Embed Size (px)
Citation preview
RECYCLE donation steel cans reusedemonstration of needmunicipal solid w
astefood recovery
COMPOST commodities PLANNINGsustainability NATURAL RESOURCES food bankC
URBSID
E RECYC
LING
plastic
growth TIRES
bins LANDFILL
b
iod
eg
rad
ab
le
sin
gle
-stre
am
waste
to e
nerg
y
garbage
electronics marketse
co
nom
y
revenue INVESTMENT roll cart
EDUCATION conservationGREEN
construction & demolition debris
OIL
glassPA
PER
waste reductiontipping fee recycling rate
ALUMINUM CANS commerceenergy conservation recycling bineconomic impact
disposal
Solid WasteManagement
SOUTH CAROLINA
ANNUAL REPORT
Catherine E. Heigel, DirectorS.C. Department of Health & Environmental Control
Fiscal Year
2016


South Carolina Solid Waste Management Annual Report for Fiscal Year 2016 1
About this Reportcounties and solid waste facilities are required to provide. (See page 2 for more information.)
“The South Carolina Solid Waste Management Annual Report” must be submitted to the Governor and General Assembly annually by March 15.
This report, which serves as an update to the State Plan, reflects solid waste management activities in fiscal year (FY) 2016 (July 1, 2015 to June 30, 2016) and includes:
• The amount of material recycled by commodity and county;
• The amount and type of solid waste disposed of by county;
• The amount of solid waste imported and exported;
• A listing of permitted solid waste facilities;• A summary of the state’s used motor oil recycling
program;• Recycling data for state agencies and
colleges/universities;• An update on solid waste planning; • Key state programs that assist local governments
in meeting the requirements of the Act; and
• Recommendations for improving solid waste management.
Table of ContentsSECTION 2: The Year at a Glance ............................................... 3
SECTION 3: Recommendations for Improving Solid Waste Management .................................. 5
SECTION 4: The Economic Impact of Recycling ......................19
The Economics of Managing Solid Waste in South Carolina ...............................................................20
SECTION 5: Recycling by Commodity ......................................21
SECTION 6: Used Motor Oil Recycling .....................................31
SECTION 7: Recycling – State Agencies & Colleges/Universities .............................................................33
State Agencies ....................................................................34
Colleges/Universities .........................................................35
SECTION 8 Recycling – The State & Counties at a Glance ..............................................................38
SECTION 9: Disposal ..................................................................86
SECTION 10: Permitted Solid Waste Facilities ......................101
SECTION 11: Solid Waste Planning ........................................107
County/Regional Responsibilities ..................................107
State Responsibilities ......................................................108
AcknowledgementsThe “South Carolina Solid Waste Management Annual Report for Fiscal Year 2016” is submitted by the S.C. Department of Health and Environmental Control (DHEC) in compliance with the S.C. Solid Waste Policy and Management Act of 1991 (S.C. Code of Laws § 44-96-60). In addition, Act 119 of 2005 mandates that agencies provide all reports to the General Assembly electronically. This report was published on March 15, 2017 by DHEC’s Office of Solid Waste Reduction and Recycling.
The report serves as an update to the State Plan.
BUREAU OF LAND & WASTE MANAGEMENT CHIEF: Daphne Neel
DIVISION OF MINING & SOLID WASTE MANAGEMENT DIRECTOR: Joan Litton
EDITOR: Amanda St. John
ASSISTANT EDITOR: Kristen Hare
LAYOUT/GRAPHICS: Gregg Glymph
CONTRIBUTORS: Richard Chesley, Amanda Edwards, Adah Gorton, Karla Isaac, Justin Koon, Michaela Kraus, Jessica McLain, Stefanie Vandiver and Jana White
ECONOMIC INVESTMENT DATA: S.C. Department of Commerce
The mission of the S.C. Department of Health and Environmental Control (DHEC) is to protect human health and the environment.
For the past 26 years, the S.C. Solid Waste Policy and Management Act of 1991 (Act) – S.C. Code of Laws §§ 44-96-10 et seq. – has played an integral role in furthering this mission. The Act establishes a comprehensive framework for the safe, cost-effective and efficient management of solid waste and authorizes DHEC to:
• Develop and implement a regulatory framework for the proper siting, design, construction, operation and closure of solid waste management facilities (Section 44-96-260);
• Develop a state solid waste management plan (State Plan) (Section 44-96-60). The Act also requires county governments or regions to develop plans that are consistent with the State Plan and designed to achieve the state’s recycling and waste reduction goals (Section 44-96-80);
• Promote waste reduction, recycling and resource conservation before disposal (Section 44-96-50); and
• Set waste reduction and recycling goals (Section 44-96-50).
The Act (Section 44-96-60) also requires DHEC to publish an annual report based in part on information that
SECTION
01

2 South Carolina Solid Waste Management Annual Report for Fiscal Year 2016
What is measured?This report measures two types of solid waste and how they are managed – municipal solid waste (MSW) and total solid waste (TSW). See Table 1.1 for definitions. As required by the Act, the focus of this report is on MSW (Section 44-96-50).
Who reports?Permitted solid waste facilities (e.g., Class 3 landfills) are required by the Act (Section 44-96-290) and subsequent regulation (R.61-107.19) to submit annual reports on disposal data to DHEC. County governments, regions, state agencies and state-supported colleges/universities are required to report recycling data annually to DHEC
TABLE 1.1: What is MSW and TSW?
MSW TSW
South Carolina adopted the U.S. Environmental Protection Agency’s definition of MSW with few exceptions in October 2000. This was done as part of a nationwide effort to have consistency among the states on how solid waste disposal and recycling activities are measured.
TSW provides a much more comprehensive look at how much waste is generated, disposed of and recovered than MSW.
MSW is defined in the Act (Section 44-96-50) as certain waste items generated from residential, commercial, institutional and industrial sources. MSW includes appliances, automobile tires, newspapers, office paper, cans, bottles, food waste, yard trimmings (mulched or composted) and packaging. South Carolina added tire-derived fuel, yard trimmings used as boiler fuel and motor oil recycled by do-it-yourself oil changers to its definition of MSW.
For the purposes of this report, TSW includes MSW as well as construction and demolition (C&D) debris, land-clearing debris, industrial process waste, automobile bodies and municipal sludge as well as combustion ash.
Recycling Rate EquationThe equation below is used for calculating the MSW and TSW recycling rates.
RECYCLING RATE (%) =
AMOUNT RECYCLEDX 100
AMOUNT GENERATED*
*Generated = Recycled + Disposed Of
(Section 44-96-80 and Section 44-96-140). Recycling data also is collected from municipalities, businesses and the recycling industry (and allocated to the counties where the material was generated), but these entities are not required to report. Because reporting by municipalities and businesses is strictly voluntary, data collection from these sources is inconsistent from year to year. (See Recommendation No. 1 on page 6.)
When Using this ReportAll data is carefully vetted. When reviewing the tables, keep in mind that in general recycling tonnage is rounded to the nearest hundredth and disposal data is rounded to the nearest ton. Some totals do not add up due to rounding.
A Note on the NumbersIt is important to note that the recycling data collected for this report does not completely reflect recycling efforts across South Carolina.
The Act (Section 44-96-290) and subsequent regulation (R.61-107.19) requires permitted solid waste facilities (e.g., Class 3 landfills) to report disposal data annually to DHEC resulting in nearly 100 percent of this information being collected.
In addition, the Act requires county governments (Section 44-96-80) as well as state agencies and state-supported colleges/universities (Section 44-96-140) to report recycling data. Businesses, however, are not required to report but can voluntarily provide information on their recycling activities. Businesses are not required to report, but can voluntarily provide information on their recycling activities.
It is estimated that MSW generation is about 60 percent residential and 40 percent commercial. Given that businesses are not required to report, the data collected from this source is inconsistent and incomplete and impacts the state’s annual MSW recycling rate.
TABLE 1.2: South Carolina’s MSW Goals
40% by 2020South Carolina’s goal is to recycle at least 40 percent of its MSW by FY20.
3.25 p/p/d by 2020
The state’s goal is to reduce MSW disposal to 3.25 pounds (or less) per person per day (p/p/d) by FY20.

South Carolina Solid Waste Management Annual Report for Fiscal Year 2016 3
The Year at a GlanceThis report provides an overview of the amount of solid waste generated, disposed of and recycled in South Carolina for fiscal year (FY) 2016 (July 1, 2015 to June 30, 2016) as required by the S.C. Solid Waste Policy and Management Act of 1991 (Act) – S.C. Code of Laws §§ 44-96-60.
Recycling Rate for FY16
Waste Disposal Rate for FY16
25.4% 3.6 p/p/d*
*Pounds Per Person Per Day
SECTION
02The Top 10 Takeaways for FY16
01In FY16, the amount of MSW generated (recycled plus disposed of) was 4,308,161 tons. Of that amount, 1,094,569 tons (25.4 percent) were recycled and 3,213,592 tons (74.6 percent) were disposed of in MSW landfills.
02 The amount of MSW disposed of increased 155,204 tons (5 percent).
03 The state’s per capita disposal increased slightly to 3.6 pounds.
04 The amount of MSW recycled decreased 17,632 tons (1.6 percent).
05 On average, each South Carolinian recycled about 438 pounds of MSW.
06The amount of MSW recycled fell for the third straight FY. But it was the eighth consecutive FY (and 12 of the past 13 FYs) that residents recycled more than 1 million tons of material. More than 19 million tons of MSW have been recycled since FY01.
07Tonnages for four commodities increased – Glass, Plastic, Organics and Banned Items.
08
Twenty-five counties met the waste disposal goal of 3.25 pounds or less disposal per day. Anderson County – with a 42 percent recycling rate – was the only county to meet the state’s recycling goal (40 percent).
09Residential recycling increased 15,911 tons – mostly due to a significant increase in the amount of Banned Items recovered.
10Inconsistent reporting remains an issue impacting the integrity of the recycling rate.
This report defines and measures two specific types of solid waste – municipal solid waste (MSW) and total solid waste (TSW). (See page 2 for definitions.) As required by the Act, the focus of this report is on MSW (Section 44-96-50).
Numbers, Changes & Trends, FY01 to FY16• South Carolina’s population grew from 4 million
people in 2000 to 4.9 million in 2016 – a 23 percent increase. Despite that significant growth, South Carolinians disposed of only 118,023 additional tons of MSW in FY16 than in FY01.
• Per capita disposal in South Carolina decreased a little more than 14 percent – dropping from about 4.2 pounds in FY01 to 3.6 pounds in FY16.
• South Carolinians have disposed of 3.2 million tons of MSW and recycled 1.2 million tons of material on average each FY since FY01.
• Recycling is traditionally measured by weight not volume. Given that, it is important to note that not only have the materials in the waste stream changed in the past 15 years (less paper and glass, more plastic and food waste), but so has their weight. Manufacturers wanting to lower costs (and save raw materials) strive to make their products as light as possible. A plastic water bottle, for example, weighs 37 percent less than it did a decade ago. Aluminum cans and even glass bottles weigh less.

4 South Carolina Solid Waste Management Annual Report for Fiscal Year 2016
TABLE 2.2: S.C. MSW Recycled2 by FY
FISCAL YEAR
RECYCLED IN TONS
RECYCLING RATE BY PERCENT
RECYCLED IN P/P/D
2012 1,229,100 29.5% 1.4
2013 1,371,960 31.5% 1.6
2014 1,263,495 29.2% 1.4
2015 1,101,190 26.5% 1.3
2016 1,094,569 25.4% 1.2
TABLE 2.4: S.C. MSW Disposed2 of by FY
FISCAL YEAR
DISPOSED OF IN TONS
DISPOSED OF IN P/P/D
2012 2,935,876 3.4
2013 2,985,852 3.5
2014 3,067,942 3.5
2015 3,058,388 3.5
2016 3,213,592 3.6
TABLE 2.6: S.C. MSW Generated2 by FY
FISCAL YEAR
GENERATED IN TONS
GENERATED IN P/P/D
2012 4,164,976 4.9
2013 4,357,812 5.1
2014 4,331,437 5.0
2015 4,159,578 4.7
2016 4,308,161 4.8
TABLE 2.3: S.C. TSW Recycled by FY
FISCAL YEAR
RECYCLED IN TONS
RECYCLING RATE BY PERCENT
RECYCLED IN P/P/D
2012 5,314,842 40.8% 6.2
2013 7,700,976 49.3% 8.9
2014 6,030,557 43.2% 6.9
2015 2,974,363 26.3% 3.4
2016 2,788,140 25.0% 3.1
TABLE 2.5: S.C. TSW Disposed of by FY
FISCAL YEAR
DISPOSED OF IN TONS
DISPOSED OF IN P/P/D
2012 7,696,559 9.0
2013 7,906,522 9.2
2014 7,918,780 9.1
2015 8,317,621 9.4
2016 8,376,283 9.4
TABLE 2.7: S.C. TSW Generated by FY
FISCAL YEAR
GENERATED IN TONS
GENERATED IN P/P/D
2012 13,011,401 15.2
2013 15,607,497 18.1
2014 13,949,336 16.0
2015 11,291,984 12.8
2016 11,164,423 12.5
TABLE 2.1: S.C. Population
YEAR POPULATION
2012 4,679,230
2013 4,723,723
2014 4,774,839
2015 4,832,482
20161 4,896,146
NOTES: 1. The population data used in this report reflects the most recent estimate available from the U.S. Census Bureau.
2. See Table 9.11 on page 97 for a breakdown by county of MSW recycling, disposal and generation.
3. Rounding of numbers may affect some totals.
South Carolina Solid Waste by the Numbers
South Carolina Solid Waste Management Annual Report for Fiscal Year 2016 5
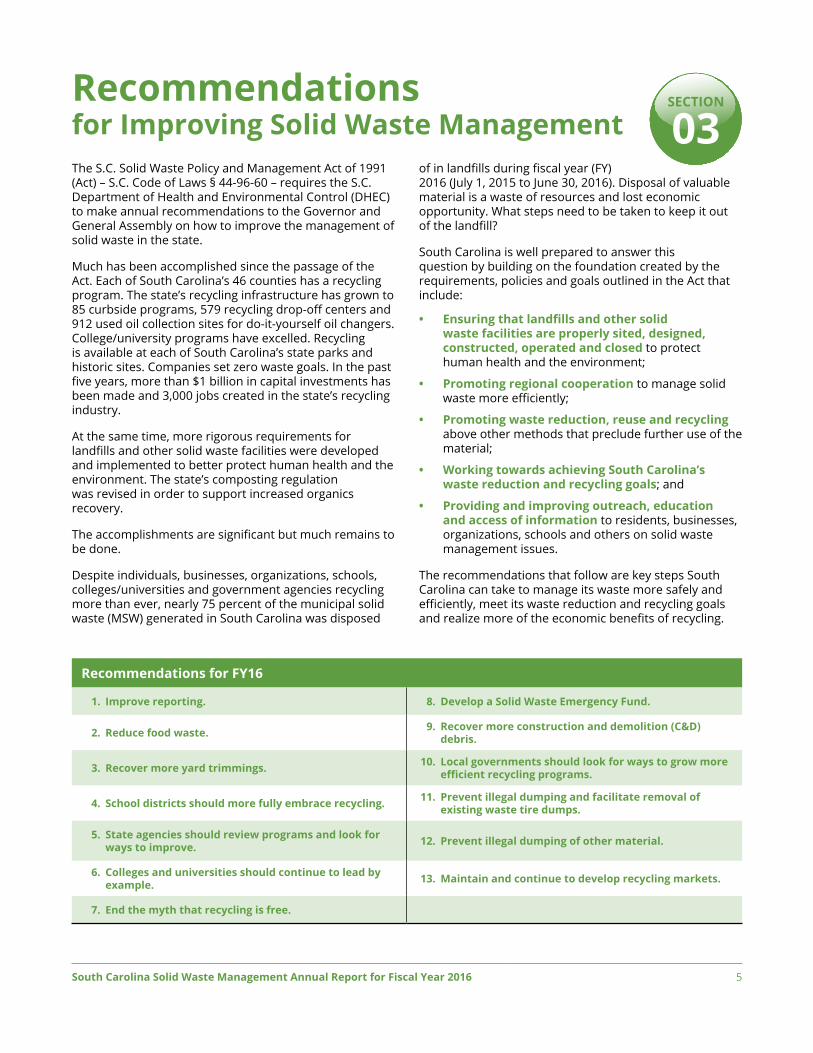
The S.C. Solid Waste Policy and Management Act of 1991 (Act) – S.C. Code of Laws § 44-96-60 – requires the S.C. Department of Health and Environmental Control (DHEC) to make annual recommendations to the Governor and General Assembly on how to improve the management of solid waste in the state.
Much has been accomplished since the passage of the Act. Each of South Carolina’s 46 counties has a recycling program. The state’s recycling infrastructure has grown to 85 curbside programs, 579 recycling drop-off centers and 912 used oil collection sites for do-it-yourself oil changers. College/university programs have excelled. Recycling is available at each of South Carolina’s state parks and historic sites. Companies set zero waste goals. In the past five years, more than $1 billion in capital investments has been made and 3,000 jobs created in the state’s recycling industry.
At the same time, more rigorous requirements for landfills and other solid waste facilities were developed and implemented to better protect human health and the environment. The state’s composting regulation was revised in order to support increased organics recovery.
The accomplishments are significant but much remains to be done.
Despite individuals, businesses, organizations, schools, colleges/universities and government agencies recycling more than ever, nearly 75 percent of the municipal solid waste (MSW) generated in South Carolina was disposed
Recommendations for Improving Solid Waste Management
of in landfills during fiscal year (FY) 2016 (July 1, 2015 to June 30, 2016). Disposal of valuable material is a waste of resources and lost economic opportunity. What steps need to be taken to keep it out of the landfill?
South Carolina is well prepared to answer this question by building on the foundation created by the requirements, policies and goals outlined in the Act that include:
• Ensuring that landfills and other solid waste facilities are properly sited, designed, constructed, operated and closed to protect human health and the environment;
• Promoting regional cooperation to manage solid waste more efficiently;
• Promoting waste reduction, reuse and recycling above other methods that preclude further use of the material;
• Working towards achieving South Carolina’s waste reduction and recycling goals; and
• Providing and improving outreach, education and access of information to residents, businesses, organizations, schools and others on solid waste management issues.
The recommendations that follow are key steps South Carolina can take to manage its waste more safely and efficiently, meet its waste reduction and recycling goals and realize more of the economic benefits of recycling.
SECTION
03
Recommendations for FY16
1. Improve reporting. 8. Develop a Solid Waste Emergency Fund.
2. Reduce food waste. 9. Recover more construction and demolition (C&D) debris.
3. Recover more yard trimmings. 10. Local governments should look for ways to grow more efficient recycling programs.
4. School districts should more fully embrace recycling. 11. Prevent illegal dumping and facilitate removal of existing waste tire dumps.
5. State agencies should review programs and look for ways to improve. 12. Prevent illegal dumping of other material.
6. Colleges and universities should continue to lead by example. 13. Maintain and continue to develop recycling markets.
7. End the myth that recycling is free.
6 South Carolina Solid Waste Management Annual Report for Fiscal Year 2016
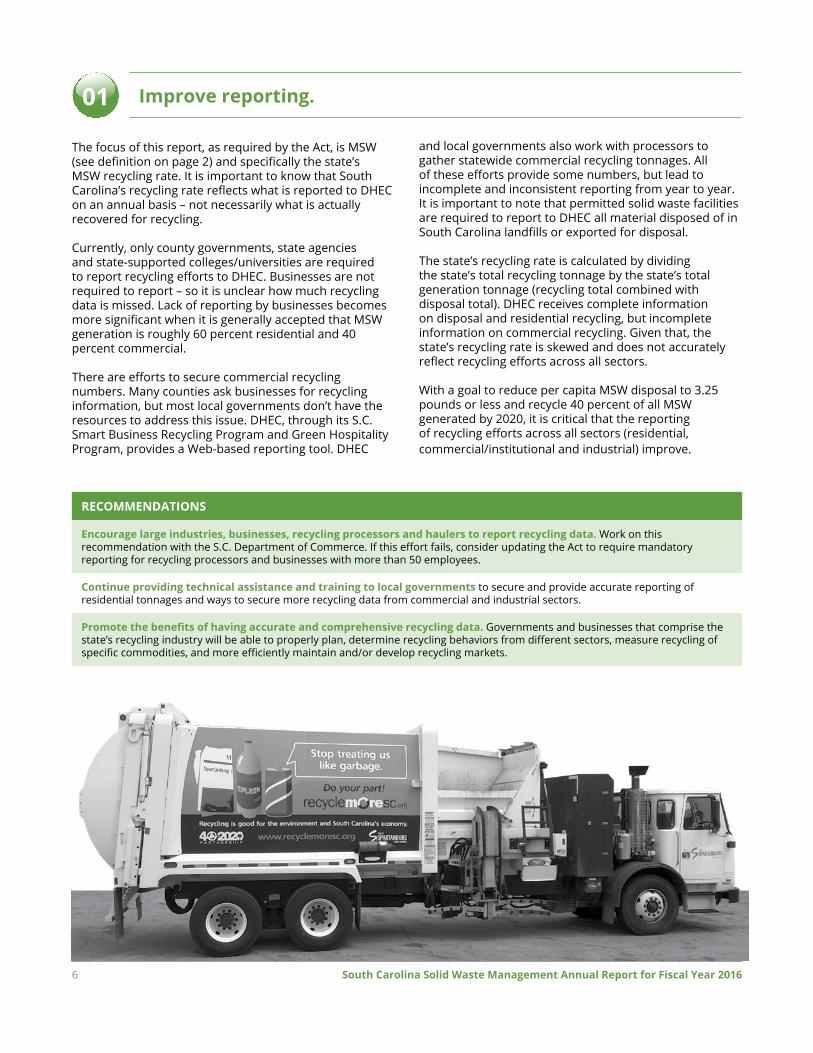
Improve reporting. 01
The focus of this report, as required by the Act, is MSW (see definition on page 2) and specifically the state’s MSW recycling rate. It is important to know that South Carolina’s recycling rate reflects what is reported to DHEC on an annual basis – not necessarily what is actually recovered for recycling.
Currently, only county governments, state agencies and state-supported colleges/universities are required to report recycling efforts to DHEC. Businesses are not required to report – so it is unclear how much recycling data is missed. Lack of reporting by businesses becomes more significant when it is generally accepted that MSW generation is roughly 60 percent residential and 40 percent commercial.
There are efforts to secure commercial recycling numbers. Many counties ask businesses for recycling information, but most local governments don’t have the resources to address this issue. DHEC, through its S.C. Smart Business Recycling Program and Green Hospitality Program, provides a Web-based reporting tool. DHEC
and local governments also work with processors to gather statewide commercial recycling tonnages. All of these efforts provide some numbers, but lead to incomplete and inconsistent reporting from year to year. It is important to note that permitted solid waste facilities are required to report to DHEC all material disposed of in South Carolina landfills or exported for disposal.
The state’s recycling rate is calculated by dividing the state’s total recycling tonnage by the state’s total generation tonnage (recycling total combined with disposal total). DHEC receives complete information on disposal and residential recycling, but incomplete information on commercial recycling. Given that, the state’s recycling rate is skewed and does not accurately reflect recycling efforts across all sectors.
With a goal to reduce per capita MSW disposal to 3.25 pounds or less and recycle 40 percent of all MSW generated by 2020, it is critical that the reporting of recycling efforts across all sectors (residential, commercial/institutional and industrial) improve.
RECOMMENDATIONS
Encourage large industries, businesses, recycling processors and haulers to report recycling data. Work on this recommendation with the S.C. Department of Commerce. If this effort fails, consider updating the Act to require mandatory reporting for recycling processors and businesses with more than 50 employees.
Continue providing technical assistance and training to local governments to secure and provide accurate reporting of residential tonnages and ways to secure more recycling data from commercial and industrial sectors.
Promote the benefits of having accurate and comprehensive recycling data. Governments and businesses that comprise the state’s recycling industry will be able to properly plan, determine recycling behaviors from different sectors, measure recycling of specific commodities, and more efficiently maintain and/or develop recycling markets.

South Carolina Solid Waste Management Annual Report for Fiscal Year 2016 7
Reduce food waste.
Food waste is the No. 1 item thrown away by Americans accounting for 38.4 million tons (21.6 percent) of the nation’s discards in 2014 according to the U.S. Environmental Protection Agency (EPA). Of that amount, only about 1.9 million tons (5 percent) were diverted from landfills for composting. South Carolina produced an estimated 641,916 tons of food waste in FY16 – 14.9 percent of the MSW generated in the state.
It is estimated that between 30-40 percent of all food grown and processed nationwide is never eaten – a loss
02
valued at more than $160 billion annually according to the U.S. Department of Agriculture. Added to those numbers is the loss of natural resources used to produce food that is not consumed. At the same time, about 42 million Americans are food insecure including 13 million children and 5 million seniors according to Feeding America.
Several of the recommendations in last year’s annual report addressing the issue were implemented this past fiscal year including the creation of a statewide public-private stakeholder group. As part of their input, DHEC took the lead on developing the Don’t Waste Food SC campaign to make the public, businesses, schools, the hospitality industry, organizations and others aware of the issue and provide information on how they can help prevent food waste.
RECOMMENDATIONS
DHEC should work with the S.C. Department of Education, the S.C. Department of Agriculture and other key stakeholders to promote food waste reduction priorities and initiatives in the state’s public schools. These efforts should include best practices for cafeterias, donation and share tables following federal and state guidelines. These efforts also should include making food waste prevention and reduction an integral part of their solid waste management program.
DHEC should work with the state’s hospitality association and other stakeholders to promote food waste reduction at restaurants and other dining facilities. These efforts should include developing, promoting and implementing best practices to reduce food waste and providing information and guidance on federal and state legislation that outlines liability protection for donation. Part of these efforts can be integrated into existing DHEC initiatives including the S.C. Smart Business Recycling Program and the Green Hospitality Program.
The S.C. Department of Commerce should continue its work to encourage and secure infrastructure growth by recruiting companies that haul, process and manage organics.
Local government recycling programs should promote what consumers can do at home to prevent food waste and encourage backyard composting.
DHEC should continue to work with EPA, the S.C. Department of Commerce, local governments and other stakeholders on the development of organics recovery infrastructure throughout the state.
DHEC Director Catherine Heigel speaks at the Don’t Waste Food SC kick-off at Harvest Hope Food Bank in Columbia. The campaign, launched July 13, 2016, is designed to increase awareness of the economic, environmental and social impacts of food waste. More information about the Don’t Waste Food SC campaign is provided on the following page.
About 42 million Americans are food insecure including
13 million children and 5 million seniors.

8 South Carolina Solid Waste Management Annual Report for Fiscal Year 2016
Recover more yard trimmings.03
Yard trimmings comprised the third largest component (34.5 million tons or 13.3 percent) of the nation’s MSW in 2014, but were the fourth-highest recovered commodity with 21 million tons (61 percent of what was generated) composted according to the EPA.
It is estimated that South Carolina generated 572,985 tons of yard trimmings in FY16. Of that amount, only 38 percent (221,524.6 tons) was recovered through composting and mulching. If South Carolina is to achieve its waste reduction and recycling goals set for 2020, the recovery of yard trimmings must increase to the numbers seen nationally.
Composting keeps material out of the landfill, conserves resources, produces a nutrient-rich soil amendment that reduces the need for chemical fertilizers and creates jobs.
Still, managing yard trimmings provides challenges for local governments. While banned from Class 3 landfill disposal (with the intent of encouraging composting), yard trimmings still can be disposed of in Class 2 landfills providing local governments an easier management option. There are additional costs to managing yard trimmings as well as finding the space needed for composting or grinding operations. It is also much more economically viable to recover material in urban settings with higher populations than rural areas. The lack of markets for the material also often remains an issue.
RECOMMENDATIONS
Local governments should recover yard trimmings and report their activities. In FY16, only 22 of the state’s 46 counties reported any recovery of yard trimmings.
Local governments should work together as well as with schools, colleges/universities and businesses to strive for economies of scale in the recovery of yard trimmings.
Local governments should offer backyard composting programs and provide technical assistance, outreach and compost bin sales. DHEC should continue offering grant funding to support these programs.
DHEC should work with the S.C. Department of Education to grow school composting programs. DHEC should continue to teach and promote composting to teachers and students through its “Action for a Cleaner Tomorrow” environmental curriculum supplement and provide technical assistance and grant funding.
The S.C. Department of Commerce should continue its work to drive infrastructure investment and market development.
DHEC and the S.C. Department of Commerce should develop an action plan to aggressively pursue the diversion of all organics from landfills. This plan should review all current activity, collection infrastructure, marketing strategies and markets.
The Don’t Waste Food SC campaign – a collaborative outreach campaign created to reduce the No. 1 item thrown away in the state – was introduced this past July.
The campaign, created by DHEC, is designed to increase awareness of the economic, environmental and social impacts of food waste. It centers on prevention, donation and composting and provides information and technical assistance to stakeholders. It also challenges stakeholders – the faith-based community, food banks, food rescue organizations, grocery stores, composters, haulers, restaurants, hospitality facilities and governments – to do their part.
Visit www.scdhec.gov/dontwastefoodsc to learn more.
Composting saves landfill space, conserves resources, makes a good soil amendment, reduces
the need for pesticides and creates jobs.

South Carolina Solid Waste Management Annual Report for Fiscal Year 2016 9
School districts should more fully embrace recycling.04
South Carolina has more than 1,260 public schools in 81 school districts with 50,000-plus teachers and 750,000 students. The sheer number of schools, staff and students results in a significant amount of waste generated – the vast majority of which could be prevented, recycled or composted.
Unfortunately, many South Carolina schools that have recycling programs only collect one or two materials.
In some instances, lack of available markets or haulers is an issue. In other instances, school budgets and administrative constraints may prevent some schools from implementing programs.
The findings of a school waste study done by the Minnesota Pollution Control Agency found that Minnesota schools generate one-half pound of waste per student per day. Using that figure, South Carolina’s public school students produce an estimated 375,000 pounds (187.5 tons) of waste per day. The study also found that more than 78 percent of a school’s waste could be recovered through paper and container recycling as well as composting.
The amount of waste generated and the potential amount that could be recovered are too large to ignore.
Unfortunately, there are many reasons schools do not recycle, but primarily it is because recycling is not free. Recycling is not free for local government or college/university recycling programs. Recycling – often mistakenly promoted as an activity that will pay for itself – has never been free. As with any program or service – there are costs.
It is commonly accepted that recycling has fundamental values such as conserving resources, saving energy, reducing the need to build landfills and supporting the state’s recycling industry that in turn creates businesses and jobs. The result is that – ironically – recycling is taught in the classroom as a desirable behavior that results in environmental and economic benefits in many schools that don’t have a recycling program.
Recycling and schools can be a perfect partnership. A recycling and/or composting program provides teachers the opportunity not only to offer a classroom lesson but a valuable real-life lesson as well to students – who ultimately will more likely understand and support South Carolina’s local government programs. Waste reduction, recycling and composting programs allow schools to reduce their environmental footprint and make a substantial contribution in helping the state achieve its waste reduction and recycling goals.
The amount of waste generated that could be recovered is too large to ignore.
RECOMMENDATIONS
The S.C. Department of Education should encourage and assist public schools in setting up and expanding waste reduction, recycling and composting programs. These services should be an accepted standard – not an exception.
School district administrators and boards should recognize that the cost of managing waste includes recycling and composting services and budget accordingly.
School districts should review their waste management costs and contracts. It may be possible to modify a contract and save some disposal revenue that can be applied to recycling and/or composting initiatives (e.g., one of the waste roll-off containers can be turned into a recycling roll off). If the waste hauler does not offer recycling services, a school district should consider requiring those services in its next contract. In addition, include provisions to assist with recycling programs in any housekeeping responsibilities and/or commercial cleaning contracts.
Recycling programs should be carefully planned, built and implemented – starting small if necessary. Local government recycling programs and school districts should work together. Local government recycling coordinators can provide invaluable technical assistance (e.g., what to collect, type and size of containers, collection options, market options).
Waste reduction initiatives should be implemented (e.g., double-sided printing, reusing paper, stopping unwanted mail, bulk purchasing) throughout each district.
DHEC should develop a Green Schools program to encourage and recognize schools for their waste reduction, recycling, composting and food waste prevention efforts.

10 South Carolina Solid Waste Management Annual Report for Fiscal Year 2016
State agencies are required by the Act to recycle, buy recycled-content products and annually report their recycling activities and recycled-content purchases to DHEC.
Beyond being required, state agencies have a responsibility to lead by example and are held accountable for operating in an environmentally responsible manner. State agencies generate significant quantities of recyclables and have the ability to make
State agencies should review programs and look for ways to improve.05
RECOMMENDATIONS
DHEC and the S.C. Department of Corrections should assist state agencies in reviewing their recycling programs to discover areas of improvement.
DHEC should continue to pursue the Green Government Initiative to encourage and improve recycling, buying recycled and reporting by all state agencies through consistent communications and technical assistance to state agencies.
DHEC should offer a one-day certification program to each agency’s recycling contact(s).
State agencies should use their considerable purchasing power to buy recycled-content products to support South Carolina’s recycling industry.
DHEC and the S.C. Department of Commerce should work with the S.C. Department of Administration to update, promote and improve the implementation of South Carolina’s Environmentally Preferred Purchasing Policy. The list of recycled-content products and specifications should be updated annually as required by the Act and promoted to all stakeholders. In addition, a list of state-term contracts containing recycled-content products as well as a state-wide system to track and report recycled-content purchases should be developed.
Recycling Requirements for State Agencies & Colleges/Universities The Act (Section 44-96-140) requires state agencies and state-supported colleges/universities to:
• Establish recycling programs for the collection of selected material including, but not limited to, aluminum, cardboard, glass, lead-acid batteries, paper, plastic, tires and used motor oil;
• Establish a program to reduce the amount of solid waste generated to the maximum feasible extent possible; and
• Report the type and amount of material recycled and all products purchased containing recycled-content material by September 15 of each year to DHEC. The Act sets a goal that at least 25 percent of all product purchases contain recycled-content material.
DHEC is required to submit a report on this information to the Governor and General Assembly by November 1 of each year.
More to Know Learn more about the recycling efforts of South Carolina’s state agencies and colleges/universities.
Visit www.scdhec.gov/recycle and select “Data and Reports.”
thousands of purchasing decisions each year. By altering a few behaviors, state agencies can be significant supporters of recycling markets, in turn helping the state’s economy.
In FY16, 59 state agencies reported recycling more than 9,400 tons of material. (See Section 7.) The number of agencies reporting – despite being required to report – has been inconsistent and dropped 19 percent from FY15.

South Carolina Solid Waste Management Annual Report for Fiscal Year 2016 11
Colleges/universities should continue to lead by example.06
South Carolina’s colleges/universities
have some of the state’s best recycling programs.
Due to their educational mission, large student populations, high community visibility and active involvement in research and new technology, South Carolina’s colleges/universities have a special role and responsibility in confronting the challenges of sustainability. That role includes contributing solutions to these challenges through not only teaching and research but transforming that work into action on campus. This action, in turn, may be able to be replicated in communities across the state.
Few institutions in South Carolina have established such successful recycling programs as colleges/universities. In fiscal year (FY) 2016 (July 1, 2015 to June 30, 2016), colleges/universities reported recycling 44,712 tons of material – a 212 percent increase from FY15.
In addition, many colleges/universities have developed comprehensive sustainability programs and have taken the lead on composting and green purchasing.
RECOMMENDATIONS
Colleges/universities should continue to lead by example and expand or improve their recycling efforts with a focus on food waste reduction and recovery.
Colleges/universities should work with local governments and communities to focus on partnership possibilities (e.g., marketing of material, sharing operations).
Colleges/universities should develop and implement green purchasing policies.
Colleges/universities should stimulate recycling markets through green procurement practices by using the 7.5 percent price preference for recycled-content products and look for sustainable alternatives for larger and less frequent purchases. In addition, colleges/universities should join state agencies in adding green products and vendors to South Carolina’s environmentally preferred purchasing policy.
Clemson University continues to have one of the nation’s top collegiate recycling programs. In addition to campus-wide recycling, the school also collects materials at all of its sporting events. A team of student volunteers is essential for making the program successful.

12 South Carolina Solid Waste Management Annual Report for Fiscal Year 2016
End the myth that recycling is free.
Recycling is not free. It never was. When recycling re-emerged into the nation’s consciousness in the 1990s, it was almost always promoted to residents that recycling would pay for itself through the revenue earned from the sale of the recovered material combined with avoided disposal costs. Many residents believed it then and still believe it now as well as a second myth that every material recycled has great value.
Both of these myths need to end. Residents must be made aware that they are paying for two basic solid waste management options: disposal and recycling. Both management choices help protect human health and the environment. But once a material is disposed of in a landfill, it has less value and the potential to produce only limited economic activity.
Conversely, recycling offers a chance to earn revenue, avoid disposal costs and generate further economic activity. Material that is recycled and reintroduced into a manufacturing process supports economic growth and
07
RECOMMENDATIONS
DHEC and the S.C. Department of Commerce should promote the findings of the economic impact of recycling study conducted by the University of South Carolina. Key findings include showing that recycling can cost less than disposal during positive markets and that the recycling industry creates more jobs than the average South Carolina industry. See “The Economic Impact of Recycling” on page 19 for more information about this study.
DHEC should provide information to increase awareness of the costs of solid waste management. Integrate that campaign into the RecycleMoreSC campaign and other potential avenues.
Local governments should consider not having a separate charge for recycling or a specific commodity, but rather provide one cost with an explanation of all of the solid waste services offered.
development through the creation of businesses, markets and jobs necessary to support those activities.
The economic impact study (see Section 4) completed in 2014 shows the significant, positive impact the recycling industry has on South Carolina’s economy.
Residents also need to know that recyclables are commodities that are subject to the same market fluctuations in value as other commodities. Unfortunately, it is generally accepted that the market value of recyclables are more volatile than other commodities. Those highs and lows are unpredictable. When prices are good, revenues are good. When prices are down, programs are more stressed.
Local governments should carefully consider and measure the true costs of any option to managing solid waste and communicate that information to residents. All aspects should be considered including long-term management, monitoring, post-closure, environmental impacts and lost opportunities for material recovery.
Develop a Solid Waste Emergency Fund.
During this reporting period, the S.C. Office of Inspector General identified a lack of funding mechanisms to address environmental emergencies caused by the management of solid waste.
Given this direction, DHEC began discussions with stakeholders to identify funding options that would be used to create a solid waste emergency fund to address
this issue and would allow cost recovery from responsible parties.
RECOMMENDATION
DHEC should continue its efforts to establish a solid waste emergency fund.
08

South Carolina Solid Waste Management Annual Report for Fiscal Year 2016 13
Recover more construction and demolition (C&D) debris.09
C&D debris is material generated during the construction, renovation and demolition of buildings, roads and bridges. This material includes concrete, drywall, asphalt, wood, bricks, shingles, metal, glass and plastic. The reuse and recycling of C&D material has significant environmental and economic benefits. (See the box below).
Measurement of the generation and recovery of C&D debris is difficult. While not included in MSW measurement, it is accepted that the material is one of the largest components of the nation’s total solid waste stream. More than 3 million tons of material was disposed of in South Carolina’s 90 Class 2 (C&D debris) landfills in
RECOMMENDATIONS
DHEC and the S.C. Department of Commerce should develop an action plan with key stakeholders to address C&D debris recycling. The plan should include policy strategies, infrastructure development, market development, technical assistance, guidance, outreach/education and a goal to cut C&D debris in half by 2030.
DHEC should develop a comprehensive Web-based clearinghouse addressing C&D debris.
Local governments should consider ordinances and/or disposal bans to increase recovery that will assist infrastructure and market development.
FY16. Another 600,000 tons of C&D debris was reported recycled. Given that, it is estimated that only 16 percent
of the C&D debris generated in the state was recovered.
South Carolina, like other states, faces two key barriers to increased recovery – low disposal costs and lack of markets. It is almost always less expensive for contractors and builders to dispose of the material than take the time to separate, store and find a market for it.
The failure to recycle or properly dispose of the material collected, along with limited markets, can lead to the creation of illegal stockpiles or dumped C&D debris.
Only about 600,000 tons of
C&D debris were recovered in FY16.
The Benefits of C&D Debris RecyclingThe recovery of C&D debris has many environmental and economic benefits including:
• Conserving resources;
• Reducing transportation costs when the material is reused onsite;
• Reducing the need for landfills;
• Offsetting the environmental impact associated with the extraction and consumption of natural resources and production of new materials;
• Providing increased business opportunities within the local community when deconstruction and selective demolition methods are used;
• Creating jobs; and
• Lowering building project expenses through avoided purchases, disposal costs and the donation of recovered material to qualified 501 (c) (3) charities – which provides a tax benefit.

14 South Carolina Solid Waste Management Annual Report for Fiscal Year 2016
Local governments should look for ways to grow more efficient recycling programs.
10
Every local government recycling program – urban or rural, small or large and everything in between – can always improve. Each program should constantly strive to increase participation and the amount of material
recovered while at the same time reducing the amount of unwanted material collected. Every improvement makes a program’s and South Carolina’s overall recycling efforts more successful.
RecycleMoreSC Campaign helps brand recycling in South Carolina The RecycleMoreSC campaign is designed to reinvigorate recycling in South Carolina by:
• Promoting the economic and environmental benefits of recycling;
• Providing tools to local governments to present a clear, consistent message across the state; and
• Challenging residents, businesses and others to do their part and recycle more.
The campaign is the centerpiece effort of the 40by2020 Partnership. The partnership is a group of public and private stakeholders dedicated to sharing knowledge, coordinating resources and working together to help South Carolina meet or exceed its 40 percent recycling goal set for 2020.
The partnership includes Pratt Industries, Sonoco Recycling, the S.C. Beverage Association, PalmettoPride, the S.C. Department of Commerce and DHEC.
Learn more at www.recyclemoresc.org.
RECOMMENDATIONS
Strive to offer continual outreach/education to provide a clear and consistent message. Significant revenue is used to purchase trucks, recycling containers and the overall infrastructure of a program. A comprehensive outreach/education program will help provide a good return on that investment. Develop, implement and stick with the outreach/education plan. (See “Education is key to successful recycling programs” on the following page.)
Continue to work with other recycling professionals and organizations for fresh ideas and assistance.
Work with local businesses and recycling processors to promote commercial waste reduction and recycling. Use the S.C. Smart Business Recycling Program to help with reporting of these activities.
Work with schools. See Recommendation No. 4 on page 9.
Always keep track of and evaluate the market prices programs receive for their material. Track revenue earned and avoided disposal costs.
Identify improvements that can be made without additional costs.
Recycle beyond the curb. Add drop-off locations to keep or add a commodity that it not accepted at the curb.
Offer assistance with and resources for backyard composting.
Add recycling bins in public spaces.
Offer promotional events to collect hard-to-recycle items.
Buy recycled. It is the final step in making recycling work.

South Carolina Solid Waste Management Annual Report for Fiscal Year 2016 15
Residents need to know what, where and how to recycle as well as the value
of recycling.
Education is key to successful recycling programs.• Review signage at convenience centers. Make
sure it is easy to follow so residents know what to do. Post temporary signage as needed to reinforce an issue or message.
• Mail an annual postcard to all households serviced with easy, basic information (e.g., yes and no lists, where to get more information). Consider a refrigerator magnet with same information. Include recycling information in new home packets.
• Advertise when and where possible (e.g., billboards, posters in libraries or stores, bus advertisements, neighborhood newsletters, social media). Collection trucks (public or private) should have recycling signage.
• Target non-recyclers. Learn from your collectors which neighborhoods are not recycling.
• Consider neighborhood recycling captains to get out the word. Make the initiative part of the overall message. Identify neighborhoods, residents and businesses that are excelling and promote them (e.g., media opportunities, website, newsletters).
• Provide the economic and environmental benefits of recycling to local decision makers. Share successes.
• Adopt the RecycleMoreSC campaign with branded material already in place. Provide waste reduction and recycling information beyond the program (e.g., how to reduce food waste, donating clothes, recycling at work, retailer options for items such as electronics and rechargeable batteries).
• Adopt the Don’t Waste Food SC campaign.
Recycling is a choice. Residents either decide to throw away the aluminum can, plastic bottle or cardboard or place the item into a recycling container. Getting residents to make recycling the choice has a significant impact on a community’s recycling success.
Education/outreach plays the key role in the success of any program. Begin with the basics. Residents need to know what to recycle, where to recycle, how to recycle and the value of recycling. Beyond that, education/outreach programs also should strive to motivate and encourage participation that makes residents better recyclers and results in higher recycling rates. Education also ends wish-cycling – the new but extremely common practice of residents placing non-recyclable items into the recycling container hoping they can be recycled. Unwanted material makes processing recyclables more difficult and costly, creates more waste and increases costs for local governments.
Each local government should develop and implement an annual education/outreach plan. There are many options to consider including:
• Place a sticker on the roll cart or bin of what is accepted and what isn’t. Do “Oops” Tags to remind residents what is not accepted. Do “Thank You” Tags to provide positive feedback.
• Update website and make information as easy-to-find as possible beginning with how to get a bin or roll cart and what is and isn’t accepted.

16 South Carolina Solid Waste Management Annual Report for Fiscal Year 2016
Prevent illegal dumping of waste tires and facilitate removal of existing waste tire dumps. 11
South Carolinians generate an estimated 4.5 million waste tires every year. When managed improperly – dumped or stored illegally – tires can become a health hazard by holding water and attracting mosquitoes as well as creating potential fire hazards and unsightly nuisances.
Unfortunately, many waste tires do not take a direct route to a tire recycler. The state continues to have illegal dumping and is working to identify responsible parties to remove and manage illegally dumped tires. The cleanup of existing piles, however, is not a solution. Preventing the creation of waste tire piles is critical to the success of any waste tire management program.
When managed properly, tires can be used in construction activities and new products as well as burned for energy recovery. Most waste tires generated in South Carolina are chipped and burned in place of other fuels (e.g., coal).
Tires also are used as a substitute for gravel or other aggregates in septic tank drain fields or other drainage applications. Wire-free tire rubber can be used for higher-value products. Chipped tire rubber, for example, can be used in place of wood chips in playgrounds. Finely ground
tire rubber can be formed into running tracks or molded into industrial mats.
The proper management of waste tires continues to be a priority. DHEC has initiated steps to prevent illegal tire dumping and to help ensure the movement of tires to recycling facilities. These initiatives include a regulation revision (R.61-107.3 Solid Waste Management: Waste Tires) that became effective in 2015. The revision clarifies reporting and record keeping as well as expands the operational, permitting and registration requirements for haulers, collectors and processors of waste tires. Still, more work is needed.
One important change is new financial assurance requirements for certain waste tire haulers. Waste tire haulers that haul tires for compensation by other persons are now required to provide $10,000 in financial assurance in order to become registered. Financial assurance is not required for persons who haul 15 or fewer tires at any time or for those who haul tires they have generated in the course of their own business.
DHEC is working with stakeholders to ensure understanding of the provisions of the regulation and provides technical assistance upon request.
RECOMMENDATIONS
Improve markets. Strong markets for waste tires can’t happen without end-users that are knowledgeable about opportunities for using recycled tire rubber in manufacturing and engineering applications and can’t be sustained without healthy waste tire processors to supply quality product. DHEC and the S.C. Department of Commerce – in conjunction with tire manufacturers, tire processors, research institutions and others – should continue efforts to promote higher-value uses for waste tires and a climate where the economics of waste tire processing can sustain suppliers of processed tire material.
Gain an understanding of the potential dangers of crumb tire rubber. DHEC should work with EPA and other stakeholders to learn about and communicate any health risks from using crumb rubber in certain applications (e.g., playgrounds, sports turfs).
Minimize the opportunities for illegal tire disposal. DHEC efforts should include full implementation of the manifesting and registration requirements. Tire generators and retailers must verify their waste tires are hauled only by legally registered haulers and that they are delivered to appropriate facilities. DHEC should work with waste tire generators, haulers, local governments and waste tire processors to ensure that only properly bonded waste tire haulers are used to move tires.
Engage law enforcement and anti-littering organizations. DHEC should work with state and local law enforcement and anti-littering organizations to locate illegal tire dumps and stockpiles and identify offenders. DHEC also should work with law enforcement to deter illegal dumping and to ensure offenders are dealt with consistently and with all available force of law and regulation. DHEC should work with anti-littering agencies, non-profits, local governments and community leaders to increase awareness of tire dumping issues and to promote cooperation between law enforcement and environmental groups.
Involve local governments. DHEC should continue to assist county and municipal governments in implementing waste tire management programs that prevent illegal dumping and encourage the purchase of high-value products made from waste tires. DHEC also should work with local governments to develop programs that expedite the removal of tire dumps and stockpiles.
Perform a comprehensive review of the waste tire program. DHEC and other stakeholders should identify statutory, regulatory or process changes that would help incentivize the proper management of waste tires, prevent illegal dumping and encourage development of a more robust recycling industry.
Develop a waste tire website. DHEC should create a comprehensive Web-based clearinghouse addressing waste tire issues that impact all stakeholders (e.g., public, recyclers, haulers, retailers, local governments).

South Carolina Solid Waste Management Annual Report for Fiscal Year 2016 17
Tires, C&D debris, land-clearing debris and electronics are the materials most frequently dumped illegally.
The most common practice is dumping material in a remote area. Another common problem is when material is collected for recycling and stockpiled with a minimum amount being recycled and the remainder left unmanaged. Both activities result in the creation of illegal dumping that degrades property values and puts human health and the environment at risk. Both activities often result in property owners or taxpayers paying for the cleanup.
The underlying causes of illegal dumping are varied, but generally fall into the following categories:
• Low Risk – Haulers that dump tires and land-clearing debris and other material face a low risk of being identified because the material they dump is difficult to trace to the source. Law enforcement and judicial bodies also may not consider the impact of this dumping on the health, environmental or economic welfare of a community, resulting in low fines and penalties against dumpers.
• Cost Factors – The cost of properly recycling or disposing of certain materials creates an incentive for illegal dumping. The average fee ($106 per ton) to recycle waste tires, for example, is higher in South
Prevent illegal dumping of other material.
Carolina than the cost (an average of $41 per ton) to properly dispose of MSW in a landfill. In addition, when a recycled material has a low intrinsic value, the costs to process and sell the material may be greater than the revenue received from its sale. Collectors may stockpile material to avoid processing costs.
• Generator Responsibility – Waste generators sometimes encourage illegal dumping by choosing the lowest cost option available to dispose of waste, without regard for how their waste is managed.
• Statutory and Regulatory Exemptions – The Act (Section 44-96-170) provides regulatory exemptions for recycling activities. While this is a positive incentive for legitimate recyclers, some operators use these loopholes to claim they are performing a recycling activity when, in fact, their activities more closely resemble unpermitted landfills.
12
RECOMMENDATIONS
DHEC and other regulatory agencies, local governments, businesses and residents should work together to prevent illegal dumping.
The S.C. Department of Commerce should continue to strive to develop strong markets for recyclable material as well as higher-value end uses.
South Carolina should consider statutory and regulatory changes to hold haulers, processors and generators more accountable for the proper collection and transport as well as the recycling or disposal of solid waste and recyclables.
Local governments should implement more robust litter control policies and practices, including cooperation between law enforcement agencies, and consider adding litter control staff.
Illegal dumping often results in property
owners or taxpayers paying for the cleanup.
18 South Carolina Solid Waste Management Annual Report for Fiscal Year 2016
Maintain and continue to develop recycling markets.13
Recycling markets and market development are indispensable components of sustainable materials management as well as economic development. Markets use material that otherwise would be disposed of and keeps it in circulation – conserving resources, creating jobs and helping protect the environment. Recycling only works when there are businesses willing to buy and process the material that is collected.
Nationally, recycling markets (i.e., recovered commodity prices) remain one of the industry’s biggest concerns. In the past FY and beyond, markets remained flat or declined, but at the same time virtually no curbside programs were dropped.
South Carolina has several key players focused on recycling markets. The S.C. Department of Commerce’s Recycling Market Development Advisory Council (RMDAC) works to create, maintain and grow markets. The state also is a member of the Southeast Recycling Development Council (SERDC). SERDC represents 11 states that work toward coordinating efforts to promote recycling and help companies across the region secure a clean, consistent supply of recovered material.
South Carolina has a robust recycling infrastructure with more than 520 companies (See Section 4) and access to other markets in the Southeast that need recovered material. These markets are available for most commodities – but not all – and continue to be impacted by low regional landfill tipping fees, commodity price fluctuations and competition with virgin material.
Glass markets remain a huge issue nationwide. Numerous programs in the state have dropped curbside glass collection due to low value, the cost of collection and hauling, and limited markets. Other key market issues include increasing the recovery of plastic, carpet, food waste and construction and demolition debris.
RECOMMENDATIONS
RMDAC should continue to work to identify and grow recycling markets, develop strategies to help increase the recovery of material.
The S.C. Department of Commerce should continue to work with stakeholders to improve infrastructure to increase the quality and quantity of recovered food waste.
The S.C. Department of Commerce should continue its work on increasing plastics recovery and supporting the recycling industry through the “Your Bottle Means Jobs” campaign.
Encourage the recycling industry to assist stakeholders (e.g., local governments and businesses) to improve the quantity and quality of recovered material through outreach, technical assistance and partnerships.
Promote the economic impact of recycling to decision makers and the public.
DHEC and the S.C. Department of Commerce should work to promote and increase green purchasing by state government and to increase the use of recycled-content material developed by South Carolina companies.
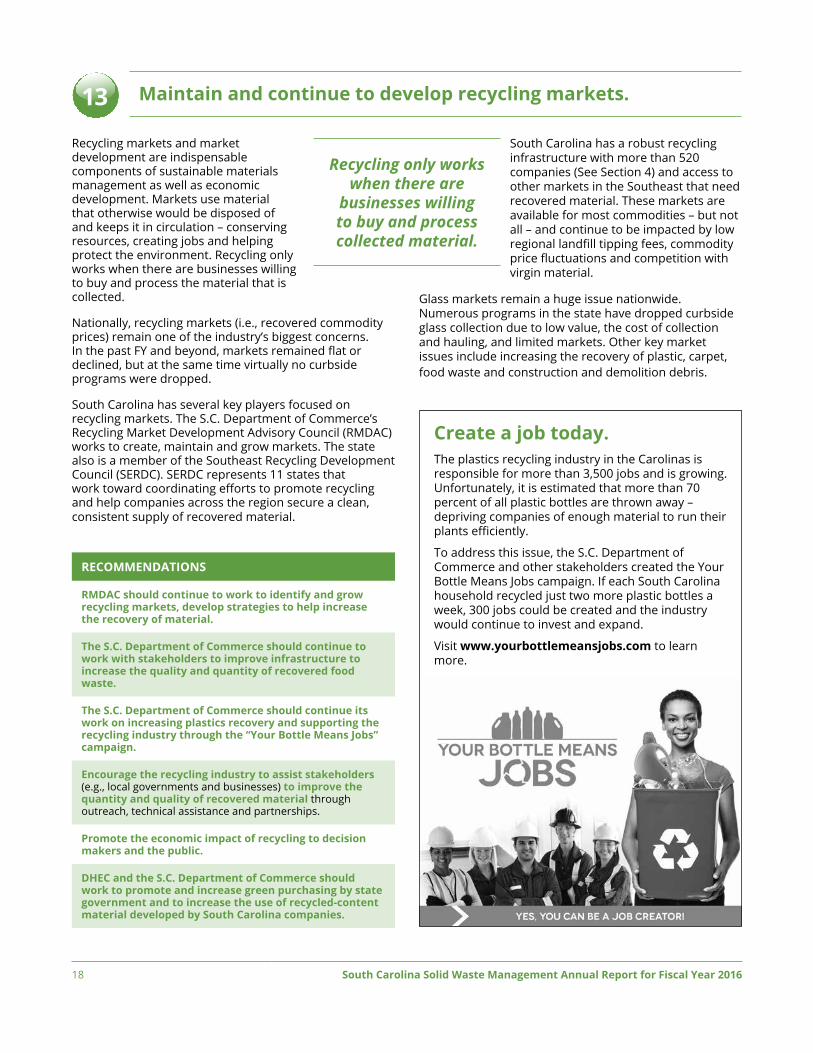
Create a job today. The plastics recycling industry in the Carolinas is responsible for more than 3,500 jobs and is growing. Unfortunately, it is estimated that more than 70 percent of all plastic bottles are thrown away – depriving companies of enough material to run their plants efficiently.
To address this issue, the S.C. Department of Commerce and other stakeholders created the Your Bottle Means Jobs campaign. If each South Carolina household recycled just two more plastic bottles a week, 300 jobs could be created and the industry would continue to invest and expand.
Visit www.yourbottlemeansjobs.com to learn more.
Recycling only works when there are
businesses willing to buy and process collected material.

South Carolina Solid Waste Management Annual Report for Fiscal Year 2016 19
The Economic Impact of RecyclingRecycling is an essential part of the nation’s and South Carolina’s economy. By transforming waste into valuable raw material, recycling stimulates economic development, creates jobs and businesses, produces tax revenue and generates income for businesses and local governments from the sale of recyclables.
The state’s recycling industry has a $13 billion annual impact on South Carolina’s economy according to a 2014 study done by the College of Charleston. It is comprised of more than 520 companies that collect, haul, process and broker material, sell equipment and manufacture recycled-content products. It includes 10 plastic reclaimers, five recycled paper manufacturing facilities, three steel mills and one recycled aluminum manufacturer. Overall, the industry also provides more than 22,000 direct jobs, $2.7 billion in annual labor income and nearly $330 million in state and local taxes every year.
The recycling industry continued to grow in 2016 with five new or existing companies making $102 million in capital investments and creating 356 jobs according to the S.C. Department of Commerce. In the past five years, the industry has announced $1.1 billion in capital investments and 3,000 jobs created.
New Economic Impact Study Released The S.C. Department of Commerce released the results of a new study done by the University of South Carolina’s Darla Moore School of Business on the economic impact of recycling. The study, done in conjunction with the S.C. Department of Health and Environmental Control’s
(DHEC) Office of Solid Waste Reduction and Recycling, had several key findings including:
• Recycling can cost less than disposal during positive market trends. The relative cost of recycling vs. disposal is largely dependent on the price that recycling firms can sell processed recycled materials for on the open market. According to the study, the price for processed recycled materials peaked at $146 per ton in 2011 and dropped to $52 per ton by 2016. As a result, recycling was about $28 per ton cheaper than disposal in 2011, but was $9 per ton more expensive than disposal in 2016.
• The recycling industry in South Carolina supports an employment multiplier of 2.4. This implies that for every 10 jobs generated in the recycling industry an additional 14 jobs are created elsewhere in the South Carolina economy. Thus, the recycling industry has the ability to scale up employment at a higher rate than the average South Carolina industry; and
• Small increases in household recycling can have a substantial statewide impact. For example, if just one percent of all South Carolina households were to recycle an additional eight newspapers per month, this additional effort could generate an annual gain of up to $3.8 million in economic activity for the state, 16 jobs and about $794,000 in labor income. Similar results can be observed for many recycled goods across commodity types.
The complete report, “The Benefits of Increased Household Recycling Rates in South Carolina: A Commodity-Level Analysis,” can be found at https://sccommerce.com/sites/default/files/all/ sc_recycling_economic_impact.pdf.
SECTION
04
Recycling Market DevelopmentThe S.C. Department of Commerce’s Recycling Market Development Advisory Council (RMDAC) supports the state’s recycling industry by working to build markets, increase material recovery and promote the impact of recycling on South Carolina’s economy.
Established by the S.C. Solid Waste Policy and Management Act of 1991, RMDAC is comprised of 14 members appointed by the Governor that represent the solid waste industry, recycling sectors, government, higher education and the public.
The Recycling Market Development Division staff coordinates the activities of the council while providing technical and economic development assistance to assist recycling businesses and the industry. Key market development activities for the past fiscal year include composting, food waste, carpet, plastic and glass.
Learn more at https://sccommerce.com/events/recycling-market-development-advisory-council.

20 South Carolina Solid Waste Management Annual Report for Fiscal Year 2016
PUBLICLY OWNED FACILITIES
1 Greenwood County1115 Siloam Church Rd., Greenwood, SC 29646
2 Horry County511 Three R Dr., Conway, SC 29526
3 North Augusta67 Claypit Rd., N. Augusta, SC 29841
4 York County220 Public Works Rd., York, SC 29745
PRIVATELY OWNED FACILITIES
5 Pratt Industries255 Morley Ct., Duncan, SC 29334
6 Sonoco Recycling1132 Idlewilde Blvd., Columbia, SC 29201
FIGURE 4.1: South Carolina’s Materials Recovery Facilities in FY16 Estimated Lost RevenueIt is estimated that nearly 590,000 tons of easily recyclable material – aluminum cans, cardboard, glass bottles and jars, office paper, plastic bottles and steel cans – were disposed of in FY16.* Using the state’s average tipping fee of $41 per ton, it is projected that local governments spent more than $24 million to dispose of this material.
It is also estimated that more than $52 million in potential revenue from the sale of this material was lost based on the average revenue received per ton as reported by local governments of each of these types of material.
* The estimated amount of material disposed of that could have been recycled is calculated by using the U.S. Environmental Protection Agency’s most recent municipal solid waste (MSW) generation rates to South Carolina’s FY16 generation.
1
3
4
2
5
6
The Economics of Managing Solid Waste in South CarolinaThe collection, proper disposal and recycling of solid waste are essential services that have long been recognized as a critical segment of a community’s infrastructure.
These services are no simple task. They include disposal, recycling, staffing, outreach/education, trucks, fuel, equipment, buildings, land, insurance and managing facilities (e.g., landfills, transfer stations).
These services are also expensive. Local governments spent more than $342 million to manage solid waste in fiscal year (FY) 2016 (July 1, 2105 to June 30, 2016) and more than $1.9 billion since FY11 according to the full-cost disclosure information reported to DHEC.
Local governments face a difficult balancing act of costs and services. Recycling programs compete with the low cost of disposal in South Carolina. The state’s average tipping fee is $41 per ton – about $3.50 less per ton than the regional average according to a 2016 study.
The true cost of recycling is much more difficult to measure in part due to outside factors beyond the services provided to residents. Recycling programs are impacted by the markets and materials recovery facilities (MRFs) that are available.
South Carolina has robust state and regional markets for many but not all materials. The state has only six MRFs. (See Figure 4.1.) South Carolina also lacks a MRF in the low country leaving a huge regional gap that includes one of the state’s largest county recycling programs. All of this impacts costs.
Recycling allows local governments to avoid disposal costs – an often forgotten positive – and earn revenue from the sale of recyclables. Unfortunately, this revenue is inconsistent because recyclables are commodities that are subject to the same change in value as other commodities. Commodity prices have been low for the past few years, but began to improve near the end of fiscal year (FY) 2016 (July 1, 2015 to June 30, 2016).

South Carolina Solid Waste Management Annual Report for Fiscal Year 2016 21
PAPER 26.8%
GLASS 0.6%
METAL19.3%
BANNEDITEMS10.0%
MISCELLANEOUS ITEMS 5.4%
COMMINGLED 14.8%
PLASTIC 1.7%
Recycling by Commodity
TABLE 5.2: Amount of MSW Commodities Recycled in FY16
COMMODITY TONS
Banned Items 110,393.99
Commingled 162,322.97
Glass 6,670.82
Metal 211,342.13
Miscellaneous 59,765.63
Organics 231,681.95
Paper 293,367.30
Plastic 19,024.17
TOTAL 1,094,568.95*NOTES: Commodities are measured by weight. Percentages do
not equal 100 percent due to rounding.
SECTION
05
CHART 5.1: MSW Commodities Recycled as a Percentage of All MSW Recycled in FY16*
The S.C. Solid Waste Policy and Management Act of 1991 – S.C. Code of Laws § 44-96-60 – requires the S.C. Department of Health and Environmental Control (DHEC) to report the amount of municipal solid waste (MSW) recycled by commodity and county. This information is gathered from counties – which are required to provide this data to DHEC (Section 46-96-80) – and from voluntary reporting by businesses and municipalities.
This section highlights the commodities that comprise MSW as defined by South Carolina – glass, metal, paper, plastic, organics, banned items, miscellaneous items and commingled recyclables. Glass, metal, paper and plastic are considered traditional commodities and serve as the foundation of local government recycling programs.
Appliances, electronics, lead-acid batteries, used motor oil and whole waste tires are banned by law from any type of landfill disposal. Yard trimmings are banned from disposal in Class 3 landfills. The majority of yard trimmings, however, are disposed of in Class 2 landfills. See Table 9.1 on page 86 for a breakdown of landfill classifications.
ORGANICS 21.0%
Paper, metal and organics comprised
more than 67 percent of the MSW recycled
in FY16.
Miscellaneous recyclables include antifreeze, cooking oil, fluorescent bulbs, hazardous household material (HHM), inkjet/toner cartridges, mattresses, paint, rechargeable batteries, textiles, used motor oil filters and wood packaging. Levels of collection differ in local government programs.
HHM is reported as a miscellaneous item and highlighted in this report because it poses a potential risk to human health and the environment. For information on local government HHM programs, see Table 5.19.
Commingled recyclables consist of a variety of material collected together and not reported by individual material type.
Overall, paper was the top commodity recovered – comprising 26.8 percent of the MSW recycled in FY16. Metal, paper and organics combined to make up more than 67 percent of the MSW recycled.
See Chart 5.1 and Table 5.2 for a breakdown of commodities recycled by percent and amount for FY16. See page 30 for a breakdown of the amount of each commodity recycled since FY12.

22 South Carolina Solid Waste Management Annual Report for Fiscal Year 2016
TABLE 5.3: Glass Recycled by County in Tons
COUNTY BROWN CLEAR GREEN MIXED COUNTY TOTALAbbeville 0.09 0.07 0.04 0.04 0.24Aiken 0.09 0.07 0.04 0.04 0.24Allendale 0.00 0.00 0.00 0.01 0.01Anderson 148.94 133.65 168.79 31.49 482.87Bamberg 0.09 0.07 0.04 0.03 0.23Barnwell 0.00 0.00 0.00 0.01 0.01Beaufort 0.34 0.32 0.04 902.42 903.12Berkeley 0.39 0.00 0.00 0.01 0.40Calhoun 0.00 0.00 0.00 0.00 0.00Charleston 0.09 0.07 0.04 11.88 12.08Cherokee 18.80 25.20 9.80 0.31 54.11Chester 0.09 0.07 0.04 38.37 38.57Chesterfield 0.00 0.00 0.00 0.00 0.00Clarendon 0.00 0.00 0.00 0.01 0.01Colleton 0.09 0.07 0.04 0.04 0.24Darlington 0.00 0.00 0.00 0.01 0.01Dillon 0.09 0.07 0.04 0.04 0.24Dorchester 0.09 0.07 0.04 108.50 108.70Edgefield 0.00 0.00 0.00 0.01 0.01Fairfield 0.09 0.07 0.04 63.19 63.39Florence 0.00 0.00 0.00 0.01 0.01Georgetown 0.10 0.11 0.04 0.14 0.39Greenville 0.09 0.07 0.04 47.28 47.48Greenwood 0.00 0.00 0.00 1.42 1.42Hampton 0.09 0.07 0.04 0.04 0.24Horry 0.10 0.11 0.04 808.10 808.35Jasper 0.00 0.00 0.00 11.15 11.15Kershaw 0.00 0.00 0.00 11.63 11.63Lancaster 0.09 0.07 0.04 0.04 0.24Laurens 8.55 54.16 0.04 0.04 62.79Lee 0.09 0.07 0.04 0.03 0.23Lexington 152.49 203.42 86.44 69.94 512.29Marion 0.00 0.00 0.00 0.01 0.01Marlboro 0.00 0.00 0.00 0.00 0.00McCormick 0.00 0.00 0.00 0.01 0.01Newberry 0.09 0.07 0.04 81.70 81.90Oconee 97.06 141.07 151.79 0.04 389.96Orangeburg 0.09 0.07 0.04 0.04 0.24Pickens 68.18 77.27 71.17 49.30 265.92Richland 18.13 2.11 3.67 163.8 187.71Saluda 0.00 0.00 0.00 0.01 0.01Spartanburg 0.09 0.07 0.04 1,383.69 1,383.89Sumter 55.46 11.99 55.41 507.58 630.44Union 0.00 0.00 0.00 0.31 0.31Williamsburg 0.00 0.00 0.00 0.01 0.01York 178.93 261.26 165.09 4.44 609.71STATE TOTAL 748.91 911.79 712.96 4,297.17 6,670.82

South Carolina Solid Waste Management Annual Report for Fiscal Year 2016 23
TABLE 5.4: Metal Recycled by County in Tons
COUNTY ALUMINUM FERROUS NON-FERROUS STEEL MIXED SCRAP COUNTY TOTALAbbeville 5.86 5.15 0.00 0.15 374.30 385.46Aiken 0.25 0.11 0.00 0.15 65.20 65.71Allendale 0.01 3.95 0.00 0.16 8.48 12.60Anderson 158.37 27,365.73 7,758.47 4.20 2,189.86 37,476.63Bamberg 0.17 0.11 0.00 0.15 10.80 11.23Barnwell 2.74 0.00 0.00 0.15 102.55 105.44Beaufort 43.76 2,840.58 170.00 0.21 731.75 3,786.30Berkeley 111.38 217.31 610.50 50.75 1,121.39 2,111.33Calhoun 1.30 0.00 0.00 0.15 181.39 182.84Charleston 39.57 33.60 0.00 0.15 1,277.46 1,350.77Cherokee 10.82 20.76 0.02 33.80 249.83 315.21Chester 10.03 14.47 0.00 1.01 103.59 129.10Chesterfield 3.52 44.12 0.00 0.15 379.98 427.77Clarendon 0.02 0.00 0.00 0.15 0.74 0.91Colleton 7.37 5.52 0.00 0.16 402.11 415.16Darlington 1.16 0.96 0.00 0.16 378.59 380.87Dillon 1.33 1.07 0.40 0.16 155.24 158.20Dorchester 0.65 1,071.57 1,208.00 18.75 5,387.57 7,686.54Edgefield 4.97 5.04 0.00 18.75 310.74 339.50Fairfield 3.50 2.11 0.00 0.15 431.44 437.20Florence 1.28 58.91 0.00 18.76 172.81 251.76Georgetown 94.10 4,156.43 0.00 2.61 246.30 4,499.44Greenville 9.16 4,110.07 573.23 67.90 19,925.29 24,685.65Greenwood 110.51 23,010.97 0.00 2.05 383.00 23,506.53Hampton 0.18 4.06 0.00 0.16 145.16 149.56Horry 448.17 11,196.11 1,849.56 420.94 10,681.51 24,596.29Jasper 3.10 5.41 0.00 0.16 262.72 271.39Kershaw 26.52 17.50 0.00 18.75 56.74 119.51Lancaster 3.40 2.11 0.00 0.15 120.57 126.23Laurens 59.99 4,615.47 0.00 0.15 732.49 5,408.10Lee 2.15 0.11 24.24 0.15 62.16 88.81Lexington 156.86 15,238.10 1,327.50 27.16 5,331.91 22,081.54Marion 1.16 0.96 0.00 0.16 1.28 3.56Marlboro 4.30 222.96 0.00 0.16 1.10 228.52McCormick 2.60 5.04 0.00 18.75 181.04 207.43Newberry 5.31 478.24 5.00 5.50 749.37 1,243.42Oconee 36.00 347.97 50.00 0.16 1,092.22 1,526.35Orangeburg 1.28 1,308.11 0.00 0.15 813.97 2,123.51Pickens 16.96 60.07 121.12 2.82 1,738.74 1,939.71Richland 479.14 6,285.73 83.53 113.03 1,657.32 8,618.75Saluda 2.89 5.04 0.00 0.15 242.46 250.54Spartanburg 323.64 11,135.37 332.47 957.18 2,920.90 15,669.55Sumter 123.47 436.53 0.00 103.40 4,702.15 5,365.55Union 3.11 5.95 0.00 0.17 8.55 17.78Williamsburg 2.89 7.21 0.00 0.16 50.18 60.44York 141.32 9,019.36 77.25 111.09 3,174.42 12,523.45STATE TOTAL 2,466.26 123,365.94 14,191.29 2,001.27 69,317.36 211,342.13

24 South Carolina Solid Waste Management Annual Report for Fiscal Year 2016
TABLE 5.5: Paper Recycled by County in Tons
COUNTY CARDBOARD MAGAZINES NEWSPAPER OFFICE PAPER PAPERBOARD TELEPHONE
BOOKSMIXED PAPER
COUNTY TOTAL
Abbeville 913.22 0.02 0.02 4.80 0.00 0.00 145.72 1,063.78
Aiken 2,501.25 0.02 0.02 4.07 0.00 0.00 6.42 2,511.78
Allendale 45.28 0.00 0.00 7.71 0.00 0.01 0.06 53.06
Anderson 8,832.43 1.63 0.60 89.49 8.00 0.09 2,716.67 11,648.91
Bamberg 135.23 0.02 0.02 0.78 0.00 0.00 0.06 136.11
Barnwell 487.32 0.00 0.00 1.34 0.00 0.00 35.74 524.40
Beaufort 3,944.72 0.17 647.44 1,554.21 36.96 0.08 1,688.17 7,871.75
Berkeley 3,992.89 4.51 0.35 39.10 0.08 0.10 19.54 4,056.54
Calhoun 265.57 1.00 1.00 9.21 1.00 1.00 1.03 277.81
Charleston 11,608.44 2.17 0.14 867.39 11.84 1.08 133.03 12,624.09
Cherokee 3,106.00 0.32 0.40 176.16 0.00 0.07 559.28 3,842.23
Chester 849.62 0.02 0.02 2.79 0.00 0.01 93.73 946.19
Chesterfield 1,235.73 0.19 0.11 2.13 0.00 0.01 0.18 1,238.35
Clarendon 601.53 0.00 0.00 1.43 0.00 0.00 0.16 603.12
Colleton 2,606.66 0.17 15.94 9.69 0.00 0.08 0.31 2,632.85
Darlington 745.36 0.02 0.00 1.68 0.00 0.00 0.33 747.39
Dillon 395.00 0.23 0.13 2.41 0.00 0.00 0.11 397.88
Dorchester 2,337.24 0.17 0.14 92.21 0.00 0.08 456.82 2,886.66
Edgefield 458.06 0.00 105.44 1.54 0.00 0.00 57.41 622.45
Fairfield 509.96 0.02 0.02 5.38 0.00 0.01 221.93 737.32
Florence 3,113.87 0.02 0.00 22.97 0.00 0.14 29.09 3,166.09
Georgetown 1,595.92 2.04 220.16 22.77 0.08 0.02 538.23 2,379.22
Greenville 17,914.47 0.02 0.02 209.49 0.00 0.03 4,614.62 22,738.65
Greenwood 3,908.31 0.25 0.25 40.36 0.00 0.00 1,300.20 5,249.38
Hampton 246.67 0.02 0.02 9.06 0.00 0.00 27.08 282.85
Horry 22,853.24 14.54 5,201.56 2,527.59 0.58 10.32 640.05 31,247.88
Jasper 526.72 1.16 52.74 8.57 0.00 0.08 0.78 590.05
Kershaw 1,305.26 0.00 0.00 2.20 0.00 0.00 34.19 1,341.65
Lancaster 1,555.87 0.02 0.02 2.05 0.00 0.01 9.52 1,567.49
Laurens 2,633.01 0.02 64.04 11.62 0.06 0.00 144.35 2,853.10
Lee 438.11 0.02 6.83 2.01 0.00 0.00 2.17 449.14
Lexington 29,862.89 8.24 24.05 3,800.70 0.20 0.10 4,222.72 37,918.90
Marion 419.83 0.02 0.00 2.64 0.00 0.00 0.14 422.63
Marlboro 593.67 0.21 0.11 581.11 28.60 0.00 238.90 1,442.60
McCormick 227.37 0.00 22.27 1.30 0.00 0.00 71.66 322.60
Newberry 3,002.85 0.02 0.07 38.15 0.00 0.00 2,076.70 5,117.79
Oconee 6,389.60 0.02 360.63 10.63 0.00 0.03 534.63 7,295.54
Orangeburg 2,892.65 2.12 23.72 62.73 1.05 0.00 7.22 2,989.49
Pickens 3,606.06 0.02 593.73 170.07 0.00 0.03 199.71 4,569.62
Richland 21,274.80 13.62 1,315.54 2,082.81 12.68 1,000.07 4,982.89 30,682.41
Saluda 134.02 0.00 44.75 1.30 0.00 0.00 71.60 251.67
Spartanburg 36,487.59 2.74 2.72 1,008.72 2.30 2.44 17,593.92 55,100.43
Sumter 4,194.20 0.72 440.64 108.23 0.00 0.02 1,515.10 6,258.91
Union 1,629.15 0.32 0.40 18.89 0.00 0.07 0.63 1,649.46
Williamsburg 514.98 0.02 89.00 3.62 0.00 0.50 7.57 615.69
York 9,654.19 13.10 584.28 136.98 6.12 8.78 1,037.96 11,441.40
STATE TOTAL 222,546.81 69.96 9,819.33 13,760.08 108.55 1,024.26 46,038.32 293,367.30

South Carolina Solid Waste Management Annual Report for Fiscal Year 2016 25
TABLE 5.6: Plastic Recycled by County in Tons
COUNTY HDPE LDPE PET PP PS VINYL COMMINGLED PET & HDPE
MIXED PLASTIC
COUNTY TOTAL
Abbeville 38.92 18.31 0.04 0.00 0.00 0.00 0.00 166.07 223.34
Aiken 0.36 43.36 0.18 0.00 0.00 0.00 0.00 51.82 95.72
Allendale 0.01 0.00 0.00 0.00 0.00 0.00 0.00 1.09 1.10
Anderson 116.12 143.00 21.50 0.00 0.00 0.00 0.00 2,684.28 2,964.90
Bamberg 0.04 0.00 0.04 0.00 0.00 0.00 0.00 2.32 2.40
Barnwell 0.07 4.85 0.01 0.00 0.00 0.00 20.73 0.05 25.71
Beaufort 0.73 14.99 0.41 0.00 0.00 0.00 439.34 2,021.27 2,476.74
Berkeley 84.54 105.18 0.83 0.00 0.00 1.00 0.00 34.72 226.27
Calhoun 23.08 23.00 10.00 0.00 0.00 0.00 0.00 1,154.03 1,210.11
Charleston 5.31 178.24 1.53 0.00 0.00 0.00 0.00 444.10 629.18
Cherokee 0.62 17.03 0.81 0.00 0.00 0.00 25.20 28.27 71.93
Chester 3.56 7.51 0.10 0.00 0.00 0.00 0.00 49.33 60.50
Chesterfield 20.62 95.65 0.23 0.00 0.00 0.00 0.00 2.08 118.57
Clarendon 0.16 10.19 0.08 0.00 0.00 0.00 0.00 0.17 10.60
Colleton 0.49 30.68 0.31 0.00 0.00 0.00 0.04 0.97 32.49
Darlington 0.23 15.12 0.13 0.00 0.00 0.00 0.00 0.76 16.24
Dillon 0.11 4.51 0.08 0.00 0.00 0.00 0.00 0.48 5.18
Dorchester 0.53 38.13 0.35 0.00 0.00 0.00 0.00 162.68 201.69
Edgefield 0.05 2.08 0.01 0.00 0.00 0.00 37.97 4.84 44.95
Fairfield 43.23 6.00 0.10 0.00 0.00 0.00 0.00 0.53 49.86
Florence 0.91 61.10 0.52 0.00 0.00 0.00 0.00 19.08 81.61
Georgetown 28.97 29.38 55.44 0.00 0.00 0.00 0.00 81.31 195.10
Greenville 33.40 162.33 8.30 0.00 0.00 0.00 0.00 164.75 368.79
Greenwood 4.87 8.77 13.21 0.00 0.00 0.00 0.00 3.90 30.75
Hampton 0.04 0.00 0.04 0.00 0.00 0.00 0.00 19.99 20.07
Horry 331.86 260.82 639.11 0.00 0.00 0.00 22.00 354.70 1,608.49
Jasper 0.09 9.53 0.03 0.00 0.00 0.00 0.00 5.07 14.72
Kershaw 100.08 3.68 0.03 0.00 0.00 0.00 0.00 9.70 113.49
Lancaster 0.46 30.42 0.30 0.00 0.00 0.00 0.00 97.75 128.93
Laurens 0.12 26.73 0.09 0.00 0.00 0.00 0.00 71.01 97.95
Lee 3.40 0.00 1.36 0.00 0.00 0.00 0.00 82.86 87.62
Lexington 189.69 310.94 97.31 0.00 0.00 2.00 0.00 1,343.02 1,942.96
Marion 278.20 13.74 66.12 0.00 0.00 161.00 0.00 90.24 609.30
Marlboro 1.34 8.47 0.08 0.00 0.00 0.00 0.00 75.15 85.04
McCormick 0.01 0.00 0.00 0.00 0.00 0.00 15.54 4.84 20.39
Newberry 33.85 24.63 0.19 0.00 0.00 0.00 27.92 415.82 502.41
Oconee 0.13 19.32 0.49 0.00 0.00 0.00 0.00 120.58 140.52
Orangeburg 7.24 20.23 5.12 0.00 0.00 0.00 0.00 201.30 233.89
Pickens 36.54 41.81 40.30 0.00 0.00 0.00 21.05 68.26 207.96
Richland 10.10 123.57 4.08 0.00 0.00 0.00 10.64 281.51 429.90
Saluda 0.01 0.00 0.00 0.00 0.00 0.00 25.13 0.06 25.20
Spartanburg 2.03 66.04 5.98 0.00 0.00 0.00 0.00 2,121.99 2,196.04
Sumter 88.00 31.04 141.33 0.00 0.00 0.00 94.22 103.94 458.53
Union 0.04 2.65 0.02 0.00 0.00 0.00 0.00 0.20 2.91
Williamsburg 0.01 0.00 0.00 0.00 0.00 0.00 0.00 0.05 0.06
York 19.38 545.78 64.96 0.00 0.00 1.07 6.37 310.37 947.91
STATE TOTAL 1,509.55 2,558.80 1,181.15 0.00 0.00 165.07 746.15 12,863.45 19,024.17

26 South Carolina Solid Waste Management Annual Report for Fiscal Year 2016
TABLE 5.7: Banned Items Recycled by County in Tons
COUNTY APPLIANCES ELECTRONICS LEAD-ACID BATTERIES TIRES USED
MOTOR OIL COUNTY TOTAL
Abbeville 1.55 69.47 81.89 429.16 27.21 609.28
Aiken 0.12 1.94 326.28 1,172.37 129.45 1,630.16
Allendale 0.63 29.94 16.54 63.39 5.40 115.90
Anderson 2,215.66 732.21 891.02 2,076.78 95.59 6,011.26
Bamberg 0.12 0.18 24.50 282.08 21.26 328.14
Barnwell 0.09 43.15 70.96 250.71 31.40 396.31
Beaufort 1,493.25 241.77 339.33 2,110.84 106.52 4,291.71
Berkeley 170.89 402.29 398.86 1,959.34 111.95 3,043.33
Calhoun 0.09 25.92 24.60 162.80 85.77 299.18
Charleston 1,184.12 531.63 794.37 4,791.00 173.32 7,474.44
Cherokee 49.06 64.77 106.85 1,069.63 22.45 1,312.76
Chester 0.12 56.68 63.79 354.72 40.40 515.71
Chesterfield 0.09 166.17 90.97 533.40 28.47 819.10
Clarendon 0.09 84.58 71.73 355.42 16.80 528.62
Colleton 0.66 57.73 85.42 664.62 2.36 810.79
Darlington 0.09 42.03 120.34 661.62 24.99 849.07
Dillon 0.12 77.10 55.07 505.57 16.20 654.06
Dorchester 0.12 215.69 272.68 1,309.65 99.34 1,897.48
Edgefield 0.09 9.57 49.07 220.30 57.38 336.41
Fairfield 0.12 117.45 34.42 494.61 34.88 681.48
Florence 2,312.09 284.96 279.95 1,441.78 82.32 4,401.10
Georgetown 0.32 165.01 109.73 844.23 42.38 1,161.67
Greenville 581.85 622.78 1,049.07 9,923.57 148.67 12,325.94
Greenwood 0.09 32.61 188.87 1,240.66 32.20 1,494.43
Hampton 23.99 92.48 32.96 303.65 19.71 472.79
Horry 1.32 1,179.28 1,727.86 5,647.01 147.40 8,702.87
Jasper 4.10 141.92 57.97 196.51 24.80 425.30
Kershaw 88.07 723.46 120.28 683.34 69.20 1,684.35
Lancaster 0.12 655.59 187.63 885.95 53.11 1,782.40
Laurens 0.12 182.72 180.35 650.40 54.82 1,068.41
Lee 0.03 57.68 24.49 290.60 26.01 398.81
Lexington 1,909.48 485.07 735.83 1,183.41 212.32 4,526.11
Marion 0.09 0.22 85.34 202.29 63.40 351.34
Marlboro 0.09 1.68 45.07 157.74 5.13 209.71
McCormick 0.09 2.85 928.05 46.17 14.14 991.30
Newberry 0.12 132.82 71.10 953.68 27.80 1,185.52
Oconee 11.46 2.47 128.79 1,069.14 198.61 1,410.47
Orangeburg 0.12 1,371.99 228.89 1,044.03 105.27 2,750.30
Pickens 0.66 353.86 231.58 1,313.13 92.45 1,991.68
Richland 5,715.02 1,119.65 1,320.41 4,211.81 122.55 12,489.44
Saluda 0.09 8.56 33.08 168.51 35.51 245.75
Spartanburg 0.15 1,760.36 778.12 3,146.85 169.07 5,854.55
Sumter 3,490.92 275.81 203.10 1,589.07 71.52 5,630.42
Union 0.66 81.85 47.51 279.45 12.77 422.24
Williamsburg 0.09 140.86 49.52 189.43 1.00 380.90
York 36.86 862.24 509.03 3,887.38 135.49 5,431.00
STATE TOTAL 19,295.08 13,709.07 13,273.24 61,017.79 3,098.79 110,393.99

South Carolina Solid Waste Management Annual Report for Fiscal Year 2016 27
TABLE 5.8: Miscellaneous Items Recycled by County in Tons
COUNTY ANTIFREEZE CARPET CARPET PADDING
COOKING OIL/GREASE
FLUORESCENT BULBS HHM INKJET/TONER
CARTRIDGES MATTRESSES
Abbeville 0.49 0.00 0.00 8.43 1.56 0.00 0.11 0.01
Aiken 1.19 0.00 0.00 9.39 0.61 0.00 0.21 0.01
Allendale 0.15 0.00 0.00 0.03 0.03 0.00 0.13 0.00
Anderson 0.50 0.00 0.00 102.80 3.99 0.00 3.68 0.01
Bamberg 0.00 0.00 0.00 0.00 0.01 0.00 0.02 0.01
Barnwell 0.15 0.00 0.00 2.66 0.04 0.00 0.11 0.00
Beaufort 8.06 0.00 0.00 46.19 2.64 0.00 2.04 0.01
Berkeley 17.10 7.50 117.51 18.02 2.84 0.00 3.06 0.00
Calhoun 0.00 0.00 0.00 0.00 2.45 0.00 0.07 0.00
Charleston 34.20 0.75 0.02 64.86 15.08 0.00 1.72 5.79
Cherokee 0.33 0.00 0.00 2.66 0.37 0.00 0.28 0.02
Chester 0.72 0.00 0.00 13.83 0.19 8.00 0.16 0.01
Chesterfield 0.18 0.00 0.00 48.45 2.26 0.00 0.02 0.00
Clarendon 0.15 0.00 0.00 3.29 0.03 0.00 0.11 0.00
Colleton 0.41 0.00 0.00 8.87 0.08 0.00 3.48 0.01
Darlington 0.40 0.00 0.00 60.78 0.08 0.00 0.11 0.00
Dillon 0.40 0.00 0.00 3.82 0.21 0.00 0.11 0.01
Dorchester 2.44 103.23 0.00 35.14 0.87 0.00 0.21 0.01
Edgefield 0.49 0.00 0.00 2.30 0.09 0.00 0.11 0.00
Fairfield 0.18 0.00 0.00 8.41 0.11 0.00 0.02 0.01
Florence 0.72 0.00 0.00 22.13 0.08 0.00 0.55 0.00
Georgetown 0.41 15.68 0.40 2,000.62 0.18 5.41 0.56 0.01
Greenville 31.39 0.00 0.00 73.49 16.66 0.00 1.60 0.01
Greenwood 1.12 0.00 0.00 6.66 1.28 0.00 2.21 0.00
Hampton 0.37 0.00 0.00 0.03 0.06 0.00 0.13 0.01
Horry 1,535.25 389.47 207.36 986.04 7.27 0.00 4.85 18.88
Jasper 0.48 0.00 0.00 5.06 0.06 0.00 0.14 0.00
Kershaw 2.65 0.00 0.00 2.96 0.12 0.00 0.11 0.00
Lancaster 1.33 0.00 0.00 8.13 0.05 0.00 0.11 0.01
Laurens 0.49 0.00 0.00 5.49 0.65 0.00 0.31 0.01
Lee 0.00 0.00 0.00 0.00 0.10 0.00 0.02 0.01
Lexington 46.61 206.97 176.6 62.48 39.67 17.48 2.16 180.98
Marion 365.40 0.00 0.00 5.34 0.08 0.00 0.11 0.00
Marlboro 0.25 0.00 0.00 5.30 0.19 0.00 0.35 0.00
McCormick 0.49 0.00 0.00 0.33 0.09 0.00 0.11 0.00
Newberry 1.11 0.00 0.00 4.85 1.67 0.00 0.11 0.01
Oconee 19.13 0.00 0.00 63.02 3.47 0.00 2.71 0.01
Orangeburg 1.15 0.00 0.00 20.09 3.43 0.00 67.51 0.01
Pickens 1.90 0.00 0.00 28.82 4.62 0.00 2.35 0.01
Richland 3.12 18.99 13.31 46.55 11.56 23.01 9.78 176.95
Saluda 0.49 0.00 0.00 0.03 0.09 0.00 0.11 0.00
Spartanburg 21.91 120.00 0.00 29.68 16.60 20.75 0.73 0.03
Sumter 8.75 0.02 0.01 11.79 6.09 0.00 1.00 0.01
Union 0.33 0.00 0.00 5.50 0.35 0.00 0.27 0.02
Williamsburg 0.40 2.00 0.00 0.03 0.08 0.00 0.36 15.00
York 937.89 426.40 0.00 93.70 21.05 3.51 11.00 0.01
STATE TOTAL 3,050.67 1,291.01 515.21 3,928.04 169.07 78.16 125.00 397.89
Continued on the following page

28 South Carolina Solid Waste Management Annual Report for Fiscal Year 2016
TABLE 5.8: Miscellaneous Items Recycled by County in Tons (continued)
COUNTY PAINT RECHARGEABLE BATTERIES TEXTILES USED OIL
FILTERSWOOD
PACKAGING OTHER ITEMS TOTAL
Abbeville 0.00 0.44 330.80 1.79 57.59 60.44 461.66
Aiken 0.00 1.14 0.01 0.17 360.77 153.78 527.28
Allendale 0.00 0.02 0.01 1.08 0.05 0.10 1.60
Anderson 1.25 0.38 388.75 2.88 2,699.57 681.08 3,884.89
Bamberg 0.00 0.01 0.01 0.00 0.01 0.06 0.13
Barnwell 0.00 0.02 0.01 0.07 0.05 1.53 4.63
Beaufort 327.22 5.09 0.01 13.36 389.26 238.20 1,032.08
Berkeley 0.05 2.48 11.06 47.55 1,199.23 137.98 1,564.37
Calhoun 0.00 0.11 0.01 0.00 31.10 0.04 33.78
Charleston 79.30 3.77 0.01 33.20 2,836.15 44.12 3,118.97
Cherokee 0.01 0.10 0.01 3.19 230.05 0.45 237.46
Chester 7.00 0.32 0.01 1.72 13.28 0.12 45.36
Chesterfield 0.00 0.14 4,670.16 5.10 0.14 142.54 4,868.99
Clarendon 0.00 0.02 0.01 0.07 0.05 0.10 3.83
Colleton 0.00 0.02 0.01 0.45 0.06 0.11 13.50
Darlington 0.00 0.13 0.01 0.27 143.05 0.10 204.93
Dillon 0.00 0.02 0.01 0.27 0.06 0.10 5.01
Dorchester 0.00 1.83 8.06 5.05 868.56 0.13 1,025.54
Edgefield 0.00 0.02 8.06 2.32 0.20 0.92 14.51
Fairfield 0.00 0.08 0.01 2.20 0.15 0.06 11.23
Florence 0.00 0.43 8.06 3.62 260.05 0.11 295.76
Georgetown 58.32 0.03 1,587.51 0.28 313.81 5.67 3,988.89
Greenville 2.10 3.11 346.19 12.24 2,338.37 68.76 2,893.92
Greenwood 0.00 0.21 0.01 0.48 705.13 0.91 718.01
Hampton 0.00 0.02 0.01 1.77 0.05 0.12 2.57
Horry 65.30 76.83 1,518.74 108.65 1,048.66 5.88 5,973.17
Jasper 0.00 0.00 0.01 0.38 0.00 3.04 9.17
Kershaw 0.00 0.17 8.06 1.87 117.05 0.11 133.10
Lancaster 5.23 2.73 0.01 27.50 199.91 0.14 245.15
Laurens 0.00 0.07 0.01 0.38 17.36 0.93 25.70
Lee 0.00 0.00 0.01 4.03 0.01 66.40 70.58
Lexington 0.70 3.78 71.01 323.96 5,457.45 323.35 6,913.20
Marion 0.00 0.03 0.01 20.63 100.05 0.10 491.75
Marlboro 0.00 0.08 0.01 0.83 20.00 21.04 48.05
McCormick 0.00 0.02 8.06 1.21 0.20 0.92 11.43
Newberry 0.25 0.25 0.01 99.71 1,389.2 0.93 1,498.11
Oconee 0.00 1.36 131.07 16.95 944.42 111.51 1,293.65
Orangeburg 0.25 1.14 0.01 3.40 1,055.61 164.74 1,317.34
Pickens 0.00 0.36 679.06 413.05 390.46 4.01 1,524.63
Richland 2.34 5.99 135.38 112.09 853.98 61.62 1,474.66
Saluda 0.00 0.02 0.00 1.75 0.20 0.91 3.60
Spartanburg 16.60 6.35 159.08 6.88 7,398.49 181.61 7,978.69
Sumter 0.01 0.47 87.22 110.87 237.85 1.18 465.27
Union 0.00 0.02 0.01 1.23 0.50 0.17 8.40
Williamsburg 0.00 0.02 0.01 0.27 14.84 0.10 33.11
York 100.03 8.37 57.96 1,257.16 2,351.91 19.03 5,288.00
STATE TOTAL 665.96 127.99 10,214.55 2,651.91 34,044.93 2,505.23 59,765.63

South Carolina Solid Waste Management Annual Report for Fiscal Year 2016 29
TABLE 5.10: Commingled Items Recycled by County
COUNTY TONS
Abbeville 1.28
Aiken 3,148.73
Allendale 2.91
Anderson 24,388.43
Bamberg 4.68
Barnwell 0.27
Beaufort 4,401.01
Berkeley 3,235.24
Calhoun 67.13
Charleston 41,359.83
Cherokee 61.36
Chester 50.62
Chesterfield 576.41
Clarendon 0.27
Colleton 38.62
Darlington 609.1
Dillon 1.28
Dorchester 5,113.48
Edgefield 43.85
Fairfield 14.87
Florence 2,727.08
Georgetown 29.12
Greenville 24,036.04
Greenwood 2,220.07
Hampton 16.88
Horry 1,888.17
Jasper 16.66
Kershaw 61.11
Lancaster 813.02
Laurens 38.68
Lee 11.41
Lexington 8,853.71
Marion 35.57
Marlboro 0.00
McCormick 0.27
Newberry 391.10
Oconee 15.81
Orangeburg 72.44
Pickens 1,283.72
Richland 20,220.44
Saluda 18.20
Spartanburg 10,096.16
Sumter 1.72
Union 363.86
Williamsburg 4.80
York 5,987.57
STATE TOTAL 162,322.97
TABLE 5.9: Organics Recycled by County
COUNTY FOOD WASTE
YARD TRIMMINGS (boiler fuel)
YARD TRIMMINGS (composted)
YARD TRIMMINGS (mulched)
TONS
Abbeville 0.01 0.00 0.00 0.01 0.02
Aiken 0.01 0.00 0.00 0.01 0.02
Allendale 0.01 0.00 0.00 0.00 0.01
Anderson 30.01 0.00 0.00 0.01 30.02
Bamberg 0.01 0.00 0.00 0.01 0.02
Barnwell 0.01 0.00 0.00 0.00 0.01
Beaufort 42.60 5,281.50 1,799.00 0.13 7,123.23
Berkeley 5.17 0.00 26.44 44.29 75.90
Calhoun 0.01 0.00 0.00 0.00 0.01
Charleston 5,200.64 0.00 66,573.57 1.38 71,775.59
Cherokee 0.02 0.00 0.00 1,123.26 1,123.28
Chester 0.01 0.00 0.00 0.01 0.02
Chesterfield 0.01 0.00 0.00 0.00 0.01
Clarendon 0.01 0.00 0.00 0.00 0.01
Colleton 0.01 0.00 0.00 0.13 0.14
Darlington 0.01 0.00 0.00 0.00 0.01
Dillon 0.01 0.00 0.00 0.01 0.02
Dorchester 38.81 0.00 0.00 14,827.20 14,866.01
Edgefield 0.01 0.00 0.00 0.00 0.01
Fairfield 0.01 0.00 0.00 1,200.01 1,200.02
Florence 0.01 0.00 0.00 1,823.25 1,823.26
Georgetown 1.16 199.10 0.28 0.16 200.70
Greenville 573.71 0.00 0.00 29,938.06 30,511.77
Greenwood 925.01 0.00 0.00 0.00 925.01
Hampton 0.01 0.00 0.00 1,789.01 1,789.02
Horry 344.59 0.00 37,114.10 2.16 37,460.85
Jasper 0.01 0.00 0.00 0.12 0.13
Kershaw 0.01 0.00 0.00 5,065.00 5,065.01
Lancaster 0.01 0.00 0.00 0.01 0.02
Laurens 0.01 0.00 0.00 185.60 185.61
Lee 0.01 0.00 0.00 155.01 155.02
Lexington 128.01 0.00 6,710.88 10,001.59 16,840.48
Marion 0.01 0.00 0.00 0.00 0.01
Marlboro 0.01 0.00 2,581.00 0.00 2,581.01
McCormick 0.01 0.00 0.00 0.00 0.01
Newberry 2,553.16 0.00 0.00 3,347.61 5,900.77
Oconee 0.01 0.00 0.00 4,211.90 4,211.91
Orangeburg 39.81 0.00 0.00 0.01 39.82
Pickens 271.36 0.00 1,230.59 5,382.56 6,884.51
Richland 0.01 0.00 0.00 2,757.80 2,757.81
Saluda 0.01 0.00 0.00 0.00 0.01
Spartanburg 0.02 0.00 67.79 4,285.84 4,353.65
Sumter 0.01 535.90 209.37 0.01 745.29
Union 0.02 0.00 0.00 10.83 10.85
Williamsburg 0.01 0.00 0.00 0.00 0.01
York 2.98 0.00 0.00 13,042.07 13,045.05
STATE TOTAL 10,157.37 6,016.50 116,313.02 99,195.06 231,681.95

30 South Carolina Solid Waste Management Annual Report for Fiscal Year 2016
TABLE 5.11: Amount of Glass Recycled in South Carolina by FY
FISCAL YEAR TONS
2012 10,646.59
2013 9,183.02
2014 5,979.56
2015 6,288.69
2016 6,670.82
TABLE 5.12: Amount of Metal Recycled in South Carolina by FY
FISCAL YEAR TONS
2012 323,820.77
2013 340,623.29
2014 349,233.40
2015 236,137.31
2016 211,342.13
TABLE 5.13: Amount of Paper Recycled in South Carolina by FY
FISCAL YEAR TONS
2012 395,775.10
2013 474,784.31
2014 316,216.86
2015 305,797.77
2016 281,320.45
TABLE 5.14: Amount of Plastic Recycled in South Carolina by FY
FISCAL YEAR TONS
2012 18,211.66
2013 19,813.86
2014 16,077.12
2015 17,311.26
2016 23,636.67
TABLE 5.15: Amount of Banned Items Recycled in South Carolina by FY
FISCAL YEAR TONS
2012 328,791.42
2013 337,863.96
2014 95,691.21
2015 92,566.37
2016 110,393.99
TABLE 5.16: Amount of Miscellaneous Items Recycled in South Carolina by FY
FISCAL YEAR TONS
2012 70,045.05
2013 57,141.48
2014 115,843.91
2015 70,943.61
2016 59,765.63
TABLE 5.17: Amount of Organics Recycled in South Carolina by FY
FISCAL YEAR TONS
2012 1,624.64*
2013 8,906.25*
2014 257,980.35
2015 203,571.24
2016 323,211.88
*This amount is included in the total for Miscellaneous Items under Food Scraps.
TABLE 5.18: Amount of Commingled Recycled in South Carolina by FY
FISCAL YEAR TONS
2012 81,809.84
2013 92,550.41
2014 106,472.43
2015 168,573.82
2016 162,322.97
TABLE 5.19: HHM Collected by Counties in FY16
COUNTY TONS
Beaufort* 327.22
Charleston* 79.30
Georgetown 63.71
Greenville* 2.10
Horry* 65.05
Lancaster* 5.23
Lexington 17.48
Richland 23.01
Spartanburg 35.75
York 86.15
*Only paint was reported.

South Carolina Solid Waste Management Annual Report for Fiscal Year 2016 31
Used Motor Oil RecyclingThe S.C. Solid Waste Policy and Management Act of 1991 (Act) – S.C. Code of Laws § 44-96-160 – requires the S.C. Department of Health and Environmental Control (DHEC) to publish an annual report on the state’s used motor oil recycling program for do-it-yourself oil changers (DIYers).
According to the Act, the report must include:
• The amount of used motor oil collected in each county;
• The number of used motor oil collection sites available in each county; and
• A summary of local government programs receiving grant funding from DHEC.
The Act requires transporters of used motor oil to register and report to DHEC the amount hauled each calendar year. For purposes of this report, however, the amount of used motor oil collected is presented by fiscal year (FY) – July 1 to June 30 – as reported by counties.
Overall, there are few barriers to recycling used motor oil, filters and bottles. Despite a continuing price drop, some local governments still earn revenue from the sale of used motor oil. Scrap dealers and steel mills accept drained and crushed used motor oil filters. Bottles, if properly drained, can be recycled with other plastic bottles.
Chart 6.1 illustrates the success of the used motor oil collection program by FY.
Table 6.2 lists the number of sites and gallons collected by county as well as grant awards to the county or municipalities within that county.
There is a fee of 2 cents per quart of motor oil collected at the wholesale level. Part of this funding is used to provide grants for local governments focusing on DIY used motor oil collection and recycling. In FY16, $704,893 was awarded to local government programs and primarily used for the purchase of equipment and supplies associated with used motor oil collection sites. Funds also were used to cover costs for used motor oil filter recycling, public education and professional development of local government recycling coordinators and others.
In addition to used motor oil, most county and some municipal recycling programs collect used motor oil filters and bottles from DIYers.
The amount of used motor oil filters and motor oil bottles recycled is difficult to determine or is not always available. For example, many counties collect and market filters with other metals. Given that, the data presented in Section 5 (Table 5.7) does not reflect the full extent of used motor oil filter recycling in the state.
In South Carolina, only used motor oil recycled by DIYers is counted as part of the state’s municipal solid waste recycling rate. In FY16, DIYers recycled nearly 888,079 gallons (or about 3,099 tons) of used motor oil – an increase of nearly 25 percent from the previous FY.
FY16 888,079 gallons
FY15 711,411 gallons
FY14 951,531 gallons
FY13 828,836 gallons
FY12 932,725 gallons
SECTION
06
CHART 6.1: Gallons of Used Motor Oil Recycled by S.C. DIYers by FY
Nearly 888,079 gallons of
used motor oil were collected from DIYers
in South Carolina during FY16.

32 South Carolina Solid Waste Management Annual Report for Fiscal Year 2016
TABLE 6.2: Number of DIY Used Motor Oil Collection Sites, FY16 Grants Awarded, Gallons Collected and Tonnage Equivalent by County for FY16
GRANTEE NUMBER OF SITES GALLONS TONS GRANT AMOUNTAbbeville 13 7,774.30 27.21 $10,804.00 Aiken 32 36,985.70 129.45 $4,300.00 Allendale 6 1,542.80 5.40 tAnderson 33 27,311.40 95.59 $11,750.00 Bamberg 10 6,074.20 21.26 tBarnwell 14 8,971.40 31.40 tBeaufort 20 30,434.30 106.52 $7,210.00 Berkeley 31 31,985.70 111.95 $15,800.00 Calhoun 10 24,505.70 85.77 tCharleston 30 49,520.00 173.32 $10,872.00 Cherokee 18 6,414.20 22.45 $6,850.00 Chester 15 11,542.80 40.40 $4,950.00 Chesterfield 13 7,848.50 28.47 $4,114.00 Clarendon 20 4,800.00 16.80 $6,317.00 Colleton 19 674.30 2.36 $6,263.50 Darlington 19 7,140.00 24.99 $16,890.00 Dillon 18 4,628.50 16.20 $14,350.00 Dorchester 21 28,382.80 99.34 $12,340.00 Edgefield 9 16,394.30 57.38 tFairfield 13 9,965.70 34.88 $15,684.00 Florence 30 23,520.00 82.32 $9,837.50 Georgetown 22 12,108.60 42.38 $33,085.00 Greenville 40 42,477.10 148.67 $19,250.00
Greater Greenville Sanitation t t t $750.00
City of Greenville t t t $4,750.00 City of Simpsonville t t t $3,135.00
Greenwood 14 9,200.00 32.20 $5,765.50 Hampton 13 5,631.40 19.71 $7,523.00 Horry 45 42,114.30 147.40 $43,535.00 Jasper 7 7,085.70 24.80 $5,030.00 Kershaw 17 19,771.40 69.20 $15,275.00 Lancaster 16 15,174.30 53.11 $26,750.00 Laurens 13 15,662.80 54.82 $12,667.00 Lee 10 7,431.40 26.01 tLexington 34 60,662.80 212.32 $13,420.00 Marion 9 18,114.30 63.40 $4,377.50 Marlboro 17 1,465.70 5.13 $18,708.00 McCormick 4 4,040.00 14.14 tNewberry 15 7,942.80 27.8 $10,461.00 Oconee 21 56,745.70 198.61 $39,250.00 Orangeburg 30 30,077.10 105.27 tPickens 19 26,414.20 92.45 $20,060.00 Richland 31 35,014.20 122.55 $45,120.00
Columbia, City of t t t $5,750.00 Saluda 9 10,145.70 35.51 tSpartanburg 43 48,305.70 169.07 $41,000.00
Spartanburg, City of t t t $2,858.00 Sumter 22 20,431.50 71.52 $22,906.00
Sumter, City of t t t $3,750.00 Union 10 3,648.50 12.77 tWilliamsburg 25 285.71 1.00 $23,575.00 York 41 38,711.40 135.49 $17,750.00
Rock Hill, City of t t t $7,450.00 Three Rivers SWA1 t t t $86,110.00 Tri-County SWA2 t t t $6,500.00 TOTAL 912 888,078.91 3,098.79 $704,893.00
1. The Three Rivers Solid Waste Authority (SWA) provides solid waste management services to local governments in Aiken, Allendale, Bamberg, Barnwell, Calhoun, Edgefield, McCormick, Orangeburg and Saluda counties.
2. The Tri-County SWA provides solid waste management services to local governments in Edgefield, McCormick and Saluda counties.
t Grant funding awarded to municipalities and regional authorities primarily is used to promote used motor oil recycling. Collection sites operated and/or used motor oil collected by a municipality are included in the county’s total.
NOTES: The majority of sites listed above are provided by local governments, but the total number (912) includes retailers, quick lubes and auto parts stores. Gallons are converted to weight (1 gallon = 7 pounds).

South Carolina Solid Waste Management Annual Report for Fiscal Year 2016 33
Recycling: State Agencies & Colleges/UniversitiesThe S.C. Solid Waste Policy and Management Act of 1991 (Act) – S.C. Code of Laws § 44-96-140 – requires state agencies and state-supported colleges/universities to:
• Establish recycling programs for the collection of selected material including, but not limited to, aluminum, cardboard, glass, lead-acid batteries, paper, plastic, tires and used motor oil;
• Make necessary modifications to their programs to ensure material is recycled to the maximum extent possible; and
• Report the type and amount of material recycled as well as information on the purchase of recycled-content products by September 15 of each year to the S.C. Department of Health and Environmental Control (DHEC).
DHEC is required to submit a report on this information to the Governor and General Assembly by November 1 of each year. This section is a condensed version of the
report and reflects recycling and buying recycled activities for fiscal year (FY) 2016 (July 1, 2015 to June 30, 2016). For more details, see the box below.
Data regarding the amount of material recycled was received either directly from the state agency or college/university that completed the survey provided by DHEC or from vendors providing recycling services. Both public and private colleges/universities are
included in this report although only state-supported colleges/universities are required by the Act to provide information.
In FY16, state agencies and colleges/universities recycled more than 54,000 tons of material – an increase of about 176 percent from the 19,615 tons recycled in FY15. This data was compiled from the information
reported by 59 state agencies, two state agency complexes (collectively 22 state agencies) and 28 colleges/universities.
Overall, state agencies reported recycling 9,462 tons of material in FY16 – about a 79 percent increase from the 5,289 tons recycled the previous FY. Paper was the most recycled commodity followed by metal.*
Colleges/universities reported recycling about 44,712 tons of material – a 212 percent increase from the 14,325 tons recycled the previous FY. C&D debris was the most recycled commodity followed by paper. In FY16, colleges/universities recycled 36,536 tons of C&D debris – an increase of 845 percent from the previous FY.
The percentage of state purchases that contain recycled material cannot be determined because no statewide system to track those purchases exists. The recycled-content products purchased most frequently by state agencies and colleges/universities were office paper and inkjet/toner cartridges.
SECTION
07
CHART 7.1: Percentage of State Agencies Reporting Recycling Data
REPORTED INDEPENDENTLY
49%DID NOT REPORT
32%
LOCATED IN COMPLEX/ MULTI-USE BUILDING
19%
State agencies and colleges/universities recycled more than
54,000 tons of material in FY16.
Want more information? Visit www.scdhec.gov/recycle (then select “Data and Reports”) to see the full report about the recycling efforts of South Carolina’s state agencies and colleges/universities.

34 South Carolina Solid Waste Management Annual Report for Fiscal Year 2016
Recycling by State AgenciesState agencies reported recycling 9,462 tons of material – an increase of about 79 percent from FY15. Compared to the previous FY, there were noteworthy decreases in glass recycling (about 45 percent) and banned items (47 percent). More material was commingled in FY16 – resulting in a decrease in individual commodity numbers. The largest contributions to the FY16 increase in recycling were paper, metal and plastic. Paper and metal were the most recycled products.
Fifty-nine individual state agencies reported this year compared to 72 in FY15. Due to the housing of state agencies within multi-office buildings and complexes, those located within the Capitol Complex and the South Trust Building in Columbia are reported under those titles. State agencies within these structures who reported their own numbers are listed as individual agencies.
For a complete list of state agencies that reported FY16 data, see pages 36-37.
PAPER 78%
GLASS <1%
ORGANICS <1%
METAL 13%
BANNED ITEMS 3%MISCELLANEOUS ITEMS 3%
COMMINGLED 1%PLASTIC 1%
TABLE 7.2: Commodities Recycled in Tons
COMMODITIES RECYCLED AMOUNTBanned Items Appliances 11.81
Electronics 20.52Lead-acid batteries 13.48Tires 40.78Used motor oil 205.49
TOTAL BANNED ITEMS 292.08Commingled Recyclables
May include: aluminum cans; cardboard; glass; paper; and/or plastic
88.63
TOTAL COMMINGLED RECYCLABLES 88.63Glass (Containers and Packaging)
Brown 19.94Clear 1.83Green 0.97Other/Mixed Glass 4.57
TOTAL GLASS 27.31Metal Aluminum (cans, foil) 125.29
Ferrous metals 192.28Steel cans 194.55Other/mixed metal 755.61
TOTAL METAL 1,267.73Organics Food waste
(composted)1.25
Yard trimmings (composted)
0.55
Yard trimmings (mulched)
21.95
TOTAL ORGANICS 23.75Paper Books 12.33
Cardboard 822.62Magazines 8.00Newspapers and inserts
4.64
Office paper 434.01Paperboard 15.28Phone books 1,003.33Other/mixed paper 5,053.16
TOTAL PAPER 7,356.37Plastic HDPE 2.21
LDPE 0.02PET 1.04Vinyl 0.01Other/mixed plastic 127.55
TOTAL PLASTIC 130.81Miscellaneous Items
* Wood includes furniture, cabinets and pallets
** Other includes batteries, cereal bags, non-hazardous sludge, oil absorbents, and tar waste
Antifreeze 18.54Clothing/textiles 81.30Construction and demolition (C&D) debris
87.49
Cooking oil 2.41Fluorescent bulbs 10.54Inkjet/toner cartridges 6.45Paint (oil or latex) 0.37Mattresses/box springs 0.65Rechargeable batteries 1.29Used oil filters 20.28Wood* 11.27Other** 35.20
TOTAL MISCELLANEOUS ITEMS 275.79TOTAL FOR ALL 9,462.49
CHART 7.3: Percentage of MSW Recycled by State Agencies
NOTES: Percentages may not add up to 100 percent due to rounding of numbers. While C&D debris is included in the “State Agencies & Colleges/Universities Recycling & Buying Recycled Annual Report,” it is not included in the state’s MSW recycling rate.
State agencies recycled 9,462 tons
of material in FY16 – about 79 percent more than FY15.

South Carolina Solid Waste Management Annual Report for Fiscal Year 2016 35
Recycling by Colleges/UniversitiesColleges/universities reported recycling about 44,712 tons of material – a 212 percent increase from the 14,325 tons recycled the previous FY. This increase is largely influenced by C&D debris. In FY16, colleges/universities recycled more than 36,536 tons of C&D debris – an increase of 845 percent from the previous FY.
Compared to FY15, plastic and glass recycling almost doubled while commingled material, metal and paper all decreased. The most recycled commodities in FY16 were C&D debris, paper and organics.
Twenty-eight colleges/universities reported recycling and buying recycled data for FY16 (compared to 39 reporting in FY15) with 13 colleges/universities reporting an increase in their total recycling compared to FY15. One university reported for the first time in FY16.
For a complete list of colleges/universities that reported FY16 data, see pages 37-38.
TABLE 7.4: Commodities Recycled in TonsCOMMODITIES RECYCLED AMOUNT
Banned Items Appliances 3.02Electronics 277.84Lead-acid batteries 15.22Tires 14.80Used motor oil 16.34
TOTAL BANNED ITEMS 327.22Commingled Recyclables
May include: aluminum cans; cardboard; glass; paper; and/or plastic
949.77
TOTAL COMMINGLED RECYCLABLES 949.77Glass (Containers and Packaging)
Brown 0.01Clear 0.07Green 0.00Other/Mixed Glass 56.72
TOTAL GLASS 56.80 Metal Aluminum (cans, foil) 8.88
Ferrous metals 67.72Steel cans 2.69Other/mixed metal 588.64
TOTAL METAL 667.93Organics Food waste
(composted)993.31
Yard trimmings (composted)
1,416.14
Yard trimmings (mulched)
34.55
TOTAL ORGANICS 2,444.00Paper Books 38.53
Cardboard 1,553.66Magazines 8.23Newspapers and inserts
2.54
Office paper 751.61Paperboard 0.15Phone books 1.87Other/mixed paper 572.54
TOTAL PAPER 2,929.13Plastic HDPE 2.90
LDPE 1.00PET 0.70Vinyl 0.00Other/mixed plastic 60.45
TOTAL PLASTIC 65.05Miscellaneous Items
* Wood includes furniture, cabinets and pallets
** Other includes ballasts, batteries, used biodiesel, glycerin, medical supplies, metal cylinders, plastic film, solvents, solvent rags, styrofoam, water filters, x-ray film
Antifreeze 4.09Carpet 2.57Carpet padding 0.83Clothing/textiles 0.01C&D debris 36,535.99Cooking oil 66.08Fluorescent bulbs 19.08Inkjet/toner cartridges 15.68Mattresses/box springs 5.84Paint (oil or latex) 2.34Rechargeable batteries 1.28Used oil filters 401.55Wood* 171.39Other** 45.59
TOTAL MISCELLANEOUS ITEMS 37,272.32TOTAL FOR ALL 44,712.22
PAPER 7%
GLASS <1%
ORGANICS 6%METAL 2%
BANNED ITEMS 1%
MISCELLANEOUS ITEMS 83%
COMMINGLED 2%
PLASTIC <1%
NOTES: Percentages may not add up to 100 percent due to rounding of numbers. While C&D debris is included in the “State Agencies & Colleges/Universities Recycling & Buying Recycled Annual Report,” it is not included in the state’s MSW recycling rate.
CHART 7.5: Percentage of MSW Recycled by Colleges/Universities
Recycling by the state’s colleges/universities
increased by 212 percent in FY16.

36 South Carolina Solid Waste Management Annual Report for Fiscal Year 2016
State Agencies Reporting for FY16• Adjutant General’s Office
• Arts Commission
• Attorney General’s Office
• Capitol Complex*
• Commission for the Blind
• Commission on Higher Education
• Commission on Indigent Defense
• Commission on Prosecution Coordination
• Comptroller General’s Office
• Criminal Justice Academy
• Department of Administration – Executive Budget Office
• Department of Administration – Surplus Property Office
• Department of Agriculture
• Department of Archives and History
• Department of Consumer Affairs
• Department of Corrections
• Department of Disabilities and Special Needs
• Department of Education
• Department of Employment and Workforce
• Department of Health and Environmental Control
• Department of Juvenile Justice
• Department of Labor, Licensing and Regulation
• Department of Mental Health
• Department of Motor Vehicles
• Department of Natural Resources
• Department of Parks, Recreation and Tourism
• Department of Probation, Parole and Pardon Services
• Department of Public Safety
• Department of Revenue
• Department of Transportation
• Education Lottery Commission
• Emergency Management Division
• First Steps
• Forestry Commission
• Governor’s Mansion
• Higher Education Tuition Grants Commission
• Human Affairs Commission
• Law Enforcement Division (SLED)
• Legislative Services Agency
• Legislative Audit Council
• National Guard
• Office of Regulatory Staff
• Office of the State Auditor
• Patriots Point Naval and Maritime Museum
• Public Employee Benefit Authority (PEBA)
• Public Service Commission of South Carolina
• Retirement System Investment Commission (RSIC)
• SCETV
• School for the Deaf and Blind
• Sea Grant Consortium
• Secretary of State
• South Trust Building**
• State Accident Fund
• State Board for Technical and Comprehensive Education
• State Ethics Commission
• State Housing Finance and Development Authority
• State Library
• State Museum Commission
• State Supreme Court
• Wil Lou Gray Opportunity School
• Worker’s Compensation Commission
The following state agencies are located within the Capitol Complex.• Administrative Law Court
• Board of Financial Institutions
• Commissioner of Banking
• Court of Appeals
• Department of Administration
• Department of Internal Operations
• Education Oversight Committee
• House of Representatives
• Office of Internal Operations
• Office of the Governor
• Office of the Lieutenant Governor
• Office of the State Treasurer
• Revenue and Fiscal Affairs Office
• Senate
The following state agencies are located within the South Trust Building.• Department of Commerce• Department of Insurance• Economic Development Authority• Office of Local Government• Office of the Insurance Reserve Fund
(State Fiscal Accountability Authority)
• Procurement Services (State Fiscal Accountability Authority)
• Rural Infrastructure Authority
• S.C. Conservation Bank
State Agencies NOT Reporting for FY16• Aeronautics Division
• Commission for Minority Affairs
• Confederate Relic Room and Museum
• Department of Alcohol and Other Drug Abuse Services
• Department of Health and Human Services
• Department of Social Services
• Election Commission
• Energy Office
• Governor’s School for Science and Mathematics
• Governor’s School for the Arts and Humanities
• John de la Howe School
• Judicial Department
• Lieutenant Governor’s Office On Aging
• Lowcountry Council of Governments
• Lowcountry Graduate Center
• Medical Malpractice Patients’ Compensation Fund
• Office of the Inspector General
• Patients’ Compensation Fund
• School Improvement Council
• Solicitor’s Office, 1st Judicial Circuit
• Solicitor’s Office, 2nd Judicial Circuit
• Solicitor’s Office, 3rd Judicial Circuit
• Solicitor’s Office, 4th Judicial Circuit
• Solicitor’s Office, 5th Judicial Circuit
• Solicitor’s Office, 7th Judicial Circuit
• Solicitor’s Office, 8th Judicial Circuit
• Solicitor’s Office, 9th Judicial Circuit
• Solicitor’s Office, 10th Judicial Circuit
• Solicitor’s Office, 11th Judicial Circuit
• Solicitor’s Office, 12th Judicial Circuit
• Solicitor’s Office, 13th Judicial Circuit
• Solicitor’s Office, 14th Judicial Circuit
• Solicitor’s Office, 15th Judicial Circuit
• Solicitor’s Office, 16th Judicial Circuit
• State Ports Authority
• Statewide Independent Living Council
• Transportation Infrastructure Bank
• Vocational Rehabilitation Department

South Carolina Solid Waste Management Annual Report for Fiscal Year 2016 37
Student volunteers participate in a waste audit on the campus of Furman University.
Colleges/Universities Reporting for FY16• Allen University
• Aiken Technical College
• Central Carolina Technical College
• Charleston Southern University
• Clemson University
• Coastal Carolina University
• College of Charleston
• Florence Darlington Technical College
• Francis Marion University
• Greenville Technical College
• Horry-Georgetown Technical College
• Midlands Technical College
• Medical University of South Carolina
• Northeastern Technical College
• Orangeburg-Calhoun Technical College
• Piedmont Technical College
• South Carolina State University
• Spartanburg Community College
• Technical College of the Lowcountry
• The Citadel, The Military College of South Carolina
• University of South Carolina (USC)
• USC Aiken
• USC Beaufort
• USC Sumter
• USC Upstate
• Williamsburg Technical College
• Winthrop University
• York Technical College
Colleges/Universities NOT Reporting for FY16• Columbia International University
• Denmark Technical College
• Lander University
• Tri-County Technical College
• Trident Technical College
• USC School of Medicine
• USC Lancaster
• USC Salkehatchie
• USC Union

38 South Carolina Solid Waste Management Annual Report for Fiscal Year 2016
Recycling: The State & Counties at a GlanceThe S.C. Solid Waste Policy and Management Act of 1991 – S.C. Code of Laws § 44-96-80 – requires counties or regions to annually report municipal solid waste (MSW) recycling data by commodity and amount to the S.C. Department of Health and Environmental Control. The commodities reported are: glass; metal; paper; plastic; organics; banned items; miscellaneous items; and commingled recyclables.
Recycling data also was collected from other sources including waste tire processors, electronics recycling vendors, used motor oil collectors, state agencies and colleges/universities as well as businesses and industries. This data was attributed to counties based on population or source. Once collected, the data is placed into one of three categories based on the source of the material: residential; commercial/institutional; and industrial (office/packaging).
Businesses and industries are not required to report their recycling activities. Unfortunately, the voluntary reporting
TABLE 8.2: S.C. Residential Recycling as a Percent of Total MSW Recycled
FY12 FY13 FY14 FY15 FY1637% 35% 40% 43% 44%
TABLE 8.3: S.C. MSW Recycling Tonnages
TONS+/– IN TONS
FROM PREVIOUS FY
CHANGE FROM
PREVIOUS FYFY12
All MSW 1,229,100 +56,332 +5%Residential Only 460,588 +46,936 +11%
FY13All MSW 1,371,960 +142,860 +11.6%Residential Only 478,426 +17,838 +3.8%
FY14All MSW 1,263,495 –108,465 –8%Residential Only 502,535 +24,109 +5%
FY15All MSW 1,101,190 –162,305 –13%Residential Only 469,318 –33,217 –6.6%
FY16All MSW 1,094,569 –6,621 –0.6%Residential Only 485,343 +15,911 +3.3%
TABLE 8.1: S.C. Counties Meeting the Waste Reduction Goal of 3.25 P/P/D or Less in FY16
COUNTY DISPOSAL RATE COUNTY DISPOSAL
RATEAbbeville 2.72 Laurens 2.66Allendale 2.33 Lee 2.55Berkeley 2.54 Lexington 2.97Chesterfield 2.54 Marlboro 2.41Clarendon 2.10 McCormick 2.31Colleton 2.77 Orangeburg 3.24Darlington 2.83 Pickens 2.54Dorchester 2.68 Richland 3.20Edgefield 3.25 Saluda 2.44Hampton 2.79 Sumter 3.07Jasper 2.52 Union 3.06Kershaw 2.88 Williamsburg 1.36Lancaster 2.39
by these sources is inconsistent and effects the state’s ability to accurately measure its recycling efforts.
South Carolina’s MSW recycling rate decreased to 25.4 percent in fiscal year (FY) 2016 (July 1, 2015 to June 30, 2016) from 26.5 percent in FY15. In South Carolina, only MSW is used to measure the state’s recycling efforts. (See the definition on page 2.) Overall, the amount of MSW recycled decreased less than 1 percent from 1,101,190 tons in FY15 to 1,094,569 tons in FY16. For total MSW and residential recycling tonnages since FY12, see Table 8.3.
The state’s goal is to recycle at least 40 percent of its MSW and reduce MSW disposal to 3.25 pounds (or less) per person per day (p/p/d) by 2020. In FY16, only one county – Anderson – had a recycling rate greater than 40 percent. Twenty-five counties met the waste reduction goal of 3.25 p/p/d or less. (See Table 8.1.) For a county-by-county comparison of MSW recycling and disposal data, see Table 9.11 on page 96.
SECTION
08
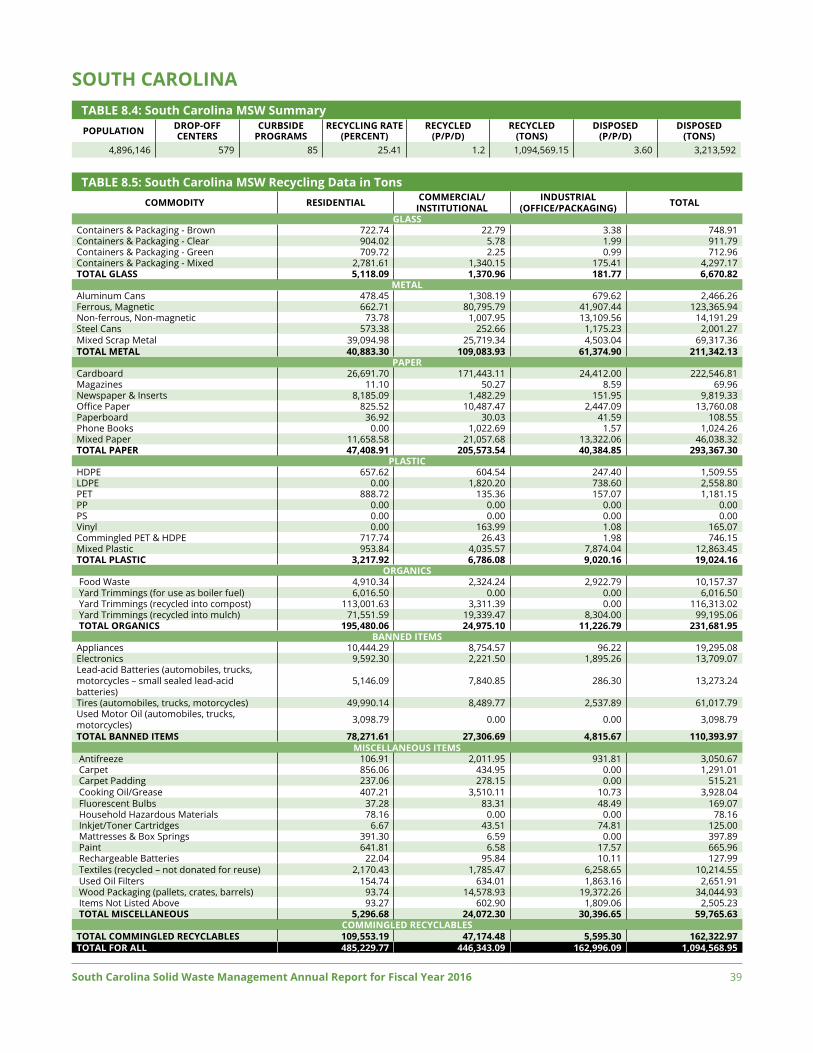
South Carolina Solid Waste Management Annual Report for Fiscal Year 2016 39
SOUTH CAROLINATABLE 8.4: South Carolina MSW SummaryPOPULATION DROP-OFF
CENTERSCURBSIDE
PROGRAMSRECYCLING RATE
(PERCENT)RECYCLED
(P/P/D)RECYCLED
(TONS)DISPOSED
(P/P/D)DISPOSED
(TONS)4,896,146 579 85 25.41 1.2 1,094,569.15 3.60 3,213,592
TABLE 8.5: South Carolina MSW Recycling Data in TonsCOMMODITY RESIDENTIAL COMMERCIAL/
INSTITUTIONALINDUSTRIAL
(OFFICE/PACKAGING) TOTAL
GLASSContainers & Packaging - Brown 722.74 22.79 3.38 748.91Containers & Packaging - Clear 904.02 5.78 1.99 911.79Containers & Packaging - Green 709.72 2.25 0.99 712.96Containers & Packaging - Mixed 2,781.61 1,340.15 175.41 4,297.17TOTAL GLASS 5,118.09 1,370.96 181.77 6,670.82
METALAluminum Cans 478.45 1,308.19 679.62 2,466.26Ferrous, Magnetic 662.71 80,795.79 41,907.44 123,365.94Non-ferrous, Non-magnetic 73.78 1,007.95 13,109.56 14,191.29Steel Cans 573.38 252.66 1,175.23 2,001.27Mixed Scrap Metal 39,094.98 25,719.34 4,503.04 69,317.36TOTAL METAL 40,883.30 109,083.93 61,374.90 211,342.13
PAPERCardboard 26,691.70 171,443.11 24,412.00 222,546.81Magazines 11.10 50.27 8.59 69.96Newspaper & Inserts 8,185.09 1,482.29 151.95 9,819.33Office Paper 825.52 10,487.47 2,447.09 13,760.08Paperboard 36.92 30.03 41.59 108.55Phone Books 0.00 1,022.69 1.57 1,024.26Mixed Paper 11,658.58 21,057.68 13,322.06 46,038.32TOTAL PAPER 47,408.91 205,573.54 40,384.85 293,367.30
PLASTICHDPE 657.62 604.54 247.40 1,509.55LDPE 0.00 1,820.20 738.60 2,558.80PET 888.72 135.36 157.07 1,181.15PP 0.00 0.00 0.00 0.00PS 0.00 0.00 0.00 0.00Vinyl 0.00 163.99 1.08 165.07Commingled PET & HDPE 717.74 26.43 1.98 746.15Mixed Plastic 953.84 4,035.57 7,874.04 12,863.45TOTAL PLASTIC 3,217.92 6,786.08 9,020.16 19,024.16
ORGANICS Food Waste 4,910.34 2,324.24 2,922.79 10,157.37 Yard Trimmings (for use as boiler fuel) 6,016.50 0.00 0.00 6,016.50 Yard Trimmings (recycled into compost) 113,001.63 3,311.39 0.00 116,313.02 Yard Trimmings (recycled into mulch) 71,551.59 19,339.47 8,304.00 99,195.06 TOTAL ORGANICS 195,480.06 24,975.10 11,226.79 231,681.95
BANNED ITEMSAppliances 10,444.29 8,754.57 96.22 19,295.08Electronics 9,592.30 2,221.50 1,895.26 13,709.07Lead-acid Batteries (automobiles, trucks, motorcycles – small sealed lead-acid batteries)
5,146.09 7,840.85 286.30 13,273.24
Tires (automobiles, trucks, motorcycles) 49,990.14 8,489.77 2,537.89 61,017.79Used Motor Oil (automobiles, trucks, motorcycles) 3,098.79 0.00 0.00 3,098.79
TOTAL BANNED ITEMS 78,271.61 27,306.69 4,815.67 110,393.97MISCELLANEOUS ITEMS
Antifreeze 106.91 2,011.95 931.81 3,050.67 Carpet 856.06 434.95 0.00 1,291.01 Carpet Padding 237.06 278.15 0.00 515.21 Cooking Oil/Grease 407.21 3,510.11 10.73 3,928.04 Fluorescent Bulbs 37.28 83.31 48.49 169.07 Household Hazardous Materials 78.16 0.00 0.00 78.16 Inkjet/Toner Cartridges 6.67 43.51 74.81 125.00 Mattresses & Box Springs 391.30 6.59 0.00 397.89 Paint 641.81 6.58 17.57 665.96 Rechargeable Batteries 22.04 95.84 10.11 127.99 Textiles (recycled – not donated for reuse) 2,170.43 1,785.47 6,258.65 10,214.55 Used Oil Filters 154.74 634.01 1,863.16 2,651.91 Wood Packaging (pallets, crates, barrels) 93.74 14,578.93 19,372.26 34,044.93 Items Not Listed Above 93.27 602.90 1,809.06 2,505.23 TOTAL MISCELLANEOUS 5,296.68 24,072.30 30,396.65 59,765.63
COMMINGLED RECYCLABLESTOTAL COMMINGLED RECYCLABLES 109,553.19 47,174.48 5,595.30 162,322.97TOTAL FOR ALL 485,229.77 446,343.09 162,996.09 1,094,568.95

40 South Carolina Solid Waste Management Annual Report for Fiscal Year 2016
ABBEVILLE COUNTYTABLE 8.6: Abbeville County MSW SummaryPOPULATION DROP-OFF
CENTERSCURBSIDE
PROGRAMSRECYCLING RATE
(PERCENT)RECYCLED
(P/P/D)RECYCLED
(TONS)DISPOSED
(P/P/D)DISPOSED
(TONS)24,932 10 1 18.16 0.60 2,745.06 2.72 12,374
TABLE 8.7: Abbeville County MSW Recycling Data in TonsCOMMODITY RESIDENTIAL COMMERCIAL/
INSTITUTIONALINDUSTRIAL
(OFFICE/PACKAGING) TOTAL
GLASSContainers & Packaging - Brown 0.00 0.09 0.00 0.09Containers & Packaging - Clear 0.00 0.07 0.00 0.07Containers & Packaging - Green 0.00 0.04 0.00 0.04Containers & Packaging - Mixed 0.00 0.04 0.00 0.04TOTAL GLASS 0.00 0.24 0.00 0.24
METALAluminum Cans 4.85 1.01 0.00 5.86Ferrous, Magnetic 0.00 5.15 0.00 5.15Non-ferrous, Non-magnetic 0.00 0.00 0.00 0.00Steel Cans 0.00 0.15 0.00 0.15Mixed Scrap Metal 316.42 28.75 29.13 374.3TOTAL METAL 321.27 35.06 29.13 385.46
PAPERCardboard 160.06 625.01 128.15 913.22Magazines 0.00 0.02 0.00 0.02Newspaper & Inserts 0.00 0.02 0.00 0.02Office Paper 3.21 1.39 0.20 4.80Paperboard 0.00 0.00 0.00 0.00Phone Books 0.00 0.00 0.00 0.00Mixed Paper 87.71 17.08 40.93 146.02TOTAL PAPER 250.98 643.52 169.28 1,063.72
PLASTICHDPE 18.94 19.98 0.00 38.92LDPE 0.00 0.00 18.31 18.31PET 0.00 0.04 0.00 0.04PP 0.00 0.00 0.00 0.00PS 0.00 0.00 0.00 0.00Vinyl 0.00 0.00 0.00 0.00Commingled PET & HDPE 0.00 0.00 0.00 0.00Mixed Plastic 0.00 0.44 165.63 166.07TOTAL PLASTIC 18.94 20.46 183.94 223.34
ORGANICS Food Waste 0.00 0.01 0.00 0.01 Yard Trimmings (for use as boiler fuel) 0.00 0.00 0.00 0.00 Yard Trimmings (recycled into compost) 0.00 0.00 0.00 0.00 Yard Trimmings (recycled into mulch) 0.00 0.01 0.00 0.01 TOTAL ORGANICS 0.00 0.02 0.00 0.02
BANNED ITEMSAppliances 0.00 1.55 0.00 1.55Electronics 68.37 0.22 0.88 69.47Lead-acid Batteries (automobiles, trucks, motorcycles – small sealed lead-acid batteries)
21.74 60.12 0.03 81.89
Tires (automobiles, trucks, motorcycles) 427.76 1.4 0.00 429.16Used Motor Oil (automobiles, trucks, motorcycles) 27.21 0.00 0.00 27.21
TOTAL BANNED ITEMS 545.08 63.29 0.91 609.28MISCELLANEOUS ITEMS
Antifreeze 0.00 0.49 0.00 0.49 Carpet 0.00 0.00 0.00 0.00 Carpet Padding 0.00 0.00 0.00 0.00 Cooking Oil/Grease 0.00 8.43 0.00 8.43 Fluorescent Bulbs 0.00 0.45 1.11 1.56 Household Hazardous Materials 0.00 0.00 0.00 0.00 Inkjet/Toner Cartridges 0.00 0.11 0.00 0.11 Mattresses & Box Springs 0.00 0.01 0.00 0.01 Paint 0.00 0.00 0.00 0.00 Rechargeable Batteries 0.16 0.22 0.06 0.44 Textiles (recycled – not donated for reuse) 0.00 0.01 330.79 330.8 Used Oil Filters 1.08 0.71 0.00 1.79 Wood Packaging (pallets, crates, barrels) 0.00 0.21 57.38 57.59 Items Not Listed Above 0.00 0.93 59.51 60.44 TOTAL MISCELLANEOUS 1.24 11.57 448.85 461.66
COMMINGLED RECYCLABLESTOTAL COMMINGLED RECYCLABLES 0.00 1.28 0.00 1.28TOTAL FOR ALL 1,137.51 775.38 832.11 2,745.00

South Carolina Solid Waste Management Annual Report for Fiscal Year 2016 41
AIKEN COUNTYTABLE 8.8: Aiken County MSW SummaryPOPULATION DROP-OFF
CENTERSCURBSIDE
PROGRAMSRECYCLING RATE
(PERCENT)RECYCLED
(P/P/D)RECYCLED
(TONS)DISPOSED
(P/P/D)DISPOSED
(TONS)165,829 10 3 7.49 0.26 7,979.64 3.26 98,620
TABLE 8.9: Aiken County MSW Recycling Data in TonsCOMMODITY RESIDENTIAL COMMERCIAL/
INSTITUTIONALINDUSTRIAL
(OFFICE/PACKAGING) TOTAL
GLASSContainers & Packaging - Brown 0.00 0.09 0.00 0.09Containers & Packaging - Clear 0.00 0.07 0.00 0.07Containers & Packaging - Green 0.00 0.04 0.00 0.04Containers & Packaging - Mixed 0.00 0.04 0.00 0.04TOTAL GLASS 0.00 0.24 0.00 0.24
METALAluminum Cans 0.00 0.25 0.00 0.25Ferrous, Magnetic 0.00 0.11 0.00 0.11Non-ferrous, Non-magnetic 0.00 0.00 0.00 0.00Steel Cans 0.00 0.15 0.00 0.15Mixed Scrap Metal 0.00 58.27 6.93 65.2TOTAL METAL 0.00 58.78 6.93 65.71
PAPERCardboard 0.00 2,480.39 20.86 2,501.25Magazines 0.00 0.02 0.00 0.02Newspaper & Inserts 0.00 0.02 0.00 0.02Office Paper 0.00 4.07 0.00 4.07Paperboard 0.00 0.00 0.00 0.00Phone Books 0.00 0.00 0.00 0.00Mixed Paper 0.00 6.42 0.00 6.42TOTAL PAPER 0.00 2,490.92 20.86 2,511.78
PLASTICHDPE 0.00 0.36 0.00 0.36LDPE 0.00 43.36 0.00 43.36PET 0.00 0.18 0.00 0.18PP 0.00 0.00 0.00 0.00PS 0.00 0.00 0.00 0.00Vinyl 0.00 0.00 0.00 0.00Commingled PET & HDPE 0.00 0.00 0.00 0.00Mixed Plastic 0.00 6.1 45.72 51.82TOTAL PLASTIC 0.00 50.00 45.72 95.72
ORGANICS Food Waste 0.00 0.01 0.00 0.01 Yard Trimmings (for use as boiler fuel) 0.00 0.00 0.00 0.00 Yard Trimmings (recycled into compost) 0.00 0.00 0.00 0.00 Yard Trimmings (recycled into mulch) 0.00 0.01 0.00 0.01 TOTAL ORGANICS 0.00 0.02 0.00 0.02
BANNED ITEMSAppliances 0.00 0.12 0.00 0.12Electronics 0.00 0.19 1.75 1.94Lead-acid Batteries (automobiles, trucks, motorcycles – small sealed lead-acid batteries)
138.64 187.26 0.37 326.28
Tires (automobiles, trucks, motorcycles) 1072.2 100.17 0.00 1172.37Used Motor Oil (automobiles, trucks, motorcycles) 129.45 0.00 0.00 129.45
TOTAL BANNED ITEMS 1340.29 287.74 2.12 1630.16MISCELLANEOUS ITEMS
Antifreeze 0.00 1.19 0.00 1.19 Carpet 0.00 0.00 0.00 0.00 Carpet Padding 0.00 0.00 0.00 0.00 Cooking Oil/Grease 0.00 9.39 0.00 9.39 Fluorescent Bulbs 0.00 0.15 0.46 0.61 Household Hazardous Materials 0.00 0.00 0.00 0.00 Inkjet/Toner Cartridges 0.00 0.21 0.00 0.21 Mattresses & Box Springs 0.00 0.01 0.00 0.01 Paint 0.00 0.00 0.00 0.00 Rechargeable Batteries 0.00 0.93 0.21 1.14 Textiles (recycled – not donated for reuse) 0.00 0.01 0.00 0.01 Used Oil Filters 0.00 0.17 0.00 0.17 Wood Packaging (pallets, crates, barrels) 0.00 286.07 74.7 360.77 Items Not Listed Above 0.00 0.11 153.67 153.78 TOTAL MISCELLANEOUS 0.00 298.24 229.05 527.28
COMMINGLED RECYCLABLESTOTAL COMMINGLED RECYCLABLES 2,077.12 1,071.61 0.00 3,148.73TOTAL FOR ALL 3,417.41 4,257.54 304.71 7,979.64

42 South Carolina Solid Waste Management Annual Report for Fiscal Year 2016
ALLENDALE COUNTYTABLE 8.10: Allendale County MSW SummaryPOPULATION DROP-OFF
CENTERSCURBSIDE
PROGRAMSRECYCLING RATE
(PERCENT)RECYCLED
(P/P/D)RECYCLED
(TONS)DISPOSED
(P/P/D)DISPOSED
(TONS)9,433 5 0 4.45 0.11 187.19 2.33 4,020
TABLE 8.11: Allendale MSW Recycling Data in TonsCOMMODITY RESIDENTIAL COMMERCIAL/
INSTITUTIONALINDUSTRIAL
(OFFICE/PACKAGING) TOTAL
GLASSContainers & Packaging - Brown 0.00 0.00 0.00 0.00Containers & Packaging - Clear 0.00 0.00 0.00 0.00Containers & Packaging - Green 0.00 0.00 0.00 0.00Containers & Packaging - Mixed 0.00 0.01 0.00 0.01TOTAL GLASS 0.00 0.01 0.00 0.01
METALAluminum Cans 0.00 0.01 0.00 0.01Ferrous, Magnetic 0.00 3.95 0.00 3.95Non-ferrous, Non-magnetic 0.00 0.00 0.00 0.00Steel Cans 0.00 0.16 0.00 0.16Mixed Scrap Metal 7.79 0.69 0.00 8.48TOTAL METAL 7.79 4.81 0.00 12.6
PAPERCardboard 0.00 45.28 0.00 45.28Magazines 0.00 0.00 0.00 0.00Newspaper & Inserts 0.00 0.00 0.00 0.00Office Paper 0.00 7.71 0.00 7.71Paperboard 0.00 0.00 0.00 0.00Phone Books 0.00 0.01 0.00 0.01Mixed Paper 0.00 0.06 0.00 0.06TOTAL PAPER 0.00 53.06 0.00 53.06
PLASTICHDPE 0.00 0.01 0.00 0.01LDPE 0.00 0.00 0.00 0.00PET 0.00 0.00 0.00 0.00PP 0.00 0.00 0.00 0.00PS 0.00 0.00 0.00 0.00Vinyl 0.00 0.00 0.00 0.00Commingled PET & HDPE 0.00 0.00 0.00 0.00Mixed Plastic 1.00 0.09 0.00 1.09TOTAL PLASTIC 1.00 0.10 0.00 1.10
ORGANICS Food Waste 0.00 0.01 0.00 0.01 Yard Trimmings (for use as boiler fuel) 0.00 0.00 0.00 0.00 Yard Trimmings (recycled into compost) 0.00 0.00 0.00 0.00 Yard Trimmings (recycled into mulch) 0.00 0.00 0.00 0.00 TOTAL ORGANICS 0.00 0.01 0.00 0.01
BANNED ITEMSAppliances 0.00 0.63 0.00 0.63Electronics 29.72 0.22 0.00 29.94Lead-acid Batteries (automobiles, trucks, motorcycles – small sealed lead-acid batteries)
8.16 8.38 0.00 16.54
Tires (automobiles, trucks, motorcycles) 63.00 0.39 0.00 63.39Used Motor Oil (automobiles, trucks, motorcycles) 5.40 0.00 0.00 5.40
TOTAL BANNED ITEMS 106.28 9.62 0.00 115.90MISCELLANEOUS ITEMS
Antifreeze 0.00 0.15 0.00 0.15 Carpet 0.00 0.00 0.00 0.00 Carpet Padding 0.00 0.00 0.00 0.00 Cooking Oil/Grease 0.00 0.03 0.00 0.03 Fluorescent Bulbs 0.00 0.03 0.00 0.03 Household Hazardous Materials 0.00 0.00 0.00 0.00 Inkjet/Toner Cartridges 0.00 0.13 0.00 0.13 Mattresses & Box Springs 0.00 0.00 0.00 0.00 Paint 0.00 0.00 0.00 0.00 Rechargeable Batteries 0.00 0.02 0.00 0.02 Textiles (recycled – not donated for reuse) 0.00 0.01 0.00 0.01 Used Oil Filters 1.01 0.07 0.00 1.08 Wood Packaging (pallets, crates, barrels) 0.00 0.05 0.00 0.05 Items Not Listed Above 0.00 0.10 0.00 0.10 TOTAL MISCELLANEOUS 1.01 0.59 0.00 1.60
COMMINGLED RECYCLABLESTOTAL COMMINGLED RECYCLABLES 0.00 2.91 0.00 2.91TOTAL FOR ALL 116.08 71.11 0.00 187.19

South Carolina Solid Waste Management Annual Report for Fiscal Year 2016 43
ANDERSON COUNTYTABLE 8.12: Anderson County MSW SummaryPOPULATION DROP-OFF
CENTERSCURBSIDE
PROGRAMSRECYCLING RATE
(PERCENT)RECYCLED
(P/P/D)RECYCLED
(TONS)DISPOSED
(P/P/D)DISPOSED
(TONS)194,692 17 2 42.09 2.45 86,887.91 3.36 119,530
TABLE 8.13: Anderson MSW Recycling Data in TonsCOMMODITY RESIDENTIAL COMMERCIAL/
INSTITUTIONALINDUSTRIAL
(OFFICE/PACKAGING) TOTAL
GLASSContainers & Packaging - Brown 148.85 0.09 0.00 148.94Containers & Packaging - Clear 133.27 0.38 0.00 133.65Containers & Packaging - Green 168.75 0.04 0.00 168.79Containers & Packaging - Mixed 0.00 0.04 31.45 31.49TOTAL GLASS 450.87 0.55 31.45 482.87
METALAluminum Cans 31.93 123.22 3.22 158.37Ferrous, Magnetic 0.00 19,760.32 7,605.41 27,365.73Non-ferrous, Non-magnetic 0.00 70.00 7,688.47 7,758.47Steel Cans 0.00 4.20 0.00 4.20Mixed Scrap Metal 1,377.48 684.02 128.36 2,189.86TOTAL METAL 1,409.41 20,641.76 15,425.46 37,476.63
PAPERCardboard 1,190.61 6,199.87 1,441.95 8,832.43Magazines 0.00 1.62 0.01 1.63Newspaper & Inserts 0.00 0.60 0.00 0.60Office Paper 0.00 23.56 65.93 89.49Paperboard 0.00 8.00 0.00 8.00Phone Books 0.00 0.08 0.01 0.09Mixed Paper 1318.89 1,275.78 122 2,716.64TOTAL PAPER 2,509.50 7,509.51 1,629.90 11,648.91
PLASTICHDPE 0.00 72.8 43.32 116.12LDPE 0.00 54.55 88.45 143.00PET 0.00 17.41 4.09 21.50PP 0.00 0.00 0.00 0.00PS 0.00 0.00 0.00 0.00Vinyl 0.00 0.00 0.00 0.00Commingled PET & HDPE 0.00 0.00 0.00 0.00Mixed Plastic 0.00 34.36 2,649.91 2,684.28TOTAL PLASTIC 0.00 179.12 2,785.77 2,964.90
ORGANICS Food Waste 0.00 30.01 0.00 30.01 Yard Trimmings (for use as boiler fuel) 0.00 0.00 0.00 0.00 Yard Trimmings (recycled into compost) 0.00 0.00 0.00 0.00 Yard Trimmings (recycled into mulch) 0.00 0.01 0.00 0.01 TOTAL ORGANICS 0.00 30.02 0.00 30.02
BANNED ITEMSAppliances 0.00 2,215.66 0.00 2,215.66Electronics 359.61 369.60 3.00 732.21Lead-acid Batteries (automobiles, trucks, motorcycles – small sealed lead-acid batteries)
163.10 723.92 4.00 891.02
Tires (automobiles, trucks, motorcycles) 1,893.63 183.15 0.00 2,076.78Used Motor Oil (automobiles, trucks, motorcycles) 95.59 0.00 0.00 95.59
TOTAL BANNED ITEMS 2,511.93 3,492.33 7.00 6,011.26MISCELLANEOUS ITEMS
Antifreeze 0.00 0.50 0.00 0.50 Carpet 0.00 0.00 0.00 0.00 Carpet Padding 0.00 0.00 0.00 0.00 Cooking Oil/Grease 91.15 11.65 0.00 102.80 Fluorescent Bulbs 0.00 0.10 3.89 3.99 Household Hazardous Materials 0.00 0.00 0.00 0.00 Inkjet/Toner Cartridges 0.00 3.48 0.20 3.68 Mattresses & Box Springs 0.00 0.01 0.00 0.01 Paint 0.00 0.00 1.25 1.25 Rechargeable Batteries 0.00 0.38 0.00 0.38 Textiles (recycled – not donated for reuse) 0.00 0.01 388.74 388.75 Used Oil Filters 0.00 1.38 1.50 2.88 Wood Packaging (pallets, crates, barrels) 0.00 348.41 2,351.16 2,699.57 Items Not Listed Above 0.00 0.91 680.17 681.08 TOTAL MISCELLANEOUS 91.15 366.83 3,426.91 3,884.89
COMMINGLED RECYCLABLESTOTAL COMMINGLED RECYCLABLES 1,058.15 23,330.28 0.00 24,388.43TOTAL FOR ALL 8,031.01 55,550.40 23,306.49 86,887.90

44 South Carolina Solid Waste Management Annual Report for Fiscal Year 2016
BAMBERG COUNTYTABLE 8.14: Bamberg County MSW SummaryPOPULATION DROP-OFF
CENTERSCURBSIDE
PROGRAMSRECYCLING RATE
(PERCENT)RECYCLED
(P/P/D)RECYCLED
(TONS)DISPOSED
(P/P/D)DISPOSED
(TONS)14,880 8 0 4.79 0.18 482.94 3.53 9,597
TABLE 8.15: Bamberg County MSW Recycling Data in TonsCOMMODITY RESIDENTIAL COMMERCIAL/
INSTITUTIONALINDUSTRIAL
(OFFICE/PACKAGING) TOTAL
GLASSContainers & Packaging - Brown 0.00 0.09 0.00 0.09Containers & Packaging - Clear 0.00 0.07 0.00 0.07Containers & Packaging - Green 0.00 0.04 0.00 0.04Containers & Packaging - Mixed 0.00 0.03 0.00 0.03TOTAL GLASS 0.00 0.23 0.00 0.23
METALAluminum Cans 0.00 0.17 0.00 0.17Ferrous, Magnetic 0.00 0.11 0.00 0.11Non-ferrous, Non-magnetic 0.00 0.00 0.00 0.00Steel Cans 0.00 0.15 0.00 0.15Mixed Scrap Metal 10.11 0.69 0.00 10.8TOTAL METAL 10.11 1.12 0.00 11.23
PAPERCardboard 92.07 43.16 0.00 135.23Magazines 0.00 0.02 0.00 0.02Newspaper & Inserts 0.00 0.02 0.00 0.02Office Paper 0.00 0.78 0.00 0.78Paperboard 0.00 0.00 0.00 0.00Phone Books 0.00 0.00 0.00 0.00Mixed Paper 0.00 0.06 0.00 0.06TOTAL PAPER 92.07 44.04 0.00 136.11
PLASTICHDPE 0.00 0.04 0.00 0.04LDPE 0.00 0.00 0.00 0.00PET 0.00 0.04 0.00 0.04PP 0.00 0.00 0.00 0.00PS 0.00 0.00 0.00 0.00Vinyl 0.00 0.00 0.00 0.00Commingled PET & HDPE 0.00 0.00 0.00 0.00Mixed Plastic 1.9 0.42 0.00 2.32TOTAL PLASTIC 1.90 0.50 0.00 2.40
ORGANICS Food Waste 0.00 0.01 0.00 0.01 Yard Trimmings (for use as boiler fuel) 0.00 0.00 0.00 0.00 Yard Trimmings (recycled into compost) 0.00 0.00 0.00 0.00 Yard Trimmings (recycled into mulch) 0.00 0.01 0.00 0.01 TOTAL ORGANICS 0.00 0.02 0.00 0.02
BANNED ITEMSAppliances 0.00 0.12 0.00 0.12Electronics 0.00 0.18 0.00 0.18Lead-acid Batteries (automobiles, trucks, motorcycles – small sealed lead-acid batteries)
12.24 12.26 0.00 24.50
Tires (automobiles, trucks, motorcycles) 282.08 0.00 0.00 282.08Used Motor Oil (automobiles, trucks, motorcycles) 21.26 0.00 0.00 21.26
TOTAL BANNED ITEMS 315.58 12.57 0.00 328.15MISCELLANEOUS ITEMS
Antifreeze 0.00 0.00 0.00 0.00 Carpet 0.00 0.00 0.00 0.00 Carpet Padding 0.00 0.00 0.00 0.00 Cooking Oil/Grease 0.00 0.00 0.00 0.00 Fluorescent Bulbs 0.00 0.01 0.00 0.01 Household Hazardous Materials 0.00 0.00 0.00 0.00 Inkjet/Toner Cartridges 0.00 0.02 0.00 0.02 Mattresses & Box Springs 0.00 0.01 0.00 0.01 Paint 0.00 0.00 0.00 0.00 Rechargeable Batteries 0.00 0.01 0.00 0.01 Textiles (recycled – not donated for reuse) 0.00 0.01 0.00 0.01 Used Oil Filters 0.00 0.00 0.00 0.00 Wood Packaging (pallets, crates, barrels) 0.00 0.01 0.00 0.01 Items Not Listed Above 0.00 0.06 0.00 0.06 TOTAL MISCELLANEOUS 0.00 0.13 0.00 0.13
COMMINGLED RECYCLABLESTOTAL COMMINGLED RECYCLABLES 0.00 4.68 0.00 4.68TOTAL FOR ALL 419.66 63.28 0.00 482.94

South Carolina Solid Waste Management Annual Report for Fiscal Year 2016 45
BARNWELL COUNTYTABLE 8.16: Barnwell County MSW SummaryPOPULATION DROP-OFF
CENTERSCURBSIDE
PROGRAMSRECYCLING RATE
(PERCENT)RECYCLED
(P/P/D)RECYCLED
(TONS)DISPOSED
(P/P/D)DISPOSED
(TONS)21,725 9 0 6.94 0.27 1,056.79 3.58 14,178
TABLE 8.17: Barnwell County MSW Recycling Data in TonsCOMMODITY RESIDENTIAL COMMERCIAL/
INSTITUTIONALINDUSTRIAL
(OFFICE/PACKAGING) TOTAL
GLASSContainers & Packaging - Brown 0.00 0.00 0.00 0.00Containers & Packaging - Clear 0.00 0.00 0.00 0.00Containers & Packaging - Green 0.00 0.00 0.00 0.00Containers & Packaging - Mixed 0.00 0.01 0.00 0.01TOTAL GLASS 0.00 0.01 0.00 0.01
METALAluminum Cans 2.73 0.01 0.00 2.74Ferrous, Magnetic 0.00 0.00 0.00 0.00Non-ferrous, Non-magnetic 0.00 0.00 0.00 0.00Steel Cans 0.00 0.15 0.00 0.15Mixed Scrap Metal 101.79 0.76 0.00 102.55TOTAL METAL 104.52 0.92 0.00 105.44
PAPERCardboard 183.91 298.96 4.45 487.32Magazines 0.00 0.00 0.00 0.00Newspaper & Inserts 0.00 0.00 0.00 0.00Office Paper 0.00 1.34 0.00 1.34Paperboard 0.00 0.00 0.00 0.00Phone Books 0.00 0.00 0.00 0.00Mixed Paper 35.47 0.27 0.00 35.72TOTAL PAPER 219.38 300.57 4.45 524.40
PLASTICHDPE 0.00 0.07 0.00 0.07LDPE 0.00 4.85 0.00 4.85PET 0.00 0.01 0.00 0.01PP 0.00 0.00 0.00 0.00PS 0.00 0.00 0.00 0.00Vinyl 0.00 0.00 0.00 0.00Commingled PET & HDPE 20.73 0.00 0.00 20.73Mixed Plastic 0.00 0.05 0.00 0.05TOTAL PLASTIC 20.73 4.98 0.00 25.71
ORGANICS Food Waste 0.00 0.01 0.00 0.01 Yard Trimmings (for use as boiler fuel) 0.00 0.00 0.00 0.00 Yard Trimmings (recycled into compost) 0.00 0.00 0.00 0.00 Yard Trimmings (recycled into mulch) 0.00 0.00 0.00 0.00 TOTAL ORGANICS 0.00 0.01 0.00 0.01
BANNED ITEMSAppliances 0.00 0.09 0.00 0.09Electronics 42.93 0.22 0.00 43.15Lead-acid Batteries (automobiles, trucks, motorcycles – small sealed lead-acid batteries)
36.7 32.94 1.32 70.96
Tires (automobiles, trucks, motorcycles) 250.62 0.09 0.00 250.71Used Motor Oil (automobiles, trucks, motorcycles) 31.4 0.00 0.00 31.4
TOTAL BANNED ITEMS 361.65 33.34 1.32 396.31MISCELLANEOUS ITEMS
Antifreeze 0.00 0.15 0.00 0.15 Carpet 0.00 0.00 0.00 0.00 Carpet Padding 0.00 0.00 0.00 0.00 Cooking Oil/Grease 0.00 2.66 0.00 2.66 Fluorescent Bulbs 0.00 0.03 0.01 0.04 Household Hazardous Materials 0.00 0.00 0.00 0.00 Inkjet/Toner Cartridges 0.00 0.11 0.00 0.11 Mattresses & Box Springs 0.00 0.00 0.00 0.00 Paint 0.00 0.00 0.00 0.00 Rechargeable Batteries 0.00 0.02 0.00 0.02 Textiles (recycled – not donated for reuse) 0.00 0.01 0.00 0.01 Used Oil Filters 0.00 0.07 0.00 0.07 Wood Packaging (pallets, crates, barrels) 0.00 0.05 0.00 0.05 Items Not Listed Above 0.00 0.1 1.43 1.53 TOTAL MISCELLANEOUS 0.00 3.20 1.43 4.63
COMMINGLED RECYCLABLESTOTAL COMMINGLED RECYCLABLES 0.00 0.27 0.00 0.27TOTAL FOR ALL 706.28 343.30 7.20 1,056.78

46 South Carolina Solid Waste Management Annual Report for Fiscal Year 2016
BEAUFORT COUNTYTABLE 8.18: Beaufort County MSW SummaryPOPULATION DROP-OFF
CENTERSCURBSIDE
PROGRAMSRECYCLING RATE
(PERCENT)RECYCLED
(P/P/D)RECYCLED
(TONS)DISPOSED
(P/P/D)DISPOSED
(TONS)179,589 12 3 18.88 0.97 31,885.94 4.18 137,013
TABLE 8.19: Beaufort County MSW Recycling Data in TonsCOMMODITY RESIDENTIAL COMMERCIAL/
INSTITUTIONALINDUSTRIAL
(OFFICE/PACKAGING) TOTAL
GLASSContainers & Packaging - Brown 0.00 0.34 0.00 0.34Containers & Packaging - Clear 0.00 0.32 0.00 0.32Containers & Packaging - Green 0.00 0.04 0.00 0.04Containers & Packaging - Mixed 844.75 57.67 0.00 902.42TOTAL GLASS 844.75 58.37 0.00 903.12
METALAluminum Cans 0.00 43.76 0.00 43.76Ferrous, Magnetic 0.00 2,805.58 35.00 2,840.58Non-ferrous, Non-magnetic 0.00 170.00 0.00 170.00Steel Cans 0.00 0.21 0.00 0.21Mixed Scrap Metal 101.61 394.14 236.00 731.75TOTAL METAL 101.61 3,413.69 271.00 3,786.30
PAPERCardboard 835.59 3,109.13 0.00 3,944.72Magazines 0.00 0.17 0.00 0.17Newspaper & Inserts 647.30 0.14 0.00 647.44Office Paper 90.23 1,463.98 0.00 1,554.21Paperboard 36.86 0.10 0.00 36.96Phone Books 0.00 0.08 0.00 0.08Mixed Paper 1,600.29 87.88 0.00 1,688.17TOTAL PAPER 3,210.27 4,661.48 0.00 7,871.75
PLASTICHDPE 0.00 0.73 0.00 0.73LDPE 0.00 14.99 0.00 14.99PET 0.00 0.41 0.00 0.41PP 0.00 0.00 0.00 0.00PS 0.00 0.00 0.00 0.00Vinyl 0.00 0.00 0.00 0.00Commingled PET & HDPE 439.34 0.00 0.00 439.34Mixed Plastic 0.00 2,021.27 0.00 2,021.27TOTAL PLASTIC 439.34 2,037.40 0.00 2,476.74
ORGANICS Food Waste 0.00 42.60 0.00 42.60 Yard Trimmings (for use as boiler fuel) 5,281.50 0.00 0.00 5,281.50 Yard Trimmings (recycled into compost) 0.00 1,799.00 0.00 1,799.00 Yard Trimmings (recycled into mulch) 0.00 0.13 0.00 0.13 TOTAL ORGANICS 5,281.50 1,841.73 0.00 7,123.23
BANNED ITEMSAppliances 1,492.59 0.66 0.00 1,493.25Electronics 229.49 12.28 0.00 241.77Lead-acid Batteries (automobiles, trucks, motorcycles – small sealed lead-acid batteries)
165.49 173.84 0.00 339.33
Tires (automobiles, trucks, motorcycles) 1,724.27 386.57 0.00 2,110.84Used Motor Oil (automobiles, trucks, motorcycles) 106.52 0.00 0.00 106.52
TOTAL BANNED ITEMS 3,718.36 573.35 0.00 4,291.71MISCELLANEOUS ITEMS
Antifreeze 1.54 6.52 0.00 8.06 Carpet 0.00 0.00 0.00 0.00 Carpet Padding 0.00 0.00 0.00 0.00 Cooking Oil/Grease 3.77 42.42 0.00 46.19 Fluorescent Bulbs 0.18 2.46 0.00 2.64 Household Hazardous Materials 0.00 0.00 0.00 0.00 Inkjet/Toner Cartridges 0.00 2.04 0.00 2.04 Mattresses & Box Springs 0.00 0.01 0.00 0.01 Paint 327.22 0.00 0.00 327.22 Rechargeable Batteries 1.20 3.89 0.00 5.09 Textiles (recycled – not donated for reuse) 0.00 0.01 0.00 0.01 Used Oil Filters 5.91 7.45 0.00 13.36 Wood Packaging (pallets, crates, barrels) 0.00 389.26 0.00 389.26 Items Not Listed Above 26.00 212.20 0.00 238.20 TOTAL MISCELLANEOUS 365.82 666.26 0.00 1,032.08
COMMINGLED RECYCLABLESTOTAL COMMINGLED RECYCLABLES 3,899.20 501.81 0.00 4,401.01TOTAL FOR ALL 17,860.85 13,754.08 271.00 31,855.93

South Carolina Solid Waste Management Annual Report for Fiscal Year 2016 47
BERKELEY COUNTYTABLE 8.20: Berkeley County MSW SummaryPOPULATION DROP-OFF
CENTERSCURBSIDE
PROGRAMSRECYCLING RATE
(PERCENT)RECYCLED
(P/P/D)RECYCLED
(TONS)DISPOSED
(P/P/D)DISPOSED
(TONS)202,786 22 6 13.20 0.39 14,313.42 2.54 94,125
TABLE 8.21: Berkeley County MSW Recycling Data in TonsCOMMODITY RESIDENTIAL COMMERCIAL/
INSTITUTIONALINDUSTRIAL
(OFFICE/PACKAGING) TOTAL
GLASSContainers & Packaging - Brown 0.00 0.00 0.39 0.39Containers & Packaging - Clear 0.00 0.00 0.00 0.00Containers & Packaging - Green 0.00 0.00 0.00 0.00Containers & Packaging - Mixed 0.00 0.01 0.00 0.01TOTAL GLASS 0.00 0.01 0.39 0.40
METALAluminum Cans 0.00 41.34 70.04 111.38Ferrous, Magnetic 0.00 11.51 205.80 217.31Non-ferrous, Non-magnetic 0.00 0.00 610.50 610.50Steel Cans 0.00 35.75 15.00 50.75Mixed Scrap Metal 957.89 80.17 83.33 1,121.39TOTAL METAL 957.89 168.77 984.67 2,111.33
PAPERCardboard 417.19 3,005.81 569.89 3,992.89Magazines 0.00 0.23 4.28 4.51Newspaper & Inserts 0.00 0.15 0.20 0.35Office Paper 0.00 7.29 31.81 39.10Paperboard 0.00 0.00 0.08 0.08Phone Books 0.00 0.10 0.00 0.10Mixed Paper 0.00 18.54 1.00 19.54TOTAL PAPER 417.19 3,032.09 607.26 4,056.54
PLASTICHDPE 0.00 1.15 83.39 84.54LDPE 0.00 105.18 0.00 105.18PET 0.00 0.75 0.08 0.83PP 0.00 0.00 0.00 0.00PS 0.00 0.00 0.00 0.00Vinyl 0.00 0.00 1.00 1.00Commingled PET & HDPE 0.00 0.00 0.00 0.00Mixed Plastic 0.00 11.42 23.30 34.72TOTAL PLASTIC 0.00 118.50 107.77 226.27
ORGANICS Food Waste 0.00 0.01 5.16 5.17 Yard Trimmings (for use as boiler fuel) 0.00 0.00 0.00 0.00 Yard Trimmings (recycled into compost) 15.74 10.70 0.00 26.44 Yard Trimmings (recycled into mulch) 44.17 0.12 0.00 44.29 TOTAL ORGANICS 59.91 10.83 5.16 75.90
BANNED ITEMSAppliances 0.00 162.89 8.00 170.89Electronics 386.45 0.80 15.04 402.29Lead-acid Batteries (automobiles, trucks, motorcycles – small sealed lead-acid batteries)
177.62 218.91 2.33 398.86
Tires (automobiles, trucks, motorcycles) 1,756.87 201.47 1.00 1,959.34Used Motor Oil (automobiles, trucks, motorcycles) 111.95 0.00 0.00 111.95
TOTAL BANNED ITEMS 2,432.89 584.07 26.37 3,043.33MISCELLANEOUS ITEMS
Antifreeze 3.28 4.61 9.21 17.10 Carpet 0.00 7.50 0.00 7.50 Carpet Padding 47.15 70.36 0.00 117.51 Cooking Oil/Grease 0.00 18.02 0.00 18.02 Fluorescent Bulbs 0.00 0.20 2.65 2.84 Household Hazardous Materials 0.00 0.00 0.00 0.00 Inkjet/Toner Cartridges 0.54 1.41 1.11 3.06 Mattresses & Box Springs 0.00 0.00 0.00 0.00 Paint 0.00 0.00 0.05 0.05 Rechargeable Batteries 0.34 2.14 0.00 2.48 Textiles (recycled – not donated for reuse) 0.00 8.06 3.00 11.06 Used Oil Filters 5.52 37.23 4.80 47.55 Wood Packaging (pallets, crates, barrels) 0.00 769.90 429.33 1,199.23 Items Not Listed Above 0.00 107.06 30.92 137.98 TOTAL MISCELLANEOUS 56.83 1,026.48 481.07 1,564.37
COMMINGLED RECYCLABLESTOTAL COMMINGLED RECYCLABLES 2,689.46 470.02 75.76 3,235.24TOTAL FOR ALL 6,614.17 5,410.75 2,288.45 14,313.37

48 South Carolina Solid Waste Management Annual Report for Fiscal Year 2016
CALHOUN COUNTYTABLE 8.22: Calhoun County MSW SummaryPOPULATION DROP-OFF
CENTERSCURBSIDE
PROGRAMSRECYCLING RATE
(PERCENT)RECYCLED
(P/P/D)RECYCLED
(TONS)DISPOSED
(P/P/D)DISPOSED
(TONS)14,781 10 0 17.36 0.77 2,076.99 3.66 9,886
TABLE 8.23: Calhoun County MSW Recycling Data in TonsCOMMODITY RESIDENTIAL COMMERCIAL/
INSTITUTIONALINDUSTRIAL
(OFFICE/PACKAGING) TOTAL
GLASSContainers & Packaging - Brown 0.00 0.00 0.00 0.00Containers & Packaging - Clear 0.00 0.00 0.00 0.00Containers & Packaging - Green 0.00 0.00 0.00 0.00Containers & Packaging - Mixed 0.00 0.00 0.00 0.00TOTAL GLASS 0.00 0.00 0.00 0.00
METALAluminum Cans 1.00 0.00 0.30 1.30Ferrous, Magnetic 0.00 0.00 0.00 0.00Non-ferrous, Non-magnetic 0.00 0.00 0.00 0.00Steel Cans 0.00 0.15 0.00 0.15Mixed Scrap Metal 134.38 3.01 44.00 181.39TOTAL METAL 135.38 3.16 44.30 182.84
PAPERCardboard 63.06 45.13 157.38 265.57Magazines 0.00 1.00 0.00 1.00Newspaper & Inserts 0.00 1.00 0.00 1.00Office Paper 0.00 0.69 8.52 9.21Paperboard 0.00 0.00 0.00 0.00Phone Books 0.00 0.00 0.00 0.00Mixed Paper 0.00 1.03 0.00 1.03TOTAL PAPER 63.06 48.85 165.9 277.81
PLASTICHDPE 1.07 0.01 22.00 23.08LDPE 0.00 0.00 23.00 23.00PET 0.00 0.00 10.00 10.00PP 0.00 0.00 0.00 0.00PS 0.00 0.00 0.00 0.00Vinyl 0.00 0.00 0.00 0.00Commingled PET & HDPE 0.00 0.00 0.00 0.00Mixed Plastic 0.00 1.03 1,153.00 1,154.03TOTAL PLASTIC 1.07 1.04 1,208.00 1,210.11
ORGANICS Food Waste 0.00 0.01 0.00 0.01 Yard Trimmings (for use as boiler fuel) 0.00 0.00 0.00 0.00 Yard Trimmings (recycled into compost) 0.00 0.00 0.00 0.00 Yard Trimmings (recycled into mulch) 0.00 0.00 0.00 0.00 TOTAL ORGANICS 0.00 0.01 0.00 0.01
BANNED ITEMSAppliances 0.00 0.09 0.00 0.09Electronics 20.96 0.18 4.78 25.92Lead-acid Batteries (automobiles, trucks, motorcycles – small sealed lead-acid batteries)
12.91 11.59 0.10 24.60
Tires (automobiles, trucks, motorcycles) 160.90 0.00 1.90 162.80Used Motor Oil (automobiles, trucks, motorcycles) 85.77 0.00 0.00 85.77
TOTAL BANNED ITEMS 280.54 11.86 6.78 299.18MISCELLANEOUS ITEMS
Antifreeze 0.00 0.00 0.00 0.00 Carpet 0.00 0.00 0.00 0.00 Carpet Padding 0.00 0.00 0.00 0.00 Cooking Oil/Grease 0.00 0.00 0.00 0.00 Fluorescent Bulbs 0.00 0.01 2.44 2.45 Household Hazardous Materials 0.00 0.00 0.00 0.00 Inkjet/Toner Cartridges 0.00 0.02 0.05 0.07 Mattresses & Box Springs 0.00 0.00 0.00 0.00 Paint 0.00 0.00 0.00 0.00 Rechargeable Batteries 0.00 0.01 0.10 0.11 Textiles (recycled – not donated for reuse) 0.00 0.01 0.00 0.01 Used Oil Filters 0.00 0.00 0.00 0.00 Wood Packaging (pallets, crates, barrels) 0.00 5.00 26.10 31.10 Items Not Listed Above 0.00 0.04 0.00 0.04 TOTAL MISCELLANEOUS 0.00 5.09 28.69 33.78
COMMINGLED RECYCLABLESTOTAL COMMINGLED RECYCLABLES 0.00 0.00 67.13 67.13TOTAL FOR ALL 480.05 70.01 1,520.80 2,070.86

South Carolina Solid Waste Management Annual Report for Fiscal Year 2016 49
CHARLESTON COUNTYTABLE 8.24: Charleston County MSW SummaryPOPULATION DROP-OFF
CENTERSCURBSIDE
PROGRAMSRECYCLING RATE
(PERCENT)RECYCLED
(P/P/D)RECYCLED
(TONS)DISPOSED
(P/P/D)DISPOSED
(TONS)389,262 38 2 30.63 1.95 138,344.96 4.41 313,382
TABLE 8.25: Charleston County MSW Recycling Data in TonsCOMMODITY RESIDENTIAL COMMERCIAL/
INSTITUTIONALINDUSTRIAL
(OFFICE/PACKAGING) TOTAL
GLASSContainers & Packaging - Brown 0.00 0.09 0.00 0.09Containers & Packaging - Clear 0.00 0.07 0.00 0.07Containers & Packaging - Green 0.00 0.04 0.00 0.04Containers & Packaging - Mixed 0.00 0.04 11.84 11.88TOTAL GLASS 0.00 0.24 11.84 12.08
METALAluminum Cans 0.00 4.05 35.52 39.57Ferrous, Magnetic 0.00 1.57 32.03 33.60Non-ferrous, Non-magnetic 0.00 0.00 0.00 0.00Steel Cans 0.00 0.15 0.00 0.15Mixed Scrap Metal 396.00 287.06 594.40 1,277.46TOTAL METAL 396.00 292.83 661.94 1,350.77
PAPERCardboard 0.00 10,181.38 1,427.06 11,608.44Magazines 0.00 2.17 0.00 2.17Newspaper & Inserts 0.00 0.14 0.00 0.14Office Paper 0.00 494.42 372.97 867.39Paperboard 0.00 0.00 11.84 11.84Phone Books 0.00 1.08 0.00 1.08Mixed Paper 0.00 109.03 24.00 133.03TOTAL PAPER 0.00 10,788.22 1,835.87 12,624.09
PLASTICHDPE 0.00 2.45 2.86 5.31LDPE 0.00 173.24 5.00 178.24PET 0.00 1.53 0.00 1.53PP 0.00 0.00 0.00 0.00PS 0.00 0.00 0.00 0.00Vinyl 0.00 0.00 0.00 0.00Commingled PET & HDPE 0.00 0.00 0.00 0.00Mixed Plastic 0.00 111.29 332.81 444.10TOTAL PLASTIC 0.00 288.51 340.67 629.18
ORGANICS Food Waste 4,413.00 586.96 200.68 5,200.64 Yard Trimmings (for use as boiler fuel) 0.00 0.00 0.00 0.00 Yard Trimmings (recycled into compost) 66,486.00 87.57 0.00 66,573.57 Yard Trimmings (recycled into mulch) 0.00 1.38 0.00 1.38 TOTAL ORGANICS 70,899.00 675.91 200.68 71,775.59
BANNED ITEMSAppliances 1,000.00 184.12 0.00 1,184.12Electronics 441.20 90.43 0.00 531.63Lead-acid Batteries (automobiles, trucks, motorcycles – small sealed lead-acid batteries)
334.95 450.65 8.77 794.37
Tires (automobiles, trucks, motorcycles) 4,544.98 246.02 0.00 4,791.00Used Motor Oil (automobiles, trucks, motorcycles) 173.32 0.00 0.00 173.32
TOTAL BANNED ITEMS 6,494.45 971.22 8.77 7,474.44MISCELLANEOUS ITEMS
Antifreeze 4.10 30.10 0.00 34.20 Carpet 0.00 0.75 0.00 0.75 Carpet Padding 0.00 0.02 0.00 0.02 Cooking Oil/Grease 0.00 64.86 0.00 64.86 Fluorescent Bulbs 7.40 5.87 1.81 15.08 Household Hazardous Materials 0.00 0.00 0.00 0.00 Inkjet/Toner Cartridges 0.00 1.62 0.10 1.72 Mattresses & Box Springs 0.00 5.79 0.00 5.79 Paint 79.30 0.00 0.00 79.30 Rechargeable Batteries 1.20 2.55 0.01 3.77 Textiles (recycled – not donated for reuse) 0.00 0.01 0.00 0.01 Used Oil Filters 6.60 6.15 20.45 33.20 Wood Packaging (pallets, crates, barrels) 0.00 885.16 1,950.99 2,836.15 Items Not Listed Above 0.00 38.12 6.00 44.12 TOTAL MISCELLANEOUS 98.60 1,041.00 1,979.37 3,118.97
COMMINGLED RECYCLABLESTOTAL COMMINGLED RECYCLABLES 40,228.00 1,101.83 30.00 41,359.83TOTAL FOR ALL 118,116.05 15,159.75 5,069.15 138,344.95

50 South Carolina Solid Waste Management Annual Report for Fiscal Year 2016
CHEROKEE COUNTYTABLE 8.26: Cherokee County MSW SummaryPOPULATION DROP-OFF
CENTERSCURBSIDE
PROGRAMSRECYCLING RATE
(PERCENT)RECYCLED
(P/P/D)RECYCLED
(TONS)DISPOSED
(P/P/D)DISPOSED
(TONS)56,194 18 0 15.06 0.68 7,018.37 3.86 39,597
TABLE 8.27: Cherokee County MSW Recycling Data in TonsCOMMODITY RESIDENTIAL COMMERCIAL/
INSTITUTIONALINDUSTRIAL
(OFFICE/PACKAGING) TOTAL
GLASSContainers & Packaging - Brown 18.80 0.00 0.00 18.80Containers & Packaging - Clear 25.20 0.00 0.00 25.20Containers & Packaging - Green 9.80 0.00 0.00 9.80Containers & Packaging - Mixed 0.00 0.31 0.00 0.31TOTAL GLASS 53.80 0.31 0.00 54.11
METALAluminum Cans 5.05 3.13 2.64 10.82Ferrous, Magnetic 0.00 5.95 14.81 20.76Non-ferrous, Non-magnetic 0.00 0.00 0.02 0.02Steel Cans 16.80 16.97 0.03 33.80Mixed Scrap Metal 216.07 27.62 6.14 249.83TOTAL METAL 237.92 53.67 23.62 315.21
PAPERCardboard 120.00 2,845.90 140.10 3,106.00Magazines 0.00 0.32 0.00 0.32Newspaper & Inserts 0.00 0.40 0.00 0.40Office Paper 0.00 10.86 165.30 176.16Paperboard 0.00 0.00 0.00 0.00Phone Books 0.00 0.07 0.00 0.07Mixed Paper 173.00 213.53 172.75 559.28TOTAL PAPER 293.00 3,071.08 478.15 3,842.23
PLASTICHDPE 0.00 0.62 0.00 0.62LDPE 0.00 17.03 0.00 17.03PET 0.00 0.81 0.00 0.81PP 0.00 0.00 0.00 0.00PS 0.00 0.00 0.00 0.00Vinyl 0.00 0.00 0.00 0.00Commingled PET & HDPE 25.20 0.00 0.00 25.20Mixed Plastic 0.00 0.87 27.40 28.27TOTAL PLASTIC 25.20 19.33 27.40 71.93
ORGANICS Food Waste 0.00 0.02 0.00 0.02 Yard Trimmings (for use as boiler fuel) 0.00 0.00 0.00 0.00 Yard Trimmings (recycled into compost) 0.00 0.00 0.00 0.00 Yard Trimmings (recycled into mulch) 1,112.43 10.83 0.00 1,123.26 TOTAL ORGANICS 1,112.43 10.85 0.00 1,123.28
BANNED ITEMSAppliances 48.40 0.66 0.00 49.06Electronics 27.40 20.31 17.06 64.77Lead-acid Batteries (automobiles, trucks, motorcycles – small sealed lead-acid batteries)
45.72 61.12 0.00 106.85
Tires (automobiles, trucks, motorcycles) 1,043.18 26.45 0.00 1,069.63Used Motor Oil (automobiles, trucks, motorcycles) 22.45 0.00 0.00 22.45
TOTAL BANNED ITEMS 1,187.15 108.54 17.06 1,312.76MISCELLANEOUS ITEMS
Antifreeze 0.00 0.33 0.00 0.33 Carpet 0.00 0.00 0.00 0.00 Carpet Padding 0.00 0.00 0.00 0.00 Cooking Oil/Grease 0.00 2.66 0.00 2.66 Fluorescent Bulbs 0.00 0.35 0.02 0.37 Household Hazardous Materials 0.00 0.00 0.00 0.00 Inkjet/Toner Cartridges 0.00 0.27 0.01 0.28 Mattresses & Box Springs 0.00 0.02 0.00 0.02 Paint 0.00 0.01 0.00 0.01 Rechargeable Batteries 0.00 0.10 0.00 0.10 Textiles (recycled – not donated for reuse) 0.00 0.01 0.00 0.01 Used Oil Filters 2.66 0.44 0.09 3.19 Wood Packaging (pallets, crates, barrels) 2.20 218.50 9.35 230.05 Items Not Listed Above 0.00 0.17 0.28 0.45 TOTAL MISCELLANEOUS 4.86 222.86 9.74 237.46
COMMINGLED RECYCLABLESTOTAL COMMINGLED RECYCLABLES 0.00 61.36 0.00 61.36TOTAL FOR ALL 2,914.36 3,548.00 555.96 7,018.32

South Carolina Solid Waste Management Annual Report for Fiscal Year 2016 51
CHESTER COUNTYTABLE 8.28: Chester County MSW SummaryPOPULATION DROP-OFF
CENTERSCURBSIDE
PROGRAMSRECYCLING RATE
(PERCENT)RECYCLED
(P/P/D)RECYCLED
(TONS)DISPOSED
(P/P/D)DISPOSED
(TONS)32,267 12 1 8.49 0.30 1,786.07 3.27 19,261
TABLE 8.29: Chester County MSW Recycling Data in TonsCOMMODITY RESIDENTIAL COMMERCIAL/
INSTITUTIONALINDUSTRIAL
(OFFICE/PACKAGING) TOTAL
GLASSContainers & Packaging - Brown 0.00 0.09 0.00 0.09Containers & Packaging - Clear 0.00 0.07 0.00 0.07Containers & Packaging - Green 0.00 0.04 0.00 0.04Containers & Packaging - Mixed 38.33 0.04 0.00 38.37TOTAL GLASS 38.33 0.24 0.00 38.57
METALAluminum Cans 6.75 3.26 0.02 10.03Ferrous, Magnetic 0.00 2.11 12.36 14.47Non-ferrous, Non-magnetic 0.00 0.00 0.00 0.00Steel Cans 0.86 0.15 0.00 1.01Mixed Scrap Metal 85.73 17.86 0.00 103.59TOTAL METAL 93.34 23.38 12.38 129.10
PAPERCardboard 459.33 390.29 0.00 849.62Magazines 0.00 0.02 0.00 0.02Newspaper & Inserts 0.00 0.02 0.00 0.02Office Paper 0.00 2.79 0.00 2.79Paperboard 0.00 0.00 0.00 0.00Phone Books 0.00 0.01 0.00 0.01Mixed Paper 93.15 0.14 0.44 93.73TOTAL PAPER 552.48 393.27 0.44 946.19
PLASTICHDPE 0.00 0.15 3.41 3.56LDPE 0.00 7.51 0.00 7.51PET 0.00 0.10 0.00 0.10PP 0.00 0.00 0.00 0.00PS 0.00 0.00 0.00 0.00Vinyl 0.00 0.00 0.00 0.00Commingled PET & HDPE 0.00 0.00 0.00 0.00Mixed Plastic 30.23 0.54 18.56 49.33TOTAL PLASTIC 30.23 8.30 21.97 60.50
ORGANICS Food Waste 0.00 0.01 0.00 0.01 Yard Trimmings (for use as boiler fuel) 0.00 0.00 0.00 0.00 Yard Trimmings (recycled into compost) 0.00 0.00 0.00 0.00 Yard Trimmings (recycled into mulch) 0.00 0.01 0.00 0.01 TOTAL ORGANICS 0.00 0.02 0.00 0.02
BANNED ITEMSAppliances 0.00 0.12 0.00 0.12Electronics 54.80 1.50 0.38 56.68Lead-acid Batteries (automobiles, trucks, motorcycles – small sealed lead-acid batteries)
29.55 34.22 0.02 63.79
Tires (automobiles, trucks, motorcycles) 353.20 1.52 0.00 354.72Used Motor Oil (automobiles, trucks, motorcycles) 40.40 0.00 0.00 40.40
TOTAL BANNED ITEMS 477.95 37.36 0.40 515.71MISCELLANEOUS ITEMS
Antifreeze 0.00 0.72 0.00 0.72 Carpet 0.00 0.00 0.00 0.00 Carpet Padding 0.00 0.00 0.00 0.00 Cooking Oil/Grease 13.80 0.03 0.00 13.83 Fluorescent Bulbs 0.00 0.18 0.01 0.19 Household Hazardous Materials 8.00 0.00 0.00 8.00 Inkjet/Toner Cartridges 0.00 0.11 0.05 0.16 Mattresses & Box Springs 0.00 0.01 0.00 0.01 Paint 7.00 0.00 0.00 7.00 Rechargeable Batteries 0.30 0.02 0.00 0.32 Textiles (recycled – not donated for reuse) 0.00 0.01 0.00 0.01 Used Oil Filters 0.78 0.94 0.00 1.72 Wood Packaging (pallets, crates, barrels) 0.00 0.20 13.08 13.28 Items Not Listed Above 0.00 0.12 0.00 0.12 TOTAL MISCELLANEOUS 29.88 2.34 13.14 45.36
COMMINGLED RECYCLABLESTOTAL COMMINGLED RECYCLABLES 0.00 50.62 0.00 50.62TOTAL FOR ALL 1,222.21 515.53 48.31 1,786.05

52 South Carolina Solid Waste Management Annual Report for Fiscal Year 2016
CHESTERFIELD COUNTYTABLE 8.30: Chesterfield County MSW SummaryPOPULATION DROP-OFF
CENTERSCURBSIDE
PROGRAMSRECYCLING RATE
(PERCENT)RECYCLED
(P/P/D)RECYCLED
(TONS)DISPOSED
(P/P/D)DISPOSED
(TONS)46,017 7 1 27.41 0.96 8,049.21 2.54 21,312
TABLE 8.31: Chesterfield County MSW Recycling Data in TonsCOMMODITY RESIDENTIAL COMMERCIAL/
INSTITUTIONALINDUSTRIAL
(OFFICE/PACKAGING) TOTAL
GLASSContainers & Packaging - Brown 0.00 0.00 0.00 0.00Containers & Packaging - Clear 0.00 0.00 0.00 0.00Containers & Packaging - Green 0.00 0.00 0.00 0.00Containers & Packaging - Mixed 0.00 0.00 0.00 0.00TOTAL GLASS 0.00 0.00 0.00 0.00
METALAluminum Cans 0.00 3.10 0.42 3.52Ferrous, Magnetic 0.00 2.00 42.12 44.12Non-ferrous, Non-magnetic 0.00 0.00 0.00 0.00Steel Cans 0.00 0.15 0.00 0.15Mixed Scrap Metal 185.81 194.18 0.00 379.98TOTAL METAL 185.81 199.43 42.54 427.77
PAPERCardboard 0.00 427.95 807.78 1,235.73Magazines 0.00 0.19 0.00 0.19Newspaper & Inserts 0.00 0.11 0.00 0.11Office Paper 0.00 2.13 0.00 2.13Paperboard 0.00 0.00 0.00 0.00Phone Books 0.00 0.01 0.00 0.01Mixed Paper 0.00 0.18 0.00 0.18TOTAL PAPER 0.00 430.57 807.78 1,238.35
PLASTICHDPE 0.00 0.18 20.44 20.62LDPE 0.00 11.10 84.55 95.65PET 0.00 0.09 0.14 0.23PP 0.00 0.00 0.00 0.00PS 0.00 0.00 0.00 0.00Vinyl 0.00 0.00 0.00 0.00Commingled PET & HDPE 0.00 0.00 0.00 0.00Mixed Plastic 0.00 0.21 1.87 2.08TOTAL PLASTIC 0.00 11.58 106.99 118.57
ORGANICS Food Waste 0.00 0.01 0.00 0.01 Yard Trimmings (for use as boiler fuel) 0.00 0.00 0.00 0.00 Yard Trimmings (recycled into compost) 0.00 0.00 0.00 0.00 Yard Trimmings (recycled into mulch) 0.00 0.00 0.00 0.00 TOTAL ORGANICS 0.00 0.01 0.00 0.01
BANNED ITEMSAppliances 0.00 0.09 0.00 0.09Electronics 82.54 83.62 0.00 166.17Lead-acid Batteries (automobiles, trucks, motorcycles – small sealed lead-acid batteries)
41.58 49.39 0.00 90.97
Tires (automobiles, trucks, motorcycles) 511.06 22.34 0.00 533.4Used Motor Oil (automobiles, trucks, motorcycles) 28.47 0.00 0.00 28.47
TOTAL BANNED ITEMS 663.65 155.44 0.00 819.10MISCELLANEOUS ITEMS
Antifreeze 0.00 0.18 0.00 0.18 Carpet 0.00 0.00 0.00 0.00 Carpet Padding 0.00 0.00 0.00 0.00 Cooking Oil/Grease 23.00 25.45 0.00 48.45 Fluorescent Bulbs 0.00 0.06 2.20 2.26 Household Hazardous Materials 0.00 0.00 0.00 0.00 Inkjet/Toner Cartridges 0.00 0.02 0.00 0.02 Mattresses & Box Springs 0.00 0.00 0.00 0.00 Paint 0.00 0.00 0.00 0.00 Rechargeable Batteries 0.00 0.14 0.00 0.14 Textiles (recycled – not donated for reuse) 0.00 0.01 4,670.15 4,670.16 Used Oil Filters 2.36 2.73 0.00 5.10 Wood Packaging (pallets, crates, barrels) 0.00 0.14 0.00 0.14 Items Not Listed Above 0.00 0.04 142.50 142.54 TOTAL MISCELLANEOUS 25.36 28.77 4,814.85 4,868.99
COMMINGLED RECYCLABLESTOTAL COMMINGLED RECYCLABLES 288.20 288.20 0.00 576.41TOTAL FOR ALL 1,163.03 1,114.00 5,772.17 8,049.23

South Carolina Solid Waste Management Annual Report for Fiscal Year 2016 53
CLARENDON COUNTYTABLE 8.32: Clarendon County MSW SummaryPOPULATION DROP-OFF
CENTERSCURBSIDE
PROGRAMSRECYCLING RATE
(PERCENT)RECYCLED
(P/P/D)RECYCLED
(TONS)DISPOSED
(P/P/D)DISPOSED
(TONS)33,775 12 0 8.16 0.19 1,147.37 2.10 12,914
TABLE 8.33: Clarendon County MSW Recycling Data in TonsCOMMODITY RESIDENTIAL COMMERCIAL/
INSTITUTIONALINDUSTRIAL
(OFFICE/PACKAGING) TOTAL
GLASSContainers & Packaging - Brown 0.00 0.00 0.00 0.00Containers & Packaging - Clear 0.00 0.00 0.00 0.00Containers & Packaging - Green 0.00 0.00 0.00 0.00Containers & Packaging - Mixed 0.00 0.01 0.00 0.01TOTAL GLASS 0.00 0.01 0.00 0.01
METALAluminum Cans 0.00 0.02 0.00 0.02Ferrous, Magnetic 0.00 0.00 0.00 0.00Non-ferrous, Non-magnetic 0.00 0.00 0.00 0.00Steel Cans 0.00 0.15 0.00 0.15Mixed Scrap Metal 0.00 0.74 0.00 0.74TOTAL METAL 0.00 0.91 0.00 0.91
PAPERCardboard 198.20 403.33 0.00 601.33Magazines 0.00 0.00 0.00 0.00Newspaper & Inserts 0.00 0.00 0.00 0.00Office Paper 0.00 1.43 0.00 1.43Paperboard 0.00 0.00 0.00 0.00Phone Books 0.00 0.00 0.00 0.00Mixed Paper 0.00 0.16 0.00 0.16TOTAL PAPER 198.20 404.92 0.00 603.12
PLASTICHDPE 0.00 0.16 0.00 0.16LDPE 0.00 10.19 0.00 10.19PET 0.00 0.08 0.00 0.08PP 0.00 0.00 0.00 0.00PS 0.00 0.00 0.00 0.00Vinyl 0.00 0.00 0.00 0.00Commingled PET & HDPE 0.00 0.00 0.00 0.00Mixed Plastic 0.00 0.17 0.00 0.17TOTAL PLASTIC 0.00 10.60 0.00 10.60
ORGANICS Food Waste 0.00 0.01 0.00 0.01 Yard Trimmings (for use as boiler fuel) 0.00 0.00 0.00 0.00 Yard Trimmings (recycled into compost) 0.00 0.00 0.00 0.00 Yard Trimmings (recycled into mulch) 0.00 0.00 0.00 0.00 TOTAL ORGANICS 0.00 0.01 0.00 0.01
BANNED ITEMSAppliances 0.00 0.09 0.00 0.09Electronics 84.36 0.22 0.00 84.58Lead-acid Batteries (automobiles, trucks, motorcycles – small sealed lead-acid batteries)
28.55 43.18 0.00 71.73
Tires (automobiles, trucks, motorcycles) 332.67 22.75 0.00 355.42Used Motor Oil (automobiles, trucks, motorcycles) 16.80 0.00 0.00 16.80
TOTAL BANNED ITEMS 462.38 66.24 0.00 528.62MISCELLANEOUS ITEMS
Antifreeze 0.00 0.15 0.00 0.15 Carpet 0.00 0.00 0.00 0.00 Carpet Padding 0.00 0.00 0.00 0.00 Cooking Oil/Grease 0.00 3.29 0.00 3.29 Fluorescent Bulbs 0.00 0.03 0.00 0.03 Household Hazardous Materials 0.00 0.00 0.00 0.00 Inkjet/Toner Cartridges 0.00 0.11 0.00 0.11 Mattresses & Box Springs 0.00 0.00 0.00 0.00 Paint 0.00 0.00 0.00 0.00 Rechargeable Batteries 0.00 0.02 0.00 0.02 Textiles (recycled – not donated for reuse) 0.00 0.01 0.00 0.01 Used Oil Filters 0.00 0.07 0.00 0.07 Wood Packaging (pallets, crates, barrels) 0.00 0.05 0.00 0.05 Items Not Listed Above 0.00 0.10 0.00 0.10 TOTAL MISCELLANEOUS 0.00 3.83 0.00 3.83
COMMINGLED RECYCLABLESTOTAL COMMINGLED RECYCLABLES 0.00 0.27 0.00 0.27TOTAL FOR ALL 660.58 486.79 0.00 1,147.37

54 South Carolina Solid Waste Management Annual Report for Fiscal Year 2016
COLLETON COUNTYTABLE 8.34: Colleton County MSW SummaryPOPULATION DROP-OFF
CENTERSCURBSIDE
PROGRAMSRECYCLING RATE
(PERCENT)RECYCLED
(P/P/D)RECYCLED
(TONS)DISPOSED
(P/P/D)DISPOSED
(TONS)37,731 14 1 17.15 0.57 3,943.79 2.77 19,049
TABLE 8.35: Colleton County MSW Recycling Data in TonsCOMMODITY RESIDENTIAL COMMERCIAL/
INSTITUTIONALINDUSTRIAL
(OFFICE/PACKAGING) TOTAL
GLASSContainers & Packaging - Brown 0.00 0.09 0.00 0.09Containers & Packaging - Clear 0.00 0.07 0.00 0.07Containers & Packaging - Green 0.00 0.04 0.00 0.04Containers & Packaging - Mixed 0.00 0.04 0.00 0.04TOTAL GLASS 0.00 0.24 0.00 0.24
METALAluminum Cans 6.81 0.56 0.00 7.37Ferrous, Magnetic 0.00 5.52 0.00 5.52Non-ferrous, Non-magnetic 0.00 0.00 0.00 0.00Steel Cans 0.00 0.16 0.00 0.16Mixed Scrap Metal 400.00 2.11 0.00 402.11TOTAL METAL 406.81 8.35 0.00 415.16
PAPERCardboard 70.44 2,536.22 0.00 2,606.66Magazines 0.00 0.17 0.00 0.17Newspaper & Inserts 15.80 0.14 0.00 15.94Office Paper 0.00 9.69 0.00 9.69Paperboard 0.00 0.00 0.00 0.00Phone Books 0.00 0.08 0.00 0.08Mixed Paper 0.00 0.31 0.00 0.31TOTAL PAPER 86.24 2,546.61 0.00 2,632.85
PLASTICHDPE 0.00 0.49 0.00 0.49LDPE 0.00 30.68 0.00 30.68PET 0.00 0.31 0.00 0.31PP 0.00 0.00 0.00 0.00PS 0.00 0.00 0.00 0.00Vinyl 0.00 0.00 0.00 0.00Commingled PET & HDPE 0.00 0.04 0.00 0.04Mixed Plastic 0.00 0.97 0.00 0.97TOTAL PLASTIC 0.00 32.49 0.00 32.49
ORGANICS Food Waste 0.00 0.01 0.00 0.01 Yard Trimmings (for use as boiler fuel) 0.00 0.00 0.00 0.00 Yard Trimmings (recycled into compost) 0.00 0.00 0.00 0.00 Yard Trimmings (recycled into mulch) 0.00 0.13 0.00 0.13 TOTAL ORGANICS 0.00 0.14 0.00 0.14
BANNED ITEMSAppliances 0.00 0.66 0.00 0.66Electronics 57.43 0.30 0.00 57.73Lead-acid Batteries (automobiles, trucks, motorcycles – small sealed lead-acid batteries)
36.12 49.30 0.00 85.42
Tires (automobiles, trucks, motorcycles) 520.75 143.87 0.00 664.62Used Motor Oil (automobiles, trucks, motorcycles) 2.36 0.00 0.00 2.36
TOTAL BANNED ITEMS 616.66 194.13 0.00 810.79MISCELLANEOUS ITEMS
Antifreeze 0.00 0.41 0.00 0.41 Carpet 0.00 0.00 0.00 0.00 Carpet Padding 0.00 0.00 0.00 0.00 Cooking Oil/Grease 0.00 8.87 0.00 8.87 Fluorescent Bulbs 0.00 0.08 0.00 0.08 Household Hazardous Materials 0.00 0.00 0.00 0.00 Inkjet/Toner Cartridges 3.25 0.23 0.00 3.48 Mattresses & Box Springs 0.00 0.01 0.00 0.01 Paint 0.00 0.00 0.00 0.00 Rechargeable Batteries 0.00 0.02 0.00 0.02 Textiles (recycled – not donated for reuse) 0.00 0.01 0.00 0.01 Used Oil Filters 0.00 0.45 0.00 0.45 Wood Packaging (pallets, crates, barrels) 0.00 0.06 0.00 0.06 Items Not Listed Above 0.00 0.11 0.00 0.11 TOTAL MISCELLANEOUS 3.25 10.25 0.00 13.50
COMMINGLED RECYCLABLESTOTAL COMMINGLED RECYCLABLES 0.00 38.62 0.00 38.62TOTAL FOR ALL 1,112.96 2,830.83 0.00 3,943.79
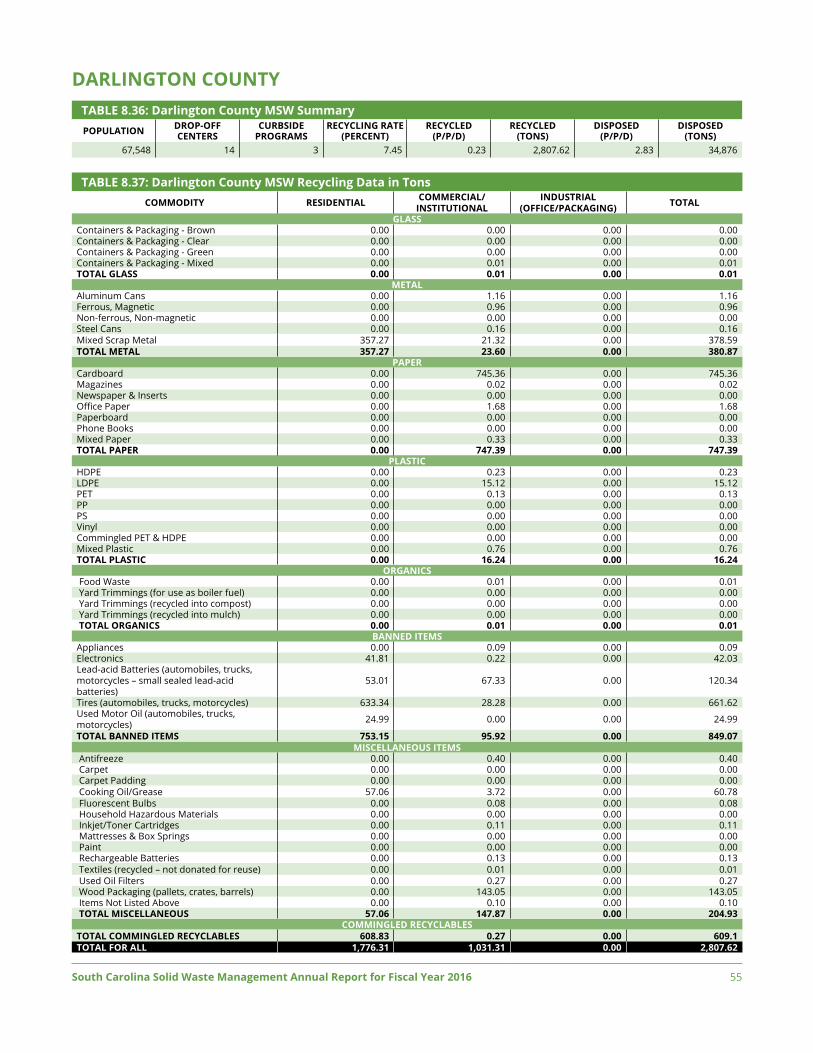
South Carolina Solid Waste Management Annual Report for Fiscal Year 2016 55
DARLINGTON COUNTYTABLE 8.36: Darlington County MSW SummaryPOPULATION DROP-OFF
CENTERSCURBSIDE
PROGRAMSRECYCLING RATE
(PERCENT)RECYCLED
(P/P/D)RECYCLED
(TONS)DISPOSED
(P/P/D)DISPOSED
(TONS)67,548 14 3 7.45 0.23 2,807.62 2.83 34,876
TABLE 8.37: Darlington County MSW Recycling Data in TonsCOMMODITY RESIDENTIAL COMMERCIAL/
INSTITUTIONALINDUSTRIAL
(OFFICE/PACKAGING) TOTAL
GLASSContainers & Packaging - Brown 0.00 0.00 0.00 0.00Containers & Packaging - Clear 0.00 0.00 0.00 0.00Containers & Packaging - Green 0.00 0.00 0.00 0.00Containers & Packaging - Mixed 0.00 0.01 0.00 0.01TOTAL GLASS 0.00 0.01 0.00 0.01
METALAluminum Cans 0.00 1.16 0.00 1.16Ferrous, Magnetic 0.00 0.96 0.00 0.96Non-ferrous, Non-magnetic 0.00 0.00 0.00 0.00Steel Cans 0.00 0.16 0.00 0.16Mixed Scrap Metal 357.27 21.32 0.00 378.59TOTAL METAL 357.27 23.60 0.00 380.87
PAPERCardboard 0.00 745.36 0.00 745.36Magazines 0.00 0.02 0.00 0.02Newspaper & Inserts 0.00 0.00 0.00 0.00Office Paper 0.00 1.68 0.00 1.68Paperboard 0.00 0.00 0.00 0.00Phone Books 0.00 0.00 0.00 0.00Mixed Paper 0.00 0.33 0.00 0.33TOTAL PAPER 0.00 747.39 0.00 747.39
PLASTICHDPE 0.00 0.23 0.00 0.23LDPE 0.00 15.12 0.00 15.12PET 0.00 0.13 0.00 0.13PP 0.00 0.00 0.00 0.00PS 0.00 0.00 0.00 0.00Vinyl 0.00 0.00 0.00 0.00Commingled PET & HDPE 0.00 0.00 0.00 0.00Mixed Plastic 0.00 0.76 0.00 0.76TOTAL PLASTIC 0.00 16.24 0.00 16.24
ORGANICS Food Waste 0.00 0.01 0.00 0.01 Yard Trimmings (for use as boiler fuel) 0.00 0.00 0.00 0.00 Yard Trimmings (recycled into compost) 0.00 0.00 0.00 0.00 Yard Trimmings (recycled into mulch) 0.00 0.00 0.00 0.00 TOTAL ORGANICS 0.00 0.01 0.00 0.01
BANNED ITEMSAppliances 0.00 0.09 0.00 0.09Electronics 41.81 0.22 0.00 42.03Lead-acid Batteries (automobiles, trucks, motorcycles – small sealed lead-acid batteries)
53.01 67.33 0.00 120.34
Tires (automobiles, trucks, motorcycles) 633.34 28.28 0.00 661.62Used Motor Oil (automobiles, trucks, motorcycles) 24.99 0.00 0.00 24.99
TOTAL BANNED ITEMS 753.15 95.92 0.00 849.07MISCELLANEOUS ITEMS
Antifreeze 0.00 0.40 0.00 0.40 Carpet 0.00 0.00 0.00 0.00 Carpet Padding 0.00 0.00 0.00 0.00 Cooking Oil/Grease 57.06 3.72 0.00 60.78 Fluorescent Bulbs 0.00 0.08 0.00 0.08 Household Hazardous Materials 0.00 0.00 0.00 0.00 Inkjet/Toner Cartridges 0.00 0.11 0.00 0.11 Mattresses & Box Springs 0.00 0.00 0.00 0.00 Paint 0.00 0.00 0.00 0.00 Rechargeable Batteries 0.00 0.13 0.00 0.13 Textiles (recycled – not donated for reuse) 0.00 0.01 0.00 0.01 Used Oil Filters 0.00 0.27 0.00 0.27 Wood Packaging (pallets, crates, barrels) 0.00 143.05 0.00 143.05 Items Not Listed Above 0.00 0.10 0.00 0.10 TOTAL MISCELLANEOUS 57.06 147.87 0.00 204.93
COMMINGLED RECYCLABLESTOTAL COMMINGLED RECYCLABLES 608.83 0.27 0.00 609.1TOTAL FOR ALL 1,776.31 1,031.31 0.00 2,807.62

56 South Carolina Solid Waste Management Annual Report for Fiscal Year 2016
DILLON COUNTYTABLE 8.38: Dillon County MSW SummaryPOPULATION DROP-OFF
CENTERSCURBSIDE
PROGRAMSRECYCLING RATE
(PERCENT)RECYCLED
(P/P/D)RECYCLED
(TONS)DISPOSED
(P/P/D)DISPOSED
(TONS)31,234 12 1 6.00 0.21 1,221.87 3.36 19,154
TABLE 8.39: Dillon County MSW Recycling Data in TonsCOMMODITY RESIDENTIAL COMMERCIAL/
INSTITUTIONALINDUSTRIAL
(OFFICE/PACKAGING) TOTAL
GLASSContainers & Packaging - Brown 0.00 0.09 0.00 0.09Containers & Packaging - Clear 0.00 0.07 0.00 0.07Containers & Packaging - Green 0.00 0.04 0.00 0.04Containers & Packaging - Mixed 0.00 0.04 0.00 0.04TOTAL GLASS 0.00 0.24 0.00 0.24
METALAluminum Cans 0.00 1.33 0.00 1.33Ferrous, Magnetic 0.00 1.07 0.00 1.07Non-ferrous, Non-magnetic 0.00 0.00 0.40 0.40Steel Cans 0.00 0.16 0.00 0.16Mixed Scrap Metal 153.69 1.55 0.00 155.24TOTAL METAL 153.69 4.11 0.40 158.20
PAPERCardboard 11.83 383.17 0.00 395.00Magazines 0.00 0.23 0.00 0.23Newspaper & Inserts 0.00 0.13 0.00 0.13Office Paper 0.00 2.41 0.00 2.41Paperboard 0.00 0.00 0.00 0.00Phone Books 0.00 0.00 0.00 0.00Mixed Paper 0.00 0.11 0.00 0.11TOTAL PAPER 11.83 386.05 0.00 397.88
PLASTICHDPE 0.00 0.11 0.00 0.11LDPE 0.00 4.51 0.00 4.51PET 0.00 0.08 0.00 0.08PP 0.00 0.00 0.00 0.00PS 0.00 0.00 0.00 0.00Vinyl 0.00 0.00 0.00 0.00Commingled PET & HDPE 0.00 0.00 0.00 0.00Mixed Plastic 0.00 0.48 0.00 0.48TOTAL PLASTIC 0.00 5.18 0.00 5.18
ORGANICS Food Waste 0.00 0.01 0.00 0.01 Yard Trimmings (for use as boiler fuel) 0.00 0.00 0.00 0.00 Yard Trimmings (recycled into compost) 0.00 0.00 0.00 0.00 Yard Trimmings (recycled into mulch) 0.00 0.01 0.00 0.01 TOTAL ORGANICS 0.00 0.02 0.00 0.02
BANNED ITEMSAppliances 0.00 0.12 0.00 0.12Electronics 75.98 1.12 0.00 77.10Lead-acid Batteries (automobiles, trucks, motorcycles – small sealed lead-acid batteries)
24.47 30.6 0.00 55.07
Tires (automobiles, trucks, motorcycles) 486.88 18.69 0.00 505.57Used Motor Oil (automobiles, trucks, motorcycles) 16.20 0.00 0.00 16.20
TOTAL BANNED ITEMS 603.53 50.53 0.00 654.06MISCELLANEOUS ITEMS
Antifreeze 0.00 0.40 0.00 0.40 Carpet 0.00 0.00 0.00 0.00 Carpet Padding 0.00 0.00 0.00 0.00 Cooking Oil/Grease 0.00 3.82 0.00 3.82 Fluorescent Bulbs 0.00 0.11 0.10 0.21 Household Hazardous Materials 0.00 0.00 0.00 0.00 Inkjet/Toner Cartridges 0.00 0.11 0.00 0.11 Mattresses & Box Springs 0.00 0.01 0.00 0.01 Paint 0.00 0.00 0.00 0.00 Rechargeable Batteries 0.00 0.02 0.00 0.02 Textiles (recycled – not donated for reuse) 0.00 0.01 0.00 0.01 Used Oil Filters 0.00 0.27 0.00 0.27 Wood Packaging (pallets, crates, barrels) 0.00 0.06 0.00 0.06 Items Not Listed Above 0.00 0.10 0.00 0.10 TOTAL MISCELLANEOUS 0.00 4.91 0.10 5.01
COMMINGLED RECYCLABLESTOTAL COMMINGLED RECYCLABLES 0.00 1.28 0.00 1.28TOTAL FOR ALL 769.05 452.33 0.50 1,221.88

South Carolina Solid Waste Management Annual Report for Fiscal Year 2016 57
DORCHESTER COUNTYTABLE 8.40: Dorchester County MSW SummaryPOPULATION DROP-OFF
CENTERSCURBSIDE
PROGRAMSRECYCLING RATE
(PERCENT)RECYCLED
(P/P/D)RECYCLED
(TONS)DISPOSED
(P/P/D)DISPOSED
(TONS)152,478 14 2 31.17 1.21 33,786.09 2.68 74,614
TABLE 8.41: Dorchester County MSW Recycling Data in TonsCOMMODITY RESIDENTIAL COMMERCIAL/
INSTITUTIONALINDUSTRIAL
(OFFICE/PACKAGING) TOTAL
GLASSContainers & Packaging - Brown 0.00 0.09 0.00 0.09Containers & Packaging - Clear 0.00 0.07 0.00 0.07Containers & Packaging - Green 0.00 0.04 0.00 0.04Containers & Packaging - Mixed 108.46 0.04 0.00 108.50TOTAL GLASS 108.46 0.24 0.00 108.70
METALAluminum Cans 0.00 0.65 0.00 0.65Ferrous, Magnetic 0.00 1.57 1,070.00 1,071.57Non-ferrous, Non-magnetic 0.00 0.00 1,208.00 1,208.00Steel Cans 0.00 18.75 0.00 18.75Mixed Scrap Metal 624.31 4,601.85 161.41 5,387.57TOTAL METAL 624.31 4,622.82 2,439.41 7,686.54
PAPERCardboard 647.92 1,675.79 13.53 2,337.24Magazines 0.00 0.17 0.00 0.17Newspaper & Inserts 0.00 0.14 0.00 0.14Office Paper 0.00 3.31 88.90 92.21Paperboard 0.00 0.00 0.00 0.00Phone Books 0.00 0.08 0.00 0.08Mixed Paper 441.8 15.02 0 456.82TOTAL PAPER 1,089.72 1,694.51 102.43 2,886.66
PLASTICHDPE 0.00 0.53 0.00 0.53LDPE 0.00 38.13 0.00 38.13PET 0.00 0.35 0.00 0.35PP 0.00 0.00 0.00 0.00PS 0.00 0.00 0.00 0.00Vinyl 0.00 0.00 0.00 0.00Commingled PET & HDPE 0.00 0.00 0.00 0.00Mixed Plastic 0.00 18.68 144.00 162.68TOTAL PLASTIC 0.00 57.69 144.00 201.69
ORGANICS Food Waste 0.00 0.01 38.80 38.81 Yard Trimmings (for use as boiler fuel) 0.00 0.00 0.00 0.00 Yard Trimmings (recycled into compost) 0.00 0.00 0.00 0.00 Yard Trimmings (recycled into mulch) 14,827.07 0.13 0.00 14,827.20 TOTAL ORGANICS 14,827.07 0.14 38.80 14,866.01
BANNED ITEMSAppliances 0.00 0.12 0.00 0.12Electronics 200.54 0.55 14.60 215.69Lead-acid Batteries (automobiles, trucks, motorcycles – small sealed lead-acid batteries)
126.41 146.27 0.00 272.68
Tires (automobiles, trucks, motorcycles) 1,175.13 134.52 0.00 1,309.65Used Motor Oil (automobiles, trucks, motorcycles) 99.34 0.00 0.00 99.34
TOTAL BANNED ITEMS 1,601.42 281.46 14.60 1,897.48MISCELLANEOUS ITEMS
Antifreeze 2.03 0.41 0.00 2.44 Carpet 103.23 0.00 0.00 103.23 Carpet Padding 0.00 0.00 0.00 0.00 Cooking Oil/Grease 20.59 14.55 0.00 35.14 Fluorescent Bulbs 0.00 0.08 0.79 0.87 Household Hazardous Materials 0.00 0.00 0.00 0.00 Inkjet/Toner Cartridges 0.00 0.21 0.00 0.21 Mattresses & Box Springs 0.00 0.01 0.00 0.01 Paint 0.00 0.00 0.00 0.00 Rechargeable Batteries 0.00 0.33 1.50 1.83 Textiles (recycled – not donated for reuse) 0.00 8.06 0.00 8.06 Used Oil Filters 4.40 0.65 0.00 5.05 Wood Packaging (pallets, crates, barrels) 0.00 142.06 726.5 868.56 Items Not Listed Above 0.00 0.13 0.00 0.13 TOTAL MISCELLANEOUS 130.25 166.50 728.79 1,025.54
COMMINGLED RECYCLABLESTOTAL COMMINGLED RECYCLABLES 4,362.80 172.88 577.80 5,113.48TOTAL FOR ALL 22,744.03 6,996.24 4,045.83 33,786.10

58 South Carolina Solid Waste Management Annual Report for Fiscal Year 2016
EDGEFIELD COUNTYTABLE 8.42: Edgefield County MSW SummaryPOPULATION DROP-OFF
CENTERSCURBSIDE
PROGRAMSRECYCLING RATE
(PERCENT)RECYCLED
(P/P/D)RECYCLED
(TONS)DISPOSED
(P/P/D)DISPOSED
(TONS)26,514 8 2 8.19 0.29 1,401.69 3.25 15,720
TABLE 8.43: Edgefield County MSW Recycling Data in TonsCOMMODITY RESIDENTIAL COMMERCIAL/
INSTITUTIONALINDUSTRIAL
(OFFICE/PACKAGING) TOTAL
GLASSContainers & Packaging - Brown 0.00 0.00 0.00 0.00Containers & Packaging - Clear 0.00 0.00 0.00 0.00Containers & Packaging - Green 0.00 0.00 0.00 0.00Containers & Packaging - Mixed 0.00 0.01 0.00 0.01TOTAL GLASS 0.00 0.01 0.00 0.01
METALAluminum Cans 4.58 0.39 0.00 4.97Ferrous, Magnetic 0.00 5.04 0.00 5.04Non-ferrous, Non-magnetic 0.00 0.00 0.00 0.00Steel Cans 0.00 18.75 0.00 18.75Mixed Scrap Metal 247.33 63.41 0.00 310.74TOTAL METAL 251.91 87.59 0.00 339.5
PAPERCardboard 140.75 317.31 0.00 458.06Magazines 0.00 0.00 0.00 0.00Newspaper & Inserts 105.44 0.00 0.00 105.44Office Paper 0.00 1.54 0.00 1.54Paperboard 0.00 0.00 0.00 0.00Phone Books 0.00 0.00 0.00 0.00Mixed Paper 42.60 14.81 0.00 57.41TOTAL PAPER 288.79 333.66 0.00 622.45
PLASTICHDPE 0.00 0.05 0.00 0.05LDPE 0.00 2.08 0.00 2.08PET 0.00 0.01 0.00 0.01PP 0.00 0.00 0.00 0.00PS 0.00 0.00 0.00 0.00Vinyl 0.00 0.00 0.00 0.00Commingled PET & HDPE 37.97 0.00 0.00 37.97Mixed Plastic 0.00 4.84 0.00 4.84TOTAL PLASTIC 37.97 6.98 0.00 44.95
ORGANICS Food Waste 0.00 0.01 0.00 0.01 Yard Trimmings (for use as boiler fuel) 0.00 0.00 0.00 0.00 Yard Trimmings (recycled into compost) 0.00 0.00 0.00 0.00 Yard Trimmings (recycled into mulch) 0.00 0.00 0.00 0.00 TOTAL ORGANICS 0.00 0.01 0.00 0.01
BANNED ITEMSAppliances 0.00 0.09 0.00 0.09Electronics 9.35 0.22 0.00 9.57Lead-acid Batteries (automobiles, trucks, motorcycles – small sealed lead-acid batteries)
20.94 28.13 0.00 49.07
Tires (automobiles, trucks, motorcycles) 206.54 13.76 0.00 220.3Used Motor Oil (automobiles, trucks, motorcycles) 57.38 0.00 0.00 57.38
TOTAL BANNED ITEMS 294.21 42.20 0.00 336.41MISCELLANEOUS ITEMS
Antifreeze 0.00 0.49 0.00 0.49 Carpet 0.00 0.00 0.00 0.00 Carpet Padding 0.00 0.00 0.00 0.00 Cooking Oil/Grease 0.00 2.30 0.00 2.30 Fluorescent Bulbs 0.00 0.09 0.00 0.09 Household Hazardous Materials 0.00 0.00 0.00 0.00 Inkjet/Toner Cartridges 0.00 0.11 0.00 0.11 Mattresses & Box Springs 0.00 0.00 0.00 0.00 Paint 0.00 0.00 0.00 0.00 Rechargeable Batteries 0.00 0.02 0.00 0.02 Textiles (recycled – not donated for reuse) 0.00 8.06 0.00 8.06 Used Oil Filters 1.94 0.38 0.00 2.32 Wood Packaging (pallets, crates, barrels) 0.00 0.20 0.00 0.20 Items Not Listed Above 0.00 0.92 0.00 0.92 TOTAL MISCELLANEOUS 1.94 12.57 0.00 14.51
COMMINGLED RECYCLABLESTOTAL COMMINGLED RECYCLABLES 39.83 4.02 0.00 43.85TOTAL FOR ALL 914.65 487.04 0.00 1,401.69

South Carolina Solid Waste Management Annual Report for Fiscal Year 2016 59
FAIRFIELD COUNTYTABLE 8.44: Fairfield County MSW SummaryPOPULATION DROP-OFF
CENTERSCURBSIDE
PROGRAMSRECYCLING RATE
(PERCENT)RECYCLED
(P/P/D)RECYCLED
(TONS)DISPOSED
(P/P/D)DISPOSED
(TONS)22,747 11 0 13.93 0.77 3,195.37 4.76 19,748
TABLE 8.45: Fairfield County MSW Recycling Data in TonsCOMMODITY RESIDENTIAL COMMERCIAL/
INSTITUTIONALINDUSTRIAL
(OFFICE/PACKAGING) TOTAL
GLASSContainers & Packaging - Brown 0.00 0.09 0.00 0.09Containers & Packaging - Clear 0.00 0.07 0.00 0.07Containers & Packaging - Green 0.00 0.04 0.00 0.04Containers & Packaging - Mixed 63.16 0.03 0.00 63.19TOTAL GLASS 63.16 0.23 0.00 63.39
METALAluminum Cans 0.00 3.25 0.25 3.50Ferrous, Magnetic 0.00 2.11 0.00 2.11Non-ferrous, Non-magnetic 0.00 0.00 0.00 0.00Steel Cans 0.00 0.15 0.00 0.15Mixed Scrap Metal 422.89 8.55 0.00 431.44TOTAL METAL 422.89 14.06 0.25 437.20
PAPERCardboard 169.75 231.91 108.30 509.96Magazines 0.00 0.02 0.00 0.02Newspaper & Inserts 0.00 0.02 0.00 0.02Office Paper 0.00 4.63 0.75 5.38Paperboard 0.00 0.00 0.00 0.00Phone Books 0.00 0.01 0.00 0.01Mixed Paper 221.87 0.06 0.00 221.93TOTAL PAPER 391.62 236.65 109.05 737.32
PLASTICHDPE 43.09 0.14 0.00 43.23LDPE 0.00 6.00 0.00 6.00PET 0.00 0.10 0.00 0.10PP 0.00 0.00 0.00 0.00PS 0.00 0.00 0.00 0.00Vinyl 0.00 0.00 0.00 0.00Commingled PET & HDPE 0.00 0.00 0.00 0.00Mixed Plastic 0.00 0.53 0.00 0.53TOTAL PLASTIC 43.09 6.77 0.00 49.86
ORGANICS Food Waste 0.00 0.01 0.00 0.01 Yard Trimmings (for use as boiler fuel) 0.00 0.00 0.00 0.00 Yard Trimmings (recycled into compost) 0.00 0.00 0.00 0.00 Yard Trimmings (recycled into mulch) 1,200.00 0.01 0.00 1,200.01 TOTAL ORGANICS 1,200.00 0.02 0.00 1,200.02
BANNED ITEMSAppliances 0.00 0.12 0.00 0.12Electronics 117.27 0.18 0.00 117.45Lead-acid Batteries (automobiles, trucks, motorcycles – small sealed lead-acid batteries)
16.80 17.61 0.01 34.42
Tires (automobiles, trucks, motorcycles) 493.18 1.43 0.00 494.61Used Motor Oil (automobiles, trucks, motorcycles) 34.88 0.00 0.00 34.88
TOTAL BANNED ITEMS 662.13 19.34 0.01 681.48MISCELLANEOUS ITEMS
Antifreeze 0.00 0.18 0.00 0.18 Carpet 0.00 0.00 0.00 0.00 Carpet Padding 0.00 0.00 0.00 0.00 Cooking Oil/Grease 5.90 2.51 0.00 8.41 Fluorescent Bulbs 0.00 0.03 0.08 0.11 Household Hazardous Materials 0.00 0.00 0.00 0.00 Inkjet/Toner Cartridges 0.00 0.02 0.00 0.02 Mattresses & Box Springs 0.00 0.01 0.00 0.01 Paint 0.00 0.00 0.00 0.00 Rechargeable Batteries 0.00 0.08 0.00 0.08 Textiles (recycled – not donated for reuse) 0.00 0.01 0.00 0.01 Used Oil Filters 1.83 0.37 0.00 2.20 Wood Packaging (pallets, crates, barrels) 0.00 0.15 0.00 0.15 Items Not Listed Above 0.00 0.06 0.00 0.06 TOTAL MISCELLANEOUS 7.73 3.43 0.08 11.23
COMMINGLED RECYCLABLESTOTAL COMMINGLED RECYCLABLES 13.86 1.01 0.00 14.87TOTAL FOR ALL 2,804.48 281.50 109.39 3,195.37

60 South Carolina Solid Waste Management Annual Report for Fiscal Year 2016
FLORENCE COUNTYTABLE 8.46: Florence County MSW SummaryPOPULATION DROP-OFF
CENTERSCURBSIDE
PROGRAMSRECYCLING RATE
(PERCENT)RECYCLED
(P/P/D)RECYCLED
(TONS)DISPOSED
(P/P/D)DISPOSED
(TONS)138,900 15 2 11.19 0.50 12,746.66 3.99 101,209
TABLE 8.47: Florence County MSW Recycling Data in TonsCOMMODITY RESIDENTIAL COMMERCIAL/
INSTITUTIONALINDUSTRIAL
(OFFICE/PACKAGING) TOTAL
GLASSContainers & Packaging - Brown 0.00 0.00 0.00 0.00Containers & Packaging - Clear 0.00 0.00 0.00 0.00Containers & Packaging - Green 0.00 0.00 0.00 0.00Containers & Packaging - Mixed 0.00 0.01 0.00 0.01TOTAL GLASS 0.00 0.01 0.00 0.01
METALAluminum Cans 0.00 1.28 0.00 1.28Ferrous, Magnetic 0.00 58.91 0.00 58.91Non-ferrous, Non-magnetic 0.00 0.00 0.00 0.00Steel Cans 0.00 18.76 0.00 18.76Mixed Scrap Metal 42.94 129.87 0.00 172.81TOTAL METAL 42.94 208.82 0.00 251.76
PAPERCardboard 0.00 3,113.87 0.00 3,113.87Magazines 0.00 0.02 0.00 0.02Newspaper & Inserts 0.00 0.00 0.00 0.00Office Paper 0.00 22.97 0.00 22.97Paperboard 0.00 0.00 0.00 0.00Phone Books 0.00 0.14 0.00 0.14Mixed Paper 0.00 29.09 0.00 29.09TOTAL PAPER 0.00 3,166.09 0.00 3,166.09
PLASTICHDPE 0.00 0.91 0.00 0.91LDPE 0.00 61.10 0.00 61.10PET 0.00 0.52 0.00 0.52PP 0.00 0.00 0.00 0.00PS 0.00 0.00 0.00 0.00Vinyl 0.00 0.00 0.00 0.00Commingled PET & HDPE 0.00 0.00 0.00 0.00Mixed Plastic 0.00 19.08 0.00 19.08TOTAL PLASTIC 0.00 81.61 0.00 81.61
ORGANICS Food Waste 0.00 0.01 0.00 0.01 Yard Trimmings (for use as boiler fuel) 0.00 0.00 0.00 0.00 Yard Trimmings (recycled into compost) 0.00 0.00 0.00 0.00 Yard Trimmings (recycled into mulch) 1,823.25 0.00 0.00 1,823.25 TOTAL ORGANICS 1,823.25 0.01 0.00 1,823.26
BANNED ITEMSAppliances 2,312.00 0.09 0.00 2,312.09Electronics 278.21 6.75 0.00 284.96Lead-acid Batteries (automobiles, trucks, motorcycles – small sealed lead-acid batteries)
118.25 161.70 0.00 279.95
Tires (automobiles, trucks, motorcycles) 1,358.30 83.48 0.00 1,441.78Used Motor Oil (automobiles, trucks, motorcycles) 82.32 0.00 0.00 82.32
TOTAL BANNED ITEMS 4,149.08 252.02 0.00 4,401.10MISCELLANEOUS ITEMS
Antifreeze 0.00 0.72 0.00 0.72 Carpet 0.00 0.00 0.00 0.00 Carpet Padding 0.00 0.00 0.00 0.00 Cooking Oil/Grease 0.00 22.13 0.00 22.13 Fluorescent Bulbs 0.00 0.08 0.00 0.08 Household Hazardous Materials 0.00 0.00 0.00 0.00 Inkjet/Toner Cartridges 0.00 0.55 0.00 0.55 Mattresses & Box Springs 0.00 0.00 0.00 0.00 Paint 0.00 0.00 0.00 0.00 Rechargeable Batteries 0.00 0.43 0.00 0.43 Textiles (recycled – not donated for reuse) 0.00 8.06 0.00 8.06 Used Oil Filters 3.25 0.37 0.00 3.62 Wood Packaging (pallets, crates, barrels) 0.00 260.05 0.00 260.05 Items Not Listed Above 0.00 0.11 0.00 0.11 TOTAL MISCELLANEOUS 3.25 292.51 0.00 295.76
COMMINGLED RECYCLABLESTOTAL COMMINGLED RECYCLABLES 2,338.00 389.08 0.00 2,727.08TOTAL FOR ALL 8,356.52 4,390.15 0.00 12,746.67

South Carolina Solid Waste Management Annual Report for Fiscal Year 2016 61
GEORGETOWN COUNTYTABLE 8.48: Georgetown County MSW SummaryPOPULATION DROP-OFF
CENTERSCURBSIDE
PROGRAMSRECYCLING RATE
(PERCENT)RECYCLED
(P/P/D)RECYCLED
(TONS)DISPOSED
(P/P/D)DISPOSED
(TONS)61,298 14 1 23.48 1.11 12,454.53 3.63 40,595
TABLE 8.49: Georgetown County MSW Recycling Data in TonsCOMMODITY RESIDENTIAL COMMERCIAL/
INSTITUTIONALINDUSTRIAL
(OFFICE/PACKAGING) TOTAL
GLASSContainers & Packaging - Brown 0.00 0.10 0.00 0.10Containers & Packaging - Clear 0.00 0.11 0.00 0.11Containers & Packaging - Green 0.00 0.04 0.00 0.04Containers & Packaging - Mixed 0.00 0.14 0.00 0.14TOTAL GLASS 0.00 0.39 0.00 0.39
METALAluminum Cans 7.64 86.46 0.00 94.10Ferrous, Magnetic 483.73 3,672.70 0.00 4,156.43Non-ferrous, Non-magnetic 0.00 0.00 0.00 0.00Steel Cans 0.00 0.16 2.45 2.61Mixed Scrap Metal 0.00 245.7 0.60 246.30TOTAL METAL 491.37 4,005.02 3.05 4,499.44
PAPERCardboard 524.00 1,012.92 59.00 1,595.92Magazines 0.00 2.04 0.00 2.04Newspaper & Inserts 219.93 0.23 0.00 220.16Office Paper 16.03 6.74 0.00 22.77Paperboard 0.00 0.08 0.00 0.08Phone Books 0.00 0.02 0.00 0.02Mixed Paper 529.97 8.26 0.00 538.23TOTAL PAPER 1,289.93 1,030.29 59.00 2,379.22
PLASTICHDPE 28.37 0.60 0.00 28.97LDPE 0.00 29.38 0.00 29.38PET 54.92 0.52 0.00 55.44PP 0.00 0.00 0.00 0.00PS 0.00 0.00 0.00 0.00Vinyl 0.00 0.00 0.00 0.00Commingled PET & HDPE 0.00 0.00 0.00 0.00Mixed Plastic 24.22 1.05 56.04 81.31TOTAL PLASTIC 107.51 31.55 56.04 195.1
ORGANICS Food Waste 0.00 1.16 0.00 1.16 Yard Trimmings (for use as boiler fuel) 199.10 0.00 0.00 199.10 Yard Trimmings (recycled into compost) 0.00 0.28 0.00 0.28 Yard Trimmings (recycled into mulch) 0.00 0.16 0.00 0.16 TOTAL ORGANICS 199.10 1.60 0.00 200.70
BANNED ITEMSAppliances 0.00 0.32 0.00 0.32Electronics 163.04 1.97 0.00 165.01Lead-acid Batteries (automobiles, trucks, motorcycles – small sealed lead-acid batteries)
51.30 58.43 0.00 109.73
Tires (automobiles, trucks, motorcycles) 539.59 304.64 0.00 844.23Used Motor Oil (automobiles, trucks, motorcycles) 42.38 0.00 0.00 42.38
TOTAL BANNED ITEMS 796.31 365.36 0.00 1,161.67MISCELLANEOUS ITEMS
Antifreeze 0.00 0.41 0.00 0.41 Carpet 14.78 0.90 0.00 15.68 Carpet Padding 0.00 0.40 0.00 0.40 Cooking Oil/Grease 0.00 2,000.62 0.00 2,000.62 Fluorescent Bulbs 0.00 0.09 0.09 0.18 Household Hazardous Materials 5.41 0.00 0.00 5.41 Inkjet/Toner Cartridges 0.00 0.56 0.00 0.56 Mattresses & Box Springs 0.00 0.01 0.00 0.01 Paint 58.30 0.02 0.00 58.32 Rechargeable Batteries 0.00 0.03 0.00 0.03 Textiles (recycled – not donated for reuse) 1,587.50 0.01 0.00 1,587.51 Used Oil Filters 0.00 0.28 0.00 0.28 Wood Packaging (pallets, crates, barrels) 0.00 1.81 312.00 313.81 Items Not Listed Above 0.00 5.67 0.00 5.67 TOTAL MISCELLANEOUS 1,665.99 2,010.81 312.09 3,988.89
COMMINGLED RECYCLABLESTOTAL COMMINGLED RECYCLABLES 0.00 29.12 0.00 29.12TOTAL FOR ALL 4,550.21 7,474.14 430.18 12,454.53

62 South Carolina Solid Waste Management Annual Report for Fiscal Year 2016
GREENVILLE COUNTYTABLE 8.50: Greenville County MSW SummaryPOPULATION DROP-OFF
CENTERSCURBSIDE
PROGRAMSRECYCLING RATE
(PERCENT)RECYCLED
(P/P/D)RECYCLED
(TONS)DISPOSED
(P/P/D)DISPOSED
(TONS)491,863 20 6 27.53 1.31 117,608.23 3.45 309,594
TABLE 8.51: Greenville County MSW Recycling Data in TonsCOMMODITY RESIDENTIAL COMMERCIAL/
INSTITUTIONALINDUSTRIAL
(OFFICE/PACKAGING) TOTAL
GLASSContainers & Packaging - Brown 0.00 0.09 0.00 0.09Containers & Packaging - Clear 0.00 0.07 0.00 0.07Containers & Packaging - Green 0.00 0.04 0.00 0.04Containers & Packaging - Mixed 47.24 0.04 0.00 47.28TOTAL GLASS 47.24 0.24 0.00 47.48
METALAluminum Cans 0.00 9.04 0.12 9.16Ferrous, Magnetic 0.00 4,022.64 87.43 4,110.07Non-ferrous, Non-magnetic 0.00 573.23 0.00 573.23Steel Cans 0.00 18.76 49.14 67.90Mixed Scrap Metal 13,924.40 5,889.23 111.66 19,925.29TOTAL METAL 13,924.40 10,512.90 248.35 24,685.65
PAPERCardboard 542.32 17,347.30 24.85 17,914.47Magazines 0.00 0.02 0.00 0.02Newspaper & Inserts 0.00 0.02 0.00 0.02Office Paper 21.00 182.97 5.52 209.49Paperboard 0.00 0.00 0.00 0.00Phone Books 0.00 0.03 0.00 0.03Mixed Paper 116.61 4,490.86 7.15 4,614.62TOTAL PAPER 679.93 22,021.20 37.52 22,738.65
PLASTICHDPE 0.00 33.04 0.36 33.40LDPE 0.00 162.33 0.00 162.33PET 0.00 3.20 5.10 8.30PP 0.00 0.00 0.00 0.00PS 0.00 0.00 0.00 0.00Vinyl 0.00 0.00 0.00 0.00Commingled PET & HDPE 0.00 0.00 0.00 0.00Mixed Plastic 0.00 32.81 131.95 164.75TOTAL PLASTIC 0.00 231.38 137.41 368.79
ORGANICS Food Waste 261.60 312.11 0.00 573.71 Yard Trimmings (for use as boiler fuel) 0.00 0.00 0.00 0.00 Yard Trimmings (recycled into compost) 0.00 0.00 0.00 0.00 Yard Trimmings (recycled into mulch) 10,711.69 19,226.37 0.00 29,938.06 TOTAL ORGANICS 10,973.29 19,538.48 0.00 30,511.77
BANNED ITEMSAppliances 74.19 507.66 0.00 581.85Electronics 353.75 267.93 1.10 622.78Lead-acid Batteries (automobiles, trucks, motorcycles – small sealed lead-acid batteries)
414.74 634.06 0.27 1,049.07
Tires (automobiles, trucks, motorcycles) 6,381.70 3,541.64 0.23 9,923.57Used Motor Oil (automobiles, trucks, motorcycles) 148.67 0.00 0.00 148.67
TOTAL BANNED ITEMS 7,373.05 4,951.29 1.60 12,325.94MISCELLANEOUS ITEMS
Antifreeze 14.74 16.65 0.00 31.39 Carpet 0.00 0.00 0.00 0.00 Carpet Padding 0.00 0.00 0.00 0.00 Cooking Oil/Grease 23.88 49.61 0.00 73.49 Fluorescent Bulbs 10.00 5.51 1.15 16.66 Household Hazardous Materials 0.00 0.00 0.00 0.00 Inkjet/Toner Cartridges 0.11 1.19 0.30 1.60 Mattresses & Box Springs 0.00 0.01 0.00 0.01 Paint 2.10 0.00 0.00 2.10 Rechargeable Batteries 1.00 2.06 0.05 3.11 Textiles (recycled – not donated for reuse) 8.73 337.46 0.00 346.19 Used Oil Filters 3.67 8.57 0.00 12.24 Wood Packaging (pallets, crates, barrels) 28.00 1,948.33 362.04 2,338.37 Items Not Listed Above 15.00 53.63 0.13 68.76 TOTAL MISCELLANEOUS 107.23 2,423.02 363.67 2,893.92
COMMINGLED RECYCLABLESTOTAL COMMINGLED RECYCLABLES 13,597.17 10,437.87 1.00 24,036.04TOTAL FOR ALL 46,702.31 70,116.39 789.54 117,608.24

South Carolina Solid Waste Management Annual Report for Fiscal Year 2016 63
GREENWOOD COUNTYTABLE 8.52: Greenwood County MSW SummaryPOPULATION DROP-OFF
CENTERSCURBSIDE
PROGRAMSRECYCLING RATE
(PERCENT)RECYCLED
(P/P/D)RECYCLED
(TONS)DISPOSED
(P/P/D)DISPOSED
(TONS)69,838 9 4 32.25 2.68 34,145.59 5.63 71,718
TABLE 8.53: Greenwood County MSW Recycling Data in TonsCOMMODITY RESIDENTIAL COMMERCIAL/
INSTITUTIONALINDUSTRIAL
(OFFICE/PACKAGING) TOTAL
GLASSContainers & Packaging - Brown 0.00 0.00 0.00 0.00Containers & Packaging - Clear 0.00 0.00 0.00 0.00Containers & Packaging - Green 0.00 0.00 0.00 0.00Containers & Packaging - Mixed 0.00 0.01 1.41 1.42TOTAL GLASS 0.00 0.01 1.41 1.42
METALAluminum Cans 0.00 110.34 0.17 110.51Ferrous, Magnetic 0.00 23,005.04 5.93 23,010.97Non-ferrous, Non-magnetic 0.00 0.00 0.00 0.00Steel Cans 1.90 0.15 0.00 2.05Mixed Scrap Metal 322.00 61.00 0.00 383.00TOTAL METAL 323.90 23,176.53 6.10 23,506.53
PAPERCardboard 635.00 3,266.60 6.71 3,908.31Magazines 0.00 0.25 0.00 0.25Newspaper & Inserts 0.00 0.25 0.00 0.25Office Paper 8.10 29.72 2.54 40.36Paperboard 0.00 0.00 0.00 0.00Phone Books 0.00 0.00 0.00 0.00Mixed Paper 6.85 1,293.35 0.00 1,300.20TOTAL PAPER 649.95 4,590.17 9.26 5,249.38
PLASTICHDPE 2.40 2.47 0.00 4.87LDPE 0.00 8.77 0.00 8.77PET 6.60 6.61 0.00 13.21PP 0.00 0.00 0.00 0.00PS 0.00 0.00 0.00 0.00Vinyl 0.00 0.00 0.00 0.00Commingled PET & HDPE 0.00 0.00 0.00 0.00Mixed Plastic 0.00 0.68 3.22 3.90TOTAL PLASTIC 9.00 18.53 3.22 30.75
ORGANICS Food Waste 0.00 925.01 0.00 925.01 Yard Trimmings (for use as boiler fuel) 0.00 0.00 0.00 0.00 Yard Trimmings (recycled into compost) 0.00 0.00 0.00 0.00 Yard Trimmings (recycled into mulch) 0.00 0.00 0.00 0.00 TOTAL ORGANICS 0.00 925.01 0.00 925.01
BANNED ITEMSAppliances 0.00 0.09 0.00 0.09Electronics 6.79 25.67 0.15 32.61Lead-acid Batteries (automobiles, trucks, motorcycles – small sealed lead-acid batteries)
57.47 131.27 0.13 188.87
Tires (automobiles, trucks, motorcycles) 1,221.50 19.16 0.00 1,240.66Used Motor Oil (automobiles, trucks, motorcycles) 32.20 0.00 0.00 32.20
TOTAL BANNED ITEMS 1,317.96 176.19 0.28 1,494.43MISCELLANEOUS ITEMS
Antifreeze 0.50 0.62 0.00 1.12 Carpet 0.00 0.00 0.00 0.00 Carpet Padding 0.00 0.00 0.00 0.00 Cooking Oil/Grease 0.50 6.16 0.00 6.66 Fluorescent Bulbs 0.00 1.16 0.12 1.28 Household Hazardous Materials 0.00 0.00 0.00 0.00 Inkjet/Toner Cartridges 0.10 2.11 0.00 2.21 Mattresses & Box Springs 0.00 0.00 0.00 0.00 Paint 0.00 0.00 0.00 0.00 Rechargeable Batteries 0.00 0.21 0.00 0.21 Textiles (recycled – not donated for reuse) 0.00 0.01 0.00 0.01 Used Oil Filters 0.10 0.38 0.00 0.48 Wood Packaging (pallets, crates, barrels) 0.00 688.20 16.93 705.13 Items Not Listed Above 0.00 0.91 0.00 0.91 TOTAL MISCELLANEOUS 1.20 699.76 17.05 718.01
COMMINGLED RECYCLABLESTOTAL COMMINGLED RECYCLABLES 2,162.00 58.07 0.00 2,220.07TOTAL FOR ALL 4,464.01 29,644.26 37.33 34,145.60

64 South Carolina Solid Waste Management Annual Report for Fiscal Year 2016
HAMPTON COUNTYTABLE 8.54: Hampton County MSW SummaryPOPULATION DROP-OFF
CENTERSCURBSIDE
PROGRAMSRECYCLING RATE
(PERCENT)RECYCLED
(P/P/D)RECYCLED
(TONS)DISPOSED
(P/P/D)DISPOSED
(TONS)20,049 10 0 21.10 0.75 2,733.98 2.79 10,224
TABLE 8.55: Hampton County MSW Recycling Data in TonsCOMMODITY RESIDENTIAL COMMERCIAL/
INSTITUTIONALINDUSTRIAL
(OFFICE/PACKAGING) TOTAL
GLASSContainers & Packaging - Brown 0.00 0.09 0.00 0.09Containers & Packaging - Clear 0.00 0.07 0.00 0.07Containers & Packaging - Green 0.00 0.04 0.00 0.04Containers & Packaging - Mixed 0.00 0.04 0.00 0.04TOTAL GLASS 0.00 0.24 0.00 0.24
METALAluminum Cans 0.00 0.18 0.00 0.18Ferrous, Magnetic 0.00 4.06 0.00 4.06Non-ferrous, Non-magnetic 0.00 0.00 0.00 0.00Steel Cans 0.00 0.16 0.00 0.16Mixed Scrap Metal 141.58 3.58 0.00 145.16TOTAL METAL 141.58 7.98 0.00 149.56
PAPERCardboard 52.69 192.23 1.75 246.67Magazines 0.00 0.02 0.00 0.02Newspaper & Inserts 0.00 0.02 0.00 0.02Office Paper 1.26 7.80 0.00 9.06Paperboard 0.00 0.00 0.00 0.00Phone Books 0.00 0.00 0.00 0.00Mixed Paper 26.94 0.14 0.00 27.08TOTAL PAPER 80.89 200.21 1.75 282.85
PLASTICHDPE 0.00 0.04 0.00 0.04LDPE 0.00 0.00 0.00 0.00PET 0.00 0.04 0.00 0.04PP 0.00 0.00 0.00 0.00PS 0.00 0.00 0.00 0.00Vinyl 0.00 0.00 0.00 0.00Commingled PET & HDPE 0.00 0.00 0.00 0.00Mixed Plastic 18.41 1.58 0.00 19.99TOTAL PLASTIC 18.41 1.66 0.00 20.07
ORGANICS Food Waste 0.00 0.01 0.00 0.01 Yard Trimmings (for use as boiler fuel) 0.00 0.00 0.00 0.00 Yard Trimmings (recycled into compost) 0.00 0.00 0.00 0.00 Yard Trimmings (recycled into mulch) 1,789.00 0.01 0.00 1,789.01 TOTAL ORGANICS 1,789.00 0.02 0.00 1,789.02
BANNED ITEMSAppliances 23.33 0.66 0.00 23.99Electronics 91.66 0.82 0.00 92.48Lead-acid Batteries (automobiles, trucks, motorcycles – small sealed lead-acid batteries)
19.09 13.87 0.00 32.96
Tires (automobiles, trucks, motorcycles) 303.26 0.39 0.00 303.65Used Motor Oil (automobiles, trucks, motorcycles) 19.71 0.00 0.00 19.71
TOTAL BANNED ITEMS 457.05 15.74 0.00 472.79MISCELLANEOUS ITEMS
Antifreeze 0.22 0.15 0.00 0.37 Carpet 0.00 0.00 0.00 0.00 Carpet Padding 0.00 0.00 0.00 0.00 Cooking Oil/Grease 0.00 0.03 0.00 0.03 Fluorescent Bulbs 0.00 0.03 0.03 0.06 Household Hazardous Materials 0.00 0.00 0.00 0.00 Inkjet/Toner Cartridges 0.00 0.13 0.00 0.13 Mattresses & Box Springs 0.00 0.01 0.00 0.01 Paint 0.00 0.00 0.00 0.00 Rechargeable Batteries 0.00 0.02 0.00 0.02 Textiles (recycled – not donated for reuse) 0.00 0.01 0.00 0.01 Used Oil Filters 1.70 0.07 0.00 1.77 Wood Packaging (pallets, crates, barrels) 0.00 0.05 0.00 0.05 Items Not Listed Above 0.00 0.12 0.00 0.12 TOTAL MISCELLANEOUS 1.92 0.62 0.03 2.57
COMMINGLED RECYCLABLESTOTAL COMMINGLED RECYCLABLES 0.00 16.88 0.00 16.88TOTAL FOR ALL 2,488.85 243.35 1.78 2,733.98

South Carolina Solid Waste Management Annual Report for Fiscal Year 2016 65
HORRY COUNTYTABLE 8.56: Horry County MSW SummaryPOPULATION DROP-OFF
CENTERSCURBSIDE
PROGRAMSRECYCLING RATE
(PERCENT)RECYCLED
(P/P/D)RECYCLED
(TONS)DISPOSED
(P/P/D)DISPOSED
(TONS)309,199 28 6 30.28 1.99 112,286.08 4.58 258,519
TABLE 8.57: Horry County MSW Recycling Data in TonsCOMMODITY RESIDENTIAL COMMERCIAL/
INSTITUTIONALINDUSTRIAL
(OFFICE/PACKAGING) TOTAL
GLASSContainers & Packaging - Brown 0.00 0.10 0.00 0.10Containers & Packaging - Clear 0.00 0.11 0.00 0.11Containers & Packaging - Green 0.00 0.04 0.00 0.04Containers & Packaging - Mixed 807.76 0.34 0.00 808.10TOTAL GLASS 807.76 0.59 0.00 808.35
METALAluminum Cans 161.42 285.25 1.50 448.17Ferrous, Magnetic 0.00 9,974.60 1,221.51 11,196.11Non-ferrous, Non-magnetic 0.00 162.00 1,687.56 1,849.56Steel Cans 403.58 17.36 0.00 420.94Mixed Scrap Metal 3,582.68 7,098.83 0.00 10,681.51TOTAL METAL 4,147.68 17,538.04 2,910.57 24,596.29
PAPERCardboard 6,538.74 16,296.67 17.83 22,853.24Magazines 0.00 14.04 0.50 14.54Newspaper & Inserts 4,910.43 291.13 0.00 5,201.56Office Paper 482.08 2,044.51 1.00 2,527.59Paperboard 0.00 0.58 0.00 0.58Phone Books 0.00 10.12 0.20 10.32Mixed Paper 0.00 639.35 0.70 640.05TOTAL PAPER 11,931.25 19,296.40 20.23 31,247.88
PLASTICHDPE 313.63 18.23 0.00 331.86LDPE 0.00 260.82 0.00 260.82PET 619.95 19.16 0.00 639.11PP 0.00 0.00 0.00 0.00PS 0.00 0.00 0.00 0.00Vinyl 0.00 0.00 0.00 0.00Commingled PET & HDPE 0.00 22.00 0.00 22.00Mixed Plastic 334.55 14.61 5.54 354.7TOTAL PLASTIC 1,268.13 334.82 5.54 1,608.49
ORGANICS Food Waste 235.74 108.85 0.00 344.59 Yard Trimmings (for use as boiler fuel) 0.00 0.00 0.00 0.00 Yard Trimmings (recycled into compost) 37,027.14 86.96 0.00 37,114.10 Yard Trimmings (recycled into mulch) 0.00 2.16 0.00 2.16 TOTAL ORGANICS 37,262.88 197.97 0.00 37,460.85
BANNED ITEMSAppliances 0.00 1.32 0.00 1.32Electronics 1,114.80 64.23 0.25 1,179.28Lead-acid Batteries (automobiles, trucks, motorcycles – small sealed lead-acid batteries)
275.54 1,452.32 0.00 1,727.86
Tires (automobiles, trucks, motorcycles) 4,238.03 1,408.98 0.00 5,647.01Used Motor Oil (automobiles, trucks, motorcycles) 147.40 0.00 0.00 147.40
TOTAL BANNED ITEMS 6,890.57 2,991.08 0.50 8,702.87MISCELLANEOUS ITEMS
Antifreeze 2.05 1,533.20 0.00 1,535.25 Carpet 285.24 104.23 0.00 389.47 Carpet Padding 0.00 207.36 0.00 207.36 Cooking Oil/Grease 1.68 984.36 0.00 986.04 Fluorescent Bulbs 0.00 5.07 2.20 7.27 Household Hazardous Materials 0.00 0.00 0.00 0.00 Inkjet/Toner Cartridges 0.00 4.85 0.00 4.85 Mattresses & Box Springs 18.87 0.01 0.00 18.88 Paint 65.05 0.16 0.09 65.30 Rechargeable Batteries 15.81 61.02 0.00 76.83 Textiles (recycled – not donated for reuse) 156.13 1,362.61 0.00 1,518.74 Used Oil Filters 0.00 108.65 0.00 108.65 Wood Packaging (pallets, crates, barrels) 0.00 1,047.46 1.20 1,048.66 Items Not Listed Above 0.00 5.88 0.00 5.88 TOTAL MISCELLANEOUS 544.83 5,424.85 3.49 5,973.17
COMMINGLED RECYCLABLESTOTAL COMMINGLED RECYCLABLES 0.00 1,888.17 0.00 1,888.17TOTAL FOR ALL 61,738.30 47,607.69 2,940.09 112,286.08
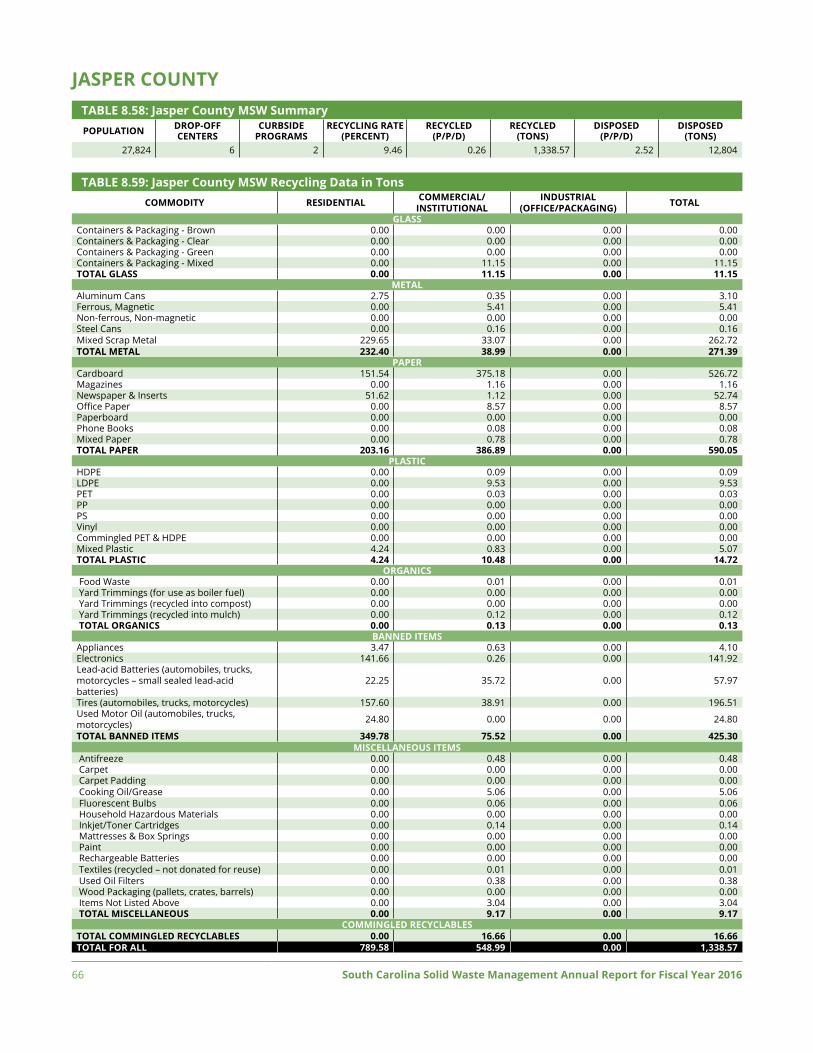
66 South Carolina Solid Waste Management Annual Report for Fiscal Year 2016
JASPER COUNTYTABLE 8.58: Jasper County MSW SummaryPOPULATION DROP-OFF
CENTERSCURBSIDE
PROGRAMSRECYCLING RATE
(PERCENT)RECYCLED
(P/P/D)RECYCLED
(TONS)DISPOSED
(P/P/D)DISPOSED
(TONS)27,824 6 2 9.46 0.26 1,338.57 2.52 12,804
TABLE 8.59: Jasper County MSW Recycling Data in TonsCOMMODITY RESIDENTIAL COMMERCIAL/
INSTITUTIONALINDUSTRIAL
(OFFICE/PACKAGING) TOTAL
GLASSContainers & Packaging - Brown 0.00 0.00 0.00 0.00Containers & Packaging - Clear 0.00 0.00 0.00 0.00Containers & Packaging - Green 0.00 0.00 0.00 0.00Containers & Packaging - Mixed 0.00 11.15 0.00 11.15TOTAL GLASS 0.00 11.15 0.00 11.15
METALAluminum Cans 2.75 0.35 0.00 3.10Ferrous, Magnetic 0.00 5.41 0.00 5.41Non-ferrous, Non-magnetic 0.00 0.00 0.00 0.00Steel Cans 0.00 0.16 0.00 0.16Mixed Scrap Metal 229.65 33.07 0.00 262.72TOTAL METAL 232.40 38.99 0.00 271.39
PAPERCardboard 151.54 375.18 0.00 526.72Magazines 0.00 1.16 0.00 1.16Newspaper & Inserts 51.62 1.12 0.00 52.74Office Paper 0.00 8.57 0.00 8.57Paperboard 0.00 0.00 0.00 0.00Phone Books 0.00 0.08 0.00 0.08Mixed Paper 0.00 0.78 0.00 0.78TOTAL PAPER 203.16 386.89 0.00 590.05
PLASTICHDPE 0.00 0.09 0.00 0.09LDPE 0.00 9.53 0.00 9.53PET 0.00 0.03 0.00 0.03PP 0.00 0.00 0.00 0.00PS 0.00 0.00 0.00 0.00Vinyl 0.00 0.00 0.00 0.00Commingled PET & HDPE 0.00 0.00 0.00 0.00Mixed Plastic 4.24 0.83 0.00 5.07TOTAL PLASTIC 4.24 10.48 0.00 14.72
ORGANICS Food Waste 0.00 0.01 0.00 0.01 Yard Trimmings (for use as boiler fuel) 0.00 0.00 0.00 0.00 Yard Trimmings (recycled into compost) 0.00 0.00 0.00 0.00 Yard Trimmings (recycled into mulch) 0.00 0.12 0.00 0.12 TOTAL ORGANICS 0.00 0.13 0.00 0.13
BANNED ITEMSAppliances 3.47 0.63 0.00 4.10Electronics 141.66 0.26 0.00 141.92Lead-acid Batteries (automobiles, trucks, motorcycles – small sealed lead-acid batteries)
22.25 35.72 0.00 57.97
Tires (automobiles, trucks, motorcycles) 157.60 38.91 0.00 196.51Used Motor Oil (automobiles, trucks, motorcycles) 24.80 0.00 0.00 24.80
TOTAL BANNED ITEMS 349.78 75.52 0.00 425.30MISCELLANEOUS ITEMS
Antifreeze 0.00 0.48 0.00 0.48 Carpet 0.00 0.00 0.00 0.00 Carpet Padding 0.00 0.00 0.00 0.00 Cooking Oil/Grease 0.00 5.06 0.00 5.06 Fluorescent Bulbs 0.00 0.06 0.00 0.06 Household Hazardous Materials 0.00 0.00 0.00 0.00 Inkjet/Toner Cartridges 0.00 0.14 0.00 0.14 Mattresses & Box Springs 0.00 0.00 0.00 0.00 Paint 0.00 0.00 0.00 0.00 Rechargeable Batteries 0.00 0.00 0.00 0.00 Textiles (recycled – not donated for reuse) 0.00 0.01 0.00 0.01 Used Oil Filters 0.00 0.38 0.00 0.38 Wood Packaging (pallets, crates, barrels) 0.00 0.00 0.00 0.00 Items Not Listed Above 0.00 3.04 0.00 3.04 TOTAL MISCELLANEOUS 0.00 9.17 0.00 9.17
COMMINGLED RECYCLABLESTOTAL COMMINGLED RECYCLABLES 0.00 16.66 0.00 16.66TOTAL FOR ALL 789.58 548.99 0.00 1,338.57

South Carolina Solid Waste Management Annual Report for Fiscal Year 2016 67
KERSHAW COUNTYTABLE 8.60: Kershaw County MSW SummaryPOPULATION DROP-OFF
CENTERSCURBSIDE
PROGRAMSRECYCLING RATE
(PERCENT)RECYCLED
(P/P/D)RECYCLED
(TONS)DISPOSED
(P/P/D)DISPOSED
(TONS)63,603 11 1 20.33 0.73 8,529.85 2.88 33,432
TABLE 8.61: Kershaw County MSW Recycling Data in TonsCOMMODITY RESIDENTIAL COMMERCIAL/
INSTITUTIONALINDUSTRIAL
(OFFICE/PACKAGING) TOTAL
GLASSContainers & Packaging - Brown 0.00 0.00 0.00 0.00Containers & Packaging - Clear 0.00 0.00 0.00 0.00Containers & Packaging - Green 0.00 0.00 0.00 0.00Containers & Packaging - Mixed 11.62 0.01 0.00 11.63TOTAL GLASS 11.62 0.01 0.00 11.63
METALAluminum Cans 18.45 8.07 0.00 26.52Ferrous, Magnetic 0.00 17.50 0.00 17.50Non-ferrous, Non-magnetic 0.00 0.00 0.00 0.00Steel Cans 0.00 18.75 0.00 18.75Mixed Scrap Metal 0.00 56.74 0.00 56.74TOTAL METAL 18.45 101.06 0.00 119.51
PAPERCardboard 51.46 1,253.80 0.00 1,305.26Magazines 0.00 0.00 0.00 0.00Newspaper & Inserts 0.00 0.00 0.00 0.00Office Paper 1.02 1.18 0.00 2.20Paperboard 0.00 0.00 0.00 0.00Phone Books 0.00 0.00 0.00 0.00Mixed Paper 0.00 34.19 0.00 34.19TOTAL PAPER 52.48 1,289.17 0.00 1,341.65
PLASTICHDPE 100.01 0.07 0.00 100.08LDPE 0.00 3.68 0.00 3.68PET 0.00 0.03 0.00 0.03PP 0.00 0.00 0.00 0.00PS 0.00 0.00 0.00 0.00Vinyl 0.00 0.00 0.00 0.00Commingled PET & HDPE 0.00 0.00 0.00 0.00Mixed Plastic 0.00 9.70 0.00 9.70TOTAL PLASTIC 100.01 13.48 0.00 113.49
ORGANICS Food Waste 0.00 0.01 0.00 0.01 Yard Trimmings (for use as boiler fuel) 0.00 0.00 0.00 0.00 Yard Trimmings (recycled into compost) 0.00 0.00 0.00 0.00 Yard Trimmings (recycled into mulch) 5,065.00 0.00 0.00 5,065.00 TOTAL ORGANICS 5,065.00 0.01 0.00 5,065.01
BANNED ITEMSAppliances 87.98 0.09 0.00 88.07Electronics 723.24 0.22 0.00 723.46Lead-acid Batteries (automobiles, trucks, motorcycles – small sealed lead-acid batteries)
49.55 70.73 0.00 120.28
Tires (automobiles, trucks, motorcycles) 649.62 33.72 0.00 683.34Used Motor Oil (automobiles, trucks, motorcycles) 69.20 0.00 0.00 69.20
TOTAL BANNED ITEMS 1,579.59 107.76 0.00 1,684.35MISCELLANEOUS ITEMS
Antifreeze 2.50 0.15 0.00 2.65 Carpet 0.00 0.00 0.00 0.00 Carpet Padding 0.00 0.00 0.00 0.00 Cooking Oil/Grease 0.00 2.96 0.00 2.96 Fluorescent Bulbs 0.00 0.12 0.00 0.12 Household Hazardous Materials 0.00 0.00 0.00 0.00 Inkjet/Toner Cartridges 0.00 0.11 0.00 0.11 Mattresses & Box Springs 0.00 0.00 0.00 0.00 Paint 0.00 0.00 0.00 0.00 Rechargeable Batteries 0.00 0.17 0.00 0.17 Textiles (recycled – not donated for reuse) 0.00 8.06 0.00 8.06 Used Oil Filters 0.20 1.67 0.00 1.87 Wood Packaging (pallets, crates, barrels) 0.00 117.05 0.00 117.05 Items Not Listed Above 0.00 0.11 0.00 0.11 TOTAL MISCELLANEOUS 2.70 130.40 0.00 133.10
COMMINGLED RECYCLABLESTOTAL COMMINGLED RECYCLABLES 28.53 32.58 0.00 61.11TOTAL FOR ALL 6,858.38 1,671.46 0.00 8,529.84

68 South Carolina Solid Waste Management Annual Report for Fiscal Year 2016
LANCASTER COUNTYTABLE 8.62: Lancaster County MSW SummaryPOPULATION DROP-OFF
CENTERSCURBSIDE
PROGRAMSRECYCLING RATE
(PERCENT)RECYCLED
(P/P/D)RECYCLED
(TONS)DISPOSED
(P/P/D)DISPOSED
(TONS)85,842 12 1 11.07 0.30 4,663.48 2.39 37,468
TABLE 8.63: Lancaster County MSW Recycling Data in TonsCOMMODITY RESIDENTIAL COMMERCIAL/
INSTITUTIONALINDUSTRIAL
(OFFICE/PACKAGING) TOTAL
GLASSContainers & Packaging - Brown 0.00 0.09 0.00 0.09Containers & Packaging - Clear 0.00 0.07 0.00 0.07Containers & Packaging - Green 0.00 0.04 0.00 0.04Containers & Packaging - Mixed 0.00 0.04 0.00 0.04TOTAL GLASS 0.00 0.24 0.00 0.24
METALAluminum Cans 0.00 3.35 0.05 3.40Ferrous, Magnetic 0.00 2.11 0.00 2.11Non-ferrous, Non-magnetic 0.00 0.00 0.00 0.00Steel Cans 0.00 0.15 0.00 0.15Mixed Scrap Metal 69.84 50.73 0.00 120.57TOTAL METAL 69.84 56.34 0.05 126.23
PAPERCardboard 0.00 1,555.87 0.00 1,555.87Magazines 0.00 0.02 0.00 0.02Newspaper & Inserts 0.00 0.02 0.00 0.02Office Paper 0.00 2.05 0.00 2.05Paperboard 0.00 0.00 0.00 0.00Phone Books 0.00 0.01 0.00 0.01Mixed Paper 0.00 0.38 9.14 9.52TOTAL PAPER 0.00 1,558.35 9.14 1,567.49
PLASTICHDPE 0.00 0.46 0.00 0.46LDPE 0.00 30.42 0.00 30.42PET 0.00 0.30 0.00 0.30PP 0.00 0.00 0.00 0.00PS 0.00 0.00 0.00 0.00Vinyl 0.00 0.00 0.00 0.00Commingled PET & HDPE 0.00 0.00 0.00 0.00Mixed Plastic 0.00 8.09 89.66 97.75TOTAL PLASTIC 0.00 39.27 89.66 128.93
ORGANICS Food Waste 0.00 0.01 0.00 0.01 Yard Trimmings (for use as boiler fuel) 0.00 0.00 0.00 0.00 Yard Trimmings (recycled into compost) 0.00 0.00 0.00 0.00 Yard Trimmings (recycled into mulch) 0.00 0.01 0.00 0.01 TOTAL ORGANICS 0.00 0.02 0.00 0.02
BANNED ITEMSAppliances 0.00 0.12 0.00 0.12Electronics 655.37 0.22 0.00 655.59Lead-acid Batteries (automobiles, trucks, motorcycles – small sealed lead-acid batteries)
81.93 105.70 0.00 187.63
Tires (automobiles, trucks, motorcycles) 867.19 18.76 0.00 885.95Used Motor Oil (automobiles, trucks, motorcycles) 53.11 0.00 0.00 53.11
TOTAL BANNED ITEMS 1,657.60 124.80 0.00 1,782.40MISCELLANEOUS ITEMS
Antifreeze 1.00 0.33 0.00 1.33 Carpet 0.00 0.00 0.00 0.00 Carpet Padding 0.00 0.00 0.00 0.00 Cooking Oil/Grease 0.50 7.63 0.00 8.13 Fluorescent Bulbs 0.00 0.05 0.00 0.05 Household Hazardous Materials 0.00 0.00 0.00 0.00 Inkjet/Toner Cartridges 0.00 0.11 0.00 0.11 Mattresses & Box Springs 0.00 0.01 0.00 0.01 Paint 5.23 0.00 0.00 5.23 Rechargeable Batteries 0.00 2.73 0.00 2.73 Textiles (recycled – not donated for reuse) 0.00 0.01 0.00 0.01 Used Oil Filters 27.06 0.44 0.00 27.50 Wood Packaging (pallets, crates, barrels) 0.00 118.2 81.71 199.91 Items Not Listed Above 0.00 0.14 0.00 0.14 TOTAL MISCELLANEOUS 33.79 129.65 81.71 245.15
COMMINGLED RECYCLABLESTOTAL COMMINGLED RECYCLABLES 735.54 77.48 0.00 813.02TOTAL FOR ALL 2,496.77 1,996.15 180.55 4,673.47

South Carolina Solid Waste Management Annual Report for Fiscal Year 2016 69
LAURENS COUNTYTABLE 8.64: Laurens County MSW SummaryPOPULATION DROP-OFF
CENTERSCURBSIDE
PROGRAMSRECYCLING RATE
(PERCENT)RECYCLED
(P/P/D)RECYCLED
(TONS)DISPOSED
(P/P/D)DISPOSED
(TONS)66,623 11 0 23.14 0.80 9,740.34 2.66 32,357
TABLE 8.65: Laurens County MSW Recycling Data in TonsCOMMODITY RESIDENTIAL COMMERCIAL/
INSTITUTIONALINDUSTRIAL
(OFFICE/PACKAGING) TOTAL
GLASSContainers & Packaging - Brown 8.46 0.09 0.00 8.55Containers & Packaging - Clear 54.09 0.07 0.00 54.16Containers & Packaging - Green 0.00 0.04 0.00 0.04Containers & Packaging - Mixed 0.00 0.04 0.00 0.04TOTAL GLASS 62.55 0.24 0.00 62.79
METALAluminum Cans 6.09 53.90 0.00 59.99Ferrous, Magnetic 164.07 4,451.40 0.00 4,615.47Non-ferrous, Non-magnetic 0.00 0.00 0.00 0.00Steel Cans 0.00 0.15 0.00 0.15Mixed Scrap Metal 0.00 732.49 0.00 732.49TOTAL METAL 170.16 5,237.94 0.00 5,408.10
PAPERCardboard 2,153.25 479.76 0.00 2,633.01Magazines 0.00 0.02 0.00 0.02Newspaper & Inserts 64.02 0.02 0.00 64.04Office Paper 10.17 1.45 0.00 11.62Paperboard 0.06 0.00 0.00 0.06Phone Books 0.00 0.00 0.00 0.00Mixed Paper 141.05 1.30 2.00 144.35TOTAL PAPER 2,368.55 482.55 2.00 2,853.10
PLASTICHDPE 0.00 0.12 0.00 0.12LDPE 0.00 26.73 0.00 26.73PET 0.00 0.09 0.00 0.09PP 0.00 0.00 0.00 0.00PS 0.00 0.00 0.00 0.00Vinyl 0.00 0.00 0.00 0.00Commingled PET & HDPE 0.00 0.00 0.00 0.00Mixed Plastic 70.48 0.53 0.00 71.01TOTAL PLASTIC 70.48 27.47 0.00 97.95
ORGANICS Food Waste 0.00 0.01 0.00 0.01 Yard Trimmings (for use as boiler fuel) 0.00 0.00 0.00 0.00 Yard Trimmings (recycled into compost) 0.00 0.00 0.00 0.00 Yard Trimmings (recycled into mulch) 185.59 0.01 0.00 185.60 TOTAL ORGANICS 185.59 0.02 0.00 185.61
BANNED ITEMSAppliances 0.00 0.12 0.00 0.12Electronics 177.49 5.23 0.00 182.72Lead-acid Batteries (automobiles, trucks, motorcycles – small sealed lead-acid batteries)
56.48 123.87 0.00 180.35
Tires (automobiles, trucks, motorcycles) 631.00 19.40 0.00 650.40Used Motor Oil (automobiles, trucks, motorcycles) 54.82 0.00 0.00 54.82
TOTAL BANNED ITEMS 919.79 148.62 0.00 1,068.41MISCELLANEOUS ITEMS
Antifreeze 0.00 0.49 0.00 0.49 Carpet 0.00 0.00 0.00 0.00 Carpet Padding 0.00 0.00 0.00 0.00 Cooking Oil/Grease 0.00 5.49 0.00 5.49 Fluorescent Bulbs 0.00 0.11 0.54 0.65 Household Hazardous Materials 0.00 0.00 0.00 0.00 Inkjet/Toner Cartridges 0.00 0.11 0.20 0.31 Mattresses & Box Springs 0.00 0.01 0.00 0.01 Paint 0.00 0.00 0.00 0.00 Rechargeable Batteries 0.00 0.07 0.00 0.07 Textiles (recycled – not donated for reuse) 0.00 0.01 0.00 0.01 Used Oil Filters 0.00 0.38 0.00 0.38 Wood Packaging (pallets, crates, barrels) 17.00 0.36 0.00 17.36 Items Not Listed Above 0.00 0.93 0.00 0.93 TOTAL MISCELLANEOUS 17.00 7.96 0.74 25.70
COMMINGLED RECYCLABLESTOTAL COMMINGLED RECYCLABLES 0.00 38.68 0.00 38.68TOTAL FOR ALL 3,794.12 5,943.47 2.74 9,740.33

70 South Carolina Solid Waste Management Annual Report for Fiscal Year 2016
LEE COUNTYTABLE 8.66: Lee County MSW SummaryPOPULATION DROP-OFF
CENTERSCURBSIDE
PROGRAMSRECYCLING RATE
(PERCENT)RECYCLED
(P/P/D)RECYCLED
(TONS)DISPOSED
(P/P/D)DISPOSED
(TONS)17,896 9 0 13.15 0.39 1,261.62 2.55 8,334
TABLE 8.67: Lee County MSW Recycling Data in TonsCOMMODITY RESIDENTIAL COMMERCIAL/
INSTITUTIONALINDUSTRIAL
(OFFICE/PACKAGING) TOTAL
GLASSContainers & Packaging - Brown 0.00 0.09 0.00 0.09Containers & Packaging - Clear 0.00 0.07 0.00 0.07Containers & Packaging - Green 0.00 0.04 0.00 0.04Containers & Packaging - Mixed 0.00 0.03 0.00 0.03TOTAL GLASS 0.00 0.23 0.00 0.23
METALAluminum Cans 0.98 1.17 0.00 2.15Ferrous, Magnetic 0.00 0.11 0.00 0.11Non-ferrous, Non-magnetic 0.00 0.00 24.24 24.24Steel Cans 0.00 0.15 0.00 0.15Mixed Scrap Metal 61.47 0.69 0.00 62.16TOTAL METAL 62.45 2.12 24.24 88.81
PAPERCardboard 0.00 148.31 289.8 438.11Magazines 0.00 0.02 0.00 0.02Newspaper & Inserts 6.81 0.02 0.00 6.83Office Paper 0.00 1.78 0.23 2.01Paperboard 0.00 0.00 0.00 0.00Phone Books 0.00 0.00 0.00 0.00Mixed Paper 0.00 0.04 2.13 2.17TOTAL PAPER 6.81 150.17 292.16 449.14
PLASTICHDPE 3.36 0.04 0.00 3.40LDPE 0.00 0.00 0.00 0.00PET 1.32 0.04 0.00 1.36PP 0.00 0.00 0.00 0.00PS 0.00 0.00 0.00 0.00Vinyl 0.00 0.00 0.00 0.00Commingled PET & HDPE 0.00 0.00 0.00 0.00Mixed Plastic 0.59 0.43 81.84 82.86TOTAL PLASTIC 5.27 0.51 81.84 87.62
ORGANICS Food Waste 0.00 0.01 0.00 0.01 Yard Trimmings (for use as boiler fuel) 0.00 0.00 0.00 0.00 Yard Trimmings (recycled into compost) 0.00 0.00 0.00 0.00 Yard Trimmings (recycled into mulch) 155.00 0.01 0.00 155.01 TOTAL ORGANICS 155.00 0.02 0.00 155.02
BANNED ITEMSAppliances 0.00 0.03 0.00 0.03Electronics 57.50 0.18 0.00 57.68Lead-acid Batteries (automobiles, trucks, motorcycles – small sealed lead-acid batteries)
12.24 12.25 0.00 24.49
Tires (automobiles, trucks, motorcycles) 290.60 0.00 0.00 290.60Used Motor Oil (automobiles, trucks, motorcycles) 26.01 0.00 0.00 26.01
TOTAL BANNED ITEMS 386.35 12.46 0.00 398.81MISCELLANEOUS ITEMS
Antifreeze 0.00 0.00 0.00 0.00 Carpet 0.00 0.00 0.00 0.00 Carpet Padding 0.00 0.00 0.00 0.00 Cooking Oil/Grease 0.00 0.00 0.00 0.00 Fluorescent Bulbs 0.00 0.01 0.09 0.1 Household Hazardous Materials 0.00 0.00 0.00 0.00 Inkjet/Toner Cartridges 0.00 0.02 0.00 0.02 Mattresses & Box Springs 0.00 0.01 0.00 0.01 Paint 0.00 0.00 0.00 0.00 Rechargeable Batteries 0.00 0.00 0.00 0.00 Textiles (recycled – not donated for reuse) 0.00 0.01 0.00 0.01 Used Oil Filters 3.90 0.13 0.00 4.03 Wood Packaging (pallets, crates, barrels) 0.00 0.01 0.00 0.01 Items Not Listed Above 0.00 0.06 66.34 66.40 TOTAL MISCELLANEOUS 3.90 0.25 66.43 70.58
COMMINGLED RECYCLABLESTOTAL COMMINGLED RECYCLABLES 0.00 11.41 0.00 11.41TOTAL FOR ALL 619.78 177.17 464.67 1,261.62

South Carolina Solid Waste Management Annual Report for Fiscal Year 2016 71
LEXINGTON COUNTYTABLE 8.68: Lexington County MSW SummaryPOPULATION DROP-OFF
CENTERSCURBSIDE
PROGRAMSRECYCLING RATE
(PERCENT)RECYCLED
(P/P/D)RECYCLED
(TONS)DISPOSED
(P/P/D)DISPOSED
(TONS)281,833 11 7 39.49 1.94 99,589.18 2.97 152,603
TABLE 8.69: Lexington County MSW Recycling Data in TonsCOMMODITY RESIDENTIAL COMMERCIAL/
INSTITUTIONALINDUSTRIAL
(OFFICE/PACKAGING) TOTAL
GLASSContainers & Packaging - Brown 150.24 0.25 2.00 152.49Containers & Packaging - Clear 201.41 1.01 1.00 203.42Containers & Packaging - Green 86.44 0.00 0.00 86.44Containers & Packaging - Mixed 69.28 0.66 0.00 69.94TOTAL GLASS 507.37 1.92 3.00 512.29
METALAluminum Cans 26.00 15.28 115.58 156.86Ferrous, Magnetic 0.00 128.52 15,109.58 15,238.10Non-ferrous, Non-magnetic 0.00 0.00 1,327.50 1,327.50Steel Cans 0.00 19.51 7.65 27.16Mixed Scrap Metal 779.15 3,115.67 1,437.09 5,331.91TOTAL METAL 805.15 3,278.98 17,997.41 22,081.54
PAPERCardboard 1,028.89 23,063.91 5,770.09 29,862.89Magazines 0.00 7.74 0.50 8.24Newspaper & Inserts 0.00 24.05 0.00 24.05Office Paper 76.87 2,787.68 936.15 3,800.70Paperboard 0.00 0.20 0.00 0.20Phone Books 0.00 0.10 0.00 0.10Mixed Paper 632.20 3,192.85 397.67 4,222.72TOTAL PAPER 1,737.96 29,076.53 7,104.41 37,918.90
PLASTICHDPE 0.00 160.99 28.70 189.69LDPE 0.00 164.34 146.60 310.94PET 0.00 4.01 93.30 97.31PP 0.00 0.00 0.00 0.00PS 0.00 0.00 0.00 0.00Vinyl 0.00 2.00 0.00 2.00Commingled PET & HDPE 0.00 0.00 0.00 0.00Mixed Plastic 247.43 68.16 1,027.43 1,343.02TOTAL PLASTIC 247.43 399.50 1,296.03 1,942.96
ORGANICS Food Waste 0.00 3.01 125.00 128.01 Yard Trimmings (for use as boiler fuel) 0.00 0.00 0.00 0.00 Yard Trimmings (recycled into compost) 6,682.38 28.50 0.00 6,710.88 Yard Trimmings (recycled into mulch) 1,670.59 27.00 8,304.00 10,001.59 TOTAL ORGANICS 8,352.97 58.51 8,429.00 16,840.48
BANNED ITEMSAppliances 1,820.94 0.59 87.95 1,909.48Electronics 418.03 51.95 15.09 485.07Lead-acid Batteries (automobiles, trucks, motorcycles – small sealed lead-acid batteries)
272.14 463.55 0.14 735.83
Tires (automobiles, trucks, motorcycles) 670.20 212.46 300.75 1,183.41Used Motor Oil (automobiles, trucks, motorcycles) 212.32 0.00 0.00 212.32
TOTAL BANNED ITEMS 3,393.63 728.55 403.93 4,526.11MISCELLANEOUS ITEMS
Antifreeze 40.71 5.90 0.00 46.61 Carpet 5.42 201.55 0.00 206.97 Carpet Padding 176.60 0.00 0.00 176.60 Cooking Oil/Grease 32.22 26.96 3.30 62.48 Fluorescent Bulbs 2.04 30.84 6.79 39.67 Household Hazardous Materials 17.48 0.00 0.00 17.48 Inkjet/Toner Cartridges 0.00 1.88 0.28 2.16 Mattresses & Box Springs 180.48 0.50 0.00 180.98 Paint 0.00 0.70 0.00 0.70 Rechargeable Batteries 0.00 2.54 1.24 3.78 Textiles (recycled – not donated for reuse) 36.32 20.39 14.30 71.01 Used Oil Filters 20.91 5.05 298.00 323.96 Wood Packaging (pallets, crates, barrels) 0.00 3,198.20 2,259.25 5,457.45 Items Not Listed Above 14.13 48.78 260.44 323.35 TOTAL MISCELLANEOUS 526.31 3,543.29 2,843.60 6,913.20
COMMINGLED RECYCLABLESTOTAL COMMINGLED RECYCLABLES 6,753.58 2,084.73 15.40 8,853.71TOTAL FOR ALL 22,324.40 39,172.00 38,092.79 99,589.19

72 South Carolina Solid Waste Management Annual Report for Fiscal Year 2016
MARION COUNTYTABLE 8.70: Marion County MSW SummaryPOPULATION DROP-OFF
CENTERSCURBSIDE
PROGRAMSRECYCLING RATE
(PERCENT)RECYCLED
(P/P/D)RECYCLED
(TONS)DISPOSED
(P/P/D)DISPOSED
(TONS)31,747 2 0 8.53 0.33 1,914.17 3.54 20,520
TABLE 8.71: Marion County MSW Recycling Data in TonsCOMMODITY RESIDENTIAL COMMERCIAL/
INSTITUTIONALINDUSTRIAL
(OFFICE/PACKAGING) TOTAL
GLASSContainers & Packaging - Brown 0.00 0.00 0.00 0.00Containers & Packaging - Clear 0.00 0.00 0.00 0.00Containers & Packaging - Green 0.00 0.00 0.00 0.00Containers & Packaging - Mixed 0.00 0.01 0.00 0.01TOTAL GLASS 0.00 0.01 0.00 0.01
METALAluminum Cans 0.00 1.16 0.00 1.16Ferrous, Magnetic 0.00 0.96 0.00 0.96Non-ferrous, Non-magnetic 0.00 0.00 0.00 0.00Steel Cans 0.00 0.16 0.00 0.16Mixed Scrap Metal 0.00 1.28 0.00 1.28TOTAL METAL 0.00 3.56 0.00 3.56
PAPERCardboard 21.60 388.23 10.00 409.83Magazines 0.00 0.02 0.00 0.02Newspaper & Inserts 0.00 0.00 0.00 0.00Office Paper 0.00 2.64 0.00 2.64Paperboard 0.00 0.00 0.00 0.00Phone Books 0.00 0.00 0.00 0.00Mixed Paper 0.00 0.14 0.00 0.14TOTAL PAPER 21.60 391.03 10.00 422.63
PLASTICHDPE 0.00 278.20 0.00 278.20LDPE 0.00 13.74 0.00 13.74PET 0.00 66.12 0.00 66.12PP 0.00 0.00 0.00 0.00PS 0.00 0.00 0.00 0.00Vinyl 0.00 161.00 0.00 161.00Commingled PET & HDPE 0.00 0.00 0.00 0.00Mixed Plastic 0.00 90.24 0.00 90.24TOTAL PLASTIC 0.00 609.30 0.00 609.30
ORGANICS Food Waste 0.00 0.01 0.00 0.01 Yard Trimmings (for use as boiler fuel) 0.00 0.00 0.00 0.00 Yard Trimmings (recycled into compost) 0.00 0.00 0.00 0.00 Yard Trimmings (recycled into mulch) 0.00 0.00 0.00 0.00 TOTAL ORGANICS 0.00 0.01 0.00 0.01
BANNED ITEMSAppliances 0.00 0.09 0.00 0.09Electronics 0.00 0.22 0.00 0.22Lead-acid Batteries (automobiles, trucks, motorcycles – small sealed lead-acid batteries)
24.47 60.87 0.00 85.34
Tires (automobiles, trucks, motorcycles) 189.20 13.09 0.00 202.29Used Motor Oil (automobiles, trucks, motorcycles) 63.40 0.00 0.00 63.40
TOTAL BANNED ITEMS 277.07 74.49 0.00 351.34MISCELLANEOUS ITEMS
Antifreeze 0.00 365.40 0.00 365.40 Carpet 0.00 0.00 0.00 0.00 Carpet Padding 0.00 0.00 0.00 0.00 Cooking Oil/Grease 0.00 5.34 0.00 5.34 Fluorescent Bulbs 0.00 0.08 0.00 0.08 Household Hazardous Materials 0.00 0.00 0.00 0.00 Inkjet/Toner Cartridges 0.00 0.11 0.00 0.11 Mattresses & Box Springs 0.00 0.00 0.00 0.00 Paint 0.00 0.00 0.00 0.00 Rechargeable Batteries 0.00 0.03 0.00 0.03 Textiles (recycled – not donated for reuse) 0.00 0.01 0.00 0.01 Used Oil Filters 0.00 20.63 0.00 20.63 Wood Packaging (pallets, crates, barrels) 0.00 0.05 100.00 100.05 Items Not Listed Above 0.00 0.10 0.00 0.10 TOTAL MISCELLANEOUS 0.00 391.75 100.00 491.75
COMMINGLED RECYCLABLESTOTAL COMMINGLED RECYCLABLES 35.30 0.27 0.00 35.57TOTAL FOR ALL 333.97 1,470.42 110.00 1,914.39

South Carolina Solid Waste Management Annual Report for Fiscal Year 2016 73
MARLBORO COUNTYTABLE 8.72: Marlboro County MSW SummaryPOPULATION DROP-OFF
CENTERSCURBSIDE
PROGRAMSRECYCLING RATE
(PERCENT)RECYCLED
(P/P/D)RECYCLED
(TONS)DISPOSED
(P/P/D)DISPOSED
(TONS)27,494 10 0 27.51 0.92 4,594.93 2.41 12,106
TABLE 8.73: Marlboro County MSW Recycling Data in TonsCOMMODITY RESIDENTIAL COMMERCIAL/
INSTITUTIONALINDUSTRIAL
(OFFICE/PACKAGING) TOTAL
GLASSContainers & Packaging - Brown 0.00 0.00 0.00 0.00Containers & Packaging - Clear 0.00 0.00 0.00 0.00Containers & Packaging - Green 0.00 0.00 0.00 0.00Containers & Packaging - Mixed 0.00 0.00 0.00 0.00TOTAL GLASS 0.00 0.00 0.00 0.00
METALAluminum Cans 3.15 1.15 0.00 4.30Ferrous, Magnetic 0.00 0.96 222.00 222.96Non-ferrous, Non-magnetic 0.00 0.00 0.00 0.00Steel Cans 0.00 0.16 0.00 0.16Mixed Scrap Metal 0.00 1.10 0.00 1.10TOTAL METAL 3.15 3.37 222.00 228.52
PAPERCardboard 0.00 484.67 109.00 593.67Magazines 0.00 0.21 0.00 0.21Newspaper & Inserts 0.00 0.11 0.00 0.11Office Paper 0.00 2.11 579.00 581.11Paperboard 0.00 0.00 28.60 28.60Phone Books 0.00 0.00 0.00 0.00Mixed Paper 0.00 0.10 238.80 238.90TOTAL PAPER 0.00 487.20 955.40 1,442.60
PLASTICHDPE 0.00 0.14 1.20 1.34LDPE 0.00 8.47 0.00 8.47PET 0.00 0.08 0.00 0.08PP 0.00 0.00 0.00 0.00PS 0.00 0.00 0.00 0.00Vinyl 0.00 0.00 0.00 0.00Commingled PET & HDPE 0.00 0.00 0.00 0.00Mixed Plastic 1.96 0.19 73.00 75.15TOTAL PLASTIC 1.96 8.88 74.20 85.04
ORGANICS Food Waste 0.00 0.01 0.00 0.01 Yard Trimmings (for use as boiler fuel) 0.00 0.00 0.00 0.00 Yard Trimmings (recycled into compost) 2,581.00 0.00 0.00 2,581.00 Yard Trimmings (recycled into mulch) 0.00 0.00 0.00 0.00 TOTAL ORGANICS 2,581.00 0.01 0.00 2,581.01
BANNED ITEMSAppliances 0.00 0.09 0.00 0.09Electronics 0.00 1.08 0.60 1.68Lead-acid Batteries (automobiles, trucks, motorcycles – small sealed lead-acid batteries)
20.39 23.12 1.56 45.07
Tires (automobiles, trucks, motorcycles) 157.60 0.14 0.00 157.74Used Motor Oil (automobiles, trucks, motorcycles) 5.13 0.00 0.00 5.13
TOTAL BANNED ITEMS 183.12 24.43 2.16 209.71MISCELLANEOUS ITEMS
Antifreeze 0.00 0.25 0.00 0.25 Carpet 0.00 0.00 0.00 0.00 Carpet Padding 0.00 0.00 0.00 0.00 Cooking Oil/Grease 0.00 5.30 0.00 5.30 Fluorescent Bulbs 0.00 0.09 0.10 0.19 Household Hazardous Materials 0.00 0.00 0.00 0.00 Inkjet/Toner Cartridges 0.00 0.02 0.33 0.35 Mattresses & Box Springs 0.00 0.00 0.00 0.00 Paint 0.00 0.00 0.00 0.00 Rechargeable Batteries 0.00 0.00 0.08 0.08 Textiles (recycled – not donated for reuse) 0.00 0.01 0.00 0.01 Used Oil Filters 0.00 0.20 0.63 0.83 Wood Packaging (pallets, crates, barrels) 0.00 0.00 20.00 20.00 Items Not Listed Above 0.00 0.04 21.00 21.04 TOTAL MISCELLANEOUS 0.00 5.91 42.14 48.05
COMMINGLED RECYCLABLESTOTAL COMMINGLED RECYCLABLES 0.00 0.00 0.00 0.00TOTAL FOR ALL 2,769.23 529.80 1,295.90 4,594.93

74 South Carolina Solid Waste Management Annual Report for Fiscal Year 2016
McCORMICK COUNTYTABLE 8.74: McCormick County MSW SummaryPOPULATION DROP-OFF
CENTERSCURBSIDE
PROGRAMSRECYCLING RATE
(PERCENT)RECYCLED
(P/P/D)RECYCLED
(TONS)DISPOSED
(P/P/D)DISPOSED
(TONS)9,706 4 0 27.53 0.88 1,553.44 2.31 4,089
TABLE 8.75: McCormick County MSW Recycling Data in TonsCOMMODITY RESIDENTIAL COMMERCIAL/
INSTITUTIONALINDUSTRIAL
(OFFICE/PACKAGING) TOTAL
GLASSContainers & Packaging - Brown 0.00 0.00 0.00 0.00Containers & Packaging - Clear 0.00 0.00 0.00 0.00Containers & Packaging - Green 0.00 0.00 0.00 0.00Containers & Packaging - Mixed 0.00 0.01 0.00 0.01TOTAL GLASS 0.00 0.01 0.00 0.01
METALAluminum Cans 2.21 0.39 0.00 2.60Ferrous, Magnetic 0.00 5.04 0.00 5.04Non-ferrous, Non-magnetic 0.00 0.00 0.00 0.00Steel Cans 0.00 18.75 0.00 18.75Mixed Scrap Metal 117.63 63.41 0.00 181.04TOTAL METAL 119.84 87.59 0.00 207.43
PAPERCardboard 51.45 175.92 0.00 227.37Magazines 0.00 0.00 0.00 0.00Newspaper & Inserts 22.27 0.00 0.00 22.27Office Paper 0.00 1.30 0.00 1.30Paperboard 0.00 0.00 0.00 0.00Phone Books 0.00 0.00 0.00 0.00Mixed Paper 56.97 14.69 0.00 71.66TOTAL PAPER 130.69 191.91 0.00 322.60
PLASTICHDPE 0.00 0.01 0.00 0.01LDPE 0.00 0.00 0.00 0.00PET 0.00 0.00 0.00 0.00PP 0.00 0.00 0.00 0.00PS 0.00 0.00 0.00 0.00Vinyl 0.00 0.00 0.00 0.00Commingled PET & HDPE 15.54 0.00 0.00 15.54Mixed Plastic 0.00 4.84 0.00 4.84TOTAL PLASTIC 15.54 4.85 0.00 20.39
ORGANICS Food Waste 0.00 0.01 0.00 0.01 Yard Trimmings (for use as boiler fuel) 0.00 0.00 0.00 0.00 Yard Trimmings (recycled into compost) 0.00 0.00 0.00 0.00 Yard Trimmings (recycled into mulch) 0.00 0.00 0.00 0.00 TOTAL ORGANICS 0.00 0.01 0.00 0.01
BANNED ITEMSAppliances 0.00 0.09 0.00 0.09Electronics 2.63 0.22 0.00 2.85Lead-acid Batteries (automobiles, trucks, motorcycles – small sealed lead-acid batteries)
927.60 0.45 0.00 928.05
Tires (automobiles, trucks, motorcycles) 44.77 1.40 0.00 46.17Used Motor Oil (automobiles, trucks, motorcycles) 14.14 0.00 0.00 14.14
TOTAL BANNED ITEMS 989.14 2.16 0.00 991.30MISCELLANEOUS ITEMS
Antifreeze 0.00 0.49 0.00 0.49 Carpet 0.00 0.00 0.00 0.00 Carpet Padding 0.00 0.00 0.00 0.00 Cooking Oil/Grease 0.00 0.33 0.00 0.33 Fluorescent Bulbs 0.00 0.09 0.00 0.09 Household Hazardous Materials 0.00 0.00 0.00 0.00 Inkjet/Toner Cartridges 0.00 0.11 0.00 0.11 Mattresses & Box Springs 0.00 0.00 0.00 0.00 Paint 0.00 0.00 0.00 0.00 Rechargeable Batteries 0.00 0.02 0.00 0.02 Textiles (recycled – not donated for reuse) 0.00 8.06 0.00 8.06 Used Oil Filters 0.83 0.38 0.00 1.21 Wood Packaging (pallets, crates, barrels) 0.00 0.20 0.00 0.20 Items Not Listed Above 0.00 0.92 0.00 0.92 TOTAL MISCELLANEOUS 0.83 10.60 0.00 11.43
COMMINGLED RECYCLABLESTOTAL COMMINGLED RECYCLABLES 0.00 0.27 0.00 0.27TOTAL FOR ALL 1,256.04 484.60 0.00 1,740.64

South Carolina Solid Waste Management Annual Report for Fiscal Year 2016 75
NEWBERRY COUNTYTABLE 8.76: Newberry County MSW SummaryPOPULATION DROP-OFF
CENTERSCURBSIDE
PROGRAMSRECYCLING RATE
(PERCENT)RECYCLED
(P/P/D)RECYCLED
(TONS)DISPOSED
(P/P/D)DISPOSED
(TONS)38,012 12 0 28.88 2.30 15,921.01 5.65 39,212
TABLE 8.77: Newberry County MSW Recycling Data in TonsCOMMODITY RESIDENTIAL COMMERCIAL/
INSTITUTIONALINDUSTRIAL
(OFFICE/PACKAGING) TOTAL
GLASSContainers & Packaging - Brown 0.00 0.09 0.00 0.09Containers & Packaging - Clear 0.00 0.07 0.00 0.07Containers & Packaging - Green 0.00 0.04 0.00 0.04Containers & Packaging - Mixed 81.66 0.04 0.00 81.70TOTAL GLASS 81.66 0.24 0.00 81.90
METALAluminum Cans 4.77 0.54 0.00 5.31Ferrous, Magnetic 0.00 5.15 473.09 478.24Non-ferrous, Non-magnetic 0.00 0.00 5.00 5.00Steel Cans 0.00 0.15 5.35 5.50Mixed Scrap Metal 343.27 45.64 360.46 749.37TOTAL METAL 348.04 51.48 843.9 1,243.42
PAPERCardboard 66.01 925.51 2,011.33 3,002.85Magazines 0.00 0.02 0.00 0.02Newspaper & Inserts 0.00 0.07 0.00 0.07Office Paper 0.00 15.34 22.81 38.15Paperboard 0.00 0.00 0.00 0.00Phone Books 0.00 0.00 0.00 0.00Mixed Paper 35.76 2,040.94 0.00 2,076.70TOTAL PAPER 101.77 2,981.88 2,034.14 5,117.79
PLASTICHDPE 0.00 0.29 33.56 33.85LDPE 0.00 16.64 7.99 24.63PET 0.00 0.19 0.00 0.19PP 0.00 0.00 0.00 0.00PS 0.00 0.00 0.00 0.00Vinyl 0.00 0.00 0.00 0.00Commingled PET & HDPE 27.92 0.00 0.00 27.92Mixed Plastic 0.00 2.57 413.25 415.82TOTAL PLASTIC 27.92 19.69 454.80 502.41
ORGANICS Food Waste 0.00 0.01 2,553.15 2,553.16 Yard Trimmings (for use as boiler fuel) 0.00 0.00 0.00 0.00 Yard Trimmings (recycled into compost) 0.00 0.00 0.00 0.00 Yard Trimmings (recycled into mulch) 3,347.60 0.01 0.00 3,347.61 TOTAL ORGANICS 3,347.60 0.02 2,553.15 5,900.77
BANNED ITEMSAppliances 0.00 0.12 0.00 0.12Electronics 128.04 1.67 3.11 132.82Lead-acid Batteries (automobiles, trucks, motorcycles – small sealed lead-acid batteries)
31.55 39.55 0.00 71.10
Tires (automobiles, trucks, motorcycles) 346.30 316.63 290.75 953.68Used Motor Oil (automobiles, trucks, motorcycles) 27.80 0.00 0.00 27.80
TOTAL BANNED ITEMS 533.69 357.97 293.86 1,185.52MISCELLANEOUS ITEMS
Antifreeze 0.00 0.62 0.49 1.11 Carpet 0.00 0.00 0.00 0.00 Carpet Padding 0.00 0.00 0.00 0.00 Cooking Oil/Grease 1.93 2.92 0.00 4.85 Fluorescent Bulbs 0.00 0.16 1.51 1.67 Household Hazardous Materials 0.00 0.00 0.00 0.00 Inkjet/Toner Cartridges 0.00 0.11 0.00 0.11 Mattresses & Box Springs 0.00 0.01 0.00 0.01 Paint 0.00 0.00 0.25 0.25 Rechargeable Batteries 0.00 0.10 0.16 0.25 Textiles (recycled – not donated for reuse) 0.00 0.01 0.00 0.01 Used Oil Filters 1.58 0.63 97.5 99.71 Wood Packaging (pallets, crates, barrels) 0.00 92.21 1,296.99 1,389.20 Items Not Listed Above 0.00 0.93 0.00 0.93 TOTAL MISCELLANEOUS 3.51 97.70 1,396.90 1,498.11
COMMINGLED RECYCLABLESTOTAL COMMINGLED RECYCLABLES 379.32 11.78 0.00 391.10TOTAL FOR ALL 4,823.51 3,520.75 7,576.75 15,921.01

76 South Carolina Solid Waste Management Annual Report for Fiscal Year 2016
OCONEE COUNTYTABLE 8.78: Oconee County MSW SummaryPOPULATION DROP-OFF
CENTERSCURBSIDE
PROGRAMSRECYCLING RATE
(PERCENT)RECYCLED
(P/P/D)RECYCLED
(TONS)DISPOSED
(P/P/D)DISPOSED
(TONS)75,713 12 2 24.26 1.18 16,284.21 3.68 50,828
TABLE 8.79: Oconee County MSW Recycling Data in TonsCOMMODITY RESIDENTIAL COMMERCIAL/
INSTITUTIONALINDUSTRIAL
(OFFICE/PACKAGING) TOTAL
GLASSContainers & Packaging - Brown 96.97 0.09 0.00 97.06Containers & Packaging - Clear 141.00 0.07 0.00 141.07Containers & Packaging - Green 151.75 0.04 0.00 151.79Containers & Packaging - Mixed 0.00 0.04 0.00 0.04TOTAL GLASS 389.72 0.24 0.00 389.96
METALAluminum Cans 18.75 0.36 16.89 36.00Ferrous, Magnetic 0.00 14.96 333.01 347.97Non-ferrous, Non-magnetic 0.00 0.00 50.00 50.00Steel Cans 0.00 0.16 0.00 0.16Mixed Scrap Metal 827.02 32.23 232.97 1,092.22TOTAL METAL 845.77 47.71 632.87 1,526.35
PAPERCardboard 1,077.74 3,361.11 1,950.75 6,389.60Magazines 0.00 0.02 0.00 0.02Newspaper & Inserts 210.61 0.02 150.00 360.63Office Paper 0.00 9.75 0.88 10.63Paperboard 0.00 0.00 0.00 0.00Phone Books 0.00 0.03 0.00 0.03Mixed Paper 500.58 15.26 18.79 534.63TOTAL PAPER 1,788.93 3,386.19 2,120.42 7,295.54
PLASTICHDPE 0.00 0.13 0.00 0.13LDPE 0.00 18.69 0.63 19.32PET 0.00 0.07 0.42 0.49PP 0.00 0.00 0.00 0.00PS 0.00 0.00 0.00 0.00Vinyl 0.00 0.00 0.00 0.00Commingled PET & HDPE 0.00 0.00 0.00 0.00Mixed Plastic 115.86 0.97 3.75 120.58TOTAL PLASTIC 115.86 19.86 4.80 140.52
ORGANICS Food Waste 0.00 0.01 0.00 0.01 Yard Trimmings (for use as boiler fuel) 0.00 0.00 0.00 0.00 Yard Trimmings (recycled into compost) 0.00 0.00 0.00 0.00 Yard Trimmings (recycled into mulch) 4,206.89 5.01 0.00 4,211.90 TOTAL ORGANICS 4,206.89 5.02 0.00 4,211.91
BANNED ITEMSAppliances 10.80 0.66 0.00 11.46Electronics 0.00 0.23 2.25 2.47Lead-acid Batteries (automobiles, trucks, motorcycles – small sealed lead-acid batteries)
33.29 93.08 2.42 128.79
Tires (automobiles, trucks, motorcycles) 866.96 198.50 3.68 1,069.14Used Motor Oil (automobiles, trucks, motorcycles) 198.61 0.00 0.00 198.61
TOTAL BANNED ITEMS 1,109.66 292.47 8.35 1,410.47MISCELLANEOUS ITEMS
Antifreeze 3.93 15.20 0.00 19.13 Carpet 0.00 0.00 0.00 0.00 Carpet Padding 0.00 0.00 0.00 0.00 Cooking Oil/Grease 56.52 1.66 4.84 63.02 Fluorescent Bulbs 0.00 0.04 3.43 3.47 Household Hazardous Materials 0.00 0.00 0.00 0.00 Inkjet/Toner Cartridges 1.58 0.13 1.00 2.71 Mattresses & Box Springs 0.00 0.01 0.00 0.01 Paint 0.00 0.00 0.00 0.00 Rechargeable Batteries 0.60 0.73 0.03 1.36 Textiles (recycled – not donated for reuse) 131.06 0.01 0.00 131.07 Used Oil Filters 11.70 0.88 4.37 16.95 Wood Packaging (pallets, crates, barrels) 31.75 159.06 753.61 944.42 Items Not Listed Above 38.14 1.37 72.00 111.51 TOTAL MISCELLANEOUS 275.27 179.09 839.28 1,293.65
COMMINGLED RECYCLABLESTOTAL COMMINGLED RECYCLABLES 0.00 15.81 0.00 15.81TOTAL FOR ALL 8,732.10 3,946.38 3,605.71 16,284.19

South Carolina Solid Waste Management Annual Report for Fiscal Year 2016 77
ORANGEBURG COUNTYTABLE 8.80: Orangeburg County MSW SummaryPOPULATION DROP-OFF
CENTERSCURBSIDE
PROGRAMSRECYCLING RATE
(PERCENT)RECYCLED
(P/P/D)RECYCLED
(TONS)DISPOSED
(P/P/D)DISPOSED
(TONS)89,208 21 1 15.29 0.59 9,527.03 3.24 52,788
TABLE 8.81: Orangeburg County MSW Recycling Data in TonsCOMMODITY RESIDENTIAL COMMERCIAL/
INSTITUTIONALINDUSTRIAL
(OFFICE/PACKAGING) TOTAL
GLASSContainers & Packaging - Brown 0.00 0.09 0.00 0.09Containers & Packaging - Clear 0.00 0.07 0.00 0.07Containers & Packaging - Green 0.00 0.04 0.00 0.04Containers & Packaging - Mixed 0.00 0.04 0.00 0.04TOTAL GLASS 0.00 0.24 0.00 0.24
METALAluminum Cans 0.00 1.28 0.00 1.28Ferrous, Magnetic 0.00 0.11 1,308.00 1,308.11Non-ferrous, Non-magnetic 0.00 0.00 0.00 0.00Steel Cans 0.00 0.15 0.00 0.15Mixed Scrap Metal 509.58 109.11 195.28 813.97TOTAL METAL 509.58 110.65 1503.28 2,123.51
PAPERCardboard 180.16 2,680.77 31.72 2,892.65Magazines 0.00 0.02 2.10 2.12Newspaper & Inserts 21.95 0.02 1.75 23.72Office Paper 0.00 52.28 10.45 62.73Paperboard 0.00 0.00 1.05 1.05Phone Books 0.00 0.00 0.00 0.00Mixed Paper 0.00 5.47 1.75 7.22TOTAL PAPER 202.11 2,738.56 48.82 2,989.49
PLASTICHDPE 0.55 1.09 5.60 7.24LDPE 0.00 20.23 0.00 20.23PET 0.00 0.22 4.90 5.12PP 0.00 0.00 0.00 0.00PS 0.00 0.00 0.00 0.00Vinyl 0.00 0.00 0.00 0.00Commingled PET & HDPE 0.00 0.00 0.00 0.00Mixed Plastic 0.00 201.3 0.00 201.30TOTAL PLASTIC 0.55 222.84 10.50 233.89
ORGANICS Food Waste 0.00 39.81 0.00 39.81 Yard Trimmings (for use as boiler fuel) 0.00 0.00 0.00 0.00 Yard Trimmings (recycled into compost) 0.00 0.00 0.00 0.00 Yard Trimmings (recycled into mulch) 0.00 0.01 0.00 0.01 TOTAL ORGANICS 0.00 39.82 0.00 39.82
BANNED ITEMSAppliances 0.00 0.12 0.00 0.12Electronics 170.77 0.22 1,201.00 1371.99Lead-acid Batteries (automobiles, trucks, motorcycles – small sealed lead-acid batteries)
81.55 147.34 0.00 228.89
Tires (automobiles, trucks, motorcycles) 961.52 82.51 0.00 1,044.03Used Motor Oil (automobiles, trucks, motorcycles) 105.27 0.00 0.00 105.27
TOTAL BANNED ITEMS 1,319.11 230.19 1,201.00 2,750.30MISCELLANEOUS ITEMS
Antifreeze 0.00 1.15 0.00 1.15 Carpet 0.00 0.00 0.00 0.00 Carpet Padding 0.00 0.00 0.00 0.00 Cooking Oil/Grease 0.00 20.09 0.00 20.09 Fluorescent Bulbs 0.00 2.08 1.35 3.43 Household Hazardous Materials 0.00 0.00 0.00 0.00 Inkjet/Toner Cartridges 0.00 0.11 67.4 67.51 Mattresses & Box Springs 0.00 0.01 0.00 0.01 Paint 0.00 0.25 0.00 0.25 Rechargeable Batteries 0.00 0.14 0.00 1.14 Textiles (recycled – not donated for reuse) 0.00 0.01 0.00 0.01 Used Oil Filters 0.00 0.44 2.96 3.40 Wood Packaging (pallets, crates, barrels) 0.00 998.98 56.63 1,055.61 Items Not Listed Above 0.00 0.12 164.62 164.74 TOTAL MISCELLANEOUS 0.00 1,023.38 293.96 1,317.34
COMMINGLED RECYCLABLESTOTAL COMMINGLED RECYCLABLES 0.00 37.91 34.53 72.44TOTAL FOR ALL 2,031.35 4,403.59 3,092.09 9,527.03

78 South Carolina Solid Waste Management Annual Report for Fiscal Year 2016
PICKENS COUNTYTABLE 8.82: Pickens County MSW SummaryPOPULATION DROP-OFF
CENTERSCURBSIDE
PROGRAMSRECYCLING RATE
(PERCENT)RECYCLED
(P/P/D)RECYCLED
(TONS)DISPOSED
(P/P/D)DISPOSED
(TONS)121,691 9 8 24.86 0.84 18,667.76 2.54 56,436
TABLE 8.83: Pickens County MSW Recycling Data in TonsCOMMODITY RESIDENTIAL COMMERCIAL/
INSTITUTIONALINDUSTRIAL
(OFFICE/PACKAGING) TOTAL
GLASSContainers & Packaging - Brown 68.09 0.09 0.00 68.18Containers & Packaging - Clear 77.20 0.07 0.00 77.27Containers & Packaging - Green 71.13 0.04 0.00 71.17Containers & Packaging - Mixed 0.10 49.20 0.00 49.30TOTAL GLASS 216.52 49.40 0.00 265.92
METALAluminum Cans 8.50 8.46 0.00 16.96Ferrous, Magnetic 0.00 14.96 45.11 60.07Non-ferrous, Non-magnetic 0.00 0.00 121.12 121.12Steel Cans 0.00 2.82 0.00 2.82Mixed Scrap Metal 1,586.28 144.71 7.75 1,738.74TOTAL METAL 1,594.78 170.95 173.98 1,939.71
PAPERCardboard 1,610.74 1,861.87 133.45 3,606.06Magazines 0.00 0.02 0.00 0.02Newspaper & Inserts 593.71 0.02 0.00 593.73Office Paper 0.00 170.07 0.00 170.07Paperboard 0.00 0.00 0.00 0.00Phone Books 0.00 0.03 0.00 0.03Mixed Paper 0.00 199.55 0.16 199.71TOTAL PAPER 2,204.45 2,231.56 133.61 4,569.62
PLASTICHDPE 36.20 0.34 0.00 36.54LDPE 0.00 41.81 0.00 41.81PET 40.10 0.17 0.03 40.30PP 0.00 0.00 0.00 0.00PS 0.00 0.00 0.00 0.00Vinyl 0.00 0.00 0.00 0.00Commingled PET & HDPE 21.05 0.00 0.00 21.05Mixed Plastic 0.00 59.59 8.67 68.26TOTAL PLASTIC 97.35 101.91 8.70 207.96
ORGANICS Food Waste 0.00 271.36 0.00 271.36 Yard Trimmings (for use as boiler fuel) 0.00 0.00 0.00 0.00 Yard Trimmings (recycled into compost) 0.00 1,230.59 0.00 1,230.59 Yard Trimmings (recycled into mulch) 5,377.55 5.01 0.00 5,382.56 TOTAL ORGANICS 5,377.55 1,506.96 0.00 6,884.51
BANNED ITEMSAppliances 0.00 0.66 0.00 0.66Electronics 326.14 26.51 1.20 353.86Lead-acid Batteries (automobiles, trucks, motorcycles – small sealed lead-acid batteries)
108.21 123.29 0.08 231.58
Tires (automobiles, trucks, motorcycles) 1,258.23 54.90 0.00 1,313.13Used Motor Oil (automobiles, trucks, motorcycles) 92.45 0.00 0.00 92.45
TOTAL BANNED ITEMS 1,785.03 205.36 1.28 1,991.68MISCELLANEOUS ITEMS
Antifreeze 1.20 0.70 0.00 1.90 Carpet 0.00 0.00 0.00 0.00 Carpet Padding 0.00 0.00 0.00 0.00 Cooking Oil/Grease 16.10 12.72 0.00 28.82 Fluorescent Bulbs 0.00 3.91 0.71 4.62 Household Hazardous Materials 0.00 0.00 0.00 0.00 Inkjet/Toner Cartridges 0.00 2.35 0.00 2.35 Mattresses & Box Springs 0.00 0.01 0.00 0.01 Paint 0.00 0.00 0.00 0.00 Rechargeable Batteries 0.00 0.33 0.03 0.36 Textiles (recycled – not donated for reuse) 0.00 0.01 679.05 679.06 Used Oil Filters 12.10 400.95 0.00 413.05 Wood Packaging (pallets, crates, barrels) 0.00 293.46 97.00 390.46 Items Not Listed Above 0.00 3.85 0.16 4.01 TOTAL MISCELLANEOUS 29.40 718.29 776.95 1,524.63
COMMINGLED RECYCLABLESTOTAL COMMINGLED RECYCLABLES 1,183.93 99.79 0.00 1,283.72TOTAL FOR ALL 12,489.01 5,084.23 1,094.52 18,667.76

South Carolina Solid Waste Management Annual Report for Fiscal Year 2016 79
RICHLAND COUNTYTABLE 8.84: Richland County MSW SummaryPOPULATION DROP-OFF
CENTERSCURBSIDE
PROGRAMSRECYCLING RATE
(PERCENT)RECYCLED
(P/P/D)RECYCLED
(TONS)DISPOSED
(P/P/D)DISPOSED
(TONS)407,051 9 5 24.45 1.03 76,861.13 3.20 237,489
TABLE 8.85: Richland County MSW Recycling Data in TonsCOMMODITY RESIDENTIAL COMMERCIAL/
INSTITUTIONALINDUSTRIAL
(OFFICE/PACKAGING) TOTAL
GLASSContainers & Packaging - Brown 0.38 17.75 0.00 18.13Containers & Packaging - Clear 2.09 0.02 0.00 2.11Containers & Packaging - Green 3.67 0.00 0.00 3.67Containers & Packaging - Mixed 154.47 9.28 0.05 163.80TOTAL GLASS 160.61 27.05 0.05 187.71
METALAluminum Cans 13.53 459.94 5.67 479.14Ferrous, Magnetic 14.91 5,700.00 570.82 6285.73Non-ferrous, Non-magnetic 72.84 0.00 10.69 83.53Steel Cans 0.00 19.78 93.25 113.03Mixed Scrap Metal 1,215.28 430.33 11.71 1,657.32TOTAL METAL 1,316.56 6,610.05 692.14 8,618.75
PAPERCardboard 174.29 21,024.49 76.02 21,274.80Magazines 11.10 2.52 0.00 13.62Newspaper & Inserts 164.60 1,150.94 0.00 1,315.54Office Paper 2.38 2,031.06 49.36 2,082.81Paperboard 0.00 12.68 0.00 12.68Phone Books 0.00 1,000.07 0.00 1,000.07Mixed Paper 8.45 4,965.25 9.19 4,982.89TOTAL PAPER 360.82 30,187.01 134.58 30,682.41
PLASTICHDPE 7.74 2.36 0.00 10.10LDPE 0.00 123.57 0.00 123.57PET 0.00 1.47 2.61 4.08PP 0.00 0.00 0.00 0.00PS 0.00 0.00 0.00 0.00Vinyl 0.00 0.00 0.00 0.00Commingled PET & HDPE 10.64 0.00 0.00 10.64Mixed Plastic 1.17 247.75 32.60 281.51TOTAL PLASTIC 19.55 375.15 35.21 429.90
ORGANICS Food Waste 0.00 0.01 0.00 0.01 Yard Trimmings (for use as boiler fuel) 0.00 0.00 0.00 0.00 Yard Trimmings (recycled into compost) 0.00 0.00 0.00 0.00 Yard Trimmings (recycled into mulch) 2,757.80 0.00 0.00 2,757.80 TOTAL ORGANICS 2,757.80 0.01 0.00 2,757.81
BANNED ITEMSAppliances 43.05 5,671.70 0.27 5,715.02Electronics 565.01 540.47 14.17 1,119.65Lead-acid Batteries (automobiles, trucks, motorcycles – small sealed lead-acid batteries)
342.57 968.37 9.47 1,320.41
Tires (automobiles, trucks, motorcycles) 3,739.50 179.99 292.32 4,211.81Used Motor Oil (automobiles, trucks, motorcycles) 122.55 0.00 0.00 122.55
TOTAL BANNED ITEMS 4,812.68 7,360.53 316.23 12,489.44MISCELLANEOUS ITEMS
Antifreeze 0.00 3.10 0.02 3.12 Carpet 18.99 0.00 0.00 18.99 Carpet Padding 13.31 0.00 0.00 13.31 Cooking Oil/Grease 9.44 37.11 0.00 46.55 Fluorescent Bulbs 0.76 8.46 2.34 11.56 Household Hazardous Materials 23.01 0.00 0.00 23.01 Inkjet/Toner Cartridges 0.19 9.58 0.01 9.78 Mattresses & Box Springs 176.95 0.00 0.00 176.95 Paint 0.00 2.34 0.00 2.34 Rechargeable Batteries 0.00 5.76 0.23 5.99 Textiles (recycled – not donated for reuse) 127.14 8.24 0.00 135.38 Used Oil Filters 3.84 3.15 105.10 112.09 Wood Packaging (pallets, crates, barrels) 0.00 807.43 46.55 853.98 Items Not Listed Above 0.00 32.43 29.19 61.62 TOTAL MISCELLANEOUS 373.63 917.60 183.44 1,474.66
COMMINGLED RECYCLABLESTOTAL COMMINGLED RECYCLABLES 19,482.74 700.18 37.52 20,220.44TOTAL FOR ALL 28,924.39 46,177.58 1,399.16 76,501.13

80 South Carolina Solid Waste Management Annual Report for Fiscal Year 2016
SALUDA COUNTYTABLE 8.86: Saluda County MSW SummaryPOPULATION DROP-OFF
CENTERSCURBSIDE
PROGRAMSRECYCLING RATE
(PERCENT)RECYCLED
(P/P/D)RECYCLED
(TONS)DISPOSED
(P/P/D)DISPOSED
(TONS)20,053 7 1 8.19 0.22 794.98 2.44 8,916
TABLE 8.87: Saluda County MSW Recycling Data in TonsCOMMODITY RESIDENTIAL COMMERCIAL/
INSTITUTIONALINDUSTRIAL
(OFFICE/PACKAGING) TOTAL
GLASSContainers & Packaging - Brown 0.00 0.00 0.00 0.00Containers & Packaging - Clear 0.00 0.00 0.00 0.00Containers & Packaging - Green 0.00 0.00 0.00 0.00Containers & Packaging - Mixed 0.00 0.01 0.00 0.01TOTAL GLASS 0.00 0.01 0.00 0.01
METALAluminum Cans 2.54 0.35 0.00 2.89Ferrous, Magnetic 0.00 5.04 0.00 5.04Non-ferrous, Non-magnetic 0.00 0.00 0.00 0.00Steel Cans 0.00 0.15 0.00 0.15Mixed Scrap Metal 218.39 24.07 0.00 242.46TOTAL METAL 220.93 29.61 0.00 250.54
PAPERCardboard 70.38 63.64 0.00 134.02Magazines 0.00 0.00 0.00 0.00Newspaper & Inserts 44.75 0.00 0.00 44.75Office Paper 0.00 1.30 0.00 1.30Paperboard 0.00 0.00 0.00 0.00Phone Books 0.00 0.00 0.00 0.00Mixed Paper 71.48 0.12 0.00 71.60TOTAL PAPER 186.61 65.06 0.00 251.67
PLASTICHDPE 0.00 0.01 0.00 0.01LDPE 0.00 0.00 0.00 0.00PET 0.00 0.00 0.00 0.00PP 0.00 0.00 0.00 0.00PS 0.00 0.00 0.00 0.00Vinyl 0.00 0.00 0.00 0.00Commingled PET & HDPE 25.13 0.00 0.00 25.13Mixed Plastic 0.00 0.06 0.00 0.06TOTAL PLASTIC 25.13 0.07 0.00 25.20
ORGANICS Food Waste 0.00 0.01 0.00 0.01 Yard Trimmings (for use as boiler fuel) 0.00 0.00 0.00 0.00 Yard Trimmings (recycled into compost) 0.00 0.00 0.00 0.00 Yard Trimmings (recycled into mulch) 0.00 0.00 0.00 0.00 TOTAL ORGANICS 0.00 0.01 0.00 0.01
BANNED ITEMSAppliances 0.00 0.09 0.00 0.09Electronics 8.34 0.22 0.00 8.56Lead-acid Batteries (automobiles, trucks, motorcycles – small sealed lead-acid batteries)
16.70 16.38 0.00 33.08
Tires (automobiles, trucks, motorcycles) 167.11 1.40 0.00 168.51Used Motor Oil (automobiles, trucks, motorcycles) 35.51 0.00 0.00 35.51
TOTAL BANNED ITEMS 236.00 18.31 0.00 245.75MISCELLANEOUS ITEMS
Antifreeze 0.00 0.49 0.00 0.49 Carpet 0.00 0.00 0.00 0.00 Carpet Padding 0.00 0.00 0.00 0.00 Cooking Oil/Grease 0.00 0.03 0.00 0.03 Fluorescent Bulbs 0.00 0.09 0.00 0.09 Household Hazardous Materials 0.00 0.00 0.00 0.00 Inkjet/Toner Cartridges 0.00 0.11 0.00 0.11 Mattresses & Box Springs 0.00 0.00 0.00 0.00 Paint 0.00 0.00 0.00 0.00 Rechargeable Batteries 0.00 0.02 0.00 0.02 Textiles (recycled – not donated for reuse) 0.00 0.00 0.00 0.00 Used Oil Filters 1.37 0.38 0.00 1.75 Wood Packaging (pallets, crates, barrels) 0.00 0.20 0.00 0.20 Items Not Listed Above 0.00 0.91 0.00 0.91 TOTAL MISCELLANEOUS 1.37 2.23 0.00 3.60
COMMINGLED RECYCLABLESTOTAL COMMINGLED RECYCLABLES 17.93 0.27 0.00 18.20TOTAL FOR ALL 679.63 115.35 0.00 794.98

South Carolina Solid Waste Management Annual Report for Fiscal Year 2016 81
SPARTANBURG COUNTYTABLE 8.88: Spartanburg County MSW SummaryPOPULATION DROP-OFF
CENTERSCURBSIDE
PROGRAMSRECYCLING RATE
(PERCENT)RECYCLED
(P/P/D)RECYCLED
(TONS)DISPOSED
(P/P/D)DISPOSED
(TONS)297,302 18 2 23.44 1.89 102,632.99 6.18 335,307
TABLE 8.89: Spartanburg County MSW Recycling Data in TonsCOMMODITY RESIDENTIAL COMMERCIAL/
INSTITUTIONALINDUSTRIAL
(OFFICE/PACKAGING) TOTAL
GLASSContainers & Packaging - Brown 0.00 0.09 0.00 0.09Containers & Packaging - Clear 0.00 0.07 0.00 0.07Containers & Packaging - Green 0.00 0.04 0.00 0.04Containers & Packaging - Mixed 47.24 1,207.22 129.23 1,383.69TOTAL GLASS 47.24 1,207.42 129.23 1,383.89
METALAluminum Cans 0.00 4.15 319.49 323.64Ferrous, Magnetic 0.00 7,072.08 4,063.29 11,135.37Non-ferrous, Non-magnetic 0.00 31.22 301.25 332.47Steel Cans 0.00 18.76 938.42 957.18Mixed Scrap Metal 1,764.67 809.55 346.68 2,920.90TOTAL METAL 1,764.67 7,935.76 5,969.12 15,669.55
PAPERCardboard 72.23 28,833.18 7,582.18 36,487.59Magazines 0.00 2.64 0.10 2.74Newspaper & Inserts 0.00 2.72 0.00 2.72Office Paper 0.00 1,007.86 0.86 1,008.72Paperboard 0.00 2.30 0.00 2.30Phone Books 0.00 2.39 0.05 2.44Mixed Paper 3,031.17 2,297.67 12,265.08 17,593.92TOTAL PAPER 3,103.40 32,148.76 19,848.27 55,100.43
PLASTICHDPE 0.00 2.03 0.00 2.03LDPE 0.00 66.04 0.00 66.04PET 0.00 5.98 0.00 5.98PP 0.00 0.00 0.00 0.00PS 0.00 0.00 0.00 0.00Vinyl 0.00 0.00 0.00 0.00Commingled PET & HDPE 0.00 0.00 0.00 0.00Mixed Plastic 0.00 988.53 1,133.46 2,121.99TOTAL PLASTIC 0.00 1,062.58 1,133.46 2,196.04
ORGANICS Food Waste 0.00 0.02 0.00 0.02 Yard Trimmings (for use as boiler fuel) 0.00 0.00 0.00 0.00 Yard Trimmings (recycled into compost) 0.00 67.79 0.00 67.79 Yard Trimmings (recycled into mulch) 4,270.00 15.84 0.00 4,285.84 TOTAL ORGANICS 4,270.00 83.65 0.00 4,353.65
BANNED ITEMSAppliances 0.00 0.15 0.00 0.15Electronics 538.83 630.19 591.34 1,760.36Lead-acid Batteries (automobiles, trucks, motorcycles – small sealed lead-acid batteries)
255.69 323.96 198.47 778.12
Tires (automobiles, trucks, motorcycles) 2,884.34 123.47 139.04 3,146.85Used Motor Oil (automobiles, trucks, motorcycles) 169.07 0.00 0.00 169.07
TOTAL BANNED ITEMS 3,847.93 1,077.77 928.85 5,854.55MISCELLANEOUS ITEMS
Antifreeze 11.10 2.43 8.38 21.91 Carpet 0.00 120.00 0.00 120.00 Carpet Padding 0.00 0.00 0.00 0.00 Cooking Oil/Grease 17.10 12.58 0.00 29.68 Fluorescent Bulbs 0.43 8.18 8.00 16.60 Household Hazardous Materials 20.75 0.00 0.00 20.75 Inkjet/Toner Cartridges 0.00 0.67 0.06 0.73 Mattresses & Box Springs 0.00 0.03 0.00 0.03 Paint 15.00 1.60 0.00 16.60 Rechargeable Batteries 0.00 2.99 3.36 6.35 Textiles (recycled – not donated for reuse) 0.00 8.06 151.02 159.08 Used Oil Filters 6.10 0.75 0.03 6.88 Wood Packaging (pallets, crates, barrels) 0.00 700.38 6,698.11 7,398.49 Items Not Listed Above 0.00 80.56 101.05 181.61 TOTAL MISCELLANEOUS 70.48 938.23 6,969.98 7,978.69
COMMINGLED RECYCLABLESTOTAL COMMINGLED RECYCLABLES 2,725.35 2,670.91 4,699.90 10,096.16TOTAL FOR ALL 15,829.07 47,125.08 39,678.8 102,632.95

82 South Carolina Solid Waste Management Annual Report for Fiscal Year 2016
SUMTER COUNTYTABLE 8.90: Sumter County MSW SummaryPOPULATION DROP-OFF
CENTERSCURBSIDE
PROGRAMSRECYCLING RATE
(PERCENT)RECYCLED
(P/P/D)RECYCLED
(TONS)DISPOSED
(P/P/D)DISPOSED
(TONS)107,480 9 1 24.51 1.00 19,556.13 3.07 60,228
TABLE 8.91: Sumter County MSW Recycling Data in TonsCOMMODITY RESIDENTIAL COMMERCIAL/
INSTITUTIONALINDUSTRIAL
(OFFICE/PACKAGING) TOTAL
GLASSContainers & Packaging - Brown 55.37 0.09 0.00 55.46Containers & Packaging - Clear 11.92 0.07 0.00 11.99Containers & Packaging - Green 55.37 0.04 0.00 55.41Containers & Packaging - Mixed 507.54 0.04 0.00 507.58TOTAL GLASS 630.20 0.24 0.00 630.44
METALAluminum Cans 116.95 6.52 0.00 123.47Ferrous, Magnetic 0.00 0.13 436.40 436.53Non-ferrous, Non-magnetic 0.00 0.00 0.00 0.00Steel Cans 97.90 0.15 5.35 103.40Mixed Scrap Metal 4,652.30 48.30 1.55 4702.15TOTAL METAL 4,867.15 55.10 443.30 5365.55
PAPERCardboard 2,867.96 1,324.34 1.90 4,194.20Magazines 0.00 0.72 0.00 0.72Newspaper & Inserts 440.02 0.62 0.00 440.64Office Paper 105.12 3.11 0.00 108.23Paperboard 0.00 0.00 0.00 0.00Phone Books 0.00 0.02 0.00 0.02Mixed Paper 1,510.60 4.00 0.50 1,515.10TOTAL PAPER 4,923.70 1,332.81 2.40 6,258.91
PLASTICHDPE 87.52 0.48 0.00 88.00LDPE 0.00 31.04 0.00 31.04PET 140.74 0.59 0.00 141.33PP 0.00 0.00 0.00 0.00PS 0.00 0.00 0.00 0.00Vinyl 0.00 0.00 0.00 0.00Commingled PET & HDPE 94.22 0.00 0.00 94.22Mixed Plastic 101.80 1.21 0.93 103.94TOTAL PLASTIC 424.28 33.32 0.93 458.53
ORGANICS Food Waste 0.00 0.01 0.00 0.01 Yard Trimmings (for use as boiler fuel) 535.90 0.00 0.00 535.90 Yard Trimmings (recycled into compost) 209.37 0.00 0.00 209.37 Yard Trimmings (recycled into mulch) 0.00 0.01 0.00 0.01 TOTAL ORGANICS 745.27 0.02 0.00 745.29
BANNED ITEMSAppliances 3,490.80 0.12 0.00 3,490.92Electronics 272.48 0.22 3.11 275.81Lead-acid Batteries (automobiles, trucks, motorcycles – small sealed lead-acid batteries)
119.71 83.39 0.00 203.10
Tires (automobiles, trucks, motorcycles) 1,252.97 45.35 290.75 1,589.07Used Motor Oil (automobiles, trucks, motorcycles) 71.52 0.00 0.00 71.52
TOTAL BANNED ITEMS 5,207.48 129.08 293.86 5,630.42MISCELLANEOUS ITEMS
Antifreeze 8.60 0.15 0.00 8.75 Carpet 0.00 0.02 0.00 0.02 Carpet Padding 0.00 0.01 0.00 0.01 Cooking Oil/Grease 8.91 2.88 0.00 11.79 Fluorescent Bulbs 5.52 0.18 0.39 6.09 Household Hazardous Materials 0.00 0.00 0.00 0.00 Inkjet/Toner Cartridges 0.88 0.12 0.00 1.00 Mattresses & Box Springs 0.00 0.01 0.00 0.01 Paint 0.00 0.01 0.00 0.01 Rechargeable Batteries 0.00 0.47 0.00 0.47 Textiles (recycled – not donated for reuse) 87.20 0.02 0.00 87.22 Used Oil Filters 13.10 0.27 97.50 110.87 Wood Packaging (pallets, crates, barrels) 0.00 218.25 19.60 237.85 Items Not Listed Above 0.00 0.37 0.81 1.18 TOTAL MISCELLANEOUS 124.21 222.76 118.30 465.27
COMMINGLED RECYCLABLESTOTAL COMMINGLED RECYCLABLES 0.00 1.72 0.00 1.72TOTAL FOR ALL 16,922.29 1,775.04 858.79 19,556.12

South Carolina Solid Waste Management Annual Report for Fiscal Year 2016 83
UNION COUNTYTABLE 8.92: Union County MSW SummaryPOPULATION DROP-OFF
CENTERSCURBSIDE
PROGRAMSRECYCLING RATE
(PERCENT)RECYCLED
(P/P/D)RECYCLED
(TONS)DISPOSED
(P/P/D)DISPOSED
(TONS)27,777 10 0 13.77 0.49 2,475.81 3.06 15,502
TABLE 8.93: Union County MSW Recycling Data in TonsCOMMODITY RESIDENTIAL COMMERCIAL/
INSTITUTIONALINDUSTRIAL
(OFFICE/PACKAGING) TOTAL
GLASSContainers & Packaging - Brown 0.00 0.00 0.00 0.00Containers & Packaging - Clear 0.00 0.00 0.00 0.00Containers & Packaging - Green 0.00 0.00 0.00 0.00Containers & Packaging - Mixed 0.00 0.31 0.00 0.31TOTAL GLASS 0.00 0.31 0.00 0.31
METALAluminum Cans 0.00 3.11 0.00 3.11Ferrous, Magnetic 0.00 5.95 0.00 5.95Non-ferrous, Non-magnetic 0.00 0.00 0.00 0.00Steel Cans 0.00 0.17 0.00 0.17Mixed Scrap Metal 0.00 8.55 0.00 8.55TOTAL METAL 0.00 17.78 0.00 17.78
PAPERCardboard 382.79 1,246.36 0.00 1,629.15Magazines 0.00 0.32 0.00 0.32Newspaper & Inserts 0.00 0.40 0.00 0.40Office Paper 8.05 10.84 0.00 18.89Paperboard 0.00 0.00 0.00 0.00Phone Books 0.00 0.07 0.00 0.07Mixed Paper 0.00 0.63 0.00 0.63TOTAL PAPER 390.84 1,258.62 0.00 1,649.46
PLASTICHDPE 0.00 0.04 0.00 0.04LDPE 0.00 2.65 0.00 2.65PET 0.00 0.02 0.00 0.02PP 0.00 0.00 0.00 0.00PS 0.00 0.00 0.00 0.00Vinyl 0.00 0.00 0.00 0.00Commingled PET & HDPE 0.00 0.00 0.00 0.00Mixed Plastic 0.00 0.20 0.00 0.20TOTAL PLASTIC 0.00 2.91 0.00 2.91
ORGANICS Food Waste 0.00 0.02 0.00 0.02 Yard Trimmings (for use as boiler fuel) 0.00 0.00 0.00 0.00 Yard Trimmings (recycled into compost) 0.00 0.00 0.00 0.00 Yard Trimmings (recycled into mulch) 0.00 10.83 0.00 10.83 TOTAL ORGANICS 0.00 10.85 0.00 10.85
BANNED ITEMSAppliances 0.00 0.66 0.00 0.66Electronics 80.40 1.45 0.00 81.85Lead-acid Batteries (automobiles, trucks, motorcycles – small sealed lead-acid batteries)
20.39 27.12 0.00 47.51
Tires (automobiles, trucks, motorcycles) 277.63 1.82 0.00 279.45Used Motor Oil (automobiles, trucks, motorcycles) 12.77 0.00 0.00 12.77
TOTAL BANNED ITEMS 391.19 31.05 0.00 422.24MISCELLANEOUS ITEMS
Antifreeze 0.00 0.33 0.00 0.33 Carpet 0.00 0.00 0.00 0.00 Carpet Padding 0.00 0.00 0.00 0.00 Cooking Oil/Grease 1.61 3.89 0.00 5.50 Fluorescent Bulbs 0.00 0.35 0.00 0.35 Household Hazardous Materials 0.00 0.00 0.00 0.00 Inkjet/Toner Cartridges 0.00 0.27 0.00 0.27 Mattresses & Box Springs 0.00 0.02 0.00 0.02 Paint 0.00 0.00 0.00 0.00 Rechargeable Batteries 0.00 0.02 0.00 0.02 Textiles (recycled – not donated for reuse) 0.00 0.01 0.00 0.01 Used Oil Filters 0.79 0.44 0.00 1.23 Wood Packaging (pallets, crates, barrels) 0.00 0.50 0.00 0.50 Items Not Listed Above 0.00 0.17 0.00 0.17 TOTAL MISCELLANEOUS 2.40 6.00 0.00 8.40
COMMINGLED RECYCLABLESTOTAL COMMINGLED RECYCLABLES 293.71 70.15 0.00 363.86TOTAL FOR ALL 1,078.14 1,397.64 0.00 2,475.78

84 South Carolina Solid Waste Management Annual Report for Fiscal Year 2016
WILLIAMSBURG COUNTYTABLE 8.94: Williamsburg County MSW SummaryPOPULATION DROP-OFF
CENTERSCURBSIDE
PROGRAMSRECYCLING RATE
(PERCENT)RECYCLED
(P/P/D)RECYCLED
(TONS)DISPOSED
(P/P/D)DISPOSED
(TONS)32,535 20 2 11.96 0.18 1,095.02 1.36 8,064
TABLE 8.95: Williamsburg County MSW Recycling Data in TonsCOMMODITY RESIDENTIAL COMMERCIAL/
INSTITUTIONALINDUSTRIAL
(OFFICE/PACKAGING) TOTAL
GLASSContainers & Packaging - Brown 0.00 0.00 0.00 0.00Containers & Packaging - Clear 0.00 0.00 0.00 0.00Containers & Packaging - Green 0.00 0.00 0.00 0.00Containers & Packaging - Mixed 0.00 0.01 0.00 0.01TOTAL GLASS 0.00 0.01 0.00 0.01
METALAluminum Cans 1.50 1.39 0.00 2.89Ferrous, Magnetic 0.00 7.21 0.00 7.21Non-ferrous, Non-magnetic 0.00 0.00 0.00 0.00Steel Cans 0.00 0.16 0.00 0.16Mixed Scrap Metal 48.90 1.28 0.00 50.18TOTAL METAL 50.40 10.04 0.00 60.44
PAPERCardboard 201.82 313.16 0.00 514.98Magazines 0.00 0.02 0.00 0.02Newspaper & Inserts 89.00 0.00 0.00 89.00Office Paper 0.00 3.62 0.00 3.62Paperboard 0.00 0.00 0.00 0.00Phone Books 0.00 0.50 0.00 0.50Mixed Paper 0.00 7.57 0.00 7.57TOTAL PAPER 290.82 324.87 0.00 615.69
PLASTICHDPE 0.00 0.01 0.00 0.01LDPE 0.00 0.00 0.00 0.00PET 0.00 0.00 0.00 0.00PP 0.00 0.00 0.00 0.00PS 0.00 0.00 0.00 0.00Vinyl 0.00 0.00 0.00 0.00Commingled PET & HDPE 0.00 0.00 0.00 0.00Mixed Plastic 0.00 0.05 0.00 0.05TOTAL PLASTIC 0.00 0.06 0.00 0.06
ORGANICS Food Waste 0.00 0.01 0.00 0.01 Yard Trimmings (for use as boiler fuel) 0.00 0.00 0.00 0.00 Yard Trimmings (recycled into compost) 0.00 0.00 0.00 0.00 Yard Trimmings (recycled into mulch) 0.00 0.00 0.00 0.00 TOTAL ORGANICS 0.00 0.01 0.00 0.01
BANNED ITEMSAppliances 0.00 0.09 0.00 0.09Electronics 140.64 0.22 0.00 140.86Lead-acid Batteries (automobiles, trucks, motorcycles – small sealed lead-acid batteries)
24.47 25.05 0.00 49.52
Tires (automobiles, trucks, motorcycles) 189.20 0.23 0.00 189.43Used Motor Oil (automobiles, trucks, motorcycles) 1.00 1.00 0.00 1.00
TOTAL BANNED ITEMS 355.31 25.59 0.00 380.90MISCELLANEOUS ITEMS
Antifreeze 0.00 0.40 0.00 0.40 Carpet 2.00 0.00 0.00 2.00 Carpet Padding 0.00 0.00 0.00 0.00 Cooking Oil/Grease 0.00 0.03 0.00 0.03 Fluorescent Bulbs 0.00 0.08 0.00 0.08 Household Hazardous Materials 0.00 0.00 0.00 0.00 Inkjet/Toner Cartridges 0.00 0.36 0.00 0.36 Mattresses & Box Springs 15.00 0.00 0.00 15.00 Paint 0.00 0.00 0.00 0.00 Rechargeable Batteries 0.00 0.02 0.00 0.02 Textiles (recycled – not donated for reuse) 0.00 0.01 0.00 0.01 Used Oil Filters 0.00 0.27 0.00 0.27 Wood Packaging (pallets, crates, barrels) 14.79 0.05 0.00 14.84 Items Not Listed Above 0.00 0.10 0.00 0.10 TOTAL MISCELLANEOUS 31.79 1.32 0.00 33.11
COMMINGLED RECYCLABLESTOTAL COMMINGLED RECYCLABLES 0.00 4.80 0.00 4.80TOTAL FOR ALL 728.32 366.70 0.00 1,095.02

South Carolina Solid Waste Management Annual Report for Fiscal Year 2016 85
YORK COUNTYTABLE 8.96: York County MSW SummaryPOPULATION DROP-OFF
CENTERSCURBSIDE
PROGRAMSRECYCLING RATE
(PERCENT)RECYCLED
(P/P/D)RECYCLED
(TONS)DISPOSED
(P/P/D)DISPOSED
(TONS)251,195 17 5 25.93 1.21 55,274.14 3.44 157,883
TABLE 8.97: York County MSW Recycling Data in TonsCOMMODITY RESIDENTIAL COMMERCIAL/
INSTITUTIONALINDUSTRIAL
(OFFICE/PACKAGING) TOTAL
GLASSContainers & Packaging - Brown 175.58 2.36 0.99 178.93Containers & Packaging - Clear 257.84 2.43 0.99 261.26Containers & Packaging - Green 162.81 1.29 0.99 165.09Containers & Packaging - Mixed 0.00 3.01 1.43 4.44TOTAL GLASS 596.23 9.08 4.40 609.71
METALAluminum Cans 19.52 14.06 107.75 141.32Ferrous, Magnetic 0.00 5.61 9,013.75 9,019.36Non-ferrous, Non-magnetic 0.94 1.50 74.81 77.25Steel Cans 52.34 0.15 58.60 111.09Mixed Scrap Metal 2,561.38 105.44 507.60 3,174.42TOTAL METAL 2,634.18 126.76 9,762.51 12,523.45
PAPERCardboard 3,475.93 4,662.10 1,516.16 9,654.19Magazines 0.00 12.00 1.10 13.10Newspaper & Inserts 576.83 7.45 0.00 584.28Office Paper 0.00 33.07 103.91 136.98Paperboard 0.00 6.09 0.03 6.12Phone Books 0.00 7.47 1.31 8.78Mixed Paper 975.17 54.91 7.88 1,037.96TOTAL PAPER 5,027.93 4,783.09 1,630.38 11,441.40
PLASTICHDPE 14.74 2.09 2.56 19.38LDPE 0.00 181.70 364.08 545.78PET 25.09 3.47 36.40 64.96PP 0.00 0.00 0.00 0.00PS 0.00 0.00 0.00 0.00Vinyl 0.00 0.99 0.08 1.07Commingled PET & HDPE 0.00 4.39 1.98 6.37Mixed Plastic 0.00 66.06 244.31 310.37TOTAL PLASTIC 39.83 258.69 649.40 947.91
ORGANICS Food Waste 0.00 2.98 0.00 2.98 Yard Trimmings (for use as boiler fuel) 0.00 0.00 0.00 0.00 Yard Trimmings (recycled into compost) 0.00 0.00 0.00 0.00 Yard Trimmings (recycled into mulch) 13,007.96 34.11 0.00 13,042.07 TOTAL ORGANICS 13,007.96 37.09 0.00 13,045.05
BANNED ITEMSAppliances 36.74 0.12 0.00 36.86Electronics 847.27 10.58 4.39 862.24Lead-acid Batteries (automobiles, trucks, motorcycles – small sealed lead-acid batteries)
213.82 238.40 56.81 509.03
Tires (automobiles, trucks, motorcycles) 2,413.98 255.93 1,217.47 3,887.38Used Motor Oil (automobiles, trucks, motorcycles) 135.49 0.00 0.00 135.49
TOTAL BANNED ITEMS 3,647.30 505.03 1,278.67 5,431.00MISCELLANEOUS ITEMS
Antifreeze 9.41 14.76 913.72 937.89 Carpet 426.40 0.00 0.00 426.40 Carpet Padding 0.00 0.00 0.00 0.00 Cooking Oil/Grease 21.55 69.56 2.59 93.70 Fluorescent Bulbs 10.95 6.00 4.10 21.05 Household Hazardous Materials 3.51 0.00 0.00 3.51 Inkjet/Toner Cartridges 0.03 7.25 3.72 11.00 Mattresses & Box Springs 0.00 0.01 0.00 0.01 Paint 82.61 1.49 15.93 100.03 Rechargeable Batteries 1.43 4.89 2.05 8.37 Textiles (recycled – not donated for reuse) 36.35 0.01 21.60 57.96 Used Oil Filters 8.45 18.47 1,230.24 1,257.16 Wood Packaging (pallets, crates, barrels) 0.00 739.85 1,612.06 2,351.91 Items Not Listed Above 0.00 0.17 18.86 19.03 TOTAL MISCELLANEOUS 600.69 862.45 3,824.87 5,288.00
COMMINGLED RECYCLABLESTOTAL COMMINGLED RECYCLABLES 4,554.64 1,376.67 56.26 5,987.57TOTAL FOR ALL 30,108.76 7,958.84 17,206.49 55,274.09

86 South Carolina Solid Waste Management Annual Report for Fiscal Year 2016
DisposalThe S.C. Solid Waste Policy and Management Act of 1991 (Act) – S.C. Code of Laws §§ 44-96-10 et seq. – and subsequent regulation (R.61-107.19) require permitted private and public solid waste landfills to annually report the amount and type of solid waste disposed of to the S.C. Department of Health and Environmental Control (DHEC).
This section focuses on disposal of both municipal solid waste (MSW) and total solid waste (TSW) as defined on page 2. As required by the Act (Section 44-96-50), the focus of this report is on MSW.
In fiscal year (FY) 2016 (July 1, 2015 to June 30, 2016) there were 378 solid waste facilities operating under the authority of 15 types of permits in South Carolina. (See Section 10 for a complete list of facilities.) Of that total number of facilities, 156 were landfills. There are three landfill classifications – each of which accepts specific material. See Table 9.1.
Key Disposal Indicators from FY16The amount of material disposed of in Class 1 landfills increased 1.5 percent (1,035 tons) in FY16 – rising to 69,241 tons. See Table 9.13 for Class 1 FY16 disposal totals by county. The amount of C&D debris and certain industrial waste disposed of in Class 2 landfills decreased by less than 1 percent (5,196 tons) to 3,062,192 tons in FY16. See Table 9.14 for a list of Class 2 landfills including permitted annual disposal, FY16 disposal and estimated remaining life.
Of the 27 Class 3 landfills, 11 are publicly owned and 16 are privately owned. (See the map on page 89.) The privately owned landfills include seven industrial landfills
(i.e., non-commercial). See Table 9.7 for a complete list of Class 3 landfills including permitted annual rate of disposal, FY16 disposal and estimated remaining life.
South Carolinians disposed of 3,231,592 tons of MSW in FY16 – an increase of 5 percent (more than 155,000 tons) from the previous FY. On average, each South Carolinian disposed
of about 3.6 pounds of MSW per day – a slight increase from the previous FY.
Import and Export of Solid Waste The amount of out-of-state solid waste disposed of in South Carolina in FY16 was 691,801 tons – an increase of 5.4 percent from the previous FY. (See Chart 9.4.) Overall, this represents about 8.2 percent of the total amount of solid waste disposed of in the state.
TABLE 9.1: S.C. Landfill Classifications
TYPENUMBER OF FACILITIES
IN FY16
MATERIAL ACCEPTED
Class 1 39 Land-clearing debris
Class 2 90Construction and demolition (C&D) debris
Class 3 27MSW, C&D debris and industrial solid waste
TABLE 9.2: S.C. Waste Disposed of by FY
FY12 FY13 FY14 FY15 FY16
MSW Disposed of in Tons 2,935,876 2,985,852 3,067,942 3,058,338 3,213,592
MSW Disposed of in p/p/d 3.4 3.5 3.5 3.5 3.6
TSW Disposed of in Tons 7,696,559 7,906,522 7,918,780 8,317,621 8,376,283
TSW Disposed of in p/p/d 9.0 9.2 9.1 9.4 9.4
SECTION
09South Carolina
disposed of 3,231,592 tons of MSW in FY16 –
an increase of 5 percent (more than 155,000
tons) from FY15.

South Carolina Solid Waste Management Annual Report for Fiscal Year 2016 87
In FY16, the vast majority of out-of-state solid waste was disposed of in three Class 3 landfills – Lee County Landfill, Richland Landfill and Upstate Regional Landfill. (See Table 9.6.) Most of the solid waste imported into South Carolina during FY16 was from North Carolina and New York. Those two states combined for 90 percent (more than 622,620 tons) of the total amount of solid waste imported to South Carolina. (See Chart 9.3 and Table 9.6.)
Also see Table 9.6 for amounts of out-of-state waste imported into the state through processing facilities. By attributing this waste to the state of origin rather than the processing facility’s county, a more accurate representation of out-of-state waste disposed of in South Carolina landfills is provided.
South Carolina exported 108,782 tons of solid waste in FY16 – a decrease of 45 percent from the previous FY (91,382 tons). This number can vary by year depending on the number of out-of-state landfills that report. Fifteen counties (Anderson, Charleston, Cherokee, Chester, Chesterfield, Darlington, Florence, Greenville, Greenwood,
Lancaster, Marlboro, Oconee, Pickens, Spartanburg and York) accounted for all of the exported waste, sent to Georgia and North Carolina landfills. (See Chart 9.5.)
IMPORTED
691,801 tonsEXPORTED
108,782 tons
CHART 9.3: Percentage of All Solid Waste Imported into South Carolina by State in FY16
CHART 9.4: Solid Waste Imported into South Carolina
CHART 9.5: Solid Waste Exported from South Carolina
FY12
FY13
FY14
FY15
FY16 691,801
655,768
691,557
666,582
689,514
TONS
FY12
FY13
FY14
FY15
FY16 108,782
200,164
163,089
148,146
84,897
TONS
OTHER STATES 1.5%
NORTH CAROLINA 59.7%
NEW YORK 30.3%
GEORGIA8.3%

88 South Carolina Solid Waste Management Annual Report for Fiscal Year 2016
TABLE 9.6: Solid Waste Imported into South Carolina in Tons in FY16
HIC
KORY
HIL
L LA
ND
FILL
Ja
sper
Cou
nty
LEE
COU
NTY
LA
ND
FILL
Lee
Coun
ty
NO
RTH
EAST
LA
ND
FILL
Ri
chla
nd C
ount
y
OA
KRID
GE
LAN
DFI
LL
Dor
ches
ter
Coun
ty
PALM
ETTO
LA
ND
FILL
Sp
arta
nbur
g Co
unty
RICH
LAN
D L
AN
DFI
LL
Rich
land
Cou
nty
THRE
E RI
VERS
SW
A1 L
AN
DFI
LL
Aik
en C
ount
y
TWIN
CH
IMN
EYS
LAN
DFI
LL
Gre
envi
lle C
ount
y
UPS
TATE
REG
ION
AL
LAN
DFI
LL
Uni
on C
ount
y
TOTA
L IM
PORT
ED
SOLI
D W
AST
E D
ISPO
SED
OF
IN
S.C
. LA
ND
FILL
S
Georgia 1,827 0 7 2,587 0 4,935 13,878 12 0 23,246
New York 0 210,065 0 0 0 3 0 0 0 210,068
North Carolina 352 942 347 1,274 12,108 124,013 0 47,576 201,675 388,287
Miscellaneous from Processing Facilities2
0 0 0 4,069 0 6,362 0 0 0 10,431
TOTAL IMPORTED WASTE DISPOSED OF IN CLASS 3 LANDFILLS
2,179 211,007 354 7,930 12,108 135,313 13,878 47,588 201,675 632,032
Total Imported Waste Disposal of in Class 1 & 2 Landfills3
0 0 0 0 0 0 0 0 0 59,769
TOTAL WASTE FROM OUT OF STATE 691,801
1. Solid Waste Authority
2. Miscellaneous from Processing Facilities represents solid waste that went through processing facilities from various states and disposed of in Class 3 landfills.
3. Waste imported from Georgia and North Carolina.
NOTE: Some totals may not add up due to rounding.
Tipping FeesThe amount charged to dispose of solid waste at a landfill – were taken from landfill reports submitted to DHEC.
While tipping fee data is incomplete (only a portion of the facilities reported tipping fees), the average tipping fee for Class 1 disposal was $21 – up $4 from the previous FY. The average tipping fee for Class 2 disposal was $28 in FY16 – up $1 from the previous FY. In addition, the average Class 3 Landfill tipping fee was $41 per ton in FY16 – up $1 from the previous FY.

South Carolina Solid Waste Management Annual Report for Fiscal Year 2016 89
1 Abbeville County Landfill
2 Bees Ferry Landfill
3 Berkeley County Landfill
4 Georgetown County Landfill
5 Greenwood County Landfill
6 Horry County SWA Landfill
7 Three Rivers SWA Landfill
8 Twin Chimneys Landfill
South Carolina’s Class 3 Landfills
in FY16
1
3
12
4
2
22
5
17
14
6
16
13
19
18
15
21
10
11 24
7
8 20
9
9 Wellford Landfill
10 Santee Cooper – Cross
11 Savannah River Site Z-Area Landfill
COMMERCIAL, PUBLICLY OWNED LANDFILLS
NON-COMMERCIAL, PRIVATELY OWNED LANDFILLS1
COMMERCIAL, PRIVATELY OWNED LANDFILLS
26 SCE&G – Williams Hwy. 52 Landfill
27 Sonoco Products
24 SCE&G – Cope
25 SCE&G – Wateree Landfill
21 Albemarle Corp. Landfill
22 CMC Landfill 1601
23 CMC Landfill 1602
18 Pepperhill Landfill
19 Richland Landfill
20 Upstate Regional Landfill
15 Northeast Landfill LLC
16 Oakridge Landfill
17 Palmetto Landfill
12 Anderson Regional Landfill
13 Hickory Hill Landfill
14 Lee County Landfill LLC
1. Non-commercial landfills are defined by regulation as facilities that only manage the solid waste generated in the course of normal operations on property under the same ownership or control as the facility itself (i.e., “on site”). For more information, see Section 10.
25
26
23
27
NON-COMMERCIAL, PUBLICLY OWNED LANDFILLS
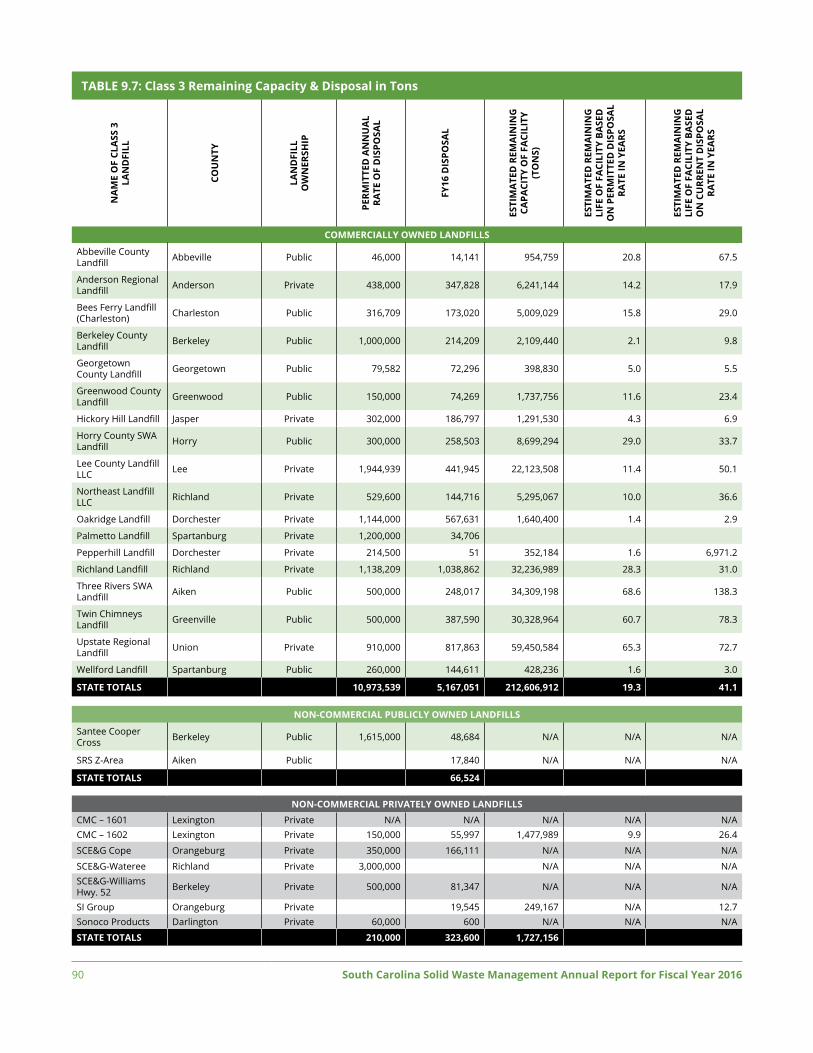
90 South Carolina Solid Waste Management Annual Report for Fiscal Year 2016
TABLE 9.7: Class 3 Remaining Capacity & Disposal in Tons
NA
ME
OF
CLA
SS 3
LA
ND
FILL
COU
NTY
LAN
DFI
LL
OW
NER
SHIP
PERM
ITTE
D A
NN
UA
L RA
TE O
F D
ISPO
SAL
FY16
DIS
POSA
L
ESTI
MA
TED
REM
AIN
ING
CA
PACI
TY O
F FA
CILI
TY
(TO
NS)
ESTI
MA
TED
REM
AIN
ING
LI
FE O
F FA
CILI
TY B
ASE
D
ON
PER
MIT
TED
DIS
POSA
L RA
TE IN
YEA
RS
ESTI
MA
TED
REM
AIN
ING
LI
FE O
F FA
CILI
TY B
ASE
D
ON
CU
RREN
T D
ISPO
SAL
RATE
IN Y
EARS
COMMERCIALLY OWNED LANDFILLS
Abbeville County Landfill Abbeville Public 46,000 14,141 954,759 20.8 67.5
Anderson Regional Landfill Anderson Private 438,000 347,828 6,241,144 14.2 17.9
Bees Ferry Landfill (Charleston) Charleston Public 316,709 173,020 5,009,029 15.8 29.0
Berkeley County Landfill Berkeley Public 1,000,000 214,209 2,109,440 2.1 9.8
Georgetown County Landfill Georgetown Public 79,582 72,296 398,830 5.0 5.5
Greenwood County Landfill Greenwood Public 150,000 74,269 1,737,756 11.6 23.4
Hickory Hill Landfill Jasper Private 302,000 186,797 1,291,530 4.3 6.9
Horry County SWA Landfill Horry Public 300,000 258,503 8,699,294 29.0 33.7
Lee County Landfill LLC Lee Private 1,944,939 441,945 22,123,508 11.4 50.1
Northeast Landfill LLC Richland Private 529,600 144,716 5,295,067 10.0 36.6
Oakridge Landfill Dorchester Private 1,144,000 567,631 1,640,400 1.4 2.9
Palmetto Landfill Spartanburg Private 1,200,000 34,706
Pepperhill Landfill Dorchester Private 214,500 51 352,184 1.6 6,971.2
Richland Landfill Richland Private 1,138,209 1,038,862 32,236,989 28.3 31.0
Three Rivers SWA Landfill Aiken Public 500,000 248,017 34,309,198 68.6 138.3
Twin Chimneys Landfill Greenville Public 500,000 387,590 30,328,964 60.7 78.3
Upstate Regional Landfill Union Private 910,000 817,863 59,450,584 65.3 72.7
Wellford Landfill Spartanburg Public 260,000 144,611 428,236 1.6 3.0
STATE TOTALS 10,973,539 5,167,051 212,606,912 19.3 41.1
NON-COMMERCIAL PUBLICLY OWNED LANDFILLS
Santee Cooper Cross Berkeley Public 1,615,000 48,684 N/A N/A N/A
SRS Z-Area Aiken Public 17,840 N/A N/A N/A
STATE TOTALS 66,524214,500 51 352,184 1.6 6,971.2
NON-COMMERCIAL PRIVATELY OWNED LANDFILLSCMC – 1601 Lexington Private N/A N/A N/A N/A N/ACMC – 1602 Lexington Private 150,000 55,997 1,477,989 9.9 26.4
SCE&G Cope Orangeburg Private 350,000 166,111 N/A N/A N/A
SCE&G-Wateree Richland Private 3,000,000 N/A N/A N/ASCE&G-Williams Hwy. 52 Berkeley Private 500,000 81,347 N/A N/A N/A
SI Group Orangeburg Private 19,545 249,167 N/A 12.7Sonoco Products Darlington Private 60,000 600 N/A N/A N/A
STATE TOTALS 210,000 323,600 1,727,156

South Carolina Solid Waste Management Annual Report for Fiscal Year 2016 91
TABLE 9.8: Class 3 Landfill Disposal Trends in Tons, FY12 to FY16
CLASS 3 LANDFILL COUNTY LANDFILL
OWNERSHIP FY12 FY13 FY14 FY15 FY16
Abbeville County Landfill Abbeville Public 17,118 16,898 13,631 13,696 14,141
Anderson Regional Landfill Anderson Private 205,313 194,645 238,576 252,574 347,828
Bees Ferry Landfill Charleston Public 147,544 148,320 151,169 173,584 173,020
Berkeley County Landfill Berkeley Public 193,151 205,235 187,726 202,496 214,209
CMC 1601 Lexington Private 100,057 49,424 0 0 0
CMC 1602 Lexington Private –– –– 27,029 57,346 55,997
Georgetown County Landfill Georgetown Public 54,511 59,860 66,603 70,141 72,296
Greenwood County Landfill Greenwood Public 65,095 73,833 61,576 72,467 74,269
Hickory Hill Landfill Jasper Private 188,677 179,367 177,410 189,961 186,797
Horry County SWA Landfill Horry Public 222,341 225,602 232,627 239,529 258,503
Lee County Landfill LLC Lee Private 475,898 424,023 471,058 428,789 441,945
Northeast Landfill LLC Richland Private 187,259 170,299 144,625 173,209 144,716
Oakridge Landfill Dorchester Private 794,144 564,571 535,444 740,505 567,631
Palmetto Landfill Spartanburg Private 291,086 272,441 219,884 125,258 34,706
Pepperhill Landfill Dorchester Private 47 49 53 43 51
Richland Landfill Richland Private 895,005 944,580 931,247 954,404 1,038,862
Santee Cooper – Cross Berkeley Public –– –– 0 0 48,684
SCE&G – Cope Orangeburg Private –– –– 226,334 97,582 166,111
SCE&G – Wateree Landfill Richland Private 88,783 159,431 133,949 254,639 ––
SCE&G – Williams Hwy. 52 Landfill Berkeley Private 46,771 80,334 63,906 63,476 81,347
SI Group Landfill Orangeburg Private 20,249 3,430 17,056 15,888 19,545
Sonoco Products Darlington Private –– –– –– 0 600
Savannah River Site Z-Area Landfill
Aiken Public 11,633 24,685 9,845 14,044 17,840
Three Rivers SWA Landfill Aiken Public 267,144 236,917 239,697 254,936 248,017
Twin Chimneys Landfill Greenville Public 228,793 260,528 340,714 334,095 387,590
Upstate Regional Landfill Union Private 793,012 712,390 690,772 758,132 817,863
Wellford Landfill Spartanburg Public 110,958 112,856 117,022 126,523 144,611
NOTE: This table only includes Class 3 landfills that were active in FY16.
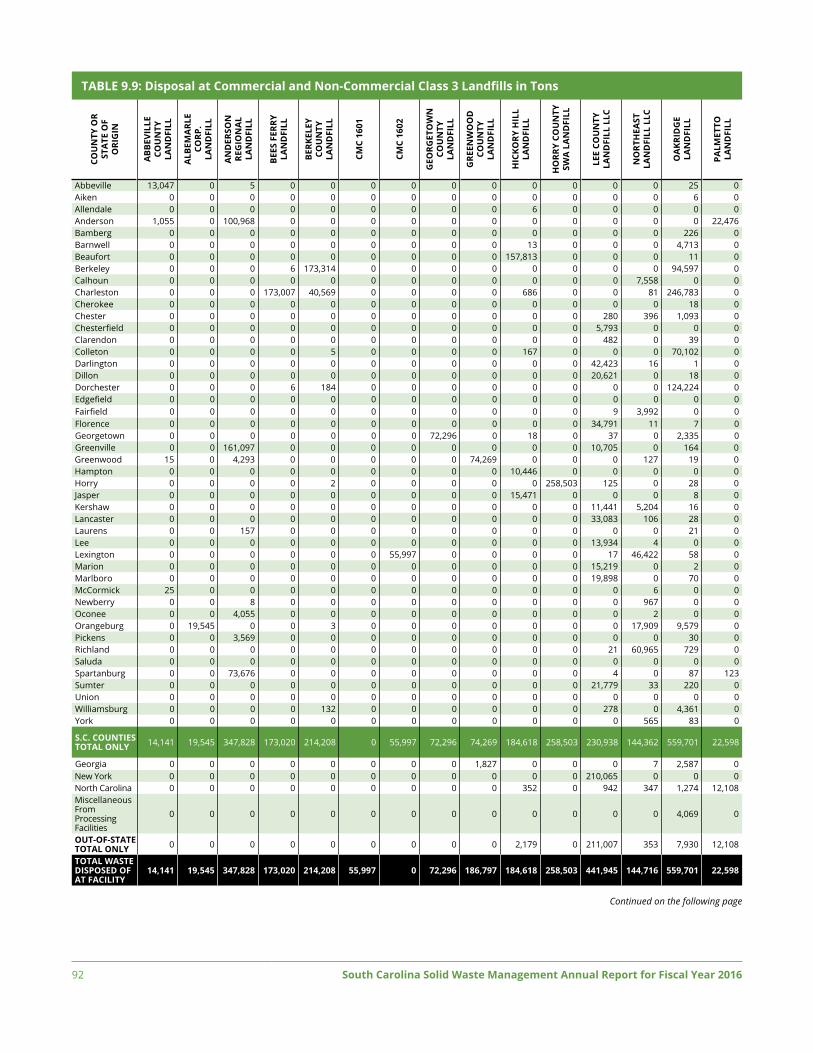
92 South Carolina Solid Waste Management Annual Report for Fiscal Year 2016
TABLE 9.9: Disposal at Commercial and Non-Commercial Class 3 Landfills in TonsCO
UN
TY O
R ST
ATE
OF
O
RIG
IN
ABB
EVIL
LE
COU
NTY
LA
ND
FILL
ALB
EMA
RLE
CORP
. LA
ND
FILL
AN
DER
SON
RE
GIO
NA
L
LAN
DFI
LL
BEES
FER
RY
LAN
DFI
LL
BERK
ELEY
CO
UN
TY
LAN
DFI
LL
CMC
1601
CMC
1602
GEO
RGET
OW
N
COU
NTY
LA
ND
FILL
GRE
ENW
OO
D
COU
NTY
LA
ND
FILL
HIC
KORY
HIL
L LA
ND
FILL
HO
RRY
COU
NTY
SW
A L
AN
DFI
LL
LEE
COU
NTY
LA
ND
FILL
LLC
NO
RTH
EAST
LA
ND
FILL
LLC
OA
KRID
GE
LAN
DFI
LL
PALM
ETTO
LA
ND
FILL
Abbeville 13,047 0 5 0 0 0 0 0 0 0 0 0 0 25 0Aiken 0 0 0 0 0 0 0 0 0 0 0 0 0 6 0Allendale 0 0 0 0 0 0 0 0 0 6 0 0 0 0 0Anderson 1,055 0 100,968 0 0 0 0 0 0 0 0 0 0 0 22,476Bamberg 0 0 0 0 0 0 0 0 0 0 0 0 0 226 0Barnwell 0 0 0 0 0 0 0 0 0 13 0 0 0 4,713 0Beaufort 0 0 0 0 0 0 0 0 0 157,813 0 0 0 11 0Berkeley 0 0 0 6 173,314 0 0 0 0 0 0 0 0 94,597 0Calhoun 0 0 0 0 0 0 0 0 0 0 0 0 7,558 0 0Charleston 0 0 0 173,007 40,569 0 0 0 0 686 0 0 81 246,783 0Cherokee 0 0 0 0 0 0 0 0 0 0 0 0 0 18 0Chester 0 0 0 0 0 0 0 0 0 0 0 280 396 1,093 0Chesterfield 0 0 0 0 0 0 0 0 0 0 0 5,793 0 0 0Clarendon 0 0 0 0 0 0 0 0 0 0 0 482 0 39 0Colleton 0 0 0 0 5 0 0 0 0 167 0 0 0 70,102 0Darlington 0 0 0 0 0 0 0 0 0 0 0 42,423 16 1 0Dillon 0 0 0 0 0 0 0 0 0 0 0 20,621 0 18 0Dorchester 0 0 0 6 184 0 0 0 0 0 0 0 0 124,224 0Edgefield 0 0 0 0 0 0 0 0 0 0 0 0 0 0 0Fairfield 0 0 0 0 0 0 0 0 0 0 0 9 3,992 0 0Florence 0 0 0 0 0 0 0 0 0 0 0 34,791 11 7 0Georgetown 0 0 0 0 0 0 0 72,296 0 18 0 37 0 2,335 0Greenville 0 0 161,097 0 0 0 0 0 0 0 0 10,705 0 164 0Greenwood 15 0 4,293 0 0 0 0 0 74,269 0 0 0 127 19 0Hampton 0 0 0 0 0 0 0 0 0 10,446 0 0 0 0 0Horry 0 0 0 0 2 0 0 0 0 0 258,503 125 0 28 0Jasper 0 0 0 0 0 0 0 0 0 15,471 0 0 0 8 0Kershaw 0 0 0 0 0 0 0 0 0 0 0 11,441 5,204 16 0Lancaster 0 0 0 0 0 0 0 0 0 0 0 33,083 106 28 0Laurens 0 0 157 0 0 0 0 0 0 0 0 0 0 21 0Lee 0 0 0 0 0 0 0 0 0 0 0 13,934 4 0 0Lexington 0 0 0 0 0 0 55,997 0 0 0 0 17 46,422 58 0Marion 0 0 0 0 0 0 0 0 0 0 0 15,219 0 2 0Marlboro 0 0 0 0 0 0 0 0 0 0 0 19,898 0 70 0McCormick 25 0 0 0 0 0 0 0 0 0 0 0 6 0 0Newberry 0 0 8 0 0 0 0 0 0 0 0 0 967 0 0Oconee 0 0 4,055 0 0 0 0 0 0 0 0 0 2 0 0Orangeburg 0 19,545 0 0 3 0 0 0 0 0 0 0 17,909 9,579 0Pickens 0 0 3,569 0 0 0 0 0 0 0 0 0 0 30 0Richland 0 0 0 0 0 0 0 0 0 0 0 21 60,965 729 0Saluda 0 0 0 0 0 0 0 0 0 0 0 0 0 0 0Spartanburg 0 0 73,676 0 0 0 0 0 0 0 0 4 0 87 123Sumter 0 0 0 0 0 0 0 0 0 0 0 21,779 33 220 0Union 0 0 0 0 0 0 0 0 0 0 0 0 0 0 0Williamsburg 0 0 0 0 132 0 0 0 0 0 0 278 0 4,361 0York 0 0 0 0 0 0 0 0 0 0 0 0 565 83 0
S.C. COUNTIES TOTAL ONLY 14,141 19,545 347,828 173,020 214,208 0 55,997 72,296 74,269 184,618 258,503 230,938 144,362 559,701 22,598
Georgia 0 0 0 0 0 0 0 0 1,827 0 0 0 7 2,587 0New York 0 0 0 0 0 0 0 0 0 0 0 210,065 0 0 0North Carolina 0 0 0 0 0 0 0 0 0 352 0 942 347 1,274 12,108Miscellaneous From Processing Facilities
0 0 0 0 0 0 0 0 0 0 0 0 0 4,069 0
OUT-OF-STATE TOTAL ONLY 0 0 0 0 0 0 0 0 0 2,179 0 211,007 353 7,930 12,108
TOTAL WASTE DISPOSED OF AT FACILITY
14,141 19,545 347,828 173,020 214,208 55,997 0 72,296 186,797 184,618 258,503 441,945 144,716 559,701 22,598
Continued on the following page

South Carolina Solid Waste Management Annual Report for Fiscal Year 2016 93
TABLE 9.9: Disposal at Commercial and Non-Commercial Class 3 Landfills in Tons (continued)CO
UN
TY O
R ST
ATE
OF
O
RIG
IN
PEPP
ERH
ILL
LAN
DFI
LL
RICH
LAN
D
LAN
DFI
LL
SAN
TEE
COO
PER
– CR
OSS
LA
ND
FILL
SCE&
G –
CO
PE
LAN
DFI
LL
SCE&
G –
W
ATE
REE
LAN
DFI
LL
SCE&
G –
WIL
LIA
MS
H
WY.
52
LAN
DFI
LL
SAVA
NN
AH
RI
VER
SITE
Z-
ARE
A
LAN
DFI
LL
SON
OCO
PR
OD
UCT
S
THRE
E RI
VERS
SW
A L
AN
DFI
LL
TWIN
CH
IMN
EYS
LAN
DFI
LL
UPS
TATE
RE
GIO
NA
L LA
ND
FILL
WEL
LFO
RD
LAN
DFI
LL
TOTA
L A
MO
UN
T O
F SO
LID
WA
STE
DIS
POSE
D O
F
IN C
LASS
3
LAN
DFI
LLS
S.C.
SO
LID
W
AST
E EX
PORT
ED F
OR
DIS
POSA
L O
UT
OF
STA
TE
Abbeville 0 85 0 0 0 0 0 0 0 2,534 0 0 15,695 0Aiken 0 32 0 0 0 9 17,840 0 123,972 629 9 0 142,487 0Allendale 0 0 0 0 0 0 0 0 7,242 0 0 0 7,248 0Anderson 0 199 0 0 0 0 0 0 0 16,171 31,049 0 171,918 10,270Bamberg 0 77 0 0 0 0 0 0 9,583 27 0 0 9,913 0Barnwell 0 300 0 0 0 0 0 0 14,553 5 0 0 19,583 0Beaufort 0 23 0 0 0 0 0 0 0 27 0 0 157,874 0Berkeley 0 121 48,684 0 0 81,347 0 0 0 54 0 0 349,439 0Calhoun 0 4,793 0 0 0 0 0 0 4,662 0 0 0 17,013 0Charleston 51 635 0 0 0 0 0 0 0 81 0 0 461,894 947Cherokee 0 11 0 0 0 0 0 0 0 620 54,739 0 55,388 345Chester 0 19,907 0 0 0 0 0 0 0 54 14,239 0 35,970 1,701Chesterfield 0 4,861 0 0 0 0 0 0 0 27 0 0 10,682 13,424Clarendon 0 12,502 0 0 0 0 0 0 0 0 0 0 13,023 0Colleton 0 84 0 0 0 0 0 0 0 0 0 0 70,357 0Darlington 0 2,466 0 0 0 2 0 600 0 20 2 0 44,928 684Dillon 0 198 0 0 0 0 0 0 0 0 0 0 20,836 0Dorchester 0 675 0 0 0 0 0 0 0 27 0 0 125,117 0Edgefield 0 45 0 0 0 0 0 0 12,666 4,238 0 0 16,949 0Fairfield 0 21,410 0 0 0 0 0 0 0 2 0 0 25,412 0Florence 0 91,402 0 0 0 0 0 0 0 108 0 0 126,318 1,169Georgetown 0 9 0 0 0 0 0 0 0 27 0 0 74,721 0Greenville 0 902 0 0 0 0 0 0 0 204,953 167,797 0 545,618 0Greenwood 0 267 0 0 0 0 0 0 0 11,258 6,626 0 96,873 550Hampton 0 0 0 0 0 0 0 0 0 0 0 0 10,446 0Horry 0 202 0 0 0 0 0 0 0 24 1 0 258,885 0Jasper 0 7 0 0 0 0 0 0 0 0 0 0 15,486 0Kershaw 0 29,934 0 0 0 0 0 0 0 135 0 0 46,730 0Lancaster 0 1,056 0 0 0 0 0 0 0 161 775 0 35,209 6,662Laurens 0 409 0 0 0 0 0 0 0 8,189 32,380 0 41,155 0Lee 0 70,202 0 0 0 0 0 0 0 0 0 0 84,141 0Lexington 0 180,172 0 0 0 0 0 0 51 27 2,667 0 285,411 0Marion 0 7,451 0 0 0 0 0 0 0 0 0 0 22,671 0Marlboro 0 728 0 0 0 0 0 0 0 27 0 0 20,723 504McCormick 0 43 0 0 0 0 0 0 3,031 1,118 461 0 4,684 0Newberry 0 1,734 0 0 0 0 0 0 0 617 50,286 0 53,611 0Oconee 0 2 0 0 0 0 0 0 0 11,580 11,533 0 27,172 41,228Orangeburg 0 3,932 0 166,111 0 0 0 0 49,541 81 0 0 100,589 0Pickens 0 134 0 0 0 0 0 0 0 44,669 7,926 0 56,328 5,229Richland 0 251,732 0 0 0 0 0 0 0 229 0 0 568,315 0Saluda 0 49 0 0 0 0 0 0 8,840 87 310 0 9,286 0Spartanburg 0 738 0 0 0 0 0 0 0 31,754 205,336 144,611 456,328 10Sumter 0 53,024 0 0 0 0 0 0 0 202 0 0 75,257 0Union 0 0 0 0 0 0 0 0 0 54 18,045 0 18,099 0Williamsburg 0 4,205 0 0 0 0 0 0 0 0 0 0 8,976 0York 0 136,790 0 0 0 0 0 0 0 188 12,007 0 149,633 26,058
S.C. COUNTIES TOTAL ONLY 51 903,548 17,840 166,111 0 81,347 17,840 600 234,140 340,002 616,187 144,611 4,964,388 108,782
Georgia 0 4,935 0 0 0 0 0 0 13,878 12 0 0 23,246 0New York 0 3 0 0 0 0 0 0 0 0 0 0 210,068 0North Carolina 0 124,013 0 0 0 0 0 0 0 47,567 201,675 0 388,287 0Miscellaneous From Processing Facilities
0 6,362 0 0 0 0 0 0 0 0 0 0 10,431 0
OUT-OF-STATE TOTAL ONLY 0 135,313 0 0 0 0 0 0 13,878 47,588 201,675 0 632,032 0
TOTAL WASTE DISPOSED OF AT FACILITY
51 1,038,862 17,840 234,140 0 81,347 17,840 600 248,017 387,590 817,863 144,611 5,613,316 108,782
*This amount includes 128 tons exported to Georgia that is not listed by county.

94 South Carolina Solid Waste Management Annual Report for Fiscal Year 2016
TABLE 9.10: TSW Disposal in Commercial and Non-Commercial Class 3 Landfills by Type of Waste in TonsCO
UN
TY
MSW
ASH
C&D
DEB
RIS
IND
UST
RIA
L PR
OCE
SS W
AST
E
PRO
CESS
ED
WA
STE
TIRE
S
NA
TURA
L
DIS
AST
ER D
EBRI
S
OTH
ER
TSW
DIS
POSE
D
OF
IN C
LASS
3
LAN
DFI
LLS
Abbeville 12,374 0 542 2,652 0 0 128 15,695
Aiken 98,620 4,430 0 5,483 324 0 33,630 142,487
Allendale 4,020 0 0 0 0 0 3,228 7,248
Anderson 119,530 0 7,450 29,135 0 22,476 3,598 182,188
Bamberg 9,597 0 0 70 0 0 246 9,913
Barnwell 14,178 0 0 182 0 0 5,224 19,583
Beaufort 137,013 3 9,655 20 0 0 20,883 167,574
Berkeley 94,125 95,674 43,475 12,106 0 0 152,742 398,123
Calhoun 9,886 0 0 7,080 0 0 47 17,013
Charleston 313,382 0 77,101 612 0 0 71,746 462,841
Cherokee 39,597 0 0 15,515 0 0 621 55,733
Chester 19,261 0 24 15,721 0 0 2,665 37,671
Chesterfield 21,312 0 0 2,296 0 0 498 24,106
Clarendon 12,914 0 0 10 0 0 100 13,023
Colleton 19,049 0 1,520 44 0 0 49,744 70,358
Darlington 34,876 40 761 6,644 0 0 3,892 46,212
Dillon 19,154 0 0 1,644 0 0 38 20,836
Dorchester 74,614 0 19,040 668 0 0 30,794 125,117
Edgefield 15,720 0 0 2 1,049 0 179 16,949
Fairfield 19,748 0 171 672 0 0 4,822 25,412
Florence 101,209 35 139 14,749 0 5,000 6,356 127,487
Georgetown 40,595 657 25,634 46 0 676 7,113 74,721
Greenville 309,594 0 32,084 165,948 0 0 37,992 545,618
Greenwood 71,718 0 6,481 1,852 0 0 17,371 97,423
Hampton 10,224 0 30 0 0 0 191 10,446
Horry 258,519 0 2 14 0 0 350 258,885
Jasper 12,804 4 927 7 0 0 2,166 15,909
Kershaw 33,432 56 496 5,061 0 0 7,685 46,730
Lancaster 37,468 0 3 3,116 0 0 1,283 41,871
Laurens 32,357 0 212 7,309 0 0 1,278 41,155
Continued on the following page

South Carolina Solid Waste Management Annual Report for Fiscal Year 2016 95
TABLE 9.10: TSW Disposal in Commercial and Non-Commercial Class 3 Landfills by Type of Waste in Tons (continued)
COU
NTY
MSW
ASH
C&D
DEB
RIS
IND
UST
RIA
L PR
OCE
SS W
AST
E
PRO
CESS
ED
WA
STE
TIRE
S
NA
TURA
L
DIS
AST
ER D
EBRI
S
OTH
ER
TSW
DIS
POSE
D
OF
IN C
LASS
3
LAN
DFI
LLS
Lee 8,334 0 3,301 2,313 0 0 70,193 84,141
Lexington 152,603 11,389 4,714 79,798 0 23,264 13,643 285,411
Marion 20,520 0 0 157 0 0 1,994 22,671
Marlboro 12,106 0 66 8,945 0 0 111 21,227
McCormick 4,089 0 85 498 0 0 12 4,684
Newberry 39,212 0 0 13,623 0 0 776 53,611
Oconee 50,828 0 51 5,962 0 0 11,558 68,399
Orangeburg 52,788 167,340 1,407 37,947 0 0 7,218 266,700
Pickens 56,436 0 7,464 2,038 0 0 1,551 67,489
Richland 237,489 254,639 354 36,168 0 22,542 17,123 568,315
Saluda 8,916 0 28 313 0 0 28 9,286
Spartanburg 335,307 0 2,807 113,623 0 123 4,479 456,338
Sumter 60,228 0 12 1,527 0 0 13,491 75,257
Union 15,502 0 1,888 514 0 0 196 18,099
Williamsburg 8,064 0 0 0 0 0 911 8,976
York 157,883 546 397 12,228 0 0 4,637 175,690
S.C. COUNTIES TOTAL ONLY (MSWLF/TS*)
3,104,810 534,812 235,996 614,310 1,373 74,080 614,529 5,179,911
Delaware 3 0 0 26 0 0 28 57
Georgia 1,056 0 7 18,627 0 0 3,554 23,244
Illinois 22 0 0 5,605 0 0 264 5,891
Massachusetts 0 0 114 5 0 0 160 279
New Jersey 1 0 0 30 0 0 273 304
New York 210,065 0 0 3 0 0 125 210,193
North Carolina 212,753 0 23,333 110,117 0 0 42,082 388,286
Tennessee 0 0 0 37 0 0 423 460
Virginia 39 0 0 660 0 0 680 1,379
Processing Facilities 11 0 0 0 0 0 75 86
OUT-OF-STATE TOTAL ONLY (MSWLF/TS*)
423,950 0 23,454 135,110 0 0 47,664 630,179
TOTAL BY WASTE STREAM**
3,528,760 534,812 259,451 749,421 1,373 74,080 662,193 5,810,090
*MSWLF = Municipal Solid Waste (MSW) Landfills and TS = Transfer Stations **Does not include exported.

96 South Carolina Solid Waste Management Annual Report for Fiscal Year 2016
TABLE 9.11: State & County MSW Recycling, Disposal & Generation Rates
COUNTY POPULATION RECYCLING RATE
RECYCLED (P/P/D)
DISPOSED** (P/P/D)
GENERATED (P/P/D)
RECYCLED (TONS)
DISPOSED (TONS)
GENERATED (TONS)
Abbeville 24,932 18.16 2,745 0.60 12,374 2.7 15,119 3.3
Aiken 165,829 7.49 7,980 0.26 98,620 3.3 106,600 3.5
Allendale 9,433 4.45 187 0.11 4,020 2.3 4,207 2.4
Anderson 194,692 42.09 86,888 2.45 119,530 3.4 206,418 5.8
Bamberg 14,880 4.79 483 0.18 9,597 3.5 10,080 3.7
Barnwell 21,725 6.94 1,057 0.27 14,178 3.6 15,234 3.8
Beaufort 179,589 18.88 31,886 0.97 137,013 4.2 168,899 5.2
Berkeley 202,786 13.20 14,313 0.39 94,125 2.5 108,439 2.9
Calhoun 14,781 17.36 2,077 0.77 9,886 3.7 11,963 4.4
Charleston 389,262 30.63 138,345 1.95 313,382 4.4 451,727 6.4
Cherokee 56,194 15.06 7,018 0.68 39,597 3.9 46,615 4.5
Chester 32,267 8.49 1,786 0.30 19,261 3.3 21,047 3.6
Chesterfield 46,017 27.41 8,049 0.96 21,312 2.5 29,361 3.5
Clarendon 33,775 8.16 1,147 0.19 12,914 2.1 14,061 2.3
Colleton 37,731 17.15 3,944 0.57 19,049 2.8 22,993 3.3
Darlington 67,548 7.45 2,808 0.23 34,876 2.8 37,683 3.1
Dillon 31,234 6.00 1,222 0.21 19,154 3.4 20,376 3.6
Dorchester 152,478 31.17 33,786 1.21 74,614 2.7 108,400 3.9
Edgefield 26,514 8.19 1,402 0.29 15,720 3.2 17,121 3.5
Fairfield 22,747 13.93 3,195 0.77 19,748 4.8 22,943 5.5
Florence 138,900 11.19 12,747 0.50 101,209 4.0 113,956 4.5
Georgetown 61,298 23.48 12,455 1.11 40,595 3.6 53,050 4.7
Greenville 491,863 27.53 117,608 1.31 309,594 3.4 427,202 4.8
Greenwood 69,838 32.25 34,146 2.68 71,718 5.6 105,864 8.3
Hampton 20,049 21.10 2,734 0.75 10,224 2.8 12,958 3.5
Horry 309,199 30.28 112,286 1.99 258,519 4.6 370,805 6.6
Jasper 27,824 9.46 1,339 0.26 12,804 2.5 14,142 2.8
Kershaw 63,603 20.33 8,530 0.73 33,432 2.9 41,961 3.6
Lancaster 85,842 11.07 4,663 0.30 37,468 2.4 42,131 2.7
Laurens 66,623 23.14 9,740 0.80 32,357 2.7 42,098 3.5
Lee 17,896 13.15 1,262 0.39 8,334 2.6 9,595 2.9
Lexington 281,833 39.49 99,589 1.94 152,603 3.0 252,192 4.9
Marion 31,747 8.53 1,914 0.33 20,520 3.5 22,434 3.9
Marlboro 27,494 27.51 4,595 0.92 12,106 2.4 16,700 3.3
McCormick 9,706 27.53 1,553 0.88 4,089 2.3 5,642 3.2
Newberry 38,012 28.88 15,921 2.30 39,212 5.7 55,133 7.9
Oconee 75,713 24.26 16,284 1.18 50,828 3.7 67,113 4.9
Orangeburg 89,208 15.29 9,527 0.59 52,788 3.2 62,315 3.8
Pickens 121,691 24.86 18,668 0.84 56,436 2.5 75,104 3.4
Richland 407,051 24.45 76,861 1.03 237,489 3.2 314,350 4.2
Saluda 20,053 8.19 795 0.22 8,916 2.4 9,711 2.7
Spartanburg 297,302 23.44 102,633 1.89 335,307 6.2 437,940 8.1
Sumter 107,480 24.51 19,556 1.00 60,228 3.1 79,784 4.1
Union 27,777 13.77 2,476 0.49 15,502 3.1 17,978 3.5
Williamsburg 32,535 11.96 1,095 0.18 8,064 1.4 9,159 1.5
York 251,195 25.93 55,274 1.21 157,883 3.4 213,158 4.6
STATE TOTALS/AVERAGES
4,896,146 25.41 1,094,569 1.2 3,213,592 3.6 4,308,161 * 4.8
*This includes MSW disposed of, exported and incinerated.

South Carolina Solid Waste Management Annual Report for Fiscal Year 2016 97
TABLE 9.12: State & County TSW Recycling, Disposal and Generation in Tons
COU
NTY
POPU
LATI
ON
TSW
DIS
POSE
D O
F
IN C
LASS
3
LAN
DFI
LLS
AN
D
EXPO
RTED
INCI
NER
ATE
D
TSW
DIS
POSE
D O
F
IN C
LASS
2
LAN
DFI
LLS
TSW
DIS
POSE
D O
F
IN C
LASS
1
LAN
DFI
LLS
TOTA
L A
MO
UN
T O
F A
LL S
W D
ISPO
SED
O
F IN
LA
ND
FILL
S
OR
INCI
NER
ATE
D
TOTA
L
RECY
CLIN
G
EFFO
RTS
TOTA
L A
MO
UN
T O
F SW
GEN
ERA
TED
(R
ECYC
LED
+
DIS
POSE
D)
PERC
ENT
OF
ALL
SW
GEN
ERA
TED
TH
AT
WA
S RE
CYCL
ED
(SW
REC
YCLE
D +
SW
GEN
ERA
TED
)
Abbeville 24,932 15,695 0 5,460 0 21,155 11,832 32,987 35.87Aiken 165,829 142,487 0 139,010 12,568 294,065 8,217 302,282 2.72Allendale 9,433 7,248 0 4,951 0 12,198 254,271 266,469 95.42Anderson 194,692 182,188 0 80,873 21,524 284,584 109,885 394,469 27.86Bamberg 14,880 9,913 0 5,925 0 15,838 666 16,504 4.04Barnwell 21,725 19,583 0 56,668 0 76,251 1,633 77,884 2.10Beaufort 179,589 161,602 5,972 86,587 0 254,161 33,761 287,921 11.73Berkeley 202,786 398,123 0 474,418 14,580 887,121 94,295 981,416 9.61Calhoun 14,781 17,013 0 3,463 0 20,476 8,606 29,082 29.59Charleston 389,262 462,841 0 294,225 0 757,066 205,888 962,953 21.38Cherokee 56,194 55,733 0 21,356 0 77,089 16,009 93,098 17.20Chester 32,267 37,671 0 53,538 0 91,209 7,188 98,397 7.31Chesterfield 46,017 24,106 0 21,240 0 45,346 8,092 53,438 15.14Clarendon 33,775 13,023 0 11,786 0 24,809 1,157 25,967 4.46Colleton 37,731 70,358 0 15,872 0 86,230 3,965 90,194 4.40Darlington 67,548 46,212 0 29,193 0 75,405 2,832 78,237 3.62Dillon 31,234 20,836 0 8,799 0 29,635 1,238 30,874 4.01Dorchester 152,478 125,117 0 96,305 0 221,421 534,176 755,597 70.70Edgefield 26,514 16,949 0 11,115 893 28,957 1,409 30,365 4.64Fairfield 22,747 25,412 0 1,708 12 27,132 3,924 31,057 12.64Florence 138,900 127,487 0 135,727 0 263,214 16,995 280,209 6.07Georgetown 61,298 74,721 0 30,739 0 105,460 18,495 123,955 14.92Greenville 491,863 545,618 0 220,050 481 766,148 258,753 1,024,901 25.25Greenwood 69,838 97,423 0 17,283 63 114,769 57,252 172,020 33.28Hampton 20,049 10,446 0 8,766 0 19,212 2,735 21,947 12.46Horry 309,199 258,885 0 143,047 0 401,932 201,109 603,041 33.35Jasper 27,824 15,486 423 4,971 0 20,880 5,222 26,102 20.01Kershaw 63,603 46,730 0 28,208 0 74,938 8,571 83,509 10.26Lancaster 85,842 41,871 0 223 3,036 45,130 4,681 49,811 9.40Laurens 66,623 41,155 0 11,130 94 52,379 9,756 62,134 15.70Lee 17,896 84,141 0 39 0 84,180 6,515 90,695 7.18Lexington 281,833 285,411 0 181,466 4,900 471,776 232,973 704,749 33.06Marion 31,747 22,671 0 29,378 0 52,050 1,947 53,996 3.61Marlboro 27,494 21,227 0 9,351 0 30,578 106,591 137,169 77.71McCormick 9,706 4,684 0 1,110 129 5,922 1,555 7,477 20.80Newberry 38,012 53,611 0 13,876 108 67,595 127,379 194,974 65.33Oconee 75,713 68,399 0 26,046 1,140 95,585 47,875 143,461 33.37Orangeburg 89,208 266,700 0 24,164 0 290,864 20,379 311,243 6.55Pickens 121,691 61,557 5,932 20,170 405 88,064 50,819 138,882 36.59Richland 407,051 568,315 0 387,813 231 956,359 79,622 1,035,980 7.69Saluda 20,053 9,286 0 1,760 0 11,046 797 11,842 6.73Spartanburg 297,302 456,338 0 114,150 3,316 573,805 111,721 685,525 16.30Sumter 107,480 75,257 0 54,806 0 130,064 27,331 157,395 17.36Union 27,777 18,099 0 108 2,150 20,358 2,481 22,839 10.86Williamsburg 32,535 8,976 0 6,795 0 15,771 1,188 16,959 7.00York 251,195 175,690 0 111,858 510 288,059 76,356 364,415 20.95TOTAL FOR S.C. COUNTIES 4,896,146 5,292,421 12,327 3,005,525 66,139 8,376,283 2,788,140 11,164,423 24.97
TOTAL OUT-OF-STATE 630,179 114 56,667 3,102 690,062
TOTAL WASTE STREAM 5,922,600 12,441 3,062,192 66,139 9,066,473
*This amount includes 128 tons exported to Georgia that is not listed by county.

98 South Carolina Solid Waste Management Annual Report for Fiscal Year 2016
TABLE 9.13: Class 1 Landfill Disposal in Tons, FY12 to FY16
COUNTY OR PLACE OF ORIGIN FY12 FY13 FY14 FY15 FY16
Abbeville 0 0 0 0 0
Aiken 10,787 11,290 12,548 11,729 12,568
Allendale 0 0 0 0 0
Anderson 16,855 18,204 14,563 18,450 21,524
Bamberg 0 0 0 0 0
Barnwell 0 0 0 0 0
Beaufort 0 0 0 0 0
Berkeley 0 4,217 15,267 2,668 14,580
Calhoun 0 0 0 0 0
Charleston 0 0 2 0 0
Cherokee 0 0 0 0 0
Chester 0 0 0 0 0
Chesterfield 0 0 0 0 0
Clarendon 0 0 0 0 0
Colleton 0 0 0 0 0
Darlington 0 0 0 0 0
Dillon 0 0 0 0 0
Dorchester 0 0 0 0 0
Edgefield 2,343 1,531 6,796 1,637 893
Fairfield 0 2 17 0 12
Florence 316 392 0 0 0
Georgetown 0 0 0 0 0
Greenville 621 575 437 1,365 481
Greenwood 1,491 970 1,960 1,800 63
Hampton 0 0 0 0 0
Horry 0 0 0 0 0
Jasper 291 252 314 0 0
Kershaw 3,210 3,487 0 0 0
Lancaster 3,750 3,488 2,910 3,180 3,036
Laurens 400 0 1,475 98 94
Lee 0 0 0 0 0
Lexington 5,369 3,626 5,428 10,316 4,900
Marion 0 0 0 0 0
Marlboro 0 0 0 0 0
McCormick 18 18 0 0 129
Newberry 66 181 122 494 108
Oconee 1,801 1,406 1,019 839 1,140
Orangeburg 0 0 0 0 0
Pickens 1,566 983 567 270 405
Richland 10,868 10,190 169 1,543 231
Saluda 162 194 114 186 0
Spartanburg 1,524 2,051 2,766 2,531 3,316
Sumter 423 0 0 0 0
Union 1,809 2,786 2,646 2,458 2,150
Williamsburg 0 0 0 0 0
York 7,710 7,530 8,206 6,045 510
TOTAL SOUTH CAROLINA 71,380 73,374 77,326 65,608 66,139
TOTAL OUT-OF-STATE 1,288 1,629 12,789 2,598 3,102
TOTAL AMOUNT DISPOSED OF 72,667 75,003 90,115 68,206 69,241
NOTE: See Table 10.3 for a list of Class 1 Landfills by name and county.
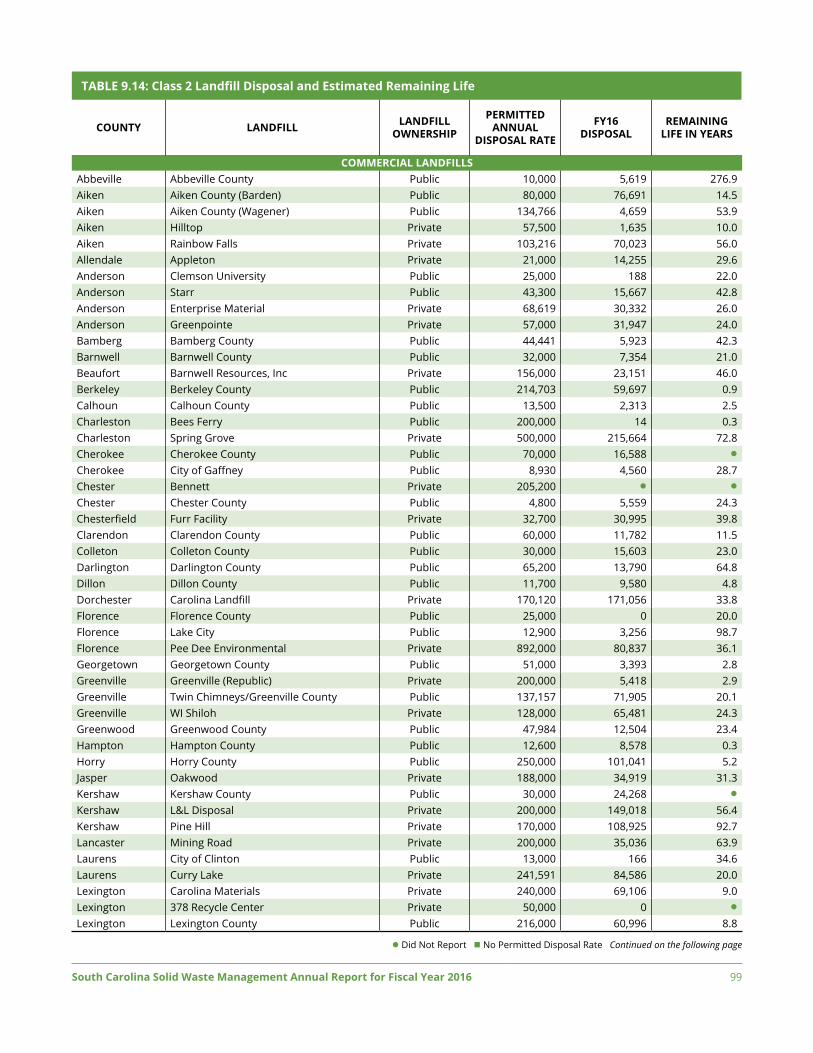
South Carolina Solid Waste Management Annual Report for Fiscal Year 2016 99
COUNTY LANDFILL LANDFILL OWNERSHIP
PERMITTED ANNUAL
DISPOSAL RATE
FY16 DISPOSAL
REMAINING LIFE IN YEARS
COMMERCIAL LANDFILLSAbbeville Abbeville County Public 10,000 5,619 276.9Aiken Aiken County (Barden) Public 80,000 76,691 14.5Aiken Aiken County (Wagener) Public 134,766 4,659 53.9Aiken Hilltop Private 57,500 1,635 10.0Aiken Rainbow Falls Private 103,216 70,023 56.0Allendale Appleton Private 21,000 14,255 29.6Anderson Clemson University Public 25,000 188 22.0Anderson Starr Public 43,300 15,667 42.8Anderson Enterprise Material Private 68,619 30,332 26.0Anderson Greenpointe Private 57,000 31,947 24.0Bamberg Bamberg County Public 44,441 5,923 42.3Barnwell Barnwell County Public 32,000 7,354 21.0Beaufort Barnwell Resources, Inc Private 156,000 23,151 46.0Berkeley Berkeley County Public 214,703 59,697 0.9Calhoun Calhoun County Public 13,500 2,313 2.5Charleston Bees Ferry Public 200,000 14 0.3Charleston Spring Grove Private 500,000 215,664 72.8Cherokee Cherokee County Public 70,000 16,588 l
Cherokee City of Gaffney Public 8,930 4,560 28.7Chester Bennett Private 205,200 l l
Chester Chester County Public 4,800 5,559 24.3Chesterfield Furr Facility Private 32,700 30,995 39.8Clarendon Clarendon County Public 60,000 11,782 11.5Colleton Colleton County Public 30,000 15,603 23.0Darlington Darlington County Public 65,200 13,790 64.8Dillon Dillon County Public 11,700 9,580 4.8Dorchester Carolina Landfill Private 170,120 171,056 33.8Florence Florence County Public 25,000 0 20.0Florence Lake City Public 12,900 3,256 98.7Florence Pee Dee Environmental Private 892,000 80,837 36.1Georgetown Georgetown County Public 51,000 3,393 2.8Greenville Greenville (Republic) Private 200,000 5,418 2.9Greenville Twin Chimneys/Greenville County Public 137,157 71,905 20.1Greenville WI Shiloh Private 128,000 65,481 24.3Greenwood Greenwood County Public 47,984 12,504 23.4Hampton Hampton County Public 12,600 8,578 0.3Horry Horry County Public 250,000 101,041 5.2Jasper Oakwood Private 188,000 34,919 31.3Kershaw Kershaw County Public 30,000 24,268 l
Kershaw L&L Disposal Private 200,000 149,018 56.4Kershaw Pine Hill Private 170,000 108,925 92.7Lancaster Mining Road Private 200,000 35,036 63.9Laurens City of Clinton Public 13,000 166 34.6Laurens Curry Lake Private 241,591 84,586 20.0Lexington Carolina Materials Private 240,000 69,106 9.0Lexington 378 Recycle Center Private 50,000 0 l
Lexington Lexington County Public 216,000 60,996 8.8
l Did Not Report n No Permitted Disposal Rate Continued on the following page
TABLE 9.14: Class 2 Landfill Disposal and Estimated Remaining Life

100 South Carolina Solid Waste Management Annual Report for Fiscal Year 2016
COUNTY LANDFILL LANDFILL OWNERSHIP
PERMITTED ANNUAL
DISPOSAL RATE
FY16 DISPOSAL
REMAINING LIFE IN YEARS
COMMERCIAL LANDFILLS (continued) Lexington S&T Recycling LLC Private 7,200 6,950 25.0Lexington Southeastern Disposal Private 120,000 48,642 14.6Marion Hwy. 908 Private 206,540 7,837 18.3Marion Marion County Public 135,350 28,422 25.0Marion Sandlands Private 206,500 42,375 26.8Newberry SRR, LLC Private 208,000 43,413 15.8Oconee Oconee County Public 37,615 22,763 l
Orangeburg Orangeburg County Public 81,000 23,906 9.2Pickens Hwy. 93 Private 70,500 0 l
Pickens Easley - Pickens County Public 30,000 19,212 1.7Richland Carolina Grading, Inc. Private 122,400 3 136.0Richland Richland County Public 200,000 32,106 17.7Spartanburg Spartanburg County - WASP Nest Public 72,161 70,952 8.1Sumter Sumter County Public 51,332 43,066 3.0Williamsburg Williamsburg County Public 4,370 4,154 5.0
York Coltharp Private 106,418 66,419 9.0York Rogers Private 24,000 2,600 10.0York Vernsdale Road Private 58,300 0 l
York York County Public 96,632 45,546 15.0NON-COMMERCIAL PUBLICLY OWNED LANDFILLS
Aiken Savannah River Site 288-F Public n 372 17.7Aiken Savannah River Site 488-4D Public 25,000 40,135 1.5Aiken Savannah River Site 632-G Public 120,000 23,780 37.0Berkeley Santee Cooper (Cross Generating
Station)Public n 282,187 0.0
NON-COMMERCIAL PRIVATE LANDFILLSAiken Owens Corning - Aiken Private 60,000 8,167 13.3Anderson Owens Corning - Anderson Private 60,000 13,098 56.0Berkeley Kapstone Private n 136,499 43.0Calhoun DAK Amerikas Private n 1,136 10.7Darlington Sonoco Products Company Private 50,000 10,194 0.8Florence WestRock Private 103,032 52,245 7.2Georgetown International Paper - Georgetown Private 200,000 25,622 13.9Greenville General Electric Private 3,500 0 l
Lexington SCE&G McMeekin Station Private 120,000 0 l
Marlboro Domtar Paper Private 12,000 2,844 54.6Oconee Duke Power - Oconee Nuclear Station Private 2,000 0 24.4Orangeburg Brewer Private 50,000 0 l
Orangeburg SCE&G Cope Private n 0 107.3Richland International Paper - Eastover Private n 126,000 12.5Richland Intertape Polymer Group Private 10,000 0 l
Spartanburg Kohler Company Private n 9,198 94.1Spartanburg Tindall Private n l l
Williamsburg DSM Nutritional Products, LLC Private 80,000 2,641 28.0York Duke Power - Catawba Private 1,000 0 46.7York Resolute Forest Products Private n 7,135 8.3TOTAL 7,526,827 3,062,192 31.2
l Did Not Report n No Permitted Disposal Rate NOTE: The remaining life of Class 2 landfills is provided in months, but converted to years.
TABLE 9.14: Class 2 Landfill Disposal and Estimated Remaining Life (continued)

South Carolina Solid Waste Management Annual Report for Fiscal Year 2016 101
SECTION
10The S.C. Solid Waste Policy and Management Act of 1991 – S.C. Code of Laws § 44-96-60 – requires the S.C. Department of Health and Environmental Control to provide an inventory of solid waste facilities.
In fiscal year (FY) 2016 (July 1, 2015 to June 30, 2016), there were 378 solid waste facilities operating under the authority of 15 types of permits in South Carolina.
Some permits apply to multiple facility types. For example, there are six types of solid waste processing facilities as well as three types of landfills and transfer stations. Of the 15 types of solid waste permits, only three are allowed to accept MSW – Class 3 landfills, Class 3 transfer stations and Class 3 processing facilities.
Overall in FY16, there were:
• 156 landfills;
• 111 composting and wood-grinding facilities;
• 41 transfer stations;
• 20 processing facilities;
• 16 waste tire facilities;
• 16 used oil facilities;
• 7 land-application facilities;
• Five research, development and demonstration facilities;
• Five incinerators (all Air Curtain); and
• One soil treatment facility.
Tables 10.2 to 10.9 provide a complete list of the permitted facilities at the close of FY16. The tables include (when available): the facility name; county in which the facility is located; permitted rate of disposal or storage; and the tons received.
TABLE 10.1: Permitted Rate Legend
CYPY Cubic Yards Per Year
GPY Gallons Per Year
TPA Tons Per Acre
TPD Tons Per Day
TPW Tons Per Week
TPY Tons Per Year
TABLE 10.2: Permitted Solid Waste Transfer Stations in FY16
COUNTY FACILITY NAME PERMITTED RATE
TONS RECEIVED
CLASS 1 TRANSFER STATIONSGreenville City of Greenville 40,000 TPY 15,000
CLASS 2 TRANSFER STATIONSCharleston Town of Mount Pleasant 100 TPD 21,696Colleton Clean Management 60 TPD 1,377Dorchester Town of Summerville 200 TPD 11,940Greenville MRR Upstate 500 TPD 32,639
Jasper Carolina Containers of Beaufort 500 TPD 21,553
CLASS 3 TRANSFER STATIONSAnderson Anderson-Oconee 1,500 TPD 0Anderson Pendleton 500 TPD 17,417Bamberg Bamberg County 250 TPD 9,620Barnwell Barnwell County 200 TPD 14,644Beaufort Haig Point 15 TPD 243
Beaufort Dolphin Shared Management Service 15 TPD 1,493
Charleston Carolina Processing & Recycling 2,000 TPD 220,352
Cherokee Cherokee County 800 TPD 36,893Chester Chester County 200 TPD 16,689Clarendon Clarendon County 250 TPD 0Colleton Colleton County 115 TPD 19,497Darlington Darlington County 95 TPD 19,670Dillon Dillon County 250 TPD 45,151Edgefield Tri-County 320 TPD 29,024Fairfield Fairfield County 320 TPD 15,836Florence Florence County 740 TPD 105,947Greenville Blackberry Valley 150 TPD 5,165Greenville City of Greer 40 TPD 10,518Greenville City of Simpsonville 300 TPD 0Horry City of Myrtle Beach 400 TPD 29,214Horry City of North Myrtle Beach 250 TPD 13,508Lancaster Lancaster, City of 315 TPD 29,971Laurens CCC Laurens County 800 TPD 29,994Lexington Lexington County 600 TPD 120,128Marlboro City of Bennettsville 50 TPD 5,035Newberry Newberry County 400 TPD 38,223Oconee Oconee Seneca 300 TPD 39,309Orangeburg Orangeburg County 300 TPD 54,302Pickens Pickens County 400 TPD 42,045Spartanburg Greer 1,200 TPD 138,996Spartanburg Broadcast Drive/J&B 1,000 TPD 83,964Spartanburg City of Spartanburg 200 TPD 0Sumter Sumter 400 TPD 63,720Union City of Union 21 TPD 3,223
York Containers Corporation of Carolina 1,200 TPD 103,599
York York County 800 TPD 135,008
South Carolina’s Permitted Solid Waste Facilities
There were 378 solid waste facilities operating in South
Carolina during FY16.

102 South Carolina Solid Waste Management Annual Report for Fiscal Year 2016
TABLE 10.3: Permitted Solid Waste Landfills in FY16
COUNTY FACILITY NAME PERMITTED DISPOSAL RATE
TONS DISPOSED
CLASS 1 LANDFILLS
Aiken G.L. Williams 625 TPY 584
Aiken Jack Wood 520 TPY 108
Aiken Toby Marks 4,800 TPY 2,709
Aiken Dennis Miller 20,000 TPY 5,100
Aiken B&W Excavating (Mike Williams) 15,000 TPY 2,456
Aiken John Swearingen 1,000 TPY 150
Anderson Starr – Anderson County 26,000 TPY 17,658
Anderson Broadway 860 TPY 612
Anderson City of Belton 3,600 TPY 3,450
Berkeley Berkeley County 15,000 TPY 14,580
Edgefield Pioneer Clearing 20,000 TPY 5,585
Greenville Norris 250 TPY 120
Greenwood BHC Trucking 6,500 TPY 63
Jasper Jasper County 120,000 TPY 0
Lancaster Lancaster County 3,500 TPY 3,036
Laurens H.R. Garrett (Henderson Rd.) 20,000 TPY 258
Lexington 378 Recycle Center 100,000 TPY 3,976
Lexington Southeastern Disposal 11,600 TPY 0
Lexington Town of Batesburg-Leesville 2,000 TPY 0
Newberry Metts 3,000 TPY 1,200
Oconee Clemson-Seneca 3,000 TPY 720
Oconee New Century Construction (Wells Hwy.) 15,000 TPY 825
Oconee Wood 8,000 CYPY 0
Richland L&L Disposal 30,000 TPY 0
Richland Sharp's Construction Co. 75 TPY 75
Saluda Goff 40,000 CYPY 0
Spartanburg Brown 3,000 TPY 149
Spartanburg City of Woodruff (Landford Rd.) 488 TPY 128
Spartanburg Cliffdale Road 150,000 TPY 0
Spartanburg Hawkins Grading 6,000 TPY 27
Spartanburg Howard Grading & Construction 1,000 TPY 8
Spartanburg Jeff Thomas LCD Landfill 2,600 TPY 0
Spartanburg Par Grading & Hauling 2,600 TPY 3,000
Spartanburg Roger Owens 900 TPY 4
Spartanburg Watson 3,000 TPY 0
Union City of Union (Eison) 2,500 TPY 2,150
York Clawson 50,400 CYPY 510
York Creekside of York County 5,500 TPY 0
York McCall Deer Creek Drive 100,000 CYPY 0
CLASS 2 LANDFILLS
A list of Class 2 landfills can be found in Table 9.14 (pages 99-100).
CLASS 3 LANDFILLS
A list of Class 3 landfills can be found in Table 9.7 (page 90).
l Did Not Report
TABLE 10.4: Permitted Solid Waste Processing Facilities in FY16
COUNTY FACILITY NAME PERMITTED RATE
TONS RECEIVED
C&D DEBRIS PROCESSING FACILITIES
Anderson ACE Environmental Inc. 50,000 TPY 8,370
Dillon Nobles Corp. Inc. 120,000 TPY 0
Greenwood Powell’s Trash Service 41,184 TPY 18,180
Horry Horry County SWA 72,800 TPY 14,183
CLASS 3 INDUSTRIAL PROCESSING FACILITIES
Calhoun Regulatory Solutions Inc. 25,000 TPY 11,036
Colleton American Bio Mass LLC 9,170 TPY 8,157
Colleton CMEG Inc. 5,200 TPY 3,857
Dorchester Geocycle LLC 150,000 TPY 26,133
Greenville VLS - Piedmont LLC 90,000 TPY 89,629
Lexington Crandall Corporation 2,491 TPY 420
Spartanburg JBR Environmental Services 52,000 TPY 17,017
Sumter Giant Resource Recovery 104,000 TPY 12,733
CLASS 3 MSW PROCESSING FACILITIES
Aiken North Augusta, City of 250 TPD 34,847
Aiken Three Rivers SWA 900 TPD 0
Greenville Piedmont Processing – Waste Industries 1,500 TPD 50,805
SpartanburgA-1 Transfer & Recycling Solid Waste Processing Facility (220 Victor Hill)
150 TPD 17,851
ORGANIC PROCESSING FACILITIES
Richland Waste 2 Energy LLC 48,000 TPY 0
C&D DEBRIS / CLASS 3 INDUSTRIAL PROCESSING FACILITIES
Lee Lee County 600 TPD 55,335
C&D DEBRIS / CLASS 3 MSW PROCESSING FACILITIES
Dorchester Pepperhill 1,200 TPD 105,302
Greenville Fennel Container 1,200 TPD 192,620

South Carolina Solid Waste Management Annual Report for Fiscal Year 2016 103
COUNTY FACILITY NAME TONS RECEIVED
Aiken APAC Composting Site 0Aiken APAC 421 Composting Site 274Aiken City of Aiken Public Works Department 0Aiken City of North Augusta 167Aiken GreenGo Recycling LLC – Aiken County 741Anderson City of Anderson 492Anderson Fowler Corporation Wood Chipping Facility 0Anderson Town of Honea Path 5,400Anderson Willimon's Mulch 195Bamberg Bamberg County 1,778Beaufort Cleland Ridgeland Chipping Facility 7,829
Beaufort Community Service Association, Inc./ Sea Pines Plantation 4,500
Beaufort Hilton Head Plantation P.O.A. 50Beaufort LCR Construction – Beautfort Facility 2,736Berkeley Berkeley County – Mitton Road 0Berkeley Berkeley County Water & Sanitation Authority 13,416Charleston Barr Construction Inc. 1,242Charleston County of Charleston – Bee's Ferry 70,412Charleston Ladson Wood Recycling 47,334Charleston Moberry LCD Wood Chipping Facility l
Charleston Sunnyside Farms 315
Charleston Three Oaks – Buring Acres Composting and Shreading Site 555
Cherokee Cherokee County Landfill 1,340Chester City of Chester l
Chester Scotts Company 78,000Chester Town of Great Falls l
Dillon Nobles Corporation Composting and Woodchipping Facility 0
Dillon Town of Latta l
Dorchester Carolina Landfill LLC 1,148
Fairfield Fairfield County Wood Chipping Facility (Limb Chipping Facility) 1,200
Fairfield Kaiser Enterprises Inc. l
Florence City of Florence 1,823
Florence Gilbert Drive Composting & Wood Chipping (DBA – Earth Care Recycling LLC) 12
Georgetown Frasier Composting l
Georgetown Georgetown County 2,546
Georgetown McKenzie Wood Chipping – Georgetown County l
Greenville Atlas Organics Composting 275Greenville Dillard Excavating 150Greenville Greater Greenville Sanitation Commission 18,695Greenville Greenworks Recycling (DBA – Mulch in Motion) 19,784
Greenville Greenworks Recycling (DBA – Mulch in Motion - Simpsonville) 10,500
Greenville Greenworks Recycling (DBA – Mulch in Motion) 300
Greenville Hensons’ Inc. – Greenville Wood Recycling Center 3,117
Greenville Schneider Tree Care Wood Chipping Facility 4,695Greenville SH Carter – Greenville County l
Greenville SR Mulch & Grinding 14,324Greenville Starr Wood Chipping Facility 0Greenville The Daylee Grind (DBA – DTS Inc.) l
Greenville Timbertech Inc. 2,366Greenville Twin Chimneys Wood Grinding Facility 3,078Greenville Piedmont Composting 0Hampton Hampton County 1,138Hampton Town of Yemassee 0Horry D&S Recycling LLC 24,356Horry G&G Mining Company LLC 31
COUNTY FACILITY NAME TONS RECEIVED
Horry Horry County Solid Waste Authority Inc. 35,583Horry Lees Landing – Horry County 0Horry Seaside Mulch Inc. 725Horry Coastal Reclaimation l
Jasper Evergreen Tree & Turf (AKA – South Coasting Logging Inc.) l
Jasper LCR Construction (formerly R&D Tree/Tutan Trees) 2,736
Jasper Oakwood C&D Landfill 6,943Kershaw Kershaw County Solid Waste 386Kershaw L&L Disposal Wood Chipping Site 18,502Kershaw SAK LLC (DBA – Re-Soil Composting) 60
Lancaster Greenway Waste Solutions/Griffin Brothers Enterprises Inc. 724
Lancaster Lancaster County/McGill Convenience Site 3,036Lancaster SM Smith & Sons Inc. l
Laurens Curry's Lake Landfill 1,397Laurens Laurens County 185Lee Lee County Composting & Recycling 824Lexington Carolina Materials Corporation 8,304Lexington Eagle Recovery Facility 4,620
Lexington Lexington County Wood Grinding & Composting Facility 8,564
Lexington S&T Grading 750Lexington Southeastern Disposal LLC/Wood Chipping Site 0Lexington 378 Recycling LLC 3,976Marion City of Marion 1,210Marion Hwy. 908 Composting – Marion County 0Marion Marion County Woodchipping 0Marlboro McDuffie & Son Composting Center l
Newberry City of Newberry 327Newberry County of Newberry 3,021Newberry Metts Wood Recycling Center 7,843Oconee Clemson – Seneca 165Oconee Hutch-N-Son Wood Chipping Facility 1,243Oconee Oconeee Country Solid Waste Mulching Facility 6,767
Oconee Wells Hwy. Landfill (New Century Construction Recycling Division) 2,730
Pickens City of Clemson l
Richland City of Columbia 6,437Richland Mitch Hook Composting 420
Richland Richland Composting and Wood Chipping Facility 1,858
Saluda SH Wood Waste Management 334Spartanburg City of Spartanburg 0
Spartanburg Hensons' Inc. – Mulch and More Wood Chipping Facility 2,914
Spartanburg Spartanburg County – Wellford Landfill, Environmental Services 2,847
Spartanburg Spartanburg Wood Recycling Facility 950
Sumter Glasscock Company (formerly SCR Composting Site) l
Sumter Sumter County Public Works 3,946Williamsburg Town of Hemingway 108York City of Rock Hill l
York City of Rock Hill – Vegetation 7,678York City of Tega Cay Wood Chipping Facility 1,905York River Hills Community Association 2,521York Rogers Composting Facility 0York Town of Fort Mill 4,237York York County Wood Chipping Facility l
York Deer Creek Composting 0l Did Not Report
TABLE 10.5: Permitted Composting and Wood-grinding Facilities in FY16

104 South Carolina Solid Waste Management Annual Report for Fiscal Year 2016
TABLE 10.6: Permitted Waste Tire Facilities in FY16
COUNTY FACILITY NAME STORAGE LIMITWASTE TIRE COLLECTORS
Aiken Three Rivers Solid Waste Authority 10,000 tiresBeaufort Beaufort County Public Works 2,900 tiresCharleston Geralds Tires II Inc. 5,200 tiresCherokee Cherokee County n
Fairfield Fairfield County Waste Tire Collection Facility 1 1,800 tiresGreenville Twin Chimneys 3 tractor trailersLancaster Lancaster County Public Works 1,850 tiresUnion Union County Public Works 1,200 tires
WASTE TIRE PROCESSORSAiken SC Tire Processing LLC 437,000 tiresAnderson Viva Recycling Upstate LLC 18,300 tiresBerkeley Viva Recycling of SC 99,000 tiresCharleston Tower Tire Reclamation 5 tractor trailersDorchester Argos Cement 100 tractor trailersEdgefield Ridge Recyclers Inc. n
Pickens Pickens County Recycling Department 2,000 tiresSumter Kiln Direct 4,250 tires
l No Permitted Limit NOTE: For a list of registered waste tire haulers, contact DHEC at 1-800-768-7348.
TABLE 10.7: Permitted Incinerators in FY16
COUNTY FACILITY NAME TYPE PROCESS/STORAGE LIMIT TONS RECEIVEDBeaufort Haig Point Air Curtain Incinerator 700 CY 556
Beaufort Ulmer Brothers Inc. Air Curtain Incinerator 500 tons 18,161
Horry Lees Landing Air Curtain Incinerator 60 TPD 0
Jasper Coastal Debris LLC Air Curtain Incinerator 1,000 tons 1,282
Pickens Pickens County Air Curtain Incinerator 150 tons 4,921
TABLE 10.8: Permitted Used Oil Facilities in FY16
COUNTY FACILITY NAME PERMITTED RATEUSED OIL BURNERS (OFF-SPECIFICATION)
Dorchester Argos Cement LLC Harleyville Cement Plant 9,250,000 GPYDorchester Giant Cement Company 5,000,000 GPYOrangeburg Holcim US Inc. 49,000 TPY
USED OIL MARKETERSDorchester Universal Environmental Services LLC n
Sumter Giant Resource Recovery n
York Atlantic Industrial n
USED OIL PROCESSORSCharleston Delfin Used Oil Processing Facility 60,000,000 GPYChester Southeastern Petroleum 4,752,000 GPYDorchester Universal Environmental Services LLC 333,700 GPYGreenville Holston Group Inc. 150,000 TPYGreenville VLS Recovery Systems 8,320,000 GPYRichland Dilmar Fluid Services Inc. Used Oil Processing Facility 125,000 GPYSpartanburg Taylor Enterprises Inc. 500,000 GPYSumter Giant Resource Recovery 4,000,000 GPYSumter Kiln Direct 4,000,000 GPYYork Diversified Recycling Inc. 2,000,000 GPY
n No Permitted Limit

South Carolina Solid Waste Management Annual Report for Fiscal Year 2016 105
TABLE 10.9: Other Permitted Solid Waste Facilities in FY16
COUNTY FACILITY NAME PERMITTED RATE
LAND APPLICATION
Lancaster Bowers Fibers Inc. 10 TPA
Laurens County Fresh Inc. 10 TPA
Lexington JB Enterprises Resawing Inc. 500 TPY
Lexington Mungo Company l
Marlboro Domtar Paper Company LLC 10 TPA
Orangeburg Council Energy Inc. 10 TPA
Richland International Paper Company - Eastover Mill l
RESEARCH, DEVELOPMENT & DEMONSTRATION PROJECT
Anderson Anderson Regional Landfill LLC l
Greenville Enoree Landfill l
Laurens Refresh Services 224 CY
Lexington Refresh Services l
Williamsburg ARC Technology 14,924 TPY
SOIL TREATMENT
Sumter TK Tank Services Inc. 15,000 TPY
l No Permitted Limit

106 South Carolina Solid Waste Management Annual Report for Fiscal Year 2016

South Carolina Solid Waste Management Annual Report for Fiscal Year 2016 107
Solid Waste PlanningThe S.C. Solid Waste Policy and Management Act of 1991 (Act) – S.C. Code of Laws § 44-96-60 – requires the S.C. Department of Health and Environmental Control (DHEC) to develop a state solid waste management plan (State Plan).
The Act (Section 44-96-80) also requires county governments or regions to develop plans that are consistent with the State Plan. This section outlines the planning and other responsibilities of state and county governments.
The State Plan is required to address a 20-year planning period and include:
• An inventory of the amount and type of solid waste currently being disposed of;
• Solid waste disposal projections;
• An analysis of the types of facilities that will be needed to manage solid waste;
• An estimate of the current capacity in the state to manage solid waste;
• An evaluation of current solid waste management practices;
• Recommendations on how the state can meet its waste reduction and recycling goals; and
• A description of public education programs developed in partnership with local governments, businesses, industry and other organizations to – among other objectives – promote waste reduction and recycling.
The State Plan was adopted in 1992 and revised in 1999. In 2006, a revision established limits for facilities that use emerging technologies.
This annual report is an update to the State Plan as required by the Act.
SECTION
11
Local Planning Responsibilitiesµ
COUNTY/REGIONAL SOLID WASTE MANAGEMENT PLANS
As outlined above, each county is required to have a comprehensive solid waste management plan to ensure adequate disposal capacity. Counties may create and implement regional solid waste management plans.
These county/regional plans also are required to address a 20-year planning period and must be consistent with the State Plan. These plans must include:
• The amount and type of solid waste projected to be disposed of within the county or region;
• An estimate of the current capacity within that county or region to manage its solid waste;
• An analysis of existing and new facilities that will be needed to manage the solid waste generated;
• A description of the recycling program including material collected, type of public education/outreach initiatives offered to promote the program and the designation of a recycling coordinator;
• An outline of how the county or region expects to meet the state’s recycling and disposal goals; and
• An estimate of the cost of implementing the plan.
DHEC considers county/regional plans when making consistency determinations for solid waste facilities. Because the county government is responsible for providing management of all solid waste, the county/regional plan should address all solid waste streams, applicable facility types and methods of treatment.
DHEC encourages counties and regions to:
• Review their solid waste management plan periodically to assess the impact of regulatory changes, new permits, population changes and waste generation trends and update their plan as needed;
• Provide opportunities for cities, towns, the public and other affected parties within the county or region to have input in the plan revisions; and
• Consult the most recent copy of the “South Carolina Solid Waste Management Annual Report” for updated solid waste data.
Beyond the State Plan, DHEC has additional responsibilities including:
• Determining consistency with state and local or regional solid waste management plans;
• Determining consistency with local zoning and other local land-use ordinances; and
• Approving Demonstration of Need (DON) for certain solid waste management facilities.

108 South Carolina Solid Waste Management Annual Report for Fiscal Year 2016
CONSISTENCY DETERMINATIONS
Before a solid waste management facility can be permitted, it must be determined to be consistent with the State Plan, the county/regional plan as well as local zoning and land-use requirements.
Although a county or region is responsible for developing the local solid waste management plan, zoning ordinances and/or other land-use ordinances, DHEC is responsible for making an independent consistency determination.
DHEC looks at many factors when reviewing the county/regional plan and making its consistency decision. Chiefly, DHEC considers the amount of waste that the county or region is projected to generate during the 20-year planning period and reviews the county or region’s proposed means of managing that waste through a combination of transfer, disposal, incineration and/or recycling.
DEMONSTRATION OF NEED (DON)
DON refers to the criteria established for the geographical placement and allowable annual disposal rate of new and expanding solid waste management facilities. The original DON regulation was put into effect in June 2000. On
June 26, 2009, a revision to Regulation 61-107.17 SWM: Demonstration-of-Need became effective.
The DON regulation addresses commercial Class 3 landfills, commercial Class 2 landfills, commercial solid waste incinerators that incinerate waste other than wood waste or yard trimmings and commercial solid waste processing facilities that process waste destined for disposal at Class 3 landfills. The DON regulation stipulates that where there are at least two commercial solid waste management facilities of the same type within a specified planning area, no new facility is allowed.
CLASS 2 LANDFILLS
Class 2 landfills accept land-clearing debris, certain construction and demolition debris, certain household furniture and under certain conditions, animal carcasses. Class 2 landfills have a 20-mile planning radius. (See pages 114-115 for a map detailing Class 2 landfill locations and planning radii.) DHEC calculates allowable annual disposal at new Class 2 landfills using:
• 100 percent of the host county generation; and
• 30 percent of the generation in other counties within the planning area.
TABLE 11.1: DON Requirements for New Solid Waste Management (SWM) Facilities
COMMERCIAL SWM FACILITY
PLANNING AREA AROUND
FACILITY
NUMBER OF FACILITIES ALLOWED WITHIN PLANNING AREA
THROUGHPUT/ANNUAL TONNAGE CALCULATION FOR NEW FACILITIES
Class 2 Landfills 20 miles 2 100 percent of host county tonnage plus 30 percent of generation from other counties in planning area
Class 3 Landfills 75 miles 2 Total of 100 percent of host county tonnage and 50 percent of tonnage of counties in planning area without a Class 3 landfill; cannot exceed 30 percent of total state generation
Solid Waste Incinerators
75 miles 2 Based on the manufacturer’s design of the incinerator not to exceed 600 tons per day
Solid Waste Processing Facilities
75 miles 2 Total of 100 percent of host county tonnage and 50 percent of tonnage of other counties in planning area
Non-Commercial FacilitiesIn South Carolina, a facility is defined as “non-commercial” if it manages only the solid waste generated in the course of normal operations on property under the same ownership or control as the facility itself (i.e., “on site”). Non-commercial facilities are not required to demonstrate need.
State Planning Responsibilities«

South Carolina Solid Waste Management Annual Report for Fiscal Year 2016 109
Tonnage increases for existing Class 2 facilities are allowed only if the facility is operating within 20 percent of its permitted amount, (i.e., the amount of waste disposed per year is 80 percent or more of the annual permitted capacity).
If a Class 2 landfill qualifies for an increase, it can receive the lesser of the amount that disposal in the planning area has increased since the facility last received a permitted increase or 50,000 tons.
Class 2 landfills operating on the effective date of the regulation are allowed variances from certain DON requirements with respect to replacement facilities, tonnage increases and expansions.
See Table 11.2 for Class 2 waste generated for disposal by county for use in DON.
CLASS 3 LANDFILLS
Class 3 landfills accept municipal solid waste (MSW), industrial solid waste, sewage sludge, non-hazardous MSW incinerator ash and other non-hazardous waste. For new commercial Class 3 landfills, allowable tonnage is calculated using:
• 100 percent of the host county generation; and
• 50 percent of the waste generated in other counties within the planning area. (None is counted from other counties that have an existing Class 3 landfill.)
Class 3 landfills have a 75-mile planning radius. (See pages 116 and 117 for a map detailing Class 3 landfill locations and planning radii.)
The yearly disposal rate at an existing landfill is allowed to increase only if the facility is within 20 percent of its permitted disposal rate (i.e., the amount of waste
disposed of per year is 80 percent or more of the annual permitted capacity). If a Class 3 landfill qualifies for an increase, it can receive the lesser of the amount that disposal in South Carolina has increased since the facility last received a permitted increase or 150,000 tons.
In addition, the allowable yearly disposal rate at any Class 3 landfill cannot exceed 30 percent of the total solid waste generated in South Carolina that is destined for disposal in Class 3 landfills. Class 3 landfills operating on the effective date of the regulation are allowed variances from certain DON requirements. See Table 11.3 for Class 3 waste generated for disposal by county for use in DON.
SOLID WASTE INCINERATORS
The yearly throughput for a solid waste incinerator is based on the manufacturer’s design of the incinerator, but it cannot exceed 600 tons per day. The DON regulation does not apply to air curtain incinerators that receive only wood waste and yard trimmings. The planning area for a solid waste incinerator is 75 miles. There are no permitted MSW incinerators in the state.
SOLID WASTE PROCESSING FACILITIES
The maximum allowable yearly throughput of a solid waste processing facility that processes waste destined for disposal at a Class 3 landfill is equal to:
• 100 percent of the solid waste destined for disposal that is generated in the host county; and
• 50 percent of the waste generated in each county other than the host county, that falls wholly or partially within the 75-mile planning radius.
See pages 118-119 for a map detailing Class 3 Solid Waste Processing Facility locations and planning radii.

110 South Carolina Solid Waste Management Annual Report for Fiscal Year 2016
TABL
E 11
.2: C
lass
2 W
aste
Gen
erat
ed fo
r D
ispo
sal i
n To
ns fo
r U
se in
Dem
onst
rati
on o
f Nee
d
COU
NTY
FY04
FY05
FY06
FY07
FY08
FY09
FY10
FY11
FY12
FY13
FY14
FY15
FY16
Abbe
ville
13,5
104,
550
6,59
73,
256
2,55
48,
180
7,04
95,
527
6,71
97,
091
5,89
26,
495
5,46
0
Aike
n88
,717
79,5
2990
,100
102,
927
22,4
4381
,575
78
,348
76,8
0181
,383
89,5
1899
,419
93,3
3511
5,01
4
Alle
ndal
e1,
578
3,12
82,
354
2,17
11,
509
1,58
610
,482
3,44
03,
081
4,06
03,
631
9,42
94,
951
Ande
rson
37,3
1635
,817
51,3
1170
,823
63,6
7048
,079
45,2
5664
,807
72,5
0867
,203
72,4
2256
,114
67,7
75
Bam
berg
4,88
34,
811
6,17
56,
381
126
18,8
715,
357
13,6
935,
609
5,73
05,
446
7,33
95,
925
Barn
wel
l8,
329
10,4
1110
,921
10,7
0011
,686
11,8
68
9,48
16,
604
7,53
97,
588
9,93
48,
407
8,21
1
Beau
fort
121,
464
139,
916
141,
752
130,
391
86,2
8867
,541
60,0
5061
,081
65,4
6468
,058
61,1
9553
,698
86,5
87
Berk
eley
66,0
2373
,228
101,
411
98,5
1612
1,26
754
,266
33
,890
34,3
4751
,025
42,7
2446
,897
61,3
7855
,732
Calh
oun
4,13
93,
554
4,47
43,
176
3,05
73,
501
3,93
23,
109
2,36
93,
288
2,81
82,
047
2,32
7
Char
lest
on
296,
129
281,
444
333,
332
341,
113
440,
913
239,
234
208,
667
157,
689
149,
081
207,
029
216,
115
260,
770
294,
225
Cher
okee
10,6
5821
,604
16,2
409,
818
10,4
0210
,613
15,5
0923
,385
23,8
5315
,844
14,4
1218
,518
21,3
56
Ches
ter
21,8
944,
373
73,3
434,
517
251,
972
20,5
66
21,4
2630
,200
18,9
0719
,477
10,1
1814
,859
53,5
38
Ches
terfi
eld
12,8
0516
,194
14,7
3812
,181
011
,855
11,9
4611
,373
15,4
5324
,320
16,9
2012
,180
21,2
40
Clar
endo
n5,
500
9,29
68,
951
10,2
887,
352
10,1
949,
491
10,0
8610
,086
9,80
09,
764*
10,5
8811
,786
Colle
ton
13,1
5713
,823
17,4
3920
,900
23,6
6819
,522
21,5
7716
,966
15,5
0117
,066
19,5
9813
,344
15,8
72
Dar
lingt
on12
,614
17,3
5816
,264
16,7
5511
,721
16,1
00
23,9
3424
,681
20,9
4619
,088
21,3
4916
,191
18,9
99
Dill
on11
,412
40,3
448,
352
10,5
4911
,233
11,3
108,
342
10,2
639,
817
7,72
99,
105
12,1
518,
799
Dor
ches
ter
063
,910
77,2
9582
,099
94,6
4157
,612
24
,130
33,0
7836
,249
38,5
4031
,931
44,0
3096
,305
Edge
field
3,44
23,
244
13,1
1612
,479
6,11
99,
644
5,14
52,
919
6,01
58,
693
3,67
17,
561
11,1
15
Fair
field
126
209
399
284
780
343
859
1,51
061
41,
103
1,80
160
51,
708
Flor
ence
93,7
1534
,114
27,0
0254
,069
323,
917
96,5
57
121,
928
70,9
6470
,274
94,5
7410
8,38
412
9,37
983
,482
Geo
rget
own
33,6
8030
,087
51,5
8134
,270
49,8
8627
,765
26
,558
22,8
8617
,431
24,5
7311
,082
5,51
25,
117
Gre
envi
lle87
,157
142,
780
163,
834
161,
738
210,
924
168,
463
145,
991
185,
015
165,
827
193,
009
184,
304
206,
475
220,
050

South Carolina Solid Waste Management Annual Report for Fiscal Year 2016 111
COU
NTY
FY04
FY05
FY06
FY07
FY08
FY09
FY10
FY11
FY12
FY13
FY14
FY15
FY16
Gre
enw
ood
8,90
814
,696
20,1
7426
,714
21,0
6328
,908
13,8
3829
,587
9,22
18,
843
22,8
4721
,212
17,2
83
Ham
pton
7,44
48,
590
7,78
68,
993
7,46
210
,466
3,00
13,
901
2,83
73,
408
3,03
913
,428
8,76
6
Hor
ry17
0,85
615
5,67
622
6,67
233
2,58
314
1,00
710
9,95
382
,451
80,6
8790
,370
90,0
6510
4,53
713
2,21
814
3,04
7
Jasp
er81
217
63,
681
4,90
75,
837
3,13
73,
047
3,88
53,
500
4,32
14,
339
4,48
64,
971
Kers
haw
33,2
7741
,925
52,6
8842
,346
41,6
5241
,026
95,9
7338
,343
34,4
1741
,415
28,5
0027
,184
28,2
08
Lanc
aste
r34
,009
31,0
6726
,798
27,3
4465
,801
29,8
34
47,7
9146
,699
57,2
1455
,438
42,6
7827
,852
223
Laur
ens
19,6
346,
655
11,4
3516
,860
12,8
117,
359
9,99
013
,982
18,7
6113
,154
14,5
2711
,892
11,1
30
Lee
00
00
00
015
281
00
039
Lexi
ngto
n23
9,92
424
6,78
523
7,17
821
7,46
522
3,50
315
3,66
5 14
1,97
513
9,90
213
0,36
616
6,32
215
8,04
316
1,37
0*18
1,46
6
Mar
ion
16,4
9329
,818
62,9
6531
,299
19,4
1918
,875
12,6
4214
,459
7,84
611
,712
40,5
7735
,715
29,3
78
Mar
lbor
o1,
040
845
1,21
22,
491
010
,486
7,
810
10,2
197,
850
7,36
66,
272
6,83
36,
507
McC
orm
ick
957
1,33
54,
409
1,66
91,
009
1,02
31,
616
349
572
820
652
1,16
91,
110
New
berr
y99
71,
098
2,26
31,
219
10,5
777,
024
7,65
77,
430
8,33
98,
675
11,5
5717
,973
13,8
76
Oco
nee
29,2
7919
,867
23,8
3826
,385
24,3
3722
,577
20,1
8119
,753
7216
,109
18,3
6122
,234
26,0
46
Ora
ngeb
urg
24,0
9720
,915
26,4
1927
,360
50,5
7329
,922
24
,581
20,6
5317
,693
17,3
6214
,479
19,2
2524
,164
Pick
ens
23,8
8034
,754
17,9
5120
,807
21,8
6719
,806
15,7
2617
,229
18,4
1715
,547
17,1
6618
,785
20,1
70
Rich
land
206,
332
216,
945
216,
246
196,
701
198,
115
199,
056
123,
076
217,
915
199,
102
225,
910
266,
021
290,
518
261,
813
Salu
da1,
176
1,14
91,
960
1,46
51,
614
1,60
11,
521
416
376
818
1,33
11,
558
1,76
0
Spar
tanb
urg
71,5
5371
,917
71,0
4772
,161
80,2
1765
,229
60,4
7991
,667
94,3
5989
,547
74,5
1492
,602
104,
953
Sum
ter
42,7
4738
,934
55,7
1450
,625
50,6
564,
193
46,2
1343
,228
44,6
9545
,311
41,4
2743
,926
54,8
06
Uni
on1,
018
1,23
68,
421
26
3,08
23,
790
5,27
37,
416
2,59
527
4110
8
Will
iam
sbur
g2,
585
2,38
67,
220
6,49
13,
280
3,86
0 2,
786
4,06
54,
594
5,33
93,
772
5,33
84,
154
York
99,2
7798
,029
97,4
9312
5,96
911
3,17
174
,202
76
,603
81,5
7311
5,90
676
,077
82,7
5097
,743
104,
724
TOTA
L1,
984,
543
2,07
8,52
22,
420,
551
2,44
1,25
72,
850,
105
1,84
0,52
91,
702,
095
1,76
1,79
11,
729,
760
1,88
2,26
01,
913,
863
2,10
3,70
72,
264,
273
NO
TE: T
his
data
is u
sed
for
calc
ulat
ing
annu
al to
nnag
e lim
its a
s re
late
d to
R.6
1-10
7.17
– e
ffec
tive
June
26,
200
9. T
he h
isto
rica
l dat
a re
port
ed h
as b
een
adju
sted
to r
eflec
t cha
nges
in th
e D
ON
reg
ulat
ion.
*Thi
s to
nnag
e w
as u
pdat
ed b
ased
on
Clar
endo
n Co
unty
’s Cl
ass
2 FY
14 L
andfi
ll Re
port
.

112 South Carolina Solid Waste Management Annual Report for Fiscal Year 2016
TABL
E 11
.3: C
lass
3 W
aste
Gen
erat
ed fo
r D
ispo
sal i
n To
ns fo
r U
se in
Dem
onst
rati
on o
f Nee
d
COU
NTY
FY04
FY05
FY06
FY07
FY08
FY09
FY10
FY11
FY12
FY13
FY14
FY15
FY16
Abbe
ville
18,8
1715
,836
17,2
1917
,959
15,6
1113
,987
13
,874
15,8
4415
,874
17,4
1620
,811
14,5
3315
,695
Aike
n14
9,51
513
1,28
510
1,56
312
5,79
612
7,49
1 1
20,0
5811
4,55
613
1,59
613
3,03
011
0,03
912
0,72
411
3,76
212
4,64
8
Alle
ndal
e5,
903
6,99
05,
813
10,9
907,
932
7,20
9 6,
522
6,26
86,
593
5,34
47,
833
8,98
77,
248
Ande
rson
148,
849
161,
610
138,
783
130,
509
135,
794
115,
667
130,
955
131,
034
156,
567
110,
994
132,
288
157,
902
182,
188
Bam
berg
11,6
5211
,280
11,8
5710
,665
10,7
9910
,457
9,
461
9,50
59,
221
9,61
010
,173
9,14
29,
913
Barn
wel
l19
,373
20,1
2817
,683
19,4
8817
,474
15,7
05
15,7
5314
,839
13,8
7014
,184
14,7
6119
,413
19,5
83
Beau
fort
167,
383
181,
849
199,
029
177,
278
163,
868
177,
291
148,
470
149,
520
140,
405
141,
785
142,
490
155,
081
157,
874
Berk
eley
353,
891
314,
269
379,
387
636,
603
501,
690
339,
890
324,
793
310,
367
329,
172
321,
016
290,
429
281,
704
268,
092
Calh
oun
8,66
012
,143
10,6
1511
,109
11,1
0015
,331
23
,062
19,1
6518
,299
23,9
2614
,392
13,9
7017
,013
Char
lest
on
391,
841
285,
117
256,
089
281,
938
270,
676
274,
636
325,
997
497,
192
646,
461
416,
222
415,
193
624,
004
462,
841
Cher
okee
71,3
3271
,145
69,1
0688
,008
52,1
3777
,652
85
,767
143,
803
97,1
2186
,507
81,0
7379
,813
55,7
33
Ches
ter
37,0
7037
,847
43,4
9633
,323
63,7
5830
,115
26
,297
23,7
9927
,785
20,9
4524
,378
33,6
7337
,671
Ches
terfi
eld
21,9
4120
,206
17,5
4315
,168
15,4
2813
,572
18
,335
19,2
8218
,615
16,0
0212
,837
24,1
0424
,106
Clar
endo
n18
,403
8,11
210
,671
16,3
7716
,364
15,5
14
15,6
4414
,988
14,2
7113
,649
12,6
8912
,658
13,0
23
Colle
ton
35,0
7138
,826
39,0
1439
,358
44,6
8338
,032
10
0,13
735
,435
32,4
8532
,421
32,4
8635
,471
70,3
57
Dar
lingt
on52
,057
51,8
2347
,333
70,7
9688
,008
90,9
53
38,4
6137
,736
55,1
8340
,227
69,5
7244
,173
45,6
12
Dill
on26
,970
34,4
1631
,492
38,6
1635
,317
25,2
46
24,3
2120
,698
26,6
1920
,006
29,5
0719
,797
20,8
36
Dor
ches
ter
163,
930
139,
405
149,
202
121,
366
125,
826
123,
105
98,7
7489
,423
80,9
0481
,370
108,
820
116,
592
125,
117
Edge
field
13,9
6913
,406
13,3
7114
,473
15,5
3115
,158
13
,119
12,0
9614
,532
12,4
3117
,978
18,6
3116
,949
Fair
field
22,5
4621
,981
20,7
2122
,041
21,3
0622
,927
21
,214
20,8
0421
,438
24,3
3810
3,56
024
,248
25,4
12
Flor
ence
152,
909
154,
874
149,
919
135,
663
139,
811
165,
766
132,
582
237,
630
143,
999
140,
552
62,9
7713
5,70
312
7,48
7
Geo
rget
own
49,7
3650
,709
54,7
1951
,870
42,6
7543
,011
48
,446
58,6
5154
,806
61,1
8474
,359
99,5
1774
,721
Gre
envi
lle58
9,20
467
3,24
967
4,57
468
2,51
160
2,82
5 5
26,4
0245
1,34
443
3,49
043
0,66
653
3,13
843
2,92
348
4,57
254
5,61
8

South Carolina Solid Waste Management Annual Report for Fiscal Year 2016 113
COU
NTY
FY04
FY05
FY06
FY07
FY08
FY09
FY10
FY11
FY12
FY13
FY14
FY15
FY16
Gre
enw
ood
109,
407
120,
320
117,
341
112,
858
102,
693
84,8
63
98,9
6379
,053
82,2
0695
,435
77,3
7188
,275
97,4
23
Ham
pton
18,1
8822
,991
17,3
2218
,609
18,2
6612
,561
13
,179
11,7
3811
,347
11,6
6411
,301
10,8
9910
,446
Hor
ry22
7,46
922
2,93
523
7,58
224
6,12
624
8,98
823
5,31
4 22
8,84
322
7,39
522
3,91
522
5,74
423
7,93
223
9,69
425
8,88
5
Jasp
er27
,039
22,1
0022
,050
32,1
3932
,966
30,9
04
18,9
2813
,508
19,9
9219
,706
21,4
0515
,765
15,4
86
Kers
haw
40,1
6244
,233
43,3
6841
,904
37,7
0537
,240
43
,691
33,3
4245
,040
36,8
9436
,612
43,6
6946
,730
Lanc
aste
r35
,623
31,5
6133
,842
30,4
8934
,114
30,0
54
28,5
0630
,619
30,1
5127
,494
27,5
3240
,664
41,8
71
Laur
ens
51,6
3673
,090
49,2
1042
,475
39,6
7142
,978
45
,586
48,6
5839
,205
30,9
2933
,877
43,8
3841
,155
Lee
14,9
8115
,425
14,7
3714
,941
15,8
3714
,637
71
,965
82,9
4297
,272
89,2
1480
,549
90,3
4384
,141
Lexi
ngto
n25
6,22
617
1,69
219
3,26
819
0,58
318
8,29
517
1,12
4 16
9,82
016
0,94
118
4,18
820
7,56
317
4,85
018
8,22
722
9,41
4
Mar
ion
21,6
7314
,380
21,6
8326
,141
30,4
5421
,241
18
,733
17,0
158,
879
16,5
7611
,645
19,9
3222
,671
Mar
lbor
o21
,815
12,0
0413
,276
12,3
3210
,314
12,0
63
14,9
1315
,547
14,6
5317
,082
28,7
1515
,322
21,2
27
McC
orm
ick
5,18
34,
858
4,52
44,
505
4,23
24,
264
5,12
05,
099
4,61
14,
215
4,22
54,
547
4,68
4
New
berr
y48
,591
50,4
2049
,951
48,6
0339
,330
40,5
74
41,0
7238
,657
37,9
9140
,422
40,7
3145
,919
53,6
11
Oco
nee
45,5
3349
,368
53,3
0256
,408
54,8
6549
,338
51
,269
49,0
5650
,767
43,6
5520
,968
76,0
0768
,399
Ora
ngeb
urg
92,9
6994
,382
100,
988
89,3
8679
,245
75,7
17
70,4
4872
,983
90,8
7011
4,55
282
,593
85,5
7281
,044
Pick
ens
59,8
7354
,966
51,2
5558
,104
52,7
1553
,494
52
,257
57,2
5955
,259
51,9
3964
,786
59,9
4961
,557
Rich
land
349,
087
341,
907
376,
435
354,
977
353,
135
348,
475
457,
204
376,
749
360,
689
330,
810
317,
862
308,
418
313,
676
Salu
da9,
684
14,6
8711
,870
11,1
1611
,025
9,68
0 12
,673
22,0
7442
,534
8,05
28,
507
8,70
79,
286
Spar
tanb
urg
373,
060
351,
908
381,
084
381,
750
484,
612
412,
680
476,
809
562,
235
452,
484
389,
482
458,
943
463,
065
456,
338
Sum
ter
135,
220
156,
345
163,
056
108,
801
101,
854
94,4
52
86,8
2484
,673
78,3
0476
,653
60,9
3010
1,65
975
,257
Uni
on18
,988
28,3
0914
,178
18,7
7519
,803
30,7
02
20,3
3520
,217
21,8
0218
,731
16,3
9721
,197
18,0
99
Will
iam
sbur
g25
,582
28,2
5939
,045
45,5
0679
,698
52,6
14
34,2
8217
,842
9,62
011
,176
7,91
47,
181
8,97
6
York
152,
150
166,
059
161,
476
167,
139
160,
675
172,
941
148,
718
141,
161
143,
618
215,
786
144,
308
220,
219
175,
690
TOTA
L4,
671,
161
4,54
8,70
54,
630,
042
4,86
5,57
24,
726,
596
4,31
5,59
44,
398,
022
4,60
1,92
54,
593,
310
4,33
7,07
84,
202,
204
4,72
6,52
0*4,
643,
802
NO
TE: T
his
data
is u
sed
for
calc
ulat
ing
annu
al to
nnag
e lim
its a
s re
late
d to
R.6
1-10
7.17
– e
ffec
tive
June
26,
200
9. T
he h
isto
rica
l dat
a re
port
ed h
as b
een
adju
sted
to r
eflec
t cha
nges
in th
e D
ON
reg
ulat
ion.
*Thi
s am
ount
doe
s no
t inc
lude
128
tons
exp
orte
d to
Geo
rgia
that
is n
ot li
sted
by
coun
ty.

114 South Carolina Solid Waste Management Annual Report for Fiscal Year 2016

South Carolina Solid Waste Management Annual Report for Fiscal Year 2016 115
CLASS 2• Limits waste streams as
specified in Regulation 61-107.19 SWM: Solid Waste Landfills and Structural Fill
• Waste that is characterized as less than 10 times the maximum contaminant level (MCL) and approved by DHEC may be added to the permit for acceptance/disposal
• Operational Criteria:
• Unauthorized waste may be stored at the facility for 30 days; except that putrescible waste must be removed within 72 hours
• An annual survey to determine landfill capacity used and the remaining permitted capacity may be required on a case-by-case basis
• Require scales – but exempts scales for facilities permitted for less than 10,000 tons per year and on-site landfills
• Design Criteria:
• Require settlement calculations on the bottom elevation
• Require DHEC to inspect the landfill prior to waste placement
• Set cap requirements at 2 feet of soil
• Establish certain buffers when “Notice of Intent to File a Permit Application” is published
• Require groundwater monitoring and corrective action
• Set post-closure (20 years)
• Require closure and post-closure financial assurance
Demonstration of Need Map
Class 2 LandfillsAs of June 30, 2016
SOURCE: www.scdhec.gov/Agency/docs/lwm-regs/R61-107-19.pdf

116 South Carolina Solid Waste Management Annual Report for Fiscal Year 2016

South Carolina Solid Waste Management Annual Report for Fiscal Year 2016 117
CLASS 3• Requires waste
characterization through the Special Waste Analysis and Implementation Plan
• Requirement to inspect 10 percent of incoming loads
• Landfills that were permitted as Industrial Solid Waste Landfills prior to the effective date of this regulation are exempt from design criteria provided the waste streams remain below 30 times the MCLs
• Leachate recirculation allowed under permit modification
• Buffers established when “Notice of Intent to File a Permit Application” is published
• Notification required within 72 hours of receipt of hazardous or PCB wastes
• Monofills that accept coal combustion by-products testing less than 10 times MCL can be constructed with a clay liner system
• Slope-stability requirements
• Certification testing of cap to include:
• One permeability test per acre
• Four density/thickness tests per acre
Demonstration of Need Map
Class 3 LandfillsAs of June 30, 2016
SOURCE: www.scdhec.gov/Agency/docs/lwm-regs/R61-107-19.pdf
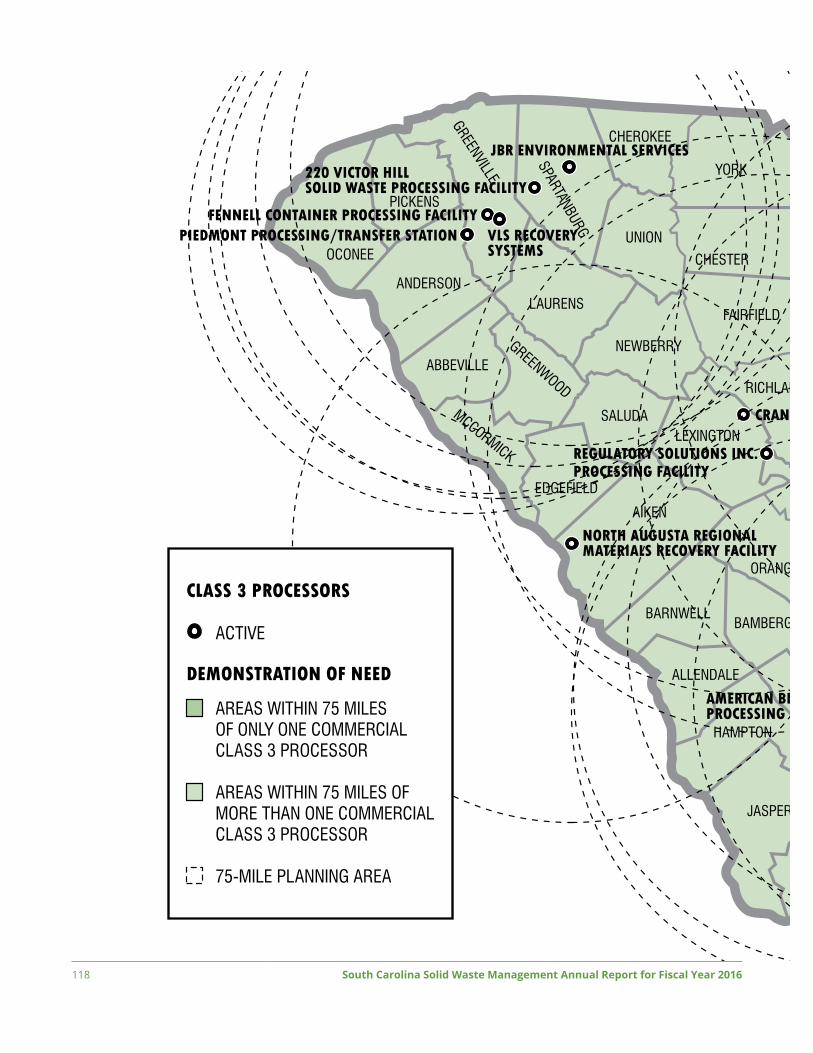
118 South Carolina Solid Waste Management Annual Report for Fiscal Year 2016

South Carolina Solid Waste Management Annual Report for Fiscal Year 2016 119
Dem
onstration of Need M
ap
Class 3 Solid Waste Processing Facilities
As of June 30, 2016

120 South Carolina Solid Waste Management Annual Report for Fiscal Year 2016
Printed April 2017 Total Printing Cost: $0.00 Number Printed: 500 Cost Per Unit: $0.00


RECYCLE donation steel cans reusedemonstration of need
municipal solid w
astefood recovery
COMPOST commodities PLANNINGsustainability NATURAL RESOURCES food bankC
URBSID
E RECYC
LING
plastic
growth
TIRES
tons environment LANDFILL
economic impact capacity disposal cost
bio
de
gra
da
ble
sin
gle
-stre
am
waste
to e
nerg
y
garbage
electronics generationmarketsec
ono
my
revenue INVESTMENT roll cart
EDUCATION conservationGREEN
construction & demolition debrisOIL
glassPA
PER
waste reductiontipping fee recycling rate MOTOR OIL
ALUMINUM CANS commerce metalenergy savings recycling bin
yard trimmingsWOOD PALLETS
This report was printed on 100 percent post-consumer, recycled-content paper made with biogas energy.
OR-1414 3/17
100%RECYCLEDCONTENT