Embed Size (px)
Citation preview
FINAL REPORT NOVEMBER 2016
Plastic Bags Ban Options – Cost Benefit Analysis
Report prepared for the Victorian Department of Environment, Land, Water and Planning
Marsden Jacob Associates Financial & Economic Consultants ABN 66 663 324 657 ACN 072 233 204 Internet: http://www.marsdenjacob.com.au E-mail: [email protected] Melbourne office: Postal address: Level 4, 683 Burke Road, Camberwell Victoria 3124 AUSTRALIA Telephone: 03 9882 1600 Facsimile: 03 9882 1300 Perth office: Level 1, 220 St Georges Terrace, Perth Western Australia, 6000 AUSTRALIA Telephone: 08 9324 1785 Facsimile: 08 9322 7936 Sydney office: 119 Willoughby Rd, Crows Nest New South Wales, 2065, AUSTRALIA Telephone: 0418 765 393
This report has been prepared in accordance with the scope of services described in the contract or agreement between Marsden Jacob Associates Pty Ltd ACN 072 233 204 (MJA) and the Client. Any findings, conclusions or recommendations only apply to the aforementioned circumstances and no greater reliance should be assumed or drawn by the Client. Furthermore, the report has been prepared solely for use by the Client and Marsden Jacob Associates accepts no responsibility for its use by other parties.
Copyright © Marsden Jacob Associates Pty Ltd 2016

MARSDEN JACOB ASSOCIATES
TABLE OF CONTENTS
Page
Executive summary ................................................................................................................ i
1. Introduction .................................................................................................................. 1
2. Background ................................................................................................................... 2
2.1 Rationale for intervention ............................................................................................................ 2
2.2 Experiences of other jurisdictions ................................................................................................ 3
3. Options to Reduce Plastic Bags ...................................................................................... 6
3.1 Option 1 – status quo ................................................................................................................... 6
3.2 Option 2 – ban on HDPE and biodegradable shopping bags ......................................................... 6
3.3 Option 3 – ban HDPE and biodegradable shopping bags and major retailers agree to a code of practice to reduce use of LDPE shopping bags .................................................................... 7
3.4 Option 4 – ban all plastic shopping bags ....................................................................................... 7
4. Cost Benefit Analysis ..................................................................................................... 8
4.1 Key findings................................................................................................................................. 8
4.2 Approach to the analysis .............................................................................................................. 9
4.3 Key Assumptions ......................................................................................................................... 9
4.4 Results ...................................................................................................................................... 12
4.5 Sensitivity analysis .................................................................................................................... 14
4.6 Concluding remarks ................................................................................................................... 16
5. Distributional impacts .................................................................................................. 17
5.1 Findings...................................................................................................................................... 17
5.2 Stakeholders .............................................................................................................................. 17
5.3 Distributional impact under each option .................................................................................... 19
Appendix A Model Assumptions .................................................................................... 20
LIST OF TABLES Page
Table 1: Results of cost benefit analysis ($2016) ................................................................................................... 13 Table 2: Major costs and benefits under a 10 year timeframe (NPV, $m, $2016) ................................................... 13 Table 3: Net results under different discount rates over a 10 year time frame ($2016) ........................................... 14 Table 4: Net results under different shopping bag costs over a 10 year time frame ($2016) ................................... 15 Table 5: Net results under different willingness to pay scenarios over a 10 year time frame ($2016) ...................... 15 Table 6: Net results under different HDPE shopping bags in use scenarios over a 10 year time frame ($2016) ....... 16 Table 7: Overview of costs and benefits of options and stakeholders affected ....................................................... 18 Table 8: Distribution of impact under a 10 year time frame (NPV, $m, $2016) ...................................................... 19 Table 9: General assumptions .............................................................................................................................. 20 Table 10: Use of plastic shopping bags ................................................................................................................. 21 Table 11: Cost and benefit assumptions (incremental to Option 1) ........................................................................ 22

VIC Environment Protection Authority Plastic Bags Ban - Cost-benefit analysis
ES.i
MARSDEN JACOB ASSOCIATES
Executive summary
Overview
Litter associated with single use plastic shopping bags is an issue of growing concern in
Victoria and globally. The Victorian Department of Environment, Land, Water and Planning
(DELWP) has engaged Marsden Jacob Associates (Marsden Jacob) to undertake a cost benefit
analysis (CBA) and distributional impact assessment of options to reduce the use of plastic
shopping bags in Victoria, with the aim of mitigating their adverse impacts on litter and the
environment.
Based on our preliminary analysis, we find that taking action to reduce all plastic shopping bags
and switching to reusable shopping bags is likely to deliver a net economic benefit to Victoria.
Options and approach
Marsden Jacob has assessed the following options in the CBA:
▪ Option 1: status quo with no specific regulation or management of plastic shopping bags.
▪ Option 2: a ban on plastic shopping bags with a thickness of less than 35 microns, known as
high density polyethylene (HDPE) shopping bags, and biodegradable shopping bags.
▪ Option 3: a ban on HDPE and biodegradable shopping bags and the major retailers agree to
a voluntary code of practice on reducing the use of all other plastic shopping bags, referred
to in this report as low density polyethylene (LDPE) shopping bags.
▪ Option 4: a ban on all plastic shopping bags (HDPE and LDPE) and biodegradable
shopping bags.
HDPE shopping bags are the type of plastic shopping bags commonly available in supermarkets
in Victoria, free of charge at the checkout. They are also commonly used in convenience stores
and takeaway food outlets. LDPE shopping bags are more commonly available at boutique
retail outlets such as apparel and electronic stores and department stores.
In this project Marsden Jacob conducted an assessment of the incremental costs and benefits of
Option 2 to Option 4, relative to Option 1. We calculated the net present value (NPV) and the
benefit cost ratio (BCR) of Option 2 to Option 4, over 5 year and 10 year timeframes. Under
Option 2 to Option 4, we assumed a ban on plastic shopping bags is announced on 1 July 2017
and takes effect on 1 July 2018. Sensitivity analysis was also undertaken to test how the net
results are affected by changes to key assumptions.
In the compressed timeframe available for this cost benefit analysis, we drew on publicly
available information on the use and flow of plastic shopping bags, and costs and benefits
associated with the different options. The sensitivity analysis shows that the results are highly
sensitive to a number of assumptions, in particular the results are most sensitive to the assumed
costs of plastic shopping bags and its alternatives due to the significant volume of plastic
shopping bags in use.
VIC Environment Protection Authority Plastic Bags Ban - Cost-benefit analysis
ES.ii
MARSDEN JACOB ASSOCIATES
Results
Our key findings are:
▪ Option 1: Under the status quo (Option 1), with no specific management on the use of
plastic shopping bags, the use of HDPE shopping bags would increase by about 1.61% per
year from 2016-17 to 2026-27, with HDPE bag consumption increasing from approximately
1.6 billion bags per year to 1.9 billion bags per year. The use of LDPE shopping bags is
assumed to increase by about 0.22% per year during the same period from about 130
million bags per year to 133 million bags per year.
▪ Option 2: Banning HDPE shopping bags and biodegradable bags under Option 2 delivers
the weakest result of the three alternative options. We estimate a net economic benefit for
Option 2 of $2.0 million (NPV) over 10 years and a net economic cost of $0.7 million
(NPV) over 5 years. The BCRs over 10 years and 5 years are 1.01 and 0.99 respectively.
Under Option 2, the benefits to consumers (reduced HDPE bag costs) and the environment
(avoided litter) of banning HDPE bags are offset to some extent by an increase in the take-
up of LDPE bags.
▪ Option 3: Banning HDPE bags and introducing a code of practice for LDPE bags under
Option 3 delivers either a net economic benefit or net cost depending on the period of the
analysis. In NPV terms, we estimated a net economic benefit for Option 3 of $15.3 million
over 10 years and a net economic cost of $1.8 million over 5 years. The BCRs over 10 years
and 5 years are 1.07 and 0.99 respectively. Compared to Option 2, there are additional
benefits to consumers and the environment from consumers switching from LDPE to re-
useable shopping bags.
▪ Option 4: Banning all plastic bags under Option 4 delivers the highest net economic benefit,
with more consumers substituting reusable shopping bags for plastic shopping bags. We
estimate a net economic benefit for Option 4 of $64.4 million and $28.5 million in NPV
terms over 10 years and 5 years respectively. The BCRs over 10 years and 5 years are 1.28
and 1.26 respectively.
▪ Sensitivity analysis: The estimated NPV results are highly sensitive to assumptions about
the costs of different types of shopping bags and the value of avoided litter. Sensitivity
analysis applying different assumptions to these key variables gives results for Option 4 (for
example) ranging from a net economic cost of $88.2 million in NPV terms over 10 years, to
a net economic benefit of $221.0 million in NPV terms over 10 years (see Section 4.5).
▪ Consumers would ultimately bear the majority of the net benefit or cost under all options,
ranging from a net economic cost to consumers of $6.2 million in NPV terms over 10 years
under Option 2, to a net economic benefit of $55.3 million in NPV terms over 10 years
under Option 4 (see Section 5).
▪ The retail industry would incur the highest cost under Option 3, about $41.4 million in NPV
terms over 10 years, under a voluntary code to reduce the use of LDPE shopping bags. The
retail industry may ultimately pass these costs on to consumers.
▪ The community and the environment would benefit from reduced litter, ranging from $10.0
million in NPV terms over 10 years under Option 2, to $13.0 million in NPV terms over 10
years under Option 4.
Because of the time constraints associated with the project the results presented in this report
should be regarded as preliminary. Subsequent analysis would benefit from industry
consultation to gain a better understanding of plastic shopping bag consumption numbers and
trends, and industry costs under the various options.

VIC Environment Protection Authority Plastic Bags Ban - Cost-benefit analysis
1.
1. Introduction
Marsden Jacob Associates (Marsden Jacob) has been engaged by the Victorian Department of
Environment, Land, Water and Planning (DELWP) to undertake a cost benefit analysis (CBA)
and distributional impact assessment of options to reduce the use of plastic shopping bags in
Victoria. Specifically, we’ve been asked to assess the following options:
▪ Option 1: status quo with no specific regulation or management of plastic shopping bags.
▪ Option 2: a ban on plastic shopping bags with a thickness of less than 35 microns, known as
high density polyethylene (HDPE) shopping bags, and biodegradable shopping bags.
▪ Option 3: a ban on HDPE and biodegradable shopping bags and the major retailers agreeing
to a voluntary code of practice on reducing the use of all other plastic shopping bags,
referred to in this report as low density polyethylene (LDPE) shopping bags.
▪ Option 4: a ban on all plastic shopping bags (HDPE and LDPE) and biodegradable
shopping bags.
HDPE shopping bags are the type of plastic shopping bags commonly available in supermarkets
in Victoria free of charge at the checkout. They are also commonly used in convenience stores,
takeaway food outlets and many smaller retailers. LDPE shopping bags are more commonly
available at boutique retail outlets such as apparel and electronic stores and department stores
and tend to be thicker than HDPE bags.
For the CBA, we conducted an assessment of the incremental costs and benefits of Option 2 to
Option 4, relative to Option 1. We calculated the net present value (NPV) and the benefit cost
ratio (BCR) of Option 2 to Option 4, over 5 year and 10 year timeframes. Under Option 2 to
Option 4, we assumed a ban on plastic shopping bags takes effect on 1 July 2018 after a 12
month transition period.
In the time available for the CBA, we drew on publicly available information on the use and
flow of plastic shopping bags from previous reviews initiated by the former Environment
Protection and Heritage Council (EPHC) and the National Litter Index. Publicly available
information from other Australian jurisdictions that have introduced a ban on plastic shopping
bags provided some data on the potential impacts of a ban. There were also some assumptions
requested by DELWP.
The major costs and benefits relevant for our analysis include:
▪ savings from the cost of HDPE and biodegradable shopping bags;
▪ costs of alternative plastic shopping bags (including LDPEs and reusable bags);
▪ avoided litter costs; and
▪ avoided landfill operating costs.
The structure of the rest of this report is as follows:
▪ Chapter 2: background on previous reviews into plastic shopping bags and the experience of
Australian jurisdictions that have implemented a ban on HDPE shopping bags.
▪ Chapter 3: discussion of the options.
▪ Chapter 4: results of our cost benefit analysis, including sensitivity testing.
▪ Chapter 5: distributional impacts from a ban under the options.

VIC Environment Protection Authority Plastic Bags Ban - Cost-benefit analysis
2.
2. Background
Litter associated with single use plastic shopping bags is an issue of growing concern in
Victoria and globally. In 2002, the former Environment Protection and Heritage Council
(EPHC) sought to reduce the environmental impacts of plastic bags in Australia. Subsequently,
a voluntary code of practice was entered into by major retailers in 2002 with the aim of reducing
plastic shopping bags by 50%. The voluntary code of practice operated from 2003 to 2005.
During that time, major retailers reduced plastic shopping bag use by between 41% to 44%
through educational campaigns and making available alternative shopping bags.1
In 2006, the EPHC committed to phasing out plastic bags by the end of 2008 and to consider
regulatory options to achieve this. However, in April 2008, after consulting on a Regulatory
Impact Statement and considering that the costs would outweigh the benefits, the EPHC
resolved not to take regulatory action to phase out plastic bags.2
Although the Australian Government decided not to take action, four states and territories
subsequently decided to implement a ban on plastic shopping bags. South Australia, the
Australian Capital Territory, Northern Territory and Tasmania have all implemented a ban on
plastic shopping bags with a thickness of less than 35 microns, excluding biodegradable
shopping bags and non-carry bags.
A rationale for government intervention on plastic shopping bags is discussed briefly below,
followed by a summary of the experiences from the four jurisdictions.
2.1 Rationale for intervention
As with all government interventions, action taken by government to control the consumption
and/or disposal of plastic bags can generally only be justified if market failure is occurring
because the market is not delivering an efficient outcome. Intervention may also be justified if
key government objectives (e.g. relating to the delivery of services, social equity etc.) can only
be met through an intervention.
At a broad level there are four main types of market failures: externalities, information failures;
public goods and natural monopolies (see Box 1). Government intervention on the consumption
of single use plastic bags may be justified because littering of plastic bags harms social amenity
and negatively affects the environment (e.g. ingestion of plastic by fauna). The costs of cleaning
up litter and minimising its resultant environmental harm are mostly borne by governments.
This means the costs are not borne by the producers or consumers of the bags so they do not
have a financial incentive to minimise the littering.
It is important to note however, that the presence of market failure does not of itself warrant
government intervention. Intervention can introduce its own distortions and can be costly,
especially if the intervention is poorly targeted. Thus it is important to establish that any
proposed interventions by government are likely to produce net benefits to society –
detailed in later sections of this report.
1 http://www.scew.gov.au/resource/ephc-archive-product-stewardship
2 Ibid.

VIC Environment Protection Authority Plastic Bags Ban - Cost-benefit analysis
3.
Box 1: Types of market failure
Externalities occur when the economic activity of one organisation or individual generates a positive
or negative impact for another without there being a market price associated with the impact.
Information failures occur when there is insufficient or inadequate information about issues such as
price, quality and availability for consumers, firms or investors to make well-informed decisions.
Public goods are goods or services that are “nonrivalrous" and "nonexcludable”, i.e. individuals
cannot be effectively excluded from using them and use by one person does not reduce their
availability to others. Examples include street lighting and public litter bins. The nature of a public
good means that it will generally need to be provided by government.
A natural monopoly occurs when it is more efficient for one firm to supply a good or a service than it
is for two of more firms to supply that service.
2.2 Experiences of other jurisdictions
2.2.1 South Australia
South Australia introduced a ban on plastic shopping bags with a thickness of less than 35
microns on 4 May 2009. The ban does not include biodegradeable shopping bags (tested in
accordance with a relevant standard).3 The ban came into effect following a four-month
transition period. During the transition period, retailers were required to provide alternatives to
plastic bags.
All retailers are subject to the ban and penalties apply for a retailer found not complying. An
independent review of the ban was conducted in November 2012.4 Key findings included:
▪ 65% of surveyed consumers brought their own shopping bags to the supermarket and 24%
of consumers purchased alternative bags from the supermarket.
▪ 50% of the retailers did not have any implementation issues. Some retailers cited issues
such as additional costs from stocking different bags in different states, unused plastic bags,
redesigning checkouts and additional theft.
▪ Retailers felt the Government’s information and marketing campaign was important in the
implementation of the ban.
▪ The purchase of bin liners increased following the ban, from 15% of surveyed customers
purchasing bin liners to 80% of surveyed customers.
▪ 45% decrease in plastic bag litter count from 2008-09 to 2011-12.
▪ Strong compliance by retailers with less than 10% of retailers having failed part of an
inspection with one expiation notice issued since 2008-09.5
3
https://www.legislation.sa.gov.au/lz/c/a/plastic%20shopping%20bags%20(waste%20avoidance)%20act%20200
8/current/2008.45.un.pdf.
4 http://www.zerowaste.sa.gov.au/upload/resource-centre/publications/plastic-bag-phase-
out/PBActReview_maspin_Nov2012_2%20-%20final.pdf.
5 DELWP advises that many of these are at shows and markets that attract interstate traders.

VIC Environment Protection Authority Plastic Bags Ban - Cost-benefit analysis
4.
2.2.2 Australian Capital Territory (ACT)
The ACT introduced a ban on plastic shopping bags on 1 November 2011. The ban applies to
plastic shopping bags with a thickness of less than 35 microns. Biodegradable shopping bags are
not included in the ban. Similar to South Australia, the ACT provided a four-month transition
period prior to the ban taking effect. Retailers must provide alternatives to plastic bags.6
Independent reviews of the ban were conducted in 2012 and 2014. In the 2012 review, the key
findings were:7
▪ 84% of surveyed customers brought their own shopping bags compared to 44% prior to the
ban.
▪ 41% reduction in the units of plastic shopping bags distributed by retailers, based on a
sample of data collected from retailers.
▪ Strong compliance by retailers with four breaches detected since the ban.
In the 2014 review, the key findings were:8
▪ 79% of surveyed customers brought their own shopping bags most of the time and 17% of
surveyed customers brought their own shopping bags some of the time.
▪ Significant increase in the sale of reusable boutique bags and “reusable woven bags”.9
▪ 36% reduction in landfill from all plastic bags (including single use, reusable plastic bags,
bin liners, and a proportion of “reusable woven bags”).
▪ A drop in the amount of plastic bag litter found in audits, from an average of “22 plastic
bags” before the ban to an average of “9 plastic bags” after the ban.
▪ Strong compliance by retailers with only four breaches detected since the commencement of
the ban.10
A recent visit to the ACT by the project team revealed that some supermarkets are offering
alternative plastic bags (typically LDPE) free of charge which confirms that some substitution is
occurring.
2.2.3 Northern Territory (NT)
A ban on plastic shopping bags with a thickness of less than 35 microns was introduced in the
NT on 1 September 2011 after a four-month transition period.11 Biodegradable bags are not
included in the ban. All retailers are required to comply.
An independent review of the ban was carried out in 2014.12 Key findings included:
▪ 46% of shoppers brought their own bags and 38% obtained at least one bag from the store.
6 http://www.legislation.act.gov.au/a/2010-49/20110701-46318/pdf/2010-49.pdf, Section 2.
7 http://www.environment.act.gov.au/__data/assets/pdf_file/0004/577057/12-
26082_Plastic_bag_review_report.pdf.
8 http://www.environment.act.gov.au/__data/assets/pdf_file/0017/602018/20140407-
ESDD_BagBan_Report_2014_Final.pdf
9 Reusable woven bags are manufactured from materials such as nylon, polypropylene or PVC.
10 No new breaches since the 2012 review.
11 http://www.ntepa.nt.gov.au/waste-pollution/plastic-bag-ban
12 https://ntepa.nt.gov.au/waste-pollution/plastic-bag-ban

VIC Environment Protection Authority Plastic Bags Ban - Cost-benefit analysis
5.
▪ 76% of observed retailers still offered an alternative plastic bag for free (thicker HDPE
bags, LDPE bags or paper bags) to customers.13
▪ Retailers did not report major challenges, some of the issues faced included training staff,
limited resources to implement the ban, and leftover stock of the banned plastic bags.
▪ Based on information provided by retailers, the estimated average annual sale of reusable
shopping bags increased from 256,000 before the ban to over 7 million. Similarly, the
estimated average annual sale of bin liners increased from 8 million to over 22 million.
▪ Based on information gathered for the National Litter Index, the average number of
lightweight plastic bag found dropped from 41 before the ban, to 17 after the ban.
2.2.4 Tasmania
A ban on plastic shopping bags (with a thickness of less than 35 microns) was introduced in
Tasmania on 1 November 2013 and applies to all retailers. Biodegradeable shopping bags that
meet Australian Standard 4376 are not subject to the ban.14
No review of the Tasmanian Scheme has been identified.
2.2.5 What can we learn from jurisdictions that have implemented bans?
Several key points emerge from reviews of the bans that have been implemented elsewhere in
Australia:
1. The bans on plastic bags significantly reduced the incidence of plastic bag littering.
2. The bans on plastic bags increased the proportion of shoppers that brought their own
shopping bags.
3. In the NT and ACT some supermarkets are offering alternative plastic bags free of charge
which indicates that some substitution is likely to be occurring.
4. The plastic bag bans have significantly increased the number of bin liners that are being
purchased.
13 17 retail stores were observed.
14 http://epa.tas.gov.au/policy/plastic-bags

VIC Environment Protection Authority Plastic Bags Ban - Cost-benefit analysis
6.
3. Options to Reduce Plastic Bags
The Victorian Department of Environment, Land, Water and Planning (DELWP) has requested
that four options associated with the consumption and littering of single use plastic shopping
bags in Victoria be examined:
▪ Option 1: status quo with no specific regulation or management of plastic shopping bags.
▪ Option 2: a ban on high density polyethylene (HDPE) plastic shopping bags with a
thickness of less than 35 microns, and biodegradable shopping bags.
▪ Option 3: a ban on HDPE and biodegradable shopping bags and the major retailers agreeing
to a voluntary code of practice on reducing the use of all other plastic shopping bags,
referred to in this report as low density polyethylene (LDPE) shopping bags.
▪ Option 4: a ban on all plastic shopping bags (HDPE and LDPE) and biodegradable
shopping bags.
These four options form the basis of the CBA and are discussed in more detail below. We also
discuss briefly the stakeholders impacted under each of the options, with further discussion on
distributional impacts included in Chapter 5.
3.1 Option 1 – status quo
Under this option, the current policy environment will continue until 2026-27 (the end of the
evaluation period for the purpose of the CBA). There is currently no specific regulation or
management of plastic bag use and we assume that this situation will continue.
The use of plastic shopping bags has increased in recent years and, in the absence of a ban, we
assume an increasing trend in the use of plastic shopping bags over the evaluation period (based
on forecast population growth and confidential data from previous analysis for other
jurisdictions).
3.2 Option 2 – ban on HDPE and biodegradable shopping bags
A ban on plastic shopping bags with a thickness less than 35 microns is announced 1 July 2017
with a 12-month transition period, which means the ban would come into effect on 1 July 2018.
The ban would apply to all retailers. Biodegradable plastic shopping bags would also be subject
to the ban, however, all other types of non-carry HDPE bags (plastic bags without handles) –
such as barrier bags - would be excluded, as would any other type of plastic bag such as bin
liners, garbage bags and reusable polypropylene bags.
As experienced by other jurisdictions that have implemented a ban on HDPE bags, the
Government will incur costs in legislating and enforcing the ban, and in conducting an
education campaign for retailers and consumers. The retail industry will incur set up costs.
Consumers may face additional costs from purchasing alternative bags (re-useable bags and/or
LDPE bags). Consumers may also face additional costs to purchase plastic ‘bin liners’ used for
the disposal of household waste, noting that household waste disposal is currently an important
secondary use of HDPE bags.

VIC Environment Protection Authority Plastic Bags Ban - Cost-benefit analysis
7.
3.3 Option 3 – ban HDPE and biodegradable shopping bags and major retailers agree to a code of practice to reduce use of LDPE shopping bags
This option is the same as Option 2 in assessing a ban on HDPE and biodegradable shopping
bags. Additionally, under this option we assume major retailers would agree to a new voluntary
code of practice to reduce the use of LDPE shopping bags by 50% by 2021 (from 2019). Under
the 2002 national Code of Practice for the Management of Plastic Bags, major retailers agreed
to reduce the use of HDPE bags by 50% by providing information to customers and by
providing alternatives to HDPE bags in store. Under a new code of practice, the major retailers
would similarly agree to provide information to customers about alternatives to LDPE bags,
provide alternatives to LDPE bags in store, and provide LDPE recycling receptacles in store.
The stakeholders impacted under this option are broadly the same as Option 2. However, there
would be a greater impact on department stores and similar retailers which tend to provide
LDPE rather than HDPE bags to customers.
3.4 Option 4 – ban all plastic shopping bags
Under this option, all HDPE and LDPE shopping bags designed to carry goods from retailers
where they were bought would be banned, including biodegradable bags. The ban would be
announced on 1 July 2017 with a 12-month transitional period, which means the ban would take
effect from 1 July 2018.
The stakeholders impacted under this option are broadly the same as Option 3.

VIC Environment Protection Authority Plastic Bags Ban - Cost-benefit analysis
8.
4. Cost Benefit Analysis
This chapter presents the results of the cost benefit analysis (CBA) and compares the
performance of options using two key metrics:
▪ Net Present Value (NPV), which is the Present Value (PV) of economic benefits delivered
by the option less the PV of economic costs incurred.
▪ Benefit Cost Ratio (BCR), which is the ratio of the PV of economic benefits to PV of
economic costs.
The NPV measures the expected benefit (or cost) to society of implementing the policy option
expressed in monetary terms, whereas the BCR identifies the option that provides the highest
benefit per unit of cost.
We conducted the CBA based on guidelines by the Victorian Department of Treasury and
Finance and the estimates presented in this chapter are calculated on a Victorian basis. Our
evaluation period is 2016-17 to 2026-27, with implementation of the options, including bans on
the relevant plastic bags, assumed to take effect from 1 July 2018. Costs and benefits of Option
2 to Option 4 are assessed incrementally to Option 1 (status quo) over 5 year and 10 year
timeframes. We have also conducted sensitivity analyses on the CBA results to test parameter
values that could materially change the overall net result.
4.1 Key findings
The key findings from our analysis are:
▪ Option 1: Under the status quo (Option 1), with no specific management on the use of
plastic shopping bags, the use of HDPE shopping bags would increase by about 1.61% per
year from 2016-17 to 2026-27, with HDPE bag consumption increasing from approximately
1.6 billion bags per year to 1.9 billion bags per year. The use of LDPE shopping bags is
assumed to increase by about 0.22% per year during the same period from about 130
million bags per year to 133 million bags per year.
▪ Option 2: Banning HDPE shopping bags and biodegradable bags under Option 2 delivers
the weakest result of the three alternative options. We estimate a net economic benefit for
Option 2 of $2.0 million (NPV) over 10 years and a net economic cost of $0.7 million
(NPV) over 5 years. The BCRs over 10 years and 5 years are 1.01 and 0.99 respectively.
Under Option 2, the benefits to consumers (reduced HDPE bag costs) and the environment
(avoided litter) of banning HDPE bags are offset to some extent by an increase in the take-
up of LDPE bags.15
▪ Option 3: Banning HDPE bags and introducing a code of practice for LDPE bags under
Option 3 delivers either a net economic benefit or net cost depending on the period of the
analysis. In NPV terms, we estimated a net economic benefit for Option 3 of $15.3 million
over 10 years and a net economic cost of $1.8 million over 5 years. The BCRs over 10 years
and 5 years are 1.07 and 0.99 respectively. Compared to Option 2, there are additional
benefits to consumers and the environment from consumers switching from LDPE to re-
useable shopping bags.
15 The benefit to consumers of reduced HDPE bags are offset by the purchase of reusable bags and bin liners.
VIC Environment Protection Authority Plastic Bags Ban - Cost-benefit analysis
9.
▪ Option 4: Banning all plastic bags under Option 4 delivers the highest net economic benefit,
with more consumers substituting reusable shopping bags for plastic shopping bags. We
estimate a net economic benefit for Option 4 of $64.4 million and $28.5 million in NPV
terms over 10 years and 5 years respectively. The BCRs over 10 years and 5 years are 1.28
and 1.26 respectively.
▪ Sensitivity analysis: The estimated NPV results are highly sensitive to assumptions about
the costs of different types of shopping bags and the value of avoided litter. Sensitivity
analysis applying different assumptions to these key variables gives results for Option 4 (for
example) ranging from a net economic cost of $88.2 million in NPV terms over 10 years, to
a net economic benefit of $221.0 million in NPV terms over 10 years.
Because of the time constraints associated with the project the results presented in this report
should be regarded as preliminary. We have conducted sensitivity analysis to address the
uncertainties underlying the assumptions. Subsequent analysis would benefit from industry
consultation to gain a better understanding of plastic bag consumption numbers and trends, and
industry costs under the various options.
4.2 Approach to the analysis
The costs and benefits associated with Options 2 to 4 have been assessed incrementally to
Option 1 (status quo) over 5 year and 10 year timeframes. We calculated the NPV and BCR for
each alternative option incrementally to the status quo.
Economic impacts (costs and benefits) are assessed in our model. This means financial
transfers, if any, between stakeholder groups are excluded from the analysis because they do not
result in a net economic cost or benefit.
In the time available for this CBA, we did not undertake a comprehensive new materials flow
analysis. Instead, we estimated the use of plastic shopping bags from available survey data on
their ultimate fate – landfill, litter and recycling – cross-checking these estimates with data from
previous analyses.
4.3 Key Assumptions
A detailed list of assumptions is included under Appendix A. Some key assumptions that
underpin the analysis are discussed below.
4.3.1 Use of shopping bags
In our analysis, we focused on HDPE, LDPE and reusable bags as the main types of shopping
bags. We estimate that biodegradable bags make up about 0.3% of the use of shopping bags in
Victoria. Given this low percentage, for the purpose of our CBA, biodegradable bags have been
included with HDPE shopping bags, i.e. we did not separately account for them.
Based on data from the National Litter Index, Victorian plastic bag consumption estimates and
studies undertaken in NSW,16 we estimated the amount of different types of shopping bags that
end up in landfill, recycling and litter as in 2014-15. We then estimated a growth rate for HDPE
and LDPE bags based on forecast population growth in Victoria and confidential data from
16 APC Waste Consultants, Audit of Plastic Bags in Household, Public Litter and Café/Restaurant Waste Bins and
Stormwater Pits, 2016.

VIC Environment Protection Authority Plastic Bags Ban - Cost-benefit analysis
10.
similar studies undertaken in other jurisdictions around Australia. We estimate that under the
status quo (Option 1), the use of HDPE shopping bags would increase by about 1.61% per year
during our evaluation period from approximately 1.6 billion bags per year in 2016-17 to
approximately 1.9 billion bags per year in 2026-27. The use of LDPE shopping bags would
increase by 0.22% per year during the same period from about 130 million bags to about 133
million bags.
We have assumed the proportion of shopping bags that end up in landfill, recycling and as litter
remains constant in our evaluation period and applies under all options.
4.3.2 Impact of a ban on plastic shopping bags
Under Option 2, we assume the following impacts based on data from Australian jurisdictions
that have introduced a ban on HDPE shopping bags:
▪ About 90% of consumers switch to LDPE and reusable bags (we assume 30% switch to
LDPE and 60% switch to reusable bags), and the rest of consumers decide not to use a
shopping bag at all due to their small purchase.
▪ The use of plastic, purpose made, garbage bin liner bags increases by 275% as consumers
who were using HDPE shopping bags for household waste disposal prior to the ban now
switch to purpose made bin liners.
Where a ban on plastic bags applies under Option 2 (HDPE), Option 3 (HDPE) and Option 4
(HDPE and LDPE), we assume the ban reduces the use of HDPE, biodegradable and LDPE
bags by 10% during the transitional period. Following the implementation of the ban, we
assume the use of HDPE, biodegradable and LDPE bags reduces by 95% by 2022-23, and by
99% by 2026-27. Most of the jurisdictions that have a ban on HDPE shopping bags reported a
high level of compliance based on sample audits of retailers. However, the level of compliance
is dependent on the level of enforcement. Under Option 3, the use of LDPE bags reduces by
50% by 2021 and remains constant thereafter.
4.3.3 Plastic bag litter
Quantity of litter
Base year estimates of the quantities of plastic bag litter were derived from surveys of two types
of plastic bag litter in Victoria undertaken as part of the National Litter Index (NLI).17
▪ ‘Bags - supermarket type light weight carry bags’, assumed to be HDPE bags; and
▪ ‘Bags - heavier glossy typically branded carry bags’, assumed to be LDPE bags.
The survey data was then scaled up to obtain state wide estimates of litter for HDPE and LDPE
using the same scaling up factor sourced from previous studies.18 Estimates derived in this way
for 2014-15 are approximately:
▪ 9.6 million bags of HDPE littered (about 1% of total HDPE bags);19 and
17 Macgregor Tan Research, 2015. National Litter Index Annual Report 2014/ 2015. Prepared for Keep Australia
Beautiful National Association.
18 See Marsden Jacob Associates, 2013. Distributional and Cost Benefit Analysis for the Packaging Impacts
Decision Regulation Impact Statement: Assumptions Report.

VIC Environment Protection Authority Plastic Bags Ban - Cost-benefit analysis
11.
▪ 1.0 million bags of LDPE littered (about 1% of total LDPE bags).
NLI plastic bag data for the past 10 years does not reveal a clear trend. In the absence of a clear
trend, estimates of litter in future years under the base case were therefore derived by assuming
the base year rate of litter remains constant in the evaluation period.
Litter destination – land and marine
Numerous studies point to substantial potential ecological, amenity and productive impacts of
plastics entering the marine environment.20 Noting this, an estimate has been made of the total
quantity of plastic bag litter that enters the marine environment. This was done by applying
estimates of plastic packaging marine litter, sourced from a previous study,21 to derive an
estimate of ‘flexible packaging’ marine litter’. NLI litter data, previously mentioned, was then
used to derive an estimate of the proportion of flexible packaging marine litter that is plastic
bags (44%). This estimate was used in turn to derive an estimate of the proportion of plastic bag
litter entering the marine environment – estimated at 48%, with the remaining 52% of plastic
bags remaining on land, including in waterways.
Willingness to pay - value of reduced litter
Households and the broader community place a value on litter reduction. At present there is a
paucity of information available on the damage costs of litter, especially litter entering the
marine environment, and/or the community’s willingness to pay (WTP) to reduce that litter.
Marsden Jacob has recalibrated estimates of the WTP of households to reduce public place
litter, derived through a previous choice modelling survey.22
There is substantial uncertainty attached to the estimates of WTP derived from the previous
study. We have taken a more conservative approach to estimating the community’s WTP to
avoid litter based on the cost of voluntary litter clean-up activities, with the imputed value of a
volunteer’s labour providing a shadow price for the economic cost of litter. Based on our
previous studies conducted for the NSW Government and the Australia Government, we have
derived a ‘most likely’ WTP value for avoided litter of $1,876 per tonne or about 1 cent per bag
for HDPE bags and 3 cents per bag for LDPE bags.23
There are reasons to believe that this value could substantially understate the value of reducing
litter in the marine environment:
19 This is within the range of 30-50 million HDPE bags littered Australia wide (equivalent to 7-12 million in VIC
on a per capita basis), estimated in the Hyder report on Plastic Retail Carry Bag Use undertaken for the EPHC
in 2007.
20 See for example: Jeftic, L, Sheavly, S and Adler, E, 2009. Marine Litter: A Global Challenge, UNEP, Nairobi;
and APEC Marine Resources Conservation Working Group, 2009. Understanding the Economic Benefits and
Costs of Controlling Marine Debris in the APEC Region, APEC.
21 Marsden Jacob Associates, 2013. Distributional and Cost Benefit Analysis for the Packaging Impacts Decision
Regulation Impact Statement: Assumptions Report.
22 PwC, 2010. Estimating consumers’ willingness to pay for improvements to packaging and beverage container
waste management, Environment Protection and Heritage Council.
23 Avoided costs of cleaning up litter by local councils are captured in this value. Costs of avoiding litter or
cleaning up litter incurred by local councils in Victoria are in the order of $400 to $900 per tonne depending on
the clean up method, type of litter and location. The community’s WTP to avoid litter is estimated to be higher
than actual clean-up costs.

VIC Environment Protection Authority Plastic Bags Ban - Cost-benefit analysis
12.
▪ evidence from available surveys indicates that people are especially concerned about litter
on beaches and other aspects of the marine environment;24 and
▪ available evidence suggests that the cost of cleaning up litter in marine environments could
be roughly 5 to 60 times the cost of cleaning up land based litter.25
Noting these points, we have derived a separate shadow price estimate for the economic cost of
marine litter, based on cost of voluntary clean-up activities that were specifically focussed on
the marine environment (beaches and underwater sites) in Australia.26 We estimate a most
likely WTP value for avoided marine litter of $36,512 per tonne,27 equivalent to about 20 cents
per bag for HDPE bags and 55 cents per bag for LDPE bags.28
A great deal of uncertainty is attached to both the land and marine litter values. Sensitivity
analysis is therefore applied to testing low and high values for avoided litter of:
▪ land litter – $1,101 per tonne (low), $17,811 per tonne (high)
▪ marine litter – $20,060 per tonne (low), $91,124 per tonne (high).29
4.4 Results
The results from our initial analysis are presented in Table 1. Banning HDPE shopping bags and
biodegradable shopping bags under Option 2 delivers a net economic benefit of $2.0 million in
NPV terms over a 10 year period. Both Option 3 and Option 4 deliver a net economic benefit in
NPV terms over a 10 year period, with a net benefit of $15.3 million for Option 3 and $64.4
million for Option 4. The results under a 5 year timeframe are worse than under a 10 year
timeframe as implementation costs are incurred upfront and the benefits stream is reduced under
a 5 year time frame compared to 10 years.
The results suggest most of the environmental benefits occur through Option 2 and don't
increase substantially in Options 3 and 4.
24 See for example, APEC Marine Resources Conservation Working Group, 2009. Op Cit
25 Jambeck et al., 2015; ‘Plastic waste inputs from land into the ocean’, in Science Vol. 347, Issue 6223, pp. 768-
771; Jeftic et al., 2009, Op. Cit; Macgregor Tan Research, 2015, Op Cit; Ocean Conservancy, 2016, 30th
Anniversary International Coastal Cleanup Annual Report
26 Ibid
27 This is a central estimate of cleaning up litter in coastal areas (beaches, bays and estuaries) and the open ocean.
Costs of cleaning up litter in coastal areas range from $11,778 to $27,252 per tonne (central estimate $20,060).
Costs of cleaning up litter in the open ocean range from $53,501 to $123,793 per tonne (central estimate
$91,124). These estimates were drawn from data on voluntary clean-up activities undertaken in the marine
environments (see in particular Jeftic et al., 2009).
28 We note that these estimates are still substantially less than the $1.00 per bag applied in the 2006 CBA of
options to phase out plastic bags for the EPHC.
29 Note the extra high values attributed to the high end estimates (relative to most likely estimates) acknowledges
the fact that plastic bag litter has a very high volume to weight ratio.

VIC Environment Protection Authority Plastic Bags Ban - Cost-benefit analysis
13.
Table 1: Results of cost benefit analysis ($2016)
10 year 5 year NPV $m BCR NPV $m BCR
Option 2 2.0 1.01 -0.7 0.99
Option 3 15.3 1.07 -1.8 0.99
Option 4 64.4 1.28 28.5 1.26
Source: Marsden Jacob analysis
The major costs and benefits that drive the net result are shown in Table 2. The largest benefit
from a ban on plastic shopping bags under all options is the reduced cost of HDPE shopping
bags. This benefit is offset by the cost of alternative bags that are needed to replace HDPE
shopping bags. Under Option 2, the cost of replacement LDPE bags partly offsets the benefits
from the reduced use of HDPE shopping bags. Under Option 3 and Option 4, the additional
benefit from the reduced use of LDPE shopping bags also results in an overall net benefit over
10 years, and a net benefit for Option 4 over 5 years.
Table 2: Major costs and benefits under a 10 year timeframe (NPV, $m, $2016)
Option 2 Option 3 Option 4
Reduced cost of HDPE and biodegradable shopping bags
146.7 146.7 146.7
Cost of LDPE shopping bags -55.0 73.4 138.3
Cost of reusable bags -68.5 -143.9 -200.3
Cost of bin liners -29.4 -29.4 -29.4
Avoided litter cost – land 0.7 0.5 0.5
Avoided litter cost – marine 6.7 8.5 9.4
Avoided landfill cost 2.7 3.0 3.0
Cost of implementing the code of practice -41.0
Source: Marsden Jacob analysis.
Note: Positive values reflect benefits and negative values reflect costs in the analysis.
These results differ from the earlier analysis undertaken by the EPHC (refer to Section 2),
because the NPV and BCR outcomes are positive for Options 3 and 4. The key factors that
explain the difference are:
▪ the assumed cost of alternative bags has decreased substantially since 2008;
▪ the assumed cost of bin liners has decreased substantially since 2008;
▪ we have not assumed any substitution with paper bags;30
▪ additional infrastructure costs to retailers associated with providing re-useable bags is now
assumed to be negligible – the necessary infrastructure is now largely in place;
▪ because the relevant infrastructure is now in place there is no additional time cost imposed
on consumers associated with using re-useable bags. This has been confirmed in reviews
undertaken by jurisdictions that have already implemented a ban; and
▪ production of single use plastic bags is mainly overseas.
30 We have found no discussion of substitution with paper bags in other jurisdictions that have introduced a ban on
plastic shopping bags.

VIC Environment Protection Authority Plastic Bags Ban - Cost-benefit analysis
14.
4.5 Sensitivity analysis
As a CBA is based on a series of assumptions, there is a degree of uncertainty around the
results. We conducted sensitivity testing to clarify which assumptions can materially change the
overall result.
4.5.1 Discount rate
In accordance with guidelines by the Victorian Department of Treasury and Finance,31 the
stream of costs and benefits (in real terms) has been discounted using a real discount rate of 4%.
We conducted sensitivity testing using a real discount rate of 7%. Table 3 shows the impacts of
these differing rates.
Table 3: Net results under different discount rates over a 10 year time frame ($2016)
Option 2 Option 3 Option 4
Discount rate NPV $m BCR NPV $m BCR NPV $m BCR
4% (base case) 2.0 1.01 15.3 1.07 64.4 1.28
7% 1.4 1.01 11.7 1.06 54.4 1.27
Source: Marsden Jacob analysis.
4.5.2 Cost of shopping bags
We tested ranges of different shopping bag costs for their impact on the net result, as well as the
cost of bin liners.32 The ranges for the different bags are:
▪ HDPE bags: 1.0c (low), 1.2c (likely), 1.4c (high).
▪ LDPE bags: 7.0c (low), 15c (likely), 24c (high).
▪ Reusable bags: 65c (low), 85c (likely), $1.05 (high).
▪ Bin liners: 1.0c (low), 1.2c (likely), 1.6c (high).
In our analysis, we estimated a conservative range of net benefits by using the low estimates of
HDPE and LDPE bag costs, and high estimates of reusable bag costs and bin liner costs.
Conversely, we estimated a less conservative range of net benefits by using high estimates of
HDPE and LDPE bag costs and low estimates of reusable bag costs and bin liner costs.
The analysis presented in Table 4 shows that the net results are highly sensitive to the cost of
the different types of bags, due to the high volume of shopping bags used.
The sensitivity analysis also indicates that Options 3 and 4, while likely to result in higher NPVs
and BCRs than Option 2, are also more risky as they require a greater amount of change than
Option 2 and with more uncertainty.
31 Department of Treasury and Finance, Victorian Guide to Regulation, Toolkit 2 Cost Benefit Analysis, July 2014.
32 As discussed in Chapter 5, we assumed the costs of shopping bags are ultimately borne by consumers.

VIC Environment Protection Authority Plastic Bags Ban - Cost-benefit analysis
15.
Table 4: Net results under different shopping bag costs over a 10 year time frame ($2016)
Option 2 Option 3 Option 4
NPV $m BCR NPV $m BCR NPV $m BCR
Likely (base case)
2.0 1.01 15.3 1.07 64.4 1.28
Low net benefit -18.8 0.88 -90.6 0.65 -88.2 0.69
High net benefit
14.3 1.09 121.1 1.68 221.0 2.20
Source: Marsden Jacob analysis.
4.5.3 Willingness to pay (WTP) to avoid litter
As discussed in Chapter 3, there is a degree of uncertainty around the value of avoided litter
from a ban on plastic shopping bags. We tested the following ranges of benefits:
▪ Avoided cost of land litter: $1,101 per tonne (low), $1,876 per tonne (most likely), $17,811
per tonne (high).
▪ Avoided cost of marine litter: $20,060 per tonne (low), $36,512 per tonne (mostly likely),
$91,124 per tonne (high).
The analysis in the table below shows that WTP estimates make a material impact on the net
result, but their impact is not as significant as the cost of shopping bags. Indeed, even if the
value of avoided marine litter was set at $0 per tonne, the BCR of Option 3 under the ‘likely’
scenario only marginally declines from 1.07 to 1.03.
Table 5: Net results under different willingness to pay scenarios over a 10 year time frame ($2016)
Option 2 Option 3 Option 4
NPV $m BCR NPV $m BCR NPV $m BCR
Likely (base case)
2.0 1.01 15.3 1.07 64.4 1.28
Low -1.3 0.99 11.3 1.05 59.9 1.26
High 17.9 1.12 32.0 1.15 82.9 1.36
Avoided marine litter = 0
-4.7 0.97 6.8 1.03 54.9 1.24
Source: Marsden Jacob analysis.
4.5.4 Plastic shopping bag use
Given the large volume of HDPE shopping bags in use and that our estimate of the number of
HDPE shopping bags in Victoria has been derived from different sources, we tested scenarios
where the number of HDPE shopping bags in use at the start of our evaluation period is 10%
lower and 10% higher than our base case. As shown in Table 6, whilst the net results are
sensitive to the number of HDPE bags in use, the impact is not significant.33
33 In the low scenario, a net cost is estimated under Option 2 as less HDPE shopping bags are phased out (from a
lower base).

VIC Environment Protection Authority Plastic Bags Ban - Cost-benefit analysis
16.
Table 6: Net results under different HDPE shopping bags in use scenarios over a 10 year time frame ($2016)
Option 2 Option 3 Option 4
NPV $m BCR NPV $m BCR NPV $m BCR
Likely (base case)
2.0 1.01 15.3 1.07 64.4 1.28
Low (-10%) -1.3 0.99 9.9 1.05 60.1 1.27
High (+10%) 5.3 1.03 20.7 1.09 68.6 1.28
Source: Marsden Jacob analysis.
4.6 Concluding remarks
The results presented above should be regarded as preliminary. Further analysis would benefit
from consultation with the retail industry to gain a better understanding of plastic bag
consumption numbers and trends, and industry costs under the various options.
Further analysis could also include a life cycle comparison of costs, including externalities for
plastic shopping bags and their substitutes. However, quantifying externalities would likely be
difficult and increase the uncertainty of the analysis without having a significant impact on the
overall result, if new valuation studies are not commissioned.

VIC Environment Protection Authority Plastic Bags Ban - Cost-benefit analysis
17.
5. Distributional impacts
In this chapter, we discuss the stakeholders affected under each of the options. We assess the
distribution of costs and benefits in net present value (NPV) terms among stakeholder groups.
5.1 Findings
The key findings from our analysis (see Table 8) are:
▪ Consumers would ultimately bear the majority of the net benefit or cost under all options,
ranging from a net economic cost to consumers of $6.2 million in NPV terms over 10 years
under Option 2, to a net economic benefit of $55.3 million in NPV terms over 10 years
under Option 4.
▪ The retail industry would incur the highest cost under Option 3, about $41.4 million in NPV
terms over 10 years, under a voluntary code to reduce the use of LDPE shopping bags. The
retail industry may ultimately pass these costs on to consumers.
▪ The community and the environment would benefit from reduced litter, ranging from $10.0
million in NPV terms over 10 years under Option 2, to $13.0 million in NPV terms over 10
years under Option 4.
5.2 Stakeholders
The key stakeholders affected by options to reduce the use of plastic shopping bags are:
▪ Victorian Government;
▪ retail industry;
▪ consumers;
▪ wholesalers/importers of shopping bags; and
▪ community / environment.
The impact on different stakeholder groups from each option is presented in Table 7. Under all
options, the Victorian Government and the retail industry would incur implementation and
compliance costs. The retail industry may ultimately pass these costs onto consumers.
Currently, the cost of plastic shopping bags (HDPE and LDPE) is included in the retail cost of
products purchased by consumers. In our analysis, we assumed the benefits from the reduced
cost of HDPE and LDPE shopping bags would be ultimately be passed on to consumers. Under
Option 2, consumers face additional costs from LDPE shopping bags as they switch from HDPE
shopping bags. Under Option 3 and Option 4, consumers benefit from switching away from
LDPE shopping bags.

VIC Environment Protection Authority Plastic Bags Ban - Cost-benefit analysis
18.
Table 7: Overview of costs and benefits of options and stakeholders affected
Option 2 Option 3 Option 4 Stakeholder
Costs
Introduce legislation X X X Government and retail industry
Introduce code of practice X Government and retail industry
Consumer education campaign X X X Government and retail industry
Industry set up costs X X X Retail industry
Monitoring and compliance costs (ban) X X X Government and retail industry
Monitoring costs (code of practice) X Government and retail industry
Cost of reusable bags X X X Consumers
Cost of replacement bin liners X X X Consumers
Cost of LDPE bags X Consumers
Loss of producer surplus X X X Importers of shopping bags
Benefits
Reduced cost of HDPE bags X X X Consumers
Reduced cost of LDPE bags X X Consumers
Avoided litter X X X Community/environment
Avoided landfill operating costs X X Community/environment
Improved environment X X X Community/environment

VIC Environment Protection Authority Plastic Bags Ban - Cost-benefit analysis
19.
5.3 Distributional impact under each option
As shown in Table 8, consumers and the general community would bear most of the net benefit
or cost under each of the options. Under Option 3, the retail industry would initially bear the
implementation costs under a code of practice to reduce the use of LDPE shopping bags.
Although it is likely that retailers would pass on the cost to consumers, we cannot be certain
because it is a voluntary code and not all retailers will be involved. So, for the purpose of this
analysis it has been assumed that the development and implementation costs for the voluntary
code (refer to Appendix) will be borne by the retailers.
Table 8: Distribution of impact under a 10 year time frame (NPV, $m, $2016)
Option 2 Option 3 Option 4
VIC Government -0.9 -0.9 -1.7
Retail industry -0.5 -41.4 -0.6
Consumers -6.2 46.8 55.3
Importers -0.4 -1.1 -1.5
Community / Environment
10.0 11.9 13.0
Source: Marsden Jacob analysis.
VIC Environment Protection Authority Plastic Bags Ban - Cost-benefit analysis
20.
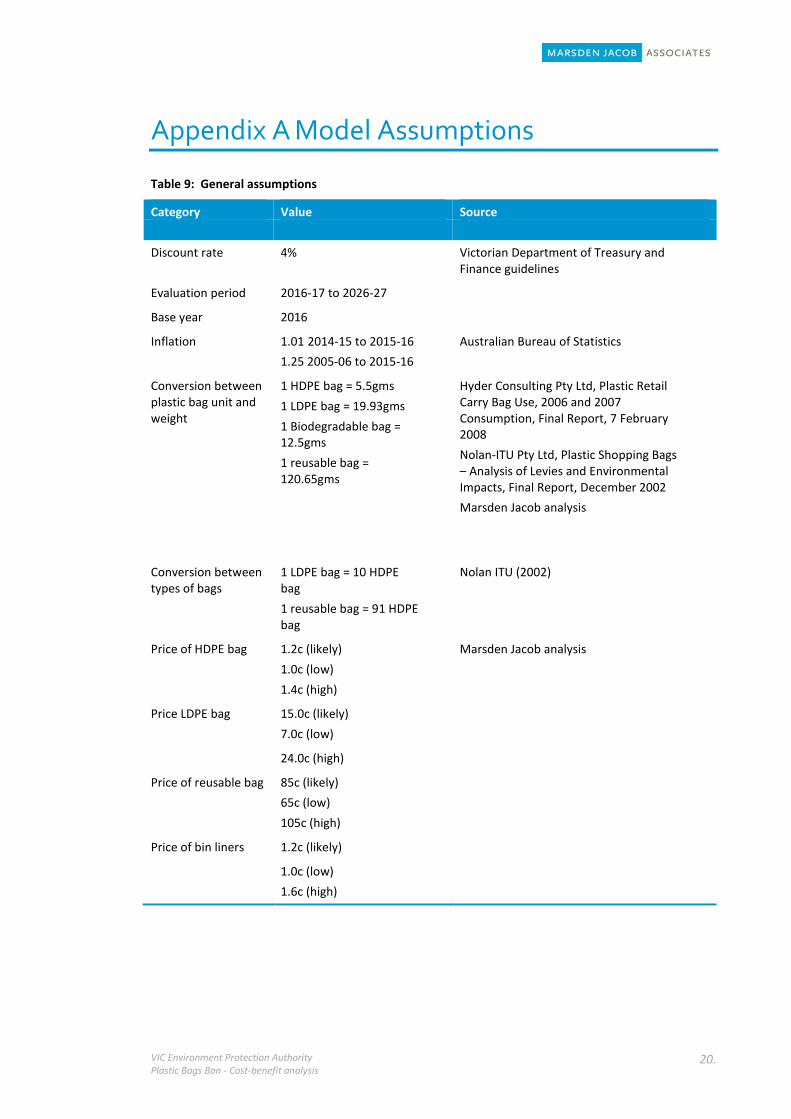
Appendix A Model Assumptions
Table 9: General assumptions
Category Value Source
Discount rate 4% Victorian Department of Treasury and Finance guidelines
Evaluation period 2016-17 to 2026-27
Base year 2016
Inflation 1.01 2014-15 to 2015-16
1.25 2005-06 to 2015-16
Australian Bureau of Statistics
Conversion between plastic bag unit and weight
1 HDPE bag = 5.5gms
1 LDPE bag = 19.93gms
1 Biodegradable bag = 12.5gms
1 reusable bag = 120.65gms
Hyder Consulting Pty Ltd, Plastic Retail Carry Bag Use, 2006 and 2007 Consumption, Final Report, 7 February 2008
Nolan-ITU Pty Ltd, Plastic Shopping Bags – Analysis of Levies and Environmental Impacts, Final Report, December 2002
Marsden Jacob analysis
Conversion between types of bags
1 LDPE bag = 10 HDPE bag
1 reusable bag = 91 HDPE bag
Nolan ITU (2002)
Price of HDPE bag 1.2c (likely)
1.0c (low)
1.4c (high)
Marsden Jacob analysis
Price LDPE bag 15.0c (likely)
7.0c (low)
24.0c (high)
Price of reusable bag 85c (likely)
65c (low)
105c (high)
Price of bin liners 1.2c (likely)
1.0c (low)
1.6c (high)

VIC Environment Protection Authority Plastic Bags Ban - Cost-benefit analysis
21.
Table 10: Use of plastic shopping bags
Category Value Source
Number of HDPE bags in Victoria in 2015
1,531 million Marsden Jacob analysis
Number of LDPE bags in Victoria in 2015
129 million
Number of reusable bags in Victoria in 2015
19 million
Number of biodegradable bags
3 million
Fate of HDPE bags 95% landfill; 4% recycled;
1% litter
Fate of LDPE bags 91% landfill; 8% recycled;
1% litter
Fate of biodegradable bags
97% landfill; 3% recycled; 0% litter
Fate of reusable bags 91% landfill; 9% recycled; 0% litter
Number of bin liners Increase by 10% in 2017-18 and 275% in 2018-19 and held constant thereafter for Option 2 to Option 4
Based on data from NT where sale of bin liners increased from 8 million to 22 million
Option 1
Growth of HDPE bag use (per annum)
1.61% Marsden Jacob analysis based on population growth in Victoria
Growth of LDPE bag use (per annum)
0.22% Previous studies by Marsden Jacob
Growth of reusable bag use (per annum)
0.02%
Option 2
Growth of HDPE bag use Reduce by 10% in 2017-18. Reduce by 85% in 2018-19 (from 2017-18). Reduced by 95% by 2022-23 (from 2016-17)
LDPE bag use Growth rate per Option 1 plus 30% of HDPE reduction
Reusable bag use Growth rate per Option 1 plus 60% of HDPE reduction
10% of consumers decide not to use a bag (based on SA experience)

VIC Environment Protection Authority Plastic Bags Ban - Cost-benefit analysis
22.
Category Value Source
Option 3
Growth of HDPE bag use Reduce by 10% in 2017-18. Reduce by 85% in 2018-19 (from 2017-18). Reduced by 95% by 2022-23 (from 2016-17)
LDPE growth rate -20.6% in 2018-19 to 2020-21
0% thereafter
Reusable bag use Growth rate per Option 1 plus 90% of HDPE and LDPE reduction
10% of consumers decide not to use a bag
Option 4
Growth of HDPE bag use Reduce by 10% in 2017-18. Reduce by 85% in 2018-19 (from 2017-18). Reduced by 95% by 2022-23 (from 2016-17)
Growth of LDPE bag use Reduce by 10% in 2017-18, 85% in 2018-19 and reduced by 95% by 2022-23
Reusable bag use Growth rate per Option 1 plus switch from HDPE and LDPE
Table 11: Cost and benefit assumptions (incremental to Option 1)
Category Value Source
Vic Government DELWP
- Implementation $0.145 million 2016-17
- Consumer education and information
$0.6 million in 2017-18
- Enforcement $0.1 million 2018-19; $0.05 million 2019-20 to 2021-22
Note costs for Option 4 is double
Retail industry Similar costs to Vic Government
- Consumer education $0.25 million in 2017-18
Cost of signage across major retail stores
- Code of Practice $8.3 million 2017-18 to 2019-20; $$4.2 million thereafter
Based on Hyder Consulting (2008) and analysis by Marsden Jacob
Consumers
- Additional time at - Assume zero, no significant issues
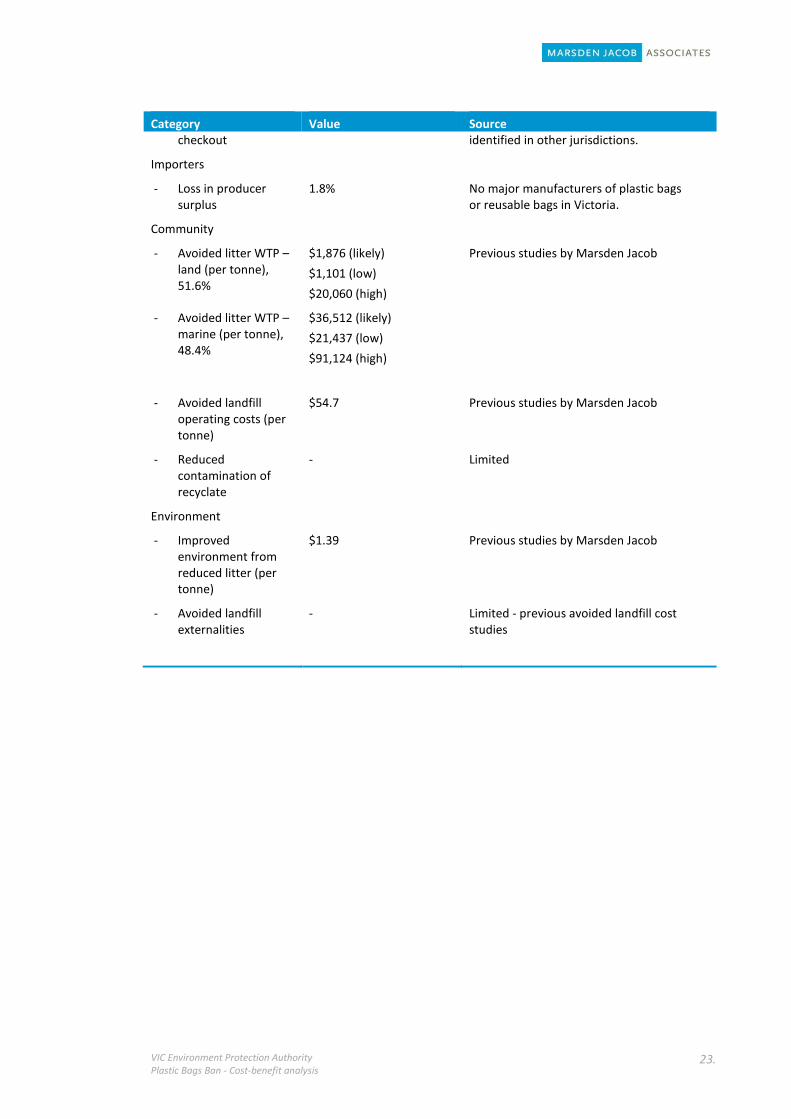
VIC Environment Protection Authority Plastic Bags Ban - Cost-benefit analysis
23.
Category Value Source checkout identified in other jurisdictions.
Importers
- Loss in producer surplus
1.8% No major manufacturers of plastic bags or reusable bags in Victoria.
Community
- Avoided litter WTP – land (per tonne), 51.6%
$1,876 (likely)
$1,101 (low)
$20,060 (high)
Previous studies by Marsden Jacob
- Avoided litter WTP – marine (per tonne), 48.4%
$36,512 (likely)
$21,437 (low)
$91,124 (high)
- Avoided landfill operating costs (per tonne)
$54.7 Previous studies by Marsden Jacob
- Reduced contamination of recyclate
- Limited
Environment
- Improved environment from reduced litter (per tonne)
$1.39 Previous studies by Marsden Jacob
- Avoided landfill externalities
- Limited - previous avoided landfill cost studies