Embed Size (px)
Citation preview
Polymer International Polym Int 56:214–223 (2007)
Plastic and fracture behavior ofnanosilica-filled poly(methylmethacrylate)Muriel Muriel, Andre Dubault and Jean Louis Halary∗Laboratoire PPMD (UMR 7615), Ecole Superieure de Physique et Chimie Industrielles de la Ville de Paris, 10 rue Vauquelin, 75231 Pariscedex 05, France
Abstract: The plastic and fracture behavior of ‘model’ hybrid materials based on methyl methacrylate andmethacryloxypropyl-grafted nanosilica was investigated. A four-step synthesis procedure allowed preparationof transparent nanosilica–poly(methyl methacrylate) networks of well-defined architecture, of variable particlediameter, volume fraction of particles, number of methacryloyl units grafted per surface unit of silica particles andnature of the grafting agent. Plasticity behavior was investigated through compression tests. The evolution of yieldstress with volume fraction of fillers can be understood by taking into account the undeformability of particles andusing the geometrical Kerner approach. The reduction of plastic flow plateau by a substantial strain hardeningwas imputed to the presence of crosslinks on the particles. Fracture properties were deduced from three-pointbending experiments on notched samples. The effects on toughness of filler incorporation are tentatively relatedto plasticity and to the presence of crosslinks. 2006 Society of Chemical Industry
Keywords: nanocomposite; poly(methyl methacrylate); grafted silica; plastic deformation; fracture behavior
INTRODUCTIONIn recent years, nanostructured organic–inorganiccomposites have received great attention because ofboth their academic interest and potential industrialimportance. Improved performance of nanocompos-ites is usually related to the large interface betweeninorganic fillers and organic matrix, even at low fillercontent, as fillers have a size scale of the orderof nanometers. However, possible upgrading of themechanical properties depends on two main param-eters: (i) the interaction strength between nanopar-ticles and matrix; and (ii) the degree of dispersionof the nanoparticles. The interaction strength can bemonitored by changing both the interaction nature(covalent, hydrogen bonding, etc.) and the numberof interactions per interface unit. Concerning theeffect of particle dispersion, the various performances(mechanical, optical, etc.) seem to be better, in the caseof thermoplastic materials, when the nanoparticles arehomogeneously dispersed within the matrix. Such afavorable situation can be reached using strategiesdesigned to prevent any filler aggregation during thenanocomposite synthesis. Search for these strategies,which is actually the major challenge of nanocompos-ite elaboration, has received much attention in thecase of clay/polymer materials.1–5 On the other hand,very few contributions – again in the special case ofthermoplastics – have dealt with silica fillers.6–8
In the study reported in the present paper, weinvestigated the plastic and fracture behavior of
nanostructured hybrid organic–inorganic materials,based on spherical nanosilica particles homogenouslydispersed in a glassy poly(methyl methacrylate)(PMMA) matrix. Different routes have been reportedfor the synthesis of polymer/silica nanocomposites.They include: (i) in situ polymerization of one or twocomponents; and (ii) direct blending of nanoparticlesand polymeric chains, both separately synthesized in apreliminary stage.
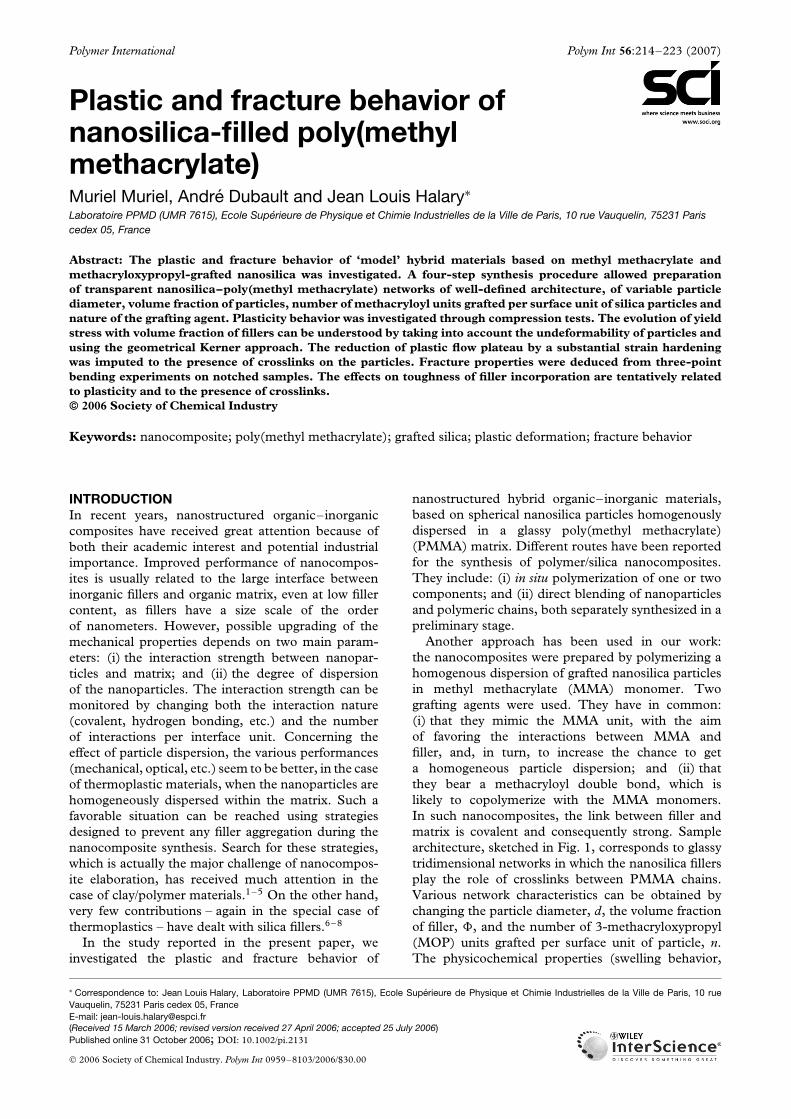
Another approach has been used in our work:the nanocomposites were prepared by polymerizing ahomogenous dispersion of grafted nanosilica particlesin methyl methacrylate (MMA) monomer. Twografting agents were used. They have in common:(i) that they mimic the MMA unit, with the aimof favoring the interactions between MMA andfiller, and, in turn, to increase the chance to geta homogeneous particle dispersion; and (ii) thatthey bear a methacryloyl double bond, which islikely to copolymerize with the MMA monomers.In such nanocomposites, the link between filler andmatrix is covalent and consequently strong. Samplearchitecture, sketched in Fig. 1, corresponds to glassytridimensional networks in which the nanosilica fillersplay the role of crosslinks between PMMA chains.Various network characteristics can be obtained bychanging the particle diameter, d, the volume fractionof filler, �, and the number of 3-methacryloxypropyl(MOP) units grafted per surface unit of particle, n.The physicochemical properties (swelling behavior,
∗ Correspondence to: Jean Louis Halary, Laboratoire PPMD (UMR 7615), Ecole Superieure de Physique et Chimie Industrielles de la Ville de Paris, 10 rueVauquelin, 75231 Paris cedex 05, FranceE-mail: [email protected](Received 15 March 2006; revised version received 27 April 2006; accepted 25 July 2006)Published online 31 October 2006; DOI: 10.1002/pi.2131
2006 Society of Chemical Industry. Polym Int 0959–8103/2006/$30.00
Plastic and fracture behavior of nanosilica-filled PMMA
SiO2SiO2
PMMA
PMMA
Figure 1. Schematic of the architecture of the nanosilica-filled PMMAsamples.
glass transition temperature) of this set of materialshave been already reported.9 It turns out that thenetwork architecture can be characterized by a uniqueparameter, called ξD, and defined as the numberof grafting agent double bonds per unit volume ofpolymer matrix:
ξD = 6n�
(1 − �)d
This parameter ξD accounts for the crosslink density:the higher the ξD value, the larger the crosslinkdensity.
As the viscoelastic properties of these nanocompos-ites have been recently published,10 the present paperonly focuses on their plastic deformation and fracturebehavior.
EXPERIMENTALMaterialsAll the nanocomposites under study were synthesizedin our laboratory. The synthesis route, basedon a well-known procedure,11–14 was extensivelydescribed in two previous papers.9,10 It involvesfour steps: (a) preparation of spherical silica particlesof nanometric size and narrow size distribution;(b) grafting of MOP units at the surface of theparticles; (c) formation of stable dispersions of thegrafted particles in MMA; and (d) copolymerizationof MMA and MOP, initiated by UV irradiation, andthen completed by thermal reaction.
Two series of samples were prepared by changingthe nature of the grafting agent bearing the MOPunits: either 3-(trimethoxysilyl)propyl methacrylate(MTOS):
Si (CH2)3
O
O
O
CH3
CH3
H3C
O
O CCH2
CH3C
or 3-(chlorodimethylsilyl)propyl methacrylate(MDCS):
CH3
CH3
Cl Si (CH2)3
O
O CCH2
CH3C
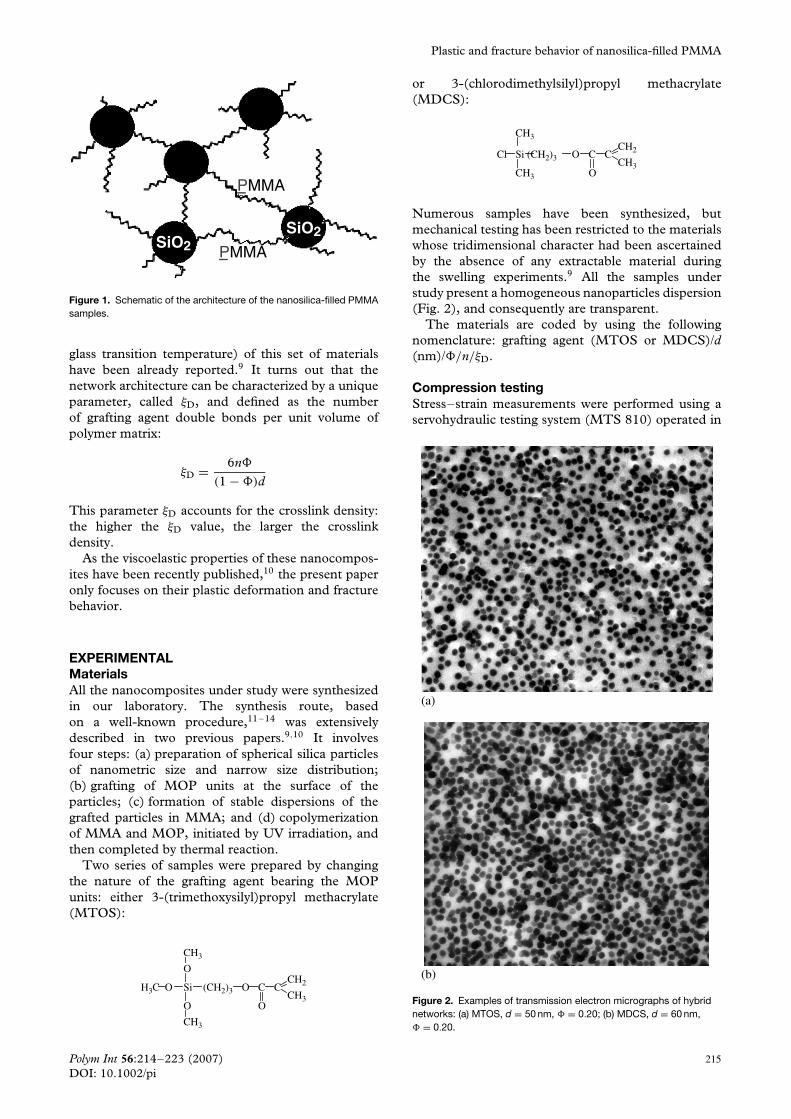
Numerous samples have been synthesized, butmechanical testing has been restricted to the materialswhose tridimensional character had been ascertainedby the absence of any extractable material duringthe swelling experiments.9 All the samples understudy present a homogeneous nanoparticles dispersion(Fig. 2), and consequently are transparent.
The materials are coded by using the followingnomenclature: grafting agent (MTOS or MDCS)/d(nm)/�/n/ξD.
Compression testingStress–strain measurements were performed using aservohydraulic testing system (MTS 810) operated in
(a)
(b)
Figure 2. Examples of transmission electron micrographs of hybridnetworks: (a) MTOS, d = 50 nm, � = 0.20; (b) MDCS, d = 60 nm,� = 0.20.
Polym Int 56:214–223 (2007) 215DOI: 10.1002/pi
M Mauger, A Dubault, JL Halary
compression mode and equipped with an isothermalchamber covering a temperature range from −120 to200 ◦C to within ±1 ◦C. Samples were 3 × 3 mm2 insection and 6 mm in height (direction of compression).Experiments were carried out by imposing a strainrate equal to 2 × 10⁻³ s−1 for temperatures rangingfrom 20 ◦C to the glass transition temperature Tα
with an increment of about 10 ◦C between twosuccessive isothermal measurements. To make surethat any residual stresses were released, the sampleswere subjected to a three-step thermal history beforetesting: (1) annealing for 15 h at a temperature equalto Tα + 10 K; (2) fast cooling down below Tα to avoidany physical aging; and (3) temperature equilibrationfor 30 min in the isothermal chamber of the testingsystem.
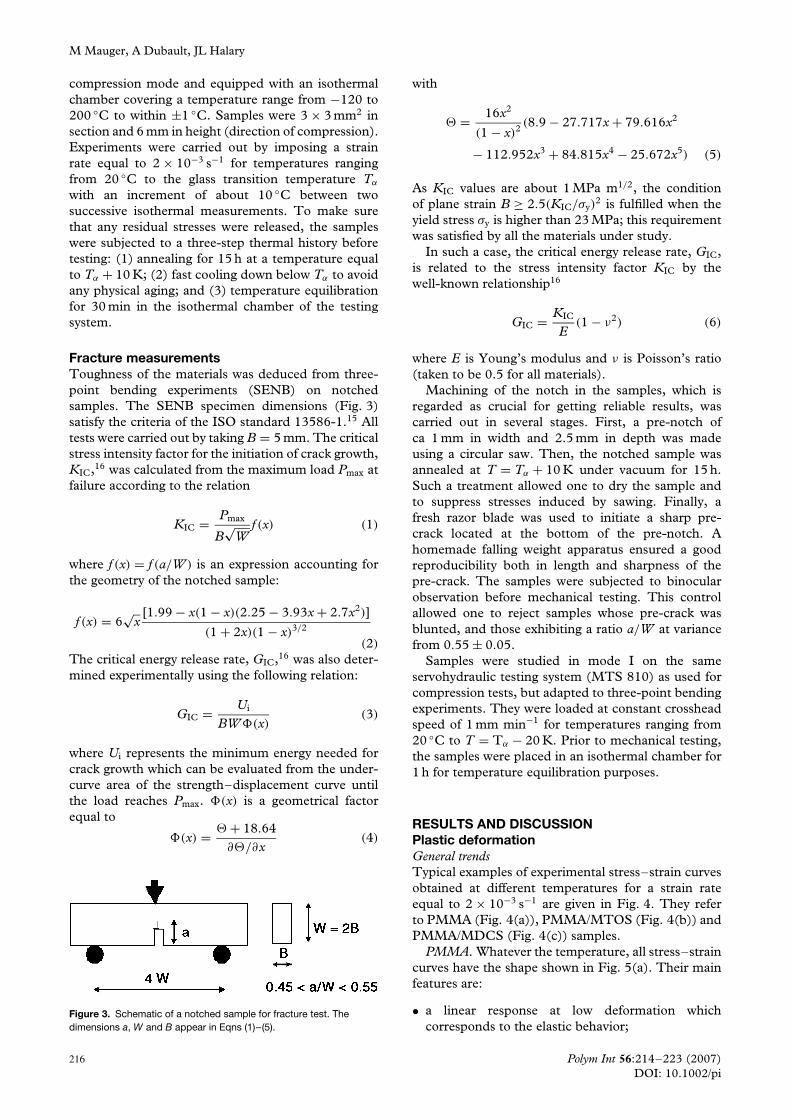
Fracture measurementsToughness of the materials was deduced from three-point bending experiments (SENB) on notchedsamples. The SENB specimen dimensions (Fig. 3)satisfy the criteria of the ISO standard 13586-1.15 Alltests were carried out by taking B = 5 mm. The criticalstress intensity factor for the initiation of crack growth,KIC,16 was calculated from the maximum load Pmax atfailure according to the relation
KIC = Pmax
B√
Wf (x) (1)
where f (x) = f (a/W ) is an expression accounting forthe geometry of the notched sample:
f (x) = 6√
x[1.99 − x(1 − x)(2.25 − 3.93x + 2.7x2)]
(1 + 2x)(1 − x)3/2
(2)
The critical energy release rate, GIC,16 was also deter-mined experimentally using the following relation:
GIC = Ui
BW�(x)(3)
where Ui represents the minimum energy needed forcrack growth which can be evaluated from the under-curve area of the strength–displacement curve untilthe load reaches Pmax. �(x) is a geometrical factorequal to
�(x) = � + 18.64∂�/∂x
(4)
Figure 3. Schematic of a notched sample for fracture test. Thedimensions a, W and B appear in Eqns (1)–(5).
with
� = 16x2
(1 − x)2 (8.9 − 27.717x + 79.616x2
− 112.952x3 + 84.815x4 − 25.672x5) (5)
As KIC values are about 1 MPa m1/2, the conditionof plane strain B ≥ 2.5(KIC/σy)
2 is fulfilled when theyield stress σy is higher than 23 MPa; this requirementwas satisfied by all the materials under study.
In such a case, the critical energy release rate, GIC,is related to the stress intensity factor KIC by thewell-known relationship16
GIC = KIC
E(1 − ν2) (6)
where E is Young’s modulus and ν is Poisson’s ratio(taken to be 0.5 for all materials).
Machining of the notch in the samples, which isregarded as crucial for getting reliable results, wascarried out in several stages. First, a pre-notch ofca 1 mm in width and 2.5 mm in depth was madeusing a circular saw. Then, the notched sample wasannealed at T = Tα + 10 K under vacuum for 15 h.Such a treatment allowed one to dry the sample andto suppress stresses induced by sawing. Finally, afresh razor blade was used to initiate a sharp pre-crack located at the bottom of the pre-notch. Ahomemade falling weight apparatus ensured a goodreproducibility both in length and sharpness of thepre-crack. The samples were subjected to binocularobservation before mechanical testing. This controlallowed one to reject samples whose pre-crack wasblunted, and those exhibiting a ratio a/W at variancefrom 0.55 ± 0.05.
Samples were studied in mode I on the sameservohydraulic testing system (MTS 810) as used forcompression tests, but adapted to three-point bendingexperiments. They were loaded at constant crossheadspeed of 1 mm min−1 for temperatures ranging from20 ◦C to T = Tα − 20 K. Prior to mechanical testing,the samples were placed in an isothermal chamber for1 h for temperature equilibration purposes.
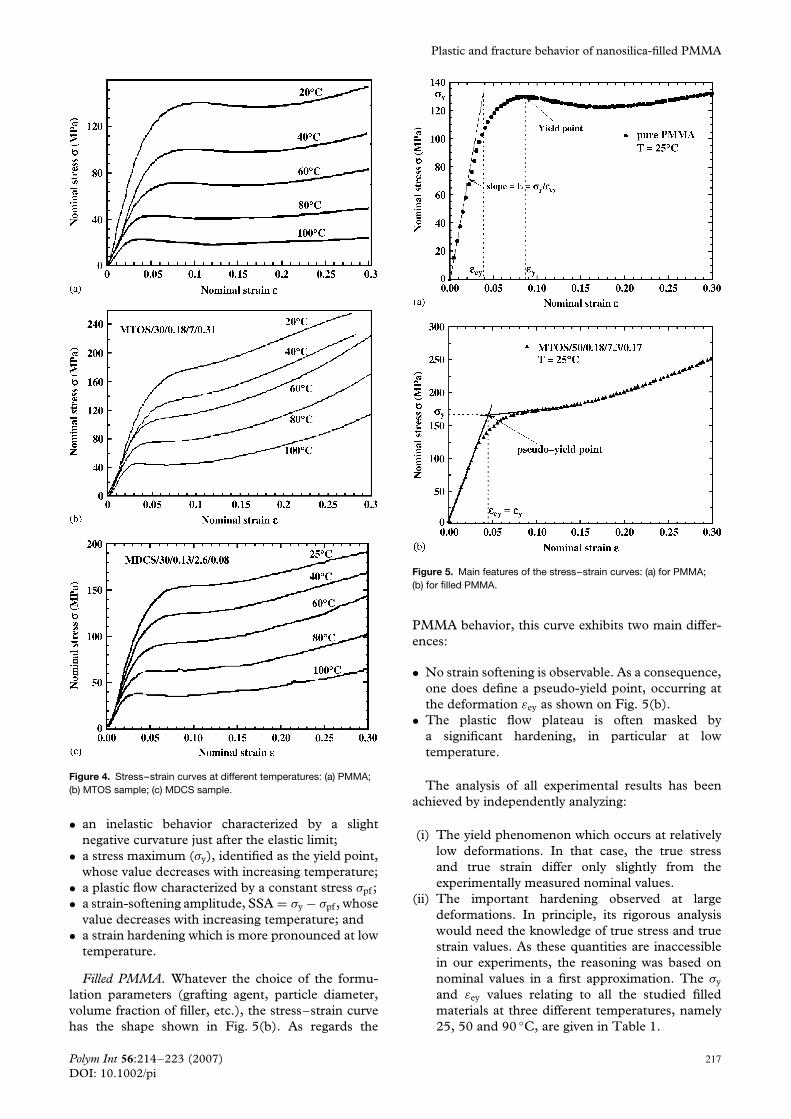
RESULTS AND DISCUSSIONPlastic deformationGeneral trendsTypical examples of experimental stress–strain curvesobtained at different temperatures for a strain rateequal to 2 × 10⁻³ s−1 are given in Fig. 4. They referto PMMA (Fig. 4(a)), PMMA/MTOS (Fig. 4(b)) andPMMA/MDCS (Fig. 4(c)) samples.
PMMA. Whatever the temperature, all stress–straincurves have the shape shown in Fig. 5(a). Their mainfeatures are:
• a linear response at low deformation whichcorresponds to the elastic behavior;
216 Polym Int 56:214–223 (2007)DOI: 10.1002/pi
Plastic and fracture behavior of nanosilica-filled PMMA
Figure 4. Stress–strain curves at different temperatures: (a) PMMA;(b) MTOS sample; (c) MDCS sample.
• an inelastic behavior characterized by a slightnegative curvature just after the elastic limit;
• a stress maximum (σy), identified as the yield point,whose value decreases with increasing temperature;
• a plastic flow characterized by a constant stress σpf ;• a strain-softening amplitude, SSA = σy − σpf , whose
value decreases with increasing temperature; and• a strain hardening which is more pronounced at low
temperature.
Filled PMMA. Whatever the choice of the formu-lation parameters (grafting agent, particle diameter,volume fraction of filler, etc.), the stress–strain curvehas the shape shown in Fig. 5(b). As regards the
Figure 5. Main features of the stress–strain curves: (a) for PMMA;(b) for filled PMMA.
PMMA behavior, this curve exhibits two main differ-ences:
• No strain softening is observable. As a consequence,one does define a pseudo-yield point, occurring atthe deformation εey as shown on Fig. 5(b).
• The plastic flow plateau is often masked bya significant hardening, in particular at lowtemperature.
The analysis of all experimental results has beenachieved by independently analyzing:
(i) The yield phenomenon which occurs at relativelylow deformations. In that case, the true stressand true strain differ only slightly from theexperimentally measured nominal values.
(ii) The important hardening observed at largedeformations. In principle, its rigorous analysiswould need the knowledge of true stress and truestrain values. As these quantities are inaccessiblein our experiments, the reasoning was based onnominal values in a first approximation. The σy
and εey values relating to all the studied filledmaterials at three different temperatures, namely25, 50 and 90 ◦C, are given in Table 1.
Polym Int 56:214–223 (2007) 217DOI: 10.1002/pi
M Mauger, A Dubault, JL Halary
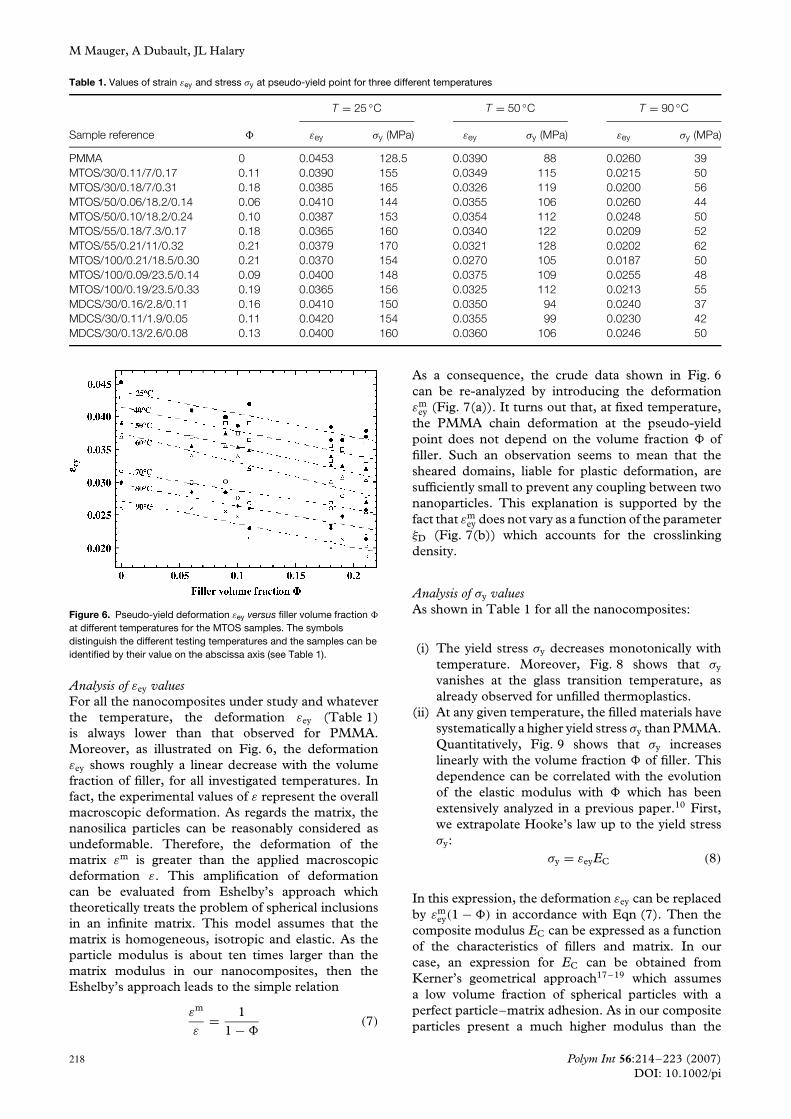
Table 1. Values of strain εey and stress σy at pseudo-yield point for three different temperatures
T = 25 ◦C T = 50 ◦C T = 90 ◦C
Sample reference � εey σy (MPa) εey σy (MPa) εey σy (MPa)
PMMA 0 0.0453 128.5 0.0390 88 0.0260 39MTOS/30/0.11/7/0.17 0.11 0.0390 155 0.0349 115 0.0215 50MTOS/30/0.18/7/0.31 0.18 0.0385 165 0.0326 119 0.0200 56MTOS/50/0.06/18.2/0.14 0.06 0.0410 144 0.0355 106 0.0260 44MTOS/50/0.10/18.2/0.24 0.10 0.0387 153 0.0354 112 0.0248 50MTOS/55/0.18/7.3/0.17 0.18 0.0365 160 0.0340 122 0.0209 52MTOS/55/0.21/11/0.32 0.21 0.0379 170 0.0321 128 0.0202 62MTOS/100/0.21/18.5/0.30 0.21 0.0370 154 0.0270 105 0.0187 50MTOS/100/0.09/23.5/0.14 0.09 0.0400 148 0.0375 109 0.0255 48MTOS/100/0.19/23.5/0.33 0.19 0.0365 156 0.0325 112 0.0213 55MDCS/30/0.16/2.8/0.11 0.16 0.0410 150 0.0350 94 0.0240 37MDCS/30/0.11/1.9/0.05 0.11 0.0420 154 0.0355 99 0.0230 42MDCS/30/0.13/2.6/0.08 0.13 0.0400 160 0.0360 106 0.0246 50
Figure 6. Pseudo-yield deformation εey versus filler volume fraction �
at different temperatures for the MTOS samples. The symbolsdistinguish the different testing temperatures and the samples can beidentified by their value on the abscissa axis (see Table 1).
Analysis of εey valuesFor all the nanocomposites under study and whateverthe temperature, the deformation εey (Table 1)is always lower than that observed for PMMA.Moreover, as illustrated on Fig. 6, the deformationεey shows roughly a linear decrease with the volumefraction of filler, for all investigated temperatures. Infact, the experimental values of ε represent the overallmacroscopic deformation. As regards the matrix, thenanosilica particles can be reasonably considered asundeformable. Therefore, the deformation of thematrix εm is greater than the applied macroscopicdeformation ε. This amplification of deformationcan be evaluated from Eshelby’s approach whichtheoretically treats the problem of spherical inclusionsin an infinite matrix. This model assumes that thematrix is homogeneous, isotropic and elastic. As theparticle modulus is about ten times larger than thematrix modulus in our nanocomposites, then theEshelby’s approach leads to the simple relation
εm
ε= 1
1 − �(7)
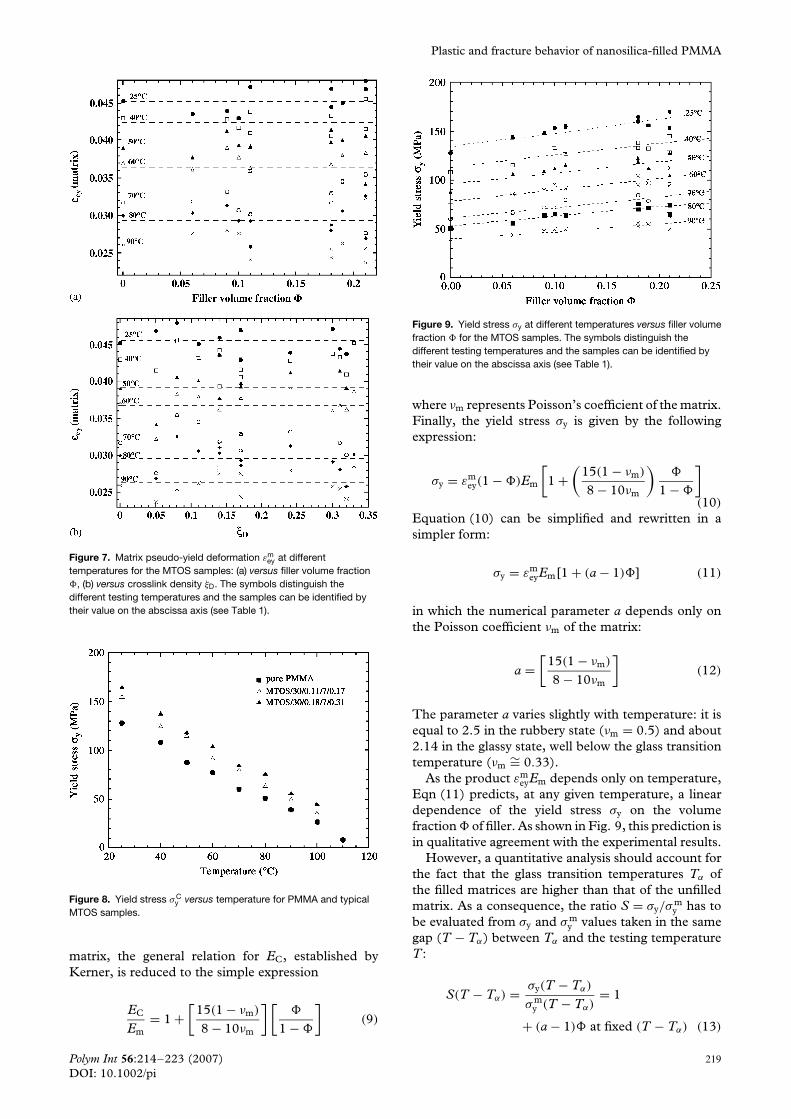
As a consequence, the crude data shown in Fig. 6can be re-analyzed by introducing the deformationεm
ey (Fig. 7(a)). It turns out that, at fixed temperature,the PMMA chain deformation at the pseudo-yieldpoint does not depend on the volume fraction � offiller. Such an observation seems to mean that thesheared domains, liable for plastic deformation, aresufficiently small to prevent any coupling between twonanoparticles. This explanation is supported by thefact that εm
ey does not vary as a function of the parameterξD (Fig. 7(b)) which accounts for the crosslinkingdensity.
Analysis of σy valuesAs shown in Table 1 for all the nanocomposites:
(i) The yield stress σy decreases monotonically withtemperature. Moreover, Fig. 8 shows that σy
vanishes at the glass transition temperature, asalready observed for unfilled thermoplastics.
(ii) At any given temperature, the filled materials havesystematically a higher yield stress σy than PMMA.Quantitatively, Fig. 9 shows that σy increaseslinearly with the volume fraction � of filler. Thisdependence can be correlated with the evolutionof the elastic modulus with � which has beenextensively analyzed in a previous paper.10 First,we extrapolate Hooke’s law up to the yield stressσy:
σy = εeyEC (8)
In this expression, the deformation εey can be replacedby εm
ey(1 − �) in accordance with Eqn (7). Then thecomposite modulus EC can be expressed as a functionof the characteristics of fillers and matrix. In ourcase, an expression for EC can be obtained fromKerner’s geometrical approach17–19 which assumesa low volume fraction of spherical particles with aperfect particle–matrix adhesion. As in our compositeparticles present a much higher modulus than the
218 Polym Int 56:214–223 (2007)DOI: 10.1002/pi
Plastic and fracture behavior of nanosilica-filled PMMA
Figure 7. Matrix pseudo-yield deformation εmey at different
temperatures for the MTOS samples: (a) versus filler volume fraction�, (b) versus crosslink density ξD. The symbols distinguish thedifferent testing temperatures and the samples can be identified bytheir value on the abscissa axis (see Table 1).
Figure 8. Yield stress σCy versus temperature for PMMA and typical
MTOS samples.
matrix, the general relation for EC, established byKerner, is reduced to the simple expression
EC
Em= 1 +
[15(1 − νm)
8 − 10νm
] [�
1 − �
](9)
Figure 9. Yield stress σy at different temperatures versus filler volumefraction � for the MTOS samples. The symbols distinguish thedifferent testing temperatures and the samples can be identified bytheir value on the abscissa axis (see Table 1).
where νm represents Poisson’s coefficient of the matrix.Finally, the yield stress σy is given by the followingexpression:
σy = εmey(1 − �)Em
[1 +
(15(1 − νm)
8 − 10νm
)�
1 − �
]
(10)
Equation (10) can be simplified and rewritten in asimpler form:
σy = εmeyEm[1 + (a − 1)�] (11)
in which the numerical parameter a depends only onthe Poisson coefficient νm of the matrix:
a =[
15(1 − νm)
8 − 10νm
](12)
The parameter a varies slightly with temperature: it isequal to 2.5 in the rubbery state (νm = 0.5) and about2.14 in the glassy state, well below the glass transitiontemperature (νm
∼= 0.33).As the product εm
eyEm depends only on temperature,Eqn (11) predicts, at any given temperature, a lineardependence of the yield stress σy on the volumefraction � of filler. As shown in Fig. 9, this prediction isin qualitative agreement with the experimental results.
However, a quantitative analysis should account forthe fact that the glass transition temperatures Tα ofthe filled matrices are higher than that of the unfilledmatrix. As a consequence, the ratio S = σy/σ
my has to
be evaluated from σy and σ my values taken in the same
gap (T − Tα) between Tα and the testing temperatureT :
S(T − Tα) = σy(T − Tα)
σ my (T − Tα)
= 1
+ (a − 1)� at fixed (T − Tα) (13)
Polym Int 56:214–223 (2007) 219DOI: 10.1002/pi
M Mauger, A Dubault, JL Halary
1.00
1.05
1.10
1.15
1.20
1.25
1.30
1.35
0.00 0.05 0.10 0.15 0.20
-100°C-90°C-80°C-70°C-60°C-50°C-40°C
Filler volume fraction Φ
(T-Tα) values
ν=1/2
ν=1/3
σ y/σ
y (m
atri
x)
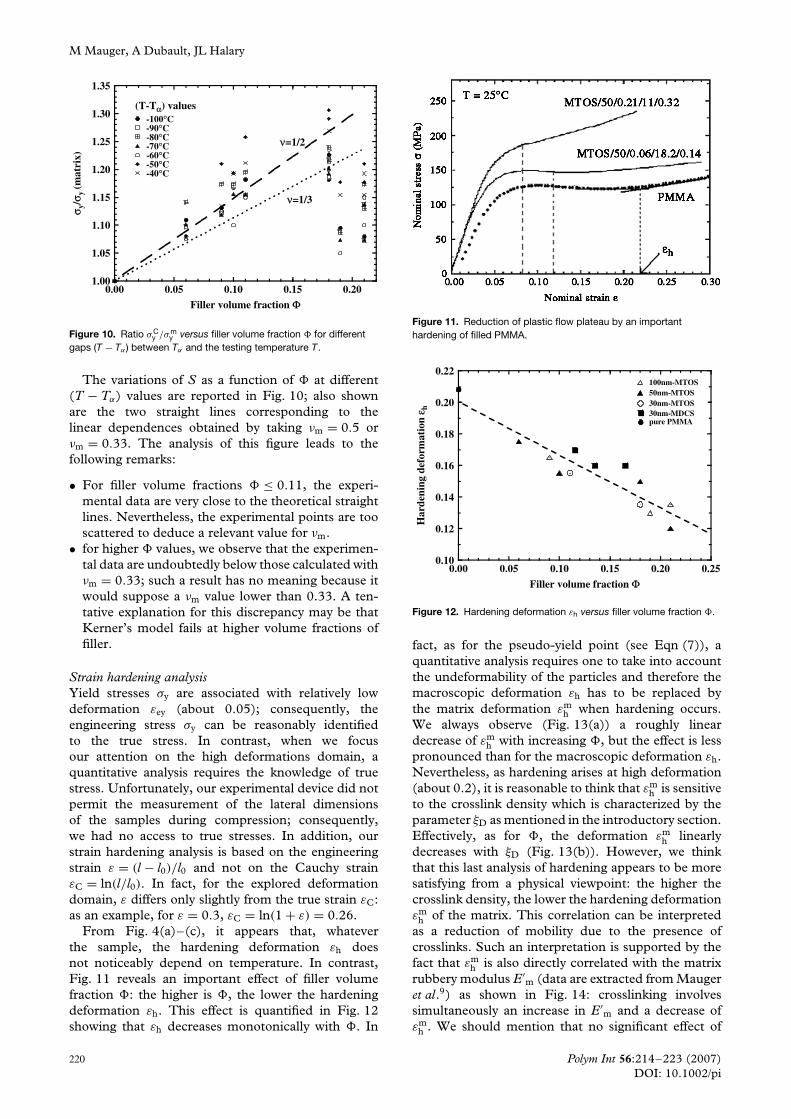
Figure 10. Ratio σCy /σm
y versus filler volume fraction � for differentgaps (T − Tα ) between Tα and the testing temperature T.
The variations of S as a function of � at different(T − Tα) values are reported in Fig. 10; also shownare the two straight lines corresponding to thelinear dependences obtained by taking νm = 0.5 orνm = 0.33. The analysis of this figure leads to thefollowing remarks:
• For filler volume fractions � ≤ 0.11, the experi-mental data are very close to the theoretical straightlines. Nevertheless, the experimental points are tooscattered to deduce a relevant value for νm.
• for higher � values, we observe that the experimen-tal data are undoubtedly below those calculated withνm = 0.33; such a result has no meaning because itwould suppose a νm value lower than 0.33. A ten-tative explanation for this discrepancy may be thatKerner’s model fails at higher volume fractions offiller.
Strain hardening analysisYield stresses σy are associated with relatively lowdeformation εey (about 0.05); consequently, theengineering stress σy can be reasonably identifiedto the true stress. In contrast, when we focusour attention on the high deformations domain, aquantitative analysis requires the knowledge of truestress. Unfortunately, our experimental device did notpermit the measurement of the lateral dimensionsof the samples during compression; consequently,we had no access to true stresses. In addition, ourstrain hardening analysis is based on the engineeringstrain ε = (l − l0)/l0 and not on the Cauchy strainεC = ln(l/l0). In fact, for the explored deformationdomain, ε differs only slightly from the true strain εC:as an example, for ε = 0.3, εC = ln(1 + ε) = 0.26.
From Fig. 4(a)–(c), it appears that, whateverthe sample, the hardening deformation εh doesnot noticeably depend on temperature. In contrast,Fig. 11 reveals an important effect of filler volumefraction �: the higher is �, the lower the hardeningdeformation εh. This effect is quantified in Fig. 12showing that εh decreases monotonically with �. In
Figure 11. Reduction of plastic flow plateau by an importanthardening of filled PMMA.
0.10
0.12
0.14
0.16
0.18
0.20
0.22
0.00 0.05 0.10 0.15 0.20 0.25
50nm-MTOS100nm-MTOS
30nm-MTOS30nm-MDCSpure PMMA
Filler volume fraction Φ
Har
deni
ng d
efor
mat
ion
ε h
Figure 12. Hardening deformation εh versus filler volume fraction �.
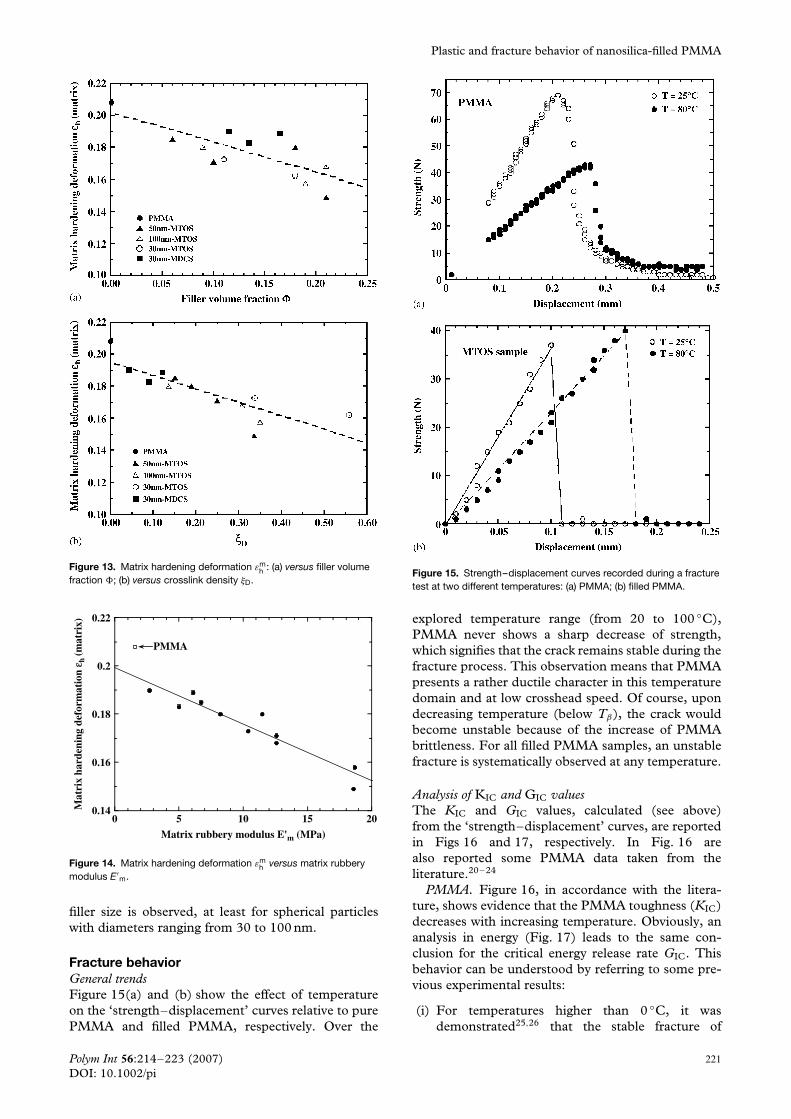
fact, as for the pseudo-yield point (see Eqn (7)), aquantitative analysis requires one to take into accountthe undeformability of the particles and therefore themacroscopic deformation εh has to be replaced bythe matrix deformation εm
h when hardening occurs.We always observe (Fig. 13(a)) a roughly lineardecrease of εm
h with increasing �, but the effect is lesspronounced than for the macroscopic deformation εh.Nevertheless, as hardening arises at high deformation(about 0.2), it is reasonable to think that εm
h is sensitiveto the crosslink density which is characterized by theparameter ξD as mentioned in the introductory section.Effectively, as for �, the deformation εm
h linearlydecreases with ξD (Fig. 13(b)). However, we thinkthat this last analysis of hardening appears to be moresatisfying from a physical viewpoint: the higher thecrosslink density, the lower the hardening deformationεm
h of the matrix. This correlation can be interpretedas a reduction of mobility due to the presence ofcrosslinks. Such an interpretation is supported by thefact that εm
h is also directly correlated with the matrixrubbery modulus E′
m (data are extracted from Maugeret al.9) as shown in Fig. 14: crosslinking involvessimultaneously an increase in E′
m and a decrease ofεm
h . We should mention that no significant effect of
220 Polym Int 56:214–223 (2007)DOI: 10.1002/pi
Plastic and fracture behavior of nanosilica-filled PMMA
Figure 13. Matrix hardening deformation εmh : (a) versus filler volume
fraction �; (b) versus crosslink density ξD.
0.14
0.16
0.18
0.2
0.22
0 5 10 15 20
Matrix rubbery modulus E'm (MPa)
PMMA
Mat
rix
hard
enin
g de
form
atio
n ε h
(mat
rix)
Figure 14. Matrix hardening deformation εmh versus matrix rubbery
modulus E′m.
filler size is observed, at least for spherical particleswith diameters ranging from 30 to 100 nm.
Fracture behaviorGeneral trendsFigure 15(a) and (b) show the effect of temperatureon the ‘strength–displacement’ curves relative to purePMMA and filled PMMA, respectively. Over the
Figure 15. Strength–displacement curves recorded during a fracturetest at two different temperatures: (a) PMMA; (b) filled PMMA.
explored temperature range (from 20 to 100 ◦C),PMMA never shows a sharp decrease of strength,which signifies that the crack remains stable during thefracture process. This observation means that PMMApresents a rather ductile character in this temperaturedomain and at low crosshead speed. Of course, upondecreasing temperature (below Tβ), the crack wouldbecome unstable because of the increase of PMMAbrittleness. For all filled PMMA samples, an unstablefracture is systematically observed at any temperature.
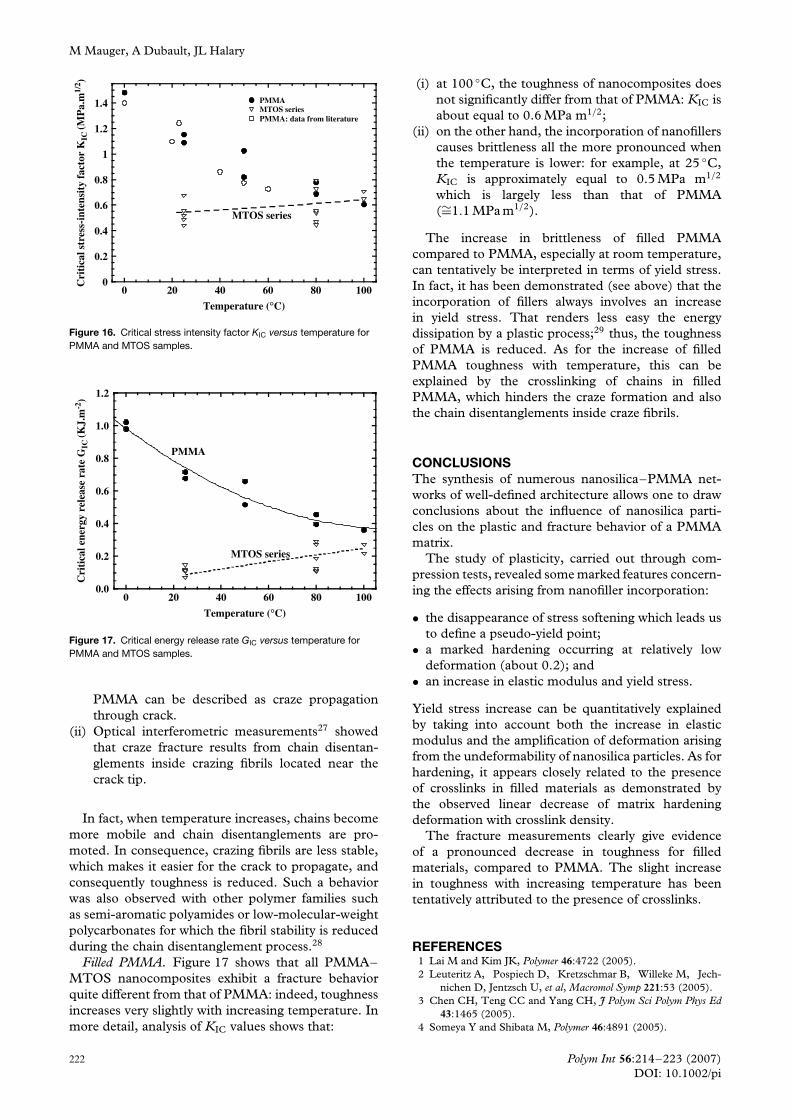
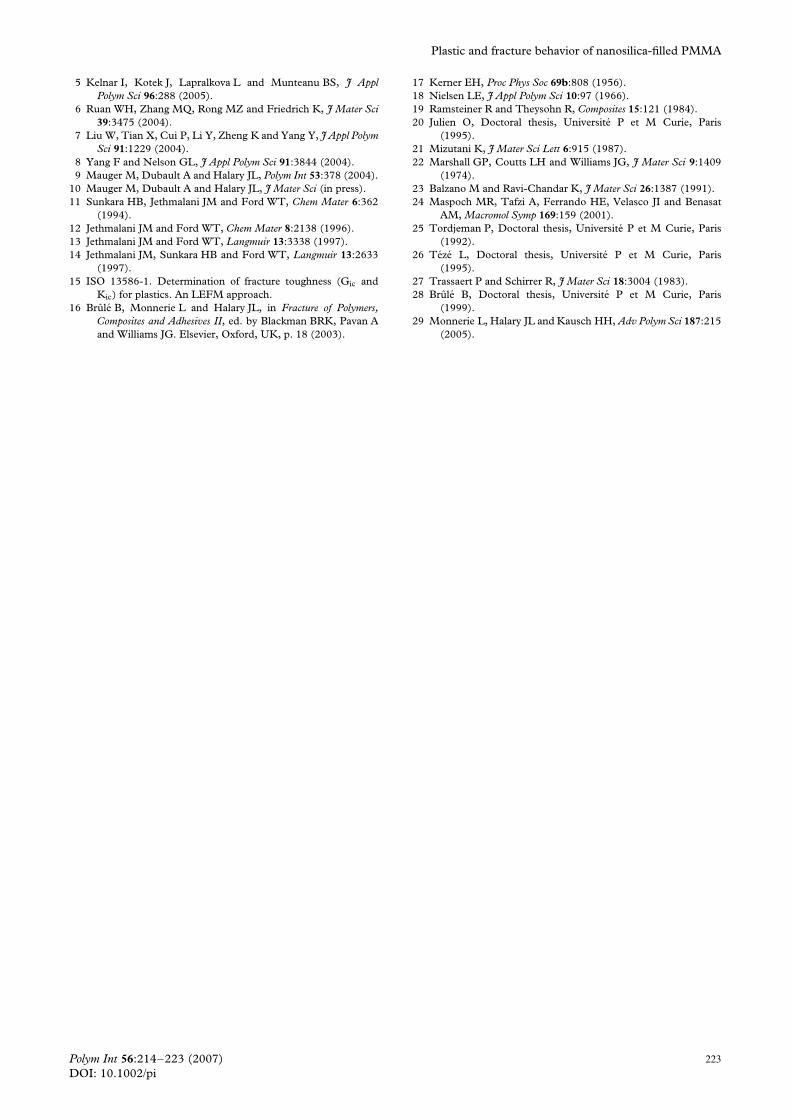
Analysis of KIC and GIC valuesThe KIC and GIC values, calculated (see above)from the ‘strength–displacement’ curves, are reportedin Figs 16 and 17, respectively. In Fig. 16 arealso reported some PMMA data taken from theliterature.20–24
PMMA. Figure 16, in accordance with the litera-ture, shows evidence that the PMMA toughness (KIC)decreases with increasing temperature. Obviously, ananalysis in energy (Fig. 17) leads to the same con-clusion for the critical energy release rate GIC. Thisbehavior can be understood by referring to some pre-vious experimental results:
(i) For temperatures higher than 0 ◦C, it wasdemonstrated25,26 that the stable fracture of
Polym Int 56:214–223 (2007) 221DOI: 10.1002/pi
M Mauger, A Dubault, JL Halary
0
0.2
0.4
0.6
0.8
1
1.2
1.4
0 20 100
PMMAMTOS seriesPMMA: data from literature
Temperature (°C)
MTOS series
Cri
tica
l str
ess-
inte
nsit
y fa
ctor
KIC
(MP
a.m
1/2 )
40 60 80
Figure 16. Critical stress intensity factor KIC versus temperature forPMMA and MTOS samples.
0.0
0.2
0.4
0.6
0.8
1.0
1.2
0 20 40 60 80 100
Temperature (°C)
PMMA
MTOS series
Cri
tica
l ene
rgy
rele
ase
rate
GIC
(KJ.
m-2
)
Figure 17. Critical energy release rate GIC versus temperature forPMMA and MTOS samples.
PMMA can be described as craze propagationthrough crack.
(ii) Optical interferometric measurements27 showedthat craze fracture results from chain disentan-glements inside crazing fibrils located near thecrack tip.
In fact, when temperature increases, chains becomemore mobile and chain disentanglements are pro-moted. In consequence, crazing fibrils are less stable,which makes it easier for the crack to propagate, andconsequently toughness is reduced. Such a behaviorwas also observed with other polymer families suchas semi-aromatic polyamides or low-molecular-weightpolycarbonates for which the fibril stability is reducedduring the chain disentanglement process.28
Filled PMMA. Figure 17 shows that all PMMA–MTOS nanocomposites exhibit a fracture behaviorquite different from that of PMMA: indeed, toughnessincreases very slightly with increasing temperature. Inmore detail, analysis of KIC values shows that:
(i) at 100 ◦C, the toughness of nanocomposites doesnot significantly differ from that of PMMA: KIC isabout equal to 0.6 MPa m1/2;
(ii) on the other hand, the incorporation of nanofillerscauses brittleness all the more pronounced whenthe temperature is lower: for example, at 25 ◦C,KIC is approximately equal to 0.5 MPa m1/2
which is largely less than that of PMMA(∼=1.1 MPa m1/2).
The increase in brittleness of filled PMMAcompared to PMMA, especially at room temperature,can tentatively be interpreted in terms of yield stress.In fact, it has been demonstrated (see above) that theincorporation of fillers always involves an increasein yield stress. That renders less easy the energydissipation by a plastic process;29 thus, the toughnessof PMMA is reduced. As for the increase of filledPMMA toughness with temperature, this can beexplained by the crosslinking of chains in filledPMMA, which hinders the craze formation and alsothe chain disentanglements inside craze fibrils.
CONCLUSIONSThe synthesis of numerous nanosilica–PMMA net-works of well-defined architecture allows one to drawconclusions about the influence of nanosilica parti-cles on the plastic and fracture behavior of a PMMAmatrix.
The study of plasticity, carried out through com-pression tests, revealed some marked features concern-ing the effects arising from nanofiller incorporation:
• the disappearance of stress softening which leads usto define a pseudo-yield point;
• a marked hardening occurring at relatively lowdeformation (about 0.2); and
• an increase in elastic modulus and yield stress.
Yield stress increase can be quantitatively explainedby taking into account both the increase in elasticmodulus and the amplification of deformation arisingfrom the undeformability of nanosilica particles. As forhardening, it appears closely related to the presenceof crosslinks in filled materials as demonstrated bythe observed linear decrease of matrix hardeningdeformation with crosslink density.
The fracture measurements clearly give evidenceof a pronounced decrease in toughness for filledmaterials, compared to PMMA. The slight increasein toughness with increasing temperature has beententatively attributed to the presence of crosslinks.
REFERENCES1 Lai M and Kim JK, Polymer 46:4722 (2005).2 Leuteritz A, Pospiech D, Kretzschmar B, Willeke M, Jech-
nichen D, Jentzsch U, et al, Macromol Symp 221:53 (2005).3 Chen CH, Teng CC and Yang CH, J Polym Sci Polym Phys Ed
43:1465 (2005).4 Someya Y and Shibata M, Polymer 46:4891 (2005).
222 Polym Int 56:214–223 (2007)DOI: 10.1002/pi
Plastic and fracture behavior of nanosilica-filled PMMA
5 Kelnar I, Kotek J, Lapralkova L and Munteanu BS, J ApplPolym Sci 96:288 (2005).
6 Ruan WH, Zhang MQ, Rong MZ and Friedrich K, J Mater Sci39:3475 (2004).
7 Liu W, Tian X, Cui P, Li Y, Zheng K and Yang Y, J Appl PolymSci 91:1229 (2004).
8 Yang F and Nelson GL, J Appl Polym Sci 91:3844 (2004).9 Mauger M, Dubault A and Halary JL, Polym Int 53:378 (2004).
10 Mauger M, Dubault A and Halary JL, J Mater Sci (in press).11 Sunkara HB, Jethmalani JM and Ford WT, Chem Mater 6:362
(1994).12 Jethmalani JM and Ford WT, Chem Mater 8:2138 (1996).13 Jethmalani JM and Ford WT, Langmuir 13:3338 (1997).14 Jethmalani JM, Sunkara HB and Ford WT, Langmuir 13:2633
(1997).15 ISO 13586-1. Determination of fracture toughness (Gic and
Kic) for plastics. An LEFM approach.16 Brule B, Monnerie L and Halary JL, in Fracture of Polymers,
Composites and Adhesives II, ed. by Blackman BRK, Pavan Aand Williams JG. Elsevier, Oxford, UK, p. 18 (2003).
17 Kerner EH, Proc Phys Soc 69b:808 (1956).18 Nielsen LE, J Appl Polym Sci 10:97 (1966).19 Ramsteiner R and Theysohn R, Composites 15:121 (1984).20 Julien O, Doctoral thesis, Universite P et M Curie, Paris
(1995).21 Mizutani K, J Mater Sci Lett 6:915 (1987).22 Marshall GP, Coutts LH and Williams JG, J Mater Sci 9:1409
(1974).23 Balzano M and Ravi-Chandar K, J Mater Sci 26:1387 (1991).24 Maspoch MR, Tafzi A, Ferrando HE, Velasco JI and Benasat
AM, Macromol Symp 169:159 (2001).25 Tordjeman P, Doctoral thesis, Universite P et M Curie, Paris
(1992).26 Teze L, Doctoral thesis, Universite P et M Curie, Paris
(1995).27 Trassaert P and Schirrer R, J Mater Sci 18:3004 (1983).28 Brule B, Doctoral thesis, Universite P et M Curie, Paris
(1999).29 Monnerie L, Halary JL and Kausch HH, Adv Polym Sci 187:215
(2005).
Polym Int 56:214–223 (2007) 223DOI: 10.1002/pi