Embed Size (px)
Citation preview
Faculty of Natural Resources and Agricultural Sciences
Plasmodiophora brassicae - host and environment interactions
Oskar Björling
Department of Plant Biology and Forest Genetics Master´s thesis • 30 hec • First cycle, G2E DEGREE OF MASTER OF SCIENCE IN AGRICULTURE and DEGREE OF MASTER OF SCIENCE with a major in Biology • ISSN 1651-5196, No 141 Uppsala, 2013
Plasmodiophora brassicae – host and environment interactions
Oskar Björling Supervisor: Dr Arne Schwelm, Swedish University of Agricultural Sciences,
Department of Plant Biology and Forest Genetics, Uppsala Assistant Supervisor: Prof. Christina Dixelius, Swedish University of Agricultural Sciences,
Department of Plant Biology and Forest Genetics, Uppsala Examiner: Dr Anders Kvarnheden, Swedish University of Agricultural Sciences,
Department of Plant Biology and Forest Genetics, Uppsala
Credits: 30 hec Level: First cycle, G2E Course title: Independent Project/Degree Project in Biology - Master's thesis Course code: EX0565 Programme/education: DEGREE OF MASTER OF SCIENCE IN AGRICULTURE and
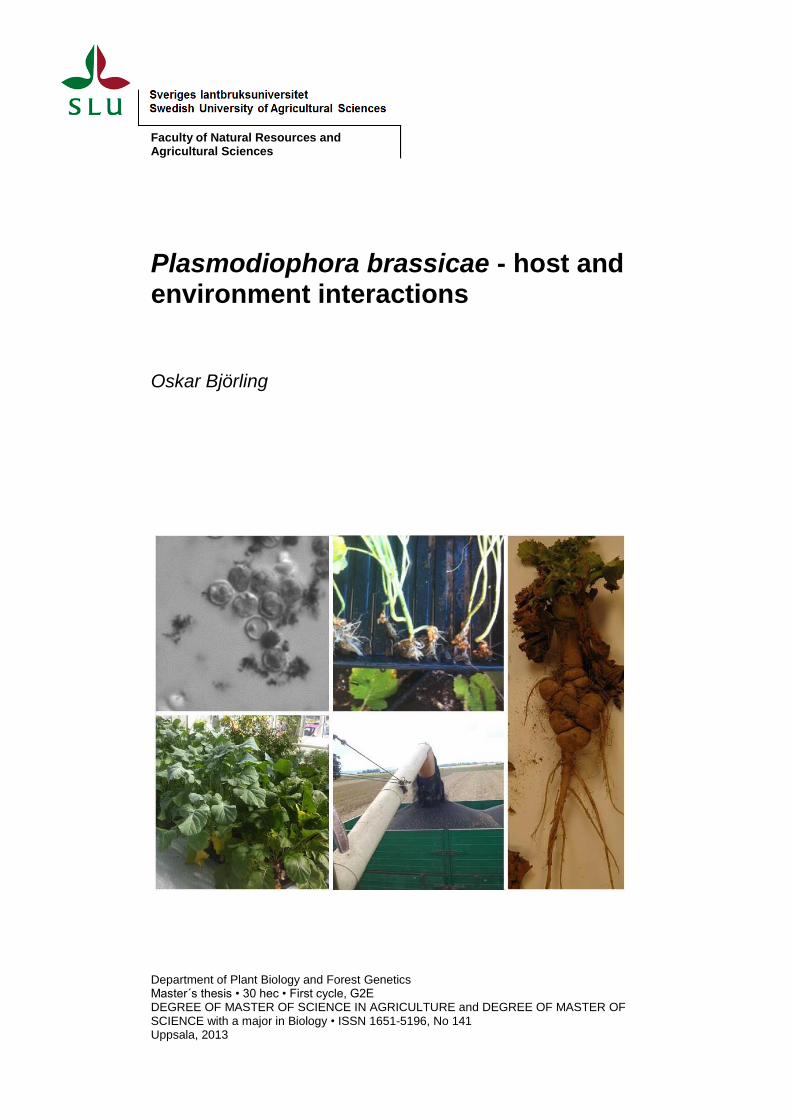
DEGREE OF MASTER OF SCIENCE with a major in Biology Place of publication: Uppsala Year of publication: 2013 Cover picture: Upper left: resting spores of P. brassicae, upper right: P. brassicae infected brassica roots, lower left: brassica plants, lower right: oilseed rape seeds, right: P. brassicae
infected brassica roots. Oskar Björling, photos. Number of part of series: 141 ISSN: 1651-5196 Online publication: http://stud.epsilon.slu.se
Keywords: Clubroot, Gene expression, Klumprotsjuka, Plasmodiophora brassicae, Root
exudates, Resting spores Department of Plant Biology and Forest Genetics Master´s thesis • 30 hec • First cycle, G2E DEGREE OF MASTER OF SCIENCE IN AGRICULTURE and DEGREE OF MASTER OF SCIENCE with a major in Biology • ISSN 1651-5196, No 141 Uppsala, 2013
Abstract
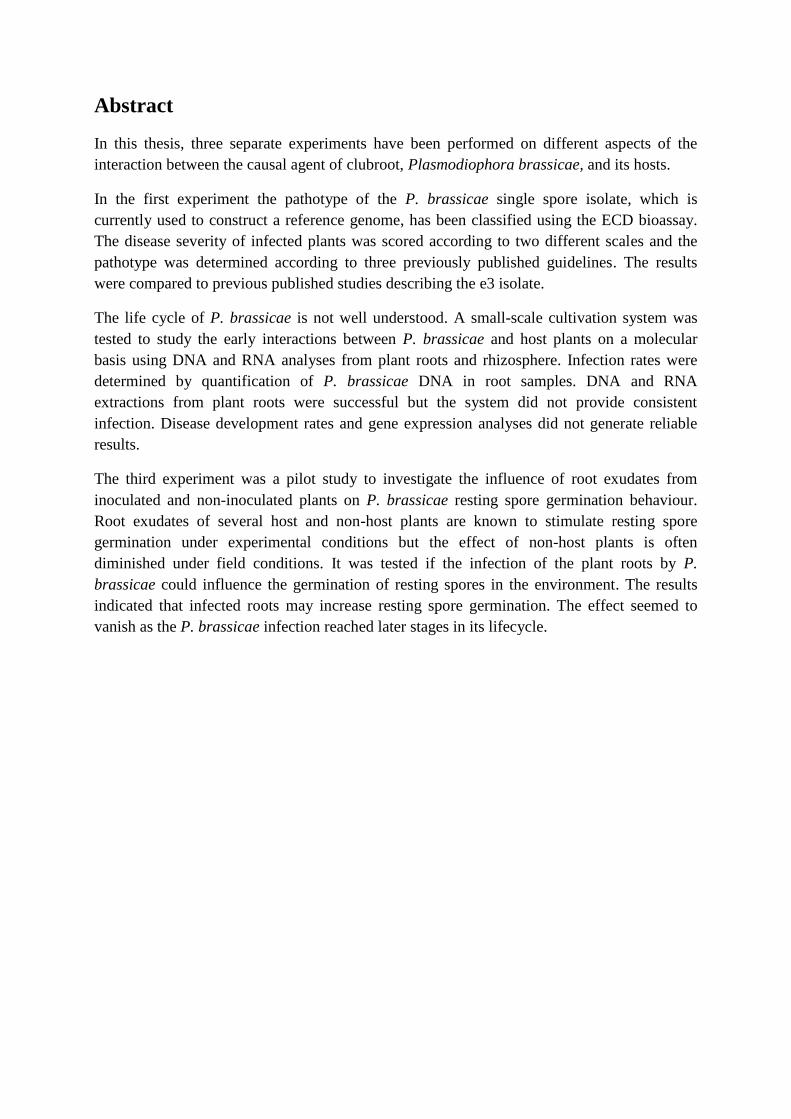
In this thesis, three separate experiments have been performed on different aspects of the
interaction between the causal agent of clubroot, Plasmodiophora brassicae, and its hosts.
In the first experiment the pathotype of the P. brassicae single spore isolate, which is
currently used to construct a reference genome, has been classified using the ECD bioassay.
The disease severity of infected plants was scored according to two different scales and the
pathotype was determined according to three previously published guidelines. The results
were compared to previous published studies describing the e3 isolate.
The life cycle of P. brassicae is not well understood. A small-scale cultivation system was
tested to study the early interactions between P. brassicae and host plants on a molecular
basis using DNA and RNA analyses from plant roots and rhizosphere. Infection rates were
determined by quantification of P. brassicae DNA in root samples. DNA and RNA
extractions from plant roots were successful but the system did not provide consistent
infection. Disease development rates and gene expression analyses did not generate reliable
results.
The third experiment was a pilot study to investigate the influence of root exudates from
inoculated and non-inoculated plants on P. brassicae resting spore germination behaviour.
Root exudates of several host and non-host plants are known to stimulate resting spore
germination under experimental conditions but the effect of non-host plants is often
diminished under field conditions. It was tested if the infection of the plant roots by P.
brassicae could influence the germination of resting spores in the environment. The results
indicated that infected roots may increase resting spore germination. The effect seemed to
vanish as the P. brassicae infection reached later stages in its lifecycle.
Sammanfattning
Klumprotsjuka är en allvarlig sjukdom som angriper oljeväxter. Den orsakas av den obligata
och biotrofa patogenen Plasmodiophora brassicae. I detta examensarbete ingår tre separata
experiment som alla syftar till att undersöka olika aspekter av interaktionen mellan P.
brassicae och dess värdväxter.
I det första experimentet undersöktes aggressiviteten av ett P. brassicae enkelsporisolat, e3,
på 15 olika värdväxter som odlades i växthus. Aggressiviteten av isolatet bedömdes genom att
gradera symptomen på värdväxternas rötter för att bestämma isolatets patotyp. Informationen
var av särskilt stor betydelse eftersom isolatet använts i flera tidigare och pågående studier,
bl.a. för utvecklingen av ett referensgenom. Alla 15 värdväxterna utvecklade mer eller mindre
kraftiga symptom vilket visar att e3 isolatet är ett aggressivt isolat med vid värdkrets.
Det andra experimentet utfördes för att studera interaktionen mellan patogenen och
värdväxten på gennivå med hjälp av kvantitativ PCR–teknik. Att mäta vilka gener som
uttrycks under infektionsförloppet är en vanlig teknik för att studera processer och
regulatoriska nätverk under sjukdomsförloppet. Kunskap inom området är en nyckel i
forskning och utvecklingen av nya sätt att kontrollera sjukdomen. För att studera genuttrycket
under infektionsprocessen utvecklades ett enkelt odlingssystem där växter kunde odlas och
inokuleras med P. brassicae under standardiserade förhållanden. DNA och RNA extraherades
ur växternas rötter och ur jorden. DNA och RNA från växternas rötter höll tillräckligt god
kvalitet för att analyseras. Patogenens tillväxt mättes i förhållande till växtens genom via
kvantifiering av DNA. Analysen indikerar ojämn sjukdomsutveckling mellan individuella
replikat vilket tyder på att odlingssystemet inte fungerade optimalt. Resultaten av
genuttrycksanalysen bedömdes inte som tillförlitliga.
P. brassicae bildar långlivade vilsporer vilket gör att smittan kan finnas kvar i marken under
lång tid efter ett sjukdomsutbrott även i avsaknad av värdväxter. Flera studier har visat att
groningen av vilsporer sker spontant, men att ett flertal biotiska och abiotiska faktorer kan
påverka sporernas groning. Att utnyttja mekanismen som styr groningen för att stimulera
denna utan att patogenen ges möjlighet att slutföra sin livscykel efter groningen är en av två
huvudsakliga strategier som har föreslagits för biologisk kontroll av P. brassicae. Ett flertal
försök med att använda olika växter för att inducera sporgroning har tidigare utförts med
blandade resultat. I den tredje delen av det här examensarbetet genomfördes en pilotstudie för
att undersöka om rotexudat från inokulerade rötter har större groningsstimulerande effekt på
vilsporer jämfört med rotexudat från friska plantor. Resultaten visar att rotexudat från
inokulerade rötter stimulerar vilsporgroningen mer än friska rötter och att den stimulerande
effekten varierar beroende på vilket stadium av sjukdomen som förekommer i växtrötterna när
rotexudaten utsöndras. Ytterligare forskning inom området behövs för att nå en djupare
förståelse för vilka faktorer som styr groningen hos vilsporerna och hur dessa kan utnyttjas för
att utveckla nya produkter för sjukdomsbekämpning.
Table of contents 1. Introduction .......................................................................................................................... 5
Background ......................................................................................................................... 5
Problem definition .............................................................................................................. 8
Limitations .......................................................................................................................... 8
2. Classification of the P. brassicae e3 isolate ......................................................................... 9
2.1 Introduction ...................................................................................................................... 9
Aim ..................................................................................................................................... 9
Hypothesis ........................................................................................................................... 9
2.2 Materials and methods .................................................................................................... 10
2.3 Results ............................................................................................................................ 11
2.4 Discussion ....................................................................................................................... 13
3. Optimization of cultivation system of test plants for gene expression analysis ............ 16
3.1 Introduction .................................................................................................................... 16
Aim ................................................................................................................................... 18
Hypothesis ......................................................................................................................... 18
3.2 Materials and methods .................................................................................................... 18
Cultivation, sampling and inoculation of test plants ......................................................... 18
RNA extraction from soil samples .................................................................................... 19
Preparation of RNA from root samples ............................................................................ 19
qPCR gene expression analysis ........................................................................................ 19
Analysis of qPCR gene expression results ........................................................................ 20
Preparation and analysis of DNA from root samples ....................................................... 20
3.3 Results ............................................................................................................................ 21
RNA extraction from infected soil .................................................................................... 21
DNA content in infected roots .......................................................................................... 21
Gene expression of P. brassicae in infected roots ............................................................ 21
3.4 Discussion ....................................................................................................................... 23
4. Stimulating effect on resting spore germination by root exudates of inoculated plant
roots ......................................................................................................................................... 24
4.1 Introduction .................................................................................................................... 24
Aim ................................................................................................................................... 24
Hypothesis ......................................................................................................................... 24
4.2 Materials and methods .................................................................................................... 24

3.3 Results ............................................................................................................................ 26
4.4 Discussion ....................................................................................................................... 28
5. General discussion .............................................................................................................. 29
5.1 Concluding remarks ........................................................................................................ 29
5.2 Acknowledgements ........................................................................................................ 29
6. References ........................................................................................................................... 30
5
1. Introduction
Background
Clubroot is a severe disease of oilseed rape, cabbages, oilseed turnip (Hwang et al. 2012a)
and all the other ~3700 potential host plant species belonging to the Brassicaceae family
(Dixon 2009a). It may cause total yield loss in infested fields (Hwang et al. 2012a). A study
by Crête (1981), on the worldwide importance of clubroot, indicates that crop losses caused
by clubroot corresponds to the general estimation of in-field crop losses caused by individual
crop pathogens of 10-15% (Dixon 2009a). The pathogen causing clubroot, Plasmodiophora
brassicae, is commonly occurring in Swedish fields (Wallenhammar 1996). Increased
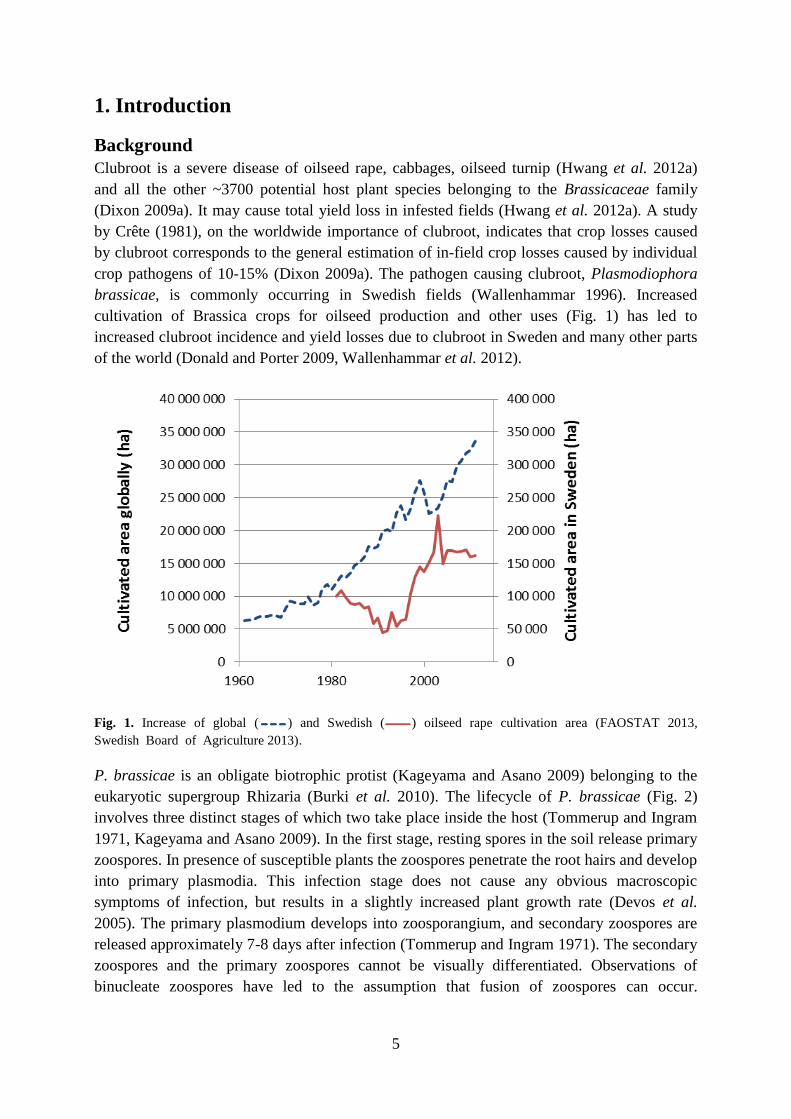
cultivation of Brassica crops for oilseed production and other uses (Fig. 1) has led to
increased clubroot incidence and yield losses due to clubroot in Sweden and many other parts
of the world (Donald and Porter 2009, Wallenhammar et al. 2012).
Fig. 1. Increase of global ( ) and Swedish ( ) oilseed rape cultivation area (FAOSTAT 2013,
Swedish_Board_of_Agriculture 2013).
P. brassicae is an obligate biotrophic protist (Kageyama and Asano 2009) belonging to the
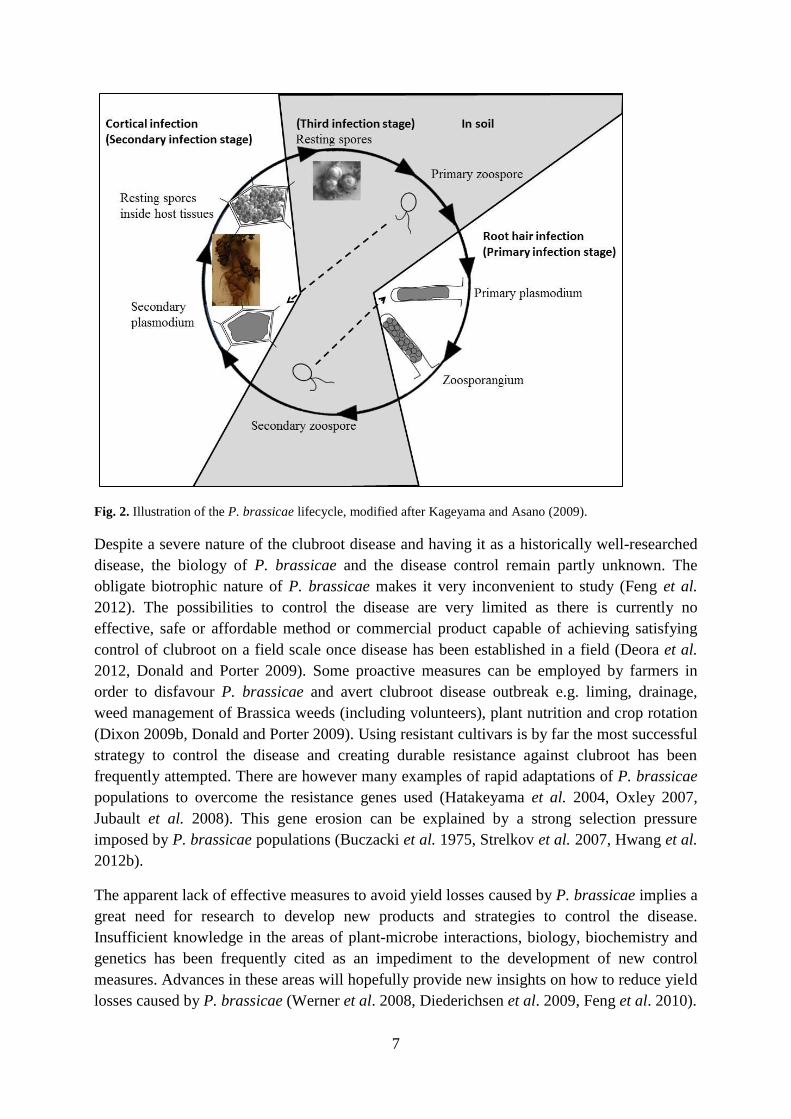
eukaryotic supergroup Rhizaria (Burki et al. 2010). The lifecycle of P. brassicae (Fig. 2)
involves three distinct stages of which two take place inside the host (Tommerup and Ingram
1971, Kageyama and Asano 2009). In the first stage, resting spores in the soil release primary
zoospores. In presence of susceptible plants the zoospores penetrate the root hairs and develop
into primary plasmodia. This infection stage does not cause any obvious macroscopic
symptoms of infection, but results in a slightly increased plant growth rate (Devos et al.
2005). The primary plasmodium develops into zoosporangium, and secondary zoospores are
released approximately 7-8 days after infection (Tommerup and Ingram 1971). The secondary
zoospores and the primary zoospores cannot be visually differentiated. Observations of
binucleate zoospores have led to the assumption that fusion of zoospores can occur.
6
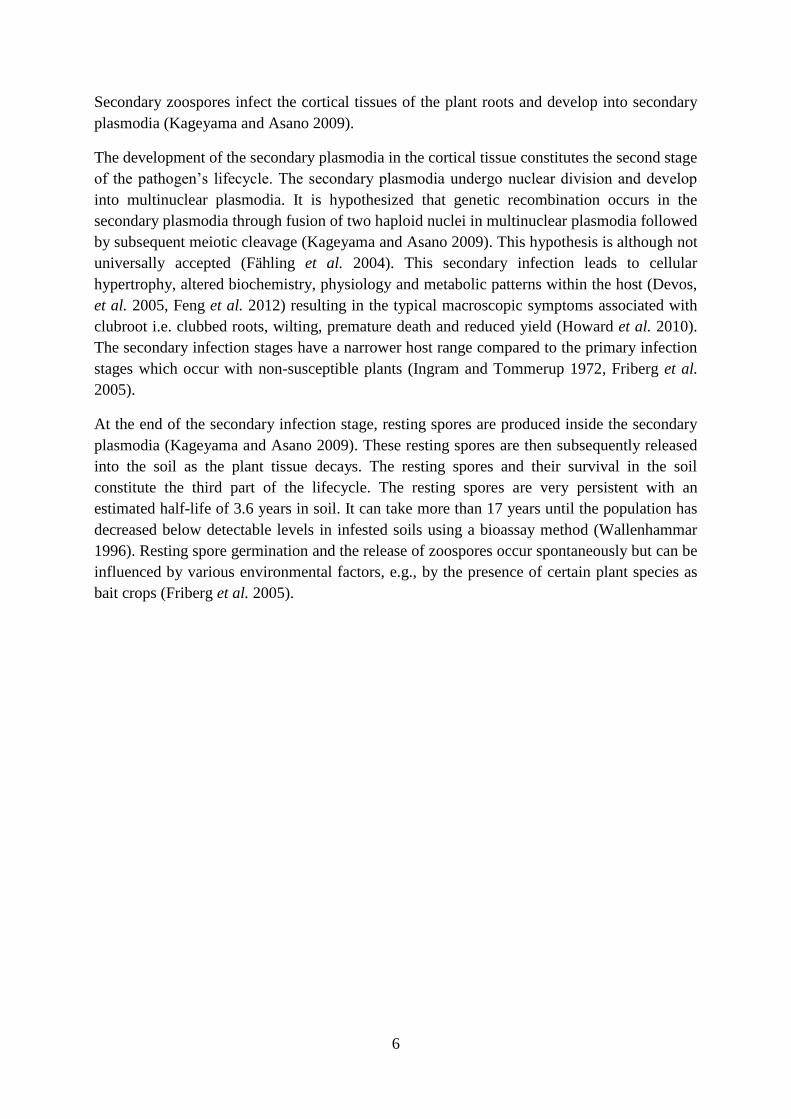
Secondary zoospores infect the cortical tissues of the plant roots and develop into secondary
plasmodia (Kageyama and Asano 2009).
The development of the secondary plasmodia in the cortical tissue constitutes the second stage
of the pathogen’s lifecycle. The secondary plasmodia undergo nuclear division and develop
into multinuclear plasmodia. It is hypothesized that genetic recombination occurs in the
secondary plasmodia through fusion of two haploid nuclei in multinuclear plasmodia followed
by subsequent meiotic cleavage (Kageyama and Asano 2009). This hypothesis is although not
universally accepted (Fähling et al. 2004). This secondary infection leads to cellular
hypertrophy, altered biochemistry, physiology and metabolic patterns within the host (Devos,
et al. 2005, Feng et al. 2012) resulting in the typical macroscopic symptoms associated with
clubroot i.e. clubbed roots, wilting, premature death and reduced yield (Howard et al. 2010).
The secondary infection stages have a narrower host range compared to the primary infection
stages which occur with non-susceptible plants (Ingram and Tommerup 1972, Friberg et al.
2005).
At the end of the secondary infection stage, resting spores are produced inside the secondary
plasmodia (Kageyama and Asano 2009). These resting spores are then subsequently released
into the soil as the plant tissue decays. The resting spores and their survival in the soil
constitute the third part of the lifecycle. The resting spores are very persistent with an
estimated half-life of 3.6 years in soil. It can take more than 17 years until the population has
decreased below detectable levels in infested soils using a bioassay method (Wallenhammar
1996). Resting spore germination and the release of zoospores occur spontaneously but can be
influenced by various environmental factors, e.g., by the presence of certain plant species as
bait crops (Friberg et al. 2005).
7
Fig. 2. Illustration of the P. brassicae lifecycle, modified after Kageyama and Asano (2009).
Despite a severe nature of the clubroot disease and having it as a historically well-researched
disease, the biology of P. brassicae and the disease control remain partly unknown. The
obligate biotrophic nature of P. brassicae makes it very inconvenient to study (Feng et al.
2012). The possibilities to control the disease are very limited as there is currently no
effective, safe or affordable method or commercial product capable of achieving satisfying
control of clubroot on a field scale once disease has been established in a field (Deora et al.
2012, Donald and Porter 2009). Some proactive measures can be employed by farmers in
order to disfavour P. brassicae and avert clubroot disease outbreak e.g. liming, drainage,
weed management of Brassica weeds (including volunteers), plant nutrition and crop rotation
(Dixon 2009b, Donald and Porter 2009). Using resistant cultivars is by far the most successful
strategy to control the disease and creating durable resistance against clubroot has been
frequently attempted. There are however many examples of rapid adaptations of P. brassicae
populations to overcome the resistance genes used (Hatakeyama et al. 2004, Oxley 2007,
Jubault et al. 2008). This gene erosion can be explained by a strong selection pressure
imposed by P. brassicae populations (Buczacki et al. 1975, Strelkov et al. 2007, Hwang et al.
2012b).
The apparent lack of effective measures to avoid yield losses caused by P. brassicae implies a
great need for research to develop new products and strategies to control the disease.
Insufficient knowledge in the areas of plant-microbe interactions, biology, biochemistry and
genetics has been frequently cited as an impediment to the development of new control
measures. Advances in these areas will hopefully provide new insights on how to reduce yield
losses caused by P. brassicae (Werner et al. 2008, Diederichsen et al. 2009, Feng et al. 2010).
8
Problem definition
P. brassicae is causing substantial problems in the production of cruciferous crops all over the
world. Development of counter measures against the disease is slow due to limited knowledge
about the pathogen, partly due to its obligate lifestyle which makes studies on this organism
difficult. Therefore, improved methods to study, and/or improved knowledge regarding plant-
pathogen interactions, biology, genetics and biochemistry are of great significance.
Limitations
The research carried out during this master thesis was adapted to fit into the limited time-
frame of a master thesis and the literature study is solely conducted in order to give
background and support the materials and methods used and the results obtained from the
thesis research.
9
2. Classification of the P. brassicae e3 isolate
2.1 Introduction
Different isolates of P. brassicae appear to have different host preferences, or physiological
specialization (Buczacki et al. 1975, Strelkov et al. 2007, Hwang et al. 2012b). Populations
with specific host preferences are referred to as races or pathotypes. Up to date the P.
brassicae pathotypes are determined by different bioassay methods (Hatakeyama et al. 2004).
One of the most common bioassay methods is the European clubroot differential (ECD)
bioassay test (Buczacki et al. 1975). The ECD test has been used in many previous studies
and has been regarded as the standard method for pathotype determination of P. brassicae
isolates over the last decades (Vorrips 1996, Hatakeyama et al. 2004, Strelkov et al. 2007).
This particular bioassay consists of 15 different genotypes representing three subsets of three
different species: Brassica rapa, B. napus and B. oleracea. These genotypes represent
different combinations of clubroot resistance (CR) genes. The exact information about the
number and identity of these resistance genes are not known but it is assumed that each
genotype contains a complex of pathotype specific CR genes (Diederichsen et al. 2009). The
ECD test is sometimes referred to as insensitive since combinations of CR genes are known to
result in fewer compatible interactions (Strelkov et al. 2006, Matsumoto et al. 2012). Other
plant genotypes can be included in the bioassay to detect differences in virulence between
isolates (Hatakeyama et al. 2004). Pathotype determination of P. brassicae field populations
is essential for management of clubroot resistant (CR) varieties. Field populations often
consist of a complex of pathotypes (Buczacki et al. 1975, Fahling et al. 2003, Strelkov et al.
2007, Hwang et al. 2012b). Hence, the use of single race-specific resistance genes against P.
brassicae imposes strong selection pressure for virulent pathotypes. Using isolates derived
from a single resting spore has been a way for researchers to reduce the genetic diversity in P.
brassicae populations, providing a more uniform material to work with (Tingal and Webster
1981, Voorrips 1996). The e3 isolate, used in this thesis, is a single spore isolate (Fähling et
al. 2003, 2004). A genome sequencing project at the Swedish University of Agricultural
Sciences (SLU) has generated a genome sequence draft of the e3 isolate, which will be the
first sequenced plasmodiophorid organism (Schwelm et al. unpublished). However, the
pathotype of the e3 isolate was unknown. The determination of the race of the e3 isolate is
essential for initiating further research aiming to uncoil the largely unknown relationships
between genotype and phenotype of P. brassicae using the e3 isolate as a reference genome.
Aim
The aim of this experiment was to determine the pathotype of the P. brassicae e3 isolate using
the ECD bioassay (Buczacki et al. 1975).
Hypothesis
The e3 isolate will produce disease of varying severity on the host set included in the ECD
test.
10
2.2 Materials and methods
The seeds of the 15 ECD hosts (Table 1) were provided by the University of Warwick, UK
(Warwick Genetic resource centre). Brassica napus var. oleifera cv. Mendel and cv. Express
were obtained from Lantmännen Lantbruk/SW Seed.
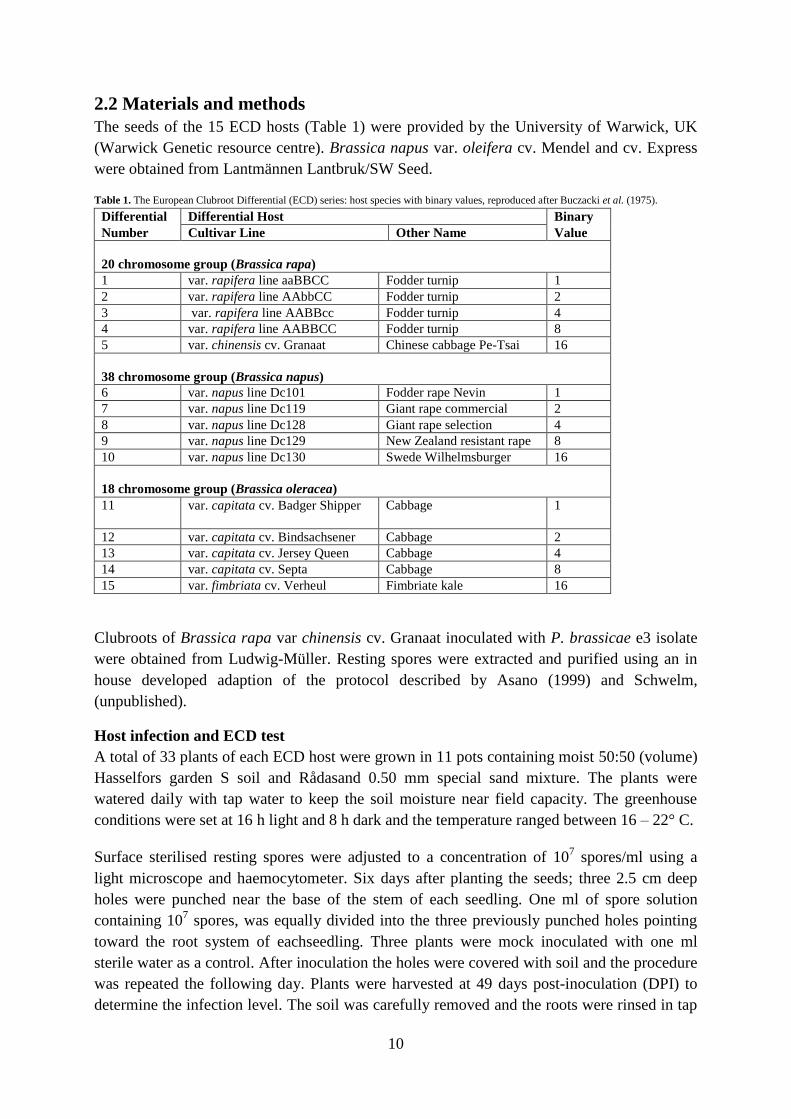
Table 1. The European Clubroot Differential (ECD) series: host species with binary values, reproduced after Buczacki et al. (1975).
Differential Differential Host Binary
Number Cultivar Line Other Name Value
20 chromosome group (Brassica rapa)
1 var. rapifera line aaBBCC Fodder turnip 1
2 var. rapifera line AAbbCC Fodder turnip 2
3 var. rapifera line AABBcc Fodder turnip 4
4 var. rapifera line AABBCC Fodder turnip 8
5 var. chinensis cv. Granaat Chinese cabbage Pe-Tsai 16
38 chromosome group (Brassica napus)
6 var. napus line Dc101 Fodder rape Nevin 1
7 var. napus line Dc119 Giant rape commercial 2
8 var. napus line Dc128 Giant rape selection 4
9 var. napus line Dc129 New Zealand resistant rape 8
10 var. napus line Dc130 Swede Wilhelmsburger 16
18 chromosome group (Brassica oleracea)
11 var. capitata cv. Badger Shipper Cabbage 1
12 var. capitata cv. Bindsachsener Cabbage 2
13 var. capitata cv. Jersey Queen Cabbage 4
14 var. capitata cv. Septa Cabbage 8
15 var. fimbriata cv. Verheul Fimbriate kale 16
Clubroots of Brassica rapa var chinensis cv. Granaat inoculated with P. brassicae e3 isolate
were obtained from Ludwig-Müller. Resting spores were extracted and purified using an in
house developed adaption of the protocol described by Asano (1999) and Schwelm,
(unpublished).
Host infection and ECD test
A total of 33 plants of each ECD host were grown in 11 pots containing moist 50:50 (volume)
Hasselfors garden S soil and Rådasand 0.50 mm special sand mixture. The plants were
watered daily with tap water to keep the soil moisture near field capacity. The greenhouse
conditions were set at 16 h light and 8 h dark and the temperature ranged between 16 – 22° C.
Surface sterilised resting spores were adjusted to a concentration of 107 spores/ml using a
light microscope and haemocytometer. Six days after planting the seeds; three 2.5 cm deep
holes were punched near the base of the stem of each seedling. One ml of spore solution
containing 107 spores, was equally divided into the three previously punched holes pointing
toward the root system of eachseedling. Three plants were mock inoculated with one ml
sterile water as a control. After inoculation the holes were covered with soil and the procedure
was repeated the following day. Plants were harvested at 49 days post-inoculation (DPI) to
determine the infection level. The soil was carefully removed and the roots were rinsed in tap
11
water and the symptoms were visually assessed to determine the disease severity on a six-
graded scale ranging from 0 - 5, where 0 = no galls; 1 = enlarged lateral roots; 2 = galls on the
tap root; 3 = enlarged napiform tap root but healthy lateral roots; 4 = enlarged napiform tap
root, few lateral roots infected (small clubs); 5 = enlarged napiform tap root, most of the
lateral roots infected, as described by Crête et al. (1963). The average disease severity index
(DSI) was calculated according to Crête et al. (1963) as described by Wallenhammar et al.
(2000).
∑
Where n is the number of plants in each class and 0, 1, 2, 3, 4 and 5 are the symptom severity
classes.
Disease severity was also assessed using a four graded scale ranging from 0 - 3, where 0 = no
galling; 1 = a few small galls; 2 = moderate galling, and 3 = severe galling, developed by
Kuginuki et al. (1999). DSI was calculated using a modified formula from Horiuchi and Hori
(1980) as described by Strelkov et al. (2006).
∑
Where n is the number of plants in each class and 0, 1, 2 and 3 are the symptom severity
classes.
Triplet codes were generated using the binary values, a system used internationally for the
ECD hosts, where the binary numbers of all susceptible hosts in each chromosome group are
added.
2.3 Results
The upper parts of the plants did not show clear symptoms of stunted growth and the
difference between inoculated plants and healthy controls was not obvious at 49 DPI.
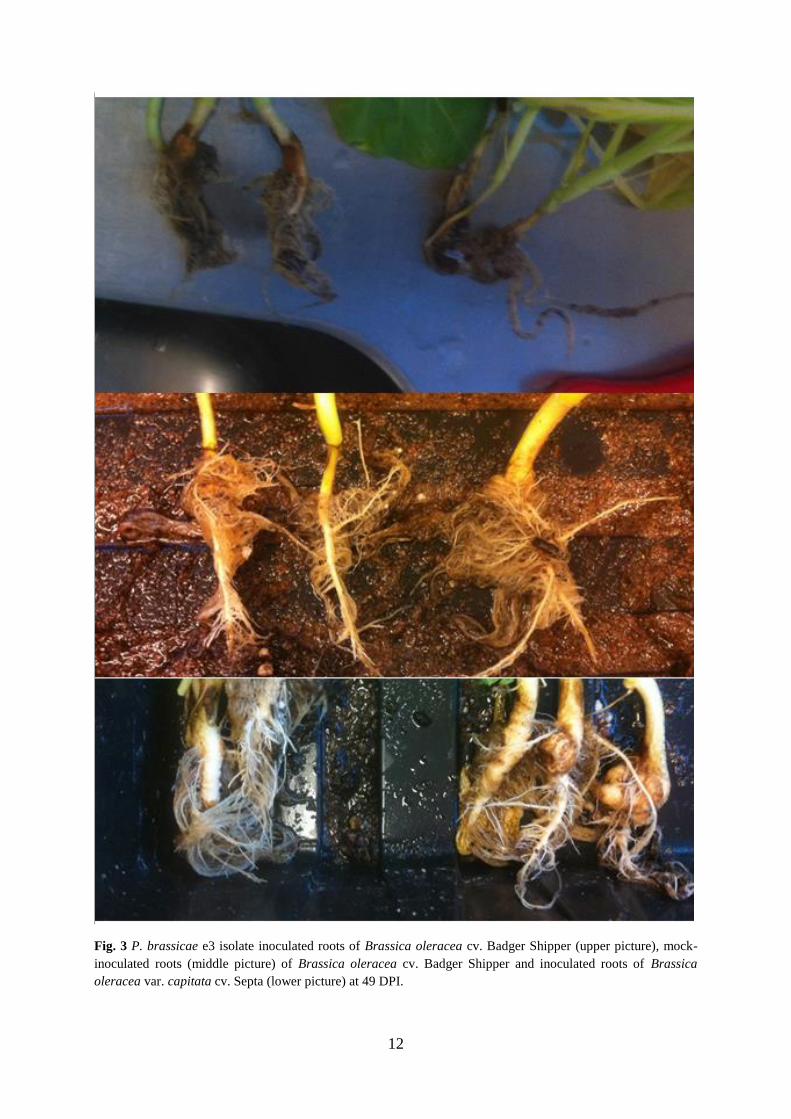
The DSI of the 15 ECD hosts used varied between 36 and 95 when symptoms were assessed
(Crête et al. 1963) as described by Wallenhammar (2000). Only ECD host number 11
(Brassica oleracea var. capitata cv. Badger Shipper) had a DSI below 50 (Fig. 3 and 4).
The DSI of the 15 ECD hosts used varied between 49 and 99 when symptoms were assessed
according to the four graded scale (Kuginuki et al. 1999) and DSI was calculated using the
formula modified from Horiuchi and Hori (1980) and Strelkov et al. (2006).
12
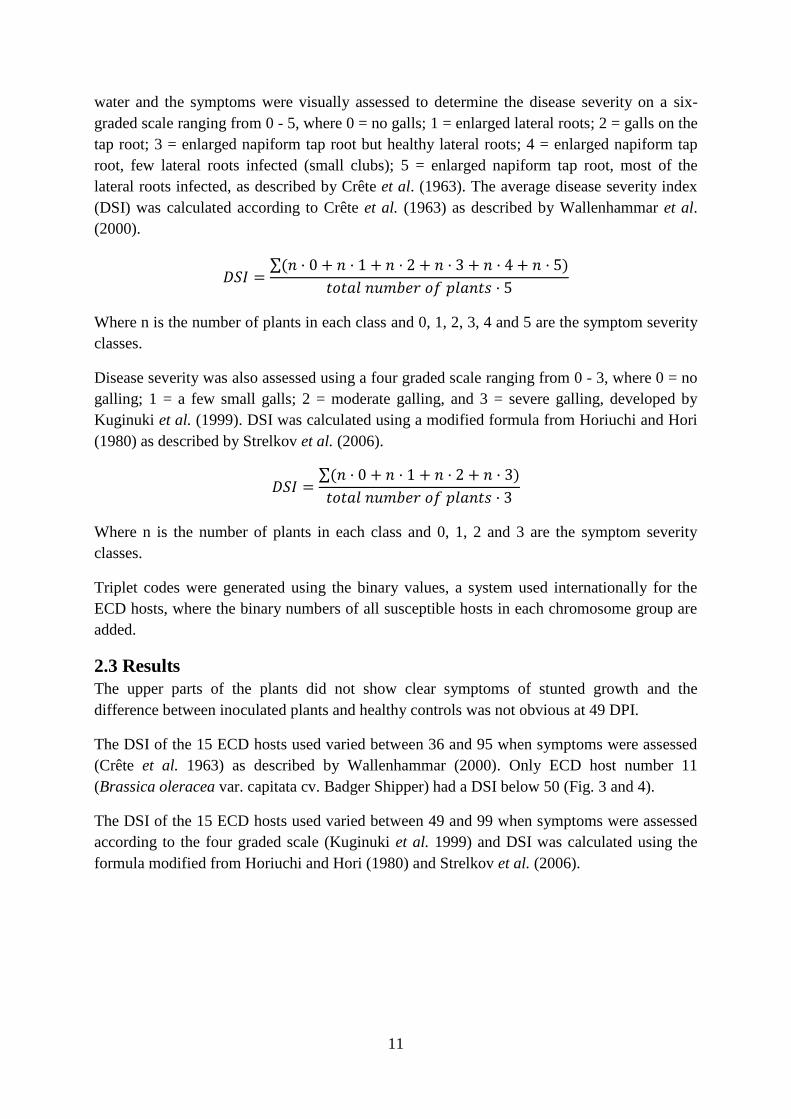
Fig. 3 P. brassicae e3 isolate inoculated roots of Brassica oleracea cv. Badger Shipper (upper picture), mock-
inoculated roots (middle picture) of Brassica oleracea cv. Badger Shipper and inoculated roots of Brassica
oleracea var. capitata cv. Septa (lower picture) at 49 DPI.
13
Fig. 4. Average disease severity index (DSI) and standard deviation of the 15 ECD hosts (Table 1) inoculated
with 2 · 107 spores of the e3 isolate per plant assessed at 49 DPI according to the instructions by Kuginuki et al.
(1999), Strelkov et al. (2006) (black) and Crête et al. (1963) (grey).
2.4 Discussion
The e3 isolate was compatible with all hosts included in this bioassay, but the aggressiveness
against different hosts varied as shown by the variation in DSI. Definitions of susceptible and
resistant interaction seem to vary between different studies. Some et al. (1996) used DSI=25
and Strelkov et al. (2006 and 2007) used DSI=50 as cut-off value between susceptible and
resistant interactions. Toxopeus et al. (1986) suggested that plants with DSI<20 should be
classified as resistant, and plants with 20<DSI<80 as intermediate and DSI>80 as susceptible.
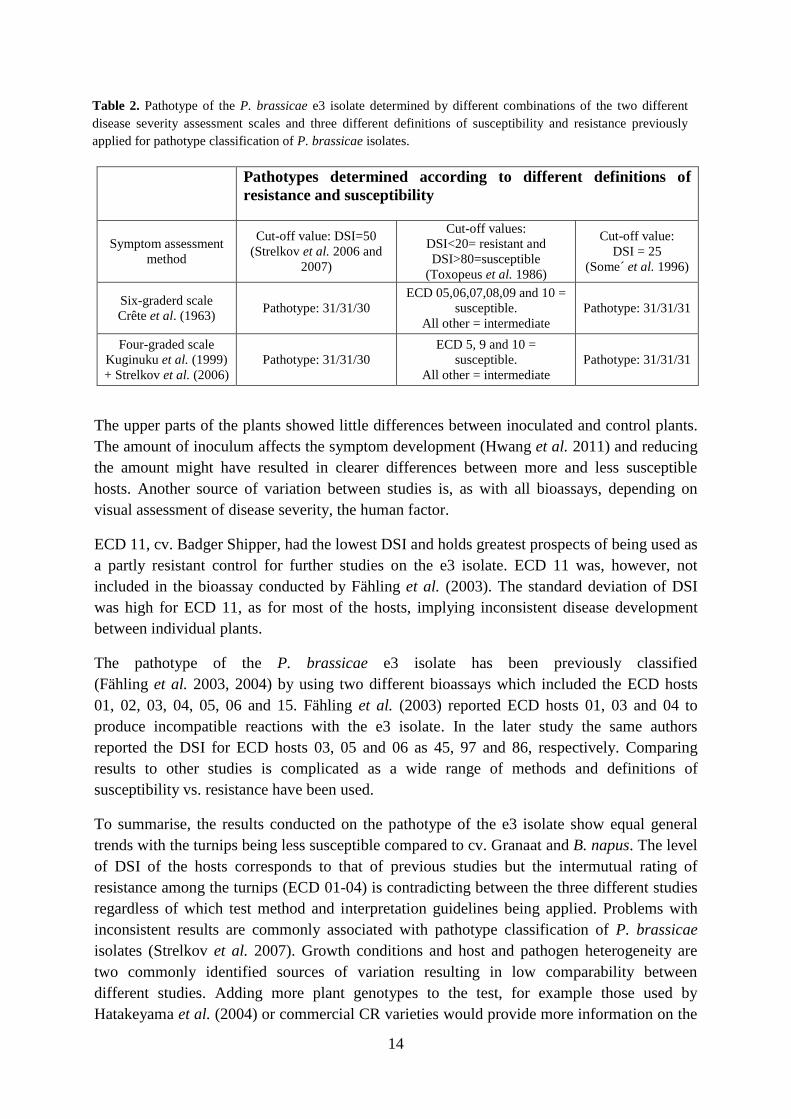
The interpretation of the pathotype classification depends on which model for pathotype
classification is being used (Table 2).
14
The upper parts of the plants showed little differences between inoculated and control plants.
The amount of inoculum affects the symptom development (Hwang et al. 2011) and reducing
the amount might have resulted in clearer differences between more and less susceptible
hosts. Another source of variation between studies is, as with all bioassays, depending on
visual assessment of disease severity, the human factor.
ECD 11, cv. Badger Shipper, had the lowest DSI and holds greatest prospects of being used as
a partly resistant control for further studies on the e3 isolate. ECD 11 was, however, not
included in the bioassay conducted by Fähling et al. (2003). The standard deviation of DSI
was high for ECD 11, as for most of the hosts, implying inconsistent disease development
between individual plants.
The pathotype of the P. brassicae e3 isolate has been previously classified
(Fähling et al. 2003, 2004) by using two different bioassays which included the ECD hosts
01, 02, 03, 04, 05, 06 and 15. Fähling et al. (2003) reported ECD hosts 01, 03 and 04 to
produce incompatible reactions with the e3 isolate. In the later study the same authors
reported the DSI for ECD hosts 03, 05 and 06 as 45, 97 and 86, respectively. Comparing
results to other studies is complicated as a wide range of methods and definitions of
susceptibility vs. resistance have been used.
To summarise, the results conducted on the pathotype of the e3 isolate show equal general
trends with the turnips being less susceptible compared to cv. Granaat and B. napus. The level
of DSI of the hosts corresponds to that of previous studies but the intermutual rating of
resistance among the turnips (ECD 01-04) is contradicting between the three different studies
regardless of which test method and interpretation guidelines being applied. Problems with
inconsistent results are commonly associated with pathotype classification of P. brassicae
isolates (Strelkov et al. 2007). Growth conditions and host and pathogen heterogeneity are
two commonly identified sources of variation resulting in low comparability between
different studies. Adding more plant genotypes to the test, for example those used by
Hatakeyama et al. (2004) or commercial CR varieties would provide more information on the
Table 2. Pathotype of the P. brassicae e3 isolate determined by different combinations of the two different
disease severity assessment scales and three different definitions of susceptibility and resistance previously
applied for pathotype classification of P. brassicae isolates.
Pathotypes determined according to different definitions of
resistance and susceptibility
Symptom assessment
method
Cut-off value: DSI=50
(Strelkov et al. 2006 and
2007)
Cut-off values:
DSI<20= resistant and
DSI>80=susceptible
(Toxopeus et al. 1986)
Cut-off value:
DSI = 25
(Some´ et al. 1996)
Six-graderd scale
Crête et al. (1963) Pathotype: 31/31/30
ECD 05,06,07,08,09 and 10 =
susceptible.
All other = intermediate
Pathotype: 31/31/31
Four-graded scale
Kuginuku et al. (1999)
+ Strelkov et al. (2006)
Pathotype: 31/31/30
ECD 5, 9 and 10 =
susceptible.
All other = intermediate
Pathotype: 31/31/31

15
host range of the e3 isolate and might enable identification of more effective CR genes against
the e3 isolate. In conclusion, e3 isolate is a broad range aggressive single spore isolate with a
perceptual preference of cv. Granaat and B. napus. It was compatible with all 15 ECD hosts.
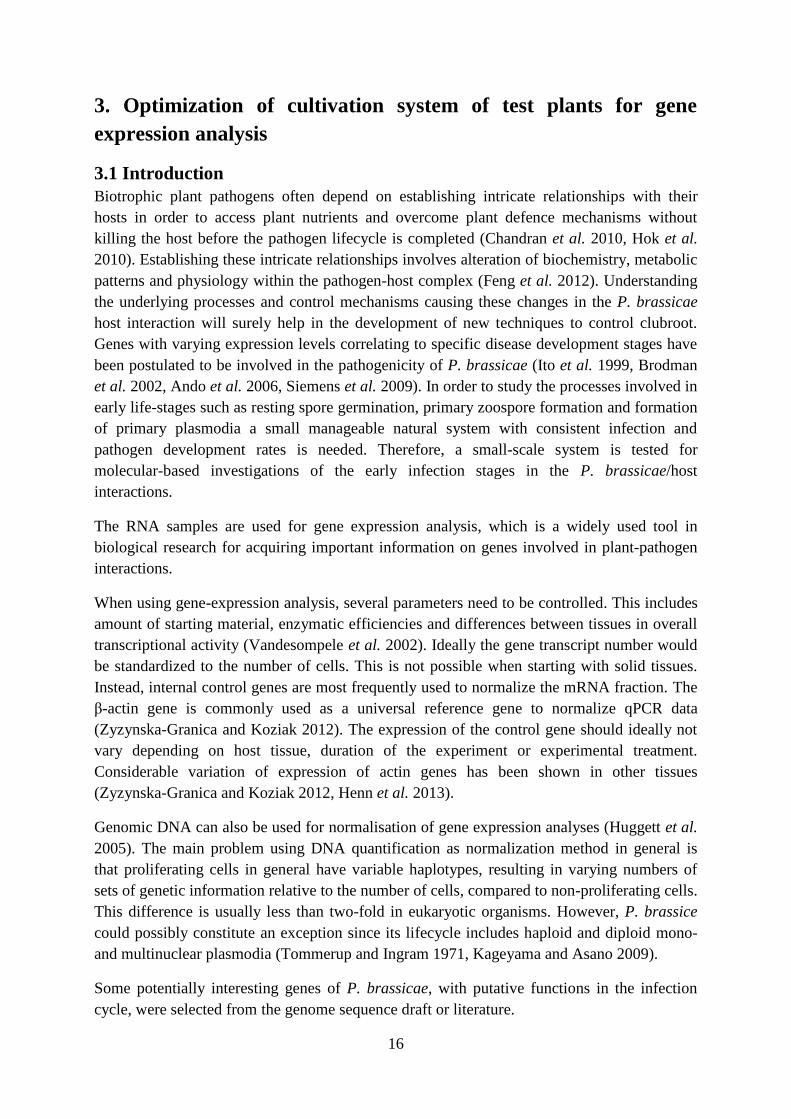
16
3. Optimization of cultivation system of test plants for gene
expression analysis
3.1 Introduction
Biotrophic plant pathogens often depend on establishing intricate relationships with their
hosts in order to access plant nutrients and overcome plant defence mechanisms without
killing the host before the pathogen lifecycle is completed (Chandran et al. 2010, Hok et al.
2010). Establishing these intricate relationships involves alteration of biochemistry, metabolic
patterns and physiology within the pathogen-host complex (Feng et al. 2012). Understanding
the underlying processes and control mechanisms causing these changes in the P. brassicae
host interaction will surely help in the development of new techniques to control clubroot.
Genes with varying expression levels correlating to specific disease development stages have
been postulated to be involved in the pathogenicity of P. brassicae (Ito et al. 1999, Brodman
et al. 2002, Ando et al. 2006, Siemens et al. 2009). In order to study the processes involved in
early life-stages such as resting spore germination, primary zoospore formation and formation
of primary plasmodia a small manageable natural system with consistent infection and
pathogen development rates is needed. Therefore, a small-scale system is tested for
molecular-based investigations of the early infection stages in the P. brassicae/host
interactions.
The RNA samples are used for gene expression analysis, which is a widely used tool in
biological research for acquiring important information on genes involved in plant-pathogen
interactions.
When using gene-expression analysis, several parameters need to be controlled. This includes
amount of starting material, enzymatic efficiencies and differences between tissues in overall
transcriptional activity (Vandesompele et al. 2002). Ideally the gene transcript number would
be standardized to the number of cells. This is not possible when starting with solid tissues.
Instead, internal control genes are most frequently used to normalize the mRNA fraction. The
β-actin gene is commonly used as a universal reference gene to normalize qPCR data
(Zyzynska-Granica and Koziak 2012). The expression of the control gene should ideally not
vary depending on host tissue, duration of the experiment or experimental treatment.
Considerable variation of expression of actin genes has been shown in other tissues
(Zyzynska-Granica and Koziak 2012, Henn et al. 2013).
Genomic DNA can also be used for normalisation of gene expression analyses (Huggett et al.
2005). The main problem using DNA quantification as normalization method in general is
that proliferating cells in general have variable haplotypes, resulting in varying numbers of
sets of genetic information relative to the number of cells, compared to non-proliferating cells.
This difference is usually less than two-fold in eukaryotic organisms. However, P. brassice
could possibly constitute an exception since its lifecycle includes haploid and diploid mono-
and multinuclear plasmodia (Tommerup and Ingram 1971, Kageyama and Asano 2009).
Some potentially interesting genes of P. brassicae, with putative functions in the infection
cycle, were selected from the genome sequence draft or literature.
17
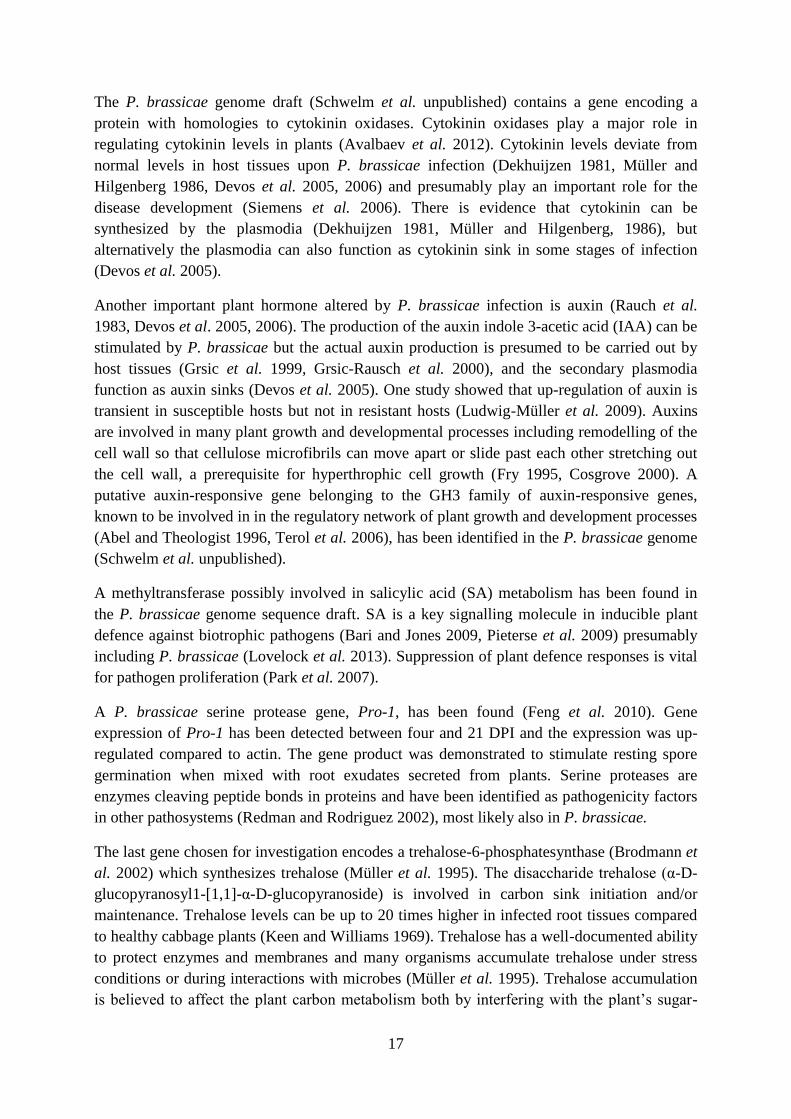
The P. brassicae genome draft (Schwelm et al. unpublished) contains a gene encoding a
protein with homologies to cytokinin oxidases. Cytokinin oxidases play a major role in
regulating cytokinin levels in plants (Avalbaev et al. 2012). Cytokinin levels deviate from
normal levels in host tissues upon P. brassicae infection (Dekhuijzen 1981, Müller and
Hilgenberg 1986, Devos et al. 2005, 2006) and presumably play an important role for the
disease development (Siemens et al. 2006). There is evidence that cytokinin can be
synthesized by the plasmodia (Dekhuijzen 1981, Müller and Hilgenberg, 1986), but
alternatively the plasmodia can also function as cytokinin sink in some stages of infection
(Devos et al. 2005).
Another important plant hormone altered by P. brassicae infection is auxin (Rauch et al.
1983, Devos et al. 2005, 2006). The production of the auxin indole 3-acetic acid (IAA) can be
stimulated by P. brassicae but the actual auxin production is presumed to be carried out by
host tissues (Grsic et al. 1999, Grsic-Rausch et al. 2000), and the secondary plasmodia
function as auxin sinks (Devos et al. 2005). One study showed that up-regulation of auxin is
transient in susceptible hosts but not in resistant hosts (Ludwig-Müller et al. 2009). Auxins
are involved in many plant growth and developmental processes including remodelling of the
cell wall so that cellulose microfibrils can move apart or slide past each other stretching out
the cell wall, a prerequisite for hyperthrophic cell growth (Fry 1995, Cosgrove 2000). A
putative auxin-responsive gene belonging to the GH3 family of auxin-responsive genes,
known to be involved in in the regulatory network of plant growth and development processes
(Abel and Theologist 1996, Terol et al. 2006), has been identified in the P. brassicae genome
(Schwelm et al. unpublished).
A methyltransferase possibly involved in salicylic acid (SA) metabolism has been found in
the P. brassicae genome sequence draft. SA is a key signalling molecule in inducible plant
defence against biotrophic pathogens (Bari and Jones 2009, Pieterse et al. 2009) presumably
including P. brassicae (Lovelock et al. 2013). Suppression of plant defence responses is vital
for pathogen proliferation (Park et al. 2007).
A P. brassicae serine protease gene, Pro-1, has been found (Feng et al. 2010). Gene
expression of Pro-1 has been detected between four and 21 DPI and the expression was up-
regulated compared to actin. The gene product was demonstrated to stimulate resting spore
germination when mixed with root exudates secreted from plants. Serine proteases are
enzymes cleaving peptide bonds in proteins and have been identified as pathogenicity factors
in other pathosystems (Redman and Rodriguez 2002), most likely also in P. brassicae.
The last gene chosen for investigation encodes a trehalose-6-phosphatesynthase (Brodmann et
al. 2002) which synthesizes trehalose (Müller et al. 1995). The disaccharide trehalose (α-D-
glucopyranosyl1-[1,1]-α-D-glucopyranoside) is involved in carbon sink initiation and/or
maintenance. Trehalose levels can be up to 20 times higher in infected root tissues compared
to healthy cabbage plants (Keen and Williams 1969). Trehalose has a well-documented ability
to protect enzymes and membranes and many organisms accumulate trehalose under stress
conditions or during interactions with microbes (Müller et al. 1995). Trehalose accumulation
is believed to affect the plant carbon metabolism both by interfering with the plant’s sugar-
18
sensing system and by diversion of carbon away from plant metabolism, thus creating a
carbon sink. Brodmann et al. (2002) hypothesized that trehalose was mainly synthesized by P.
brassicae plasmodia and released into the host plant.
Aim
The aim of this experiment was to develop, test and evaluate methods to study the gene
expression of selected genes of P. brassicae in resting spores, germinating zoospores and
early infection stages in soil and plant roots synchronously.
Hypothesis
The one ml pipette tip cultivation system can be used as a convenient growing system
from which P. brassicae mRNA can be extracted from soil and from plant roots using
commercial kits.
Interactions with different host plants will result in different gene expression patterns
depending on susceptibility of the host.
The ratio between P. brassicae DNA and plant DNA will increase as the disease
establishes and spreads within the plant roots.
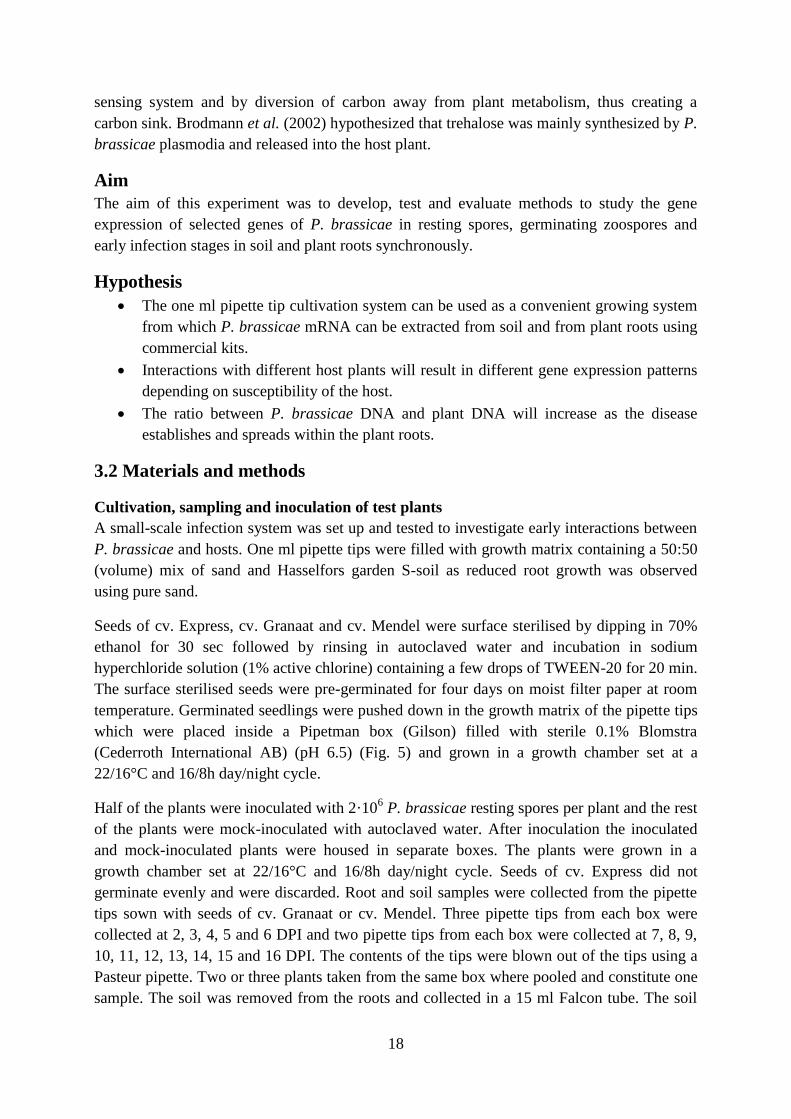
3.2 Materials and methods
Cultivation, sampling and inoculation of test plants
A small-scale infection system was set up and tested to investigate early interactions between
P. brassicae and hosts. One ml pipette tips were filled with growth matrix containing a 50:50
(volume) mix of sand and Hasselfors garden S-soil as reduced root growth was observed
using pure sand.
Seeds of cv. Express, cv. Granaat and cv. Mendel were surface sterilised by dipping in 70%
ethanol for 30 sec followed by rinsing in autoclaved water and incubation in sodium
hyperchloride solution (1% active chlorine) containing a few drops of TWEEN-20 for 20 min.
The surface sterilised seeds were pre-germinated for four days on moist filter paper at room
temperature. Germinated seedlings were pushed down in the growth matrix of the pipette tips
which were placed inside a Pipetman box (Gilson) filled with sterile 0.1% Blomstra
(Cederroth International AB) (pH 6.5) (Fig. 5) and grown in a growth chamber set at a
22/16°C and 16/8h day/night cycle.
Half of the plants were inoculated with 2·106 P. brassicae resting spores per plant and the rest
of the plants were mock-inoculated with autoclaved water. After inoculation the inoculated
and mock-inoculated plants were housed in separate boxes. The plants were grown in a
growth chamber set at 22/16°C and 16/8h day/night cycle. Seeds of cv. Express did not
germinate evenly and were discarded. Root and soil samples were collected from the pipette
tips sown with seeds of cv. Granaat or cv. Mendel. Three pipette tips from each box were
collected at 2, 3, 4, 5 and 6 DPI and two pipette tips from each box were collected at 7, 8, 9,
10, 11, 12, 13, 14, 15 and 16 DPI. The contents of the tips were blown out of the tips using a
Pasteur pipette. Two or three plants taken from the same box where pooled and constitute one
sample. The soil was removed from the roots and collected in a 15 ml Falcon tube. The soil
19
samples were immediately frozen in liquid nitrogen and stored at -70°C until further use. The
roots were thoroughly rinsed in tap water. The plants were cut off at the base of the stem and
the roots were collected in 2.2 ml sterile microcentrifuge tubes, immediately frozen in liquid
nitrogen and stored at -70°C until being ground into a fine powder using a mortar and pestle.
The ground samples were divided into two equal halves and transferred into two 1.5 ml
microcentrifuge tubes. The tubes were immediately frozen in liquid nitrogen and stored at
-70°C until further use.
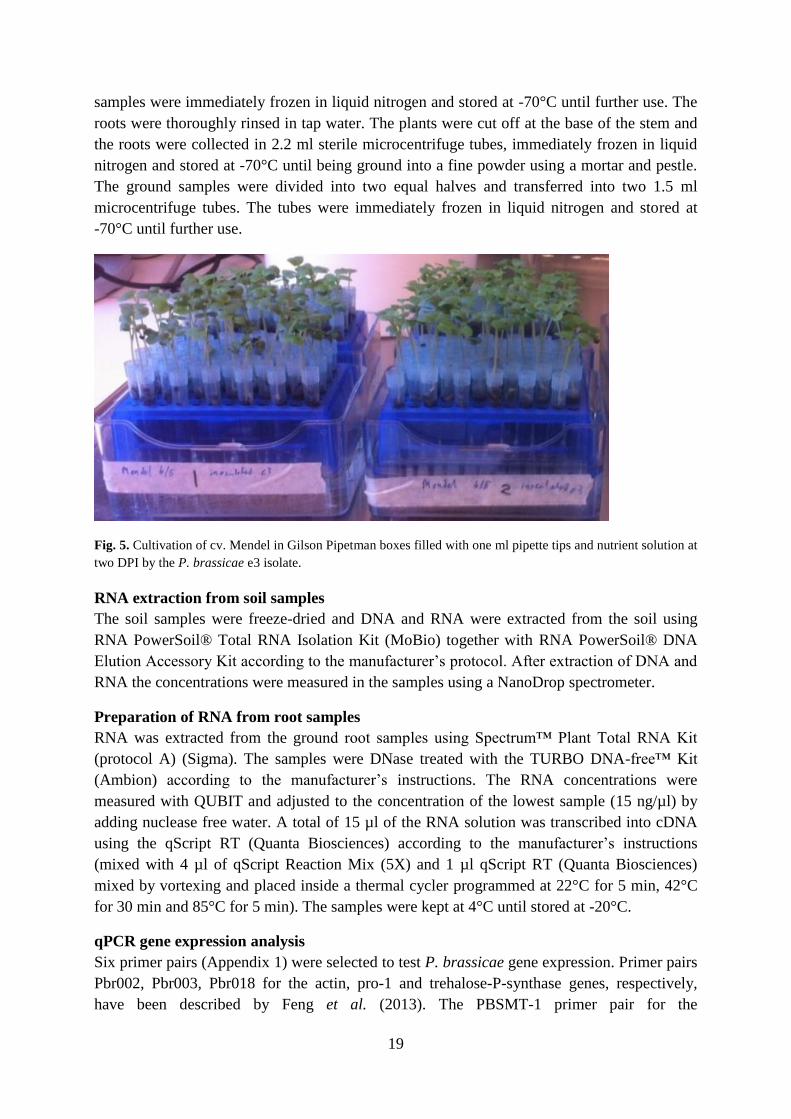
Fig. 5. Cultivation of cv. Mendel in Gilson Pipetman boxes filled with one ml pipette tips and nutrient solution at
two DPI by the P. brassicae e3 isolate.
RNA extraction from soil samples
The soil samples were freeze-dried and DNA and RNA were extracted from the soil using
RNA PowerSoil® Total RNA Isolation Kit (MoBio) together with RNA PowerSoil® DNA
Elution Accessory Kit according to the manufacturer’s protocol. After extraction of DNA and
RNA the concentrations were measured in the samples using a NanoDrop spectrometer.
Preparation of RNA from root samples
RNA was extracted from the ground root samples using Spectrum™ Plant Total RNA Kit
(protocol A) (Sigma). The samples were DNase treated with the TURBO DNA-free™ Kit
(Ambion) according to the manufacturer’s instructions. The RNA concentrations were
measured with QUBIT and adjusted to the concentration of the lowest sample (15 ng/µl) by
adding nuclease free water. A total of 15 µl of the RNA solution was transcribed into cDNA
using the qScript RT (Quanta Biosciences) according to the manufacturer’s instructions
(mixed with 4 µl of qScript Reaction Mix (5X) and 1 µl qScript RT (Quanta Biosciences)
mixed by vortexing and placed inside a thermal cycler programmed at 22°C for 5 min, 42°C
for 30 min and 85°C for 5 min). The samples were kept at 4°C until stored at -20°C.
qPCR gene expression analysis
Six primer pairs (Appendix 1) were selected to test P. brassicae gene expression. Primer pairs
Pbr002, Pbr003, Pbr018 for the actin, pro-1 and trehalose-P-synthase genes, respectively,
have been described by Feng et al. (2013). The PBSMT-1 primer pair for the
20
methyltransferase gene was obtained from Ludwig-Müller (TU Dresden, Germany). Primer
pairs for the putative GH3/ CytOx were designed using Primer3 software
(http://frodo.wi.mit.edu/) and the P. brassicae genome sequence data.
Dilution series to evaluate primer effectiveness were produced using PCR amplified cDNA.
The cDNA was amplified using the same primer pairs that were to be used later in the qPCR.
The amplified PCR products were loaded on a 0.1% agarose gel, isolated, eluted and purified
using GeneJET® Gel Extraction Kit (Thermo Scientific). The DNA concentration was
measured using a QUBIT® 2.0 Fluorometer and adjusted to 0.0424 ng/µl. A dilution series
including 100, 10
1, 10
2, 10
3, 10
4, 10
5 and 10
6-fold dilutions were prepared from the PCR
products of each primer pair.
The wells of 96-well qPCR plates were filled with 5 µl template (15 ng cDNA/µl), 12.5 µl
(2X) DyNamo Flash Sybr Green qPCR mix (Thermo Scientific), 1.5 µl 5mM forward primer,
1.5 µl 5 mM reverse primer and 4.5 µl nuclease free water. The wells were sealed with qPCR
sealing film and placed inside the qPCR machine. Three different qPCR programs were
initially tested with all six primer pairs (Appendix 1). Standard curves, amplification-peak-
charts and amplification charts were generated by the qPCR software, BioRad IQ5. E-values
were calculated using the formula:
The results were evaluated and it was concluded that the primers are working the best when
using qPCR program 3 (Appendix 1) as there was no unspecific amplification and the
efficiency of the PCR for all primer pairs was close to 2.0. qPCR program 3 was therefore
used for all the following qPCRs. The cDNA samples were loaded in 96-well PCR plates
together with master mix and primers as described earlier. Each 96-well PCR plate was
loaded with two replicates of the 36 cDNA samples, dilution series and one non-template
control.
Analysis of qPCR gene expression results
Standard curves were generated from the dilution series and E-values were calculated for each
primer pair (Invitrogen 2013). Melting curves and PCR amplification charts were generated
and evaluated. The initial analysis showed that the results were not reliable and no further
analyses were conducted.
Preparation and analysis of DNA from root samples
DNA was extracted from the ground root samples using Qiagen DNeasy Plant Mini Kit
following the manufacturer’s instructions. The DNA samples were stored at -24°C. P.
brassicae and plant DNA contents were analysed by Eurofins Food and Agro Testing Sweden
AB according to their standard assay using general primers for the plant cytochrome oxidase
(COX) and P. brassicae ribosomal DNA as earlier described (Wallenhammar et al. 2012).
21
3.3 Results
RNA extraction from infected soil
After absorbance measurement of the RNA samples with a NanoDrop spectrometer, it was
clear that the quantity and quality of extracted RNA were too low to study the gene
expression of P. brassicae genes using RNA extracted from soil samples.
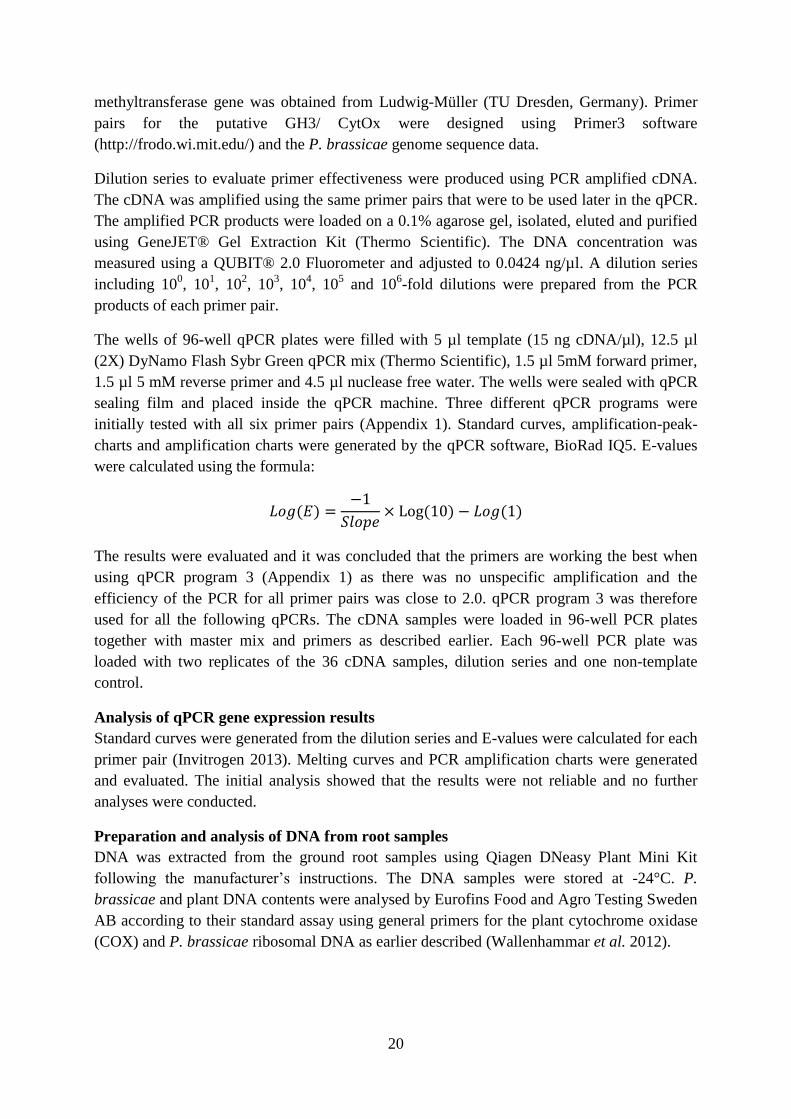
DNA content in infected roots
The ratio between P. brassicae and plant DNA (Pb/Cox gene ratio) in the samples was
consistently higher in samples from P. brassicae inoculated root samples compared to the
negative control (Fig. 6). There was no significant interaction between the plant and P.
brassicae DNA ratio and time post infection (R2=0.016) in inoculated plants.
Fig. 6.. Average Pb/Cox gene ratio of inoculated ( ) and non-inoculated ( ) Brassica rapa var. chinensis
cv. Granaat samples at different time-points (DPI). There was no significant interaction between PB/COX ratio
and DPI in inoculated plants (R2=0.016).
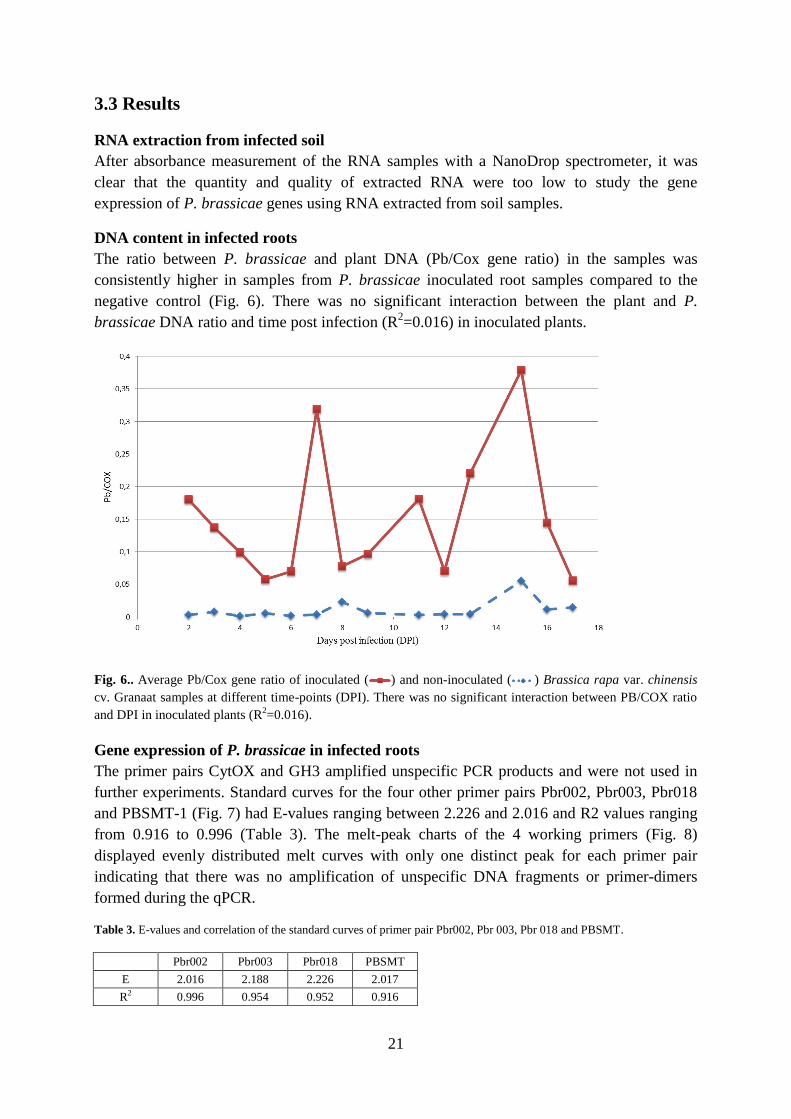
Gene expression of P. brassicae in infected roots
The primer pairs CytOX and GH3 amplified unspecific PCR products and were not used in
further experiments. Standard curves for the four other primer pairs Pbr002, Pbr003, Pbr018
and PBSMT-1 (Fig. 7) had E-values ranging between 2.226 and 2.016 and R2 values ranging
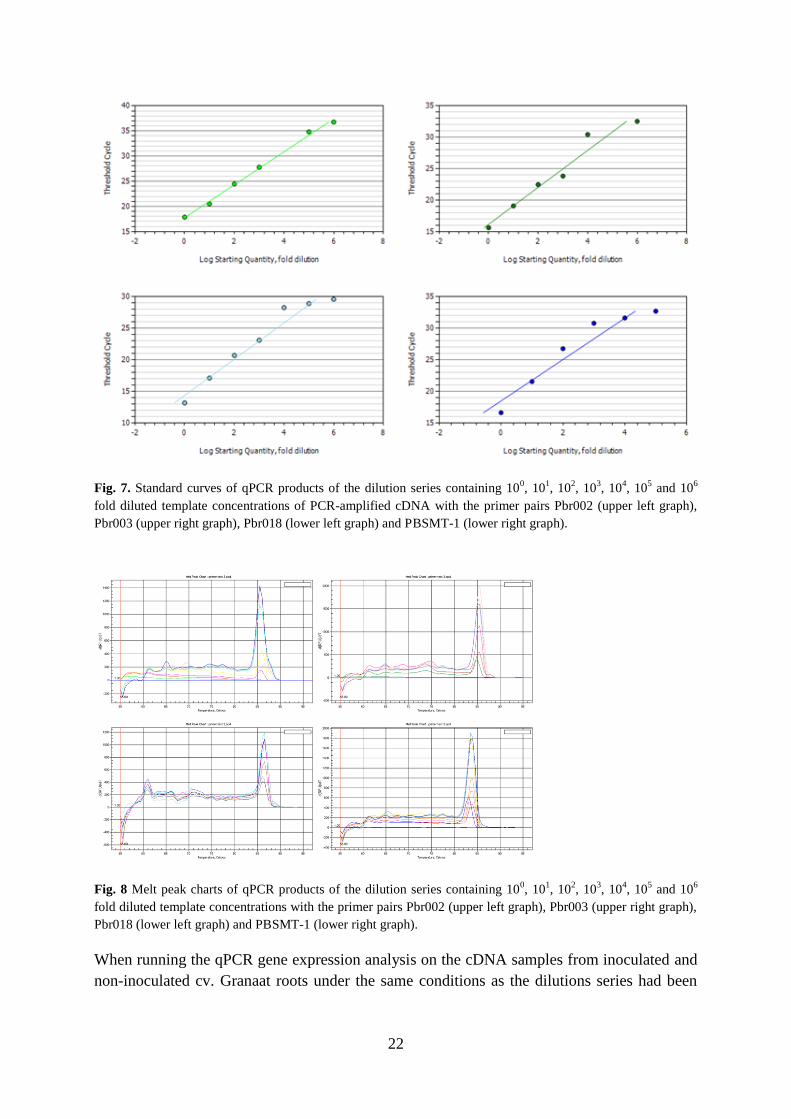
from 0.916 to 0.996 (Table 3). The melt-peak charts of the 4 working primers (Fig. 8)
displayed evenly distributed melt curves with only one distinct peak for each primer pair
indicating that there was no amplification of unspecific DNA fragments or primer-dimers
formed during the qPCR.
Table 3. E-values and correlation of the standard curves of primer pair Pbr002, Pbr 003, Pbr 018 and PBSMT.
Pbr002 Pbr003 Pbr018 PBSMT
E 2.016 2.188 2.226 2.017
R2 0.996 0.954 0.952 0.916
22
Fig. 7. Standard curves of qPCR products of the dilution series containing 100, 10
1, 10
2, 10
3, 10
4, 10
5 and 10
6
fold diluted template concentrations of PCR-amplified cDNA with the primer pairs Pbr002 (upper left graph),
Pbr003 (upper right graph), Pbr018 (lower left graph) and PBSMT-1 (lower right graph).
Fig. 8 Melt peak charts of qPCR products of the dilution series containing 100, 10
1, 10
2, 10
3, 10
4, 10
5 and 10
6
fold diluted template concentrations with the primer pairs Pbr002 (upper left graph), Pbr003 (upper right graph),
Pbr018 (lower left graph) and PBSMT-1 (lower right graph).
When running the qPCR gene expression analysis on the cDNA samples from inoculated and
non-inoculated cv. Granaat roots under the same conditions as the dilutions series had been
23
tested, E-values and correlation of the dilution series deteriorated, melt peak charts displayed
different patterns and there was amplification in non-template controls (Appendix 2).
3.4 Discussion
The cultivation system using one ml pipette tips can provide a simple and clean system for
growing plants to study P. brassicae-host interactions. The sampling of both root and soil
samples could be done easily and a consistent amount of soil from the rhizosphere could be
sampled. However, the infection process did not appear to occur simultaneously on each
plant, but rather showed a high variation based on the PB/COX ratio. Including more plants in
each sample would reduce the variation of the sample caused by the variation between
individual pipette tips. This would also have made the DNA and RNA extractions easier since
the amount of plant tissue would have been increased. Adding soil from more samples would
not have provided any benefits for the soil RNA extraction since one pipette tip contains
about the maximum amount of soil allowed for the RNA extraction kit used. Studying gene
expression in P. brassicae at single life-stages is not possible using this system since
infections are likely to occur at different time-points and the roots will therefore
simultaneously contain several life stages of the pathogen. Developing a system where
inoculation can be controlled so that infections could only occur during a limited timeframe
would provide better opportunities to study gene expression during distinct processes in
pathogen development to identify transition stages in the pathogen lifecycle resulting in
pivotal changes in the plant-pathogen complex.
Four out of the six tested primer sets were functional in the PCR program used in this study.
The PCR program used generated good PCR efficiencies (E-values) for these four primers
and could be used for further studies on P. brassicae gene expression.
The qPCRs performed did not generate reliable results because of amplification in non-
template controls. Hence, the results were not further analysed. The dilution series had lower
E-values when running the qPCR plates containing the samples and amplification was
detected in non-template controls. This is most likely caused by the human factor, pipetting
mistakes and exposure of the Sybr-green dye to light. The qPCR results might have been
improved by higher cDNA quality and concentrations. Larger samples including more plants
should have been taken to compensate for uneven disease development.
24
4. Stimulating effect on resting spore germination by root
exudates of inoculated plant roots
4.1 Introduction
Germination of dormant P. brassicae resting spores occurs spontaneously at low rates but can
be stimulated by various biotic and abiotic factors in its environment (Friberg et al. 2005,
Dixon 2009b). Presence of host plants is presumed to stimulate resting spore germination.
Using bait crops to stimulate resting spore germination in infested soils, hence eroding the
resting spore population, is one of two major methods attempted for biocontrol of P.
brassicae (Friberg et al. 2006, Donald and Porter 2009). Susceptible cabbages have shown the
greatest effect on resting spore population decline (Dixon 2009b) and the use of susceptible
crops as bait crops has been reported to reduce disease severity significantly in following
Brassica crops (Harling and Kennedy 1991). However, the effect has been shown to be
inconsistent (Friberg et al. 2006, Ahmed et al. 2011) and associated with the risk of pathogen
multiplication (Robak 1996). Using clubroot resistant varieties can also decrease resting spore
populations in soils (Hwang et al. 2013). Resting spore germination might be triggered by
non-host species (Kowalski and Bochow 1996, Friberg et al. 2005).
In aquatic laboratory systems, root exudates of some plant species can stimulate resting spore
germination (Friberg et al. 2006, Feng et al. 2010). The exact nature of the stimulating
substance is not known, but Suzuki et al. (1992) concluded it to be to be a polar, heat stable,
low molecular weight chemical secreted by plant roots. More recently a serine protease
encoded by the P. brassicae Pro-1 gene capable of increasing resting spore germination has
been described (Feng et al. 2010). However, Pro-1 only had an effect on resting spore
germination in combination with plant root exudates.
Microbial communication (quorum sensing) is a well-known pathogenicity factor for several
prokaryotic and some eukaryotic plant pathogens helping microorganisms to coordinate
growth and development and efforts in breaking down host defence (Hornby et al. 2001,
Albuquerque and Canadevall 2012).
Aim
The aim of this experiment was to conduct a pilot study to investigate whether root exudates
of infected plants with different stages of P. brassicae infections can affect resting spore
germination/dormancy compared to root exudates of healthy plants or not.
Hypothesis
Plant roots infected with P. brassicae secrete germination-stimulating factors during early
infection stages.
4.2 Materials and methods
Root exudate solutions were obtained from B. rapa cv. Granaat. Seeds were surface sterilised
as described in Chapter 3.2, germinated for two days and planted in autoclaved one ml pipette
tips filled with autoclaved growth matrix consisting of 50:50 (volume) mix of sand and
Hasselfors garden S-soil. The pipette tips were placed inside an autoclaved Pipetman box
25
(Gilson) filled with sterile 0.1% Blomstra (Cederroth International AB) (pH 6.5) and the
plants were grown in a growth chamber set at a 22/16°C and 16/8h day/night cycle.
The plants in the four boxes were kept separated and plants were inoculated at three different
time-points: eleven, nine and five days before the plants were being harvested. The plants in
the fourth box were not inoculated and served as control. The inoculum consisted of 2·106
cleaned e3 resting spores re-suspended in 200 µl sterile water per plant. The plants were
harvested 15 days post planting by blowing them out of the pipette tips using a Pasteur
pipette. For producing the root exudate solutions, roots of 10 plants were rinsed in autoclaved
water, cut off and incubated in 7 ml 0.1 M MOPS buffer (pH 6.2) in 15 ml Falcon tubes
wrapped in tinfoil. One Falcon tube containing only 0.1 M MOPS buffer and one Falcon tube
containing only sterile water were also wrapped in tinfoil. The Falcon tubes were incubated in
a growth chamber set at 22/16°C, 16/8 h day/night cycle (Feng et al. 2010). After 36 h the
samples were centrifuged at 600 rpm and the supernatant was filter-sterilised using a 0.22 µm
pore filter.
Resting spores were treated with root exudates by mixing 800 μl root exudate solution and
400 µl of 4.2·107
spores/ml spore suspension in 1.5 ml microcentrifuge tubes wrapped in
tinfoil and incubated at 28°C. At 0, 2, 4, 6, 8, 10, 13 and 19 DPI the spore germination was
determined microscopically. To prepare microscope samples, 10 µl aliquots of the root
exudate/spore solution were air-dried on a microscope slide for 1 hr and subsequently stained
with 1% Orcein by adding 10 µl of staining solution onto the dried resting spores and
carefully flaming the slide for approximately two seconds (Naiki et al. 1987). The Orcein was
air-dried for an hour and the samples were covered with 10 µl sterile water and a cover slip.
The ratio between germinated and ungerminated resting spores was determined by sweeping
the microscope across an axis, counting 200 resting spores situated along the axis in each
sample (Friberg et al. 2005).
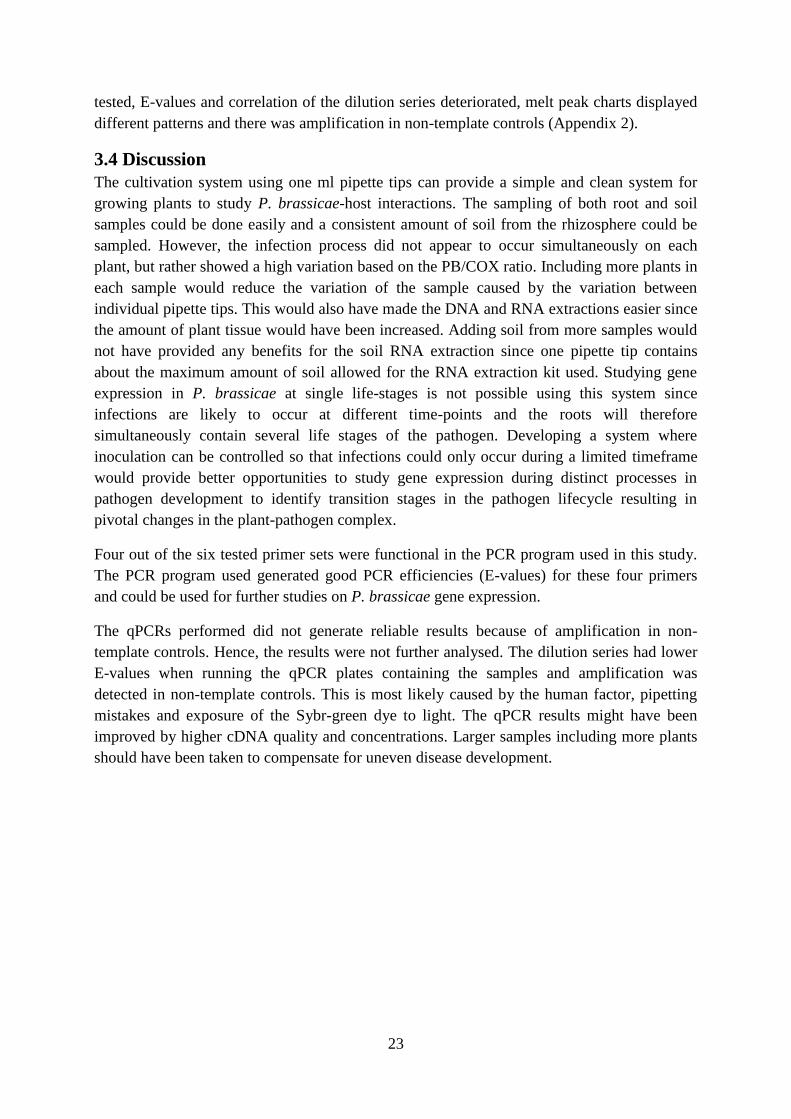
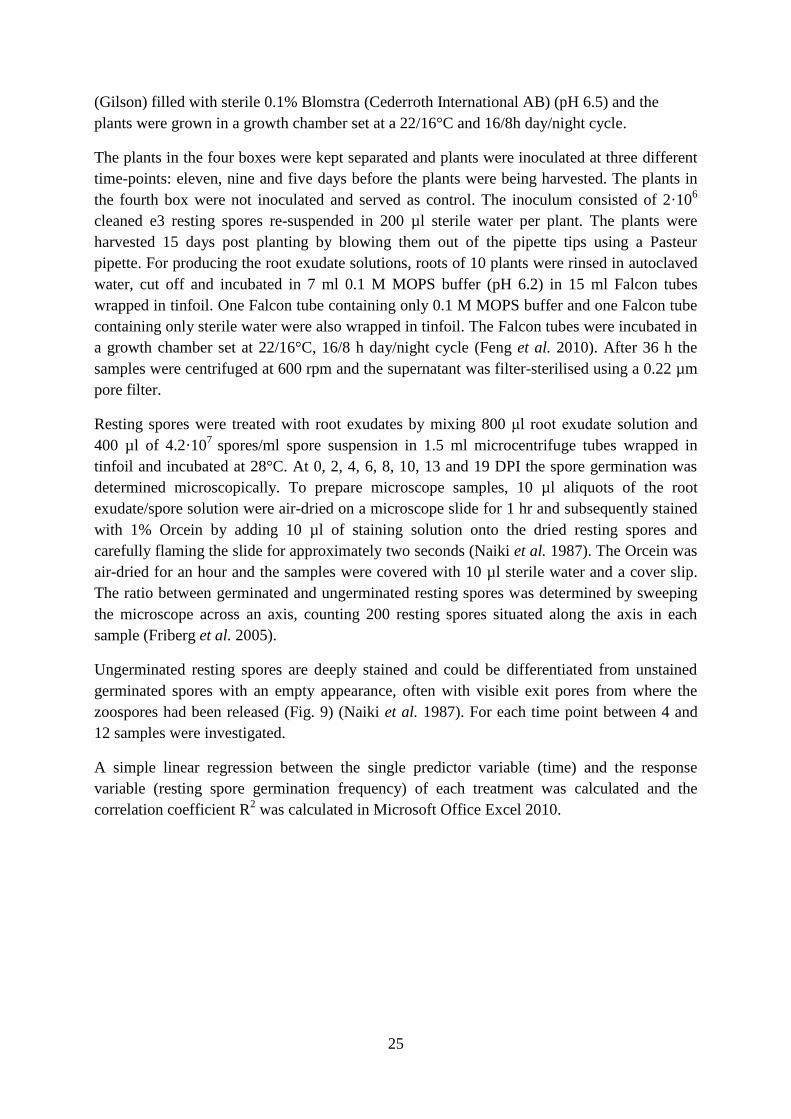
Ungerminated resting spores are deeply stained and could be differentiated from unstained
germinated spores with an empty appearance, often with visible exit pores from where the
zoospores had been released (Fig. 9) (Naiki et al. 1987). For each time point between 4 and
12 samples were investigated.
A simple linear regression between the single predictor variable (time) and the response
variable (resting spore germination frequency) of each treatment was calculated and the
correlation coefficient R2 was calculated in Microsoft Office Excel 2010.
26
Fig. 9. Ungerminated (UGS) and germinated (GS) resting spores of P. brassicae incubated in root exudates of
healthy plants for two days (left) and root exudates of plants harvested at five DPI (right).
3.3 Results
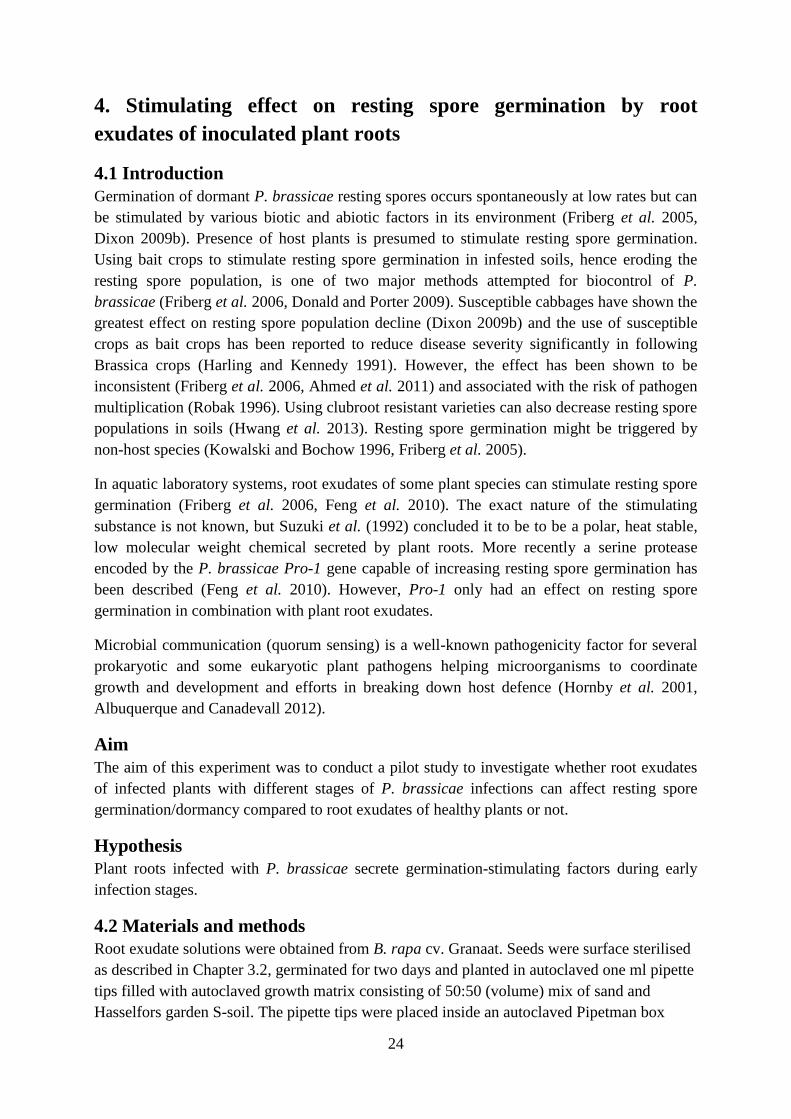
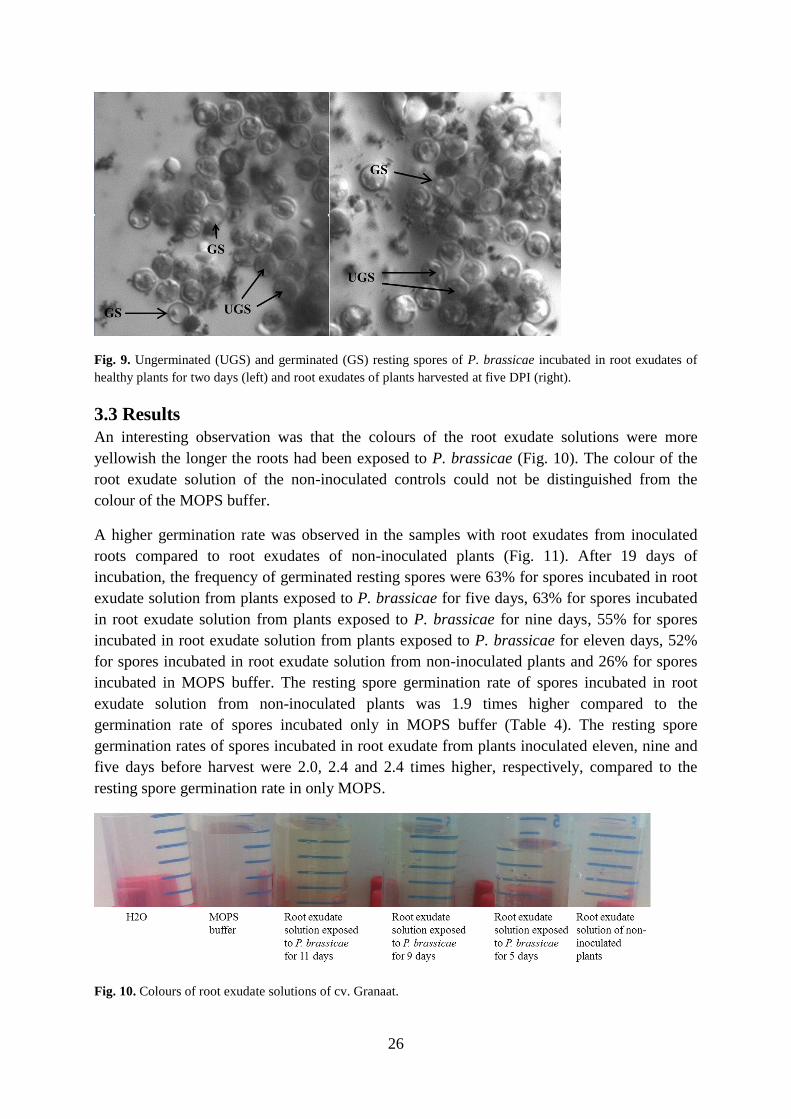
An interesting observation was that the colours of the root exudate solutions were more
yellowish the longer the roots had been exposed to P. brassicae (Fig. 10). The colour of the
root exudate solution of the non-inoculated controls could not be distinguished from the
colour of the MOPS buffer.
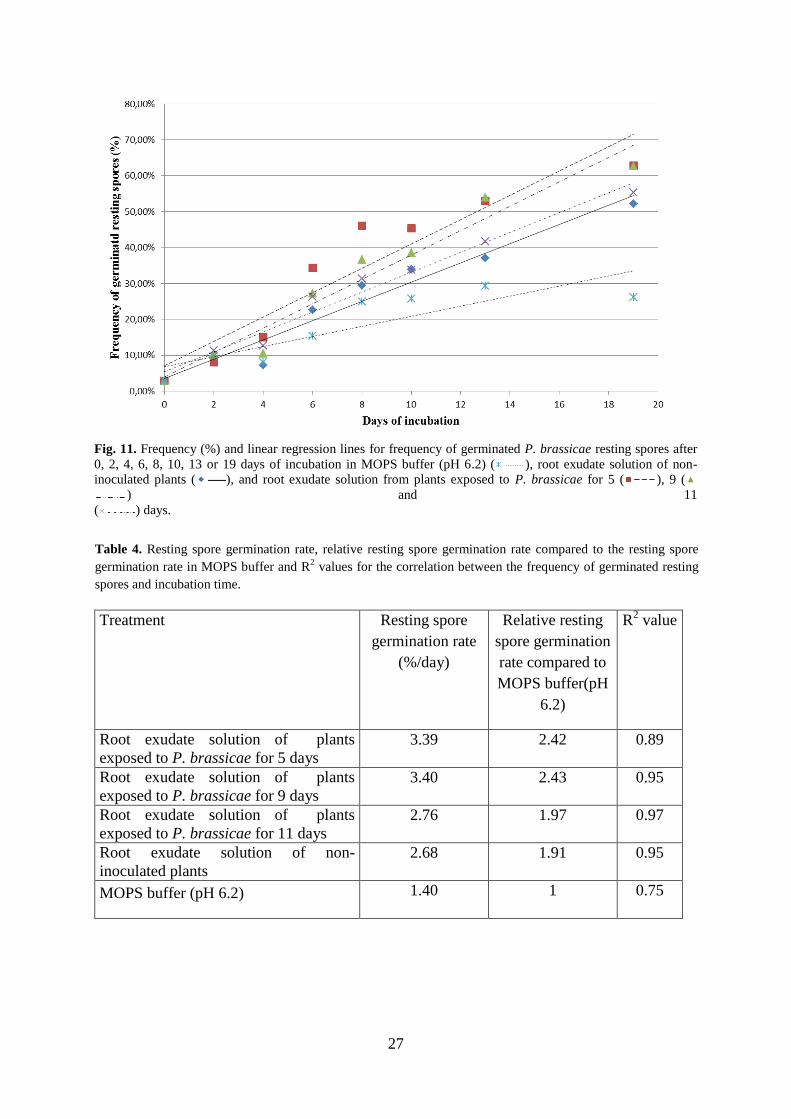
A higher germination rate was observed in the samples with root exudates from inoculated
roots compared to root exudates of non-inoculated plants (Fig. 11). After 19 days of
incubation, the frequency of germinated resting spores were 63% for spores incubated in root
exudate solution from plants exposed to P. brassicae for five days, 63% for spores incubated
in root exudate solution from plants exposed to P. brassicae for nine days, 55% for spores
incubated in root exudate solution from plants exposed to P. brassicae for eleven days, 52%
for spores incubated in root exudate solution from non-inoculated plants and 26% for spores
incubated in MOPS buffer. The resting spore germination rate of spores incubated in root
exudate solution from non-inoculated plants was 1.9 times higher compared to the
germination rate of spores incubated only in MOPS buffer (Table 4). The resting spore
germination rates of spores incubated in root exudate from plants inoculated eleven, nine and
five days before harvest were 2.0, 2.4 and 2.4 times higher, respectively, compared to the
resting spore germination rate in only MOPS.
Fig. 10. Colours of root exudate solutions of cv. Granaat.
27
Fig. 11. Frequency (%) and linear regression lines for frequency of germinated P. brassicae resting spores after
0, 2, 4, 6, 8, 10, 13 or 19 days of incubation in MOPS buffer (pH 6.2) ( ), root exudate solution of non-
inoculated plants ( ), and root exudate solution from plants exposed to P. brassicae for 5 ( ), 9 (
) and 11
( ) days.
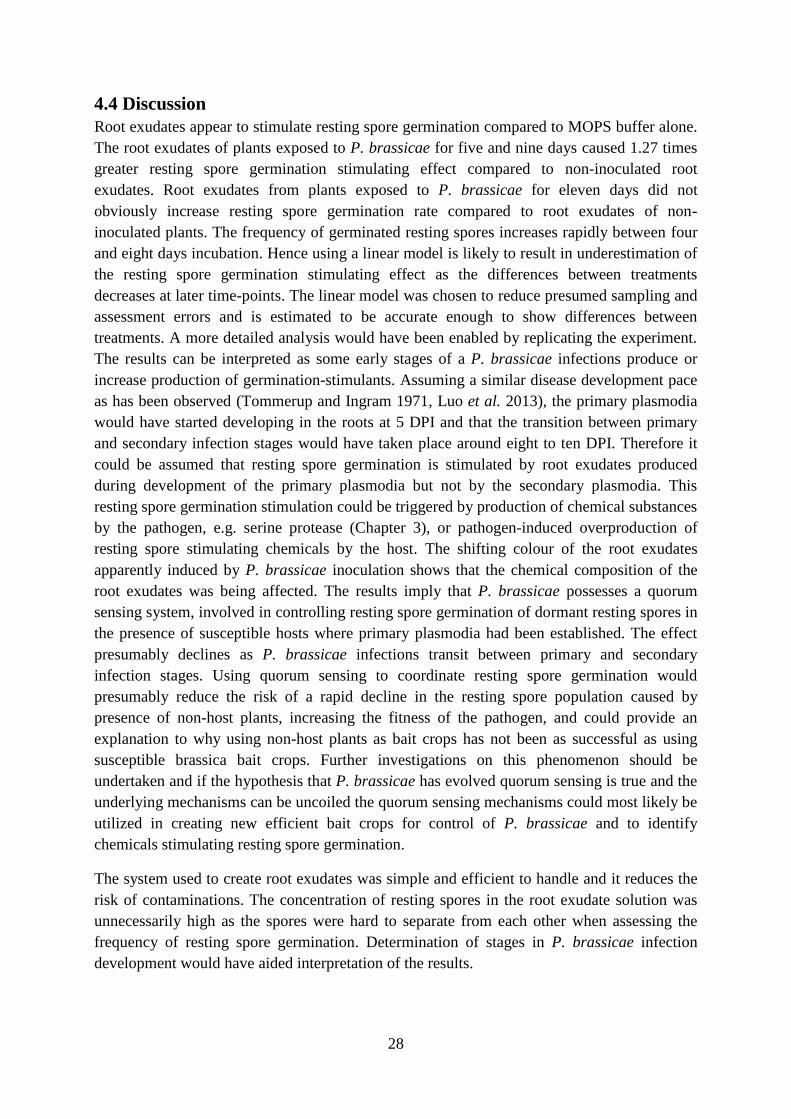
Table 4. Resting spore germination rate, relative resting spore germination rate compared to the resting spore
germination rate in MOPS buffer and R2 values for the correlation between the frequency of germinated resting
spores and incubation time.
Treatment Resting spore
germination rate
(%/day)
Relative resting
spore germination
rate compared to
MOPS buffer(pH
6.2)
R2 value
Root exudate solution of plants
exposed to P. brassicae for 5 days
3.39 2.42 0.89
Root exudate solution of plants
exposed to P. brassicae for 9 days
3.40 2.43 0.95
Root exudate solution of plants
exposed to P. brassicae for 11 days
2.76 1.97 0.97
Root exudate solution of non-
inoculated plants
2.68 1.91 0.95
MOPS buffer (pH 6.2) 1.40 1 0.75
28
4.4 Discussion
Root exudates appear to stimulate resting spore germination compared to MOPS buffer alone.
The root exudates of plants exposed to P. brassicae for five and nine days caused 1.27 times
greater resting spore germination stimulating effect compared to non-inoculated root
exudates. Root exudates from plants exposed to P. brassicae for eleven days did not
obviously increase resting spore germination rate compared to root exudates of non-
inoculated plants. The frequency of germinated resting spores increases rapidly between four
and eight days incubation. Hence using a linear model is likely to result in underestimation of
the resting spore germination stimulating effect as the differences between treatments
decreases at later time-points. The linear model was chosen to reduce presumed sampling and
assessment errors and is estimated to be accurate enough to show differences between
treatments. A more detailed analysis would have been enabled by replicating the experiment.
The results can be interpreted as some early stages of a P. brassicae infections produce or
increase production of germination-stimulants. Assuming a similar disease development pace
as has been observed (Tommerup and Ingram 1971, Luo et al. 2013), the primary plasmodia
would have started developing in the roots at 5 DPI and that the transition between primary
and secondary infection stages would have taken place around eight to ten DPI. Therefore it
could be assumed that resting spore germination is stimulated by root exudates produced
during development of the primary plasmodia but not by the secondary plasmodia. This
resting spore germination stimulation could be triggered by production of chemical substances
by the pathogen, e.g. serine protease (Chapter 3), or pathogen-induced overproduction of
resting spore stimulating chemicals by the host. The shifting colour of the root exudates
apparently induced by P. brassicae inoculation shows that the chemical composition of the
root exudates was being affected. The results imply that P. brassicae possesses a quorum
sensing system, involved in controlling resting spore germination of dormant resting spores in
the presence of susceptible hosts where primary plasmodia had been established. The effect
presumably declines as P. brassicae infections transit between primary and secondary
infection stages. Using quorum sensing to coordinate resting spore germination would
presumably reduce the risk of a rapid decline in the resting spore population caused by
presence of non-host plants, increasing the fitness of the pathogen, and could provide an
explanation to why using non-host plants as bait crops has not been as successful as using
susceptible brassica bait crops. Further investigations on this phenomenon should be
undertaken and if the hypothesis that P. brassicae has evolved quorum sensing is true and the
underlying mechanisms can be uncoiled the quorum sensing mechanisms could most likely be
utilized in creating new efficient bait crops for control of P. brassicae and to identify
chemicals stimulating resting spore germination.
The system used to create root exudates was simple and efficient to handle and it reduces the
risk of contaminations. The concentration of resting spores in the root exudate solution was
unnecessarily high as the spores were hard to separate from each other when assessing the
frequency of resting spore germination. Determination of stages in P. brassicae infection
development would have aided interpretation of the results.
29
5. General discussion
5.1 Concluding remarks
The results of the experiments conducted in this thesis could be condensed into four main
results:
The e3 isolate was able to infect and cause symptoms on all 15 ECD hosts. The pathotype of
the isolate depends on the method for disease assessment and calculation of DSI and how the
border between susceptibility and resistance is defined.
The attempt to create a convenient, natural, reliable and efficient system to study P. brassicae
gene expression using a cultivation system with one ml pipette tips was working suboptimally
since the DNA analysis indicated significant variations in infection development between
individual plants. However, the method was convenient to use for creating root exudates for
studies on germination of resting spores.
The qPCR program and four of the primers tested can be used for further studies on the
selected genes but the gene expression analysis in this thesis did not generate reliable results.
Resting spore germination is stimulated by root exudates of susceptible plants. Inoculated
roots can likely stimulate resting spore germination further but the effect is seemingly
dependent on the infection stage of P. brassicae in the roots. This could be interpreted as P.
brassicae using quorum sensing to break resting spore dormancy in presence of susceptible
plants.
5.2 Acknowledgements
I would like to thank my supervisor Dr Arne Schwelm and assistant supervisor Professor
Christina Dixelius for all their support and inspiration.
I would also like to thank my examiner Dr Anders Kvarnheden for his inspiration, advices
and sincere commitment in helping his students.
Besides them I would also like to thank Charlotta Almquist, Dr Sarosh Bejai, Dr Hanna
Friberg, Dr Hanneke Peele, Per Lindén, Sultana Jahan, Urban Pettersson, Dr Jonas Roos, Dr
Ann-Charlotte Wallenhammar and Anna Åsman for all their help.
Last but not least I would like to thank my opponent Lena Granehäll for helpful criticism and
advices.
This degree project was funded by the Biological soil mapping (BioSoM) thematic research
program at the Swedish University of Agricultural Sciences.
30
6. References Abel, S. and Theologist, A. (1996) Early genes and auxin action. Plant Physiol. 111, 9-17.
Agarwal, A., Kaul, V., Faggian, R., Rookes, J.E., Ludwig-Muller, J. and Cahill, D.M. (2011) Analysis of
global host gene expression during the primary phase of the Arabidopsis thaliana-Plasmodiophora
brassicae interaction. Funct. Plant Biol. 38, 462-478.
Ahmed, H.U., Hwang, S.F., Strelkov, S.E., Gossen, B.D., Peng, G., Howard, R.J. and Turnbull, G.D. (2011) Assessment of bait crops to reduce inoculum of clubroot (Plasmodiophora brassicae) of canola. Can.
J. Plant Sci. 91, 545–51.
Albuquerque, P. and Casadevall, A. (2012) Quorum sensing in fungi - a review. Med. Mycol. 50, 337-345.
Ando, S., Yamada, T., Asano, T., Kamachi, S., Tsushima, S., Hagio, T. and Tabei, Y. (2006) Molecular
cloning of PbSTKL1 gene from Plasmodiophora brassicae expressed during club root development. J.
Phytopathol. 154, 185–189.
Asano, T., Kageyama, K. and Hyakumachi, M. (1999) Surface disinfestation of resting spores of
Plasmodiophora brassicae used to infect hairy roots of Brassica spp. Phytopathology. 89, 314-319.
Avalbaev, A.M., Somov, K.A., Yuldashev, R.A. and Shakirova, F.M. (2012) Cytokinin oxidase is key
enzyme of cytokinin degradation. Biochemistry-Moscow 77, 1354-1361.
Bari, R. and Jones, J. (2009) Role of plant hormones in plant defence responses. Plant Mol. Biol. 69, 473-488.
Brodmann, D., Schuller, A., Ludwig-Muller, J., Aeschbacher, R.A., Wiemken, A., Boller, T. and Wingler,
A. (2002) Induction of trehalase in Arabidopsis plants infected with the trehalose-producing pathogen
Plasmodiophora brassicae. Mol. Plant-Microbe Interact. 15, 693-700.
Buczacki, S.T., Toxopeus, H., Mattusch, P., Johnston, T.D., Dixon, G.R. and Hobolth, L.A. (1975) Study of
physiologic specialization in Plasmodiophora-Brassicae - Proposals for attempted rationalization through an
international approach. Trans. Brit. Mycol. Soc. 65, 295-303.
Burki, F., Kudryavtsev, A., Matz, M.V., Aglyamova, G.V., Bulman, S., Fiers, M., Keeling, P.J. and
Pawlowski, J. (2010) Evolution of Rhizaria: new insights from phylogenomic analysis of uncultivated
protists. Bmc Evol. Biol. 10, 377.
Chandran, D., Inada, N., Hather, G., Kleindt, C.K. and Wildermuth, M.C. (2010) Laser microdissection of
Arabidopsis cells at the powdery mildew infection site reveals site-specific processes and regulators. Proc.
Natl. Acad. Sci. USA 107, 460-465.
Cosgrove, D.J. (2000) Loosening of plant cell walls by expansins. Nature 407, 312–326.
Crête, R., Laliberte, J. and Jasmin, J.J. (1963) Chemical control of clubroot, P. brassicae, of crucifers in
mineral and organic soils. Can. J. Plant Sci 43, 349-354.
Crête, R. (1981) Worldwide importance of clubroot. Clubroot Newslett. 11, 6–7
Dekhuijzen, M. (1981) The occurrence of free and bound cytokinins in plasmodia of Plasmodiophora brassica
isolated from tissue cultures of clubroots. Plant Cell Rep. 1, 18-20.
Deora, A., Gossen, B.D. and McDonald, M.R. (2012) Infection and development of Plasmodiophora brassicae
in resistant and susceptible canola cultivars. Can. J. Plant Pathol.-Rev. Can. Phytopathol. 34, 239-247.
Devos, S., Laukens, K., Deckers, P., Van der Straeten, D., Beeckman, T., Inze, D., Van Onckelen, H.,
Witters, E. and Prinsen, E. (2006) A hormone and proteome approach to picturing the initial metabolic
events during Plasmodiophora brassicae infection on Arabidopsis. Mol. Plant-Microbe Interact. 19, 1431-
1443.
Devos, S., Vissenberg, K., Verbelen, J.P. and Prinsen, E. (2005) Infection of Chinese cabbage by
Plasmodiophora brassicae leads to a stimulation of plant growth: impacts on cell wall metabolism and
hormone balance. New Phytol. 166, 241-250.
Diederichsen, E., Frauen, M., Linders, E.G.A., Hatakeyama, K. and Hirai, M. (2009) Status and
perspectives of clubroot resistance breeding in Crucifer crops. J. Plant Growth Regul. 28, 265-281.
Dixon, G.R. (2009a) The occurrence and economic impact of Plasmodiophora brassicae and clubroot disease. J.
Plant Growth Regul. 28, 194-202.
Dixon, G.R. (2009b) Plasmodiophora brassicae in its environment. J. Plant Growth Regul. 28, 212-228.
Donald, C. and Porter, I. (2009) Integrated control of clubroot. J. Plant Growth Regul. 28, 289-303.
Fahling, M., Graf, H. and Siemens, J. (2003) Pathotype separation of Plasmodiophora brassicae by the host
plant. J. Phytopathol. Zeitschr. 151, 425-430.
Fahling, M., Graf, H. and Siemens, J. (2004) Characterization of a single-spore isolate population of
Plasmodiophora brassicae resulting from a single club. J. Phytopathol. 152, 438-444.
FAOSTAT (2013) Crops Area Harvested. http://faostat3.fao.org/home/index.html#DOWNLOAD: Food and
Agriculture Organization of the United Nations.
Feng, J., Hwang, S.-F. and Strelkov, S.E. (2013) Assessment of gene expression profiles in primary and
secondary zoospores of Plasmodiophora brassicae by dot blot and real-time PCR. Microb. Res. 168, 518-
524.
31
Feng, J., Hwang, R., Hwang, S.F., Strelkov, S.E., Gossen, B.D., Zhou, Q.X. and Peng, G. (2010) Molecular
characterization of a serine protease Pro1 from Plasmodiophora brassicae that stimulates resting spore
germination. Mol. Plant Pathol. 11, 503-512.
Feng, J., Hwang, S.F. and Strelkov, S.E. (2012) Analysis of expressed sequence tags derived from a
compatible Plasmodiophora brassicae-canola interaction. Can. J. Plant Pathol. 34, 562-574.
Friberg, H., Lagerlof, J. and Ramert, B. (2005) Germination of Plasmodiophora brassicae resting spores
stimulated by a non-host plant. Eur. J. Plant Pathol. 113, 275-281.
Friberg, H., Lagerlof, J. and Ramert, B. (2006) Usefulness of nonhost plants in managing Plasmodiophora
brassicae. Plant Pathol. 55, 690-695.
Fry SC. (1995) Polysaccharide-modifying enzymes in the plant cell wall. Annu. Rev. Plant Physiol. Plant Mol.
Biol. 46, 497-520.
Grsic-Rausch, S., Kobelt, P., Siemens, J.M., Bischoff, M. and Ludwig-Muller, J. (2000) Expression and
localization of nitrilase during symptom development of the clubroot disease in Arabidopsis. Plant Physiol.
122, 369-378.
Grsic, S., Kirchheim, B., Pieper, K., Fritsch, M., Hilgenberg, W. and Ludwig-Muller, J. (1999) Induction of
auxin biosynthetic enzymes by jasmonic acid and in clubroot diseased Chinese cabbage plants. Physiol.
Plant. 105, 521-531.
Hatakeyama, K., Fujimura, M., Ishida, M. and Suzuki, T. (2004) New classification method for
Plasmodiophora brassicae field isolates in Japan based on resistance of F-1 cultivars of Chinese cabbage
(Brassica rapa L.) to clubroot. Breeding Sci., 54, 197-201.
Harling R. and Kennedy SH. (1991) Biological control of Plasmodiophora brassicae using a bait crop.
Mededelingen – Faculteit Landbouwwetenschappen, Rijksuniversiteit Gent 56, 159–70.
Henn, D., Bandner-Risch, D., Perttunen, H., Schmied, W., Porras, C., Ceballos, F., Rodriguez-Losada, N.
and Schafers, H.J. (2013) Identification of reference genes for Quantitative RT-PCR in Ascending Aortic
Aneurysms. Plos One. 8, 1-6.
Hok, S., Attard, A. and Keller, H. (2010) Getting the most from the host: How pathogens force plants to
cooperate in disease. Mol. Plant-Microbe Interact. 23, 1253-1259.
Horiuchi, S and Hori, M. (1980) A simple greenhouse technique for obtaining high levels of clubroot
incidence. Bull. Chugoku. Natl Agric. Exp. Stn. E. 17, 33–55.
Hornby, J.M., Jensen, E.C., Lisec, A.D., Tasto, J.J., Jahnke, B., Shoemaker, R., Dussault, P. and
Nickerson, K.W. (2001) Quorum sensing in the dimorphic fungus Candida albicans is mediated by
farnesol. Appl. Environ. Microb. 67, 2982-2992.
Howard, R.J., Strelkov, S.E. and Harding, M.W. (2010) Clubroot of cruciferous crops - new perspectives on
an old disease. Can. J. Plant Pathol. 32, 43-57.
Hugget, J., Dheda, K., Bustin, S. and Zumla, A. (2005) Real-time RT-PCR normalisation; strategies and
considerations. Genes Immun. 6, 279-284.
Hwang, S.F., Ahmed, H.U., Zhou, Q., Rashid, A., Strelkov, S.E., Gossen, B.D., Peng, G. and Turnbull,
G.D. (2013) Effect of susceptible and resistant canola plants on Plasmodiophora brassicae resting spore
populations in the soil. Plant Pathol. 62, 404-412.
Hwang, S.F., Ahmed, H.U., Zhou, Q., Strelkov, S.E., Gossen, B.D., Peng, G. and Turnbull, G.D. (2011)
Influence of cultivar resistance and inoculum density on root hair infection of canola (Brassica napus) by
Plasmodiophora brassicae. Plant Pathol. 60, 820-829.
Hwang, S. F., Cao, T., Xiao, Q., Ahmed1, H. U., Manolii, V. P., Turnbull, G. D., Gossen, B. D., Peng, G.
and Strelkov, S. E. (2012a) Effects of fungicide, seeding date and seedling age on clubroot severity,
seedling emergence and yield of canola. Can. J. Plant Sci. 92, 1175-1186
Hwang, S.F., Strelkov, S.E., Feng, J., Gossen, B.D. and Howard, R.J. (2012b) Plasmodiophora brassicae: a
review of an emerging pathogen of the Canadian canola (Brassica napus) crop. Mol. Plant Pathol. 13, 105-
113.
Ingram, D.S. and Tommerup, I.C. (1972) Life-history of Plasmodiophora-brassicae Woron. Proceed. Roy.
Soc. B-Biol. Sci. 180, 103-112.
Invitrogen (2013) Important parameters of quantitative PCR (qPCR) analysis.
https://tools.invitrogen.com/content/sfs/appendix/PCR_RTPCR/Important%20Parameters%20of%20qPCR.p
df.
Ito, S., Ichinose, H., Yanagi, C., Tanaka, S., Kameya-Iwaki, M., and Kishi, F. (1999) Identification of an in
planta-induced mRNA of Plasmodiophora brassicae. J. Phytopathol. 147, 79–82.
Jubault, M., Hamon, C., Gravot, A., Lariagon, C., Delourme, R., Bouchereau, A. and Manzanares-
Dauleux, M.J. (2008) Differential regulation of root arginine catabolism and polyamine metabolism in
clubroot-susceptible and partially resistant Arabidopsis genotypes. Plant Physiol. 146, 2008-2019.
Kageyama, K. and Asano, T. (2009) Life cycle of Plasmodiophora brassicae. J. Plant Growth Regul. 28, 203-
211.
32
Keen, N. T., and Williams, P. H. (1969) Translocation of sugars into infected cabbage tissues during clubroot
development. Plant Physiol. 44, 748-754.
Kowalski, K. and Bochow, H. (1996) Observations on the behaviour of resting spores of Plasmodiophora
brassicae in the presence of cruciferous and non-cruciferous plant roots. Acta Horticulturae 407, 419–422.
Kuginuki Y, Hiroaki Y and Hirai M. (1999) Variation in virulence of Plasmodiophora brassicae in Japan
tested with clubroot-resistant cultivars of Chinese cabbage (Brassica rapa L. spp. pekinensis). Eur. J. Plant
Pathol. 105, 327–332.
Lovelock, D.A., Donald, C.E., Conlan, X.A. and Cahill, D.M. (2013) Salicylic acid suppression of clubroot in
broccoli (Brassicae oleracea var. italica) caused by the obligate biotroph Plasmodiophora brassicae.
Australasian Plant Pathol. 42, 141-153.
Ludwig-Müller, J., Prinsen, E., Rolfe, S.A. and Scholes, J.D. (2009) Metabolism and plant hormone action
during clubroot disease. J. Plant Growth Regul. 28, 229–244.
Luo, H-C., Chen, G-K., Liu, C-P., Huang, Y. and Xiao, C-G. (2013) An improved culture solution technique
for Plasmodiophora brassicae infection and the dynamic infection in the root hair. Australasian. Plant
Pathol. 42, 1-8.
Matsumoto, E., Ueno, H., Aruga, D., Sakamoto, K. and Hayashida, N. (2012) Accumulation of three
clubroot resistance genes through marker-assisted selection in Chinese cabbage Brassica rapa ssp.
pekinensis. J. Jpn. Soc. Hortic. Sci. 8, 184–190.
Müller, J., Boller, T. and Wiemken, A. (1995) Trehalose and trehalase in plants: recent developments. Plant
Sci. 112:1-9.
Müller, P. and Hilgenberg, W. (1986) Isomers of zeatin and zeatin riboside in clubroot tissue: evidence for
trans-zeatin biosynthesis by Plasmodiophora brassicae. Physiol. Plant. 66, 245–250.
Naiki, T., Dixon, G.R. and Ikegami, H. (1987) Quantitative estimation of spore germination of
Plasmodiophora-Brassicae. Trans. Brit. Mycol. Soc. 89, 569-572.
Niwa, R., Kawahara, A., Murakami, H., Tanaka, S. and Ezawa, T. (2011) Complete structure of nuclear
rDNA of the obligate plant parasite Plasmodiophora brassicae: intraspecific polymorphism in the exon and
group 1 intron of the large subunit rDNA. Protist 162, 423-434
Oxley, S. (2007) Clubroot disease of oilseed rape and other Brassica crops. Tech. Note Scott. Agr. Coll.
(TN602). ISBN: 1854828908.
Park, S.-W., Kaimoyo, E., Kumar, D., Mosher, S. and Klessig, D.F. (2007) Methyl salicylate is a critical
mobile signal for plant systemic acquired resistance. Science 318, 113–116
Pieterse, C.M.J., Leon-Reyes, A., Van der Ent, S. and Van Wees, S.C.M. (2009) Networking by small-
molecule hormones in plant immunity. Nat. Chem. Biol. 5, 308-316.
Rauch, T., Butcher, D.N. and Hilgenborg, W. (1983) Indole-3-methylgIucosinoIate biosynthesis and
metabolism in clubroot diseased plants. Physiol. Plant. 58, 93-100
Redman, R.S. and Rodriguez, R.J. (2002) Characterization and isolation of an extracellular serine protease
from the tomato pathogen Colletotrichum coccodes, and its role in pathogenicity. Mycol. Res. 106, 1427-
1434.
Robak, J. (1996) Crop rotation effect on clubroot disease decrease. Acta Horticulturae 371, 223–226.
Russell, J. and Bulman, S. (2005) The liverwort Marchantia foliacea forms a specialized symbiosis with
arbuscular mycorrhizal fungi in the genus Glomus. New Phytol. 165, 567-579.
Seskar, M., Shulaev, V. and Raskin, I. (1998) Endogenous methyl salicylate in pathogen-inoculated tobacco
plants. Plant Physiol., 116, 387-392.
Siemens, J., Graf, H., Bulmans, S., In, O. and Ludwig-Müller, J. (2009) Monitoring expression of selected
Plasmodiophora brassicae genes during clubroot development in Arabidopsis thaliana. Plant Pathol. 58,
130-136.
Siemens, J., Keller, I., Sarx, J., Kunz, S., Schuller, A., Nagel, W., Schmulling, T., Parniske, M. and
Ludwig-Muller, J. (2006) Transcriptome analysis of Arabidopsis clubroots indicate a key role for
cytokinins in disease development. Mol. Plant-Microbe Interact. 19, 480-494.
Some´, A., Manzanares, M.J., Laurens, F., Baron, F., Thomas, G. and Rouxel, F. (1996) Variation for
virulence on Brassica napus L. amongst Plasmodiophora brassicae collections from France and derived
single-spore isolates. Plant Pathol. 45, 432–439.
Strelkov S.E., Tewari J.P. and Smith-Degenhardt E. (2006) Characterization of Plasmodiophora brassicae
populations from Alberta, Canada. Can. J. Plant Pathol. 28, 467–474.
Strelkov, S.E., Manolii, V.P., Cao, T., Xue, S. and Hwang, S.F. (2007) Pathotype classification of
Plasmodiophora brassicae and its occurrence in Brassica napus in Alberta, Canada. J. Phytopathol. 155,
706-712.
Suzuki, K., Matsumiya, E., Ueno, Y. and Mizutani, J. (1992) Some properties of germination-stimulating
factor from plants for resting spores of Plasmodiophora brassicae. Ann. Phytopathol. Soc. Jpn. 58, 699–705.
33
Swedish Board of Agriculture (2013) Åkerarealens användning efter län/riket och gröda. År 1981-2012.
http://statistik.sjv.se/Database/ Jordbruksverket/Markanvandning/Markanvandning.asp: Swedish Board of
Agriculture.
Terol, J., Domingo, C. and Talon, M. (2006) The GH3 family in plants: Genome wide analysis in rice and
evolutionary history based on EST analysis. Gene 371, 279-290.
Tingal, H. and Webster J. (1981) Technique for single spore infection by Plasmodiophora brassicae. Trans.
Br. Mycol. Soc. 76, 187-190.
Tommerup, I.C. and Ingram, D.S. (1971) Life-cycle of Plasmodiophora-Brassicae Woron. in Brassica tissue
cultures and in intact roots. New Phytol. 70, 327-332.
Toxopeus, H., Dixon, G.R. and Mattusch, P. (1986) Physiological specialization in Plasmodiophora
brassicae: an analysis by international experimentation. Trans. Br. Mycol. Soc. 87, 279–287.
Wallenhammar, A.C. (1996) Prevalence of Plasmodiophora brassicae in a spring oilseed rape growing area in
central Sweden and factors influencing soil infestation levels. Plant Pathol. 45, 710-719.
Wallenhammar, A.C., Johnsson, L. and Gerhardson, B. (2000) Agronomic performance of partly clubroot-
resistant spring oilseed turnip rape lines. Phytopath. Z.. 148, 495-499.
Wallenhammar, A-C., Almquist, C. and Jonsson, A. (2012) In-field distribution of Plasmodiophora brassicae
measured using quantitative real-time PCR. Plant Pathol. 61, 16-28
Werner, S., Diederichsen, E., Frauen, M., Schondelmaier, J. and Jung, C. (2008) Genetic mapping of
clubroot resistance genes in oilseed rape. Theor. Appl. Genet. 116, 363-372.
Vandesompele, J., De Preter, K., Pattyn, F., Poppe, B., Van Roy, N., De Paepe, A. and Speleman, F. (2002)
Accurate normalization of real-time quantitative RT-PCR data by geometric averaging of multiple internal
control genes. Genome Biol. 3, 1-11
Voorrips, R.E. (1996) Production, characterization and interaction of single-spore isolates of Plasmodiophora
brassicae. Eur. J. Plant Pathol. 102, 377-383.
Zyzynska-Granica, B. and Koziak, K. (2012) Identification of suitable reference genes for real-time PCR
analysis of statin-treated human umbilical vein endothelial cells. Plos One 7, 1-12.
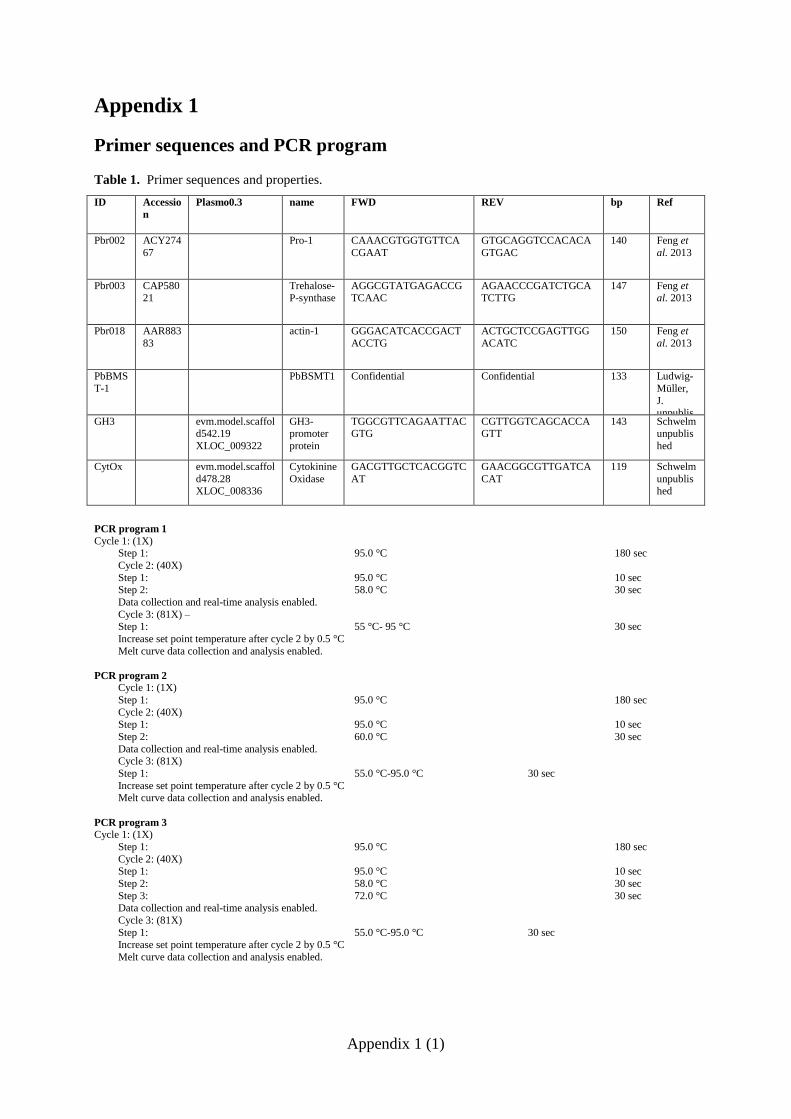
Appendix 1 (1)
Appendix 1
Primer sequences and PCR program
Table 1. Primer sequences and properties.
ID Accessio
n
Plasmo0.3 name FWD REV bp Ref
Pbr002 ACY274
67
Pro-1 CAAACGTGGTGTTCA
CGAAT
GTGCAGGTCCACACA
GTGAC
140 Feng et
al. 2013
Pbr003 CAP580
21
Trehalose-
P-synthase
AGGCGTATGAGACCG
TCAAC
AGAACCCGATCTGCA
TCTTG
147 Feng et
al. 2013
Pbr018 AAR883
83
actin-1 GGGACATCACCGACT
ACCTG
ACTGCTCCGAGTTGG
ACATC
150 Feng et
al. 2013
PbBMS
T-1
PbBSMT1 Confidential Confidential 133 Ludwig-
Müller,
J. unpublis
hed GH3 evm.model.scaffold542.19
XLOC_009322
GH3-promoter
protein
TGGCGTTCAGAATTACGTG
CGTTGGTCAGCACCAGTT
143 Schwelm unpublis
hed
CytOx evm.model.scaffol
d478.28 XLOC_008336
Cytokinine
Oxidase
GACGTTGCTCACGGTC
AT
GAACGGCGTTGATCA
CAT
119 Schwelm
unpublished
PCR program 1
Cycle 1: (1X) Step 1: 95.0 °C 180 sec
Cycle 2: (40X)
Step 1: 95.0 °C 10 sec Step 2: 58.0 °C 30 sec
Data collection and real-time analysis enabled.
Cycle 3: (81X) – Step 1: 55 °C- 95 °C 30 sec
Increase set point temperature after cycle 2 by 0.5 °C
Melt curve data collection and analysis enabled.
PCR program 2
Cycle 1: (1X)
Step 1: 95.0 °C 180 sec
Cycle 2: (40X) Step 1: 95.0 °C 10 sec
Step 2: 60.0 °C 30 sec
Data collection and real-time analysis enabled. Cycle 3: (81X)
Step 1: 55.0 °C-95.0 °C 30 sec
Increase set point temperature after cycle 2 by 0.5 °C Melt curve data collection and analysis enabled.
PCR program 3
Cycle 1: (1X)
Step 1: 95.0 °C 180 sec
Cycle 2: (40X) Step 1: 95.0 °C 10 sec
Step 2: 58.0 °C 30 sec
Step 3: 72.0 °C 30 sec
Data collection and real-time analysis enabled.
Cycle 3: (81X)
Step 1: 55.0 °C-95.0 °C 30 sec Increase set point temperature after cycle 2 by 0.5 °C
Melt curve data collection and analysis enabled.
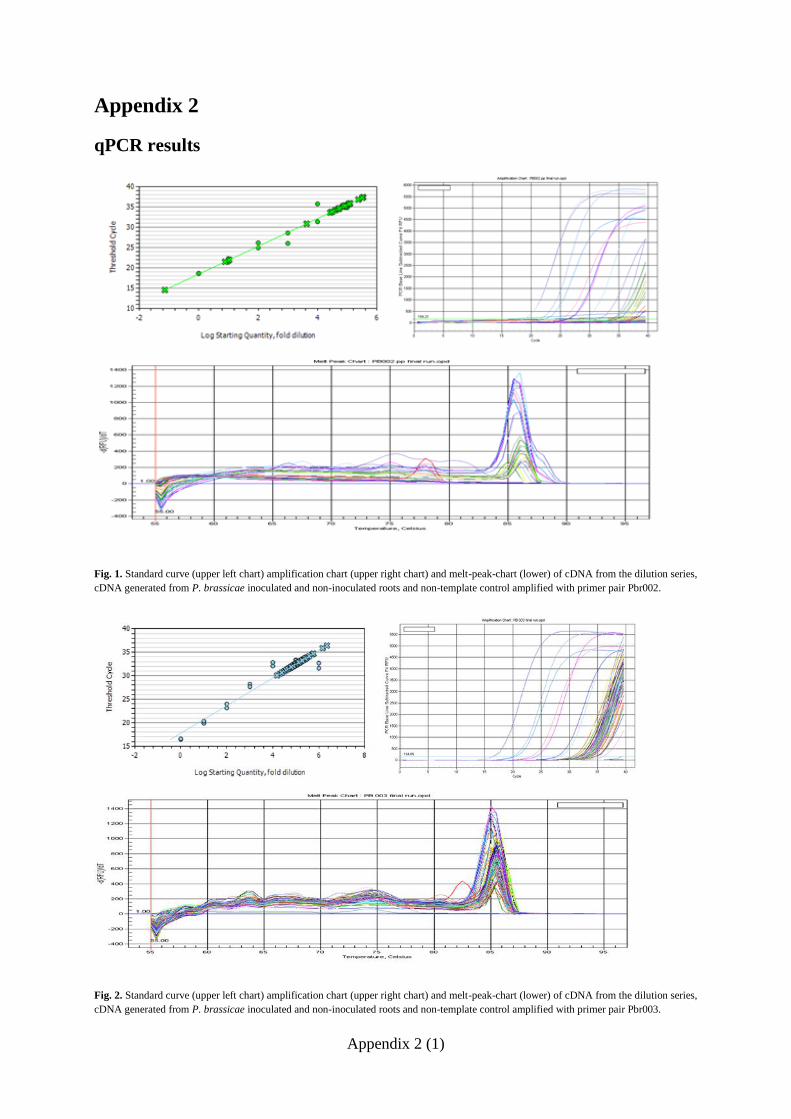
Appendix 2 (1)
Appendix 2
qPCR results
Fig. 1. Standard curve (upper left chart) amplification chart (upper right chart) and melt-peak-chart (lower) of cDNA from the dilution series,
cDNA generated from P. brassicae inoculated and non-inoculated roots and non-template control amplified with primer pair Pbr002.
Fig. 2. Standard curve (upper left chart) amplification chart (upper right chart) and melt-peak-chart (lower) of cDNA from the dilution series,
cDNA generated from P. brassicae inoculated and non-inoculated roots and non-template control amplified with primer pair Pbr003.
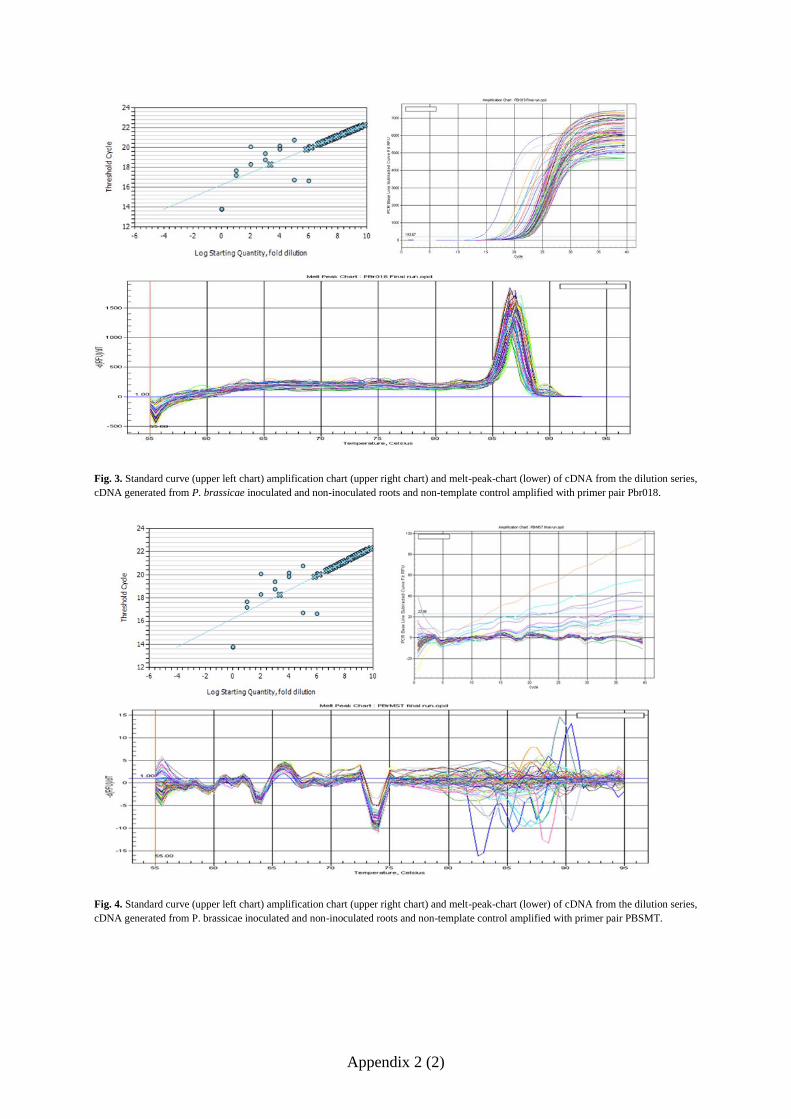
Appendix 2 (2)
Fig. 3. Standard curve (upper left chart) amplification chart (upper right chart) and melt-peak-chart (lower) of cDNA from the dilution series,
cDNA generated from P. brassicae inoculated and non-inoculated roots and non-template control amplified with primer pair Pbr018.
Fig. 4. Standard curve (upper left chart) amplification chart (upper right chart) and melt-peak-chart (lower) of cDNA from the dilution series,
cDNA generated from P. brassicae inoculated and non-inoculated roots and non-template control amplified with primer pair PBSMT.
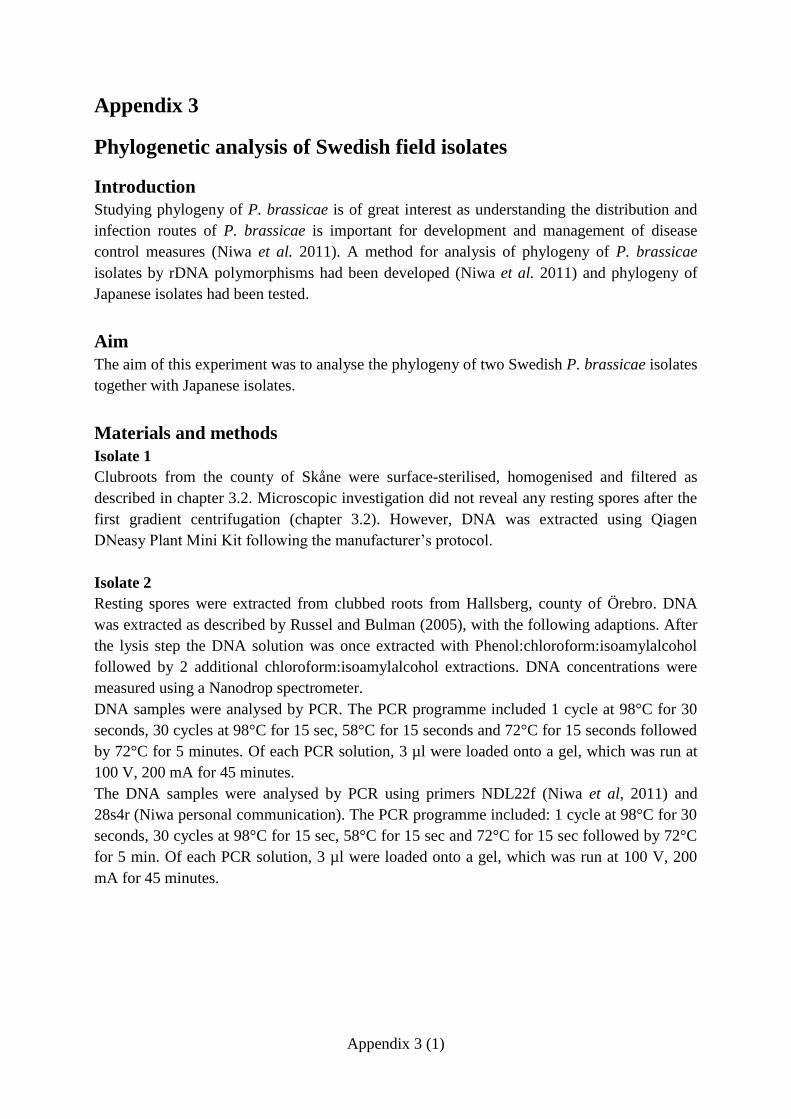
Appendix 3 (1)
Appendix 3
Phylogenetic analysis of Swedish field isolates
Introduction
Studying phylogeny of P. brassicae is of great interest as understanding the distribution and
infection routes of P. brassicae is important for development and management of disease
control measures (Niwa et al. 2011). A method for analysis of phylogeny of P. brassicae
isolates by rDNA polymorphisms had been developed (Niwa et al. 2011) and phylogeny of
Japanese isolates had been tested.
Aim
The aim of this experiment was to analyse the phylogeny of two Swedish P. brassicae isolates
together with Japanese isolates.
Materials and methods
Isolate 1
Clubroots from the county of Skåne were surface-sterilised, homogenised and filtered as
described in chapter 3.2. Microscopic investigation did not reveal any resting spores after the
first gradient centrifugation (chapter 3.2). However, DNA was extracted using Qiagen
DNeasy Plant Mini Kit following the manufacturer’s protocol.
Isolate 2
Resting spores were extracted from clubbed roots from Hallsberg, county of Örebro. DNA
was extracted as described by Russel and Bulman (2005), with the following adaptions. After
the lysis step the DNA solution was once extracted with Phenol:chloroform:isoamylalcohol
followed by 2 additional chloroform:isoamylalcohol extractions. DNA concentrations were
measured using a Nanodrop spectrometer.
DNA samples were analysed by PCR. The PCR programme included 1 cycle at 98°C for 30
seconds, 30 cycles at 98°C for 15 sec, 58°C for 15 seconds and 72°C for 15 seconds followed
by 72°C for 5 minutes. Of each PCR solution, 3 µl were loaded onto a gel, which was run at
100 V, 200 mA for 45 minutes.
The DNA samples were analysed by PCR using primers NDL22f (Niwa et al, 2011) and
28s4r (Niwa personal communication). The PCR programme included: 1 cycle at 98°C for 30
seconds, 30 cycles at 98°C for 15 sec, 58°C for 15 sec and 72°C for 15 sec followed by 72°C
for 5 min. Of each PCR solution, 3 µl were loaded onto a gel, which was run at 100 V, 200
mA for 45 minutes.
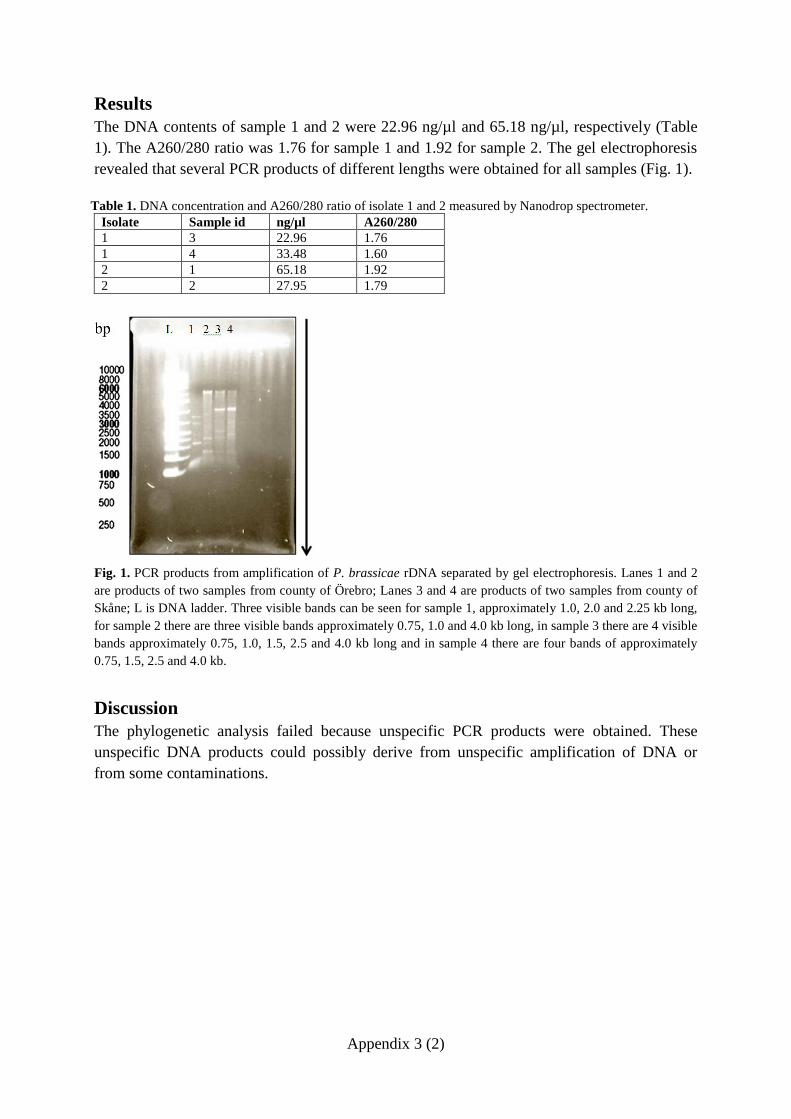
Appendix 3 (2)
Results
The DNA contents of sample 1 and 2 were 22.96 ng/µl and 65.18 ng/µl, respectively (Table
1). The A260/280 ratio was 1.76 for sample 1 and 1.92 for sample 2. The gel electrophoresis
revealed that several PCR products of different lengths were obtained for all samples (Fig. 1).
Table 1. DNA concentration and A260/280 ratio of isolate 1 and 2 measured by Nanodrop spectrometer.
Isolate Sample id ng/µl A260/280
1 3 22.96 1.76
1 4 33.48 1.60
2 1 65.18 1.92
2 2 27.95 1.79
Fig. 1. PCR products from amplification of P. brassicae rDNA separated by gel electrophoresis. Lanes 1 and 2
are products of two samples from county of Örebro; Lanes 3 and 4 are products of two samples from county of
Skåne; L is DNA ladder. Three visible bands can be seen for sample 1, approximately 1.0, 2.0 and 2.25 kb long,
for sample 2 there are three visible bands approximately 0.75, 1.0 and 4.0 kb long, in sample 3 there are 4 visible
bands approximately 0.75, 1.0, 1.5, 2.5 and 4.0 kb long and in sample 4 there are four bands of approximately
0.75, 1.5, 2.5 and 4.0 kb.
Discussion
The phylogenetic analysis failed because unspecific PCR products were obtained. These
unspecific DNA products could possibly derive from unspecific amplification of DNA or
from some contaminations.


ISSN: 1651-5196 Nr: 141
Uppsala 2013
Department of Plant Biology and Forest Genetics
Uppsala BioCenter
Box 7080
75007 Uppsala, Sweden