Embed Size (px)
Citation preview

Research ArticlePlasma-Treated CVD Graphene Gas Sensor Performance inEnvironmental Condition: The Role of Defects on Sensitivity
Gil Capote Mastrapa 1 and Fernando Lazaro Freire Jr.2
1Brazilian Center for Research in Physics, Rio de Janeiro, Brazil2Pontifical Catholic University of Rio de Janeiro, Rio de Janeiro, Brazil
Correspondence should be addressed to Gil Capote Mastrapa; [email protected]
Received 17 June 2019; Revised 23 August 2019; Accepted 9 September 2019; Published 4 November 2019
Academic Editor: Sang Sub Kim
Copyright © 2019 Gil Capote Mastrapa and Fernando Lazaro Freire Jr. This is an open access article distributed under the CreativeCommons Attribution License, which permits unrestricted use, distribution, and reproduction in any medium, provided theoriginal work is properly cited.
In this work, a low-cost resistive gas sensor based on graphene grown by CVDwas fabricated and its sensitivity was studied in termsof defect density. CVD graphene was transferred using Polyurethane as sacrifice layer with low contamination and defect-freeresults. An atmospheric plasma etching system was used to homogeneously induce defects on the sensor’s active area, asinvestigated through Raman spectroscopy. Device sensing properties were significantly enhanced for greater defect density forboth NH3 and NO2. The modified sensors were submitted to different concentrations of both target gas to assess detection limitsand overall behavior. It was revealed that defective CVD graphene devices possess sensitivity up to ppm range with lineardependence in the range of values measured. The fabricated sensors presented little to no signal degradation after months ofatmospheric exposure.
1. Introduction
Since graphene first gas detection investigation published in2007 [1], numerous efforts have been made towards itsextended application in the area [2, 3]. 2D materials, suchas graphite, have attracted enormous attention given thatthey usually show different properties from their three-dimensional counterparts. Since most chemical sensors arebased in the interaction between an active surface and a tar-get gas, it is straightforward to understand that graphene’sextremely high surface area/volume ratio makes it ideal forits use in gas sensing devices.
In this regard, the need to growth and isolate large-area graphene on suitable substrates for electronic applica-tions becomes apparent. Chemical Vapor Deposition hasbeen used for many years as a suitable option for thegrowth of polycrystalline graphene, with a highly repro-ducible process and sufficient quality for most require-ments [4, 5]. CVD-grown graphene natural defects arealso somewhat desired, as defects and irregularities are
well-known adsorption sites in most solid state gas sensorsin use today [6, 7].
On the other hand, too many defects in the graphene sur-face may promote adsorption but also have a substantialeffect in the film electrical conductivity. A typical exampleof this is seen in graphene oxide films: as deposited, theypresent an enormous amount of adsorption sites given byits sheet irregular agglomeration, which conversely causeshigh resistance values and poor effective contact [8].
Numerous ab initio studies have found that defects ongraphene enhance its sensing properties (DFTs) and experi-mental works have confirmed this behavior [9–11]. It hasbeen shown in the work by Salehi-Khojin et al. [9] that defec-tive graphene is not only more sensitive than pristine but alsothat a combination of different types of defects is desired.Lastly, it has also been reported by Rigoni et al. [12] thatUV radiation may increase the sensor’s response by intro-ducing defects and aiding desorption during the recoveryprocess. Despite all that, the mechanism of response of thegraphene properties to the variation of defect density for
HindawiJournal of SensorsVolume 2019, Article ID 5492583, 7 pageshttps://doi.org/10.1155/2019/5492583

CVD graphene in an atmospheric environment is yet to befully understood.
In this work, we studied graphene sensing propertiesupon successive increases in uniformly distributed defects.To obtain this homogeneously defect density, atmosphericplasma etching was used.NO2 andNH3 were chosen as targetgases. The two analytes studied in this work are among themost treated for research in the field, because these toxicgases have been demonstrated to have significant negativeimpacts on health and the environment. However, thedangerousness towards analytes mostly depends on someparameters related to the exposure time. To this aim, differ-ent definitions of limit values and accordingly thresholds
can be considered, taking into account different endpointsor averaging times. Independently from the various defini-tions and the countries taken into account, the analyte con-centration ranges to not exceed are quite stringent. Indeed,the general aim of research and technology is to find routesto make possible the detection and measurement of gases atlevels of ppm.
Raman spectroscopy was used to monitor defect densityand distribution [13]. It was shown that defective sensorspresented enhanced response to the same concentration ofboth target gases. A higher sensitivity was observed forNO2, which may be explained by the water adsorption onthe sensor surface as seen in [12]. It was also revealed that
(a) (b)
(c) (d)
(e)
0,10
1,0 1,2 1,4 1,6
14.15 𝛺 0,08
0,08
0,06
0,06
0,04
0,04
0,02
0,02
I (A
)
U (V)
0,000,00
(f)
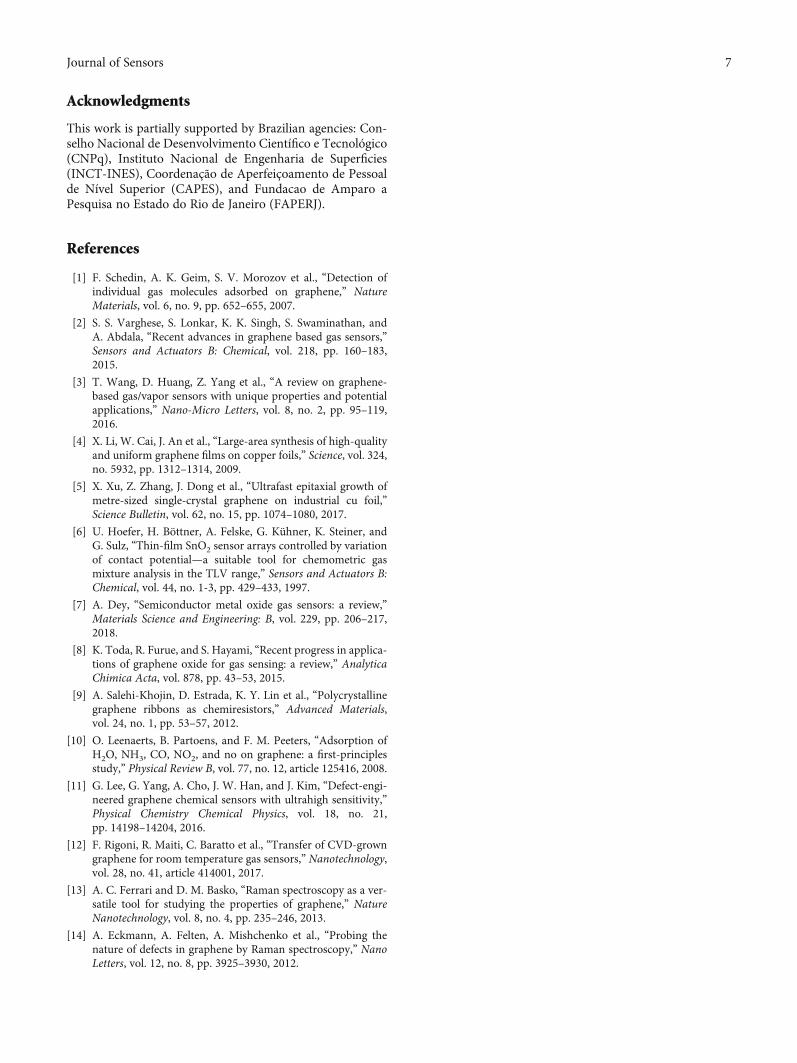
Figure 1: SEM images of CVD graphene as grown on Cu (a) and after transferred onto SiO2/Si (b). (c-e) Details of the interdigitatedchemiresistor; (d) I/V graphic. Distance between fingers is 60 microns.
2 Journal of Sensors

the as-fabricated defective sensors present linear responsevariation with concentration for both gases, with detectionlimits ranging to the few ppm scale.
2. Experimental Details
All sensors used monolayer graphene grown on copper foilsby Low Pressure Chemical Vapor Deposition (LPCVD),using a H2 annealing flux and methane gas as precursor at1050°C and 500 mTorr of total pressure. All films were trans-ferred on to SiO2/Si substrates using a modified wet-transfermethod using Polyurethane (PU) as sacrifice layer andTetrahydrofuran (THF) as solvent. PU thin films were spin-coated on the graphene surface, and the copper was subse-quently etched using an iron chloride ðFeCl3Þ solution for 1hour. After transferring graphene on to the silicon dioxidesubstrate, PU film was removed by rinsing in THF for 3hours. Scanning electron microscopy (SEM) images were
obtained using a FEG-SEM model JSM-6701F from JEOL.SEM images of the as-grown graphene sheets on copperand after the transfer process onto SiO2/Si as described areshown in Figures 1(a) and 1(b), respectively.
After transferred, chemiresistors were fabricated bythermal evaporation of Cr/Au (5/45 nm) contacts on top ofthe graphene films on SiO2/Si using a mask as shown inFigures 1(c)–1(e). The distance of the graphene active areabetween the interdigitated electrodes was 60 microns.Ohmicity was checked through I-V curves measured usinga Keithley 2400 SourceMeter connected to a sample mount-ing board, model Ecopia SPCB-1. The corresponding I/Vgraph is shown in Figure 1(f).
Defects were introduced by atmospheric plasma etchingthrough a Harrick plasma model PDC-32G. The amount ofdefects was adjusted depending on period of exposure, goingfrom 5, 10, 20, and up to 30 seconds. Each sample was thensubmitted to Raman spectroscopy to quantify defect density,
1000 1500 2000 2500 3000 3500 4000
Pristine
30 s
20 s
10 s
5 s
Raman shift (1/cm)
(a)
3,01,8
1,5
0,6
0,3
1,2
0,9
2,5
2,0
1,5
1,0
0,5
0 5 10 15 20Plasma (s)
25 30
2D/G
2D/G
(1/c
m)
D/G
(1/c
m)
D/G
(b)
0 5 10 15 20 25 30 35 40
1,8
1,6
1,4
1,2
1,0
0,8
0,6
0,4
0,2
X (𝜇m)
Y (𝜇
m)
0
5
10
15
20
25
30
35
40
(c)
1,8
1,6
1,4
1,2
1,0
0,8
0 5 10 15 20 25 30 35 40X (𝜇m)
Y (𝜇
m)
0
5
10
15
20
25
30
35
40
(d)
Figure 2: Raman spectra of typical samples before and after plasma treatment (a), (b) ðI2D/IGÞ and ðID/IGÞ ratios for the sample series;(c-d) Raman maps for 10 seconds and 30 seconds of plasma exposure, respectively.
3Journal of Sensors

using a NTEGRA spectrometer from NT-MDT with emis-sion wavelength of 473nm.
Each sample was then mounted onto the sample holderand placed inside a cylindrical stainless steel chamber (1.7 lit-ters of volume) with a small diaphragm pump installed forvacuum. Commercial traceable standard mixtures suppliedby Linde Industrial Gases of 100 ppm of NH3 and 150 ppmofNO2, both on a nitrogen base, were used to test the sensor’sperformance. All measures were made at room temperature(295K) and 50% relative humidity, and total pressure insidethe chamber was adjusted to 700 torr. MKS Instruments massflow controllers were used for gas release (NH3 and NO2mixtures, 99.99% pure N2 also from Linde or air).
Initially, the samples were placed in vacuum for a periodof 3 hours in which a resistance baseline value was attained,with less than a 0.5% variation observed in 10 minutes. Then,an air flux was released and the baseline readjusts to the newconditions in approximately one hour. After that, the air fluxwas substituted by a controlled moisture flux, keepingpressure constant throughout the measurement. Typicalexposure time to both target gases was set to 10 minutes.Finally, an air flow was used for device recovery.
The fabricated devices presented little to no signal degra-dation after 3 months of atmospheric exposure.
3. Results and Discussion
As previously discussed, defects were generated by atmo-spheric plasma as appreciated by Raman spectroscopy shownin Figure 2(a). The 2D band (∼2700 cm−1) and G band(∼1580 cm−1) intensity ratio ðI2D/IGÞ, a well-known indica-tor of monolayer graphene, decreases with higher plasmaexposure times as expected, while the D band (∼1360 cm−1)vs. G band intensity ratio ðID/IGÞ rises, as shown inFigure 2(b). This latter indicator usually is mainly associatedwith the presence of defects. It has been also established thathigh D peak intensity in conjunction with the appearance of a
D′ band (∼1620 cm−1), as observed, further signals defects inthe graphene structure [13].
Even more, it has been reported that the value of intensityratio between the D and the D′ bands ðID/ID′Þ indicates theprevalence of different types of defects in a graphene sample,(∼13) for sp3 defects and (∼7) for vacancy-like defects [14]. Inthis regard, it may be inferred from the measurements thatinitial bombardment created numerous sp3-related defects,but eventually the D′ band higher intensities for higherexposure periods denotes vacancy-dominated samples.
Raman maps showed that plasma-created defects werehomogeneously distributed, as shown through Raman mapsfor 10 seconds (Figure 2(c)) and 30 seconds (Figure 2(d)) ofplasma exposure. Local Raman spectrum variation, observedmainly in the form of cracks and wrinkles in the film, was alldue to growth and transfer-related processes. Image histo-grams of ðID/IGÞ ratio indicates the presence of highlyuniform surfaces, more so for higher exposure periods.
The values corresponding to G and 2D bands presented aslight blue shift as the exposure time increased, causedmainly because of the broadening of the peaks caused bythe induced defects. Both Raman maps presented inFigure 2 average shift values (in the whole map) for theG and 2D peaks were 1589.4 cm−1 and 2709.1 cm−1 forthe 10-second plasma exposure and 1592.5 cm−1 and2711.4 cm−1 for the 30-second exposure. Both G and 2D shiftsare an indicator of the p-type behavior the sensors showed.
In Figure 3, we resume response of the sensor to exposi-tion to different gases as a function of the time of plasmatreatment. It is clear that the response increases upon theincrease of the duration of the processing. The response ofthe sensor is illustrated also in Figures 4(a) and 4(b). Theresponse changes as a function of plasma exposure as seenin Figures 4(a) and 4(b). In Figures 4(c) and 4(d), it wasshown for plasma processing time of 30 minutes the recoverybehavior of the sensor. Total recovery was not achieved, sig-naling that full desorption might require further treatment.
35
30
25
20
15
10R
/R N
O2 (
%)
5
00 5
NO2NH3
10 15 20 25 30
5
4
3
2
1
0
Plasma (s)
𝛻 𝛥R
/R N
H3 (
%)
Figure 3: Sensor response to NO2 and NH3 as a function of the time of plasma treatment.
4 Journal of Sensors

However, it was not identified a clear relation between recov-ery rates and plasma exposure time.
It was also investigated the sensor performance whensubmitted to different concentrations of the target gases.For this, an additional pure nitrogen flux was introduced tothe previous target gas mixtures in-flux, in such way thatthe total flux released into the chamber remained constant.When exposed to different concentrations of NH3 and NO2, as shown in Figures 5(a) and 5(b), the sensors registeredclear signals up into the range of tens of ppm. It was alsofound that the response is directly proportional to the con-centration of the target gas as shown in Figure 5(c). Fromthe linear regression curves of both series, it may be estimatedthat below 2ppm for NH3 and 18 ppm of NO2 the responsewill no longer be reliable.
4. Summary and Conclusions
In summary, monolayer CVD-grown graphene sheets weretransferred to SiO2/Si substrates using PU as sacrifice layerin the transfer process. A chemiresistor was fabricated ontop of the as-transferred graphene layer, and homogeneousdefects were then induced by plasma. The density and typeof defects produced were investigated as a vital factor in thesensor response. Raman spectroscopy proved uniformlydistributed defects in the graphene sheet after plasmaexposure. Device sensing properties were highly influencedby the defect density for both NO2 and NH3 gases. Ingeneral, all devices showed greater response to NO2, whichmay be explained by the predominant number of vacancy-type defects caused by plasma etching. All devices showed
0
–5
–10
–15
–20
–25
–30
–35–2 0
Pristine10 s
2 4 6 8 10Time (min)
R/R
(%)
𝛻
20 s30 s
(a)
Pristine10 s
5
4
3
2
1
0
–2 0 2 4 6 8 10Time (min)
R/R
(%)
𝛻
20 s30 s
(b)
Time (min)
R/R
(%)
𝛻
R/R𝛻
0
5
–5
–10
–15
–20
–25
–30
–40
–40 0
35,7%
30,2%30,3%
40 80 120 160 200
150 ppm NO2
–35
(c)
R/R𝛻
100 ppm NH3
4,4%
4,6%
4,5%
Time (min)0 40 80 120 160 200
R/R
(%)
𝛻
6
5
4
3
2
0
1
(d)
Figure 4: CVD graphene sensor response to 150 ppm of NO2 (a) and 100 ppm of NH3 (b) for as-transferred and plasma-treated samples.(c-d) Sequential exposure to both gases for a 30-second-exposed sample.
5Journal of Sensors

almost complete desorption when exposed to air and aresponse was recorded up to tens of ppm range for bothgases. The as-created chemiresistors showed low resistanceand an enhanced response to both target gases, all of thatwhile not showing any signal degradation after atmo-spheric exposure.
To be competitive with commercial sensor technologies,graphene-based sensors must be mass producible at low cost.With the recent improvement of the CVD synthesis method[5], the issue of large-scale graphene production is apparentlyabout to be overcome. In our devices, another bottleneckwhich is the need of high-temperature desorption for gasesof NO2 and NH3 on graphene surfaces is surmount, as isclear from Figures 4 and 5. Concluding, the increase in sensor
sensitivity is the result of simple plasma treatment using airas the active gas, clearly indicating that this device is on theroute to be commercially competitive.
Data Availability
All the data used to support the findings of this study areavailable from the corresponding author upon request.
Conflicts of Interest
The authors declare that they have no conflicts of interest.
R/R𝛻
NO2
R/R
(%)
𝛻
0
5150 ppm
35,3%26,3%
22,3%20,0%
75 ppm 40 ppm 20 ppm
–5
–10
–15
–20
–25
–30
–40–40
–35
0 40 80 120 160 200 240 280Time (min)
(a)
R/R𝛻
NH3
R/R
(%)
𝛻
5
4,3% 2,9%2,5% 2,0%
100 ppm 50 ppm 25 ppm 12 ppm
4
3
2
1
0
0 40 80 120 160 200 240 280Time (min)
(b)
4,536
34
32
30
28
26
24
22
20
18
4,0
3,5
3,0
2,5
2,0
NO2
NH3
160140Concentration (ppm)
1201008060200 40
R/R
NH
3 (%
)
𝛻 R/R
NO
2 (%
)
𝛻
(c)
Figure 5: Real-time behavior of a 30-second plasma-treated device upon exposure to sequential NO2 (a) and NH3 (b) pulses at decreasingconcentrations. (c) Registered response for each gas.
6 Journal of Sensors
Acknowledgments
This work is partially supported by Brazilian agencies: Con-selho Nacional de Desenvolvimento Científico e Tecnológico(CNPq), Instituto Nacional de Engenharia de Superficies(INCT-INES), Coordenação de Aperfeiçoamento de Pessoalde Nível Superior (CAPES), and Fundacao de Amparo aPesquisa no Estado do Rio de Janeiro (FAPERJ).
References
[1] F. Schedin, A. K. Geim, S. V. Morozov et al., “Detection ofindividual gas molecules adsorbed on graphene,” NatureMaterials, vol. 6, no. 9, pp. 652–655, 2007.
[2] S. S. Varghese, S. Lonkar, K. K. Singh, S. Swaminathan, andA. Abdala, “Recent advances in graphene based gas sensors,”Sensors and Actuators B: Chemical, vol. 218, pp. 160–183,2015.
[3] T. Wang, D. Huang, Z. Yang et al., “A review on graphene-based gas/vapor sensors with unique properties and potentialapplications,” Nano-Micro Letters, vol. 8, no. 2, pp. 95–119,2016.
[4] X. Li, W. Cai, J. An et al., “Large-area synthesis of high-qualityand uniform graphene films on copper foils,” Science, vol. 324,no. 5932, pp. 1312–1314, 2009.
[5] X. Xu, Z. Zhang, J. Dong et al., “Ultrafast epitaxial growth ofmetre-sized single-crystal graphene on industrial cu foil,”Science Bulletin, vol. 62, no. 15, pp. 1074–1080, 2017.
[6] U. Hoefer, H. Böttner, A. Felske, G. Kühner, K. Steiner, andG. Sulz, “Thin-film SnO2 sensor arrays controlled by variationof contact potential—a suitable tool for chemometric gasmixture analysis in the TLV range,” Sensors and Actuators B:Chemical, vol. 44, no. 1-3, pp. 429–433, 1997.
[7] A. Dey, “Semiconductor metal oxide gas sensors: a review,”Materials Science and Engineering: B, vol. 229, pp. 206–217,2018.
[8] K. Toda, R. Furue, and S. Hayami, “Recent progress in applica-tions of graphene oxide for gas sensing: a review,” AnalyticaChimica Acta, vol. 878, pp. 43–53, 2015.
[9] A. Salehi-Khojin, D. Estrada, K. Y. Lin et al., “Polycrystallinegraphene ribbons as chemiresistors,” Advanced Materials,vol. 24, no. 1, pp. 53–57, 2012.
[10] O. Leenaerts, B. Partoens, and F. M. Peeters, “Adsorption ofH2O, NH3, CO, NO2, and no on graphene: a first-principlesstudy,” Physical Review B, vol. 77, no. 12, article 125416, 2008.
[11] G. Lee, G. Yang, A. Cho, J. W. Han, and J. Kim, “Defect-engi-neered graphene chemical sensors with ultrahigh sensitivity,”Physical Chemistry Chemical Physics, vol. 18, no. 21,pp. 14198–14204, 2016.
[12] F. Rigoni, R. Maiti, C. Baratto et al., “Transfer of CVD-growngraphene for room temperature gas sensors,” Nanotechnology,vol. 28, no. 41, article 414001, 2017.
[13] A. C. Ferrari and D. M. Basko, “Raman spectroscopy as a ver-satile tool for studying the properties of graphene,” NatureNanotechnology, vol. 8, no. 4, pp. 235–246, 2013.
[14] A. Eckmann, A. Felten, A. Mishchenko et al., “Probing thenature of defects in graphene by Raman spectroscopy,” NanoLetters, vol. 12, no. 8, pp. 3925–3930, 2012.
7Journal of Sensors

International Journal of
AerospaceEngineeringHindawiwww.hindawi.com Volume 2018
RoboticsJournal of
Hindawiwww.hindawi.com Volume 2018
Hindawiwww.hindawi.com Volume 2018
Active and Passive Electronic Components
VLSI Design
Hindawiwww.hindawi.com Volume 2018
Hindawiwww.hindawi.com Volume 2018
Shock and Vibration
Hindawiwww.hindawi.com Volume 2018
Civil EngineeringAdvances in
Acoustics and VibrationAdvances in
Hindawiwww.hindawi.com Volume 2018
Hindawiwww.hindawi.com Volume 2018
Electrical and Computer Engineering
Journal of
Advances inOptoElectronics
Hindawiwww.hindawi.com
Volume 2018
Hindawi Publishing Corporation http://www.hindawi.com Volume 2013Hindawiwww.hindawi.com
The Scientific World Journal
Volume 2018
Control Scienceand Engineering
Journal of
Hindawiwww.hindawi.com Volume 2018
Hindawiwww.hindawi.com
Journal ofEngineeringVolume 2018
SensorsJournal of
Hindawiwww.hindawi.com Volume 2018
International Journal of
RotatingMachinery
Hindawiwww.hindawi.com Volume 2018
Modelling &Simulationin EngineeringHindawiwww.hindawi.com Volume 2018
Hindawiwww.hindawi.com Volume 2018
Chemical EngineeringInternational Journal of Antennas and
Propagation
International Journal of
Hindawiwww.hindawi.com Volume 2018
Hindawiwww.hindawi.com Volume 2018
Navigation and Observation
International Journal of
Hindawi
www.hindawi.com Volume 2018
Advances in
Multimedia
Submit your manuscripts atwww.hindawi.com


![Plasma Treatment of Graphene Oxide · wettability for both graphene oxide [20] and graphene [22, 27], treated in oxygen plasma. The increase of the wettabilityallows to improve its](https://img.pdfslide.us/doc/110x75/5f17083bb5aad850ac4f563d/plasma-treatment-of-graphene-oxide-wettability-for-both-graphene-oxide-20-and.jpg)


![Hydrogen-sieving single-layer graphene membranes obtained ...sized by the chemical vapor deposition (CVD) method [11,12], mainly because the CVD synthesis can be carried out rapidly](https://img.pdfslide.us/doc/110x75/5f6a29415fe541748a7df065/hydrogen-sieving-single-layer-graphene-membranes-obtained-sized-by-the-chemical.jpg)