Embed Size (px)
Citation preview
APPLIED NUTRITIONAL INVESTIGATION
Plasma Glutamine Response to EnteralAdministration of Glutamine in Human Volunteers(Free Glutamine Versus Protein-Bound Glutamine)Julio J. Boza, PhD, Jean-Claude Maire, PhD, Lionel Bovetto, PhD, and Olivier Balle`vre, PhD
From the Department of Nutrition, Nestle´ Research Center, Lausanne, Switzerland
The goal of the present work was to compare the plasma glutamine response to exogenous glutamineadministration in human volunteers; glutamine was provided as a free amino acid, bound to proteins, orin the form of peptides. Plasma glutamine concentrations were measured in eight human volunteers at 30,60, 90, 120, and 240 min after receiving a drink containing 30 g of protein from one of the five differentproteins tested (sodium caseinate, sodium caseinate1 free glutamine, carob germ flour, carob proteinconcentrate, and carob protein hydrolysate). Peak plasma glutamine concentrations were 42% higher thanpostabsorptive basal values when exogenous glutamine was administered in the form of free glutamineadded to caseinate (925.96 67.7 versus 651.36 44.0mmol/L, respectively). In contrast, when glutaminewas offered 100% bound to proteins (carob proteins), peak plasma glutamine concentration increased onlybetween 18% and 23% from basal values, possibly because of the lower digestibility of carob proteinsversus that of caseinate1 free glutamine, to a different glutamine utilization at the gut level, or to adifferent response in endogenous glutamine kinetics to enteral administration of glutamine, depending onthe molecular form of the glutamine source (free or protein bound).Nutrition 2000;16:1037–1042.©Elsevier Science Inc. 2000
Key words: free glutamine versus protein-bound glutamine, plasma glutamine concentration, humanvolunteers, enteral nutrition
INTRODUCTION
Glutamine is an amino acid that accounts for 30% to 35% of all theamino-acid nitrogen that is transported in the plasma.1 Because itcan be synthesized de novo, it has not been considered an essentialamino acid. However, it has been recognized that glutamine is notonly abundant in the body but also very labile under certainphysiologic and pathologic conditions, with especially markeddeclines in glutamine concentrations in both the plasma and bodytissues in the setting of catabolic, stressful disease states and afterintense exercise.2–4
The physiologic basis for these changes has been investigated,and anabolic trophic effects of glutamine feeding have been dem-onstrated in experimental animals. A high rate of glutamine uptakeof rapidly dividing cells that allows them a rapid response to achallenge (gut injury, infection, etc.) would be the basis of thoseeffects. From this work, glutamine has been classified as a condi-tionally essential amino acid.5,6
Glutamine will be made available in the lumen of the intestinefrom the digestion of the protein. However, animal and humanstudies7,8 have demonstrated that little of this glutamine enters thebloodstream: the absorptive cells of the small intestine and thegut-associated lymphoid tissue would, therefore, use a great por-tion of the glutamine coming from the diet. Hence, to satisfy thehigh demand for glutamine by the immune system (apart from thegut-associated lymphoid tissue), it must be provided within thebody (skeletal muscle). Glutamine concentrations in muscle aredecreased in certain physiologic conditions. In this situation, the
rate of release of this amino acid from muscle is also decreasedand, consequently, the concentration of glutamine in plasma alsodrops; in other words, glutamine transport would no longer be fluxgenerating for glutamine release and utilization by cells of theimmune function and by enterocytes. Thus, glutamine-supplemented diets would provide sufficient amounts of this aminoacid to the enterocytes and, hence, would spare the plasma glu-tamine for other tissue needs, thus maintaining the normal glu-tamine concentration in the muscle.9
Standard nutrition formulas for enteral nutrition are based onmilk proteins, which are low in glutamine (6% to 9% of totalamino acids). Because this free amino acid is unstable to heattreatment, enteral liquid diets have not included glutamine in itsfree form. However, powdered diets containing L-glutamine arenow available, but it can be converted into pyroglutamate over thelong run in solution and under acidic conditions. In addition, itsrate of absorption and appearance in plasma will be differentcompared with the other amino acids provided as proteins, whichare released more slowly in the intestinal lumen. Therefore, theideal way to provide stable glutamine would be to feed proteins orpeptides rich in this particular amino acid. We recently made ascreening on the glutamine content of different plant proteinsources to find glutamine-rich proteins that potentially could beused in enteral formulas as glutamine sources. Apart from wheatproteins, we found that cereal and seeds contained more glutaminethan did legumes (C. Garcı´a-Rodenas, J. Boza, D. Moe¨nnoz, O.Ballevre, unpublished results). The glutamine content was mea-sured after extensive enzymatic hydrolysis of the raw material withFlavorzyme (Novo, Bagsvaerd, Denmark). Among these, carobgerm flour presented a high amount of protein (50%) and a highamount of gutamine (17 g/100 g protein).
The main goal of the present work was to study the plasmaglutamine response to exogenous administration of glutamine inhumans; glutamine was provided as a free amino acid, bound toproteins, or in the form of peptides. We studied the effect of four
Correspondence to: Julio J. Boza, PhD, Department of Nutrition, Nestle´Research Center, Vers-chez-les-Blanc, 1000 Lausanne 26, Switzerland.E-mail: [email protected]
Date accepted: April 28, 2000.
Nutrition 16:1037–1042, 2000 0899-9007/00/$20.00©Elsevier Science Inc., 2000. Printed in the United States. All rights reserved. PII S0899-9007(00)00433-0
glutamine-supplemented meals in comparison with a non-supplemented meal (caseinate) on the plasma glutamine concen-tration of normal subjects and on plasma glucose and insulinconcentrations. The glutamine supplementation was done in one oftwo ways: 1) we added free L-glutamine to the non-supplementedmeal (caseinate); 2) we used a protein that contained a high contentof glutamine (carob). The carob protein was presented in threeforms: carob germ flour, carob protein concentrate, and the tryptichydrolysate of the concentrate.
MATERIALS AND METHODS
Proteins Tested
Five different protein preparations were tested in the study: sodiumcaseinate (Miprodan 32, MD Food Ingredients, Videbaek, Den-mark), sodium caseinate1 glutamine (to reach a glutamine con-tent of 17% above the total amino-acid content), carob germ meal,carob protein concentrate, and carob protein hydrolysate. Theamino-acid profile chemical composition of the protein prepara-tions is presented in Tables I and II.
Carob Protein Concentrate Obtention
Carob germ flour contains 50% protein, trypsin inhibitors (393TIU/mg N), phytic acid, tannins, and an important amount of fiber(Polygal, Marstepten, Switzerland). A carob protein concentratewas obtained after carbohydrate digestion at pH 5 with the aid ofViscozyme (Novo), followed by protein precipitation to pH 4,resuspension in demineralized water, and sterilization through anUHT system at 140°C for 40 s to decrease the content of trypsininhibitors. The protein content of the concentrate was 68.1% (Ncontent3 6.25), and the trypsin inhibitor content after heat treat-ment was 124 mg TIU/mg N.
Carob Protein Enzymatic Hydrolysate Obtention
The carob protein concentrate was made enzymatic by the additionof trypsine (940465; Trypsin PTN 6.0S, Novo). The protein con-tent of the hydrolysate was 65.6% (N content3 6.25), and thetrypsin inhibitor content after heat treatment was 25 mg TIU/mg N.Peptide distributions were established by size-exclusion–high-performance liquid chromatography by injecting 12.5mg of nitro-gen into 25mL 0.1% trifluoroacetic acid solution (v/v) on a TSKG2000 WXL column. Mobile phase was 0.1% (v/v) trifluoroaceticacid in water at a flow rate of 0.5 mL/min. The column effluentwas monitored for ultraviolet-light absorption at 220 nm.10 Thepeptide distribution of the carob protein hydrolysate was as fol-lows: .5000 Da, 1%; 1000 to 5000 Da, 32%; 500 to 1000 Da,45%; and,500 Da, 22%.
TABLE I.
AMINO-ACID COMPOSITION OF CASEINATE, CASEINATE1 GLUTAMINE, CAROB GERM FLOUR, CAROB PROTEIN CONCENTRATE,AND ITS TRYPSINE HYDROLYSATE (G/100 G AMINO ACIDS)
Amino acid Caseinate Caseinate1 glutamine Carob Carob concentrate Carob hydrolysate
Asp 6.40 5.82 7.96 8.20 7.78Glu 11.56 10.52 11.19 11.01 12.54Ser 4.86 4.42 4.82 4.33 4.72Gly 1.72 1.56 5.08 4.81 4.76Gln* 8.90 17.1 17.01 17.30 15.64His 2.75 2.5 2.81 2.56 2.77Thr 3.99 3.63 3.44 3.26 3.18Ala 2.87 2.61 4.49 4.15 4.28Arg 3.75 3.41 11.99 12.75 12.71Pro 10.41 9.47 3.69 3.73 3.73Tyr 5.33 4.85 3.21 3.27 3.28Val 6.23 5.67 4.03 4.25 4.06Met 2.79 2.54 1.14 1.00 0.97Cys 0.36 0.33 1.39 1.35 1.34Ile 4.80 4.37 3.34 3.60 3.46Leu 9.27 8.43 6.42 6.71 6.63Phe 4.98 4.53 3.18 3.27 3.31Trp 1.68 1.53 n.m. 0.88 0.92Lys 7.60 6.91 5.17 4.89 5.03
* Glutamine values were obtained after extensive enzymatic hydrolysis.n.m., not measured.
TABLE II.
CHEMICAL COMPOSITION OF THE CASEINATE, CAROB GERMFLOUR, THE CAROB PROTEIN ISOLATE, AND ITS TRYPSINE
HYDROLYSATE
Caseinate CarobCarob
concentrateCarob
hydrolysate
Protein (%) 93.5 50.0 68.1 65.6Fat (%) 1.2 7.2 9.4 n.m.Carbohydrates (%) 0.2 14.5 6.3 n.m.Fiber (%) — 18.3 9.6 n.m.Ash (%) 3.1 6.2 5.2 9.0Moisture (%) 2.0 3.8 3.3 n.m.Trypsin inhibitors
(TIU/mg N)— 393 124 25
n.m., not measured
1038 Boza et al. Nutrition Volume 16, Numbers 11/12, 2000
Subjects
Eight healthy volunteer subjects (four male, four female; age536.3 6 9.1; body mass index5 22.5 6 2.5) participated in thestudy. All subjects had a normal physical examination and main-tained their usual physical activity. Subjects did not suffer fromany chronic or metabolic disease (e.g., diabetes, hypertension) andwere not taking drugs at the time of the study. Written informedconsent was obtained from each participant. The experimentalprotocol was approved by the Nestle´ Research Center EthicalCommittee.
Experimental Design
Five experimental protocols were performed in the same eightvolunteers who were assigned to receive a drink containing 30 g ofprotein of one of the five different protein preparations, 40 g ofmaltodextrines (dextrose equivalent5 50), and 10 g of sucrose,dispersed in 450 mL of water. All drinks were isonitrogenous.After an overnight fasting, subjects were admitted at the metabolicunit of CRN at 7.30AM, a catheter was inserted in the forearm veinfor blood sampling, and two blood samples (4.5 mL each) weretaken before the oral administration of the drink. The proteinpreparations were offered at 8.00AM and they were consumedwithin 5 min. Blood samples (4.5 mL) were taken at 30, 60, 90,120, 180, and 240 min after meal ingestion. Plasma was obtainedimmediately after centrifugation at 4°C.
Plasma Amino Acid Concentrations
Once obtained, 200mL of plasma was deproteinized by adding 20mL of a solution containing sulfosalicylic acid (400 mg/mL) andvitamin C (60 mg/mL). After mixing, samples were centrifuged(10 000g for 3 min), and supernatants were frozen at280°C untilanalysis, which was performed in a Beckman 6300 amino-acidanalyzer. Amino-acid concentrations (mmol/L; glutamine, threo-nine, glutamate, and glycine; Table III) were calculated fromindividual peak area, external standard, and the two internal stan-dard areas.11
Plasma Insulin and Glucose
Plasma insulin levels (mU/L) were measured by an inhibitionradioimmune assay (INSI-PR, CIS Bio International, Gif-Sur-Yvette, France). Plasma glucose concentrations (mmol/L) weredetermined photometrically using the enzymatic ultraviolet testUnimate 5 GLUC HK (Roche, Rotkreuz, Switzerland).
Statistical Analysis
Data are expressed as mean6 SD. One-way analysis of varianceand post hoc Bonferroni tests were used to determine mean dif-ferences across the nutritional treatments for all the parametersstudied.P , 0.05 was considered significant.
RESULTS
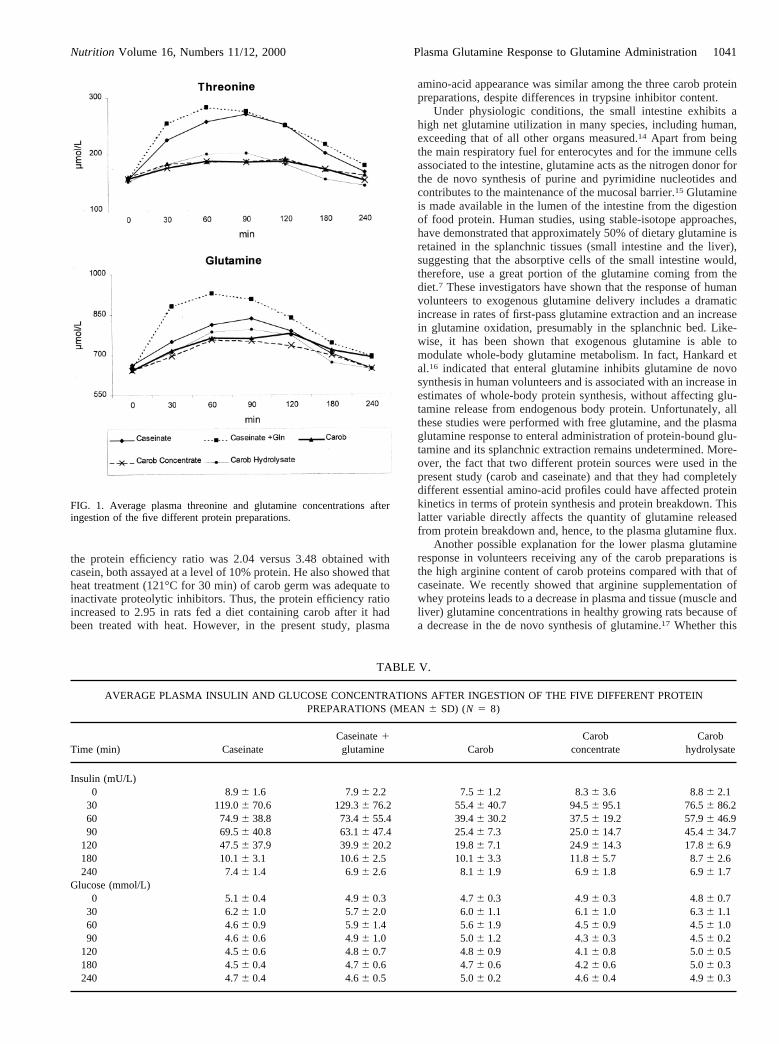
This study was designed to examine plasma glutamine response toexogenous glutamine (provided as a free amino acid or bound toprotein) in human volunteers after receiving a drink containing30 g of protein or protein equivalent. Table IV and Figure 1 showthe plasma amino-acid concentrations after the ingestion of the fivedifferent protein preparations. A marked increase in plasma glu-tamine concentration was observed from baseline to a peak con-centration between 60 and 90 min after protein preparation inges-tion irrespective of the diet. However, increases in plasmaglutamine were significantly higher when volunteers drank thecasein1 glutamine preparation than when they were offered thecarob preparations, despite the fact that these preparations con-tained similar quantities of glutamine. At maximum plasma glu-tamine concentration, volunteers fed the free glutamine-supplemented test meal showed an increase of up to 42% in theirplasma glutamine concentration compared with basal values,whereas this maximum reached only 18% to 23% when the samevolunteers consumed the carob protein–based drinks.
Plasma threonine concentrations also increased 60 to 90 minafter drink ingestion, especially when volunteers received thecaseinate-based preparations. Plasma glycine concentrationsreached higher levels after ingestion of carob-based drinks thanafter casein preparations, mainly due to the higher content ofglycine in the carob proteins (three times higher).
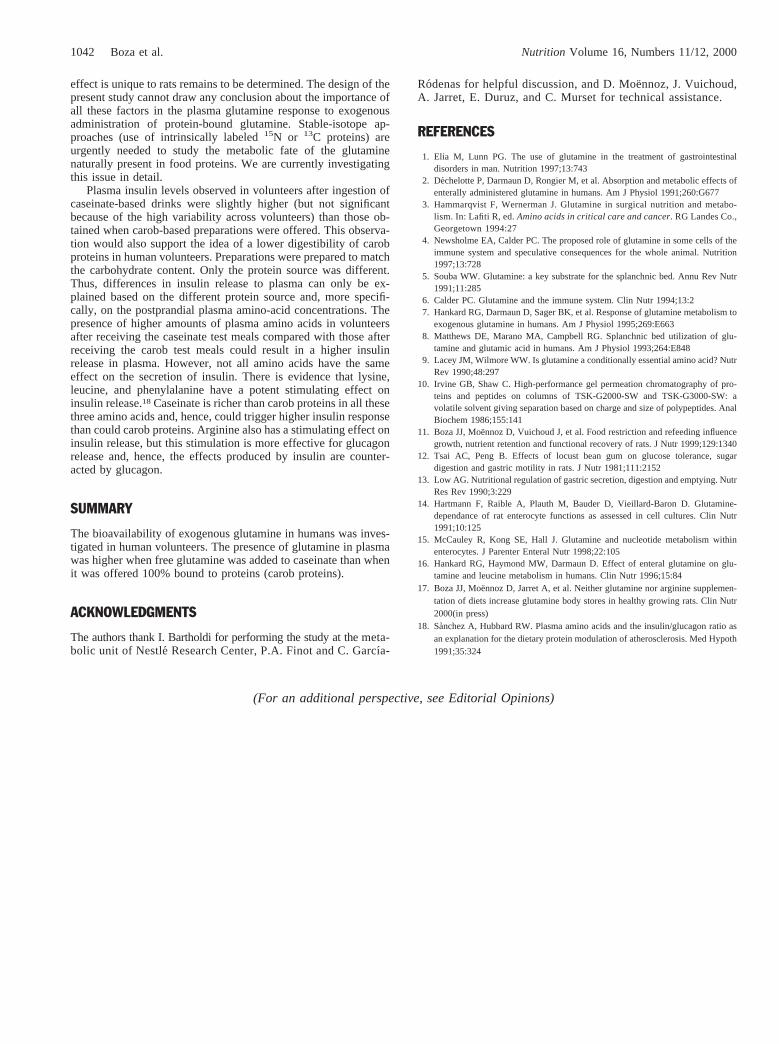
Insulin secretion was stimulated to a peak concentration thatappeared 30 min after protein ingestion (Table V). The highestinsulin peaks were observed when caseinate-based preparationswere used. However, because of the variability, there were nostatistically significant differences between groups throughout thestudy. Values decreased gradually, and insulin concentrations werecomparable to basal values 180 min after volunteers ingested theprotein drink. Plasma glucose concentrations were also increasedin response to the 50 g of carbohydrates present in the proteindrinks. No significant differences were observed between nutri-tional treatments.
DISCUSSION
The present study was performed to establish the response ofplasma glutamine concentration after glutamine ingestion of glu-tamine in humans; glutamine was provided as a free amino acid,bound to proteins, or in the form of peptides. Free glutaminesupplementation of caseinate (from 9% to 17% above the totalamino-acid content) resulted in an increase of plasma glutamineconcentrations in human volunteers (42%). This addition did notsignificantly affect the appearance in plasma of threonine after theingestion of the two caseinate-based drinks, taking into accountthat there was only a 10% difference in threonine intake betweenthe two preparations. However, when volunteers received any ofthe three carob-based preparations (germ flour, carob protein con-centrate, and its enzymatic hydrolysate), plasma glutamine con-centration did not reach the same levels observed when casein-
TABLE III.
THREONINE, GLUTAMINE, ARGININE, AND GLYCINE CONTENT OF THE TEST MEALS (G/TEST SERVING)
Amino acid Caseinate Caseinate1 glutamine Carob Carob concentrate Carob hydrolysate
Thr 1.22 1.11 0.97 0.92 0.90Gln 2.73 5.24 4.82 4.90 4.43Arg 1.15 1.04 3.37 3.61 3.58Gly 0.52 0.47 1.52 1.44 1.43
Nutrition Volume 16, Numbers 11/12, 2000 1039Plasma Glutamine Response to Glutamine Administration
ate 1 free glutamine was used, despite the fact that glutamineintake was similar between groups (Table III). Differences werestatistically significant at 30, 60, and 90 min after protein inges-tion. Plasma from volunteers fed the carob protein preparationsexhibited postpandrial plasma glutamine concentrations compara-ble to those of volunteers receiving the caseinate drink, despite theimportant difference in glutamine intake (2.73 g versus 4.43 to4.82 g in the caseinate- and carob-based protein preparations,respectively).
The increase in plasma threonine concentration after proteiningestion was also significantly lower in volunteers fed any of thethree glutamine-bound protein preparations than in subjects receiv-ing the caseinate-based protein drinks. Caseinate-based drinkscontained 25% more threonine than carob-based drinks (Table III),whereas threonine plasma concentration increments in subjectsreceiving the caseinate-based protein drinks were more than dou-ble those of volunteers receiving the carob-based preparations.
According to the results obtained, we hypothesize that glu-tamine from food proteins behave in a manner different than freeglutamine (L-glutamine added to caseinate). Bound glutaminecould be retained in the splanchnic bed to a greater extent than freeglutamine. We speculate that glutamine bound to proteins is ab-sorbed more slowly than free glutamine; hence, enterocytes may
have more time to retain it in the splanchnic bed. As Table IVshows, plasma glutamine concentrations reached the maximum at90 min after ingestion when caseinate or carob proteins wereoffered to the volunteers. In contrast, when free glutamine wasadded to casein, the plasma glutamine concentration peak wasreached only 60 min after protein ingestion. In addition, thepotential effect of gastric emptying could have affected the lateappearance of glutamine in plasma when volunteers were fed thecarob-based preparations. Tsai and Peng12 showed that carob gumdelays gastric emptying of liquid meals in rats. Moreover, theosmolarity of the different meals could have influenced the results.Low13 indicated that the higher the osmolarity of solutions in thestomach, the more gastric emptying is delayed. Although mealswere isonitrogenous, the carob-based preparations contained ahigher content of minerals, carbohydrates, and fibers than did thosebased on caseinate and, consequently, they had a higherosmolarity.
Trypsin inhibitors present in the carob preparations could havehad a major impact on the digestibility of carob protein. Thisactivity was drastically reduced by heat treatment in carob proteinconcentrate and the carob protein hydrolysate. K. Anantharaman(unpublished observations) studied the nutritional value of carobgerm in rats. Carob proteins supported growth of the animals, but
TABLE IV.
AVERAGE CHANGES OF PLASMA AMINO ACID CONCENTRATION (mMOL/L) AFTER INGESTION OF THE FIVE DIFFERENT PROTEINPREPARATIONS (MEAN6 SD) (N 5 8)*
Time (min) CaseinateCaseinate1glutamine Carob
Carobconcentrate
Carobhydrolysate
Threonine0 154.36 38.9 155.56 32.8 158.66 52.5 155.66 25.0 149.86 35.1
30 224.76 49.3ab 253.96 30.5a 182.46 59.0b 174.46 28.9b 180.96 33.6b
60 256.26 45.4a 281.86 38.6a 185.26 58.9b 185.96 28.9b 198.96 36.8b
90 269.46 52.9a 274.86 42.2a 185.16 56.8b 183.86 29.1b 200.36 40.5b
120 250.36 49.4a 249.16 36.5a 189.86 56.9b 185.46 29.6b 179.86 41.8b
180 199.36 59.1ab 215.56 52.4a 169.66 51.8bc 170.46 42.2c 152.16 40.7c
240 65.46 44.9ab 176.76 37.9a 159.96 42.8ab 149.86 29.7b 140.46 30.2b
Glutamine0 662.76 68.7 651.36 44.0 644.26 75.7 643.76 50.8 645.96 49.9
30 748.06 79.2a 881.36 68.2b 716.86 101.8a 695.46 56.9a 709.16 89.1a
60 812.26 90.3a 925.96 67.7b 763.36 123.8a 757.16 69.9a 784.76 64.7a
90 834.26 96.7a 903.86 59.3b 760.36 111.1ac 750.96 59.3c 794.16 83.0ac
120 786.66 101.0ab 836.76 80.5a 777.46 120.1ab 733.96 75.0b 771.16 76.2ab
180 702.66 93.9ab 743.86 71.3a 715.36 110.6ab 697.86 69.3ab 668.96 87.6b
240 647.96 53.9a 694.96 61.1b 688.76 73.4ab 647.86 58.1b 645.66 66.9b
Glutamate0 24.16 9.3 23.66 7.1 25.06 10.7 26.36 14.3 25.86 9.9
30 37.26 18.6 37.46 16.6 36.26 20.0 32.86 15.9 44.06 26.560 39.46 19.7 39.86 15.1 36.86 17.8 38.76 19.7 49.26 22.590 33.26 15.8 39.06 15.4 38.56 16.2 36.16 14.3 37.96 16.3
120 33.26 19.5 38.76 14.9 45.66 18.7 37.56 13.0 38.06 15.5180 32.26 12.5 41.56 16.9 36.96 18.2 30.76 20.3 36.06 11.1240 25.46 11.6 27.86 13.2 24.86 5.9 26.26 10.4 22.56 5.2
Glycine0 238.06 58.4 222.06 43.2 225.36 39.1 228.46 43.7 245.06 44.3
30 250.26 74.6 269.66 59.0 255.56 55.4 254.76 57.5 279.16 69.460 261.86 63.7 270.96 57.6 268.96 73.1 279.56 64.9 311.06 70.090 266.56 75.2 260.16 61.2 279.66 72.2 280.16 68.1 312.56 73.8
120 241.66 70.5ab 239.26 54.7a 293.36 80.1b 282.36 66.0ab 291.06 69.1b
180 217.06 70.3 214.76 58.4 260.76 71.1 257.26 58.6 242.06 48.2240 194.96 59.1 193.06 53.6 238.26 65.2 221.96 50.3 224.36 43.3
* Values were calculated by subtracting the mean plasma levels (n 5 2) from those obtained before ingesting the test meal. At a given time, valuesnot sharing the same letter are significantly different (P , 0.05).
1040 Boza et al. Nutrition Volume 16, Numbers 11/12, 2000
the protein efficiency ratio was 2.04 versus 3.48 obtained withcasein, both assayed at a level of 10% protein. He also showed thatheat treatment (121°C for 30 min) of carob germ was adequate toinactivate proteolytic inhibitors. Thus, the protein efficiency ratioincreased to 2.95 in rats fed a diet containing carob after it hadbeen treated with heat. However, in the present study, plasma
amino-acid appearance was similar among the three carob proteinpreparations, despite differences in trypsine inhibitor content.
Under physiologic conditions, the small intestine exhibits ahigh net glutamine utilization in many species, including human,exceeding that of all other organs measured.14 Apart from beingthe main respiratory fuel for enterocytes and for the immune cellsassociated to the intestine, glutamine acts as the nitrogen donor forthe de novo synthesis of purine and pyrimidine nucleotides andcontributes to the maintenance of the mucosal barrier.15 Glutamineis made available in the lumen of the intestine from the digestionof food protein. Human studies, using stable-isotope approaches,have demonstrated that approximately 50% of dietary glutamine isretained in the splanchnic tissues (small intestine and the liver),suggesting that the absorptive cells of the small intestine would,therefore, use a great portion of the glutamine coming from thediet.7 These investigators have shown that the response of humanvolunteers to exogenous glutamine delivery includes a dramaticincrease in rates of first-pass glutamine extraction and an increasein glutamine oxidation, presumably in the splanchnic bed. Like-wise, it has been shown that exogenous glutamine is able tomodulate whole-body glutamine metabolism. In fact, Hankard etal.16 indicated that enteral glutamine inhibits glutamine de novosynthesis in human volunteers and is associated with an increase inestimates of whole-body protein synthesis, without affecting glu-tamine release from endogenous body protein. Unfortunately, allthese studies were performed with free glutamine, and the plasmaglutamine response to enteral administration of protein-bound glu-tamine and its splanchnic extraction remains undetermined. More-over, the fact that two different protein sources were used in thepresent study (carob and caseinate) and that they had completelydifferent essential amino-acid profiles could have affected proteinkinetics in terms of protein synthesis and protein breakdown. Thislatter variable directly affects the quantity of glutamine releasedfrom protein breakdown and, hence, to the plasma glutamine flux.
Another possible explanation for the lower plasma glutamineresponse in volunteers receiving any of the carob preparations isthe high arginine content of carob proteins compared with that ofcaseinate. We recently showed that arginine supplementation ofwhey proteins leads to a decrease in plasma and tissue (muscle andliver) glutamine concentrations in healthy growing rats because ofa decrease in the de novo synthesis of glutamine.17 Whether this
FIG. 1. Average plasma threonine and glutamine concentrations afteringestion of the five different protein preparations.
TABLE V.
AVERAGE PLASMA INSULIN AND GLUCOSE CONCENTRATIONS AFTER INGESTION OF THE FIVE DIFFERENT PROTEINPREPARATIONS (MEAN6 SD) (N 5 8)
Time (min) CaseinateCaseinate1glutamine Carob
Carobconcentrate
Carobhydrolysate
Insulin (mU/L)0 8.96 1.6 7.96 2.2 7.56 1.2 8.36 3.6 8.86 2.1
30 119.06 70.6 129.36 76.2 55.46 40.7 94.56 95.1 76.56 86.260 74.96 38.8 73.46 55.4 39.46 30.2 37.56 19.2 57.96 46.990 69.56 40.8 63.16 47.4 25.46 7.3 25.06 14.7 45.46 34.7
120 47.56 37.9 39.96 20.2 19.86 7.1 24.96 14.3 17.86 6.9180 10.16 3.1 10.66 2.5 10.16 3.3 11.86 5.7 8.76 2.6240 7.46 1.4 6.96 2.6 8.16 1.9 6.96 1.8 6.96 1.7
Glucose (mmol/L)0 5.16 0.4 4.96 0.3 4.76 0.3 4.96 0.3 4.86 0.7
30 6.26 1.0 5.76 2.0 6.06 1.1 6.16 1.0 6.36 1.160 4.66 0.9 5.96 1.4 5.66 1.9 4.56 0.9 4.56 1.090 4.66 0.6 4.96 1.0 5.06 1.2 4.36 0.3 4.56 0.2
120 4.56 0.6 4.86 0.7 4.86 0.9 4.16 0.8 5.06 0.5180 4.56 0.4 4.76 0.6 4.76 0.6 4.26 0.6 5.06 0.3240 4.76 0.4 4.66 0.5 5.06 0.2 4.66 0.4 4.96 0.3
Nutrition Volume 16, Numbers 11/12, 2000 1041Plasma Glutamine Response to Glutamine Administration
effect is unique to rats remains to be determined. The design of thepresent study cannot draw any conclusion about the importance ofall these factors in the plasma glutamine response to exogenousadministration of protein-bound glutamine. Stable-isotope ap-proaches (use of intrinsically labeled15N or 13C proteins) areurgently needed to study the metabolic fate of the glutaminenaturally present in food proteins. We are currently investigatingthis issue in detail.
Plasma insulin levels observed in volunteers after ingestion ofcaseinate-based drinks were slightly higher (but not significantbecause of the high variability across volunteers) than those ob-tained when carob-based preparations were offered. This observa-tion would also support the idea of a lower digestibility of carobproteins in human volunteers. Preparations were prepared to matchthe carbohydrate content. Only the protein source was different.Thus, differences in insulin release to plasma can only be ex-plained based on the different protein source and, more specifi-cally, on the postprandial plasma amino-acid concentrations. Thepresence of higher amounts of plasma amino acids in volunteersafter receiving the caseinate test meals compared with those afterreceiving the carob test meals could result in a higher insulinrelease in plasma. However, not all amino acids have the sameeffect on the secretion of insulin. There is evidence that lysine,leucine, and phenylalanine have a potent stimulating effect oninsulin release.18 Caseinate is richer than carob proteins in all thesethree amino acids and, hence, could trigger higher insulin responsethan could carob proteins. Arginine also has a stimulating effect oninsulin release, but this stimulation is more effective for glucagonrelease and, hence, the effects produced by insulin are counter-acted by glucagon.
SUMMARY
The bioavailability of exogenous glutamine in humans was inves-tigated in human volunteers. The presence of glutamine in plasmawas higher when free glutamine was added to caseinate than whenit was offered 100% bound to proteins (carob proteins).
ACKNOWLEDGMENTS
The authors thank I. Bartholdi for performing the study at themeta-bolic unit of NestleResearch Center, P.A. Finot and C. Garcı´a-
Rodenas for helpful discussion, and D. Moe¨nnoz, J. Vuichoud,A. Jarret, E. Duruz, and C. Murset for technical assistance.
REFERENCES
1. Elia M, Lunn PG. The use of glutamine in the treatment of gastrointestinaldisorders in man. Nutrition 1997;13:743
2. Dechelotte P, Darmaun D, Rongier M, et al. Absorption and metabolic effects ofenterally administered glutamine in humans. Am J Physiol 1991;260:G677
3. Hammarqvist F, Wernerman J. Glutamine in surgical nutrition and metabo-lism. In: Lafiti R, ed.Amino acids in critical care and cancer. RG Landes Co.,Georgetown 1994:27
4. Newsholme EA, Calder PC. The proposed role of glutamine in some cells of theimmune system and speculative consequences for the whole animal. Nutrition1997;13:728
5. Souba WW. Glutamine: a key substrate for the splanchnic bed. Annu Rev Nutr1991;11:285
6. Calder PC. Glutamine and the immune system. Clin Nutr 1994;13:27. Hankard RG, Darmaun D, Sager BK, et al. Response of glutamine metabolism to
exogenous glutamine in humans. Am J Physiol 1995;269:E6638. Matthews DE, Marano MA, Campbell RG. Splanchnic bed utilization of glu-
tamine and glutamic acid in humans. Am J Physiol 1993;264:E8489. Lacey JM, Wilmore WW. Is glutamine a conditionally essential amino acid? Nutr
Rev 1990;48:29710. Irvine GB, Shaw C. High-performance gel permeation chromatography of pro-
teins and peptides on columns of TSK-G2000-SW and TSK-G3000-SW: avolatile solvent giving separation based on charge and size of polypeptides. AnalBiochem 1986;155:141
11. Boza JJ, Moe¨nnoz D, Vuichoud J, et al. Food restriction and refeeding influencegrowth, nutrient retention and functional recovery of rats. J Nutr 1999;129:1340
12. Tsai AC, Peng B. Effects of locust bean gum on glucose tolerance, sugardigestion and gastric motility in rats. J Nutr 1981;111:2152
13. Low AG. Nutritional regulation of gastric secretion, digestion and emptying. NutrRes Rev 1990;3:229
14. Hartmann F, Raible A, Plauth M, Bauder D, Vieillard-Baron D. Glutamine-dependance of rat enterocyte functions as assessed in cell cultures. Clin Nutr1991;10:125
15. McCauley R, Kong SE, Hall J. Glutamine and nucleotide metabolism withinenterocytes. J Parenter Enteral Nutr 1998;22:105
16. Hankard RG, Haymond MW, Darmaun D. Effect of enteral glutamine on glu-tamine and leucine metabolism in humans. Clin Nutr 1996;15:84
17. Boza JJ, Moe¨nnoz D, Jarret A, et al. Neither glutamine nor arginine supplemen-tation of diets increase glutamine body stores in healthy growing rats. Clin Nutr2000(in press)
18. Sanchez A, Hubbard RW. Plasma amino acids and the insulin/glucagon ratio asan explanation for the dietary protein modulation of atherosclerosis. Med Hypoth1991;35:324
(For an additional perspective, see Editorial Opinions)
1042 Boza et al. Nutrition Volume 16, Numbers 11/12, 2000