Embed Size (px)
Citation preview
Plantation Forestry in the South West Slopes Region (NSW)
Presentation by
Christopher Adams
General Manager
Tumut Shire Council

Tumut Shire Statistics
• Area 4600sq km• Population 11500• Towns are Tumut, Batlow, Adelong,
Talbingo, Cabramurra, Brungle• Council budget in 2006/07 $30M. • Economy based on plantation timber,
power, water, horticulture, tourism, sheep/cattle
• 62.3% of the Shire is non rateable

Overview of the Plantation Industry
• Mainly Pinus Radiata• 116,300 hectares on SW Slopes• 62,500ha Murray region of Victoria • 74% publicly owned, 26% privately owned• Plantations in Tumut, Tumbarumba, Greater Hume and
Gundagai Shires• Processing centres in Tumut, Wagga Wagga,
Tumbarumba, Albury. Only fully integrated timber industry in Australia.
• Direct employment – 1680 jobs• Indirect jobs – 3,250


Processors
• Tumut – Visy (paper), Weyerhaeuser (sawn timber), Carter Holt Harvey (panels)
• Tumbarumba – Hyne (sawn timber)
• Wagga Wagga – Ausply (ply and laminated beams)
• Albury – Norske Skog (newsprint)

Areas of Softwood Plantation in 2004
0
5,000
10,000
15,000
20,000
25,000
30,000
35,000
40,000
45,000
50,000
Source: Bureau of Rural Sciences, National Forest Inventory
Are
a o
f P
lan
tati
on
(h
ec
tare
s)

Volume of timber transported in the SWS (‘000 tonnes or cubic metres)
1991 2001 2006 est.
Logs 1,000 2,050 2,455
Wood products and residue
710 1,612 1,966
Total 1,710 3,662 4,411
Note: includes a small proportion of native forest timber
Source: PEECE Consulting (2005)

Employment
• Has remained relatively steady, despite increases in production
• Over 95% full time employment• 5% part time or casual• 2003 – 2004, 66% direct employment • 90% of direct jobs in the region• Tumut – over 900 jobs• Tumbarumba – over 200 jobs• One new job in region for every 63ha of new
plantation

Socioeconomic Change and the Plantation Industry
-20
-15
-10
-5
0
5
Source: Australian Bureau of Statistics
% c
han
ge
in p
op
ula
tio
n o
f to
wn
, 19
96 t
o 2
001

Socio-Demographic Change and the Plantation Industry
• Small towns with strong timber presence had higher population growth
• Stronger growth in working age population
• More consistent growth in household income
• Communities were becoming more highly qualified

Forest Production Vs other Agricultural Production
• Plantation Pine 20 t/ha/a• Plantation hardwood 22 t/ha/a• Rice (irrigated) 9 t/ha/a• Wheat (dryland) 5 t/ha/a• Apples 25 t/ha/a• Grapes 15 t/ha/a• Milk 14 t/ha/a• Sheep 0.7t/ha/a• Cattle 0.75t/ha/a

Production from hypothetical 1000 ha plantation
• First thinning, age 13 years 132,000t all pulpwood
• Second thinning, age 23 years, 165,000t mix of pulp wood and sawlog
• Harvest, age 33 years, 363,000t, mainly sawlog
• Total production from plantation 660,000t
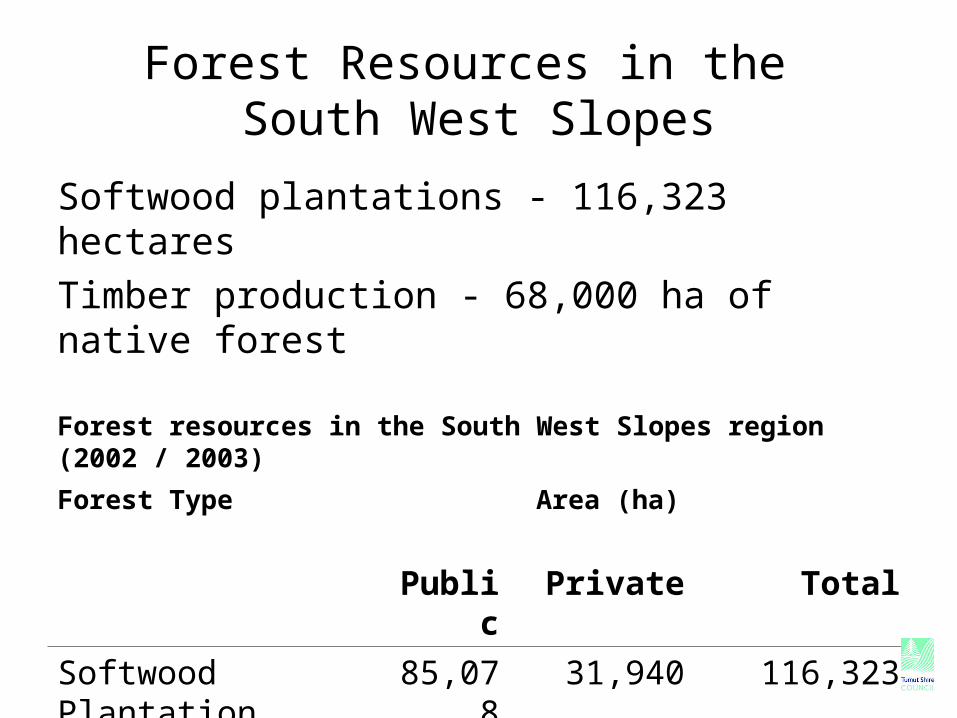
Forest Resources in the South West Slopes
Softwood plantations - 116,323 hectares
Timber production - 68,000 ha of native forest
Forest resources in the South West Slopes region (2002 / 2003)
Forest Type Area (ha)
Public Private Total
Softwood Plantation 85,078 31,940 116,323
Native forest 68,256 0 68,256

Forest Product Processing in the South West Slopes Region
Direct and indirect economic impacts of the forest sector in the South West Slopes (2002 /2003)Sector Value of production
($ million)
Employment
(number)
Direct Indirect Direct Indirect
Plantation Softwood 574.47 1,148.95 1,748 3,496
Native Forest 8.65 17.31 80 160
Total 583.13 1,166.25 1,828 3,656

Resource Utilisation (present)
South West Slopes:• Total of 1.87 million m3 forest resources• 964,450 m3 of sawlogs • 907,000 m3 pulpwoodOutside Region• 266,750 m3 of sawlogs and pulpwood and• 87,250 m3 of sawmill residues

Current and Planned Investment in Wood Processing
Current raw material intake
Future raw material intake
Value of future investments
($M)
Sawlog (’000m3)
Hyne & Son 450 1,054 $127
Weyerhaeuser 530 650 $40
Woodchip (’000m3)
Norske Skog 320 384 $130
Visy 795 2,000 $460

Regional Plantation Development
• Availability of softwood resources expected to be inadequate to meet the demand for wood resources
• New plantings required of 2,500 – 3,500 ha over the next 10 – 15 years across public and privately owned plantations
• Plantation owners: Forests NSW, Willmotts, Gunns, Hume Forests
Future Timber Demand
• Vision 2020 – trebling of Australias plantation timber resource by 2020
• Current softwood supply 8M cu m rising to 10 M cu m by 2020
• Domestic demand is expected to be 12 M cu m by 2020.
• Shortfall met by imports

Asia/Pacific Demand for Timber Products
• Paper products increasing at 3.8% pa
• Panels increasing at 3.1% pa
• Sawn timber increasing at 1% pa

Asia/Pacific Supply
• Currently a 21M cu m shortfall in production
• Deforestation occurring at 3.9 to 4.5 M ha pa
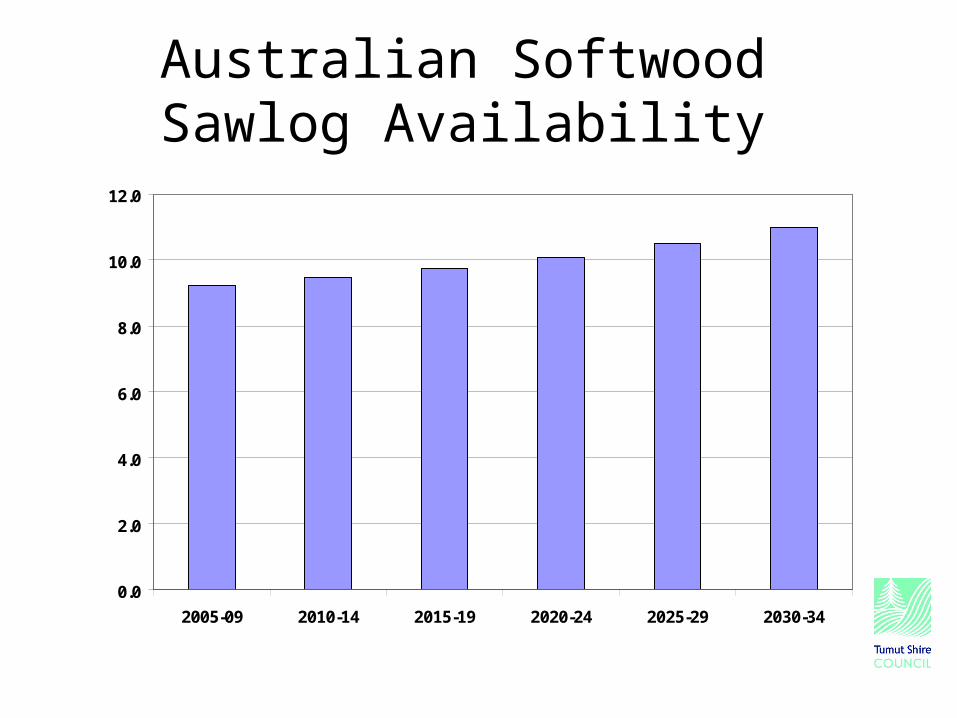
Australian Softwood Sawlog Availability
0.0
2.0
4.0
6.0
8.0
10.0
12.0
2005-09 2010-14 2015-19 2020-24 2025-29 2030-34

Projected Softwood Timber Consumption
-
1,000,000
2,000,000
3,000,000
4,000,000
5,000,000
6,000,000
7,000,000
2002
2005
2008
2011
2014
2017
2020
2023
2026
2029
2032
2035
2038
2041
2044
2047
2050
M3
Series A - Consumption Series B - Consumption Domestic Capacity
One Radiata Pine Rotation
Other Future Changes?
• Climate change
• Carbon trading/sequestration
• Salt credits
• Mass limits on transport vehicles
• Configurations of transport vehicles

Strategic Road Network
#
##
#
##
##
#
#
#
#
#
#
#
##
#
#
#
Tumut
Gundagai
Henty
Batlow
AdelongTarcutta
Talbingo
Holbrook
Khancoban
Tumbarumba
Lake Hume
J ingellic
Wagga Wagga
Albury
Rosewood
Hume
High
way
Olym
pic W
ay
Snowy Mountains
Highway
Hume Highway
BloweringDam
TantangaraReservoir
Murray River
20 0 20 40 60 80 100 Kilometres
NState Roads
Regional Roads
Roads - Unclassified
River
Plantations & Native Forest
Nat. Park, Nat. Reserve etc
Figure 1.1Strategic Road Network
N
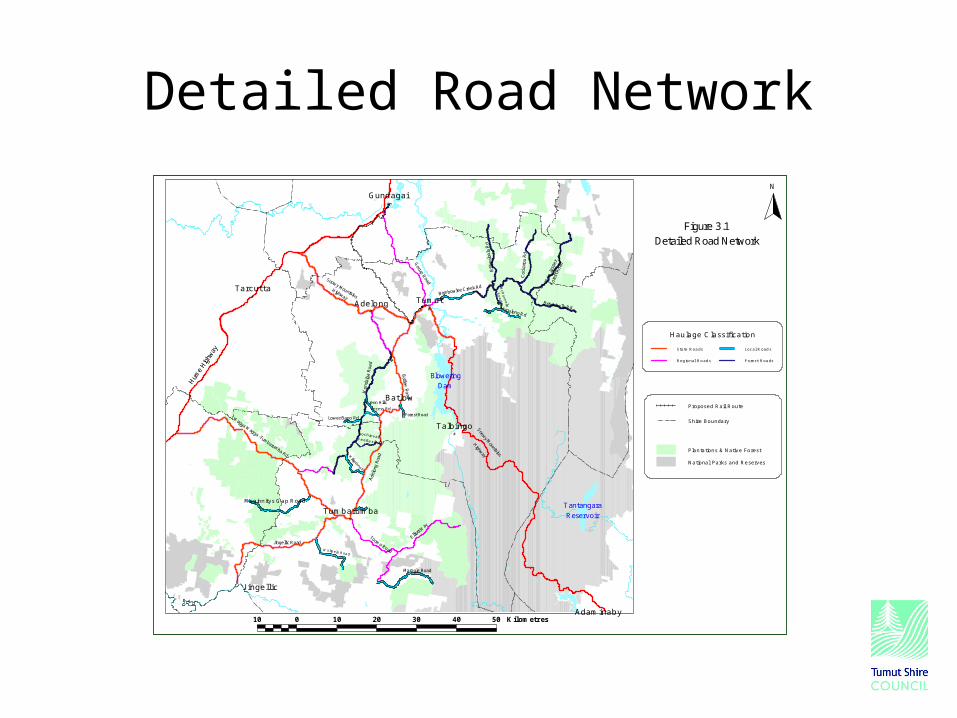
Detailed Road Network
Figure 3.1Detailed Road Network
N
10 0 10 20 30 40 50 Kilometres
State Roads
Regional Roads
Local Roads
Forest Roads
Haulage Classification
#
#
##
#
#
#
BloweringDam
TantangaraReservoir
Jingellic Road
Bat low Ro ad
Adelo
ng R
oad
Snowy Mountains
Highway
Wagga Wagga -Tumbarumba Rd
Won
dalga
Roa
d
Elliott W
ay
Tooma Road
Maragle Road
Argalong Rd
Bombowlee Creek Rd
Gocup Road
Billap
aloola
Rd
Wee J
aspe
r Fo
rest R
oad
Coc k
a too R
d
Brindabella Rd
Snowy Mountains
Highway
Lower Bago Rd
Walteela Road
Willigobung Rd
Forest Road
Green Hills Access Rd
McD
onnells
Roa
d
Lochinvar Feeder Rd
Maginnitys Gap Road
Tumut
Batlow
Adelong
Gundagai
Tarcutta
Talbingo
Adaminaby
Tumbarumba
J ingellic
Hume
High
way
Proposed Rail Route
Shire Boundary
Plantations & Native Forest
National Parks and Reserves

Transport Impact of Visy’s Expansion Plans
Tonnage, tonnes per annum
Loaded B-double trips per annum
Stage
Tumut to Gundagai
Gundagai to Tumut
Tumut to Gundagai
Gundagai to Tumut
Current 52,000 148,000 1,486 4,229
Redirection of export to Sydney
202,000 148,000 5,771 4,229
Stage 2 Development
450,000 838,000 13,771 23,943

Actions to Date
• Softwoods Working Party been going for over 20 years – log haul strategies, socio economic studies, economic studies of transport routes.
• Roads to Recovery applications for projects across the region
• Lobbying - $5M from Feds in 1999; $4M from State in 2003
• Auslink application for reopening of Rail• Seats membership?