Embed Size (px)
Citation preview
Plant Seed Species Identification from Chemical Fingerprints: A High-Throughput Application of Direct Analysis in Real Time MassSpectrometryAshton D. Lesiak,† Robert B. Cody,‡ A. John Dane,‡ and Rabi A. Musah*,†
†Department of Chemistry, University at Albany, State University of New York, 1400 Washington Avenue, Albany, New York 12222,United States‡JEOL USA Inc., 11 Dearborn Road, Peabody, Massachusetts 01960, United States
*S Supporting Information
ABSTRACT: Plant species identification based on the morphological featuresof plant parts is a well-established science in botany. However, speciesidentification from seeds has largely been unexplored, despite the fact that theseeds contain all of the genetic information that distinguishes one plant fromanother. Using seeds of genus Datura plants, we show here that the massspectrum-derived chemical fingerprints for seeds of the same species are similar.On the other hand, seeds from different species within the same genus displaydistinct chemical signatures, even though they may contain similar characteristicbiomarkers. The intraspecies chemical signature similarities on the one hand,and interspecies fingerprint differences on the other, can be processed bymultivariate statistical analysis methods to enable rapid species-levelidentification and differentiation. The chemical fingerprints can be acquiredrapidly and in a high-throughput manner by direct analysis in real time massspectrometry (DART-MS) analysis of the seeds in their native form, without useof a solvent extract. Importantly, knowledge of the identity of the detected molecules is not required for species levelidentification. However, confirmation of the presence within the seeds of various characteristic tropane and other alkaloids,including atropine, scopolamine, scopoline, tropine, tropinone, and tyramine, was accomplished by comparison of the in-sourcecollision-induced dissociation (CID) fragmentation patterns of authentic standards, to the fragmentation patterns observed in theseeds when analyzed under similar in-source CID conditions. The advantages, applications, and implications of the chemometricprocessing of DART-MS derived seed chemical signatures for species level identification and differentiation are discussed.
Plant seeds are not only a receptacle for a unique genomethat distinguishes the embryonic plant from every other
plant species but also a reservoir for a tailored mix of thenutrients required to support plant germination and earlygrowth for the particular species. The outward manifestation ofthe genomic and nutrient requirement distinctions betweenseeds of individual species takes the form of differences inchemical profiles. As such, seeds would be expected to exhibit ametabolome that is similar for plants within the same species,but different between species. Furthermore, unlike themetabolic profile of the organs in a germinated plant thatreflect significant real-time fluctuations in gene expression, andwhich in turn introduce small-molecule fingerprint variations,such gene expression variations may occur to a much lowerextent in seeds that are not undergoing germination. Thiswould be expected to result in much less variability in thechemical signatures of seeds of the same species whencompared to what would be observed in examinations ofplant aerial parts or roots. Therefore, seed metabolomefingerprinting and profiling potentially present useful, largelyunexploited opportunities in several areas, including seedspecies identification, assessment of seed development stages,
and determination of seed exposure to pests, disease, orchemical agents. However, relatively few seed metabolomestudies have been reported, in contrast to proteomicsinvestigations. Those that have appeared focus by and largeon agriculturally important food crops and include: (1)investigations of metabolite variations among cultivars withina single species;1−3 (2) the monitoring of plant biosynthesisreactions in developing and germinating seeds;4−6 (3)identification and quantification of medicinal natural productssuch as glucosinolates;7 and (4) assessment of small-moleculebiomarker variations in seeds in response to geneticmanipulation.8−10 Seed metabolome profiling has also beenexploited in forensics applications, such as in the identificationof cannabis seeds.11
The steps associated with most seed metabolome determi-nation studies begin with solvent extraction. Depending on theprofile of compounds known or expected to be present, the
Received: April 28, 2015Accepted: August 3, 2015
Article
pubs.acs.org/ac
© XXXX American Chemical Society A DOI: 10.1021/acs.analchem.5b01611Anal. Chem. XXXX, XXX, XXX−XXX
extract may be subjected to further treatment such as theaddition of derivatizing agents to enhance the volatility ofanalytes and pH adjustments followed by filtration to removeconstituents whose presence is incompatible with subsequentanalysis steps. The resulting solution is then subjected toanalysis by a spectroscopic method which may or may not behyphenated (e.g., NMR, Raman, IR, LC-FT-IR, LC-NMR)and/or a hyphenated mass spectrometric method [e.g., GC/MS, LC-MS, and capillary electrophoresis mass spectrometry(CE-MS) among others]. GC/MS and the hyphenatedmethods offer the advantage that complex mixtures can beseparated into constituent components that can then beanalyzed structurally to obtain more definitive informationabout specific compounds. Whatever the method used, theobserved metabolome fingerprint can be processed by variousmultivariate statistical methods to gain insights into a variety ofprocesses and their interrelatedness. The experimentalprotocols associated with acquisition of metabolite fingerprintsby these conventional methods can be tedious and time-consuming, particularly with regard to sample preparation.Furthermore, extraction solvent choice is extremely importantbecause the differential uptake of compounds by the solventinfluences the profile of molecules detected. An additionalchallenge is that chemometric processing of the metabolomeprofile/fingerprint is hampered by the large number ofreplicates required to assess statistical significance, coupledwith the considerable time that is necessary to acquire asufficient number of them.One way to circumvent the aforementioned bottlenecks
associated with metabolic profiling by conventional methods isto use the solvent-free approach afforded by direct analysis inreal time mass spectrometry (DART-MS). By this ambientionization MS method, solids, liquids, or gases can be analyzeddirectly by exposing them to the open air space between themass spectrometer inlet and the ion source.12 A mass spectrumis acquired instantly, which provides high-throughput oppor-tunities. The technique has been demonstrated to detect arange of both polar and nonpolar analytes in complex matricesincluding plant material of various forms.12−15 Thus, analysis bythis method has been demonstrated to provide chemicalfingerprints that can be subjected to analysis by multivariatestatistical methods. For example, statistical analysis of DART-MS derived fingerprints has been used to distinguish betweenwood types,13 identify the country of origin of medicinalplants,16 distinguish between organic and conventional farmingmethods in the cultivation of economically important crops,17
and differentiate between propolis of various origins.18
In our ongoing work on the development of methods thatcan be used to rapidly identify plant species, we sought todetermine whether the DART-MS-derived chemical profile ofseeds could be used to differentiate between plant specieswithin the same genus. For the study, we selected Datura seedsas a convenient example of a genus that contains a finitenumber of species most of which are available from commercialsources, namely, D. ceratocaula, D. discolor, D. ferox, D. inoxia,D. leichhardtii, D. metel, D. quercifolia, D. stramonium, and D.wrightii. Datura spp. are important in horticulture asornamentals. Plants of this genus also contain toxichallucinogens including scopolamine and atropine. Historically,the seeds and aerial plant parts have been used in ceremonialrituals to induce mind-altering effects. It is often difficult toidentify Datura species because not only are the plants similarin appearance but also their morphological features often
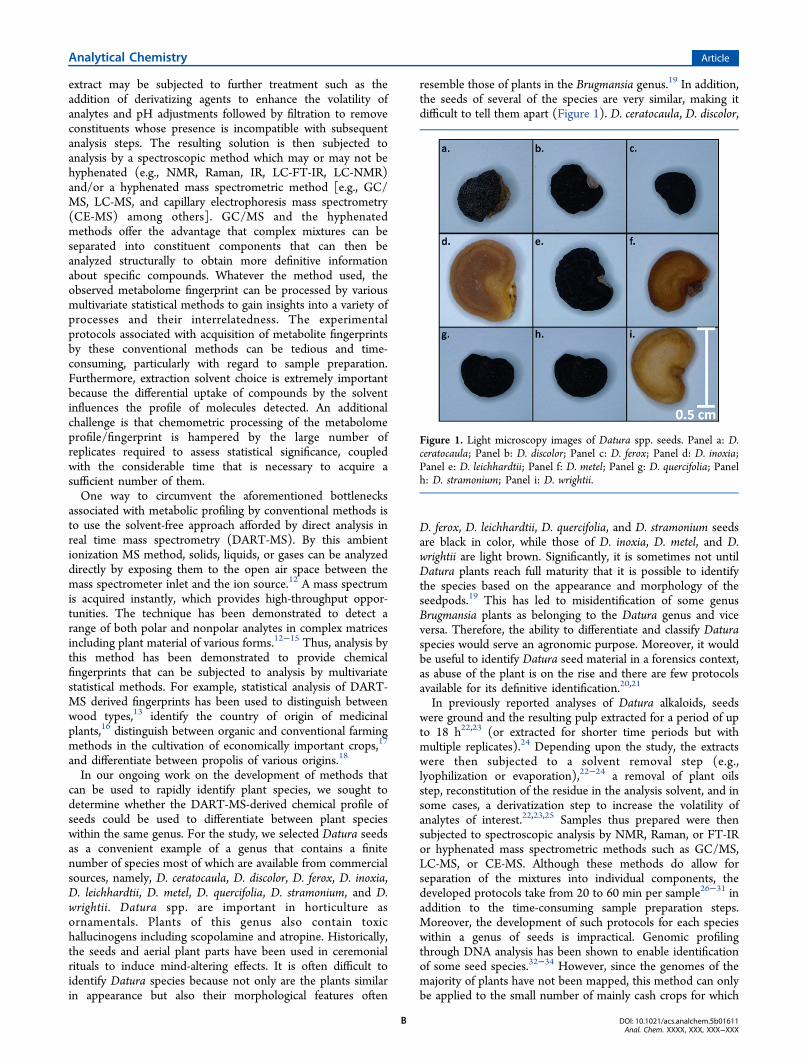
resemble those of plants in the Brugmansia genus.19 In addition,the seeds of several of the species are very similar, making itdifficult to tell them apart (Figure 1). D. ceratocaula, D. discolor,
D. ferox, D. leichhardtii, D. quercifolia, and D. stramonium seedsare black in color, while those of D. inoxia, D. metel, and D.wrightii are light brown. Significantly, it is sometimes not untilDatura plants reach full maturity that it is possible to identifythe species based on the appearance and morphology of theseedpods.19 This has led to misidentification of some genusBrugmansia plants as belonging to the Datura genus and viceversa. Therefore, the ability to differentiate and classify Daturaspecies would serve an agronomic purpose. Moreover, it wouldbe useful to identify Datura seed material in a forensics context,as abuse of the plant is on the rise and there are few protocolsavailable for its definitive identification.20,21
In previously reported analyses of Datura alkaloids, seedswere ground and the resulting pulp extracted for a period of upto 18 h22,23 (or extracted for shorter time periods but withmultiple replicates).24 Depending upon the study, the extractswere then subjected to a solvent removal step (e.g.,lyophilization or evaporation),22−24 a removal of plant oilsstep, reconstitution of the residue in the analysis solvent, and insome cases, a derivatization step to increase the volatility ofanalytes of interest.22,23,25 Samples thus prepared were thensubjected to spectroscopic analysis by NMR, Raman, or FT-IRor hyphenated mass spectrometric methods such as GC/MS,LC-MS, or CE-MS. Although these methods do allow forseparation of the mixtures into individual components, thedeveloped protocols take from 20 to 60 min per sample26−31 inaddition to the time-consuming sample preparation steps.Moreover, the development of such protocols for each specieswithin a genus of seeds is impractical. Genomic profilingthrough DNA analysis has been shown to enable identificationof some seed species.32−34 However, since the genomes of themajority of plants have not been mapped, this method can onlybe applied to the small number of mainly cash crops for which
Figure 1. Light microscopy images of Datura spp. seeds. Panel a: D.ceratocaula; Panel b: D. discolor; Panel c: D. ferox; Panel d: D. inoxia;Panel e: D. leichhardtii; Panel f: D. metel; Panel g: D. quercifolia; Panelh: D. stramonium; Panel i: D. wrightii.
Analytical Chemistry Article
DOI: 10.1021/acs.analchem.5b01611Anal. Chem. XXXX, XXX, XXX−XXX
B
gene sequence information is available (e.g., cereal grains andsome vegetables).32−42
In this report, we describe the results of our investigationinto whether DART-MS analysis could provide diagnostic
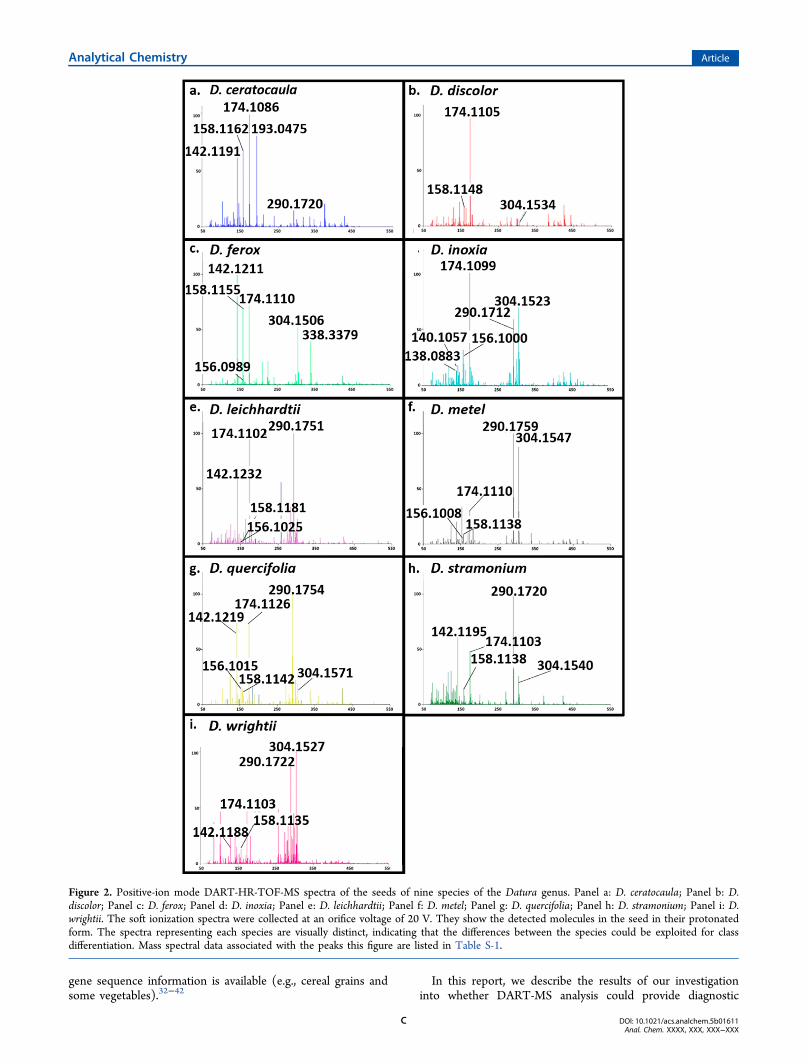
Figure 2. Positive-ion mode DART-HR-TOF-MS spectra of the seeds of nine species of the Datura genus. Panel a: D. ceratocaula; Panel b: D.discolor; Panel c: D. ferox; Panel d: D. inoxia; Panel e: D. leichhardtii; Panel f: D. metel; Panel g: D. quercifolia; Panel h: D. stramonium; Panel i: D.wrightii. The soft ionization spectra were collected at an orifice voltage of 20 V. They show the detected molecules in the seed in their protonatedform. The spectra representing each species are visually distinct, indicating that the differences between the species could be exploited for classdifferentiation. Mass spectral data associated with the peaks this figure are listed in Table S-1.
Analytical Chemistry Article
DOI: 10.1021/acs.analchem.5b01611Anal. Chem. XXXX, XXX, XXX−XXX
C
fingerprint profiles of Datura species seeds and whetherchemometric processing of the observed profiles could enablespecies level identification and differentiation. We observe thatthe seeds can be analyzed by DART-MS directly in a high-throughput manner without the use of a solvent extract. Eachspecies exhibits a distinct chemical signature, and theprocessing of this data by multivariate statistical methodsenables species level differentiation. The results show thatchemical fingerprinting of seeds is a viable method for speciesidentification and differentiation. The protocol reported herecircumvents bottlenecks commonly encountered in metab-olome and fingerprint profiling investigations conducted byconventional methods.
■ EXPERIMENTAL SECTIONSeed Materials. When possible, seeds of a given species
were acquired from multiple vendors. Thus, nine species ofDatura seeds were purchased from a variety of vendors. D.ceratocaula, D. discolor, D. inoxia, D. leichhardtii, D. stramonium,and D. wrightii seeds were purchased from J.L. Hudson,Seedsman (La Honda, CA, USA). D. ceratocaula, D. ferox, D.inoxia, D. metel, D. stramonium, and D. wrightii seeds werepurchased from Georgia Vines (Claxton, GA, USA). D.ceratocaula, D. discolor, and D. ferox seeds were purchasedfrom World Seed Supply (Mastic Beach, NY, USA). D. inoxiaand D. stramonium seeds were purchased from Horizon Herbs(Williams, OR, USA). D. quercifolia seeds were purchased fromHirts Gardens (Medina, OH, USA).Standards. Atropine, scopolamine, tropinone, and tyramine
standards were purchased from Sigma-Aldrich (St. Louis MO,USA). Scopoline was purchased from AK Scientific (UnionCity, CA, USA), and tropinone was purchased from Alfa Aesar(Ward Hill, MA, USA).Microscopic Imaging. Datura spp. seeds were viewed
using a Nikon stereozoom SMZ800 microscope that wasequipped with a Nikon DS Fi2 microscope camera.Vacuum Tweezer Apparatus. A vacuum tweezer
apparatus was used to hold each analyzed seed half in theopen air gap between the mass spectrometer inlet and theDART ion source (Figure S-1). The tweezer was formed asfollows: a Wiretrol II disposable pipet capillary tube open atboth ends (Drummond Scientific, Broomall, PA) was insertedinto the smallest opening of a 200 μL Fisherbrand RediTippipet tip (Fisher Scientific, Ontario, Canada), and a flame wasapplied briefly to the tapered end of the plastic tip in order forthe melted plastic to form an airtight seal around the capillary.The opposite open end of the pipet tip was then attached toone end of a high temperature silicone rubber tube (1/4 in.inner diameter, 1/2 in. outer diameter) (McMaster-Carr,Robbinsville, NJ, USA), and the opposite end of the tubewas connected to an MZ 2 diaphragm vacuum pump(Vacuubrand, Wertheim, Germany). Turning on the vacuumpump created suction in the capillary tube, which was thenapplied to the seed half to hold it steadily at the MS inlet duringanalysis. More than 100 seeds could be sampled per hour usingthe vacuum tweezer apparatus.Mass Spectral Data Collection and Analysis. Mass
spectra were acquired using a DART-SVP ion source(IonSense, Saugus, MA, USA) coupled to a JEOL AccuTOFtime-of-flight mass spectrometer (JEOL USA, Peabody, MA,USA) in positive ion mode. The DART ion source parameterswere: grid voltage, 250 V; gas heater temperature, 350 °C.Unless otherwise indicated, the mass spectrometer settings
were: ring lens voltage, 5 V; orifice 1 voltage, 20 V; orifice 2voltage, 5 V; peak voltage 600 V. Spectra were obtained overthe mass range of m/z 60−800 at 1 spectrum per s. The heliumflow rate for the DART source was 2.0 L s−1. The resolvingpower of the mass spectrometer was 6000 fwhm.Individual seeds of Datura species were sliced in half and
sampled directly by gripping each sample with the vacuumtweezer apparatus (Figure S-1) and suspending the seedbetween the ion source and mass spectrometer inlet. Thisyielded the results presented in Figure 2. Each of the spectrashown is an average of three seed spectra (each one from adifferent vendor), except in the cases of D. leichhardtii, D. metel,and D. quercifolia, where seeds were available from only onevendor. For these species, three spectra from the single vendorwere averaged. Seed extracts were prepared by slicing a seed inhalf and suspending both halves in 50 μL of solvent andsonicating for 30 min. Solvents used were hexane, ethyl acetate,dichloromethane, ethanol, and water. A 1:1:1 mixture of ethylacetate, ethanol, and water was also used. Extracts were testeddirectly by dipping the closed end of a melting point capillarytube into the extract and suspending the coated surface of thetube between the DART ion source and the mass spectrometerinlet.In-source collision-induced dissociation (CID) was per-
formed on seed material and standards by using “functionswitching”, which permits the simultaneous acquisition of bothlow orifice voltage and high orifice voltage mass spectra. Toaccomplish this, the orifice 1 voltage was varied from 20 to 30,60, and 90 V, with the extent of fragmentation increasing withincreasing voltage.43,44 All other DART-SVP and AccuTOFparameters remained as described above. Chemical standardswere tested directly by dipping the closed end of a meltingpoint capillary tube into the pure standard and suspending thecoated surface of the tube between the DART ion source andthe mass spectrometer inlet. Seeds were analyzed in the mannerdescribed above.
Data Processing. Calibration, spectral averaging, back-ground subtraction, and peak centroiding were performed usingTSSPro3 (Shrader Analytical Laboratories, Detroit, MI, USA)data processing software. Mass Mountaineer software (Mass-spec-software.com, Toronto, Ontario, Canada) was used formass spectrum analysis, spectral elemental compositiondetermination, isotope analysis, and spectra addition, as wellas for linear discriminant analysis (LDA)-facilitated classifica-tion and discrimination. A threshold of 10% was used forreporting mass spectral data, except in the cases of the eightdiagnostic alkaloids for the Datura spp. (tyramine, tropinone,tropine, scopoline, dihydroxytropane, trihydroxytropane, atro-pine/hyoscyamine, and scopolamine), which were reportedusing a 2% threshold (Tables S-1 and S-12). The 10% thresholdwas used in order to reduce to an appropriate size (forreporting purposes) the large amount of mass spectral peakdata that were acquired (although all the spectra are shown).The normalized relative abundance values of the eightdiagnostic alkaloids were calculated and averaged across eachspecies. Relative standard deviation values were calculated fromthe averaged abundances and the standard deviation values ofthese alkaloids for each species. Mass calibration was performedusing polyethylene glycol (PEG 600) or Jeffamine M600(Huntsman, The Woodlands, TX). For readability, nominalmasses are listed throughout the text. Accurate masses arereported in the mass spectra and in the SupportingInformation.
Analytical Chemistry Article
DOI: 10.1021/acs.analchem.5b01611Anal. Chem. XXXX, XXX, XXX−XXX
D
■ RESULTS
DART-MS Analysis of Seeds. To determine the chemicalfingerprints of the seeds of various Datura spp., seedsrepresenting 9 species were analyzed by DART high resolutiontime-of-flight mass spectrometry (HR-TOF-MS). These wereD. ceratocaula, D. discolor, D. ferox, D. inoxia, D. leichhardtii, D.metel, D. quercifolia, D. stramonium, and D. wrightii. In everycase, 50 seeds were analyzed in positive-ion mode. To eliminatepotential bias associated with analysis of seeds that wereacquired from a single source, seeds of the same species wereacquired from as many vendors as were available. Each seed wascut in half, and the halves were sampled by suspending themusing a vacuum tweezer apparatus (described in theExperimental Section) in the open air space between theDART ion source and the mass spectrometer inlet, with thesliced end of the seed facing the ion source. Representativespectra obtained in each case are shown in Figure 2, and thecorresponding mass spectral data including measured andcalculated masses and relative peak abundances are presented inTable S-1. Each of the images in Panels a through i representsthe average of 3 spectra of a given species. The spectracontained from 52 to 117 peaks (using a 2% threshold relativeto the base peak) with D. quercifolia (Panel g) exhibiting thegreatest number of peaks and D. ferox the least (Panel c). Thepeaks observed in each spectrum represented the protonatedforms of the detected molecules.Visual inspection showed the fingerprint of each species to be
distinct. Nevertheless, all of the spectra exhibited peaks at m/zvalues having molecular formulas consistent with those ofseveral compounds that have been isolated from Datura species(Table S-2).20,22,45−47 Prominent among them were psycho-tropic amine biomarkers and other related compoundsincluding tyramine (m/z 138), tropinone (m/z 140), tropine(m/z 142), scopoline (m/z 156), dihydroxytropane (m/z 158),trihydroxytropane (m/z 174), scopoletine (m/z 193), andhydroxydiethyloxytropane (m/z 338). Also observed in everycase, except for D. discolor and D. ferox, was a peak at m/z 290corresponding to the formula C17N23NO3. This formula isconsistent with that of the psychotropic drug atropine, whichhas been identified in Datura spp. However, hyoscyamine,which is the enantiomer of atropine, has also been isolated fromDatura genus plants, and thus, it is not certain which of the twomolecules is represented. A peak at m/z 304, whichcorresponds to the molecular formula C17H21NO4, wasobserved in all species except D. ceratocaula and D. leichhardtii.The compound was tentatively identified as scopolamine/hyoscine. This also represents an enantiomeric pair, and bothmolecules have been isolated from Datura spp.22,46,48 Therelative abundances of the m/z values representing the varioustropane alkaloids observed for each species are presented inTable S-2.The data show that the relative proportions of these
biomarkers differed from species to species. Some speciesexhibited comparable levels of both atropine/hyoscyamine (m/z 290) and scopolamine/hyoscine (m/z 304) (i.e., D. ferox, D.inoxia, D. metel, and D. wrightii; Panels c, d, f, and i,respectively). Others had much higher levels of atropine/hyoscyamine than scopolamine/hyoscine (i.e., D. leichhardtii, D.quercifolia, and D. stramonium) (Panels e, g, and h).Scopolamine/hyoscine was most prominent in D. ferox, D.inoxia, and D. wrightii (Panels c, d, and i). In several species,various tropane alkaloids were prominent enough to be the
base peak (atropine/hyoscyamine in D. leichhardtii, D. metel, D.quercifolia, and D. stramonium (Panels e, f, g, and h);scopolamine/hyoscine in D. wrightii (Panel i; and trihydroxy-tropane in D. ceratocaula, D. discolor, and D. inoxia (Panels a, b,and d)). D. ceratocaula and D. discolor exhibited particularly lowlevels of atropine/hyoscyamine and scopolamine/hyoscinecompared to the other species analyzed (Panels a and b).
In-Source Collision-Induced Dissociation (CID) Experi-ments Confirmed the Identity of Various TropaneAlkaloids in Datura spp. DART-MS analysis is a softionization technique that results in the detection primarily ofprotonated molecules when conducted in positive ion mode ata low orifice voltage (e.g., 20 V). However, DART-MS can beconducted under in-source collision-induced dissociation(CID) conditions to yield fragmentation patterns that serveas a signature for the analyzed molecule. We exploited thistechnique to confirm the presence in Datura species ofalkaloids for which we had authentic standards. In-sourceCID was accomplished by increasing the orifice voltage duringthe analysis. In order to determine the optimal voltage at whichto conduct the in-source CID experiments, authentic standardsof atropine, scopolamine, scopoline, tropine, tropinone, andtyramine were analyzed by DART at orifice voltages of 20, 30,60, and 90 V. The 90 V condition was consistently observed toyield the best results (i.e., maximum fragmentation withretention of the protonated parent molecule peak). TheDART mass spectra of the seeds of each species were thendetermined at 90 V, and the spectrum in each case wascompared to the spectrum determined at 90 V for each of theavailable standards. Representative results are shown for D.metel in Figure S-2, and a list of the mass spectral dataassociated with each of the alkaloids whose presence in Daturaspp. seeds was confirmed appears in Table S-2. Each of thePanels a through f shows two in-source CID spectra renderedas head-to-tail plots. The top spectrum in each plot is that ofthe seed at 90 V, and the bottom spectrum is that of theindicated standard at 90 V. Thus, the results shown in Panel aillustrate that all of the atropine fragments observed from in-source CID of the atropine standard appear in the spectrum ofD. metel, thus confirming that the peak at m/z 290 representsatropine. A similar result was obtained for scopolamine, asshown in Figure S-2, Panel b. The 90 V spectrum of D. metelshows not only the parent scopolamine but also thescopolamine fragments, confirming that the peak at m/z 304is scopolamine. In Figure S-2, Panel c, the head-to-tail plotshows the 90 V spectrum of the D. metel seed on top and the 90V spectrum of scopoline on the bottom. The fragments at m/z138, 110, 94, and 67, as well as the protonated parent at m/z156, match in both the standard and the seed, confirming thepresence of scopoline in the seed material. Similarly, in Panel dof Figure S-2, the in-source CID spectrum of the seed showspeaks that match those of the tropine standard (at m/z 158,142, 124, 93, and 67). This confirmed the presence of tropinein D. metel seeds. Panel e shows the head-to-tail comparisonspectra of the D. metel seed and tropinone standard. Peaks atm/z 156, 140, and 82 in both the seed material and standardconfirm that tropinone is present in the seed. Tyramine wasconfirmed to be present in the D. metel seed through in-sourceCID analysis as well. In Panel f, the head-to-tail plot shows the90 V spectrum of Datura seed on top and the 90 V spectrum oftyramine on the bottom. The peaks at m/z 138, 121, 103, 91,77, and 63 that are present in the standard are also present inthe seed material, confirming the presence of tyramine.
Analytical Chemistry Article
DOI: 10.1021/acs.analchem.5b01611Anal. Chem. XXXX, XXX, XXX−XXX
E
DART-MS Analysis of Seed Extracts. Conventionalmethods of metabolome or chemical fingerprint determinationoften rely on the analysis of extracts of the plant material ratherthan direct analysis of the material itself. For this reason, it wasof interest to compare the results obtained by direct analysis ofseeds as described above, to those obtained by DART-MSanalysis of seed extracts. Extracts of each Datura seed specieswere prepared using five solvents, namely, hexane, ethyl acetate,dichloromethane, ethanol, and water. Extracts were prepared byhalving a seed, suspending both halves in 50 μL of solvent, andsonicating for 30 min. The resulting solution was thenimmediately analyzed by DART-MS. The spectra obtainedare shown in Figures S-3−S-11. Examination of the datarevealed a number of trends. As expected, a select group ofcomponents was detected in each solvent and there was verylittle similarity between the extract spectra. A representativeexample of the typical differences seen between the DART-MS-derived fingerprints of the extracts for a given species is shownfor D. metel (Figure S-3 and Table S-3).Hexane proved to be the least effective extraction solvent
based upon the greatly reduced number of detected moleculescompared with the number detected in other solvents (FiguresS-3−S-11). Moreover, the diagnostic tropane alkaloids werenever detected in the hexane or dichloromethane extracts inamounts greater than 2% (Figures S-3−S-11, Panels a and c).Ethyl acetate, ethanol, and water were all effective in extractingthe tropane alkaloids (Figures S-3−S-11, Panels b, d, and e).Nevertheless, the fingerprints of these three extracts werevisually very different. The distinctions were a consequence notonly of differences in the relative abundances of peaks commonto all three spectra, but also because the profiles of extractedmolecules differed between solvents. For example, the basepeak in the ethyl acetate spectrum was at m/z 195. However,this peak, which was also the base peak in the spectra of thehexane and dichloromethane extracts, did not appear at all inthe ethanol and water extracts. Comparison of each of theextract spectra in Figure S-3 to that of the spectrum obtainedfrom direct analysis of the seed (Figure 2, Panel f) showed thelatter to provide the most comprehensive fingerprint profile.Similar trends were observed in comparisons between extractsfor the other analyzed species (Figures S-3−S-11 and Tables S-3−S-11). Thus, for all analyzed species, the base peak in thehexane and dichloromethane extracts was always at m/z 195.This peak was never present in the spectra of the ethanol andwater extracts. The identity of the molecule represented by thispeak is unknown.Comparisons between the DART-MS Spectra of Seeds
and Those of Extracts Revealed That Direct SeedAnalysis Was Superior for the Detection of AlkaloidBiomarkers. Comparison of the spectra obtained from directseed analysis to those of the extracts revealed trends that weresimilar across the range of analyzed species. The case of D.ceratocaula is representative (Figure 2, Panel a). The mostprominent peaks in the seed spectrum were those of thealkaloid biomarkers tropine (m/z 142, 68.5% relativeabundance), dihydroxytropane (m/z 158, 65.6% relativeabundance), trihydroxytropane (m/z 174, 100% relativeabundance), scopoletin (m/z 193, 81% relative abundance),and atropine (m/z 290, 14.4% relative abundance). With theexception of trace to modest relative amounts of atropinedetected in the ethyl acetate, dichloromethane, ethanol, andwater extracts (0.4%, 0.4%, 0.3%, and 26.1% relativeabundances, respectively) and a relatively low amount of
scopolamine detected in the water extract (1.7% relativeabundance), none of the other diagnostic biomarkers wereobserved in the solvent extracts (Figure S-4 and Table S-4)In D. inoxia (Figure 2, Panel a), seven diagnostic alkaloids
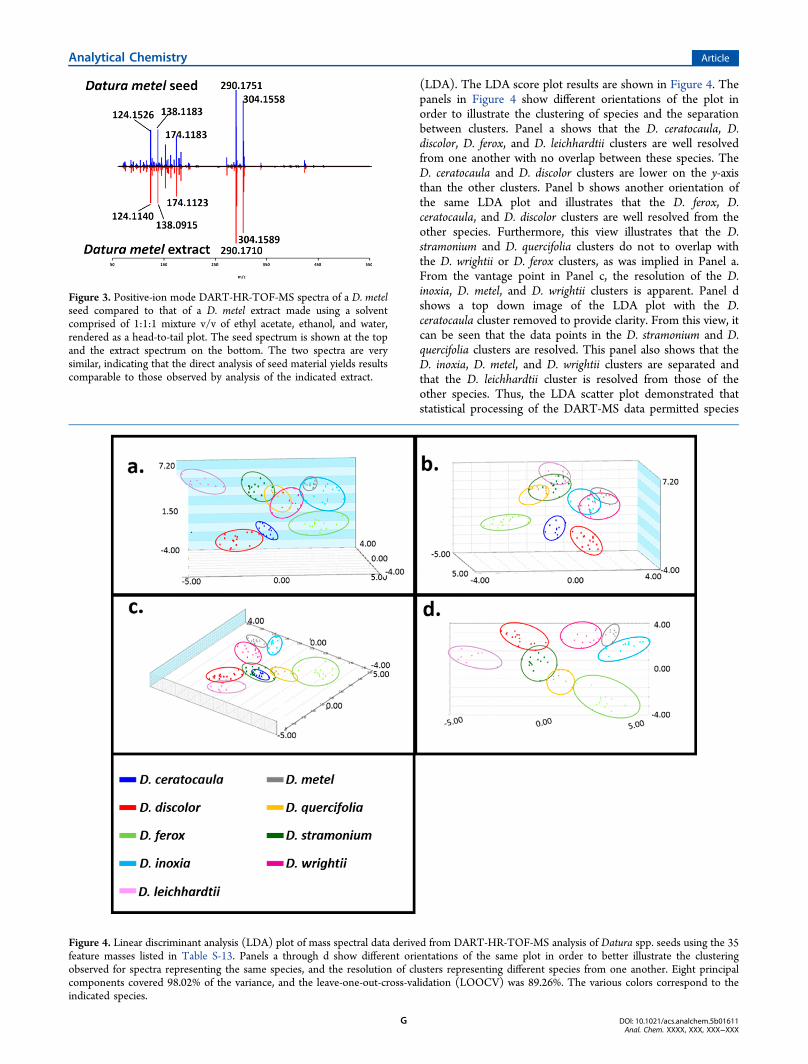
were detected by direct seed analysis, namely, tyramine (m/z138, 13.2% relative abundance), tropinone (m/z 140, 28.2%relative abundance), scopoline (m/z 156, 31.8% relativeabundance), trihydroxytropane (m/z 174, 100% relativeabundance), atropine (m/z 290, 61.9% relative abundance),and scopolamine (m/z 304, 70% relative abundance). With theexception of the observation of scopolamine in the ethylacetate, dichloromethane, ethanol, and water extracts (at 17.5%,1.9%, 38.4%, and 100% relative abundances, respectively) anddetection of tyramine, trihydroxytropane, and scopolamine inthe water extract (at 52.5%, 80.6%, and 100% relativeabundances, respectively), the alkaloids detected in the seedwere absent from the extracts (Figure S-7 and Table S-7).Comparison of the seed DART-MS spectra (Figure 2) to thoseof the corresponding seed extracts (Figures S-3−S-11) revealedanalogous trends in all cases. Direct seed analysis wasconsistently observed to reveal the presence of the mostcomprehensive set of alkaloid biomarkers. Although theaqueous extract of every species of seed always containedalkaloid secondary metabolites, the entire complement of theamines detected by direct seed analysis was never observed inthe water extracts. However, the solvents did exhibit differentialuptake of various alkaloids. For example, the ethyl acetateextract of D. metel contained atropine and scopolamine but notyramine (Figures S-3). On the other hand, the ethanol extractshowed the presence of atropine, scopolamine, and tyramine,and the water extract showed four alkaloids, namely, tyramine,trihydroxytropane, atropine, and scopolamine. In order todetermine whether a solvent extract could yield a fingerprintthat was more aligned with that observed by direct analysis ofthe seeds, a three-component solvent mixture comprised of a1:1:1 ratio by volume of ethyl acetate, ethanol, and water wasused to extract the seeds of each species. The three solvents inthe mix were chosen because all three demonstrated the abilityto take up various alkaloids, while hexane and dichloromethanedid not. The DART mass spectrum obtained for each species isshown in Figure S-12 with the mass spectral peak informationpresented in Table S-12. A representative example of the resultfor D. metel is shown in the head-to-tail plot in Figure 3. Thetop panel of the plot shows the DART mass spectrum obtainedfrom direct analysis of the seed, and the bottom panel showsthe results for the 3-solvent extract. Remarkably, the spectra arevery similar both in terms of the m/z values observed and theirrelative intensities. This demonstrated that it was possible foran appropriately chosen solvent system to extract compoundsthat are similar to those that are observed by direct seedanalysis. However, when taking into account time per analysis,as well as the process of determining the most appropriateextraction solvent system, direct seed analysis is superior, as itprovides similar results without the added time needed forextraction and method development.
Statistical Analysis of Seed DART-MS Derived Chem-ical Fingerprints Enabled Species-Level Identification.To determine whether statistical analysis could be used toclassify and correctly identify seed species based on theirDART-MS-derived mass spectral fingerprints, a training set of121 mass spectra representing all 9 Datura species wasemployed. From the spectra, 35 feature masses (listed inTable S-13) were selected for linear discriminant analysis
Analytical Chemistry Article
DOI: 10.1021/acs.analchem.5b01611Anal. Chem. XXXX, XXX, XXX−XXX
F
(LDA). The LDA score plot results are shown in Figure 4. Thepanels in Figure 4 show different orientations of the plot inorder to illustrate the clustering of species and the separationbetween clusters. Panel a shows that the D. ceratocaula, D.discolor, D. ferox, and D. leichhardtii clusters are well resolvedfrom one another with no overlap between these species. TheD. ceratocaula and D. discolor clusters are lower on the y-axisthan the other clusters. Panel b shows another orientation ofthe same LDA plot and illustrates that the D. ferox, D.ceratocaula, and D. discolor clusters are well resolved from theother species. Furthermore, this view illustrates that the D.stramonium and D. quercifolia clusters do not to overlap withthe D. wrightii or D. ferox clusters, as was implied in Panel a.From the vantage point in Panel c, the resolution of the D.inoxia, D. metel, and D. wrightii clusters is apparent. Panel dshows a top down image of the LDA plot with the D.ceratocaula cluster removed to provide clarity. From this view, itcan be seen that the data points in the D. stramonium and D.quercifolia clusters are resolved. This panel also shows that theD. inoxia, D. metel, and D. wrightii clusters are separated andthat the D. leichhardtii cluster is resolved from those of theother species. Thus, the LDA scatter plot demonstrated thatstatistical processing of the DART-MS data permitted species
Figure 3. Positive-ion mode DART-HR-TOF-MS spectra of a D. metelseed compared to that of a D. metel extract made using a solventcomprised of 1:1:1 mixture v/v of ethyl acetate, ethanol, and water,rendered as a head-to-tail plot. The seed spectrum is shown at the topand the extract spectrum on the bottom. The two spectra are verysimilar, indicating that the direct analysis of seed material yields resultscomparable to those observed by analysis of the indicated extract.
Figure 4. Linear discriminant analysis (LDA) plot of mass spectral data derived from DART-HR-TOF-MS analysis of Datura spp. seeds using the 35feature masses listed in Table S-13. Panels a through d show different orientations of the same plot in order to better illustrate the clusteringobserved for spectra representing the same species, and the resolution of clusters representing different species from one another. Eight principalcomponents covered 98.02% of the variance, and the leave-one-out-cross-validation (LOOCV) was 89.26%. The various colors correspond to theindicated species.
Analytical Chemistry Article
DOI: 10.1021/acs.analchem.5b01611Anal. Chem. XXXX, XXX, XXX−XXX
G
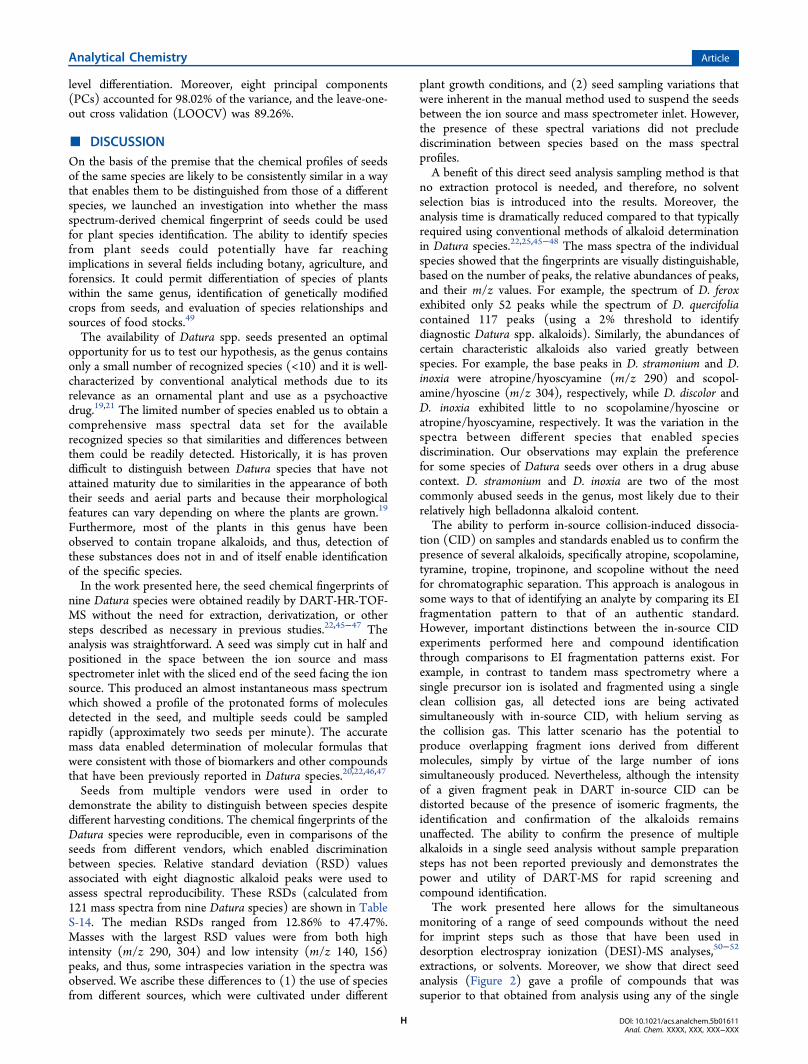
level differentiation. Moreover, eight principal components(PCs) accounted for 98.02% of the variance, and the leave-one-out cross validation (LOOCV) was 89.26%.
■ DISCUSSIONOn the basis of the premise that the chemical profiles of seedsof the same species are likely to be consistently similar in a waythat enables them to be distinguished from those of a differentspecies, we launched an investigation into whether the massspectrum-derived chemical fingerprint of seeds could be usedfor plant species identification. The ability to identify speciesfrom plant seeds could potentially have far reachingimplications in several fields including botany, agriculture, andforensics. It could permit differentiation of species of plantswithin the same genus, identification of genetically modifiedcrops from seeds, and evaluation of species relationships andsources of food stocks.49
The availability of Datura spp. seeds presented an optimalopportunity for us to test our hypothesis, as the genus containsonly a small number of recognized species (<10) and it is well-characterized by conventional analytical methods due to itsrelevance as an ornamental plant and use as a psychoactivedrug.19,21 The limited number of species enabled us to obtain acomprehensive mass spectral data set for the availablerecognized species so that similarities and differences betweenthem could be readily detected. Historically, it is has provendifficult to distinguish between Datura species that have notattained maturity due to similarities in the appearance of boththeir seeds and aerial parts and because their morphologicalfeatures can vary depending on where the plants are grown.19
Furthermore, most of the plants in this genus have beenobserved to contain tropane alkaloids, and thus, detection ofthese substances does not in and of itself enable identificationof the specific species.In the work presented here, the seed chemical fingerprints of
nine Datura species were obtained readily by DART-HR-TOF-MS without the need for extraction, derivatization, or othersteps described as necessary in previous studies.22,45−47 Theanalysis was straightforward. A seed was simply cut in half andpositioned in the space between the ion source and massspectrometer inlet with the sliced end of the seed facing the ionsource. This produced an almost instantaneous mass spectrumwhich showed a profile of the protonated forms of moleculesdetected in the seed, and multiple seeds could be sampledrapidly (approximately two seeds per minute). The accuratemass data enabled determination of molecular formulas thatwere consistent with those of biomarkers and other compoundsthat have been previously reported in Datura species.20,22,46,47
Seeds from multiple vendors were used in order todemonstrate the ability to distinguish between species despitedifferent harvesting conditions. The chemical fingerprints of theDatura species were reproducible, even in comparisons of theseeds from different vendors, which enabled discriminationbetween species. Relative standard deviation (RSD) valuesassociated with eight diagnostic alkaloid peaks were used toassess spectral reproducibility. These RSDs (calculated from121 mass spectra from nine Datura species) are shown in TableS-14. The median RSDs ranged from 12.86% to 47.47%.Masses with the largest RSD values were from both highintensity (m/z 290, 304) and low intensity (m/z 140, 156)peaks, and thus, some intraspecies variation in the spectra wasobserved. We ascribe these differences to (1) the use of speciesfrom different sources, which were cultivated under different
plant growth conditions, and (2) seed sampling variations thatwere inherent in the manual method used to suspend the seedsbetween the ion source and mass spectrometer inlet. However,the presence of these spectral variations did not precludediscrimination between species based on the mass spectralprofiles.A benefit of this direct seed analysis sampling method is that
no extraction protocol is needed, and therefore, no solventselection bias is introduced into the results. Moreover, theanalysis time is dramatically reduced compared to that typicallyrequired using conventional methods of alkaloid determinationin Datura species.22,25,45−48 The mass spectra of the individualspecies showed that the fingerprints are visually distinguishable,based on the number of peaks, the relative abundances of peaks,and their m/z values. For example, the spectrum of D. feroxexhibited only 52 peaks while the spectrum of D. quercifoliacontained 117 peaks (using a 2% threshold to identifydiagnostic Datura spp. alkaloids). Similarly, the abundances ofcertain characteristic alkaloids also varied greatly betweenspecies. For example, the base peaks in D. stramonium and D.inoxia were atropine/hyoscyamine (m/z 290) and scopol-amine/hyoscine (m/z 304), respectively, while D. discolor andD. inoxia exhibited little to no scopolamine/hyoscine oratropine/hyoscyamine, respectively. It was the variation in thespectra between different species that enabled speciesdiscrimination. Our observations may explain the preferencefor some species of Datura seeds over others in a drug abusecontext. D. stramonium and D. inoxia are two of the mostcommonly abused seeds in the genus, most likely due to theirrelatively high belladonna alkaloid content.The ability to perform in-source collision-induced dissocia-
tion (CID) on samples and standards enabled us to confirm thepresence of several alkaloids, specifically atropine, scopolamine,tyramine, tropine, tropinone, and scopoline without the needfor chromatographic separation. This approach is analogous insome ways to that of identifying an analyte by comparing its EIfragmentation pattern to that of an authentic standard.However, important distinctions between the in-source CIDexperiments performed here and compound identificationthrough comparisons to EI fragmentation patterns exist. Forexample, in contrast to tandem mass spectrometry where asingle precursor ion is isolated and fragmented using a singleclean collision gas, all detected ions are being activatedsimultaneously with in-source CID, with helium serving asthe collision gas. This latter scenario has the potential toproduce overlapping fragment ions derived from differentmolecules, simply by virtue of the large number of ionssimultaneously produced. Nevertheless, although the intensityof a given fragment peak in DART in-source CID can bedistorted because of the presence of isomeric fragments, theidentification and confirmation of the alkaloids remainsunaffected. The ability to confirm the presence of multiplealkaloids in a single seed analysis without sample preparationsteps has not been reported previously and demonstrates thepower and utility of DART-MS for rapid screening andcompound identification.The work presented here allows for the simultaneous
monitoring of a range of seed compounds without the needfor imprint steps such as those that have been used indesorption electrospray ionization (DESI)-MS analyses,50−52
extractions, or solvents. Moreover, we show that direct seedanalysis (Figure 2) gave a profile of compounds that wassuperior to that obtained from analysis using any of the single
Analytical Chemistry Article
DOI: 10.1021/acs.analchem.5b01611Anal. Chem. XXXX, XXX, XXX−XXX
H
solvent systems we investigated. DART-MS analysis of anextract prepared using the combination solvent system (i.e.,1:1:1 v/v/v of water/ethanol/ethyl acetate) did yield aspectrum very similar to that observed by direct seed analysis(Figures 3 and S-12). This further demonstrated that theextraction step was not required since direct seed analysisyielded the same information.The high-throughput capability of DART-MS analysis made
practical the rapid acquisition of multiple spectra that could beprocessed by multivariate statistical analysis methods, with>100 samples being analyzed per hour. The use of seeds forchemical phenotyping with multivariate statistical analysis isideal, as the seed contains the entire genetic makeup thatdistinguishes the plant. This approach is novel, as mostdefinitive identifications of species are accomplished throughDNA analysis, which can be expensive and is limited to thesmall number of plants with mapped genomes. Processing ofthe chemical signature data by LDA illustrated the power of thisapproach to provide species-level discrimination between seeds.The methodology presented here demonstrates that a viablealternative to species differentiation using gene sequenceinformation is the application of statistical analysis processingof seed chemical fingerprints. The method can be applied to avery large number of species even if little information isavailable on the plant’s chemical makeup or the identities of anyof its biomarkers.
■ CONCLUSIONWe have demonstrated using Datura spp. seeds that the small-molecule fingerprint of seeds can be obtained by DART-HRMS. While intraspecies chemical signatures are similar,interspecies fingerprints are distinct enough to be discriminatedusing multivariate statistical analysis tools. The results shownhere demonstrate the application and utility of DART-MSfingerprinting in seed species determination.
■ ASSOCIATED CONTENT*S Supporting InformationThe Supporting Information is available free of charge on theACS Publications website at DOI: 10.1021/acs.anal-chem.5b01611.
12 additional figures and 14 tables referenced in the text(PDF)
■ AUTHOR INFORMATIONCorresponding Author*E-mail: [email protected]. Fax: 518-442-3462.NotesThe authors declare no competing financial interest.
■ ACKNOWLEDGMENTSWe would like to thank Justine E. Giffen for assistance withpreparation of seed and extract samples and critical reading ofthe manuscript. The support of the Research Foundation of theState University of New York, as well as a National ScienceFoundation grant to R.A.M. and R.B.C. (Grant #1310350), isalso gratefully acknowledged.
■ REFERENCES(1) Lin, H.; Rao, J.; Shi, J.; Hu, C.; Cheng, F.; Wilson, Z. A.; Zhang,D.; Quan, S. J. Integr. Plant Biol. 2014, 56, 826−836.
(2) Tsopmo, A.; Muir, A. D. J. Agric. Food Chem. 2010, 58, 8715−8721.(3) Hu, C.; Shi, J.; Quan, S.; Cui, B.; Kleessen, S.; Nikoloski, Z.;Tohge, T.; Alexander, D.; Guo, L.; Lin, H.; Wang, J.; Cui, X.; Rao, J.;Luo, Q.; Zhao, X.; Fernie, A. R.; Zhang, D. Sci. Rep. 2014, 4, 5067.(4) Auger, B.; Marnet, N.; Gautier, V.; Maia-Grondard, A.; Leprince,F.; Renard, M.; Guyot, S.; Nesi, N.; Routaboul, J.-M. J. Agric. FoodChem. 2010, 58, 6246−6256.(5) Shu, X.-L.; Frank, T.; Shu, Q.-Y.; Engel, K.-H. J. Agric. Food Chem.2008, 56, 11612−11620.(6) Na Jom, K.; Frank, T.; Engel, K.-H. Metabolomics 2011, 7, 102−117.(7) Hong, E.; Kim, S.-J.; Kim, G.-H. Food Chem. 2011, 128, 1115−1120.(8) Levandi, T.; Leon, C.; Kaljurand, M.; Garcia-Canas, V.; Cifuentes,A. Anal. Chem. 2008, 80, 6329−6335.(9) Frank, T.; Rohlig, R. M.; Davies, H. V.; Barros, E.; Engel, K.-H. J.Agric. Food Chem. 2012, 60, 3005−3012.(10) Piccioni, F.; Capitani, D.; Zolla, L.; Mannina, L. J. Agric. FoodChem. 2009, 57, 6041−6049.(11) Ovenden, S. P. B.; Gordon, B. R.; Bagas, C. K.; Muir, B.;Rochfort, S.; Bourne, D. J. Aust. J. Chem. 2010, 63, 8−21.(12) Cody, R.; Laramee, J.; Durst, H. D. Anal. Chem. 2005, 77,2297−2302.(13) Espinoza, E. O.; Lancaster, C. A.; Kreitals, N. M.; Hata, M.;Cody, R. B.; Blanchette, R. A. Rapid Commun. Mass Spectrom. 2014,28, 281−289.(14) Cody, R. Anal. Chem. 2009, 81, 1101−1107.(15) Nilles, J.; Connell, T.; Durst, H. Anal. Chem. 2009, 81, 6744−6749.(16) Fukuda, E.; Uesawa, Y.; Baba, M.; Suzuki, R.; Fukuda, T.;Shirataki, Y.; Okada, Y. Nat. Prod. Commun. 2014, 9, 1591−1594.(17) Novotna, H.; Kmiecik, O.; Galazka, M.; Krtkova, V.; Hurajova,A.; Schulzova, V.; Hallmann, E.; Rembialkowska, E.; Hajslova, J. FoodAddit. Contam., Part A 2012, 29, 1335−1346.(18) Morlock, G. E.; Ristivojevic, P.; Chernetsova, E. S. J.Chromatogr. A 2014, 1328, 104−112.(19) Preissel, U.; Preissel, H.-G. Brugmansia and Datura: Angel’sTrumpets and Thorn Apples; Firefly Books: Richmond Hill, ON, 2002.(20) Koverman, G. Microgram 1993, 26, 122.(21) US Drug Enforcement Administration. Jimson Weed (Daturastramonium); 2013; http://www.deadiversion.usdoj.gov/drug_chem_info/jimson_w.pdf. Accessed 7-14-2015.(22) Friedman, M.; Levin, C. E. J. Agric. Food Chem. 1989, 37, 998−1005.(23) Paul, B.; Dreka, C.; Knight, E.; Smith, M. Planta Med. 1996, 62,544−547.(24) Wu, X.; Li, N.; Li, H.; Tang, H. Analyst 2014, 139, 1769−1778.(25) Namera, A.; Yashiki, M.; Hirose, Y.; Yamaji, S.; Tani, T.; Kojima,T. Forensic Sci. Int. 2002, 130, 34−43.(26) Gorzolka, K.; Lissel, M.; Kessler, N.; Loch-Ahring, S.; Niehaus,K. J. Biotechnol. 2012, 159, 177−187.(27) Kim, J. K.; Park, S.-Y.; Na, J.-K.; Seong, E. S.; Yu, C. Y. J. Agric.Food Chem. 2012, 60, 2257−2263.(28) Matthews, S. B.; Santra, M.; Mensack, M. M.; Wolfe, P.; Byrne,P. F.; Thompson, H. J. PLoS One 2012, 7, e44179.(29) Frank, T.; Rohlig, R.; Davies, H.; Barros, E.; Engel, K.-H. J.Agric. Food Chem. 2012, 60, 3005−3012.(30) Sessa, R. A.; Bennett, M. H.; Lewis, M. J.; Mansfield, J. W.;Beale, M. H. J. Biol. Chem. 2000, 275, 26877−26884.(31) Busko, M.; Jelen, H.; Goral, T.; Chmielewski, J.; Stuper, K.;Szwajkowska-Michalek, L.; Tyrakowska, B.; Perkowski, J. Food Addit.Contam., Part A 2010, 27, 1574−1581.(32) Weder, J. K. P. Lebensm. Wiss. Technol. 2002, 35, 504−511.(33) Devi, R.; Nandeesha, P.; Kaashyap, M.; Kumar, S.; Datta, S.Indian J. Agric. Biochem. 2014, 27, 81−84.(34) Tsai, L.-C.; Hsieh, H.-M.; Huang, L.-H.; Wang, J.-C.; Linacre,A.; Lee, J. C.-I. Forensic Sci. Int. 2006, 158, 250−251.
Analytical Chemistry Article
DOI: 10.1021/acs.analchem.5b01611Anal. Chem. XXXX, XXX, XXX−XXX
I
(35) Wang, P.; Xia, H.; Zhang, Y.; Zhao, S.; Zhao, C.; Hou, L.; Li, C.;Li, A.; Ma, C.; Wang, X. BMC Genomics 2015, 16, 21.(36) Tar’an, B.; Warkentin, T.; Somers, D. J.; Miranda, D.;Vandenberg, A.; Blade, S.; Bing, D. Euphytica 2004, 136, 297−306.(37) Hashemi, S. H.; Mirmohammadi-Maibody, S. A. M.;Nematzadeh, G. A.; Arzani, A. Afr. J. Biotechnol. 2009, 8, 2094−2101.(38) Jordan, M. C.; Somers, D. J.; Banks, T. W. Plant Biotechnol. J.2007, 5, 442−453.(39) Kato, S.; Sayama, T.; Fujii, K.; Yumoto, S.; Kono, Y.; Hwang, T.-Y.; Kikuchi, A.; Takada, Y.; Tanaka, Y.; Shiraiwa, T.; Ishimoto, M.Theor. Appl. Genet. 2014, 127, 1365−1374.(40) McCarthy, P. L.; Hansen, J. L.; Zemetra, R. S.; Berger, P. H.Biotechniques 2002, 32 (560), 562−564.(41) Yin, G.; Xu, H.; Liu, J.; Gao, C.; Sun, J.; Yan, Y.; Hu, Y. Gene2014, 546, 177−186.(42) Shirley, N.; Allgeier, L.; LaNier, T.; Miller Coyle, H. J. ForensicSci. 2013, 58, S176−S182.(43) Lesiak, A. D.; Musah, R. A.; Cody, R. B.; Domin, M. A.; Dane,A. J.; Shepard, J. R. Analyst 2013, 138, 3424−3432.(44) Musah, R.; Domin, M.; Cody, R.; Lesiak, A.; Dane, A. J.;Shepard, J. Rapid Commun. Mass Spectrom. 2012, 26, 2335−2342.(45) Amokaha, R. A.; Ubwa, S. T.; Otokpa, M.; Shenge, G. J. Chem.Soc. Nigeria 2002, 27 (1), 105−106.(46) El Bazaoui, A.; Stambouli, H.; Bellimam, M. A.; Soulaymani, A.Ann. Toxicol. Anal. 2009, 21, 183−188.(47) Philipof, S.; Berkhov, S. Z. Naturforsch. 2002, 57, 559−561.(48) Jakabova, S.; Vincze, L.; Farkas, A.; Kilar, F.; Boros, B.; Felinger,A. J. Chromatogr. A 2012, 1232, 295−301.(49) Kim, S. W.; Kim, H. J.; Kim, J. H.; Kwon, Y. K.; Ahn, M. S.;Jang, Y. P.; Liu, J. R. Plant Methods 2011, 7, 14.(50) Tata, A.; Perez, C.; Hamid, T.; Bayfield, M.; Ifa, D. J. Am. Soc.Mass Spectrom. 2015, 26, 641−648.(51) Thunig, J.; Hansen, S. H.; Janfelt, C. Anal. Chem. 2011, 83,3256−3259.(52) Wiseman, J. M.; Ifa, D. R.; Zhu, Y.; Kissinger, C. B.; Manicke, N.E.; Kissinger, P. T.; Cooks, R. G. Proc. Natl. Acad. Sci. U. S. A. 2008,105, 18120−18125.
Analytical Chemistry Article
DOI: 10.1021/acs.analchem.5b01611Anal. Chem. XXXX, XXX, XXX−XXX
J


![Identification and Characterization of Arabidopsis …...Identification and Characterization of Arabidopsis Seed Coat Mucilage Proteins1[OPEN] Allen Yi-Lun Tsai2, Tadashi Kunieda3,](https://img.pdfslide.us/doc/110x75/5e93c006afc9c34a843ac831/identiication-and-characterization-of-arabidopsis-identiication-and-characterization.jpg)


![Sport Utility Vehicle...Rated output1 (kW [HP] at rpm) XXX XXX XXX XXX XXX Acceleration from 0 to 100 km/h (s) XXX XXX XXX XXX XXX Top speed (km/h) XXX 3XXX XXX 3XXX XXX3 Fuel consumption4](https://img.pdfslide.us/doc/110x75/5e9ad03bae36bf4b5c045c78/sport-utility-vehicle-rated-output1-kw-hp-at-rpm-xxx-xxx-xxx-xxx-xxx-acceleration.jpg)