Embed Size (px)
DESCRIPTION
ttt
Citation preview
Plant Physiol. (1994) 106: 281-292
Gas Exchange and Carbon Partitioning in the leaves of Celery (Apium graveolens 1.) at Various levels of
Root Zone Salinity’
John D. Everard, Riccardo Cucci, Susan C. Kann, James A. Flore, and Wayne H. Loescher*
Department of Horticulture, Michigan State University, East Lansing, Michigan 48824-1 325 (J.D.E., S.C.K., J.A.F., W.H.L.); and Dipartimento di Coltivazione e Difesa delle Specie Legnose, Sezione Coltivazioni Arboree,
Universita’ di Pisa, 56100 Pisa, Italy (R.G.)
Both mannitol and sucrose (Suc) are primary photosynthetic products in celery (Apium graveolens 1.). In other biological sys- tems mannitol has been shown to serve as a compatible solute or osmoprotectant involved in stress tolerance. Although mannitol, like SUC, is translocated and serves as a reserve carbohydrate in celery, its role in stress tolerance has yet to be resolved. Mature celery plants exposed to low (25 mM NaCI), intermediate (100 mM NaCI), and high (300 mM NaCI) salinities displayed substantial salt tolerance. Shoot fresh weight was increased at low NaCl concen- trations when compared with controls, and growth continued, although at slower rates, even after prolonged exposure to high salinities. Gas-exchange analyses showed that low NaCl levels had little or no effect on photosynthetic carbon assimilation (A), but at intermediate levels decreases in stomatal conductance limited A, and at the highest NaCl levels carboxylation capacity (as measured by analyses of the CO, assimilation response to changing internal CO, partial pressures) and electron transport (as indicated by fluorescence measurements) were the apparent prevailing limits to A. Increasing salinities up to 300 mM, however, increased mannitol accumulation and decreased SUC and starch pools in leaf tissues, e.g. the ratio of mannitol to SUC increased almost 10-fold. These changes were due in part to shifts in photosynthetic carbon parti- tioning (as measured by “C labeling) from SUC into mannitol. Salt treatments increased the activity of mannose-6-phosphate reduc- tase (MCPR), a key enzyme in mannitol biosynthesis, 6-fold in young leaves and 2-fold in fully expanded, mature leaves, but increases in MCPR protein were not apparent in the older leaves. Mannitol biosynthetic capacity (as measured by labeling rates) was maintained despite salt treatment, and relative partitioning into mannitol consequently increased despite decreased photosynthetic capacity. The results support a suggested role for mannitol accu- mulation in adaptation to and tolerance of salinity stress.
The polyols were the first class of compounds to be termed compatible solutes (Brown and Simpson, 1972), and many of these compounds (acyclic polyols, e.g. sorbitol, mannitol, and glycerol, and substituted cyclic polyols, e.g. pinitol) and sev- eral related derivatives (e.g. glycerol glucoside) play roles in stress protection in almost all classes of living organisms,
Financial support was provided by U.S. Department of Agricul- ture-National Research Initiative Competitive Grant No. 93-37100- 8907.
* Corresponding author; fax 1-517-353-0890. 281
including moderately halophilic bacteria (Galinski, 1993), mammals (osmoregulation in cultured renal medullary cells [Bagnasco et al., 1986]), diapausal insects (Chino, 1957; Sto- rey and Storey, 1988), yeast (Brown and Simpson, 1972), marine macro-algae (Kirst, 1990), unicellular green algae (Ginzburg, 1987), and fungi (Jennings and Burke, 1990). Now that it appears clear that the accumulation of other types of compatible solutes (e.g. Gly betaine and Pro) are adaptive responses to abiotic stress in higher plants (Rhodes and Hanson, 1993), it may appear pedantic to question whether poly01 accumulation is an adaptation to or a consequence of stress imposition, especially with data showing improved salt tolerance in mannitol-producing transgenic tobacco plants (Tarczynski et al., 1993). However, when compared to nitro- gen- and sulfur-containing compatible solutes in plants or to polyols in other organisms, polyols in higher plants are unique because they are frequently primary photosynthetic products with central metabolic and physiological roles under nonstressed conditions (Loescher, 1987). Tissue content is therefore inextricably linked to photosynthetic carbon ana- bolism, catabolism, and translocation, and stress-induced ac- cumulation may be a symptom of rather than an adaptation to stress.
Celery (Apium graveolens L.) not only produces mannitol as a primary photosynthetic product (Loescher et al., 1992), but it also has a halophilic ancestry (Bailey, 1942) and dis- plays substantial salt tolerance and elevated levels of man- nitol under salt stress (Everard and Loescher, 1992; Everard et al., 1993b; Stoop and Pharr, 1994). In addition, mannitol synthesis has been proposed as a supplemental mechanism to dissipate reducing power (NADPH) accumulated during the light reactions of photosynthesis (Loescher, 1987). Both
Abbreviations: A, photosynthetic carbon assimilation; A-C” COz assimilation response to changing intemal COZ partial pressures; A- PPFD, COZ assimilation response to changing photosynthetic photon flux density; C,, ambient COZ partial pressure; C, intemal COz partial pressure; F,, initial nonvariable fluorescence; F,, maximal variable fluorescence; FJF,,,, photochemical efficiency of PSII; r, COz com- pensation point; g., stomatal conductance; k, carboxylation efficiency; M6PR, mannose-6-phosphate reductase; PVPP, polyvinylpolypyr- rolidone; %, dark respiration rate; ?, regression analysis coefficient of determination; SPS, sucrose-phosphate synthase; VPD, vapor pressure deficit; WUE, water use efficiency.
www.plant.org on April 12, 2014 - Published by www.plantphysiol.orgDownloaded from Copyright © 1994 American Society of Plant Biologists. All rights reserved.
282 Everard et al. Plant Physiol. Val. 106, 1994
mannitol accumulation and photochemical energy dissipation would likely be advantageous under salinity stress: accumu- lation would be useful if mannitol functions as a compatible solute or osmoprotectant, and energy dissipation via mannitol biosynthesis would be important especially if salinity stress results in partial stomatal closure and decreased levels of intemal CO,. No studies have yet focused on these sub- jects at a metabolic level. To determine whether salt- induced poly01 accumulation is an adaptive response in higher plants, we here report a study of gas exchange, carbon par-titioning, and enzymology in celery grown at various salt concentrations.
MATERIALS AND METHODS
Plant Material
Celery (Apium graveolens L. cv Giant Pascal) was grown under glasshouse conditions in East Lansing, MI, during the spring and summer of 1992 and the spring of 1993, essentially as described by Davis et al. (1988). Mature plants (with 15 or more leaves) used throughout these studies were approxi- mately 5 months old at treatment initiation. Prior to treatment the open surfaces of 5.4-L pots containing the plants were covered with plastic film to minimize surface evaporation. Salt treatments were stepped up in 50 m’d-’ increments (25 mM in the AM, 25 m in the PM) until final treatment concen- trations (O, 25, 100, 300 m) were achieved. NaCl was dissolved in either Peters 20:20:20 fertilizer (W.R. Grace, Fogelsville, PA) (100 ppm- nitrogen working strength) or tap water and plants were watered alternately with each solution. Plants were watered at least once a day with approximately 1 L of solution, ensuring adequate leaching and preventing excess salinity (J.D. Everard and D. Hilliard, unpublished data). All measurements were made 3.5 to 5 weeks after final treatment concentrations were achieved (unless otherwise indicated), when plants were assumed to have reached a steady state with respect to treatment effects. By this time mature, newly fully expanded leaves (leaves 6-10, as num- bered from the youngest visible leaf in the center), on which all measurements were made, had been elaborated during salt treatments.
Growth Analysis
After 14C pulse-chase experiments (see below) total shoot fresh weight and leaf numbers were determined. Dry weights were not determined in these experiments. Where dry weight estimates were required (e.g. for pool size calculations) we used dry matter contents for comparable plants and treat- ments obtained in other experiments.
Gas Exchange
Gas exchange and A-Ci or A-PPFD were measured in the laboratory using an open gas-exchange system (Layne and Flore, 1992). Standard conditions during gas exchange were PPFD > 900 pmol m-* s-’, V P D < 1.5 kPa, 34 to 38 Pa C,, 22 to 25OC leaf temperature, and a flow rate into the cuvette ranging between 22 and 33 mL s-’. For comparative purposes measurements were also made on the same plant material in
the glacjshouse where they had been grown and salt treated. Glasshouse measurements were made using a portable ADC LCA-2 gas-exchange unit (Analytical Development Co., Hod- desdon, UK) operated at a flow rate of 8 mL s-’. ‘ h e terminal leaflet of the seventh youngest leaf was measured, except in three plants where these were damaged or chlorotic and adjacent lateral leaflets were used instead. Glasshouse meas- urements were made between 10 AM and noor at PPFD > 1100 pmol m-’s-’, 36.6 f 0.1 Pa C,, leaf temperature of 20.6 f 0.5O(3, and 1.1 f 0.3 kPa VPD. PPFD was measured with a LI-187 quantum sensor (Li-Cor, Lincoln, NE) R,, was cal- culated as the means of two to three measurements taken in the laboratory at 20-min intervals at the end of the night period once gas exchange had reached a steady state (ap- proximately 1 h after enclosing the leaf in the cuvette). Gas- exchange parameters were calculated and nonlinear regres- sion models were fitted to each assimilation re5,ponse curve (Layne and Flore, 1992). The ? of fitted models was higher than 0.94 and 0.92 for A-PPFD and A-C, curves, respectively, with the exception of one A-C, replicate of the 300 m~ NaCl treatment, which had an ? of 0.68. For illustrative purposes, best line fits for the pooled A-Cl-derived data at each salt concentration are displayed (see the legend to Fig. 2 [below] for the relevant ? values for the curves). Stomatal limitations to CO1 assimilation were calculated from individual A-C, curves by sensitivity analysis (Jones, 1985) whereby the slopes of A-C, (demand) and gas-supply curves of single replicates were compared at the point of intersection corre- sponding to a C, of 35 Pa.
Fluorescence Analysis
Fluorescence measurements were made on the terminal lateral leaflets of the seventh to ninth leaf witn a CF-1000 Chl fluorescence system (Morgan Instruments, I nc., Andover MA) at room temperature during A-PPFD response analysis. For dark acclimation, cuvettes were applied to the leaflets at least 30 min before measurements were made, iind chamber temperature and humidity were maintained at 22OC and 60%, respectively. Dark-adapted leaves were illuminated with an actinic light pulse of 1000 pmol m-* s-’, and fluores- cence transients were recorded at 690 nm for 1 min. F,,, F,, and F,/F,,, were computed using software supplied with the instrument. Fluorescence parameters for each t r ~ atment were also measured on six plants in the glasshouse on two separate occasions.
Pulse-Chase labeling
The protocols used for pulse labeling and analysis of prod- ucts are briefly described below. Plants were transferred from glasshouse to laboratory in the late aftemoon and were dark acclimated overnight in a growth chamber at 17OC and 70% RH. Plants were then removed individually from the growth chamber for pulse labeling at approximately 1.5-h intervals. Labeling was performed in a plexiglass cuvette (Sams and Flore, 1982) within a ventilated hood. Leaves were arranged such that the opposite subterminal lateral leaflets were en- closed within the cuvette and the terminal leaflet protruded through the side wall. Leaves proximal to those i n the cuvette
www.plant.org on April 12, 2014 - Published by www.plantphysiol.orgDownloaded from Copyright © 1994 American Society of Plant Biologists. All rights reserved.
Carbon Partitioning and Salinity in Celery 283
were excised to avoid shading. Cuvette temperature was maintained at 22.8 f 0.3OC and leaf temperature was contin- uously monitored with a 0.08-mm chromel-constantan ther- mocouple pressed against the abaxial surface. PPFD at the leaf surface was between 870 and 930 pmol m-' s-I. Air entering the cuvette, at a flow rate of 41.7 to 50.0 mL s-I, was derived from the reference line of the lab-based gas- exchange system, C, was 35 to 39 Pa, and the dew point was 14.4 f 0.6OC. Leaves were acclimated under these conditions for 60 min prior to I4CO2 pulsing. Immehately prior to labeling the terminal leaflet was removed, frozen in liquid nitrogen, and stored at -8OOC for later enzyme analysis. I4CO2 was pulsed through the cuvette for 20 s, followed by a 20-min chase period with unlabeled air from the reference gas line as described above; excess '*C02 from the cuvette was trapped in a soda lime scrubber. Labeled CO, was dispensed from a 50-L tank containing I4CO2 (specific activity 10 pCi L-I) at 34.2 Pa partial pressure CO, in air (Matheson Gas Products, East Rutherford, NJ). Flow rate was regulated at 8.33 mL s-I, dispensing a dose of 1.667 pCi in 20 s; a fan within the cuvette ensured thorough mixing of the label during the pulse. Immediately after the chase the labeled material was wrapped in aluminum foil, frozen in liquid nitrogen, and stored at -8OOC. Three plants from each salt treatment were labeled in a random order with respect to treatment, one treatment series at a time.
Carbohydrate Analysis of Radiolabeled Tissue
Approximately 0.5 g of the frozen material (avoiding major veins) was ground to a powder with a liquid-nitrogen-cooled mortar and pestle, resuspended in 10 mL of 80% ethanol (v/v with HzO), and transferred to a test tube. After 15 min at room temperature (vortex mixing every 5 min), extracts were centrifuged at lOOOg for 5 min. The supernatants were decanted, the pellets were reextracted twice with 5 mL of 80% ethanol washes, and the resulting supernatants were pooled with the initial extract (further extraction at 4OC ovemight resulted in 4% more label being recovered). Ten milliliters of H20 was added to the pooled supernatants followed by partitioning with 5 mL of chloroform. The aqueous phase was dried in vacuo at 4OoC and subsequently stored in a desiccator at -2OOC. The pellets were also dried and stored for starch analyses. Aliquots were taken for liquid scintillation counting at each stage to determine I4C incor- poration into the various fractions. Combustion analysis of selected subsamples of leaf material gave incorporation rates within 10% of those obtained by liquid scintillation counting of crude leaf extracts (data not shown); the latter data were used to calculate recovery rates.
Dried carbohydrate samples were dissolved in water. After filtering, 100 to 200 pL (containing approximately 15,000 dpm) was injected onto the HPLC column. HPLC analysis was performed at 85OC on a Bio-Rad HPX-87P (300 X 7.8 mm) eluted with water (flow of 0.01 mL s-I) from a Waters 600 delivery system (Waters, Milford, MA). A P-Ram model 2 flow-through scintillation counter (IN/US Systems, Inc., Fairfield, NJ) fitted with a yttrium silicate flow cell was used to monitor the eluted labeled material. Identity of the eluted material was confirmed by comparing retention times with
those of I4C-labeled authentic standards of mannitol, Glc, Fru, and SUC. Fixed retention time windows were used for data analysis to avoid operator bias. Recovery was at least 96%.
Analysis of Carbohydrate Pools
Aliquots (100 pL) of the reconstituted soluble carbohydrate fractions were dried in vacuo, solubilized ovemight (with agitation) in 1 mL of dry pyridine containing 30 mg mL-' hydroxylamine hydrochloride, heated at 70 to 8OoC for 1 h, and derivatized by the method of Sweeley et al., (1963). GC was performed on a Hewlett-Packard 5890 series I1 gas chromatograph fitted with a 0.25-pm film, 30 m X 250 pm i.d. DB-1701 capillary column (J & W Scientific, Folsom, CA).
Starch was measured in the pellet remaining after extrac- tion with 80% ethanol as previously described (Gucci et al., 1991). To confirm that the label in the pellet was starch, HPLC analysis was performed after amyloglucosidase diges- tion (Gucci et al., 1991).
Enzyme Extractions
All steps were performed at 2.5OC. Frozen leaf material (0.3-1.0 g) was ground to a fine powder in a liquid-nitrogen- cooled mortar and pestle and then transferred to hsposable blood dilution vials (American Scientific Products, McGaw Park, IL) containing insoluble PVPP and Triton X-100, at 5% (w/v) and 0.1% (v/v) of the buffer volume, respectively. A suitable volume (approximately 10 times the tissue weight) of cold, degassed buffer (100 mM Tris-HCI, pH 7.5, 15 m MgC12, 1 m EDTA disodium salt, and 10 IT~M DTT [added immediately prior to use]) was added and the tissue was homogenized with a Polytron (2 X 15 s, full speed). Aliquots of crude extracts were frozen in liquid nitrogen and used for Chl determinations. The extract was filtered through Poly- cloth and centrifuged at 20,200g for 20 min, and the super- natant was used for enzyme activity determinations (see below). A portion used for SPS assays was desalted through Sephadex G-25 columns (equilibrated with extraction buffer minus PVPP and Triton X-100). Another aliquot (100 pL) was added to 700 pL of cold (-21OC) acetone, and after standing ovemight at -21OC the precipitated protein was pelleted (13,OOOg for 10 min) and used for gel electrophoresis and immunoblotting.
Enzyme Assays
M6PR was assayed according to Loescher et al. (1992). Assays were run at at least two different extract volumes; further assays were performed if linearity with extract volume was poor (i.e. SD > 5% of the mean). SPS was assayed according to Huber et al. (1989) under substrate-saturated conditions (10 mM of both UDPG and Fru-6-P) in the pres- ence of 40 mM Glc-6-P. Five replicate assays were run for each extract (45 pL/assay). Preliminary experiments showed: (a) that the extraction buffer used was as effective as that described by Huber et al. (1989); (b) that enzyme assays were linear with time and extract volume; and (c) that Glc-6-P was essential for maximal activity.
www.plant.org on April 12, 2014 - Published by www.plantphysiol.orgDownloaded from Copyright © 1994 American Society of Plant Biologists. All rights reserved.
2 84 Everard et at. Plant Physiol. Vol. 106, 1994
Protein content was determined by the method of Bradford (1976) using BSA as the standard. Chl determinations fol- lowed Wintermans and De Mots (1965).
150
SDS-PAGE, Immunoblotting, and Quantification of M6PR
The protocols followed Everard et al. (1993a). For quanti- fication of M6PR, Coomassie blue R-stained gels were lami- nated between two sheets of cellulose and the amount of M6PR was determined by densitometry using a Molecular Dynamics model 300A computing densitometer (Molecular Dynamics, Inc., Sunnyvale CA). The amount of M6PR rela- tive to other proteins in each extract was determined by a density scan through an elongated rectangle drawn over the central two-thirds of the lane (the rectangle was replicated in each lane so that inter-lane comparisons could be made). Relative amounts of M6PR between treatments were also determined by enclosing the M6PR band with a rectangle and scanning it for density (the rectangle encompassed the whole M6PR band and was replicated in each lane).
Statistical Analysis
Experiments were designed and analyzed as completely randomized experiments. Statistical significance, where in- dicated, is at least at the 5% level as determined by analysis of variance and Fisher’s LSD test using Systat software on an Apple Macintosh computer.
RESULTS
Plant Growth
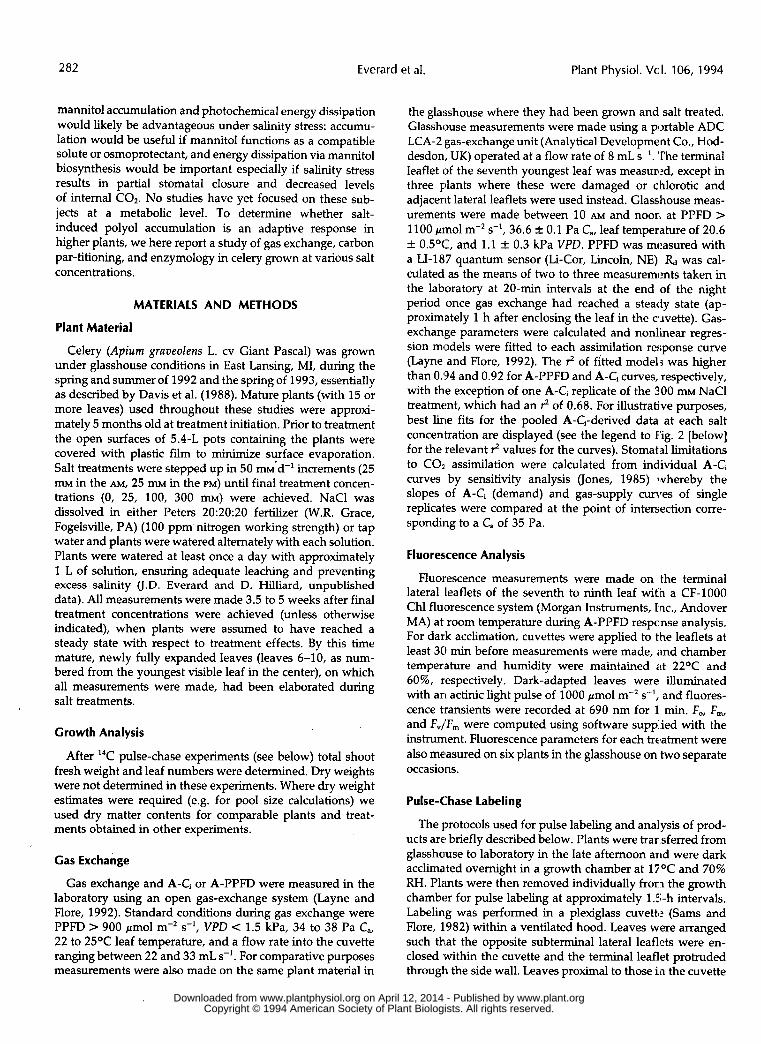
The data in Figure 1 showing the effects of salt on celery growth and development are presented here to give a back- ground to the present study and are not intended to be comprehensive. Low concentrations of NaCl(25 m) signif- icantly increased shoot wet weight (Fig. 1A). In contrast, the dry matter content of plants at this level of salt was similar to or slightly lower than controls (Fig. lA), thus the apparent growth stimulation was the result of increased succulence. Increased succulence (reduced dry matter content) was also apparent in plants treated with 100 m NaCl despite a significant reduction in wet weight (Fig. 1A). A dramatic reduction in shoot fresh weight occurred at 300 m NaCI; dry matter content was similar to controls (Fig. 1A). Ohe symptom of plants subjected to 300 m NaCl was desiccation and loss of older leaves, which led to a substantial reduction in the number of viable leaves (green and turgid) at final harvest (Fig. 18). The loss of the oldest and largest leaves exaggerated the apparent effects of high salinity on plant growth (as measured by wet weight and total leaf number), and a more representative index was the leaf emergence rate (Fig. lB), e.g. at 300 m NaCl, although shoot fresh weight was reduced to 30%, leaf emergence rates remained at 57% of that of the controls.
Gas Exchange and Chi Fluorescence
Salt stress effects on gas-exchange parameters vaned mark- edly with NaCl concentration. For instance, A (measured at
0.4
30T- Leafemergence
Li 0.3 20 E
0.2 2 2i
A ,A 10 F 0.1 c
5 P - w
* O
”
O O o 25 100 300
NaCl (mM)
Figure 1. Growth data from celery plants treated at various salt levels for 30 d. A, Shoot fresh weights and dry matter contents (estimated from other experiments [see “Materials arid Methods”]). B, Total number of viable leaves (green and turgid) íit final harvest and rates of leaf emergence (new leaves d-’). Values represent mean & SD values of three plants per treatment.
ambient C, in the laboratory) was reduced 7% in 25 m, 37% in 100 mM, and 70% in 300 m salt-treated plants (Fig. 2; Table 1). Salinity effects were less apparent foi. the 25 m- and 100 m NaC1-treated plants, when A was recalculated at a C, of 28.1 Pa (the value estimated for control plants), assuming A was directly proportional to C, - I’. Calculated values were 20.3, 20.4, 14.3, and 5.8 pmol m-’s-l for the O, 25, 100, and 300 m treatments, respectively. Glasshouse measurements gave similar results, with no dilference in A between O and 25 m treatments and decreases of 25 and 58% in the 100 and 300 mM NaC1-treated plants, respectively.
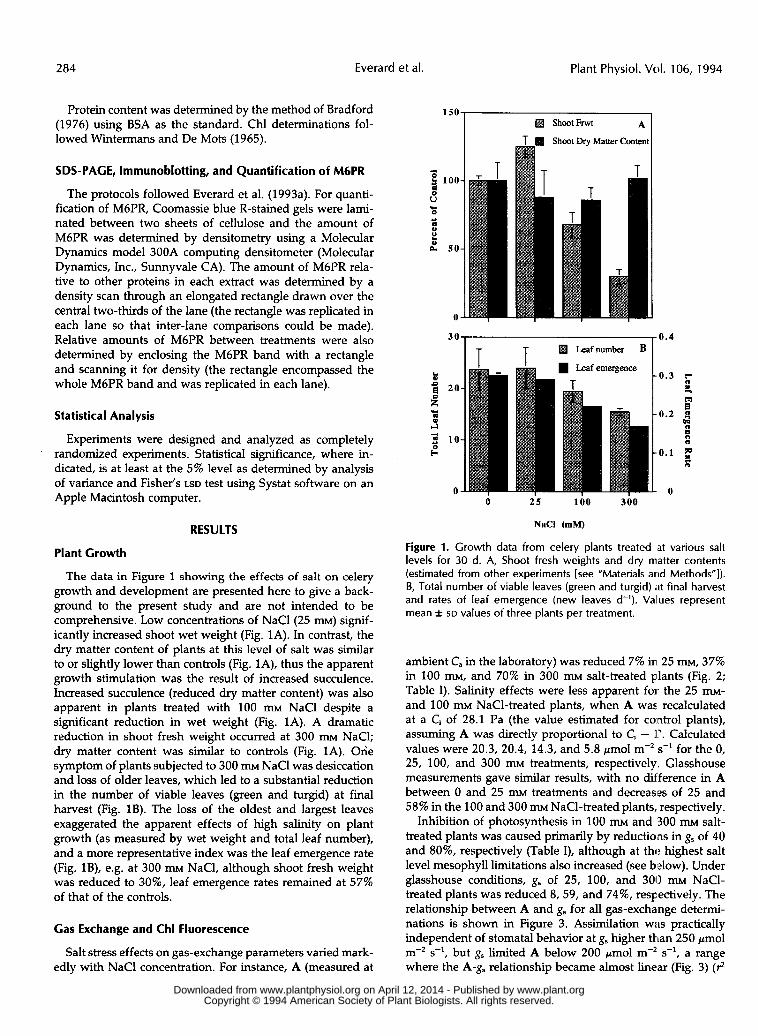
Inhibition of photosynthesis in 100 m and 300 m salt- treated plants was caused primarily by reductions in gs of 40 and 80%, respectively (Table I), although at the highest salt level mesophyll limitations also increased (see bdow). Under glasshouse conditions, g, of 25, 100, and 300 m NaCl- treated plants was reduced 8,59, and 74%, resFectively. The relationship between A and g, for all gas-exchange determi- nations is shown in Figure 3. Assimilation wits practically independent of stomatal behavior at g, higher than 250 pmol m-2 - 1 s , but g, limited A below 200 pmol m-’ s-’, a range where the A-g, relationship became almost linear (Fig. 3) (12
www.plant.org on April 12, 2014 - Published by www.plantphysiol.orgDownloaded from Copyright © 1994 American Society of Plant Biologists. All rights reserved.
Carbon Partitioning and Salinity in Celery 285
Control 30
20 -
10 -
0 -
mM
mM
mM
L Í a I . I I I I I I I
O 20 40 60 80 100
Internal CO, (Pa)
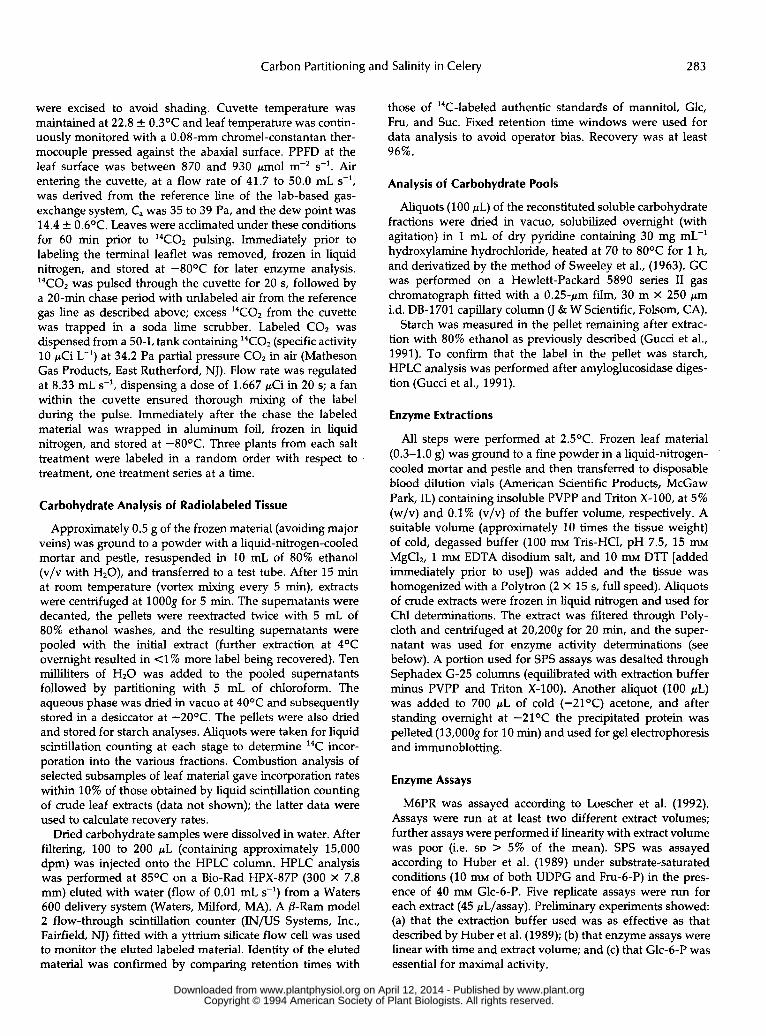
Figure 2. A-Ci of mature leaves of celery after 4 weeks of treatment at different salt concentrations. Data from three or four plants per treatment were pooled, after critical photosynthetic parameters (reported in Table I) were calculated from curves fitted to individual data sets, and curves were fitted by nonlinear regression models of the monomolecular asymptotic type for illustrative purposes only; ? values were 0.71, 0.91, 0.91, and 0.72 for control and 25, 100, and 300 mM NaCl treatments, respectively. These curves are rep- resentative of gas-exchange differences caused by the salinity treat- ments. Arrows indicate the gradient of the gas-supply curves (slope of arrow tail) and the points at which they intersected the corre- sponding A-Ci curves; stomatal limitations and the Ci/C, ratios were calculated at these points.
= 0.81). Data points for 100- and 3 0 0 - m ~ treatments were mostly confined to this latter region, with less scatter for 300 than for 100 m~ (Fig. 3). Stomatal limitations increased from 0.15 to 0.25 between O and 100 m~ NaC1. This reflected partial stomatal closure, as indicated by the progressive de- cline of g, with increasing salt concentration (Table I). At 300 mM NaCl, g, was much reduced, and mesophyll limitations balanced the further decrease of g,. Hence, stomatal limita- tions were similar to those calculated for 100 m~ NaCl- treated plants (Table I). The increase in nonstomatal limita- tions with salt stress was clearly shown by the reduction of k
25 O
15 A
10 c O 0 Control
5
100 200 300 400 500 600
g, (mmol m-2 s-l)
Figure 3. Relationship between A and g, of mature celery leaves after 3.5 to 4 weeks of treatment at various salt concentrations. Gas-exchange measurements were made in the laboratory (open symbols) and in the glasshouse (closed symbols). The curve repre- sents the best-fit relationship obtained by nonlinear regression analysis of pooled data (3 = 0.72).
to 80 and 25% of control values at 100 and 300 m~ NaCl, respectively. There was no difference between k of control and 25 mM NaC1-treated plants (Table I). r increased 3-fold at 300 mM NaCl, but was unchanged at lower salt concentra- tions (Fig. 2; Table I). At 300 mM NaC1, A saturated at lower Ci than in the other treatments (Fig. 2). The combined effect of salinity on k and gs was a decline in the calculated Ci and Ci/C, ratio for the 25- and 1 0 0 - m ~ treatments. The similarity between Ci and Ci/Ca values in control and 300 m~ NaCl- treated plants (Table I) indicates that high salinities decreased k and reduced C02 assimilation to the extent that C02 fluxes, even through the partially closed stomata, were sufficient to meet the reduced demand. Further, the increased dark res- piration rate in 300 mM NaC1-treated plants may also be expected to elevate Ci at this salt level.
A further consequence of salt stress on A and gs was a change in WUE (data not shown). Up to moderate salt levels
Table 1. Cas-exchange parameters derived from A-Cl response curves of fully expanded leaves of mature celery plants subjected to 4 weeks of salinity treatment
COz assimilation rates and stomatal conductances of O, 25, 100, and 300 mM NaCI-treated plants were measured at C, of 36.7, 37.2, 35.6, and 40.7 Pa, respectively, prior to A-Ci measurements. Ci and Ci/C, refer to values calculated at the point of intersection of the A-Ci and gas supply curves (see “Materials and Methods”). Values represent mean f SD of three to four plants.
Treatment (mM NaCI)
O 25 1 O0 300 Parameter
A at 35 Pa (pmol m-’ s-’) 20.3 f 4 . 7 18.8 f 1.6 1 2 . 8 f 0 . 7 6 . 0 f 1.3 k (pmol COz s-’ Pa-’) 0.75 f 0.25 0.76 f 0.13 0.60 f 0.10 0.19 f 0.03 r (Pa) 3.4 f 0.19 3.8 f 0.31 3.4 f 0.59 10.9 f 1.43 g, at 35 Pa (mmol HzO m-’ s-’) 231 f 8 0 1 9 5 f 5 2 1 3 9 f 4 65 f 8 Stomatal limitation at 35 Pa 0.14 f 0.04 0.19 2 0.07 0.25 2 0.02 0.25 2 0.05 Ci at 35 Pa (Pa) 28.1 f 1.9 26.2 f 2.0 25.5 f 0.8 28.6 f 2.5 Ci/Ca (‘10) 80 75 73 82
www.plant.org on April 12, 2014 - Published by www.plantphysiol.orgDownloaded from Copyright © 1994 American Society of Plant Biologists. All rights reserved.
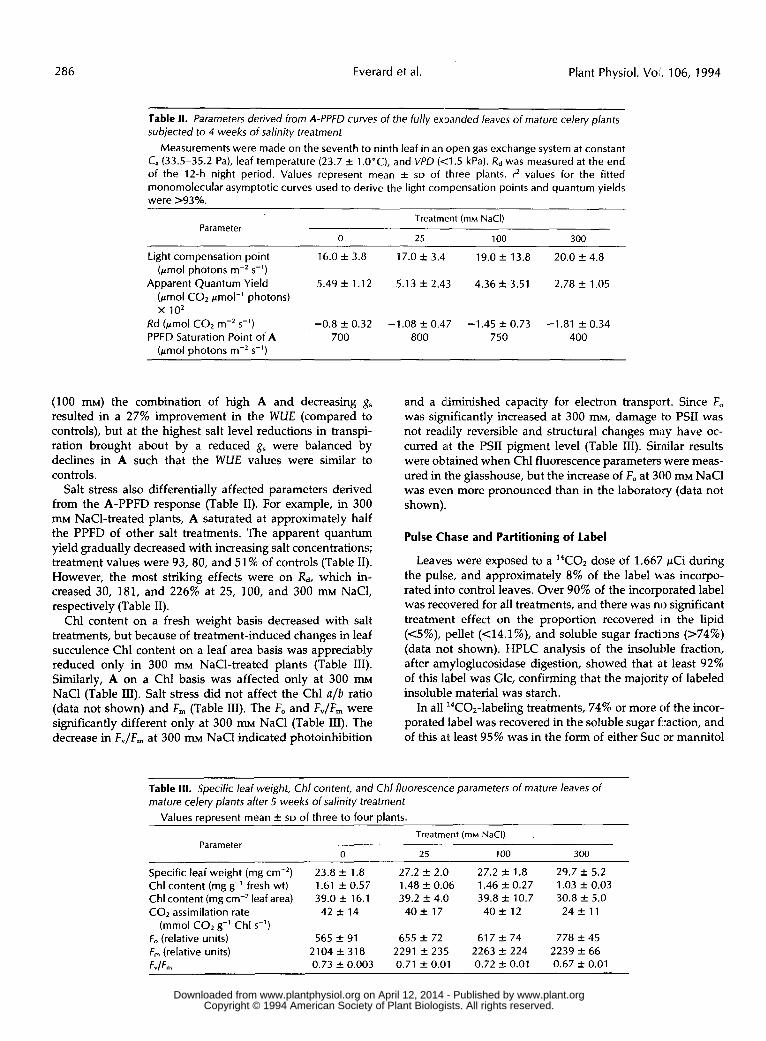
286 Everard et al. Plant Physiol. Vol. 106, 1994
Table I I . Parameters derived from A-PPFD curves of the fully ex,Danded leaves of mature celery plants subjected to 4 weeks of salinity treatment
Measurements were made on the seventh to ninth leaf in an open gas exchange system at constant C, (33.5-35.2 Pa), leaf temperature (23.7 f l.O"C), and VPD ( 4 . 5 kPa). R d was measured at t h e end of the 12-h night period. Values represent mean f SD of three plants. rZ values for the fitted monomolecular asymptotic curves used to derive the light compensation points and quantum yields were >%yo.
Treatm,ent (mM NaCI)
O 25 1 O0 300 Parameter
_____ ______ ~ _ _ _ _ _ ~ ~
Light compensation point 16.0 f 3.8 17.0 f 3.4 19.0 f 13.8 20.0 f 4.8
Apparent Quantum Yield 5.49 f 1.12 5.13 k 2.43 4.36 f 3.51 2.78 f 1.05 (pmol photons m-, s-')
(pmol CO, pmol-' photons) x 1 0 2
Rd (pmol CO, m-'s-') -0.8 f 0.32 -1.08 f 0.47 -1.45 f 0.73 -1.81 f 0.34 PPFD Saturation Point of A 700 800 750 400
(pmol photons m-'s-')
(100 mM) the combination of high A and decreasing g, resulted in a 27% improvement in the WUE (compared to controls), but at the highest salt level reductions in transpi- ration brought about by a reduced gs were balanced by declines in A such that the WUE values were similar to controls.
Salt stress also differentially affected parameters derived from the A-PPFD response (Table 11). For example, in 300 mM NaC1-treated plants, A saturated at approximately half the PPFD of other salt treatments. The apparent quantum yield gradually decreased with increasing salt concentrations; treatment values were 93, 80, and 51% of controls (Table 11). However, the most striking effects were on Rd, which in- creased 30, 181, and 226% at 25, 100, and 300 mM NaCl, respectively (Table 11).
Chl content on a fresh weight basis decreased with salt treatments, but because of treatment-induced changes in leaf succulence Chl content on a leaf area basis was appreciably reduced only in 300 mM NaC1-treated plants (Table 111). Similarly, A on a Chl basis was affected only at 300 m~ NaCl (Table 111). Salt stress did not affect the Chl a/b ratio (data not shown) and F, (Table 111). The F, and F,/F,,, were significantly different only at 300 m~ NaCl (Table 111). The decrease in F J F , at 300 mM NaCl indicated photoinhibition
and a dliminished capacity for electron transport. Since F, was significantly increased at 300 mM, damage to PSII was not reaclily reversible and structural changes miiy have oc- curred at the PSII pigment level (Table 111). Sirnilar results were obtained when Chl fluorescence parameters were meas- ured in the glasshouse, but the increase of F, at 300 m~ NaCl was even more pronounced than in the laboratory (data not shown).
Pulse Chase and Partitioning of label
Leaves were exposed to a 14C02 dose of 1.667 pCi during the pulse, and approximately 8% of the label u'as incorpo- rated into control leaves. Over 90% of the incorporated label was recovered for all treatments, and there was no significant treatment effect on the proportion recovered in the lipid (<5%), pellet ((14.1 %), and soluble sugar fractilms (>74%) (data not shown). HPLC analysis of the insoluble fraction, after amyloglucosidase digestion, showed that at least 92% of this label was Glc, confirming that the majority of labeled insoluble material was starch.
In all ''C02-labeling treatments, 74% or more cif the incor- porated label was recovered in the soluble sugar fraction, and of this at least 95% was in the form of either Suc or mannitol
Table 111. Specific leaf weight, Chl content, and Chl fluorescence parameters of mature leaves of mature celery plants after 5 weeks of salinity treatment
Values remesent mean f SD of three to four Dlants.
Parameter Treatment (mM NaCI)
O 25 1 O0 300
Specific leaf weight (mg cm-') Chl content (mg g-' fresh wt) Chl content (mg cm-' leaf area) CO, assimilation rate
F , (relative units) F,,, (relative units) F J F ,
(mmol CO, g-' Chl s-')
~
23.8 f 1.8 1.61 f 0.57 39.0 f 16.1 42 k 14
27.2 f 2.0 27.2 f 1.8 29.7 k 5.2 1.48 f 0.06 1.46 f 0.27 1 .O3 f 0.03 39.2 f 4.0 39.8 f 10.7 30.8 f 5.0
40+. 17 4 0 A 12 2 4 f 1 1
565 f 91 2104 f 318 0.73 f 0.003
655 f 72 617 +- 74 778 f 45 2291 f 235 2263 f 224 2239 f 66 0.71 f 0.01 0.72 4 0.01 0.67 f 0.01
www.plant.org on April 12, 2014 - Published by www.plantphysiol.orgDownloaded from Copyright © 1994 American Society of Plant Biologists. All rights reserved.
Carbon Partitioning and Salinity in Celery 287
200.00 A ]
60
B - O 4 0 P 3
20 c
f
O 0.125
C o. 1
0.075
h
I
B 2 3 0.05 u
0.025
O o 25 loo 300
NaCl (mM)
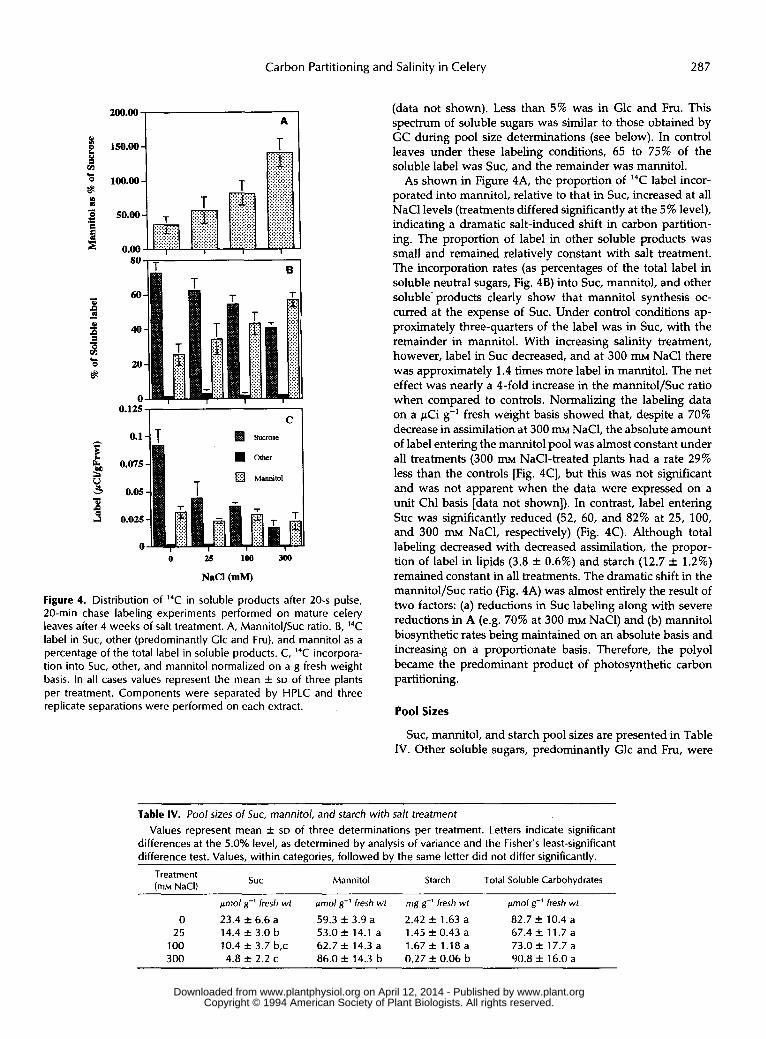
Figure 4. Distribution of 14C in soluble products after 20-s pulse, 20-min chase labeling experiments performed on mature celery leaves after 4 weeks of salt treatment. A, Mannitol/Suc ratio. B, 14C label in SUC, other (predominantly Glc and Fru), and mannitol as a percentage of the total label in soluble products. C, 14C incorpora- tion into SUC, other, and mannitol normalized on a g fresh weight basis. In all cases values represent the mean f SD of three plants per treatment. Components were separated by HPLC and three replicate separations were performed on each extract.
(data not shown). Less than 5% was in Glc and Fru. This spectrum of soluble sugars was similar to those obtained by GC during pool size determinations (see below). In control leaves under these labeling conditions, 65 to 75% of the soluble label was SUC, and the remainder was mannitol.
As shown in Figure 4A, the proportion of 14C label incor- porated into mannitol, relative to that in SUC, increased at all NaCl levels (treatments differed significantly at the 5% level), indicating a dramatic salt-induced shift in carbon partition- ing. The proportion of label in other soluble products was small and remained relatively constant with salt treatment. The incorporation rates (as percentages of the total label in soluble neutral sugars, Fig. 4B) into SUC, mannitol, and other soluble- products clearly show that mannitol synthesis oc- curred at the expense of SUC. Under control conditions ap- proximately three-quarters of the label was in SUC, with the remainder in mannitol. With increasing salinity treatment, however, label in Suc decreased, and at 300 m NaCl there was approximately 1.4 times more label in mannitol. The net effect was nearly a 4-fold increase in the mannitol/Suc ratio when compared to controls. Normalizing the labeling data on a pCi g-’ fresh weight basis showed that, despite a 70% decrease in assimilation at 300 m NaC1, the absolute amount of label entering the mannitol pool was almost constant under all treatments (300 m NaC1-treated plants had a rate 29% less than the controls [Fig. 4C], but this was not significant and was not apparent when the data were expressed on a unit Chl basis [data not shown]). In contrast, label entering SUC was significantly reduced (52, 60, and 82% at 25, 100, and 300 m NaC1, respectively) (Fig. 4C). Although total labeling decreased with decreased assimilation, the propor- tion of label in lipids (3.8 f 0.6%) and starch (12.7 & 1.2%) remained constant in all treatments. The dramatic shift in the mannitol/Suc ratio (Fig. 4A) was almost entirely the result of two factors: (a) reductions in Suc labeling along with severe reductions in A (e.g. 70% at 300 mM NaC1) and (b) mannitol biosynthetic rates being maintained on an absolute basis and increasing on a proportionate basis. Therefore, the poly01 became the predominant product of photosynthetic carbon partitioning.
Pool Sizes
SUC, mannitol, and starch pool sizes are presented in Table IV. Other soluble sugars, predominantly Glc and Fru, were
Table IV. Pool sizes of SUC, mannitol, and starch with salt treatment Values represent mean f SD of three determinations per treatment. Letters indicate significant
differences at the 5.0% level, as determined by analysis of variance and the Fisher’s least-significant difference test. Values, within categories, followed by the same letter did not differ significantly.
SUC Mannitol Starch Total Soluble Carbohydrates Treatment (mM NaCI)
pmol g-’ fresh wt pmol g-’ fresh wt mg g-’ fresh wt pmol g-’ fresh wt
O 23.4 f 6.6 a 59.3 f 3.9 a 2.42 f 1.63 a 82.7 f 10.4 a 25 14.4 f 3.0 b 53.0 f 14.1 a 1.45 f 0.43 a 67.4 f 11.7 a
1 O0 10.4 f 3.7 b,c 62.7 f 14.3 a 1.67 f 1.18 a 73.0 f 17.7 a 300 4.8 f 2.2 c 86.0 f 14.3 b 0.27 f 0.06 b 90.8 & 16.0 a
www.plant.org on April 12, 2014 - Published by www.plantphysiol.orgDownloaded from Copyright © 1994 American Society of Plant Biologists. All rights reserved.
288 Everard et al. Plant Physiol. Val. 106, 1994
present in only trace amounts in controls and were absent in salt-treated plants (data not shown). Suc content was less than half that of mannitol in control plants and declined significantly with increasing salt treatment. Mannitol/Suc pool ratios for control and for 25, 100, and 300 mM NaCl treatments averaged 2.7 f 0.7, 3.9 f 1.8, 6.3 f 1.3, and 20.2 f 8.3, respectively. Mannitol pool sizes, however, did not differ significantly except in 300 m NaCl treatments. At 300 m NaCl the mannitol pool was 26.7 pmol g-* fresh weight (146 pmol g-’ dry weight, and 33 m on a tissue concentra- tion basis, assuming that all water and mannitol in the leaf is symplastic and that the apoplastic water content does not change with salt treatments). Compared to controls, this represents a 45% increase on a fresh weight basis (42% on a dry weight basis). Despite these changes in Suc and mannitol pools, as dramatically illustrated by the mannitol/Suc ratios, total soluble carbohydrates did not differ significantly at any salt concentration (Table IV), i.e. salt-related reductions in Suc were compensated for by increases in mannitol. Although starch was only a minor component in controls, it was re- duced significantly (nearly 90%) by 300 m NaCl treatments (Table IV). Correspondingly, the mannitol/starch ratio (ex- pressed on a Glc equivalent basis) shifted from 6.2 in controls to 58.0 in 300 m NaC1-treated plants.
Enzyme Activities
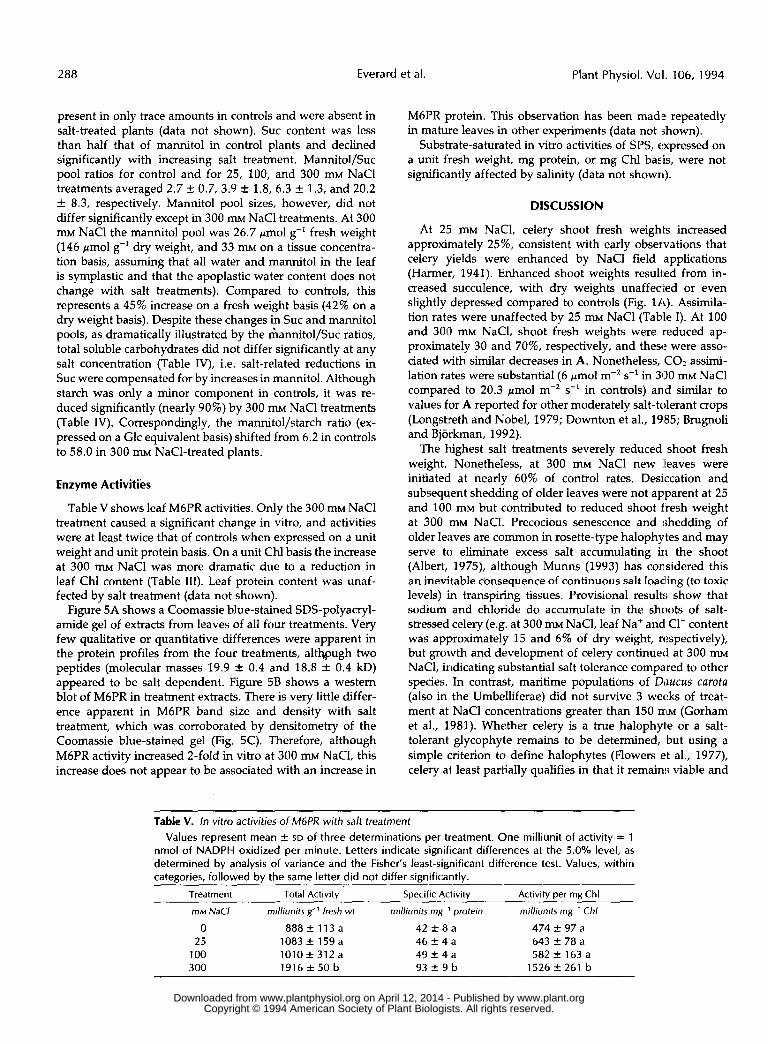
Table V shows leaf M6PR activities. Only the 300 mM NaCl treatment caused a significant change in vitro, and activities were at least twice that of controls when expressed on a unit weight and unit protein basis. On a unit Chl basis the increase at 300 mM NaCl was more dramatic due to a reduction in leaf Chl content (Table 111). Leaf protein content was unaf- fected by salt treatment (data not shown).
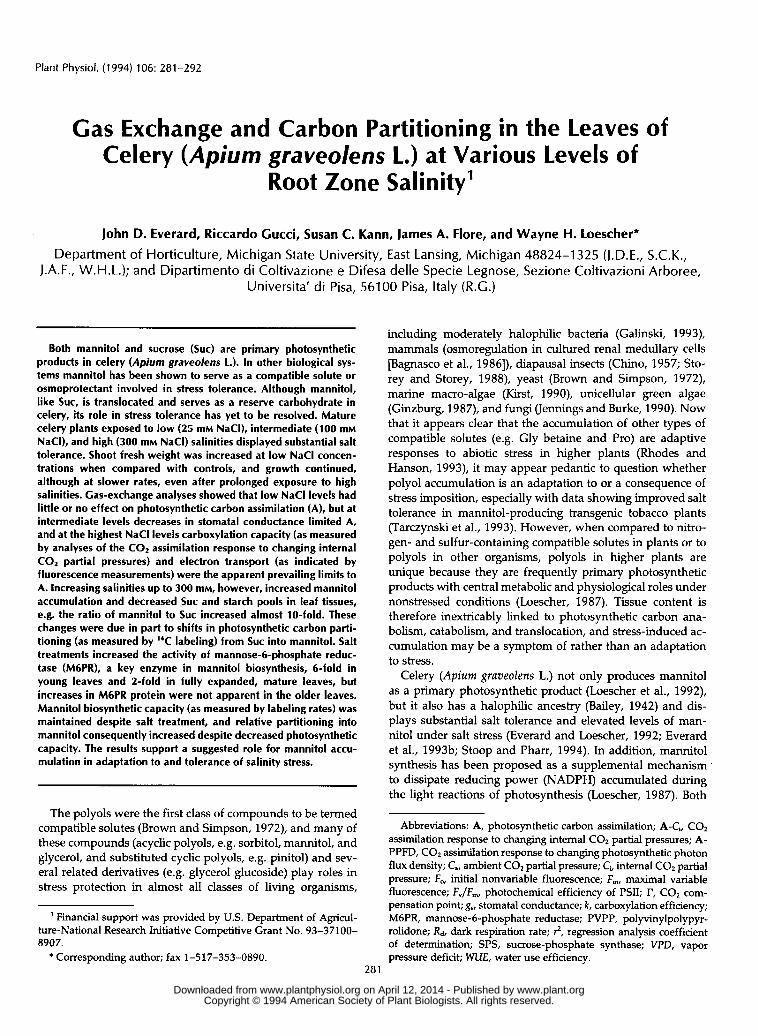
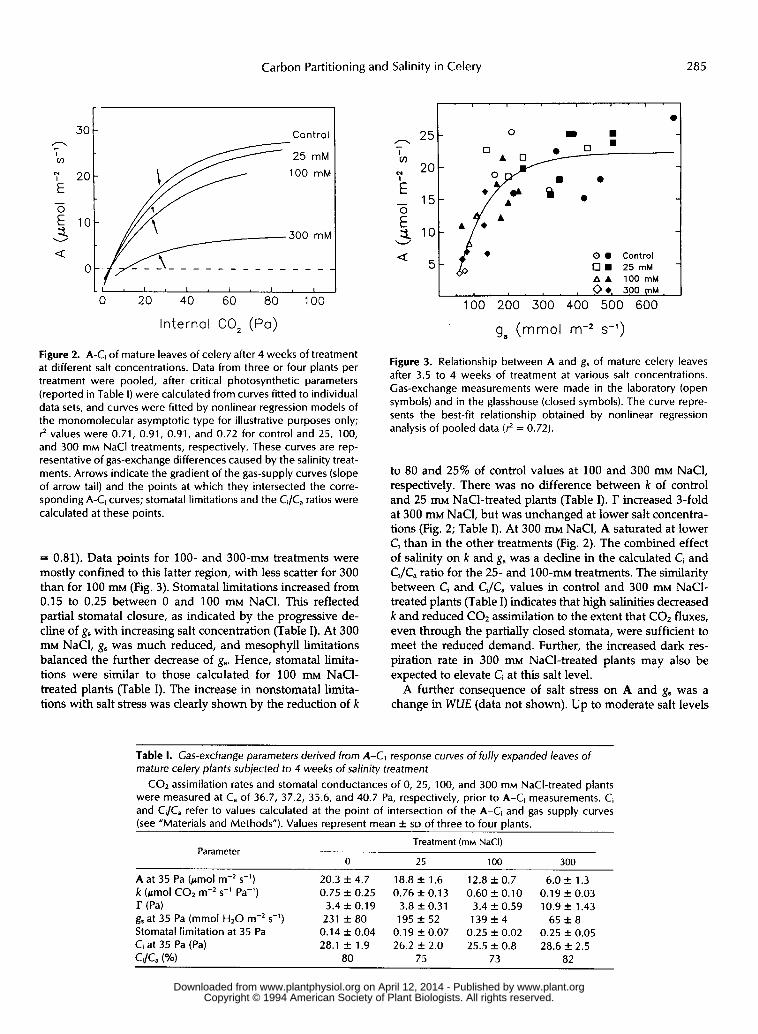
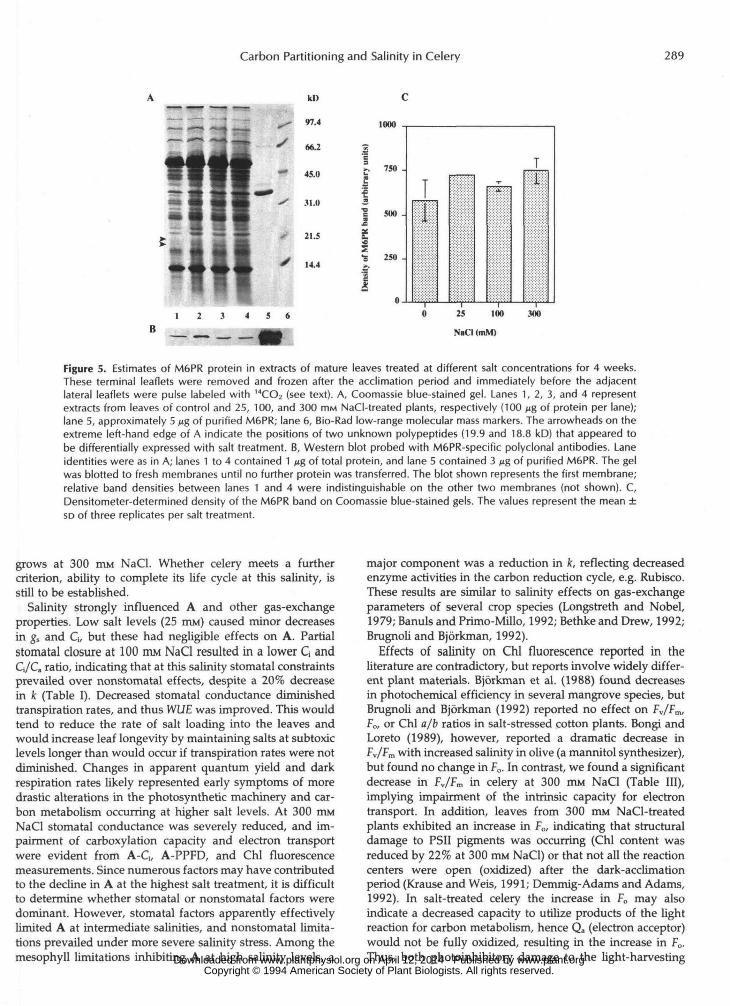
Figure 5A shows a Coomassie blue-stained SDS-polyacryl- amide gel of extracts from leaves of all four treatments. Very few qualitative or quantitative differences were apparent in the protein profiles from the four treatments, al tkugh two peptides (molecular masses 19.9 f 0.4 and 18.8 f 0.4 kD) appeared to be salt dependent. Figure 5B shows a westem blot of M6PR in treatment extracts. There is very little differ- ence apparent in M6PR band size and density with salt treatment, which was corroborated by densitometry of the Coomassie blue-stained gel (Fig. 5C). Therefore, although M6PR activity increased 2-fold in vitro at 300 mM NaCI, this increase does not appear to be associated with an increase in
M6PR protein. This observation has been made repeatedly in mahue leaves in other experiments (data not shown).
Substrate-saturated in vitro activities of SPS, expressed on a unit lresh weight, mg protein, or mg Chl basis, were not significantly affected by salinity (data not shown).
DISCUSSION
At 25 mM NaCI, celery shoot fresh weights increased approximately 25%, consistent with early observations that celery yields were enhanced by NaCl field applications (Harmer, 1941). Enhanced shoot weights resulíed from in- creased succulence, with dry weights unaffecied or even slightly depressed compared to controls (Fig. 1A). Assimila- tion rates were unaffected by 25 m NaCl (Table I). At 100 and 300 m NaCl, shoot fresh weights were reduced ap- proximately 30 and 70%, respectively, and these were asso- ciated with similar decreases in A. Nonetheless, C02 assimi- lation rates were substantial (6 pmol m-’ s-l in 3130 m NaCl comparled to 20.3 pmol m-’ s-’ in controls) and similar to values for A reported for other moderately salt-tolerant crops (Longskreth and Nobel, 1979; Downton et al., 1985; Brugnoli and Bjorkman, 1992).
The highest salt treatments severely reduced shoot fresh weight. Nonetheless, at 300 m NaCl new leaves were initiated at nearly 60% of control rates. Desiccation and subsequent shedding of older leaves were not apparent at 25 and 100 m but contributed to reduced shoot fresh weight at 300 mM NaCI. Precocious senescence and !ihedding of older leaves are common in rosette-type halophytes and may serve to eliminate excess salt accumulating in the shoot (Albert, 1975), although Munns (1993) has considered this an inevitable consequence of continuous salt loading (to toxic levels) in transpiring tissues. Provisional result!; show that sodium and chloride do accumulate in the shoots of salt- stressed celery (e.g. at 300 m NaCl, leaf Na+ and C1- content was approximately 15 and 6% of dry weight, respectively), but growth and development of celery continued at 300 m NaCI, indicating substantial salt tolerance compared to other species. In contrast, maritime populations of Diiucus carota (also in the Umbelliferae) did not survive 3 wetbks of treat- ment at NaCl concentrations greater than 150 ELM (Gorham et al., 1981). Whether celery is a true halophyle or a salt- tolerant glycophyte remains to be determined, but using a simple criterion to define halophytes (Flowers et al., 1977), celery at least partially qualifies in that it remain:; viable and
Table V. In vitro activities of M6PR with salt treatment Values represent mean f SD of three determinations per treatment. One milliunit of activity = 1
nmol of NADPH oxidized per minute. Letters indicate significant differences at the 5.0% level, as determined by analysis of variance and the Fisher’s least-significant difference test. Values, within categories, followed by the same letter did not differ Significantly.
Treatment Total Activity Specific Activity Activity per mg Chl
mM NaCl milliunits g-’ fresh wt milliunits mg-’ protein milliunits mg-’ Chl
O 888+ 113a 42 -+ 8 a 474 f 97 a 25 1083 f 159 a 46 f 4 a 643 f 78 a
1 O0 1010 f 312 a 49 f 4 a 582 f 163 a 300 1916 f 50 b 93 f 9 I3 1526 f 261 b
www.plant.org on April 12, 2014 - Published by www.plantphysiol.orgDownloaded from Copyright © 1994 American Society of Plant Biologists. All rights reserved.
Carbon Partitioning and Salinity in Celery 289
U)
»7.4
66.2
45.0
31.0
21.5
,4.4
I. 750-zf1 500-
£•5 250 ->,
0-
I11
Tr.y^v
Tl-iill
2 3 4 5 6 25 100 300
N.CI (mM)
Figure 5. Estimates of M6PR protein in extracts of mature leaves treated at different salt concentrations for 4 weeks.These terminal leaflets were removed and frozen after the acclimation period and immediately before the adjacentlateral leaflets were pulse labeled with 14CO2 (see text). A, Coomassie blue-stained gel. Lanes 1, 2, 3, and 4 representextracts from leaves of control and 25, 100, and 300 mM NaCI-treated plants, respectively (100 jjg of protein per lane);lane 5, approximately 5 n% of purified M6PR; lane 6, Bio-Rad low-range molecular mass markers. The arrowheads on theextreme left-hand edge of A indicate the positions of two unknown polypeptides (19.9 and 18.8 kD) that appeared tobe differentially expressed with salt treatment. B, Western blot probed with M6PR-specific polyclonal antibodies. Laneidentities were as in A; lanes 1 to 4 contained 1 ng of total protein, and lane 5 contained 3 /ig of purified M6PR. The gelwas blotted to fresh membranes until no further protein was transferred. The blot shown represents the first membrane;relative band densities between lanes 1 and 4 were indistinguishable on the other two membranes (not shown). C,Densitometer-determined density of the M6PR band on Coomassie blue-stained gels. The values represent the mean ±so of three replicates per salt treatment.
grows at 300 mM NaCl. Whether celery meets a furthercriterion, ability to complete its life cycle at this salinity, isstill to be established.
Salinity strongly influenced A and other gas-exchangeproperties. Low salt levels (25 HIM) caused minor decreasesin gs and Q, but these had negligible effects on A. Partialstomatal closure at 100 mM NaCl resulted in a lower G andQ/Ca ratio, indicating that at this salinity stomatal constraintsprevailed over nonstomatal effects, despite a 20% decreasein k (Table I). Decreased stomatal conductance diminishedtranspiration rates, and thus WUE was improved. This wouldtend to reduce the rate of salt loading into the leaves andwould increase leaf longevity by maintaining salts at subtoxiclevels longer than would occur if transpiration rates were notdiminished. Changes in apparent quantum yield and darkrespiration rates likely represented early symptoms of moredrastic alterations in the photosynthetic machinery and car-bon metabolism occurring at higher salt levels. At 300 mMNaCl stomatal conductance was severely reduced, and im-pairment of carboxylation capacity and electron transportwere evident from A-C, A-PPFD, and Chl fluorescencemeasurements. Since numerous factors may have contributedto the decline in A at the highest salt treatment, it is difficultto determine whether stomatal or nonstomatal factors weredominant. However, stomatal factors apparently effectivelylimited A at intermediate salinities, and nonstomatal limita-tions prevailed under more severe salinity stress. Among themesophyll limitations inhibiting A at high salinity levels, a
major component was a reduction in k, reflecting decreasedenzyme activities in the carbon reduction cycle, e.g. Rubisco.These results are similar to salinity effects on gas-exchangeparameters of several crop species (Longstreth and Nobel,1979; Banuls and Primo-Millo, 1992; Bethke and Drew, 1992;Brugnoli and Bjorkman, 1992).
Effects of salinity on Chl fluorescence reported in theliterature are contradictory, but reports involve widely differ-ent plant materials. Bjorkman et al. (1988) found decreasesin photochemical efficiency in several mangrove species, butBrugnoli and Bjorkman (1992) reported no effect on Fv/Fm,F0, or Chl a/b ratios in salt-stressed cotton plants. Bongi andLoreto (1989), however, reported a dramatic decrease inFv/Fm with increased salinity in olive (a mannitol synthesizer),but found no change in F0. In contrast, we found a significantdecrease in Fv/Fm in celery at 300 mM NaCl (Table III),implying impairment of the intrinsic capacity for electrontransport. In addition, leaves from 300 mM NaCl-rreatedplants exhibited an increase in F0, indicating that structuraldamage to PSII pigments was occurring (Chl content wasreduced by 22% at 300 mM NaCl) or that not all the reactioncenters were open (oxidized) after the dark-acclimationperiod (Krause and Weis, 1991; Demmig- Adams and Adams,1992). In salt-treated celery the increase in F0 may alsoindicate a decreased capacity to utilize products of the lightreaction for carbon metabolism, hence Q, (electron acceptor)would not be fully oxidized, resulting in the increase in F0.Thus, both photoinhibitory damage to the light-harvesting www.plant.org on April 12, 2014 - Published by www.plantphysiol.orgDownloaded from
Copyright © 1994 American Society of Plant Biologists. All rights reserved.
2 90 Everard et al. Plant Physiol. Vol. 106, 1994
complex and reduced efficiency for electron transport, when reaction centers were open, effectively contributed to meso- phyll limitation of photosynthesis in celery at high salinity.
As in other polyol-synthesizing higher plants (Ahmad et al., 1979; Jefferies et al., 1979; Gorham et al., 1981; Briens and Larher, 1982,1983), mannitol preferentially accumulated in celery leaves in response to salinity (Table IV). In these tissues mannitol concentrations (approximately 9% of the tissue dry weight at 300 m~ NaCI) are comparable to those of sorbitol in salt-marsh populations of Plantago maritima (Ahmad et al., 1979; Briens and Larher, 1983). In celery, however, the initial mannitol concentration in controls was high, and salinity increased mannitol only 1.5-fold (on a fresh weight or molar tissue water content basis), compared to an 8-fold increase in sorbitol in P. maritima (Ahmad et al., 1979). The mannitol increases in celery, however, were also accompanied by substantial decreases in Suc pools, e.g. to only 20% of controls in 300 m~ NaC1-treated plants.
As indicated in the introduction, accumulation of a com- pound in response to salt stress may be purely a correlative phenomenon providing little or no insight into the tolerance or resistance mechanisms involved. It may not be possible to conclude whether accumulation is a consequence or an ad- aptation to the stress. Data from other systems showing an adaptive or protective role for the same compound may be inappropriate for comparison. The contrasting behavior of mannitol and Suc pools here, however, is instructive. To- gether they represent the primary photosynthetic products of celery source leaves (over 70% of fixed carbon after a 20-s pulse, 20-min chase) and are equally important as phloem translocates (Davis and Loescher, 1990), but these two com- pounds differ metabolically. Suc is respired in both sink and source leaves, whereas mannitol is catabolized only in the former (Fellman and Loescher, 1987). Assuming that the same holds for salt-treated tissues, mannitol accumulation could result from salt-induced growth reductions limiting sink strength. Therefore, it would accumulate in source leaves, because it is not respired (is catabolically inert) in these tissues. On the other hand, Suc depletion would be expected to be enhanced due to increased demand as indi- cated by the enhanced dark respiration rates (Table 11). Our current study shows, however, that mannitol synthesis is sustained at approximately the same level in 300 m~ NaCI- treated plants as it is in controls, despite a 60 to 70% reduction in carbon assimilation in the former. The combination of an undiminished rate of synthesis and a substantial decrease in plant and consequently sink size would inevitably lead to elevated mannitol pools. Conversely, the decreases in Suc synthesis almost mirrored the decrease in assimilation rates, which, combined with the elevated demand for respiratory substrates, is consistent with the observed depletion of the Suc pools. The increased respiratory demand for substrates was also probably important in reducing the starch pools at the highest salt treatments.
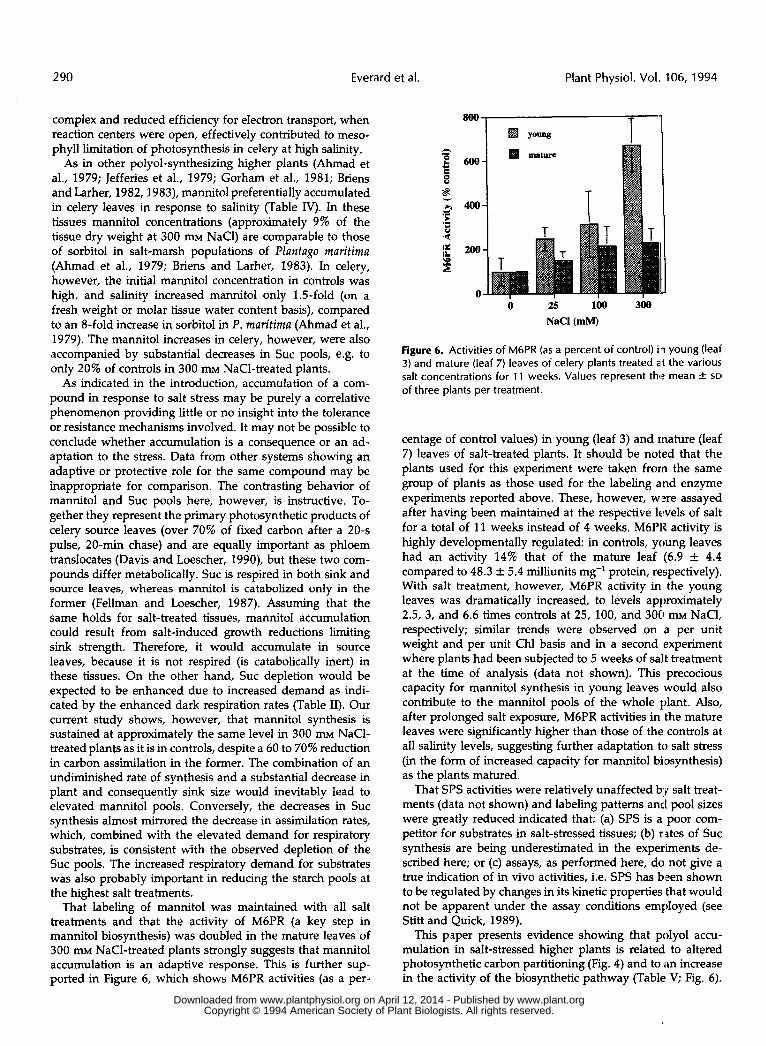
That labeling of mannitol was maintained with all salt treatments and that the activity of M6PR (a key step in mannitol biosynthesis) was doubled in the mature leaves of 300 m~ NaC1-treated plants strongly suggests that mannitol accumulation is an adaptive response. This is further sup- ported in Figure 6, which shows M6PR activities (as a per-
1 800
ò 100 300 NaCl (mM)
Figure 6. Activities of M6PR (as a percent of control) ii young (leaf 3) and mature (leaf 7) leaves of celery plants treated a t the various salt concentrations for 11 weeks. Values represent t h e mean f SD
of three plants per treatment.
centage of control values) in young (leaf 3) and mature (leaf 7) leaves of salt-treated plants. It should be noted that the plants used for this experiment were taken from the same group of plants as those used for the labeling and enzyme experiments reported above. These, however, wlzre assayed after having been maintained at the respective levels of salt for a total of 11 weeks instead of 4 weeks. M6PR activity is highly developmentally regulated: in controls, young leaves had an activity 14% that of the mature leaf (6.9 k 4.4 compared to 48.3 & 5.4 milliunits mg-' protein, respectively). With salt treatment, however, M6PR activity in the young leaves was dramatically increased, to levels approximately 2.5, 3, and 6.6 times controls at 25, 100, and 30C1 m~ NaCI, respectively; similar trends were observed on a per unit weight and per unit Chl basis and in a second experiment where plants had been subjected to 5 weeks of salt treatment at the time of analysis (data not shown). This precocious capacity for mannitol synthesis in young leaves would also contribute to the mannitol pools of the whole plant. Also, after prolonged salt exposure, M6PR activities in the mature leaves were significantly higher than those of the controls at all salinity levels, suggesting further adaptation to salt stress (in the form of increased capacity for mannitol biosynthesis) as the plants matured.
That SPS activities were relatively unaffected b,q salt treat- ments (data not shown) and labeling pattems and pool sizes were greatly reduced indicated that: (a) SPS is a poor com- petitor for substrates in salt-stressed tissues; (b) mtes of Suc synthesis are being underestimated in the experiments de- scribed here; or (c) assays, as performed here, do not give a true indication of in vivo activities, i.e. SPS has been shown to be regulated by changes in its kinetic properties that would not be apparent under the assay conditions employed (see Stitt and Quick, 1989).
This paper presents evidence showing that poly01 accu- mulation in salt-stressed higher plants is related to altered photosynthetic carbon partitioning (Fig. 4) and to ,in increase in the activity of the biosynthetic pathway (Table V; Fig. 6) .
www.plant.org on April 12, 2014 - Published by www.plantphysiol.orgDownloaded from Copyright © 1994 American Society of Plant Biologists. All rights reserved.
Carbon Partitioning and Salinity in Celery 291
Taken together such data imply that mannitol accumulation is a response to rather than a consequence of salt stress. Similar observations have been reported in the unicellular green algae Dunaliella (Bental et al., 1990) and Chlamydomo- nas reinhardtii (Husic and Tolbert, 1986), which with salt stress divert photosynthetic carbon and starch degradation products into glycerol (another polyol). In Dunaliella, in- creases in glycerol synthesis are associated with salt stimu- lation of a key biosynthetic enzyme, a chloroplastic dihy- droxyacetone phosphate reductase (Goyal et al., 1987; Gee et al., 1993). In the marine alga Platymonas subcordiformis, osmotic-induced changes in mannitol levels have been asso- ciated with differential salt effects on the synthetic and degradative enzymes (Richter and Kirst, 1987). We have not studied salt effects on M6PR in detail, but provisional data suggest that salt inhibits in vitro activity (W.H. Loescher, unpublished data), making it unlikely that the elevated M6PR activities in extracts from 300 ITLM NaC1-treated plants were due to direct salt effects. This is corroborated by the obser- vation that M6PR activities in extracts from 300 m~ NaC1- treated plants were unaffected by desalting (data not shown). That increased M6PR activities in mature leaves were appar- ently not correlated to the amount of M6PR protein in the extracts (Fig. 5) suggests that the enhanced activity was the result of enzyme activation (fine regulation) rather than de novo synthesis (coarse regulation). The potential for covalent modification deserves further investigation, as do the effects of salinity stress on the expression of the gene encoding M6PR.
One current hypothesis as to how compatible solutes, such as mannitol, protect plants under salt stress is that these materials preferentially accumulate in the cytosol, maintain- ing osmotic balance with metabolically perturbing ions se- questered in the vacuole (Flowers et al., 1977; Wyn Jones, 1984). There is good experimental evidence for asymmetric cellular distribution of ions in other species (e.g. Hajibagheri and Flowers, 1989; see also, Wyn Jones, 1984), but informa- tion on the intercellular distribution of compatible solutes is lacking, due to difficulties in obtaining reliable measurements (Leigh et al., 1981). In celery, however, there is quite con- vincing data from cellular subfractionation (in petioles; Keller and Matile, 1989) and transport kinetics (in leaves; Davis and Loescher, 1990) suggesting that the bulk (70% in the case of petioles) of the mannitol pool is vacuolar. Nonetheless, be- cause of the much smaller size of the cytosolic compartment, Keller and Matile (1989) estimated that the mannitol concen- tration there was 300 mM. These values, however, are esti- mates for nonstressed plants. Here the difference between control and 300 m~ NaC1-treated plants in total tissue man- nitol concentration was only 33 m ~ , and it is difficult to visualize how such a small increase (relative to the stress imposed) could counter the increased osmotic demand of the vacuole unless there is large-scale redistribution of mannitol (out of the vacuole and into the cytosol) with salt stress. Altematively, other osmotically active compounds may sup- plement the mannitol pool, and both Pro and y-amino bu- tyrate have been shown to accumulate in desiccated celery embryos (Saranga et al., 1992). A direct test, using transgenic tobacco plants, of the role of mannitol in protecting higher plants from salt stress indicated that only 6 pmol g-' fresh
weight (approximately one-tenth of the control levels here) or less was enough to confer salt tolerance (Tarczynski et al., 1993), which may suggest (a) that mannitol is entirely local- ized in the cytosol of the transgenic tobacco cells or (b) that the protective role of mannitol is not entirely osmotic.
A possible (nonosmotic) protective role for mannitol bio- synthesis could involve dissipation of photochemical energy in salt-stressed plants. Mannitol synthesis utilizes cytosoli- cally generated NADPH and in the process recycles some triose phosphates back to the plastids (Rumpho et al., 1983; Loescher, 1987). The importance of such a mechanism is difficult to address and will have to await studies in which mannitol synthesis can be manipulated independently of salinity stress.
In summary, we have here demonstrated (a) that celery is capable of substantial salt tolerance, (b) that mannitol accu- mulates with increasing salinity, and (c) that mannitol accu- mulation is due to a dramatic shift of photosynthetic carbon partitioning into mannitol, primarily at the expense of SUC. We have also shown that activity of M6PR, a key enzyme in the mannitol synthetic pathway, increases in both young and older mature leaves with salt treatment. Although such data may not unequivocally link mannitol accumulation to salt tolerance in celery, the observation that mannitol synthesis in 300 ITLM NaC1-treated plants was similar to that in controls, despite a 60 to 70% reduction in assimilation rate, shows that mannitol synthesis is not only maintained but is indeed preferentially favored in salt-stressed celery plants. This also suggests that mannitol biosynthesis and accumulation are adaptations to, rather than consequences of, salt stress.
Received December 31, 1993; accepted May 3, 1994. Copyright Clearance Center: 0032-0889/94/106/0281/12.
LITERATURE CITED
Ahmad I, Larher F, Stewart GR (1979) Sorbitol, a compatible osmotic solute in Plantago maritima. New Phytol 8 2 671-678
Albert R (1975) Salt regulation in halophytes. Oecologia 21: 57-71 Bagnasco S, Balaban R, Fales HM, Yang Y-M, Burg M (1986)
Predominant osmotically active organic solutes in rat and rabbit renal medullas. J Biol Chem 261: 5872-5877
Bailey LH (1942) The Standard Cyclopedia of Horticulture. M a d - lan, New York
Banuls J, Primo-Millo E (1992) Effects of chloride and sodium on gas exchange parameters and water relations of citrus plants. Physiol Plant 86: 115-123
Bental M, Pick U, Avron M, Degani H (1990) The role of intracel- lular orthophosphate in triggering osmoregulation in the alga Dunaliella salina. Eur J Biochem 188: 117-122
Bethke PC, Drew MC (1992) Stomatal and non-stomatal compo- nents to inhibition of photosynthesis in leaves of Capsicum annuum during progressive exposure to NaCl salinity. Plant Physiol 9 9
Bjorkman O, Demmig B, Andrews TJ (1988) Mangrove photosyn- thesis: response to high-irradiance stress. Aust J Plant Physiol 15
Bond G, Loreto F (1989) Gas-exchange properties of salt-stressed olive (Olea europen L.) leaves. Plant Physiol90: 1408-1416
Bradford MM (1976) A rapid and sensitive method for the quanti- tation of microgram quantities of protein using the principle of protein-dye binding. Anal Biochem 72: 248-254
Briens M, Larher F (1982) Osmoregulation in halophytic higher plants: a comparative study of soluble carbohydrates, polyols, betaines and free proline. Plant Cell Environ 5 287-292
219-226
43-61
www.plant.org on April 12, 2014 - Published by www.plantphysiol.orgDownloaded from Copyright © 1994 American Society of Plant Biologists. All rights reserved.
292 Everard et al. Plant Physiol. Vol. 106, 1994
Briens M, Larher F (1983) Sorbitol accumulation in Plantaginaceae; further evidence for a function in stress tolerance. Z Pflanzenphy- si01 110 447-458
Brown AD, Simpson JR (1972) Water relations of sugar-tolerant yeasts: the role of intracellular polyols. J Gen Microbiol 7 2
Brugnoli E, Bjorkman O (1992) Growth of cotton under continuous salinity stress: influence on allocation pattern, stomatal and non- stomatal components of photosynthesis and dissipation of excess light energy. Planta 187: 335-347
Chino H (1957) Conversion of glycogen to sorbitol and glycerol in the diapause egg of the Bombyx silkworm. Nature 180 606-607
Davis JM, Fellman JK, Loescher WH (1988) Biosynthesis of sucrose and mannitol as a function of leaf age in celery (Apium graveolens L.). Plant Physiol 86: 129-133
Davis JM, Loescher WH (1990) ['4C]-Assimilate translocation in the light and dark in celery (Apium graveolens) leaves of different ages. Physiol Plant 79: 656-662
Demmig-Adams B, Adams WW (1992) Photoprotection and other responses of plants to high light stress. Annu Rev Plant Physiol Plant Mol Biol43 599-626
Downton WJS, Grant WJR, Robinson SP (1985) Photosynthetic and stomatal responses of spinach leaves to salt stress. Plant Physiol77: 85-88
Everard JD, Franceschi VR, Loescher WH (1993a) Mannose-6- phosphate reductase, a key enzyme in photoassimilate partitioning, is abundant and located in the cytosol of photosynthetically active cells of celery (Apium graveolens L.) source leaves. Plant Physiol
Everard JD, Gucci R, Kann SC, Flore JA, Loescher WH (1993b) Growth analyses, gas exchange characteristics, and salt tolerance in celery (abstract No. 912). Plant PhysiollO2 5-159
Everard JD, Loescher WH (1992) Investigations into the salt toler- ance of the mannitol producer celery (abstract No. 166). Plant Physiol99: S-28
Fellman JK, Loescher WH (1987) Comparative studies of sucrose and mannitol utilization in celery (Apium graveolens). Physiol Plant
Flowers TJ, Troke PF, Yeo AR (1977) The mechanism of salt tolerance in halophytes. Annu Rev Plant Physiol28 89-121
Galinski EA (1993) Compatible solutes of halophilic eubacteria- molecular principles, water-solute interaction, stress protection. Experientia 4 9 487-496
Gee R, Goyal A, Byerrum RU, Tolbert NE (1993) Two isoforms of dihydroxyacetone phosphate reductase from the chloroplasts of Dunaliella tertiolecta. Plant Physiol 103: 243-249
Ginzburg M (1987) Dunaliella: a green alga adapted to salt. Adv Bot Res 1 4 93-183
Gorham J, Hughes L, Wyn Jones RG (1981) Low-molecular-weight carbohydrates in some salt-stressed plants. Physiol Plant 53: 27-33
Goyal A, Brown AD, Gimmler H (1987) Regulation of salt-induced starch degradation in Dunaliella tertiolecta. J Plant Physiol 127: 77-96
Gucci R, Xiloyannis C, Flore JA (1991) Gas exchange parameters, water relations and carbohydrate partitioning in leaves of field- grown Prunus domestica following fruit removal. Physiol Plant 8 3 497-505
Hajibagheri MA, Flowers TJ (1989) X-ray microanalysis of ion distribution within root cortical cells of the halophyte Suaeda maritima (L.) Dum. Planta 177: 131-134
Harmer PM (1941) The muck soils of Michigan, their management and uses. Bulletin, Michigan State College Agricultural Experiment Station
Huber JL, Huber SC, Nielsen TH (1989) Protein phosphorylation as a mechanism for regulation of spinach leaf sucrose-phosphate synthase activity. Arch Biochem Biophys 270 681-690
Husk HD, Tolbert NE (1986) Effect of osmotic stress on carbon
589-591
102 345-356
6 9 337-341
metabolism in Chlamydomonas reinhardtii. Plant Physiol 8 2 594-596
Jefferies RL, Rudmik T, Dillon EM (1979) Responses cd halophytes to high salinities and low water potentials. Plant Physiol 64:
Jennings DH, Burke RM (1990) Compatible solutes--lhe mycolog- ical dimension and their role as physiological buffwing agents. New Phytol 116: 277-283
Jones HG (1985) Partitioning stomatal and nonstomatd limitations to photosynthesis. Plant Cell Environ 8: 95-104
Keller F, Matile P (1989) Storage of sugars and mannitol in petioles of celeiy leaves. New Phytol 113 291-299
Kirst GO (1990) Salinity tolerance of eukaryotic marine algae. Annu Rev Plant Physiol Plant Mol Biol41: 21-53
Krause GH, Weis E (1991) Chlorophyll fluorescence arid photosyn- thesis: the basics. Annu Rev Plant Physiol Plant 'li401 Biol 42: 313-349
Layne D, Flore J (1992) Photosynthetic compensation to partial leaf area reduction in sour cherry. J Am SOC Hortic S a l l ' 7 : 279-286
Leigh RA, Ahmad N, Wyn Jones RG (1981) Assessment of glyci- nebetaine and proline compartmentation by analysis of isolated beet vacuoles. Planta 153 34-41
Loescher WH (1987) Physiology and metabolism of sugar alcohols in higher plants. Physiol Plant 7 0 553-557
Loescher WH, Tyson RH, Everard JD, Redgwell RJ, Bieleski RL (1992) Mannitol synthesis in higher plants: evidence for the role and ch,aracterization of a NADPH-dependent mannose 6-phos- phate reductase. Plant Physiol98 1396-1402
Longstreth DJ, Nobel PS (1979) Salinity effects on kaf anatomy. Plant Physiol63 700-703
Munns R (1993) Physiological processes limiting plant growth in saline soils-some dogmas and hypotheses. Plant Cell Environ 16:
Rhodes D, Hanson AD (1993) Quatemary ammonium and tertiary sulfonium compounds in higher plants. Annu Rev Flant Physiol Plant Mol Biol44: 357-384
Richter DFE, Kirst GO (1987) D-Mannitol dehydrogenase and D- mannitol-1-phosphate dehydrogenase in Platymonas subcordifor- mis: some characteristics and their role in osmotic adaptation. Planta 170 528-534
Rumpho ME, Edwards GE, Loescher WH (1983) A pathway for photosynthetic carbon flow to mannitol in celery leaves: activity and localization of key enzymes. Plant Physíol73 86'2-873
Sams CE, Flore JA (1982) The influence of age, pxition, and environmental variables on net photosynthetic rate of sour cherry leaves. J Am SOC Hortic Sci 107: 339-344
Saranga Y, Rhodes D, Janick J (1992) Changes in amino acid composxtion associated with tolerance to partial desiccation of celery somatic embryos. J Am SOC Hortic Sci 117: 337-341
Stitt M, Quick WP (1989) Photosynthetic sucrose synthesis: its regulation and possibilities for manipulation. Physiol Plant 7 7
Stoop JMH, Pharr DM (1994) Growth substrate and nutrient salt environment alter mannitol-to-hexose partitioning in celery pe- tioles. J Am SOC Hortic Sci 119 237-242
Storey KB;, Storey JM (1988) Freeze tolerance in animals. Physiol Rev 6 8 27-84
Sweeley CC, Bentley R, Makita M, Wells WW (1963) Gas-liquid chromatography of trimethylsilyl derivatives of sugars and related substances. J Am Chem SOC 8 5 2497-2507
Tarczynski MC, Jensen RG, Bohnert HJ (1993) Stress protection of transgenic tobacco by production of the osmolyte mannitol. Sci- ence 259 508-510
Wintermans JFGM, De Mots A (1965) Spectrophotomttric charac- teristics of chlorophylls and their pheopytins in ethanol. Biochim Biophys Acta 109 448-453
Wyn Jones RG (1984) Phytochemical aspects of osmotic adaptation. In BN Timmermann, C Steelink, FA Loewus, eds, Phytochemical Adaptations to Stress: Recent Advances in Phytochemistry, Vol 18. Plenum Press, New York, pp 55-78
989-9914
15-24
633-641
www.plant.org on April 12, 2014 - Published by www.plantphysiol.orgDownloaded from Copyright © 1994 American Society of Plant Biologists. All rights reserved.

![Thomas EVERARD (1314- ) · 2020. 7. 26. · 27.Ann EVERARD1 [2241], daughter of Thomas Gawdy EVERARD [2197] and Agnes MANNOCK [2198], was born in 1594.1 She marriedEdward NEWPORT](https://img.pdfslide.us/doc/110x75/61174fc94dd72067a5111bc3/thomas-everard-1314-2020-7-26-27ann-everard1-2241-daughter-of-thomas.jpg)


![Am J Physiol Heart Circ Physiol 2011[1]](https://img.pdfslide.us/doc/110x75/577ce0031a28ab9e78b28109/am-j-physiol-heart-circ-physiol-20111.jpg)