Embed Size (px)
Citation preview

Plant
Pathology
and
Entomology
Capability
Study
2012
Bruce Howie Managing Director C-Qual Agritelligence Pty Ltd

PLANT PATHOLOGY AND ENTOMOLOGY CAPABILITY STUDY - 2012 II
Table of Contents
Table of Contents ............................................................................................................................ ii List of Tables ................................................................................................................................... iii
List of Figures .................................................................................................................................. iv Executive Summary ....................................................................................................................... v
1. Introduction ............................................................................................................................... 1
2. Methodology .............................................................................................................................. 3 The Survey – 2012 ................................................................................................................................. 3
3. Capability .................................................................................................................................... 4 Academic Standard and Accomplishment .................................................................................. 4 Diversity of Capability ......................................................................................................................... 5 Organisational Distribution of Capability .................................................................................. 6 Application of Capability .................................................................................................................... 8 Future Demand for Capability ....................................................................................................... 10
4. Age Profile and Service Expectations ........................................................................... 14 Age Profile .............................................................................................................................................. 14 Service Expectations .......................................................................................................................... 15
5. Education and Training ...................................................................................................... 19 Training Priorities – Competency and Skills ........................................................................... 19 Industry support for education and training .......................................................................... 20
6. Issues that concern survey respondents .................................................................... 22
7. Conclusion ................................................................................................................................ 25
References ...................................................................................................................................... 28 Acknowledgements .................................................................................................................... 28
Statistical Limitations ................................................................................................................ 28
Appendix A: Survey ................................................................................................................... 29 Appendix B: Survey Results .................................................................................................. 47

PLANT PATHOLOGY AND ENTOMOLOGY CAPABILITY STUDY - 2012 III
List of Tables Table 1: Summary of the highest level of training reported in both surveys ........................ 4
Table 2: FTEs in plant pathology sub-discipline areas 2006 and 2012 ................................... 5
Table 3: FTEs in entomology sub-discipline areas .................................................................... 6
Table 4: Organisation type classifications .................................................................................. 7
Table 5: Distribution of plant pathology and entomology capability across organisation types ................................................................................................................................... 7
Table 6: Primary environment of plant pathologists and entomologists expressed as FTEs and percentage FTEs for both the 2006 and the 2012 surveys ...................... 8
Table 7: Primary focus of plant pathologists and entomologists represented as FTEs and a percentage of FTEs for both the 2006 and the 2012 surveys ......................... 9
Table 8: Age profile for each discipline - 2012 .......................................................................... 14
Table 9: Expected years of service for each discipline reported in the 2012 survey (2006 percentage shown in parenthesis). .................................................................. 16
Table 10: Expected years of service for plant pathology sub-disciplines reported in the 2012 survey (actual numbers). ..................................................................................... 16
Table 11: Expected years of service for entomology sub-disciplines reported in the2012 survey (actual numbers). .............................................................................................. 16
Table 12: Relationship between service expectations and likely reasons to leave plant pathology or entomology expressed as a percentage within each bracket of expected years of service. (2006 percentages are shown in parenthesis) ........... 17
Table 13: Relationship between age range and likely reasons to leave plant pathology or entomology based on actual numbers of ‘Active’ respondents in each age bracket. The percentage of ‘Active’ respondents is shown in parenthesis. ....... 18
Table 14: Overall potential for employment and training support from the 2012 survey. (2006 responses are shown in parenthesis) .............................................................. 21
Table 15: Level of concern expressed across a range of issues relating to employment 2012 (2006 percentage responses are shown in parenthesis) ............................... 22
Table 16: Level of concern expressed across a range of issues relating to future requirements within each discipline 2012 (2006 percentage responses are shown in parenthesis) ................................................................................................... 24

PLANT PATHOLOGY AND ENTOMOLOGY CAPABILITY STUDY - 2012 IV
List of Figures Figure 1: Word cloud indicating the range of responses from those who selected 'Other'
as their entomology sub-discipline (2012) ................................................................... 6
Figure 2: Years of experience in field of specialty 2012 survey (actual numbers) .............. 10
Figure 3: Ranked importance of plant pathology sub-disciplines as assessed in both the 2006 and 2012 surveys ........................................................................................... 11
Figure 4: Relative current and future importance of plant pathology skills and competencies as ranked in the 2012 survey ............................................................. 12
Figure 5: Ranked importance of entomology sub-disciplines as assessed in both the 2006 and 2012 surveys .................................................................................................. 12
Figure 6: Relative current and future importance of entomology skills and competencies as ranked in the 2012 survey ............................................................. 13
Figure 7: Comparison of the percentage of overall plant pathologists in each age bracket as survey in 2006 and 2012 ............................................................................ 14
Figure 8: Comparison of the percentage of overall entomologists in each age bracket as surveyed in 2006 and 2012 ...................................................................................... 15
Figure 9: Ranked importance of attributes in future staff appointments .............................. 19
Figure 10: Identification of training priorities as a percentage of all responses (n=160) ..... 20
Figure 11: Word cloud indicating the range and frequency of various concerns impacting employment as noted in open responses (2012) ................................... 23
Figure 12: Word cloud indicating the range and frequency of various concerns about future capacity as noted in open responses (2012) ................................................. 24

PLANT PATHOLOGY AND ENTOMOLOGY CAPABILITY STUDY - 2012 V
Executive Summary In 2006 the then Cooperative Research Centre for Tropical Crop Protection commissioned a survey to evaluate capability within Australia and New Zealand in the two important disciplines of plant pathology and entomology. The report on that survey is available on the CRCTPP legacy website (Howie, 2006).
After consideration of the issues raised in the 2006 report and recognition that there remain concerns regarding the current and future capacity in these areas, the Australasian Plant Pathology Society (APPS) and the Australian Entomological Society (AES) jointly commissioned a follow-up survey intended to obtain an updated snapshot of the current capacity in plant pathology and entomology across Australian and New Zealand. The 2012 survey was intended to identify similarities and differences in perceptions of plant pathology and entomology capability along with any trends influencing capacity.
This report focuses on a review of the data gathered in the 2012 survey and comparison of the data with the 2006 survey. It highlights important shifts in the data that might inform decisions and strategic planning for meeting future requirements in plant pathology and entomology.
The 2012 survey followed a similar design to that which was conducted in 2006. Only minor variations were considered in order to ensure consistency for comparison of results. The survey was distributed to universities, state and national government entities, commercial industry, grower and industry associations.
At the close of the survey in excess of 400 responses were received, of which 333 were judged to be complete and became the basis for the analyses in this report. This compared with 359 complete surveys in 2006. The 2012 responses have been further broken down as follows:
Total respondents 333 Administration only 23 Entomologists/Plant pathologists 310 Plant pathologists 175 Entomologists 135 ‘Active’ (employed) specialists 275
The survey was constructed in two parts, each divided into a plant pathology section and an entomology section. Part A collected data from those working within the two disciplines including information about their organisation type, areas of speciality, age profile and activity focus as well as qualitative opinions regarding a range of issues affecting their work environment. Part B collected data from an organisational perspective including information about current capacity, future needs, sources of expertise and training perspectives.
Both Australia and New Zealand continue to have a strong academic achievement in the combined fields of plant pathology and entomology. In 2006 53% of respondents had PhD level qualifications whilst in 2012 this had risen markedly to 65%. Conversely undergraduate qualifications showed a decline to 16% in 2012 from 27% in 2006. This appears to reflect the reduced offerings at the undergraduate level and related fall in student numbers in the science faculties, especially in the fields of plant pathology and entomology.
Distribution of capability across plant pathology sub-disciplines is largely similar when the 2006 and 2012 surveys are compared, however, areas such as bacteriology and virology appear to have declined sharply in representation. Mycology remains the dominant sub-discipline area but there appears to be an upward shift in respondents reporting more generalist roles.
Taxonomy/systematics remains the leading sub-discipline area for entomology. However, there is a large proportion of respondents selecting ‘Other’ as their primary discipline then identifying ecology as their main area. Genetics and insect pathology are sub-discipline areas that appear to have declined in capacity.
PLANT PATHOLOGY AND ENTOMOLOGY CAPABILITY STUDY - 2012 VI
Plant pathologists and entomologists are employed predominantly in government organisations, although there appears to be a decline overall in this sector since 2006. This is particularly the case in the ‘applied’ sector such as state departments of agriculture and frontline services to producers. A small increase in the government sector engaged in more strategic and basic research does not offset the decline in the applied sector.
The education sector accounts for around 20% of the overall employment of plant pathologists and entomologists, which is similar to 2006. Only 7% of respondents indicated employment in the commercial sector.
In terms of the application of capability, applied research dominates, followed by biosecurity, then strategic and basic research. Education/teaching remains at around 4% of full-time equivalents (FTEs) whilst there is a noticeable decline in extension and support services. It is not evident that the commercial sector sees itself as assuming these latter roles.
Agricultural and horticultural production dominate the primary focus of plant pathologists and entomologists and show little change in percentage FTEs between 2006 and 2012. In fact there are only small changes in primary focus across all areas. There has been an apparent loss of resource in agriculture storage, from an initial low figure in 2006 whilst there is an increase in the resource allocated to horticulture post-harvest.
In assessing the importance of specialty sub-discipline areas in plant pathology, respondents indicated that all remain important in 2012. Mycology, in particular, remains strong but, compared to the 2006 survey, there is increasing importance in the fields of nematology, molecular plant pathology and phytoplasmas. In entomology taxonomy/systematics continues to rate highest in importance with increasing importance in genetics and biochemistry.
The age profile of those employed in these two important disciplines has shifted sharply towards an older profile. The number of plant pathologists now in the over 55 age bracket has increased since 2006 with lower numbers now evident in the under 35 age brackets. It is a similar result for entomology.
These shifting profiles are of concern when put alongside service expectations. Of the 275 currently employed respondents, 28% will retire within the next 10 years and 40% within 15 years. A further 12% will be lost due to other factors and, therefore, in excess of 50% of the current capacity requiring replacement within 15 years just to maintain the status quo.
At the same time, respondents over 45 tend to have a strong likelihood to remain in their specialist field until retirement. Not surprisingly, commitment through to retirement reduces as the age profile becomes younger. This is most evident in the 35-45 age bracket where 20% of the ‘Active’ respondents indicate the likelihood of leaving their field within the 15 year horizon.
Research, communication and practical skills tend to be the most sought after by employers of plant pathologists and entomologists. Interestingly, many with managerial responsibility don’t see their organisations as being particularly supportive of developing these skills internally. There is a tendency to seek post-graduates for employment, with the necessary skills already developed. Willingness to employ undergraduates and support them through internal training and professional development appears to be low. This area may need closer examination.
Finally, the survey gathered information on the areas of concern for respondents. Areas such as employment opportunities, career progression, tenure/funding constraints and work pressure all drew very high to extremely high levels of concern. From open-ended responses other areas to emerge with high levels of concern included the serious loss of skills through, retirements and redundancies coupled with the widespread lack of succession planning to capture departing knowledge. Frequent reference to the inadequate intake of new talent was also a common response in this area.
The following areas for action and follow-up are proposed in the report:

PLANT PATHOLOGY AND ENTOMOLOGY CAPABILITY STUDY - 2012 VII
That the APPS and AES convene a joint action committee, with additional representation from the Plant Biosecurity Cooperative Research Centre to review of the 2012 findings and commit to a combined and coordinated strategy to address the key issues including:
n Development of targeted communication strategies for specific audiences including:
o Politicians and policy makers
o Science & Technology Australia
o Funding agencies
o Industry bodies and representatives
o Course developers
n Development of retention strategies for employing organisations including:
o Funding and tenure challenges
o Commitment to professional development
o Effective succession planning and knowledge transfer
o Incentives structures that promote a range of skills (ie not just publication) that will encourage career progression and retention of skilled staff
n Attraction of new talent into the disciplines through:
o High school recruitment programs
o Active promotion of plant pathology and entomology careers during generalist undergraduate programs
o Engagement of the societies with undergraduates to secure participation in society activities and motivate interest in plant pathology and entomology careers
o Development of a visionary and inspirational career prospectus
o Motivate an organisational commitment to the recruitment and development of undergraduates
n Coordinate with the tertiary sector and industry to develop innovative and flexible undergraduate training programs that include practical skills-development in key areas of future demand
n Identify and access new funding sources to underpin specialist training programs, for example, industry sponsorship or scholarships/traineeships

PLANT PATHOLOGY AND ENTOMOLOGY CAPABILITY STUDY - 2012 1
1. Introduction
In 2006 the then Cooperative Research Centre for Tropical Crop Protection (CRCTPP) commissioned a survey to evaluate capability within Australia and New Zealand in the two important disciplines of plant pathology and entomology. The report on that survey is available on the CRCTPP legacy website (Howie, 2006). A number of issues were highlighted in that report, which suggested the following be addressed:
n The implementation of strategic programs to improve retention of existing capability. These programs must address the following:
o lack of job security arising from funding and tenure policies
o in-service and professional development programs to ensure a broader skills base
o knowledge transfer, career planning and succession planning in order to capture existing capability and ensure its long term retention
o retention incentives for valued emerging talent
n Undertake targeted career exposé programs at high school level and during undergraduate programs that promote the positive aspects of plant pathology and entomology careers.
n Develop inspirational curricula that ensure integration with industry during undergraduate programs and provide genuine specialisation at postgraduate levels, ensuring that these programs are supported by increased allocation of education and training capability in the university sector.
n Ensure flexible delivery of specialized postgraduate programs in order to overcome the need to have large enrolments in any one location.
n Encourage industry recruitment of graduates from undergraduate programs, thus enhancing the development of practical skills and closing the opportunity gap currently evident.
n Rebuild the teaching resource within universities to ensure requisite teaching skills, appropriate incentives and professional recognition for teaching commitment.
After consideration of the issues raised in the 2006 report and recognition that there remain concerns regarding the current and future capacity in these areas, the Australasian Plant Pathology Society (APPS) and the Australian Entomological Society (AES) jointly commissioned a follow-up survey intended to obtain an updated snapshot of the current capacity in plant pathology and entomology across Australia and New Zealand. The 2012 survey was intended to identify similarities and differences in perceptions of plant pathology and entomology capability along with any trends influencing capacity.
As with the 2006 survey, the 2012 survey gathered information on the views of administrators and managers with insight into the current and future plant pathology and entomology needs of their organisations. This was intended to evaluate how well Australia and New Zealand are positioned to maintain their capability in the context of future industry and environmental needs. This included views on anticipated future priorities and various issues relating to employment, job satisfaction and training. It should be noted that the survey did not propose to quantify future needs; it was intended to obtain perceptions of future requirements around current areas of expertise and application.
This report focuses on a review of the data gathered in the 2012 survey and comparison of the data with the 2006 survey. It highlights important shifts in the data that might inform decisions and strategic planning for meeting future requirements in plant pathology and entomology.
PLANT PATHOLOGY AND ENTOMOLOGY CAPABILITY STUDY - 2012 2
There was a high level of consistency between the surveys in terms of the way in which respondents evaluated the issues. Similarities are evident in the range of specialities and various work environments, although there are some shifts in the distribution of plant pathologists and entomologists across the organisation types.
Important differences are evident in the age profiles of respondents, adding to existing concerns about the potential for significant loss of both capacity and capability from these specialist disciplines. In particular likely losses through retirement and change of career direction appear unlikely to be met by new and emerging talent

PLANT PATHOLOGY AND ENTOMOLOGY CAPABILITY STUDY - 2012 3
2. Methodology
The study was intended to gather largely quantitative data with the opportunity in some cases to expand responses to more open, qualitative input. Data was gathered by means of a survey of plant pathologists and entomologists as well as administrators having responsibility for the management of programs, resources and the appointment of staff within these disciplines.
The Survey – 2012
The 2012 survey followed a similar design to that which was conducted in 2006. Only minor variations were considered in order to ensure consistency for comparison of results. Additional information was collected on years of experience in order to assess numbers and distribution of field ‘experts’ (defined as having 10 or more years experience in their field), and some additional job functions. Some organisations surveyed in 2006 no longer existed so these were deleted, although the broad categories of organisations remained unchanged.
The re-drafted survey was reviewed by a steering committee consisting of representatives of the following:
n Australasian Plant Pathology Society
n Australian Entomological Society
n Plant Biosecurity Cooperative Research Centre
The survey was set up as an online survey using software from Fluidsurveys Inc. (see www.fluidsurveys.com). In order to maximize responses to the survey the invitation to access the link and complete it was distributed via the APPS & AEC and to a key contacts in the target organisations with a request to forward to the appropriate staff. Target organisations included universities, state and national government entities, commercial industry, grower and industry associations. The complete survey is attached to this report as Appendix A.
At the close of the survey in excess of 400 responses were received, of which 333 were judged to be complete and became the basis for the analysis in this report.
The survey was constructed in two parts, each divided into a plant pathology section and an entomology section. Part A collected data from those working within the two disciplines including information about their organisation type, areas of speciality, age profile and activity focus as well as qualitative opinions regarding a range of issues affecting their work environment. Part B collected data from an organisational perspective including information about current capacity, future needs, sources of expertise and training perspectives.
Early feedback after the live launch of the survey indicated a need for additional ‘Primary focus’ categories for entomologists so these were added, recognising that some initial survey respondents would have missed the opportunity to register in these areas. They were considered important enough that their absence might have led to respondents failing to complete the survey.
Survey respondents were also given the opportunity to provide their personal contact details for the purpose of follow-up interviews for added qualitative data. Interviews have not been conducted at the time of preparation of this report but may be pursued by APPS and AES at a later date as appropriate.
Data is reported as collected in the survey software, primarily on a numerical basis (numbers and percentages of responses received) although some cross-tabulation has been performed to determine relationships between questions where appropriate.
PLANT PATHOLOGY AND ENTOMOLOGY CAPABILITY STUDY - 2012 4
3. Capability
The 2006 report noted:
Plant pathology and entomology are important fields of science that impact directly on the well-being of society due to their fundamental importance in food and fibre production and in sustaining quality of environment. These scientific disciplines are crucial to the agricultural economies of Australia and New Zealand due to the impact of plant diseases and insect pests on production quality and yields of food crops and commodities derived from agricultural production. Not less important is the contribution of these disciplines to maintenance and sustainability of natural ecosystems that are critical to quality of life and preservation of national heritage.
Clearly these points remain valid in 2012 and it was considered by the two societies to be important to review similar issues to determine whether there had been any shift in the availability and capability of resources in these areas. Therefore, as in the earlier survey information was gathered on both the academic levels and accomplishments of practitioners as well as where the resources are employed and made available to industry and environmental services.
Most respondents (77%) were employed in full-time positions, 12% in part-time positions, 6% retired and 5% actively seeking work. Tenured positions were held by 45% of respondents, whilst 35% were in contracted positions (16% <3 years and 19% >3 years). Five percent indicated self-employment with a small number of voluntary/honorarium positions.
In addition to gaining an understanding of the current capability, information was gathered on how well Australia and New Zealand are positioned to maintain their capability in the context of future industry and environmental needs. This included views on anticipated future priorities and various issues relating to employment, job satisfaction and training.
Academic Standard and Accomplishment
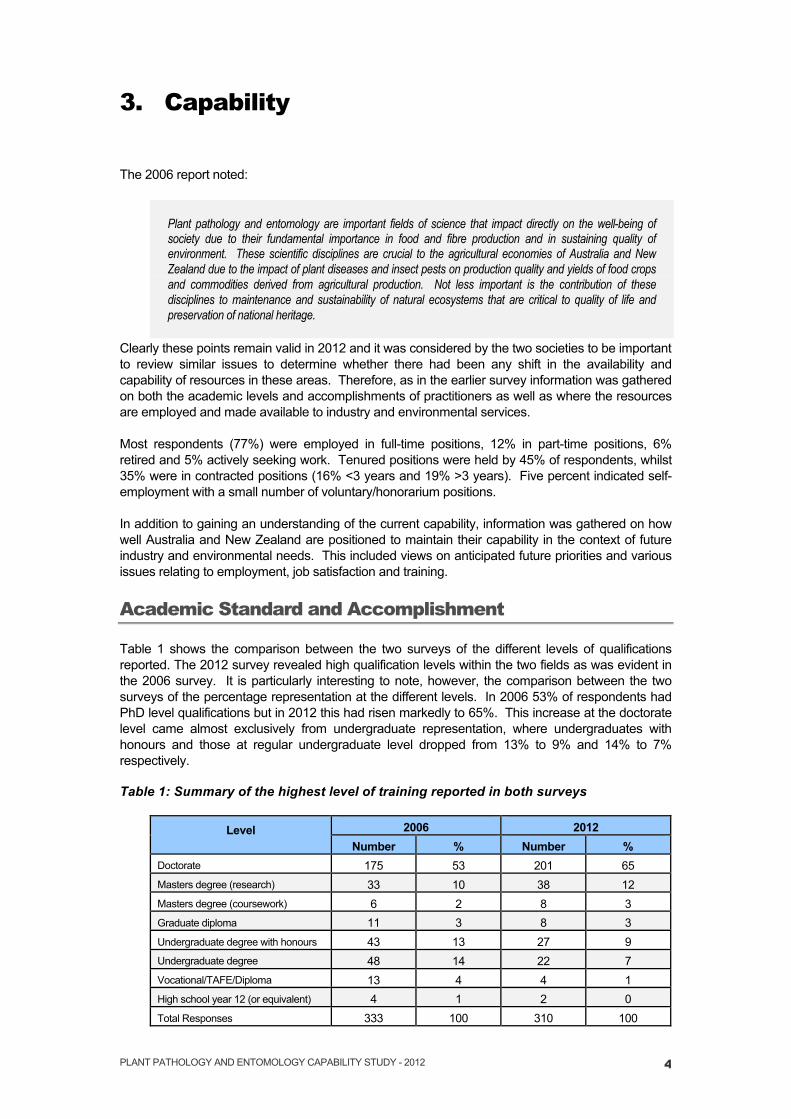
Table 1 shows the comparison between the two surveys of the different levels of qualifications reported. The 2012 survey revealed high qualification levels within the two fields as was evident in the 2006 survey. It is particularly interesting to note, however, the comparison between the two surveys of the percentage representation at the different levels. In 2006 53% of respondents had PhD level qualifications but in 2012 this had risen markedly to 65%. This increase at the doctorate level came almost exclusively from undergraduate representation, where undergraduates with honours and those at regular undergraduate level dropped from 13% to 9% and 14% to 7% respectively.
Table 1: Summary of the highest level of training reported in both surveys
Level 2006 2012 Number % Number %
Doctorate 175 53 201 65 Masters degree (research) 33 10 38 12 Masters degree (coursework) 6 2 8 3 Graduate diploma 11 3 8 3 Undergraduate degree with honours 43 13 27 9 Undergraduate degree 48 14 22 7 Vocational/TAFE/Diploma 13 4 4 1 High school year 12 (or equivalent) 4 1 2 0 Total Responses 333 100 310 100

PLANT PATHOLOGY AND ENTOMOLOGY CAPABILITY STUDY - 2012 5
Similar to the 2006 survey, the current survey drew a very low response from the under 25 years age bracket. It is certain that there are graduates of more generalist courses currently engaged in plant pathology and entomology but due to the lack of specific qualifications in these fields they may not have felt that the survey was relevant to them. For example, there are clearly a number of graduates of agronomy and broad agricultural undergraduate degrees working in commercial advisory roles, sales and extension who are providing advice and guidance on pest and disease management that do not appear to have been captured in this survey.
In the 2006 report the challenge of maintaining high quality capability into the future was noted and it is evident from the 2012 survey results that there is a decline in representation at the undergraduate levels. Despite the limited responses from commercial and under 25s in this survey there is widespread anecdotal evidence that there are significant difficulties in filling positions in commercial and advisory roles.
Diversity of Capability
Plant pathology
Table 2 provides a comparison between the 2006 and 2012 surveys in regard to the particular sub-disciplines in which plant pathology capability is applied. Not surprisingly, mycology remains the dominant area, but this, along with several other sub-discipline areas is showing a decline in the percentage of respondents that consider this to be their primary sub-discipline. Relatively large reductions are evident in bacteriology (already at a low percentage in 2006) and virology. There is an increase in the percentage indicating ‘Other’, suggesting that respondents are perhaps fulfilling broader roles than previously indicated. In fact nearly half of all ‘Other’ responses indicated multiple sub-disciplines and therefore broad plant pathology capability. Other responses in this area tended to represent the application of their expertise, rather than sub-discipline, for example, plant breeding, disease resistance, biocontrol, biosecurity and post-harvest disease management.
Table 2: FTEs in plant pathology sub-discipline areas 2006 and 2012
Plant Pathology Sub-discipline
2006 (n=183) 2012 (n=175) Number of
FTEs Percentage
of FTEs Number of
FTEs Percentage
of FTEs Bacteriology 7.0 4.0 2.5 1.7
Molecular Plant Pathology 16.2 9.3 16.2 9.3
Mycology 78.7 45.1 52.2 35.9
Nematology 12.4 7.1 9 6.2
Virology 15.8 9.0 8.0 5.5
No specific sub discipline 28.0 16.0 19.2 13.2
Other 16.4 9.4 33.0 22.7
Total 174.5 100.0 145.4 100.0
Entomology
In order to provide comparative data, categories for entomology sub-disciplines from the 2006 survey were retained. A comparison of full-time equivalents (FTEs) in entomology sub-disciplines is shown in Table 3. It was noted in the 2006 report that entomologists tended to select for ‘Other’ quite strongly with an emphasis on ecology. This remained true for the 2012 survey where nearly half of all respondents (47.9%) selected ‘Other’. Although the opportunity for direct comparison in some areas might be lost, for any future analysis, it would probably be beneficial to modify the entomology sub-discipline areas to more closely reflect those that respondents connect with.
Taxonomy/systematics remains the strongest sub-discipline area from those offered, accounting for 18.9% of respondents, very similar to 2006. Biochemistry showed an increase to 2.2% from a very low 2006 result, while genetics and insect pathology showed quite marked declines.

PLANT PATHOLOGY AND ENTOMOLOGY CAPABILITY STUDY - 2012 6
Table 3: FTEs in entomology sub-discipline areas
Entomology Sub-discipline 2006 (n=151) 2012 (n=150)
Number of FTEs
Percentage of FTEs
Number of FTEs
Percentage of FTEs
Behaviour 9.3 6.9 11.0 8.6
Biochemistry 1.0 0.7 2.8 2.2
Genetics 7.0 5.1 1.0 0.8
Insect pathology 7.7 5.7 3.0 2.3
Physiology 1.0 0.7 1.0 0.8
Taxonomy/Systematics 24.8 18.4 24.2 18.9
No specific sub discipline 18.6 13.8 23.6 18.5
Other 65.8 48.7 61.3 47.9
Total 135.1 100.0 127.9 100.0
Figure 1 shows a sample of ‘Other’ responses, which are dominated by ecology and integrated pest management as the primary sub-discipline.
• Figure 1: Word cloud indicating the range of responses from those who selected 'Other' as their entomology sub-discipline (2012)
Organisational Distribution of Capability
Whilst 14 different organisation types were listed in the survey, to simplify the analysis these were grouped into 5 classifications in the same way as the 2006 survey. The classifications and groupings are shown in Table 4. There is considerable overlap of activities between the classifications but the groupings are intended to provide some perspective of the nature of employment in these disciplines.

PLANT PATHOLOGY AND ENTOMOLOGY CAPABILITY STUDY - 2012 7
Table 4: Organisation type classifications
Classification Comments Gov1 Government organisations with a strong application focus which may include
extension, applied research or practical management of agricultural or natural resources: • State departments of primary industries, forestry or agriculture. • Ministry of Agriculture and Forestry. • Plant health, quarantine or biosecurity. • Heritage and environment
Gov2 Government organisations with primarily a research focus: • CSIRO • Crown Research Institutes • Cooperative Research Centres • Industry research and development organisations
Edu Organisations in an educational environment • Universities and Higher Education. • Vocational
Comm Organisations having a commercial focus • Suppliers and distributors of agricultural inputs including pest and disease
management solutions. • Service providers including consultants, advisors and extension services. • R&D start-up companies.
Other Unclassified including primary producer and grower associations.
Table 5 summarizes the responses received from each of the disciplines of plant pathology and entomology across the different organisational classifications. The table also shows those who provided input from an administrative perspective for each of the organisational classifications. For comparison, 2006 figures are shown in parenthesis.
The Gov1 classification, which tends to broadly represent the applied research and delivery sector shows quite a large decline in numbers, down from 60% of total capacity, to 42%. At the same time, there is an increase in the Gov2 classification rising from 11% to 20%.
The Edu classification has remained fairly stable with slight increases evident in the commercial sector.
The 2012 survey collected information on those with qualifications but not currently employed and seeking work. This group represented about 7% of all respondents.
Table 5: Distribution of plant pathology and entomology capability across organisation types
Organisation type
Plant Pathology 2012(2006)
Entomology 2012(2006)
Admin 2012(2006) Totals %
2012(2006)
Gov1 84 (129) 52 (77) 4 (11) 140 (217) 42 (60)
Gov2 25 (10) 33 (27) 10 (4) 68 (41) 20 (11)
Edu 38 (38) 29 (32) 4 (2) 71 (72) 21 (20)
Comm 9 (4) 12 (10) 3 (5) 24 (19) 7 (5)
Other 4 (2) 2 (5) 1 (3) 7 (10) 2 (3)
Not employed (not reported 2006)
15 (-) 7 (-) 1 (-) 23 (-) 7 (-)
Total 175 (183) 135 (151) 23 (25) 333 (359)

PLANT PATHOLOGY AND ENTOMOLOGY CAPABILITY STUDY - 2012 8
Application of Capability
The previous section identified the distribution of plant pathology and entomology capacity across different organisation classifications. In this section the application of capability is analysed, firstly in terms of the FTE allocation to a range of primary environments and secondly, the allocation to a range of different industries (primary focus).
Primary Environment
Primary environment is defined in terms of the nature of the activities undertaken by the respondents in carrying out their duties. The survey presented several primary environments and asked respondents to indicate the FTEs allocated to each, where applicable. Ten primary environments were offered in the 2006 survey but biosecurity was added to the 2012 survey and the category, support services, from the 2006 survey was replaced by advisory in 2012. Table 6 shows the results obtained from each survey.
Table 6: Primary environment of plant pathologists and entomologists expressed as FTEs and percentage FTEs for both the 2006 and the 2012 surveys
Primary environment 2006 2012
FTEs % FTEs % Education/Teaching 13.2 4.4 10.8 4.4
Research – Basic 41.4 13.9 21.5 8.7
Research – Strategic 34.1 11.5 31.5 12.8
Research – Applied 120.4 40.4 102.4 41.6
Extension 14.5 4.9 6.1 2.5
Biosecurity - - 43.6 17.7
Support Services/Advisory 15.9 5.3 8.6 3.5
Regulatory/Policy 13.6 4.6 4.6 1.9
Quarantine 28.7 9.6 7.85 3.2
Commercial – Sales/Marketing 1.7 0.6 1.2 0.5
Commercial – Technical/Advisory 14.2 4.8 7.9 3.2
Total 297.7 100 246.0 100
Research – Applied remains in 2012 as the most dominant primary environment at 41.6% of FTEs, very similar to the percentage representation in 2006. Research – Strategic remains at similar levels, whilst Research – Basic has shown a decline. Research overall dominates the primary environment representing 63.1% of all FTEs in 2012 compared to 65.8% of FTEs in 2006.
Extension and advisory (support services) were considered to be low in 2006 at 4.9% and 5.3% respectively. Both areas have declined noticeably in 2012 to 2.5% in the case of extension and 3.5% for advisory. It is not evident that the commercial sector sees itself as assuming these roles. That is not to say that they are not active in extension and support, but clearly not from a specialist perspective.
Biosecurity, as a new primary environment included in 2012 is, in fact, quite substantial capturing 17.7% of FTEs. Much of this is probably a transfer from the quarantine environment, which has shown a decline, and perhaps from regulatory/policy. It is possible that some of the decline in the advisory area could be attributed to the new category of biosecurity as well, however, the low allocation of capability to frontline delivery and support is an area of concern and perhaps needs further investigation.
PLANT PATHOLOGY AND ENTOMOLOGY CAPABILITY STUDY - 2012 9
Interestingly the allocation to education/teaching has remained consistent between the two surveys. This area remains low at 4.4% and, as noted in the 2006 report it is clear that only a small proportion of the Edu classification (21% of overall capacity), considers education/training to be their primary role.
Primary Focus
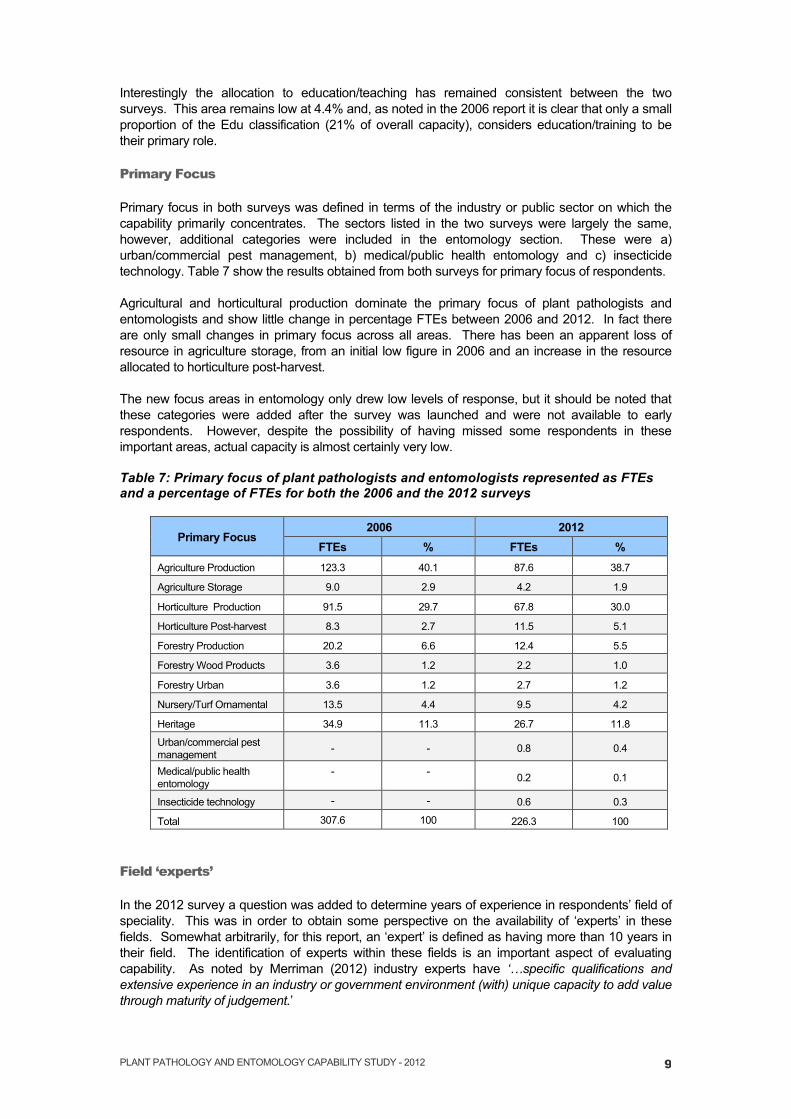
Primary focus in both surveys was defined in terms of the industry or public sector on which the capability primarily concentrates. The sectors listed in the two surveys were largely the same, however, additional categories were included in the entomology section. These were a) urban/commercial pest management, b) medical/public health entomology and c) insecticide technology. Table 7 show the results obtained from both surveys for primary focus of respondents.
Agricultural and horticultural production dominate the primary focus of plant pathologists and entomologists and show little change in percentage FTEs between 2006 and 2012. In fact there are only small changes in primary focus across all areas. There has been an apparent loss of resource in agriculture storage, from an initial low figure in 2006 and an increase in the resource allocated to horticulture post-harvest.
The new focus areas in entomology only drew low levels of response, but it should be noted that these categories were added after the survey was launched and were not available to early respondents. However, despite the possibility of having missed some respondents in these important areas, actual capacity is almost certainly very low.
Table 7: Primary focus of plant pathologists and entomologists represented as FTEs and a percentage of FTEs for both the 2006 and the 2012 surveys
Primary Focus 2006 2012
FTEs % FTEs % Agriculture Production 123.3 40.1 87.6 38.7
Agriculture Storage 9.0 2.9 4.2 1.9
Horticulture Production 91.5 29.7 67.8 30.0
Horticulture Post-harvest 8.3 2.7 11.5 5.1
Forestry Production 20.2 6.6 12.4 5.5
Forestry Wood Products 3.6 1.2 2.2 1.0
Forestry Urban 3.6 1.2 2.7 1.2
Nursery/Turf Ornamental 13.5 4.4 9.5 4.2
Heritage 34.9 11.3 26.7 11.8
Urban/commercial pest management - - 0.8 0.4
Medical/public health entomology
- - 0.2 0.1
Insecticide technology - - 0.6 0.3
Total 307.6 100 226.3 100
Field ‘experts’
In the 2012 survey a question was added to determine years of experience in respondents’ field of speciality. This was in order to obtain some perspective on the availability of ‘experts’ in these fields. Somewhat arbitrarily, for this report, an ‘expert’ is defined as having more than 10 years in their field. The identification of experts within these fields is an important aspect of evaluating capability. As noted by Merriman (2012) industry experts have ‘…specific qualifications and extensive experience in an industry or government environment (with) unique capacity to add value through maturity of judgement.’

PLANT PATHOLOGY AND ENTOMOLOGY CAPABILITY STUDY - 2012 10
Therefore, any shift in expert capacity is likely to have significant impact on an industry’s overall capability to respond to demands, implement sound decision-making process and capture innovation.
Figure 2 shows the relative proportions of those with various years of service within their specialty disciplines of both plant pathology and entomology. The result is encouraging in terms of the numbers of ‘experts’ available in these fields, but also alarming in terms of the shallow field of expertise coming through to fulfil roles of expert contribution in the future.
• Figure 2: Years of experience in field of specialty 2012 survey (actual numbers)
Future Demand for Capability
Importance of plant pathology sub-disciplines
The survey gathered data on how individuals within the targeted organisations identified the current importance of the various sub-discipline areas in plant pathology and entomology. Figure 3 shows the rankings for the various plant pathology sub-disciplines. Rankings are based on a weighted average calculated from a five-point scale where 5 is most important.
0 20 40 60 80 100 120
>10 years
6-‐10 years
1-‐5 years
<1 year
Plant pathology Entomology

PLANT PATHOLOGY AND ENTOMOLOGY CAPABILITY STUDY - 2012 11
• Figure 3: Ranked importance of plant pathology sub-disciplines as assessed in both the 2006 and 2012 surveys
Mycology continues to be regarded as the most important of the sub-disciplines within plant pathology but molecular plant pathology, while still ranked in second position, has shown an increase in importance since 2006 and is now approaching a similar level to mycology. All other sub-disciplines score higher in importance in 2012 with particularly strong increases for nematology and phytoplasmas.
Current and future importance of plant pathology skills
Figure 4 shows the relative current and future importance of the various plant pathology skills and competencies as ranked by respondents. Once again a weighted average based on a five-point scale is applied.
A comparison of rankings between current and future importance is similar across the range of skills and competencies. However, while following a similar pattern, future importance tends to record higher levels of importance than current. Greatest increase in importance is in education and training, which is interesting given the low level of application in these areas noted earlier.
Field diagnostics, risk assessment & quarantine and emergency response show clear increases in future importance, which possibly reflects growing emphasis in these areas. Physiology also shows a similar increase in future importance.
0.0 1.0 2.0 3.0 4.0 5.0
Phytoplasmas
Molecular Plant Pathology
Nematology
Bacteriology
Virology
Mycology
2012 2006

PLANT PATHOLOGY AND ENTOMOLOGY CAPABILITY STUDY - 2012 12
• Figure 4: Relative current and future importance of plant pathology skills and competencies as ranked in the 2012 survey
Importance of entomology sub-disciplines
Figure 5 shows the rankings of current importance for the various entomology sub-disciplines, ranked on the basis of a five-point, weighted average scale. All areas are rated equal to or higher in importance in 2012 than they were in 2006. Many show quite large increases, in particular genetics, biochemistry and taxonomy/systematics. The latter continues to rank as the most important sub-discipline area, whilst genetics and biochemistry rank above their 2006 rankings.
• Figure 5: Ranked importance of entomology sub-disciplines as assessed in both the 2006 and 2012 surveys
Current and future importance of entomology skills
The relative current and future importance of the various entomology skills and competencies as ranked by respondents are shown in Figure 6. Quite strong increases in future importance occur in areas of diagnostics, risk assessment & quarantine, environment & ecology and education & training. In a clear reversal of the trend towards increasing importance, emergency response & management shows quite a reduction in future importance compared to current importance.
0.0 1.0 2.0 3.0 4.0 5.0
Education and training
Disease management (Biol or Chem)
Disease management (Res or Breeding)
Taxonomy (not diagnostics)
Epidemiology
Physiology
Genetics
Emerg. response & management
Risk assess. & quarantine
Diagnostics -‐ Field skills
Diagnostics -‐ Laboratory & taxonomic
2012 future 2012 current
0.0 1.0 2.0 3.0 4.0 5.0
Behaviour
Insect pathology
Biochemistry
Physiology
Genetics
Taxonomy & Systematics
2012 2006

PLANT PATHOLOGY AND ENTOMOLOGY CAPABILITY STUDY - 2012 13
• Figure 6: Relative current and future importance of entomology skills and competencies as ranked in the 2012 survey
0.0 0.5 1.0 1.5 2.0 2.5 3.0 3.5 4.0 4.5
Education and training
Environment and ecology
Pest control and management
Curation
Emerg. response & management
Risk assess. & quarantine
Diagnostics -‐ Field skills
Diagnostics -‐ Laboratory & taxonomic
2012 future 2012 current

PLANT PATHOLOGY AND ENTOMOLOGY CAPABILITY STUDY - 2012 14
4. Age Profile and Service Expectations
Age Profile
Both surveys gathered data on the age profiles within the two disciplines. The results of the 2012 survey are shown in Table 8. In the 2006 survey there was no representation from the under 25 age bracket. In 2012 there were some responses but numbers were low. It is suggested that this may not be representative due to the possibility that many in this age bracket may see themselves as generalists engaged in a wide range of activities and not specifically regarding themselves as plant pathologists or entomologists per se. Despite this there are probably many in this category that contribute to the overall national capability in these two discipline areas.
None-the-less, it is significant that numbers are low in this segment and must generate some concern that emerging specialist capacity is limited. It is interesting to note that the lack of representation in the under 25s in 2006 has translated into low numbers in the 25-34 age bracket in the 2012 survey. Figure 7 and Figure 8 clearly show the profiles shifting through the age brackets between 2006 and 2012 with the low student intake in recent years starting to push deeper into the profile. On top of this the figures also illustrates the shift of higher percentages into the over 55 age bracket with the obvious consequences as these move out of the system.
Table 8: Age profile for each discipline - 2012
Discipline <25 25-34 35-44 45-54 55+ Total Plant pathology (nos) 2 18 54 42 58 174
Entomology (nos) 1 21 30 35 48 135
Total (nos) 3 39 84 77 106 309
Percentage overall 1 13 27 25 34 100
Percentage Aust population* - 13.8 14.3 13.7 11.6
*Australian census data, 2011
• Figure 7: Comparison of the percentage of overall plant pathologists in each age bracket as survey in 2006 and 2012
0.0%
5.0%
10.0%
15.0%
20.0%
25.0%
30.0%
35.0%
40.0%
<25 25-‐34 35-‐44 45-‐54 >55
2006 2012

PLANT PATHOLOGY AND ENTOMOLOGY CAPABILITY STUDY - 2012 15
• Figure 8: Comparison of the percentage of overall entomologists in each age bracket as surveyed in 2006 and 2012
The positive view expressed in the 2006 report that low numbers in the 55+ age bracket should allay fears of significant losses is now somewhat redundant. Six years further on and there is a high percentage in the over 55s and very poor build up in the lower age brackets, indicating just how quickly the situation can change and the critical position these disciplines are likely to face over the next 6 – 10 year period. Importantly the 2006 report commented:
This profile should not be of immediate concern but should be recognised as a significant opportunity for the two disciplines to ensure that capability is maintained well into the future. However, with this opportunity is an unambiguous warning. The capability evident in the 45-54 age bracket must be captured, transferred and most importantly retained down the profile.
Unfortunately the evidence is clear that there has been minimal build up in the lower age profiles and the effectiveness of knowledge and skills transfer has not been obvious. The need for a clearly stated professional development strategy at the organisational level is now both more evident and more urgent that ever before.
Service Expectations
Data on two aspects of service expectations were obtained from the survey. Firstly, respondents were asked to indicate how long they expected to continue in their plant pathology or entomology career and secondly, to indicate reasons why they might leave their career.
Table 9 summarizes the expected years of service indicated by survey respondents. Retired or unemployed respondents are noted in the column headed N/A. The column headed ‘Active’ indicates those who are actively employed in these disciplines. Percentage calculations relating to expected departures are based on these actively employed respondents. Forty four percent of “Active’ have indicated that they are likely to leave within 10 years, and 60% within 15 years. Forty percent expect to remain in plant pathology or entomology for more than 15 years. This is marginally better than the 2006 survey where there was an anticipated loss from these 2 disciplines of close to 50% within 10 years and 63% within 15 years. The loss rate remains a concern, as this is a high proportion of the skills base potentially lost over the next few years, either through retirement or other pursuits.
0.0%
5.0%
10.0%
15.0%
20.0%
25.0%
30.0%
35.0%
40.0%
<25 25-‐34 35-‐44 45-‐54 >55
2006 2012

PLANT PATHOLOGY AND ENTOMOLOGY CAPABILITY STUDY - 2012 16
Table 9: Expected years of service for each discipline reported in the 2012 survey (2006 percentage shown in parenthesis).
Discipline <5 5-10 11-15 >15 Active N/A Total Plant pathology 35 33 26 61 155 20 175
Entomology 24 29 18 49 120 15 135
Total 59 62 44 110 275 35 310
Percentage of ‘Active’ 21 (25) 23 (25) 16 (13) 40 (38) 100 (-) - -
Table 10 indicates how the various sub-disciplines in plant pathology are impacted by expected years of service, whilst Table 11 shows the impact on entomology sub-disciplines.
Table 10: Expected years of service for plant pathology sub-disciplines reported in the 2012 survey (actual numbers).
Sub-discipline <5 5-10 11-15 >15 Active N/A Total Mycology 13 8 11 24 56 10 66
Virology 2 2 0 4 8 1 9
Bacteriology 1 0 0 2 3 2 5
Nematology 3 2 3 2 10 2 12
Molecular Plant Pathology 6 5 4 7 22 2 24
Phytoplasmas 0 0 0 0 0 0 0
No specific sub-disc 3 7 1 9 20 2 22
Other 7 9 7 13 36 1 37
Total 35 33 26 61 155 20 175
Table 11: Expected years of service for entomology sub-disciplines reported in the 2012 survey (actual numbers).
Sub-discipline <5 5-10 11-15 >15 Active N/A Total Taxonomy/System 6 7 4 8 25 5 30
Genetics 0 0 0 1 1 0 1
Physiology 0 1 0 0 1 0 1
Biochemistry 0 2 1 0 3 0 3
Insect pathology 0 0 0 1 1 1 2
Behaviour 4 1 3 3 11 0 11
No specific sub-disc 1 5 1 10 17 2 19
Other 13 13 9 26 61 7 68
Total 24 29 18 49 120 15 135
All sub-discipline area will be significantly impacted over the next 10 years with loss of capacity that is not going to be readily replaced due to low numbers in the younger age brackets and university entry levels that continue to decline.
The following is taken from the 2006 report but is important to repeat here as it clearly emphasizes the on-going pressure on plant pathology and entomology positions and the demand for ‘new’ and ‘replacement’ capacity.

PLANT PATHOLOGY AND ENTOMOLOGY CAPABILITY STUDY - 2012 17
In light of these data, if capability is to be maintained, there will be a strong demand for replacement of skills lost. The SET audit (DEST, 2006) indicates that overall ‘replacement’ demand for SET skills will exceed ‘new’ demand over the next decade. The audit defines ‘new’ demand and ‘replacement’ demand as follows:
‘Demand from industry for skilled employees is comprised of two basic components: demand that arises due to economic growth and/or the emergence of new industries and technology leading to the creation of new jobs that did not previously exist, referred to as ‘new’ demand; and demand that arises from staff turnover, movements and retirement, referred to as ‘replacement’ demand.’
The audit draws data from a Monash study which projects employment growth over the period 2004-5 to 2012-13 in agriculture & environment related fields of 36.2% and in the natural & physical sciences of 33.3%. Agriculture & environment are projected to show an annual replacement demand of 2.0% and a growth (new) demand of 3.9%. For the natural & physical sciences the projections are 4.5% and –2.3% respectively. Plant pathology and entomology are not specifically addressed but are closely linked to these two categories of SET. The Monash study identifies the ‘baby-boomer’ retirement effect in these projections but probably does not recognize the high level of early attrition identified in the plant pathology and entomology survey. This result is likely to drive up the replacement demand above that shown in the Monash study and raises important implications for employing organisations with regard to professional development, internal training and succession planning.
From Table 9 it is evident that 35 of the 310 respondents were either retired or unemployed, resulting in a total of 275 actively employed in these two disciplines. Of these 60%, or 165, indicated that they were likely to leave within 15 years for a range of reasons. One respondent did not provide age or a reason for likely departure, leaving 164 responses to be analysed on this criterion.
Considering these 164 respondents, Table 12 links the likely reasons for departure from field of specialty with the expected years of service indicated. Of those likely to leave within 5 years, 53% indicated retirement as the reason. This percentage is almost double that found in 2006. Overseas opportunity or study was indicated by 15%, also up from 2006. Presumably these would not be totally lost from the discipline areas.
New field of activity and limited tenure or funding were indicated by 14% and 17% respectively suggesting that 31% of the loss from these disciplines is likely to be for reasons other than retirement or career development within the disciplines. This is noticeably less than in 2006 when 57% indicated departure in less than 5 years for these reasons.
Regardless of the expected years of service, however, retirement is the dominant reason for likely departure, ultimately accounting for 70% of anticipated departures over the next 15 years. This is a large increase from 2006 and reflects the shift in age profile.
Table 12: Relationship between service expectations and likely reasons to leave plant pathology or entomology expressed as a percentage within each bracket of expected years of service. (2006 percentages are shown in parenthesis)
Expected Future
Years of Service
n
Likely Reason to Leave
Career development (new field of
activity)
Career development
(overseas study or
opportunity)
Limited tenure or funding
constraints
Retirement Other Total
<5 59 14 (22) 15 (7) 17 (35) 53 (29) 2 (7) 100
5-10 62 8 (6) 5 (9) 6 (13) 74 (67) 6 (5) 100
11-15 43 5 (10) 2 (0) 3 (5) 86 (81) 0 (5) 100
Overall 164 9 (13) 8 (6) 10 (20) 70 (55) 3 (6) 100

PLANT PATHOLOGY AND ENTOMOLOGY CAPABILITY STUDY - 2012 18
Table 13 summarizes data on the relationship between age range and likely reasons to leave in the context of ‘Active’ respondents, that is, those currently in employment. It is not surprising that retirement dominates the >55 age bracket at 88% anticipating departure due to retirement. In the 45-54 age bracket 51% anticipate departure due to retirement, whilst 39% have no plans to leave. Together, that means 90% of this age bracket appear quite committed to their profession, a positive result.
A positive result overall is the numbers in the lower age brackets that indicate no plans to leave their field. Under 25s had a response rate too low to be meaningful, however, 60% of the 25-34 bracket and 70% of the 35-44 bracket indicated a commitment to their career.
Therefore, apart from retirement, the greatest risk of loss from the two disciplines appears to be concerns over funding or seeking new career opportunities. These two factors may, of course, be linked, but potentially will lead to a combined 20% loss from the ranks of these mid-career specialists.
Those in the 25-34 age bracket have a strong interest in career development through overseas study or opportunities, accounting for 23% of those actively employed in this bracket. Up to 15% of those actively employed in this bracket may be lost from these disciplines altogether through other pursuits and/or concerns over tenure or funding.
Table 13: Relationship between age range and likely reasons to leave plant pathology or entomology based on actual numbers of ‘Active’ respondents in each age bracket. The percentage of ‘Active’ respondents is shown in parenthesis.
Age range
Likely Reason to Leave
No plans to
leave Active
Career development (new field of
activity)
Career development
(overseas study or
opportunity)
Limited tenure or funding
constraints
Retire- ment Other
<25 0 (0%) 0 (0%) 1 (50%) 0 (0%) 0 (0%) 1 (50%) 2
25-34 3 (9%) 8 (23%) 2 (6%) 0 (0%) 1 (3%) 21 (60%) 35
35-44 8 (10%) 4 (5%) 8 (10%) 3 (4%) 1 (1%) 55 (70%) 79
45-54 4 (5%) 1 (1%) 2 (3%) 38 (51%) 1 (1%) 29 (39%) 75
>55 0 (0%) 0 (0%) 4 (5%) 73 (88%) 2 (2%) 4 (5%) 83
Overall 15 (5%) 13 (5%) 17 (6%) 114 (42%) 5 (2%) 110 (40%) 274
This relationship between age groupings and likely reasons for departure was not conducted for the 2006 survey report. However, what is evident in looking at both Tables 12 and 13 based on the 2012 survey, there appears to be a stronger commitment to maintaining careers in these two disciplines than there was in 2006.
Despite this the projected departures due to retirement is a major threat. This provides strong reinforcement for the concerns expressed regarding loss of skills, inadequate succession planning and lack of new talent that emerge in part 6 of this report.
Losses are not limited to retirement, however, with departures due to concerns over funding and tenure potentially driving career changes which suggests a need to pay close attention to retention of key staff in younger and mid-term career age brackets. Retention strategies and succession planning are clearly closely linked and should possibly be considered together.
PLANT PATHOLOGY AND ENTOMOLOGY CAPABILITY STUDY - 2012 19
5. Education and Training
Training Priorities – Competency and Skills
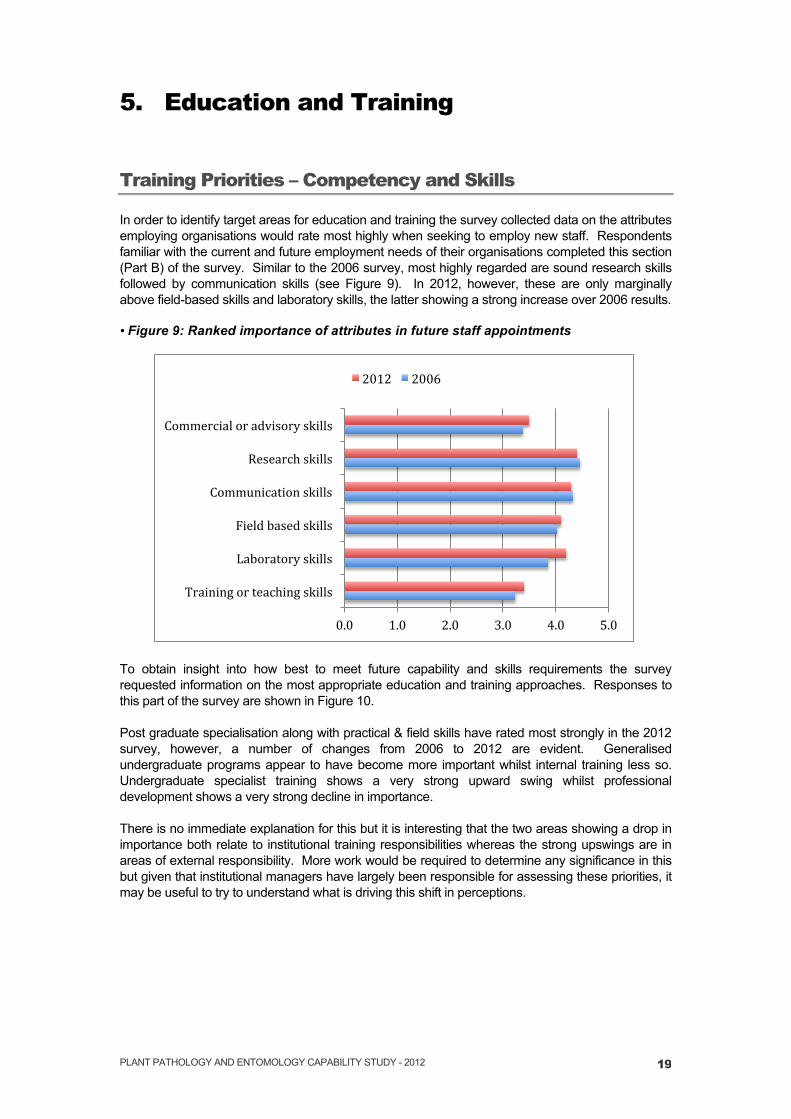
In order to identify target areas for education and training the survey collected data on the attributes employing organisations would rate most highly when seeking to employ new staff. Respondents familiar with the current and future employment needs of their organisations completed this section (Part B) of the survey. Similar to the 2006 survey, most highly regarded are sound research skills followed by communication skills (see Figure 9). In 2012, however, these are only marginally above field-based skills and laboratory skills, the latter showing a strong increase over 2006 results.
• Figure 9: Ranked importance of attributes in future staff appointments
To obtain insight into how best to meet future capability and skills requirements the survey requested information on the most appropriate education and training approaches. Responses to this part of the survey are shown in Figure 10.
Post graduate specialisation along with practical & field skills have rated most strongly in the 2012 survey, however, a number of changes from 2006 to 2012 are evident. Generalised undergraduate programs appear to have become more important whilst internal training less so. Undergraduate specialist training shows a very strong upward swing whilst professional development shows a very strong decline in importance.
There is no immediate explanation for this but it is interesting that the two areas showing a drop in importance both relate to institutional training responsibilities whereas the strong upswings are in areas of external responsibility. More work would be required to determine any significance in this but given that institutional managers have largely been responsible for assessing these priorities, it may be useful to try to understand what is driving this shift in perceptions.
0.0 1.0 2.0 3.0 4.0 5.0
Training or teaching skills
Laboratory skills
Field based skills
Communication skills
Research skills
Commercial or advisory skills
2012 2006

PLANT PATHOLOGY AND ENTOMOLOGY CAPABILITY STUDY - 2012 20
• Figure 10: Identification of training priorities as a percentage of all responses (n=160)
Industry support for education and training
In both surveys respondents were asked to review a list of different approaches to supporting the training and development of plant pathologists and entomologists and assess the extent to which their organisation may or may not engage with each. The results are shown in Table 14 with percentage for each of three categories, i) unlikely to support, ii) possibly support or, iii) highly likely to support. Some additional training and support options were provided in the 2012 survey but, where applicable, results for 2006 are shown in parenthesis.
The only area to rate strongly in the ‘Highly likely’ category is ‘As an employer of postgraduates’. This clearly places pressure on opportunities for undergraduates looking to move into employment. This observation was noted in the 2006 report but the concern is even more evident in the 2012 survey results. The observation from the 2006 report is quoted below for further emphasis:
These results emphasize again the significance placed on postgraduate achievement, almost certainly driven by the research focus of organisations surveyed. There is a substantial drop in the likely employment of undergraduates and this is an important area for concern. What is evident from this result is an opportunity gap for graduates, meaning that they are driven into postgraduate programs in an effort to improve employment opportunities and therefore do not have the opportunity to build on their undergraduate degree with workplace experience. It is not surprising that employers identify shortage of practical skills as an issue.
There is quite a clear shift away from the likelihood that organisations will commit to skills development and training. In almost every case there is an increase from 2006 in the ‘Unlikely’ column and a corresponding decrease from 2006 in the ‘Highly likely’ column. When this is combined with the inference above that organisations appear to be placing less priority on internal training options this is potentially an alarming trend. Further examination of this would be beneficial in order to understand more clearly how organisations view their responsibilities for internal development; succession planning and skills transfer within their operations.
0.0% 5.0% 10.0% 15.0% 20.0% 25.0%
Practical & Xield skills
Professional development
Post-‐grad specialisation
Undergraduate specialisation
Internal training
Availability of post-‐grad programs
Generalised undergraduate programs
Flexibility in delivery formats
2012 2006

PLANT PATHOLOGY AND ENTOMOLOGY CAPABILITY STUDY - 2012 21
Table 14: Overall potential for employment and training support from the 2012 survey. (2006 responses are shown in parenthesis)
Training/support area Percentage of Responses
Unlikely %
Possible %
Highly Likely %
An employer of undergraduates 21 (13) 45 (41) 33 (46)
An employer of postgraduates 5 (5) 36 (25) 59 (70)
Provide financial support/ scholarships/cadetships for internal staff 45 (29) 45 ((52) 10 (19)
Provide structured professional development program 32 (-) 56 (-) 12 (-)
Provide annual corporate scholarship or award on a competitive basis 60 (47) 29 (43) 10 (10)
Offer work experience or short term on the job opportunities for trainees 15 (11) 57 (50) 28 (39)
Provide direct sponsorship for a particular course or specialty unit 57 (57) 36 (38) 8 (5)
Contribute skills to on-line or distance training programs 28 (-) 56 (-) 16 (-)
The 2006 report further states:
It is also evident from these results that employers are reluctant to contribute in a direct financial way to education and training. All options involving direct financial contribution, including scholarships, cadetships and course sponsorship rate quite strongly in the ‘unlikely’ category. In order to encourage graduates into plant pathology and entomology careers, thereby ensuring on-going capability in these fields the major employing organisations need to consider these issues carefully. There is a need to promote the employment of undergraduates, focus on the internal development of the skills base and be more prepared to invest in the specialisation and careers of their people.
Unfortunately the situation appears to have deteriorated rather than improved. A key challenge for organisations looking to have reliable access to a capable workforce in plant pathology and entomology is for them to take greater responsibility in providing employment opportunities and skills development in a nurturing environment. Attention to these areas is likely to see a more positive culture for developing talent as well as building a foundation for succession as expert skills and experience are handed on from industry specialists nearing retirement.

PLANT PATHOLOGY AND ENTOMOLOGY CAPABILITY STUDY - 2012 22
6. Issues that concern survey respondents
The surveys in both 2006 and 2012 collected information on how concerned plant pathologists and entomologists were about a range of issues that influence their current employment and work environment. Areas such as employment opportunities, career progression, work pressure, tenure and funding, among others were explored. Three new areas were added to the 2012 survey, which were opportunities for professional development, perceived shift from strategic to applied research and capacity to respond to biosecurity incursions.
In the area of organisational capacity to meet future requirements, respondents were asked to rate additional areas of concern including, capacity to meet demand for services, impact of emergency response, access to qualified specialists and anticipated retirement of key personnel.
In each case respondents were asked to rate their concerns using a 4 point scale – ‘Not concerned at all’, ‘Concerned’, ‘Very concerned’ and ‘Extremely concerned’.
Table 15 summarizes the results obtained across the range of issues that influence employment at a personal level. For comparison the results for the 2006 survey across the same issues are shown in parenthesis. Highlights in these responses include:
n Employment opportunities – 65% in 2012 are either ‘Very concerned’ or ‘Extremely concerned’, which is up from 47% across these 2 categories in 2006.
n Prospects for career progression – 59% ‘Very concerned’ or ‘Extremely concerned’ in 2012, up from 46% in 2006.
n Opportunities for professional development tended, in 2012, to fall into the concerned to very concerned categories – 65% of all respondents.
n Tenure or funding constrains – 73% ‘Very concerned’ or “Extremely concerned in 2012, up from 66% in 2006.
n Work pressure demands have remained consistent between surveys with most indicating ‘Concerned’ to ‘Very concerned’.
Table 15: Level of concern expressed across a range of issues relating to employment 2012 (2006 percentage responses are shown in parenthesis)
Area for concern
Percentage of Responses Not Concerned
at all %
Concerned
%
Very Concerned
%
Extremely Concerned
% Employment opportunities in the field 11 (16) 24 (38) 30 (25) 35 (22)
Prospects for career progression 14 (16) 26 (37) 31 (26) 28 (20)
Opportunities for professional development within your organisation 26 (-) 31 (-) 27 (-) 16 (-)
Emphasis on provision of services in commercial context 26 (26) 38 (41) 27 (23) 9 (10)
A perceived shift from strategic to applied research 36 (-) 37 (-) 20 (-) 7 (-)
Tenure or funding constraints 9 (11) 19 (22) 28 (30) 45 (36)
Capacity of your organisation to respond to biosecurity incursions 25 (-) 34 (-) 26 (-) 15 (-)
Work pressure demands 13 (14) 35 (34) 32 (30) 20 (23)
Other 39 (35) 18 (13) 23 (17) 20 (35)
Respondents indicated a number of ‘Other’ areas of concern. Figure 11 is a word cloud indicating the range and importance of issues that respondents indicated in open responses. Despite

PLANT PATHOLOGY AND ENTOMOLOGY CAPABILITY STUDY - 2012 23
‘Funding’ being an option in the initial selections it has been further highlighted in these response, often connected with short planning horizons and limited contract periods for research projects.
Succession planning and future prospects/career opportunities are also of concern along with the loss of skills through inadequate training, limited knowledge transfer and retirement.
• Figure 11: Word cloud indicating the range and frequency of various concerns impacting employment as noted in open responses (2012)
Current concerns, as indicated above, are similar to those that respondents have in terms of their organisations capacity to meet future requirements. A range of issues was listed in the survey and Table 16 shows the responses to those issues. Responses from the 2006 survey are shown in parenthesis for comparison.
Highlights from responses to concerns about future capacity are:
n General capacity to meet demands for services – 73% indicated that they are “Concerned’ to “Very concerned’, a similar result to 2006.
n Impact of emergency response requirements drew similar responses to those above.
n Availability of key staff in critical activity areas – 67% are ‘Very concerned’ or ‘Extremely concerned’.
n Access to graduates in specialty disciplines along with the standards of the graduate skill base drew responses mostly in the areas of ‘Concerned’ to ‘Very concerned’.
n Less concern was evident in regard to movement of staff to overseas positions, however, relatively high levels of concern were indicated in the area of anticipated retirement of key personnel.

PLANT PATHOLOGY AND ENTOMOLOGY CAPABILITY STUDY - 2012 24
• Table 16: Level of concern expressed across a range of issues relating to future requirements within each discipline 2012 (2006 percentage responses are shown in parenthesis)
Area for concern
Percentage of Responses Not Concerned
at all %
Concerned %
Very Concerned
%
Extremely Concerned
% General capacity to meet demands for services 9 (12) 36 (41) 37 (31) 18 (15)
Impact of emergency response requirements 14 (17) 35 (35) 34 (40) 16 (18)
Availability of key staff in critical activity areas 7 (8) 26 (29) 38 (37) 29 (26)
Access to graduates in specialty disciplines 12 (15) 33 (37) 33 (31) 21 (17)
Standard of graduate skills base
16 (18) 34 (40) 31 (26) 19 (16)
Movement of staff to overseas positions
37 (46) 36 (37) 22 (13) 6 (4)
Anticipated retirement of key personnel
11 (12) 30 (28) 28 (30) 30 (30)
Other
63 (52) 9 (11) 14 (18) 14 (20)
Responses to ‘Other’ also revealed a number of concerns through open responses. Again, there is significant overlap in that the things that concern respondents in the current climate tend to be the things that worry them about the future capacity in their fields of specialty. Figure 12 provides an illustration of the range and frequency of future concerns by means of a word map.
• Figure 12: Word cloud indicating the range and frequency of various concerns about future capacity as noted in open responses (2012)

PLANT PATHOLOGY AND ENTOMOLOGY CAPABILITY STUDY - 2012 25
7. Conclusion
The 2012 survey provided important insights into the current capability in the fields of plant pathology and entomology and when reviewed along side the 2006 survey similarities and differences are readily identified. Similar response levels were achieved with both surveys, 2012 receiving 333 complete surveys whilst the 2006 survey delivered 359 responses.
Australia and New Zealand continue to be supported by a capable resource in plant pathology and entomology and it is evident from the two surveys that the resource is particularly strong in academic achievement. Of the 333 respondents in 2012, 65% are qualified at PhD level, an increase from 59% in 2006. Sixty-two percent are employed in the government sector with 21% in the education sector. The percentage distribution across the sectors is largely similar in both surveys.
There continues to be a dominance of research focus with 63% of FTEs applied into research, whilst areas such as education/teaching and extension rate at fewer than 5% of FTEs each. Extension has declined from an already low base in 2006 to just 2.5% of FTEs in 2012.
Most capability is applied with an agricultural production or horticultural production focus. Forestry, nursery, heritage, storage and post-harvest management all were found to have very low levels of capability application, mostly well under 10% of FTEs. However, this is consistent with the 2006 survey and there has been virtually no change over the 2 surveys in the distribution of capability in terms of the primary focus of respondents’ activities.
In plant pathology, mycology remains the dominant sub-discipline but showing a decline from 2006. There are noticeable declines in areas of virology and bacteriology with an increase in respondents selecting ‘Other’, and then reporting multiple sub-disciplines. This suggests that many may be taking on greater diversity and a reduction in specialisation.
In entomology FTEs in genetics and insect pathology have declined in 2012, behaviour and biochemistry are slightly higher with high FTEs again reported for ‘Other’, most of which report ecology as the sub-discipline.
In terms of expected future demand within the various sub-discipline areas, mycology remains the strongest, with no change from 2006. Bacteriology, nematology, molecular plant pathology and phytoplasmas, all rank strongly higher for future importance in 2012.
In entomology sub-disciplines, the category taxonomy & systematics leads in importance with a small increase over 2006. Genetics and biochemistry, whilst lower ranked, have shown the strongest increase in importance in 2012. As with plant pathology above, rankings for entomology sub-disciplines in 2012 are similar to 2006 except for quite strong increases in genetics and biochemistry.
In the 2006 survey it was evident that the age distribution across the various age brackets from 25-34 through to 55+ was relatively even. That is not the case in the 2012 where it is very clear that the age profile has shifted strongly into the 55+ age bracket with quite low levels coming through in the younger age brackets. This points to current concerns that capacity in plant pathology and entomology will be seriously diminished in a relatively short time frame. Whist there remains a continued potential for those in the younger age brackets to change career direction within 5 to 10 years, it is less apparent than in the 2006 survey. However, loss of capacity through retirement has become a far more significant issue as the age profile has shifted upwards.
Both surveys indicated that respondents have concerns over areas of funding and tenure. These concerns have a strong influence on the sense of job security and stability. Practitioners in these disciplines identify their concerns about loss of skills, inadequate succession planning and lack of

PLANT PATHOLOGY AND ENTOMOLOGY CAPABILITY STUDY - 2012 26
new emerging talent, yet administrators and managers (many of whom are themselves practitioners) have a perception that their organisations are not sufficiently committed to effective succession planning, engagement of emerging talent or internal development programs.
The 2006 report listed a number of areas that could be addressed in order to build and retain capacity and capability in plant pathology and entomology.
These included attention to:
n retaining existing capability through improved sense of job security, professional development, knowledge transfer and retention incentives,
n programs aimed at attracting high school and generalist undergraduates into careers in plant pathology and entomology,
n development of inspirational and motivational curricula, including flexibility in delivery and access to undergraduate programs,
n active recruitment of undergraduates to capture, then develop the capacity internally within organisations.
All of the above remain relevant given the results from the 2012 survey. The current awareness of low enrolments in undergraduate programs and the shifting age profile are clear evidence of inadequate recruitment into these disciplines. When this is exacerbated by the emerging impact of retirements and some continued loss from early to mid-career specialists it is clear that recruitment and retention must receive significant focus if there is to be positive change.
Both the Australasian Plant Pathology Society and the Australian Entomological Society are strongly motivated to plan for expansion of their sector as opposed to developing contingencies for retraction. It is important that both societies have taken the initiative to undertake this survey and evaluate where capability exists and the factors influencing future capacity. The next steps are critical in development of a coordinated response to the issues identified.
The issues for both societies are similar. The data obtained provides the opportunity for them to work on joint initiatives to enhance the future of both disciplines, each so fundamentally important to Australia and New Zealand in terms of food and fibre production, food security, environment, amenity and natural heritage. Increasingly issues of biosecurity and access to international trade opportunities are dependant upon the national capability and capacity for both countries in these areas.
The key recommendation, therefore from the analysis of the 2012 survey is that the APPS and AES convene a joint action committee, with additional representation from the Plant Biosecurity Cooperative Research Centre to review of the 2012 findings and commit to a combined and coordinated strategy to address the key issues including:
n Development of targeted communication strategies for specific audiences including:
o Politicians and policy makers
o Science & Technology Australia
o Funding agencies
o Industry bodies and representatives
o Course developers
n Development of retention strategies for employing organisations including:
o Funding and tenure challenges
o Commitment to professional development
o Effective succession planning and knowledge transfer
o Incentives structures that promote a range of skills (ie not just publication) that will encourage career progression and retention of skilled staff

PLANT PATHOLOGY AND ENTOMOLOGY CAPABILITY STUDY - 2012 27
n Attraction of new talent into the disciplines through:
o High school recruitment programs
o Active promotion of plant pathology and entomology careers during generalist undergraduate programs
o Engagement of the societies with undergraduates to secure participation in society activities and motivate interest in plant pathology and entomology careers
o Development of a visionary and inspirational career prospectus
o Motivate an organisational commitment to the recruitment and development of undergraduates
n Coordinate with the tertiary sector and industry to develop innovative and flexible undergraduate training programs that include practical skills-development in key areas of future demand
n Identify and access new funding sources to underpin specialist training programs, for example, industry sponsorship or scholarships/traineeships
These areas for action are largely similar to the recommendations of the 2006 survey report. Given the high level of consistency between the surveys, this is not surprising. Very similar issues have emerged, and where there has been change, it has indicated a reinforcement of the importance of the above actions.
With the added impact of combined and committed efforts the opportunity exists for these two disciplines to focus on and drive some key initiatives that, if successful will begin to rebuild the foundation for future capacity and ensure that both Australia and New Zealand can capture and retain the outstanding capability they currently have in both plant pathology and entomology.
PLANT PATHOLOGY AND ENTOMOLOGY CAPABILITY STUDY - 2012 28
References
Australian. Dept. of Education, Science and Training (2006) ‘Audit of Science, engineering and technology skills, Summary Report’. Dept. of Education, Science and Training, [Canberra, A.C.T.]
Howie, Bruce, Plant Pathology and Entomology Capability Study accessed at http://www.tpp.uq.edu.au/Portals/17/Resources/publications/APPC%20Final%20Report.pdf
Merriman, Peter, Decline of Australian Agricultural experts in plant industries: causes & retrieval, Agricultural Science Vol 24, No 2. August 2012. AgInstitute Australia
Acknowledgements
The 2012 survey was conducted on behalf of, and funded by, the Australasian Plant Pathology Society, Australian Entomological Society and the Plant Biosecurity Cooperative Research Centre.
Thanks also to:
n Elaine Davison – President, Australasian Plant Pathology Society
n David Yeates – Vice President, Australian Entomological Society
n Simon McKirdy – Former CEO, Plant Biosecurity Cooperative Research Centre
n Rob Magarey – BSES (Survey steering committee representing APPS))
n Peter Merriman – Private consultant (Survey steering committee representing CRCNPB)
n David Merritt – University of Queensland (Survey steering committee representing AES)
Statistical Limitations
As was the case with the 2006 survey, the 2012 survey was widely distributed in order to obtain a valid snapshot of plant pathology and entomology capability across Australia and New Zealand. The data presented is a compilation of responses and analysed only to the extent of making comparisons between responses and one-to-one relationships through cross tabulation. Comparisons between the 2006 and 2012 surveys are based on the direct response values.
The 2012 survey attracted 333 complete responses, considered to be a high level of representation for plant pathology and entomology in Australia and New Zealand.

PLANT PATHOLOGY AND ENTOMOLOGY CAPABILITY STUDY - 2012 29
Appendix A: Survey
Plant Pathology and Entomology Capability in Australia and New Zealand
Introduction
This survey is a collaborative project involving the Australasian Plant Pathology Society and the Australian Entomological Society. It is supported by the Plant Biosecurity Cooperative Research Centre. The purpose of the survey is to obtain information about two aspects of plant pathology and entomology in Australia and New Zealand. Part A is designed to capture a snapshot of the current capability in these disciplines, identify where the capability exists and how it is utilized. This information will be profiled against age groupings and anticipated future service, which will be helpful in assessing future capability distribution. Part A should take you about 15 to 20 minutes to complete. Part B is designed to obtain feedback from various industry levels about current and future industry needs for plant pathology and entomology expertise. This will provide valuable information to assist in planning education and training programs to ensure the availability of specialists to support future industry requirements. Part B should take you about 15 minutes to complete. You may wish to complete only Part A or Part B of the survey. For example, if you are a plant pathologist or entomologist with no input on industry needs just complete Part A. If you are not a plant pathologist or entomologist but engaged in industry in a role that provides you with insight into industry requirements in these disciplines just complete Part B. You will be directed through Part A and/or Part B depending upon the answers you provide throughout the survey. This survey is based on a similar survey conducted in 2006 so your participation will provide valuable current and comparative data for these two science specialities. We respect your privacy and all data is collected anonymously except if you choose to provide your contact details for the purpose of a telephone interview. If you provide your contact details these will remain confidential. For further information about the survey please contact Bruce Howie at [email protected]
The survey is intended to capture information about plant pathology and entomology capability currently within Australia and New Zealand. Are you currently located in either Australia or New Zealand?
Yes
No
What is your current location?
New Zealand - North Island
New Zealand - South Island
Australia - Northern Territory
Australia - Western Australia
Australia - South Australia
PLANT PATHOLOGY AND ENTOMOLOGY CAPABILITY STUDY - 2012 30
Australia - Tasmania
Australia - Victoria
Australia - Australian Capital Territory
Australia - New South Wales
Australia - Queensland
Which of the following best describes the type of organisation in which you are employed, or industry group in which you are involved (select only your primary employer or industry group)?
University/Higher education
State Department/Ministry of Agriculture, Primary Industries or Forestry
Crown Research Institute
Commercial Company – supplier
Commercial Company – distributor
Commercial Company – services
Commercial Company – R&D start-up
Primary Producer or Grower Association
CSIRO
Cooperative Research Centre (primary employer)
National Plant Health, Quarantine or Biosecurity entity
Heritage or Environment (eg Landcare/Museum/National Park/Botanical Garden)
Vocational (eg Agricultural College/TAFE/TVET)
Industry Research and Development Corporation (eg HAL/GRDC/CRCD/FAR)
Not currently employed (eg seeking employment or retired)
Other, please specify... ______________________
If you are associated with a CRC please indicate your percentage in-kind contribution.
What is your gender?
Male

PLANT PATHOLOGY AND ENTOMOLOGY CAPABILITY STUDY - 2012 31
Female
Have you registered on the Plant Health Australia Expertise Register?
Yes
No
What is your employment status?
Part-time (show average days per week) ______________________
Full-time
Not currently employed in my field of training, but seeking employment
Retired
What is the nature of your employment contract?
Short term contract (3 years or less)
Long term contract (more than 3 years)
Tenured position
Commercial sector employment contract
Self-employed
Honorarium (or similar)
Voluntary
Not employed
What is the longest contract you have held?
None
1 year or less
1-3 years
3-5 years
More than 5 years
Are you trained or employed in either plant pathology or entomology?
Note: If you answer YES you will be directed to Part A of the survey (Plant Pathology and Entomology Capability).If you answer NO you will be directed to Part B of the survey (Current and Future Industry Needs).
Yes
No
PLANT PATHOLOGY AND ENTOMOLOGY CAPABILITY STUDY - 2012 32
Part A - Plant pathology and entomology capability
Indicate your highest level of formal training
High school year 12 (or equivalent)
Vocational/TAFE/Diploma
Undergraduate degree
Undergraduate degree with honours
Graduate diploma
Masters degree (coursework)
Masters degree (research)
Doctorate
What is your age bracket?
<25
25-34
35-44
45-54
>55
Do you anticipate leaving your work in the Australian/NZ Plant Pathology or Entomology fields within the next:
<5
5-10 years
11-15 years
No plans to leave within the above time frame
Not applicable (retired or not currently employed)
Please identify the likely reason for leaving employment in Australian/NZ plant pathology or entomology from the options below:
Retirement
Career development (new field of activity)
Career development (overseas study or overseas opportunity)
Limited tenure/funding constraints
Other, please specify... ______________________
PLANT PATHOLOGY AND ENTOMOLOGY CAPABILITY STUDY - 2012 33
How concerned are you about each of the following issues associated with your employment in plant pathology or entomology in Australia/NZ?
Not concerned at all
Concerned Very concerned
Extremely concerned
Employment opportunities in your field
Prospects for career progression
Opportunities for professional development within your organisation
Emphasis on provision of services in commercial context
A perceived shift from strategic to applied research
Tenure or funding constraints
Capacity of your organisation to respond to biosecurity incursions
Work pressure demands
Are there other issues that concern you? Please specify below
Add a comment about other issues that concern you about your employment:
How concerned are you about each of the following issues associated with the future requirements within your area of plant pathology or entomology in Australia/NZ?
Not concerned at all
Concerned Very concerned
Extremely concerned
General capacity to meet demands for services
Impact of emergency response requirements
Availability of key staff in critical activity areas
Access to graduates in specialty disciplines
PLANT PATHOLOGY AND ENTOMOLOGY CAPABILITY STUDY - 2012 34
Standard of graduate skills base
Movement of staff to overseas positions
Anticipated retirement of key personnel
Are there other issues that concern you? Please specify below
Add a comment about other issues that concern you about future requirements in your area:
What is your primary discipline?
Plant pathology
Entomology
Are you a member of the Australasian Plant Pathology Society?
Yes
No
What is your sub-discipline?
Mycology
Virology
Bacteriology
Nematology
Molecular Plant Pathology
Phytoplasmas
No specific sub-discipline
Other, please specify... ______________________
If you have a focus on a particular systematic group (eg Fusarium, Phytophthora etc) please record that here.
How long have you worked in your current field of specialty?
<1 year

PLANT PATHOLOGY AND ENTOMOLOGY CAPABILITY STUDY - 2012 35
1-5 years
6-10 years
>10 years
You indicated that your sub-discipline area is {{ selection }}. In which of the following capacities do you mainly work (or worked in prior to retirement)?
Note: Select whichever are appropriate. You will be asked in the following 2 questions to indicate the percentage of your time allocated to each capacity that you select and then the primary environment (e.g. research, teaching, commercial) in which each is applied.
Diagnostics – Laboratory
Diagnostics – Field
Emergency response and management
Genetics
Physiology
Epidemiology
Taxonomy
Disease control and management (Resistance/Breeding)
Disease control and management (Biological or Chemical inputs & practices)
Administration
Other, please specify... ______________________
What percentage of your time would you allocate to {{ selection }}.
Select which one of the following is the primary environment in which you work in {{ selection }}.
Education/Teaching
Research - Basic
Research - Strategic
Research - Applied
Extension
Regulatory/Policy
Biosecurity

PLANT PATHOLOGY AND ENTOMOLOGY CAPABILITY STUDY - 2012 36
Quarantine
Commercial - Sales/Marketing
Commercial - Technical
Advisory
Select which of the following industry areas you work in:
Note: You may select more than one. In the following question you will be asked to estimate the percentage of your time that you allocate to each area that you select.
Agriculture – Production
Agriculture – Storage
Horticulture – Production
Horticulture – Post-harvest
Forestry - Production
Forestry – Wood Products
Forestry - Urban
Nursery/Turf/Ornamental
Heritage/Natural Ecosystems
What is the percentage of your time that you work in {{ selection }}.
You have completed the plant pathology section of the survey. Do you also have qualifications in entomology?
Note: If you answer YES you will be directed to the entomology section of the survey. If you answer NO you will return to general questions.
Yes
No
Are you a member of the Australian Entomological Society?
Yes
No
What is your sub-discipline?
Taxonomy/Systematics
Genetics

PLANT PATHOLOGY AND ENTOMOLOGY CAPABILITY STUDY - 2012 37
Physiology
Biochemistry
Insect pathology
Behaviour
No specific sub-discipline
Other, please specify... ______________________
If you have a focus on a particular systematic group (eg Lepidoptera, Diptera; Arachnids, other invertebrates etc) please record that here.
How long have you worked in your current field of specialty?
<1 year
1-5 years
6-10 years
>10 years
You indicated that your sub-discipline area is {{ selection }}. In which of the following capacities do you mainly work (or worked in prior to retirement)?
Note: Select whichever are appropriate. You will be asked in the following 2 questions to indicate the percentage of your time allocated to each capacity that you select and then the primary environment (e.g. research, teaching, commercial) in which each is applied.
Diagnostics - Laboratory
Diagnostics - Field
Emergency response and management
Population studies
Curation
Pest control and management (including IPM)
Environmental
Administration
Other, please specify... ______________________
What percentage of your time would you allocate to {{ selection }}.

PLANT PATHOLOGY AND ENTOMOLOGY CAPABILITY STUDY - 2012 38
Select which one of the following is the primary environment in which you work in {{ selection }}.
Education/Teaching
Research - Basic
Research - Strategic
Research - Applied
Extension
Regulatory/Policy
Biosecurity
Quarantine
Commercial - Sales/Marketing
Commercial - Technical
Advisory
Select which of the following industry areas you work in:
Note: You may select more than one. In the following question you will be asked to estimate the percentage of your time that you allocate to each area that you select.
Agriculture – Production
Agriculture – Storage
Horticulture – Production
Horticulture – Post-harvest
Forestry - Production
Forestry – Wood Products
Forestry - Urban
Nursery/Turf/Ornamental
Heritage/Natural Ecosystems
Urban and commercial pest management
Medical and/or Public Health Entomology
Insecticide technology
What is the percentage of your time that you work in {{ selection }}.

PLANT PATHOLOGY AND ENTOMOLOGY CAPABILITY STUDY - 2012 39
Do you anticipate undertaking further study in plant pathology or entomology in the future?
Yes – in Australia/NZ
Yes – overseas
No
How soon do you plan to commence further study?
<5 years
>5 years
What do you expect to be the level of your next study program?
High school year 12 (or equivalent)
VET certificate/diploma
Undergraduate degree
Masters degree (coursework)
Masters degree (research)
Doctorate
Postdoctorate
Unsure
We would like to conduct a small number of short interviews with respondents to this Part A of the survey. Would you be willing to participate in a telephone interview?
Yes
No
Please provide your contact details.
First name
Last name
Contact phone number
Email address

PLANT PATHOLOGY AND ENTOMOLOGY CAPABILITY STUDY - 2012 40
The next section of the survey (Part B) is about current and future needs in plant pathology and entomology. If you are a plant pathologist, entomologist or an administrator/manager with insight into industry needs we would like you to answer the questions in Part B.
Are you in a position that allows you to comment on current and future industry needs?
Note: If you answer YES you will continue to Part B of the survey. If you answer NO you will go to the end of the survey.
Yes
No
Part B - Current and future industry needs
Are you currently involved in the appointment of plant pathology or entomology staff within your organisation?
Yes
No
Are you familiar with the plant pathology requirements of your organisation?
Yes
No
Rate the following plant pathology sub-disciplines in terms of their current importance to your organisation.
Not at all Important
Somewhat Important
Neutral Important Very Important
Mycology
Virology
Bacteriology
Nematology
Molecular Plant Pathology
Phytoplasmas
Rate the following plant pathology skills and competencies in terms of their CURRENT importance to your organisation.
Not at all Important
Somewhat Important
Neutral Important Very Important

PLANT PATHOLOGY AND ENTOMOLOGY CAPABILITY STUDY - 2012 41
Diagnostics – Laboratory/taxonomic
Diagnostics – Field Skills
Risk assessment and quarantine services
Emergency response and management
Genetics
Physiology
Epidemiology
Taxonomy (other than for diagnostics)
Disease control and management (Resistance Breeding)
Disease control and management (Biological or Chemical inputs & practices)
Education and Training
Indicate your three main sources of the plant pathology skills and competencies required:
Internal
University/Higher education
State Department/Ministry of Agriculture or Forestry
Commercial Agronomist/Service Provider/Consultant
Grower or Industry Association
CSIRO
Cooperative Research Centre
National Plant Health, Quarantine or Biosecurity entity
Rural Industry Research and Development Corporation (eg HAL/GRDC/CRDC/FAR)
Other, please specify... ______________________
Thinking about the plant pathology skills and competencies required for your organisation, how satisfied are you with:
Very Dissatisfied
Dissatisfied Neutral Satisfied Very Satisfied
PLANT PATHOLOGY AND ENTOMOLOGY CAPABILITY STUDY - 2012 42
The accessibility of those skills and competencies for your organisation
The quality of those skills and competencies for your organisation
Rate the following plant pathology skills and competencies in terms of their FUTURE importance to your organisation.
Not at all Important
Somewhat Important
Neutral Important Very Important
Diagnostics – Laboratory/taxonomic
Diagnostics – Field Skills
Risk assessment and quarantine services
Emergency response and management
Genetics
Physiology
Epidemiology
Taxonomy (other than for diagnostics)
Disease control and management (Resistance Breeding)
Disease control and management (Biological or Chemical inputs & practices)
Education and Training
Are you familiar with the entomology requirements of your organisation?
Yes
No
Rate the following entomology sub-disciplines in terms of their current importance to your organisation.
Not at all Important
Somewhat Important
Neutral Important Very Important
Taxonomy/Systematics
PLANT PATHOLOGY AND ENTOMOLOGY CAPABILITY STUDY - 2012 43
Genetics
Physiology
Biochemistry
Insect Pathology
Behaviour
Rate the following entomology skills and competencies in terms of their CURRENT importance to your organisation.
Not at all Important
Somewhat Important
Neutral Important Very Important
Diagnostics – Laboratory/taxonomic
Diagnostics – Field Skills
Risk assessment and quarantine services
Emergency response and management
Curation
Pest control and management
Environment and Ecology
Education and Training
Indicate your three main sources of the entomology skills and competencies required:
Internal
University/Higher education
State Department/Ministry of Agriculture or Forestry
Commercial Agronomist/Service Provider/Consultant
Grower or Industry Association
CSIRO
Cooperative Research Centre
National Plant Health, Quarantine or Biosecurity entity
Rural Industry Research and Development Corporation (eg HAL/GRDC/CRDC/FAR)

PLANT PATHOLOGY AND ENTOMOLOGY CAPABILITY STUDY - 2012 44
Other, please specify... ______________________
Thinking about the entomology skills and competencies required for your organisation, how satisfied are you with:
Very Dissatisfied
Dissatisfied Neutral Satisfied Very Satisfied
The accessibility of those skills and competencies for your organisation
The quality of those skills and competencies for your organisation
Rate the following entomology skills and competencies in terms of their FUTURE importance to your organisation.
Not at all Important
Somewhat Important
Neutral Important Very Important
Diagnostics – Laboratory/taxonomic
Diagnostics – Field Skills
Risk assessment and quarantine services
Emergency response and management
Curation
Pest control and management
Environment and Ecology
Education and Training
Rate the following attributes in terms of their importance in the people your organisation will employ in the future?
Not at all Important
Somewhat Important
Neutral Important Very Important
Training or teaching skills
Laboratory skills
Field based skills
Communication skills
Research skills (Basic, Strategic or Applied)

PLANT PATHOLOGY AND ENTOMOLOGY CAPABILITY STUDY - 2012 45
Commercial or advisory skills
In order to meet the future needs of your organisation on which three of the following programs (in order of priority 1-3) would you place the greatest emphasis?
Priority 1 Priority 2 Priority 3
Internal training programs
Generalized undergraduate program
Undergraduate specialisation
Development of practical/field based skills
Postgraduate specialisation
Availability of postgraduate programs
Professional development opportunities
Flexibility in delivery formats
There are many ways in which your organisation might support an enhanced curriculum for the training of plant pathologists and entomologists. For each of the following indicate the likely level of your organisation’s support.
Unlikely Possible Highly likely
An employer of undergraduates
An employer of postgraduates
Provide financial support/scholarships/
cadetships for internal staff
Provide a structured professional development program
Provide annual corporate scholarship or award on a competitive basis
Offer work experience or short term on the job opportunities for trainees
Provide direct sponsorship for a particular course or specialty unit
Contribute skills to on-line or distance training programs

PLANT PATHOLOGY AND ENTOMOLOGY CAPABILITY STUDY - 2012 46
Please comment on any other ways your organisation might support training and development of plant pathologists and entomologists.
We would like to conduct a small number of short interviews with respondents to this Part B of the survey. Would you be willing to participate in a telephone interview?
Yes
No
Please provide your contact details.
First name
Last name
Contact phone number
Email address
The industry sectors for entomology were modified after the survey was released. You will only see this question if you selected one of the following industry sectors: Urban and commercial pest management, Medical and/or public health entomology, Insecticide technology. You may have partially or fully completed the survey previously but felt that you could not accurately record your industry sector. To help us identify any such responses could you please indicate the following:
I have not previously partially or fully completed the survey
I previously attempted the survey but quit when I felt that the industry sectors available were not suitable
I previously completed the survey by selecting an industry sector that was the best fit. If you can recall the sector you selected please note that here (or just leave it blank) ______________________

PLANT PATHOLOGY AND ENTOMOLOGY CAPABILITY STUDY - 2012 47
Appendix B: Survey Results This appendix provides survey results summarized by tables and figures without additional commentary in order to provide a comprehensive set of data should further analysis be required.
Appendix B List of Tables
Table 17: Highest level of training reported 2006 and 2012 ...................................................... 55
Table 18: Qualifications reported by organisation type, actual numbers 2012 (2006 numbers are shown in parenthesis) ........................................................................... 55
Table 19: Age profile by organisation – plant pathology 2012 (2006 numbers are shown in parenthesis) ................................................................................................................ 55
Table 20: Service Expectations by organisation – plant pathology 2012 (2006 numbers are shown in parenthesis) ............................................................................................ 56
Table 21: Age profile by organisation – entomology 2012 (2006 numbers are shown in parenthesis) .................................................................................................................... 56
Table 22: Service Expectations by organisation – entomology 2012 (2006 numbers are shown in parenthesis) ................................................................................................... 56
Table 23: Number of respondents for each period of expected years of service for plant pathologists and entomologists 2012 (2006 numbers are shown in parenthesis) .................................................................................................................... 56
Table 24: Relationship between service expectations and likely reasons to leave plant pathology or entomology 2012 (2006 numbers are shown in parenthesis) ......... 57
Table 25: Explanation of terms sub-discipline, capacity and primary environment as used in the survey .......................................................................................................... 57
Table 26: FTEs for plant pathology sub-discipline areas within organisations 2012 (2006 FTEs are shown in parenthesis) ....................................................................... 58
Table 27: FTEs for entomology sub-discipline areas within organisations 2012 (2006 FTEs are shown in parenthesis) .................................................................................. 58
Table 28: Primary focus of plant pathology and entomology capacity expressed as FTEs and percentage FTEs for both the 2006 and 2012 surveys ........................... 59
Table 29: Level of concern expressed across a range of issues relating to employment 2012 (2006 percentage responses are shown in parenthesis) ............................... 60
Table 30: Level of concern expressed across a range of issues relating to future requirements within each discipline 2012 (2006 percentage responses are shown in parenthesis) ................................................................................................... 60
Table 31: Ranking of current importance of plant pathology sub-discipline 2012 (2006 percentage responses are shown in parenthesis) ................................................... 61
Table 32: Ranking of current importance of plant pathology skills and competencies 2012 (2006 percentage responses are shown in parenthesis) ............................... 61

PLANT PATHOLOGY AND ENTOMOLOGY CAPABILITY STUDY - 2012 48
Table 33: Ranking of future importance of plant pathology skills and competencies 2012 (2006 percentage responses are shown in parenthesis) ............................... 62
Table 34: Ranking of current importance of entomology sub-disciplines 2012 (2006 percentage responses are shown in parenthesis) ................................................... 62
Table 35: Ranking of current importance of entomology skills and competencies 2012 (2006 percentage responses are shown in parenthesis) ......................................... 63
Table 36: Ranking of future importance of entomology skills and competencies 2012 (2006 percentage responses are shown in parenthesis) ......................................... 63
Table 37: Overall ranking of importance of attributes in future staff appointments 2012 (2006 percentage responses are shown in parenthesis) ......................................... 64
Table 38: Overall potential for employment and training support 2012 (2006 potential is shown in parenthesis) ................................................................................................... 65
Table 39: Sources of support by organisation 2012 .................................................................. 65
Appendix B List of Figures
Figure 13: National Distribution of Plant Pathology Capability by Organisation – Australia 2006 and 2012 ................................................................................................................. 49
Figure 14: National Distribution of Plant Pathology Capability by Organisation – New Zealand 2006 and 2012 .................................................................................................. 50
Figure 15: National Distribution of Entomology Capability by Organisation – Australia 2006 and 2012 ................................................................................................................. 51
Figure 16: National Distribution of Entomology Capability by Organisation – New Zealand 2006 and 2012 .................................................................................................. 52
Figure 17: Regional Distribution of Plant Pathology Capability – Australia 2006 and 2012 .................................................................................................................................. 53
Figure 18: Regional Distribution of Entomology Capability – Australia 2006 and 2012 ....... 54
Figure 19: Word cloud illustrating the range and emphasis of sub-discipline areas noted by entomologists that selected 'other' when identifying their sub-discipline 2012 .................................................................................................................................. 59
Figure 20: Ranking of training priorities 2012 .............................................................................. 64
Figure 21: Accessibility and quality of plant pathology support 2012 .................................... 65
Figure 22: Accessibility and quality of entomology support 2012 ........................................... 66

PLANT PATHOLOGY AND ENTOMOLOGY CAPABILITY STUDY - 2012 49
Part A: Plant Pathology and Entomology Capacity
Distribution of Capability
• Figure 13: National Distribution of Plant Pathology Capability by Organisation – Australia 2006 and 2012
2006
2012
Gov174%
Gov22%
Edu21%
Other1%Comm
2%
Comm 6%
Edu 23%
Gov1 59%
Gov2 10%
Other 2%

PLANT PATHOLOGY AND ENTOMOLOGY CAPABILITY STUDY - 2012 50
• Figure 14: National Distribution of Plant Pathology Capability by Organisation – New Zealand 2006 and 2012
2006
2012
Gov133%
Gov240%
Edu20%
Comm7%
Comm 4%
Edu 26%
Gov1 22%
Gov2 44%
Other 4%

PLANT PATHOLOGY AND ENTOMOLOGY CAPABILITY STUDY - 2012 51
• Figure 15: National Distribution of Entomology Capability by Organisation – Australia 2006 and 2012
2006
2012
Gov151%
Gov215%
Edu23%
Comm7%
Other4%
Comm 11%
Edu 21%
Gov1 47%
Gov2 19%
Other 2%

PLANT PATHOLOGY AND ENTOMOLOGY CAPABILITY STUDY - 2012 52
• Figure 16: National Distribution of Entomology Capability by Organisation – New Zealand 2006 and 2012
2006
2012
Gov150%
Gov243%
Comm7%
Edu 33%
Gov2 67%

PLANT PATHOLOGY AND ENTOMOLOGY CAPABILITY STUDY - 2012 53
Regional Distribution
• Figure 17: Regional Distribution of Plant Pathology Capability – Australia 2006 and 2012
2006
2012
ACT2% NSW
13%
NT3%
Qld27%
SA15%
Tas4%
Vic26%
WA10%
ACT 7%
NSW 18%
NT 2%
QLD 17%
SA 14%
TAS 4%
VIC 24%
WA 14%

PLANT PATHOLOGY AND ENTOMOLOGY CAPABILITY STUDY - 2012 54
• Figure 18: Regional Distribution of Entomology Capability – Australia 2006 and 2012
2006
2012
ACT11%
NSW15%
Qld42%
SA9%
Tas4%
Vic15%
WA4%
ACT 20%
NSW 20%
NT 3%
QLD 31%
SA 2%
TAS 2%
VIC 8%
WA 14%

PLANT PATHOLOGY AND ENTOMOLOGY CAPABILITY STUDY - 2012 55
Qualification Levels
Table 17: Highest level of training reported 2006 and 2012
Level 2006 2012 Number % Number %
Doctorate 175 53 201 65 Masters degree (research) 33 10 38 12 Masters degree (coursework) 6 2 8 3 Graduate diploma 11 3 8 3 Undergraduate degree with honours 43 13 27 9 Undergraduate degree 48 14 22 7 Vocational/TAFE/Diploma 13 4 4 1 High school year 12 (or equivalent) 4 1 2 0 Total Responses 333 100 310 100
Table 18: Qualifications reported by organisation type, actual numbers 2012 (2006 numbers are shown in parenthesis)
Level Organisation
Gov1 Gov2 Edu Comm Other Doctorate 80 (96) 36 (19) 57 (53) 8 (3) 4 (4)
Masters degree (research) 18 (22) 6 (6) 5 (3) 3 (0) 1 (2)
Masters degree (coursework) 4 (1) 2 (1) 0 (1) 2 (2) 0 (1)
Graduate diploma 6 (9) 1 (0) 0 (0) 1 (2) 0 (0)
Undergraduate degree with honours 14 (28) 3 (3) 4 (10) 4 (2) 1 (0)
Undergraduate degree 13 (33) 6 (8) 1 (2) 2 (5) 0 (0)
Vocational/TAFE/Diploma 1 (13) 2 (0) 0 (0) 1 (0) 0 (0)
High school year 12 (or equivalent) 0 (3) 2 (0) 0 (1) 0 (0) 0 (0)
Total (n=288) 136 (205) 58 (37) 67 (70) 21 (14) 6 (7)
Overall % 47.2 (61.6) 20.1 (11.1) 23.3 (21.0) 7.3 (4.2) 2.1 (2.1)
Age Profile and Service Expectations
Table 19: Age profile by organisation – plant pathology 2012 (2006 numbers are shown in parenthesis)
Organisation Number of Respondents in Age Bracket
<25 25-34 35-44 45-54 55+ Total Gov1 0 (0) 7 (31) 29 (35) 23 (45) 26 (16) 85 (127)
Gov2 0 (0) 4 (5) 4 (1) 9 (1) 6 (2) 23 (9)
Edu 1 (0) 6 (9) 16 (7) 5 (14) 10 (6) 38 (36)
Comm 1 (0) 0 (2) 2 (1) 2 (0) 4 (1) 9 (4)
Other 0 (0) 0 (1) 0 (0) 1 (0) 3 (1) 4 (2)
Total 2 (0) 17 (48) 51 (44) 40 (60) 49 (26) 159 (178)
Overall % 1.3 (0) 10.7 (27.0) 32.1 (24.7) 25.2 (33.7) 30.8 (14.8) 100
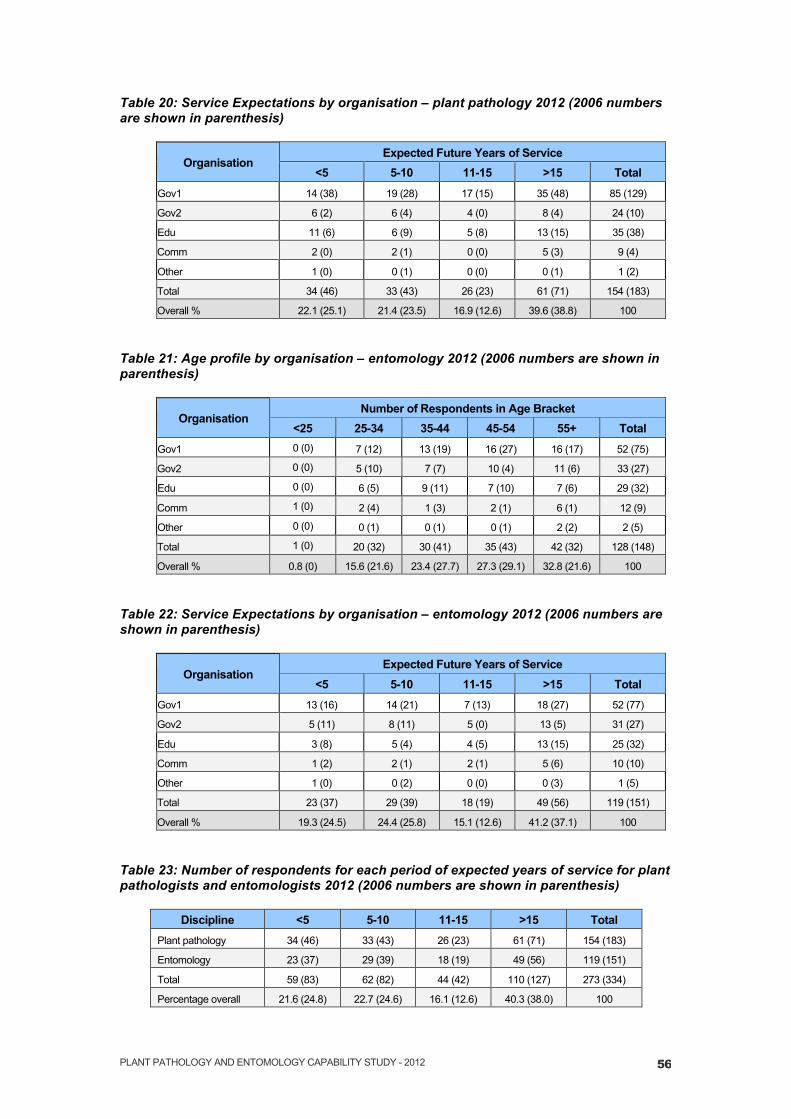
PLANT PATHOLOGY AND ENTOMOLOGY CAPABILITY STUDY - 2012 56
Table 20: Service Expectations by organisation – plant pathology 2012 (2006 numbers are shown in parenthesis)
Organisation Expected Future Years of Service
<5 5-10 11-15 >15 Total Gov1 14 (38) 19 (28) 17 (15) 35 (48) 85 (129)
Gov2 6 (2) 6 (4) 4 (0) 8 (4) 24 (10)
Edu 11 (6) 6 (9) 5 (8) 13 (15) 35 (38)
Comm 2 (0) 2 (1) 0 (0) 5 (3) 9 (4)
Other 1 (0) 0 (1) 0 (0) 0 (1) 1 (2)
Total 34 (46) 33 (43) 26 (23) 61 (71) 154 (183)
Overall % 22.1 (25.1) 21.4 (23.5) 16.9 (12.6) 39.6 (38.8) 100
Table 21: Age profile by organisation – entomology 2012 (2006 numbers are shown in parenthesis)
Organisation Number of Respondents in Age Bracket
<25 25-34 35-44 45-54 55+ Total Gov1 0 (0) 7 (12) 13 (19) 16 (27) 16 (17) 52 (75)
Gov2 0 (0) 5 (10) 7 (7) 10 (4) 11 (6) 33 (27)
Edu 0 (0) 6 (5) 9 (11) 7 (10) 7 (6) 29 (32)
Comm 1 (0) 2 (4) 1 (3) 2 (1) 6 (1) 12 (9)
Other 0 (0) 0 (1) 0 (1) 0 (1) 2 (2) 2 (5)
Total 1 (0) 20 (32) 30 (41) 35 (43) 42 (32) 128 (148)
Overall % 0.8 (0) 15.6 (21.6) 23.4 (27.7) 27.3 (29.1) 32.8 (21.6) 100
Table 22: Service Expectations by organisation – entomology 2012 (2006 numbers are shown in parenthesis)
Organisation Expected Future Years of Service
<5 5-10 11-15 >15 Total Gov1 13 (16) 14 (21) 7 (13) 18 (27) 52 (77)
Gov2 5 (11) 8 (11) 5 (0) 13 (5) 31 (27)
Edu 3 (8) 5 (4) 4 (5) 13 (15) 25 (32)
Comm 1 (2) 2 (1) 2 (1) 5 (6) 10 (10)
Other 1 (0) 0 (2) 0 (0) 0 (3) 1 (5)
Total 23 (37) 29 (39) 18 (19) 49 (56) 119 (151)
Overall % 19.3 (24.5) 24.4 (25.8) 15.1 (12.6) 41.2 (37.1) 100
Table 23: Number of respondents for each period of expected years of service for plant pathologists and entomologists 2012 (2006 numbers are shown in parenthesis)
Discipline <5 5-10 11-15 >15 Total Plant pathology 34 (46) 33 (43) 26 (23) 61 (71) 154 (183)
Entomology 23 (37) 29 (39) 18 (19) 49 (56) 119 (151)
Total 59 (83) 62 (82) 44 (42) 110 (127) 273 (334)
Percentage overall 21.6 (24.8) 22.7 (24.6) 16.1 (12.6) 40.3 (38.0) 100

PLANT PATHOLOGY AND ENTOMOLOGY CAPABILITY STUDY - 2012 57
Likely Reasons to Leave Plant Pathology or Entomology
Table 24: Relationship between service expectations and likely reasons to leave plant pathology or entomology 2012 (2006 numbers are shown in parenthesis)
Reason to Leave Expected future years of service
Total % <5 5-10 11-15
Retirement 31 (24) 46 (55) 37 (34) 114 (113) 70 (55)
Career development (new field of activity) 8 (18) 5 (5) 2 (4) 15 (27) 9 (13)
Career development (overseas study or overseas opportunity) 9 (6) 3 (7) 1 (0) 13 (13) 8 (6)
Limited tenure/funding constraints 10 (29) 4 (11) 3 (2) 17 (42) 10 (20)
Other 1 (6) 4 (4) 0 (2) 5 (12) 3 (6)
Total 59 (83) 62 (82) 43 (42) 164 (207) 100
Overall % 36 38 26 100
Sub-Discipline Capability
Table 25: Explanation of terms sub-discipline, capacity and primary environment as used in the survey
Primary Discipline Sub-discipline Areas Capacities Primary Environment
Plant Pathology
Mycology Virology Bacteriology Nematology Molecular plant pathology Phytoplasmas No specific sub-discipline Other
Diagnostics – laboratory Diagnostics – field Risk assessment & quarantine Emergency response & management Genetics Physiology Epidemiology Taxonomy Disease management (resistance/breeding) Disease management (Inputs/practices) Administration Education and training
Education/Teaching Research – Basic Research – Strategic Research – Applied Extension Biosecurity Support services/advisory Regulatory/Policy Quarantine Commercial – Sales/Marketing Commercial – Technical/Advisory
Entomology
Taxonomy/Systematics Genetics Physiology Biochemistry Insect pathology Behaviour No specific sub-discipline Other
Diagnostics – laboratory Diagnostics – field Risk assessment & quarantine Emergency response & management Curation Pest control & management Environment and ecology Administration Education and training
Education/Teaching Research – Basic Research – Strategic Research – Applied Extension Biosecurity Support services/advisory Regulatory/Policy Quarantine Commercial – Sales/Marketing Commercial – Technical/Advisory
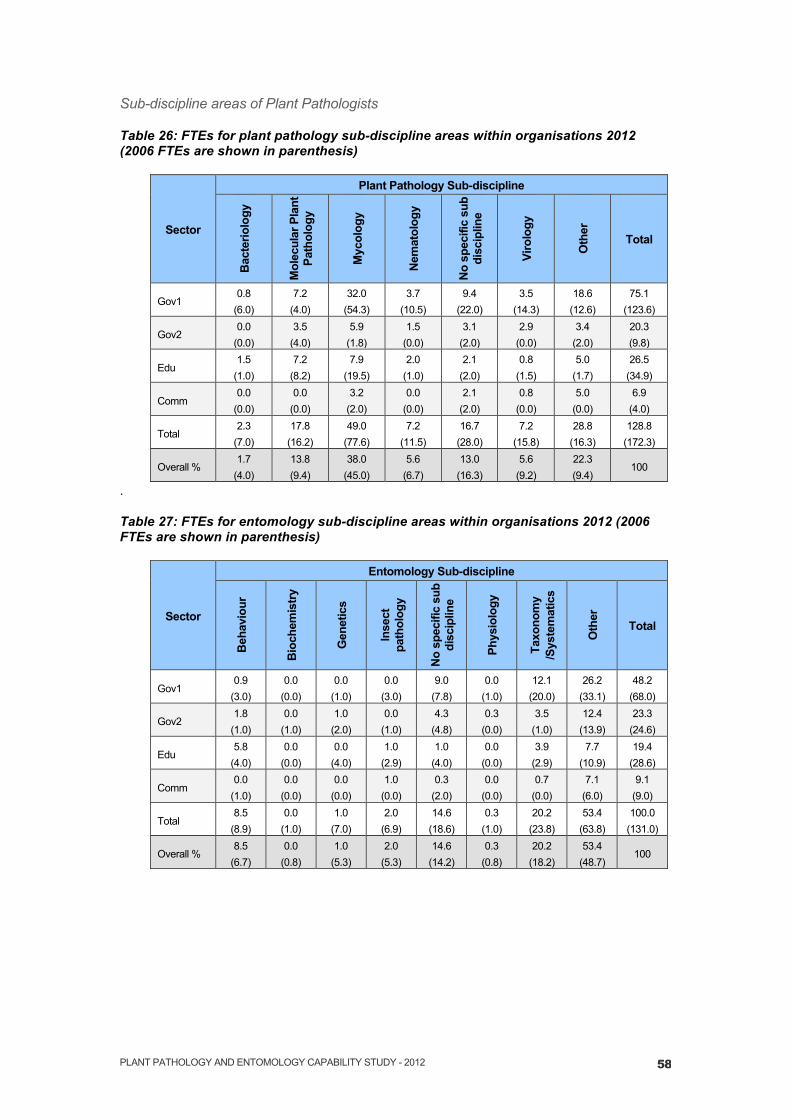
PLANT PATHOLOGY AND ENTOMOLOGY CAPABILITY STUDY - 2012 58
Sub-discipline areas of Plant Pathologists
Table 26: FTEs for plant pathology sub-discipline areas within organisations 2012 (2006 FTEs are shown in parenthesis)
Sector
Plant Pathology Sub-discipline
Bac
terio
logy
Mol
ecul
ar P
lant
Pa
thol
ogy
Myc
olog
y
Nem
atol
ogy
No
spec
ific
sub
disc
iplin
e
Viro
logy
Oth
er
Total
Gov1 0.8
(6.0) 7.2
(4.0) 32.0
(54.3) 3.7
(10.5) 9.4
(22.0) 3.5
(14.3) 18.6
(12.6) 75.1
(123.6)
Gov2 0.0
(0.0) 3.5
(4.0) 5.9
(1.8) 1.5
(0.0) 3.1
(2.0) 2.9
(0.0) 3.4
(2.0) 20.3 (9.8)
Edu 1.5
(1.0) 7.2
(8.2) 7.9
(19.5) 2.0
(1.0) 2.1
(2.0) 0.8
(1.5) 5.0
(1.7) 26.5
(34.9)
Comm 0.0
(0.0) 0.0
(0.0) 3.2
(2.0) 0.0
(0.0) 2.1
(2.0) 0.8
(0.0) 5.0
(0.0) 6.9
(4.0)
Total 2.3
(7.0) 17.8
(16.2) 49.0
(77.6) 7.2
(11.5) 16.7
(28.0) 7.2
(15.8) 28.8
(16.3) 128.8
(172.3)
Overall % 1.7
(4.0) 13.8 (9.4)
38.0 (45.0)
5.6 (6.7)
13.0 (16.3)
5.6 (9.2)
22.3 (9.4)
100
.
Table 27: FTEs for entomology sub-discipline areas within organisations 2012 (2006 FTEs are shown in parenthesis)
Sector
Entomology Sub-discipline
Beh
avio
ur
Bio
chem
istry
Gen
etic
s
Inse
ct
path
olog
y
No
spec
ific
sub
disc
iplin
e
Phys
iolo
gy
Taxo
nom
y /S
yste
mat
ics
Oth
er
Total
Gov1 0.9
(3.0) 0.0
(0.0) 0.0
(1.0) 0.0
(3.0) 9.0
(7.8) 0.0
(1.0) 12.1
(20.0) 26.2
(33.1) 48.2
(68.0)
Gov2 1.8
(1.0) 0.0
(1.0) 1.0
(2.0) 0.0
(1.0) 4.3
(4.8) 0.3
(0.0) 3.5
(1.0) 12.4
(13.9) 23.3
(24.6)
Edu 5.8
(4.0) 0.0
(0.0) 0.0
(4.0) 1.0
(2.9) 1.0
(4.0) 0.0
(0.0) 3.9
(2.9) 7.7
(10.9) 19.4
(28.6)
Comm 0.0
(1.0) 0.0
(0.0) 0.0
(0.0) 1.0
(0.0) 0.3
(2.0) 0.0
(0.0) 0.7
(0.0) 7.1
(6.0) 9.1
(9.0)
Total 8.5
(8.9) 0.0
(1.0) 1.0
(7.0) 2.0
(6.9) 14.6
(18.6) 0.3
(1.0) 20.2
(23.8) 53.4
(63.8) 100.0
(131.0)
Overall % 8.5
(6.7) 0.0
(0.8) 1.0
(5.3) 2.0
(5.3) 14.6
(14.2) 0.3
(0.8) 20.2
(18.2) 53.4
(48.7) 100

PLANT PATHOLOGY AND ENTOMOLOGY CAPABILITY STUDY - 2012 59
• Figure 19: Word cloud illustrating the range and emphasis of sub-discipline areas noted by entomologists that selected 'other' when identifying their sub-discipline 2012
Primary focus of Plant Pathologists and Entomologists
Table 28: Primary focus of plant pathology and entomology capacity expressed as FTEs and percentage FTEs for both the 2006 and 2012 surveys
Primary Focus 2006 2012
FTEs % FTEs % Agriculture Production 123.3 40.1 87.6 38.7
Agriculture Storage 9.0 2.9 4.2 1.9
Horticulture Production 91.5 29.7 67.8 30.0
Horticulture Post-harvest 8.3 2.7 11.5 5.1
Forestry Production 20.2 6.6 12.4 5.5
Forestry Wood Products 3.6 1.2 2.2 1.0
Forestry Urban 3.6 1.2 2.7 1.2
Nursery/Turf Ornamental 13.5 4.4 9.5 4.2
Heritage 34.9 11.3 26.7 11.8
Urban/commercial pest management - - 0.8 0.4
Medical/public health entomology
- - 0.2 0.1
Insecticide technology - - 0.6 0.3
Total 307.6 100 226.3 100

PLANT PATHOLOGY AND ENTOMOLOGY CAPABILITY STUDY - 2012 60
Issues of Concern to Plant Pathologists and Entomologists
Table 29: Level of concern expressed across a range of issues relating to employment 2012 (2006 percentage responses are shown in parenthesis)
Area for concern
Percentage of Responses Not Concerned
at all %
Concerned
%
Very Concerned
%
Extremely Concerned
% Employment opportunities in the field 11 (16) 24 (38) 30 (25) 35 (22)
Prospects for career progression 14 (16) 26 (37) 31 (26) 28 (20)
Opportunities for professional development within your organisation 26 (-) 31 (-) 27 (-) 16 (-)
Emphasis on provision of services in commercial context 26 (26) 38 (41) 27 (23) 9 (10)
A perceived shift from strategic to applied research 36 (-) 37 (-) 20 (-) 7 (-)
Tenure or funding constraints 9 (11) 19 (22) 28 (30) 45 (36)
Capacity of your organisation to respond to biosecurity incursions 25 (-) 34 (-) 26 (-) 15 (-)
Work pressure demands 13 (14) 35 (34) 32 (30) 20 (23)
Other 39 (35) 18 (13) 23 (17) 20 (35)
Issues Related to Organisational Structures and Resources
Table 30: Level of concern expressed across a range of issues relating to future requirements within each discipline 2012 (2006 percentage responses are shown in parenthesis)
Area for concern
Percentage of Responses Not Concerned
at all %
Concerned %
Very Concerned
%
Extremely Concerned
% General capacity to meet demands for services 9 (12) 36 (41) 37 (31) 18 (15)
Impact of emergency response requirements 14 (17) 35 (35) 34 (40) 16 (18)
Availability of key staff in critical activity areas 7 (8) 26 (29) 38 (37) 29 (26)
Access to graduates in specialty disciplines 12 (15) 33 (37) 33 (31) 21 (17)
Standard of graduate skills base
16 (18) 34 (40) 31 (26) 19 (16)
Movement of staff to overseas positions
37 (46) 36 (37) 22 (13) 6 (4)
Anticipated retirement of key personnel
11 (12) 30 (28) 28 (30) 30 (30)
Other
63 (52) 9 (11) 14 (18) 14 (20)
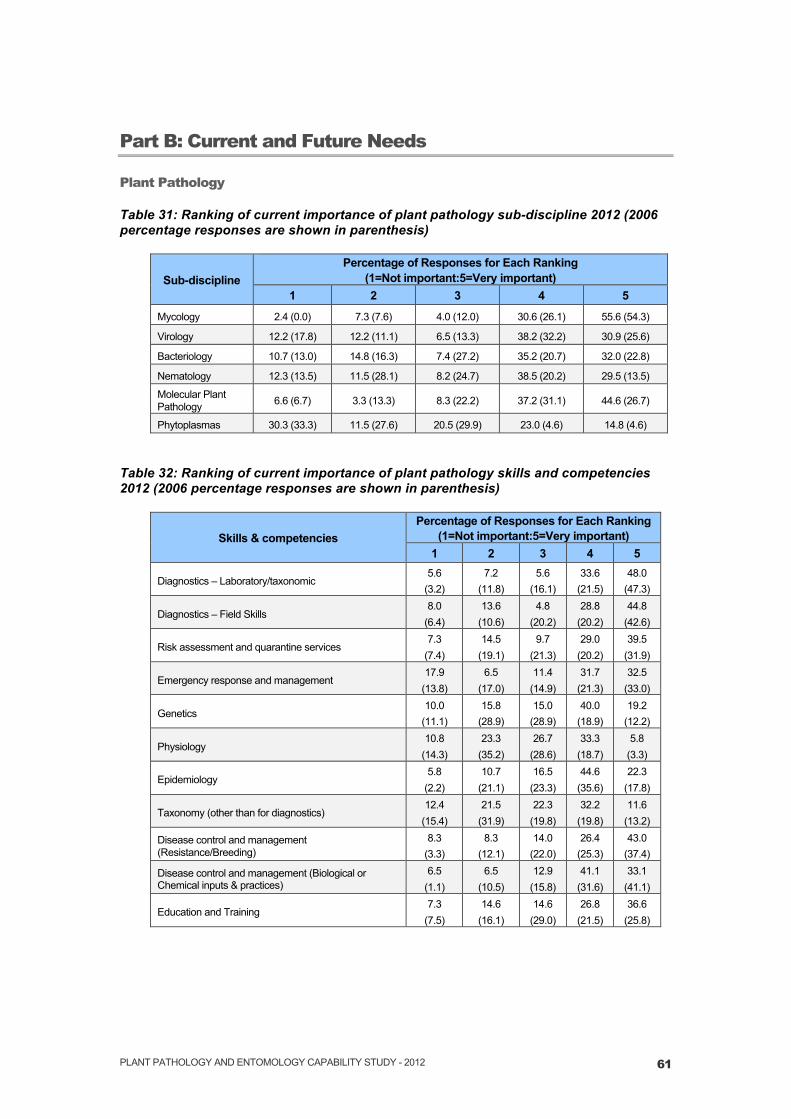
PLANT PATHOLOGY AND ENTOMOLOGY CAPABILITY STUDY - 2012 61
Part B: Current and Future Needs
Plant Pathology
Table 31: Ranking of current importance of plant pathology sub-discipline 2012 (2006 percentage responses are shown in parenthesis)
Sub-discipline Percentage of Responses for Each Ranking
(1=Not important:5=Very important) 1 2 3 4 5
Mycology 2.4 (0.0) 7.3 (7.6) 4.0 (12.0) 30.6 (26.1) 55.6 (54.3)
Virology 12.2 (17.8) 12.2 (11.1) 6.5 (13.3) 38.2 (32.2) 30.9 (25.6)
Bacteriology 10.7 (13.0) 14.8 (16.3) 7.4 (27.2) 35.2 (20.7) 32.0 (22.8)
Nematology 12.3 (13.5) 11.5 (28.1) 8.2 (24.7) 38.5 (20.2) 29.5 (13.5)
Molecular Plant Pathology 6.6 (6.7) 3.3 (13.3) 8.3 (22.2) 37.2 (31.1) 44.6 (26.7)
Phytoplasmas 30.3 (33.3) 11.5 (27.6) 20.5 (29.9) 23.0 (4.6) 14.8 (4.6)
Table 32: Ranking of current importance of plant pathology skills and competencies 2012 (2006 percentage responses are shown in parenthesis)
Skills & competencies Percentage of Responses for Each Ranking
(1=Not important:5=Very important) 1 2 3 4 5
Diagnostics – Laboratory/taxonomic 5.6
(3.2) 7.2
(11.8) 5.6
(16.1) 33.6
(21.5) 48.0
(47.3)
Diagnostics – Field Skills 8.0
(6.4) 13.6
(10.6) 4.8
(20.2) 28.8
(20.2) 44.8
(42.6)
Risk assessment and quarantine services 7.3
(7.4) 14.5
(19.1) 9.7
(21.3) 29.0
(20.2) 39.5
(31.9)
Emergency response and management 17.9
(13.8) 6.5
(17.0) 11.4
(14.9) 31.7
(21.3) 32.5
(33.0)
Genetics 10.0
(11.1) 15.8
(28.9) 15.0
(28.9) 40.0
(18.9) 19.2
(12.2)
Physiology 10.8
(14.3) 23.3
(35.2) 26.7
(28.6) 33.3
(18.7) 5.8
(3.3)
Epidemiology 5.8
(2.2) 10.7
(21.1) 16.5
(23.3) 44.6
(35.6) 22.3
(17.8)
Taxonomy (other than for diagnostics) 12.4
(15.4) 21.5
(31.9) 22.3
(19.8) 32.2
(19.8) 11.6
(13.2)
Disease control and management (Resistance/Breeding)
8.3 (3.3)
8.3 (12.1)
14.0 (22.0)
26.4 (25.3)
43.0 (37.4)
Disease control and management (Biological or Chemical inputs & practices)
6.5 (1.1)
6.5 (10.5)
12.9 (15.8)
41.1 (31.6)
33.1 (41.1)
Education and Training 7.3
(7.5) 14.6
(16.1) 14.6
(29.0) 26.8
(21.5) 36.6
(25.8)

PLANT PATHOLOGY AND ENTOMOLOGY CAPABILITY STUDY - 2012 62
Table 33: Ranking of future importance of plant pathology skills and competencies 2012 (2006 percentage responses are shown in parenthesis)
Skills & competencies Percentage of Responses for Each Ranking
(1=Not important:5=Very important) 1 2 3 4 5
Diagnostics – Laboratory/taxonomic 4.0
(3.2) 10.4
(10.5) 4.0
(11.6) 25.6
(28.4) 56.0
(46.3)
Diagnostics – Field Skills 6.5
(3.2) 8/9
(11.6) 5.6
(15.8) 29.8
(28.4) 49.2
(41.1)
Risk assessment and quarantine services 8.2
(2.1) 7.4
(15.8) 7.4
(12.6) 34.4
(29.5) 42.6
(40.0)
Emergency response and management 11.3 (3.2)
10.5 (13.8)
10.5 (19.1)
29.8 (25.5)
37.9 (38.3)
Genetics 8.3
(8.6) 15.0
(17.2) 20.0
(30.1) 35.0
(29.0) 21.7
(15.1)
Physiology 7.4
(11.8) 24.0
(26.9) 22.3
(30.1) 36.4
(21.5) 9.9
(9.7)
Epidemiology 5.0
(4.3) 12.4 (9.7)
14.0 (25.8)
37.2 (35.5)
31.4 (24.7)
Taxonomy (other than for diagnostics) 13.0 (8.5)
15.4 (28.7)
27.6 (24.5)
26.8 (18.1)
17.1 (20.2)
Disease control and management (Resistance/Breeding)
4.1 (3.2)
10.7 (11.7)
11.6 (18.1)
33.1 (28.7)
40.5 (38.3)
Disease control and management (Biological or Chemical inputs & practices)
4.0 (2.1)
7.3 (2.1)
12.1 (19.1)
36.3 (28.7)
40.3 (47.9)
Education and Training 4.0
(3.3) 11.3 (8.7)
10.5 (27.2)
31.5 (27.2)
42.7 (33.7)
Entomology
Table 34: Ranking of current importance of entomology sub-disciplines 2012 (2006 percentage responses are shown in parenthesis)
Sub-discipline Percentage of Responses for Each Ranking
(1=Not important:5=Very important) 1 2 3 4 5
Taxonomy/Systematics 3.0 (7.8) 9.0 (14.4) 13.0 (16.7) 35.0 (22.2) 40.0 (38.9)
Genetics 8.4 (23.0) 22.1 (27.6) 17.9 (16.1) 36.8 (14.9) 14.7 (18.4)
Physiology 17.2 (21.1) 23.7 (30.0) 26.9 (25.6) 30.1 (17.8) 2.2 (5.6)
Biochemistry 16.0 (25.0) 21.3 (34.1) 23.4 (18.2) 31.9 (10.2) 7.4 (12.5)
Insect Pathology 16.5 (14.4) 18.6 (20.0) 18.6 (23.3) 34.0 (22.2) 12.4 (20.0)
Behaviour 3.1 (4.4) 13.4 (16.5) 14.4 (22.0) 46.4 (31.9) 22.7 (25.3)

PLANT PATHOLOGY AND ENTOMOLOGY CAPABILITY STUDY - 2012 63
Table 35: Ranking of current importance of entomology skills and competencies 2012 (2006 percentage responses are shown in parenthesis)
Skills & competencies Percentage of Responses for Each Ranking
(1=Not important:5=Very important) 1 2 3 4 5
Diagnostics – Laboratory/taxonomic 2.0
(3.4) 16.2
(19.1) 5.1
(12.4) 40.4
(23.6) 36.4
(41.6)
Diagnostics – Field Skills 4.1
(4.4) 15.3
(11.1) 8.2
(13.3) 37.8
(24.4) 34.7
(46.7)
Risk assessment and quarantine 9.2
(10.0) 9.2
(10.0) 8.2
(20.0) 35.7
(24.4) 37.8
(35.6)
Emergency response and management 14.6 (9.0)
10.4 (14.6)
8.3 (22.5)
34.5 (25.8)
31.2 (28.1)
Curation 18.4
(14.8) 16.3
(26.1) 21.4
(26.1) 30.6
(17.0) 13.3
(15.9)
Pest control and management 6.2
(1.1) 7.2
(4.4) 9.3
(13.3) 33.0
(22.2) 44.3
(58.9)
Environment and Ecology 5.2
(1.1) 14.6
(13.5) 15.6
(23.6) 38.5
(24.7) 26.0
(37.1)
Education and Training 8.0
(9.3) 12.0
(18.6) 21.0
(17.4) 31.0
(26.7) 28.0
(27.9)
Table 36: Ranking of future importance of entomology skills and competencies 2012 (2006 percentage responses are shown in parenthesis)
Skills & competencies Percentage of Responses for Each Ranking
(1=Not important:5=Very important) 1 2 3 4 5
Diagnostics – Laboratory/taxonomic 0.0
(1.1) 10.3
(12.1) 6.2
(16.5) 37.1
(23.1) 46.4
(47.3)
Diagnostics – Field Skills 2.1
(2.2) 8.3
(5.5) 6.2
(14.3) 42.7
(31.9) 40.6
(46.2)
Risk assessment and quarantine 5.2
(5.6) 6.2
(14.4) 7.3
(14.4) 31.2
(23.3) 50.0
(42.2)
Emergency response and management 9.5
(5.6) 11.6
(18.9) 9.5
(14.4) 20.0
(27.8) 49.5
(33.3)
Curation 10.3
(14.6) 15.5
(22.5) 24.7
(25.8) 33.0
(25.8) 16.5
(11.2)
Pest control and management 4.2
(1.1) 7.3
(4.4) 9.4
(11.0) 32.3
(22.2) 46.9
(61.5)
Environment and Ecology 2.2
(1.1) 10.8 (4.4)
6.5 (15.6)
50.5 (27.8)
30.1 (51.1))
Education and Training 3.1
(5.6) 11.2 (5.6)
12.2 (21.3)
35.7 (25.8)
37.8 (41.6)

PLANT PATHOLOGY AND ENTOMOLOGY CAPABILITY STUDY - 2012 64
Training Issues
Table 37: Overall ranking of importance of attributes in future staff appointments 2012 (2006 percentage responses are shown in parenthesis)
Attributes Percentage of Responses for Each Ranking
(1=Not important:5=Very important) 1 2 3 4 5
Training or teaching skills 12.2 (7.1)
10.6 (19.9)
19.7 (31.4)
37.8 (25.6)
19.7 (16.0)
Laboratory skills 1.1
(4.5) 4.3
(10.3) 10.6
(16.0) 38.3
(34.0) 45.7
(35.3)
Field based skills 1.6
(3.8) 10.6 (5.7)
9.0 (13.8)
35.1 (38.4)
43.6 (38.4)
Communication skills 1.1
(0.0) 2.6
(0.6) 5.8
(13.9) 43.7
(38.0) 46.8
(47.5)
Research skills (Basic, Strategic or Applied) 0.5
(0.6) 4.2
(4.4) 3.2
(9.4) 37.4
(19.5) 54.7
(66.0)
Commercial or advisory skills 4.8
(3.8) 14.9
(18.5) 25.5
(28.7) 36.2
(34.4) 18.6
(14.6)
• Figure 20: Ranking of training priorities 2012
0 0.5 1 1.5 2 2.5 3
Practical & Xield skills
Professional development
Post-‐grad specialisation
Undergraduate specialisation
Internal training
Availability of post-‐grad programs
Generalised undergraduate programs
Flexibility in delivery formats
2012
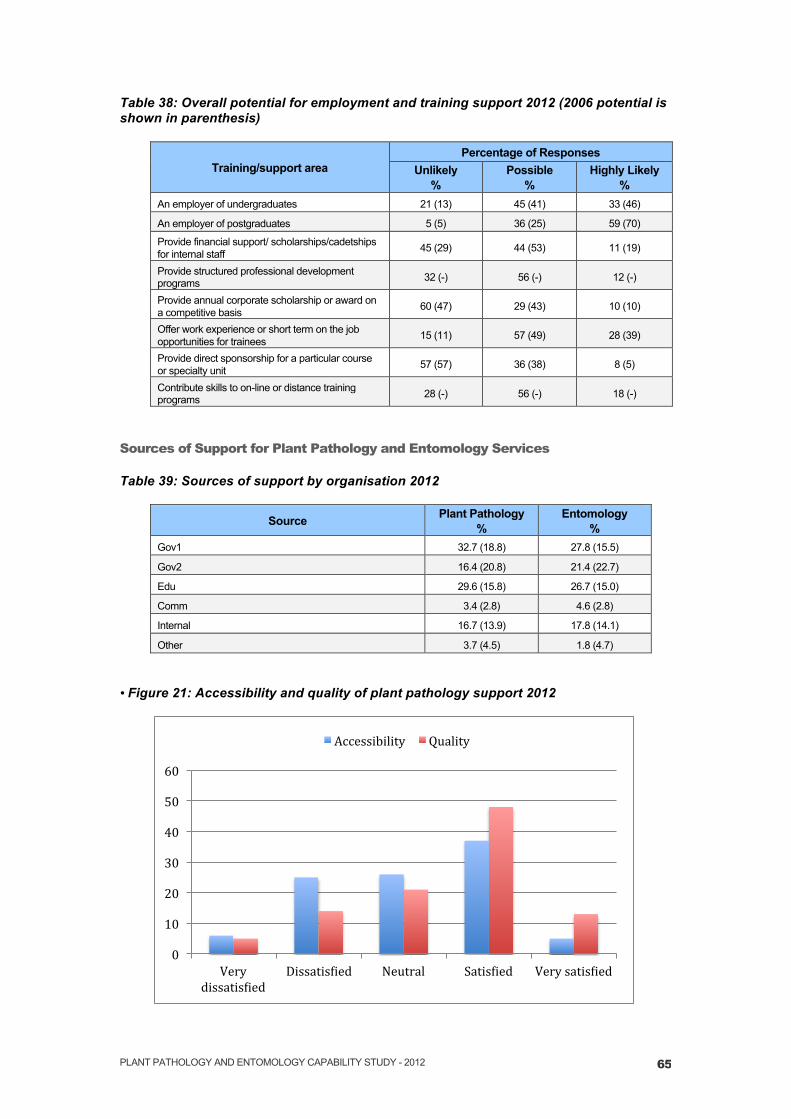
PLANT PATHOLOGY AND ENTOMOLOGY CAPABILITY STUDY - 2012 65
Table 38: Overall potential for employment and training support 2012 (2006 potential is shown in parenthesis)
Training/support area Percentage of Responses
Unlikely %
Possible %
Highly Likely %
An employer of undergraduates 21 (13) 45 (41) 33 (46)
An employer of postgraduates 5 (5) 36 (25) 59 (70)
Provide financial support/ scholarships/cadetships for internal staff 45 (29) 44 (53) 11 (19)
Provide structured professional development programs 32 (-) 56 (-) 12 (-)
Provide annual corporate scholarship or award on a competitive basis 60 (47) 29 (43) 10 (10)
Offer work experience or short term on the job opportunities for trainees 15 (11) 57 (49) 28 (39)
Provide direct sponsorship for a particular course or specialty unit 57 (57) 36 (38) 8 (5)
Contribute skills to on-line or distance training programs 28 (-) 56 (-) 18 (-)
Sources of Support for Plant Pathology and Entomology Services
Table 39: Sources of support by organisation 2012
Source Plant Pathology %
Entomology %
Gov1 32.7 (18.8) 27.8 (15.5)
Gov2 16.4 (20.8) 21.4 (22.7)
Edu 29.6 (15.8) 26.7 (15.0)
Comm 3.4 (2.8) 4.6 (2.8)
Internal 16.7 (13.9) 17.8 (14.1)
Other 3.7 (4.5) 1.8 (4.7)
• Figure 21: Accessibility and quality of plant pathology support 2012
0
10
20
30
40
50
60
Very dissatisXied
DissatisXied Neutral SatisXied Very satisXied
Accessibility Quality

PLANT PATHOLOGY AND ENTOMOLOGY CAPABILITY STUDY - 2012 66
• Figure 22: Accessibility and quality of entomology support 2012
0 5 10 15 20 25 30 35 40 45
Very dissatisXied
DissatisXied Neutral SatisXied Very satisXied
Accessibility Quality