Embed Size (px)
Citation preview
S o c i a l P e r f o r m a n c e M a n a g e m e n t H U B
How-to guide - Standard 1B Planning Stage 1: Indicator Mapping
P lann ing S tage
Transitioning from Standard 1A to 1B
2
From Standard 1A you should have:
Defined your social goals and identified indicators. These provide the basis for data collection and reporting that will enable effective decision making.
In Standard 1B: Planning Stage 1 you will:
Map your information needs or indicators and outline the various activities that will be involved. This is a necessary step before you start collecting data. In this first stage you will identify your information needs and map each Indicator’s data cycle.
Planning Stage
Indicator Mapping
3
Through the process for mapping indicators, we aim to answer the following:
1. What resource requirements and constraints do we have for data collection?• Data collection requires considerable resources: time, training
and sometimes upgrades to data software (data storage systems, MIS). Where there are resourcing constraints it is important to be aware of them, and begin with collecting data for a small number of indicators. Additions can be made gradually.
2. Does data already exist? • Your MFI may already be collecting lots of data from multiple
sources that can be useful to track performance against social goals.
Planning Stage
Indicator Mapping
4
3. When do we need data and what for?• Internal processes and the demands of external stakeholders will
determine when information is required, which might influence how and when data is collected.
4. Can I take a sample of the population?• For some areas of data collection we might not need to collect data
for all clients, but can take a sample of the population. We need to ensure that this sample is representative.
5. What impact does this have on clients?• Data collection requires the time of clients. In order to minimise the
cost to clients, where possible additional data collection should be integrated into existing processes and points of contact with clients. Examples include loan application forms, business/loan utilisation checks, routine collection meetings.
I nd i ca tor Mapp ing
Checklist of steps
5
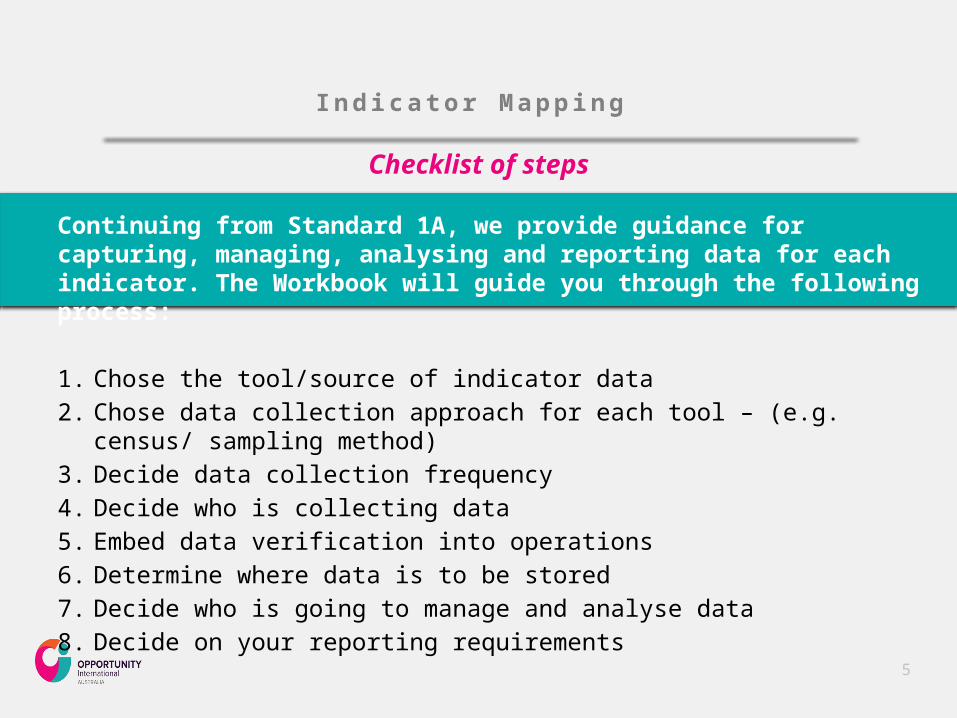
Continuing from Standard 1A, we provide guidance for capturing, managing, analysing and reporting data for each indicator. The Workbook will guide you through the following process:
1. Chose the tool/source of indicator data2. Chose data collection approach for each tool – (e.g. census/
sampling method)3. Decide data collection frequency 4. Decide who is collecting data5. Embed data verification into operations 6. Determine where data is to be stored7. Decide who is going to manage and analyse data8. Decide on your reporting requirements
P lann ing S tage
Indicator mapping
6
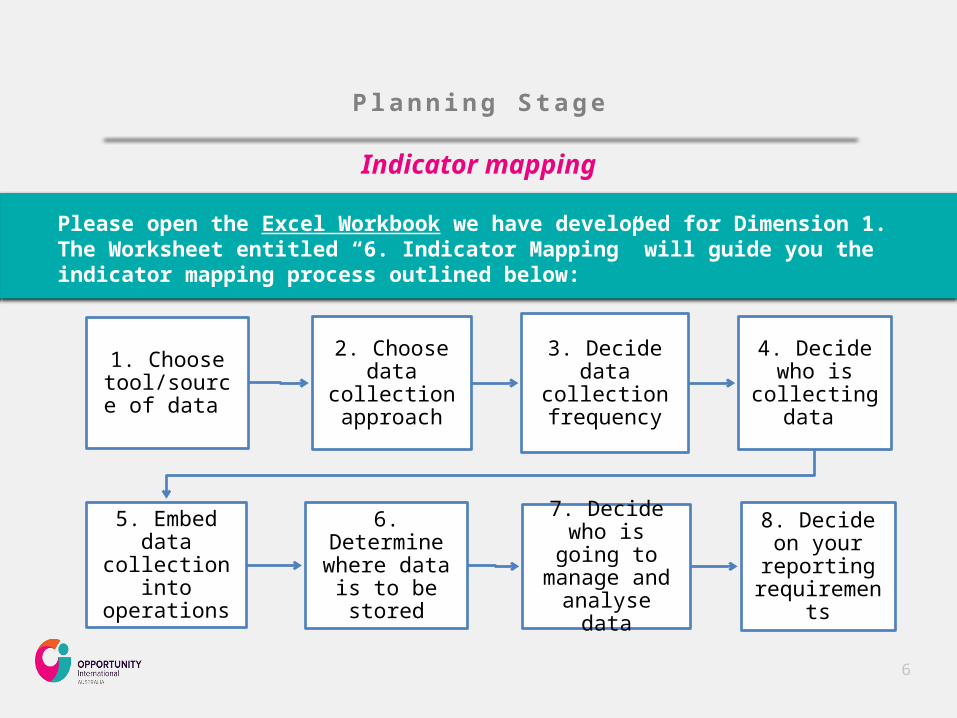
Please open the Excel Workbook we have developed for Dimension 1. The Worksheet entitled “6. Indicator Mapping” will guide you the indicator mapping process outlined below:
1. Choose tool/source
of data
2. Choose data
collection approach
3. Decide data
collection frequency
4. Decide who is
collecting data
5. Embed data
collection into
operations
6. Determine where data
is to be stored
7. Decide who is going to manage
and analyse data
8. Decide on your
reporting requiremen
ts
I nd i ca tor Mapp ing
Step 1: Choose the source (touch points) for data collection
7
When choosing indicators, identify the source of the data if it exists already, or decide which tool the indicator will be included in. This will ensure that the data will actually be able to be collected. The following considerations should be made:
How will the data collection be integrated into current operations and business processes? • Social data can be collected at a number of touch points, which is the point
at which data is collected. These include during loan application process, during business/loan utilisation checks, at loan disbursement for example.
Does the data already exist? • You may already be collecting data for particular indicators. Duplicating data
collection is costly and should be avoided.

Design ing your SPM System
Step 1: Choose the source (touch points) for data collection
8
Data can be collected formally or informally through a variety of touch points.
Formal data collection touch points include operational forms, special surveys and qualitative research. The table below shows examples of each:
InformalInformal data can be generated in informal meetings between staff or between field staff and clients. Informal data can be valuable in itself or used as background data or clarification for other types of information collection. It is often overlooked when not recorded in a systematic way, which can be detrimental to the value of information.
Operational forms Special surveys Qualitative research
• Client membership forms
• Loan application forms• Suggestion boxes
• Client exit survey• Client satisfaction
surveys• Transformational
surveys
• Case studies• Focus group
discussions
I nd i ca tor Mapp ing
Step 2: Choose data collection approach for each tool (census or sampling method)
9
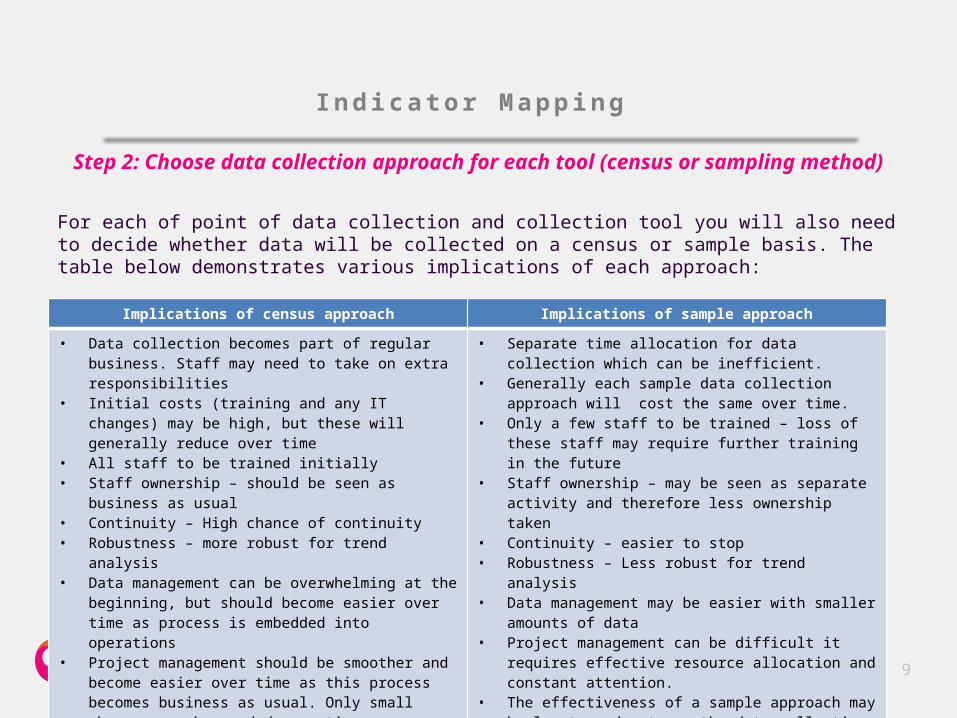
For each of point of data collection and collection tool you will also need to decide whether data will be collected on a census or sample basis. The table below demonstrates various implications of each approach:
Implications of census approach Implications of sample approach
• Data collection becomes part of regular business. Staff may need to take on extra responsibilities
• Initial costs (training and any IT changes) may be high, but these will generally reduce over time
• All staff to be trained initially• Staff ownership – should be seen as business as usual• Continuity – High chance of continuity • Robustness – more robust for trend analysis• Data management can be overwhelming at the
beginning, but should become easier over time as process is embedded into operations
• Project management should be smoother and become easier over time as this process becomes business as usual. Only small changes may be needed over time
• The effectiveness of a census approach is high as data collection and processes are business as usual
• Separate time allocation for data collection which can be inefficient.
• Generally each sample data collection approach will cost the same over time.
• Only a few staff to be trained – loss of these staff may require further training in the future
• Staff ownership – may be seen as separate activity and therefore less ownership taken
• Continuity – easier to stop• Robustness – Less robust for trend analysis• Data management may be easier with smaller amounts
of data• Project management can be difficult it requires effective
resource allocation and constant attention. • The effectiveness of a sample approach may be low to
moderate as the data collection is a separate activity
I nd i ca tor Mapp ing
Step 3: Decide data collection frequency
10
From Step 1 and Step 2 you should have identified the data collection source for each indicator and whether you will collect data on a census or sample basis. Next you need to decide how often you will collect data.
• Census data should generally be collected on an ongoing basis from all clients and this process embedded into operations.
• Sample data should be collected in line with data needs. For example, if you need to use information on a monthly or quarterly basis for detailed analysis of progress, it is likely that clients will need to be regularly surveyed and monitored. However, if an annual overview of a representative group of clients is sufficient, it may be more appropriate to conduct a survey once a year with a small sample of clients.
I nd i ca tor Mapp ing
Step 4: Decide on who is collecting data
11
• In general, field staff such as loan officers should regularly collect client level data, such that this process is embedded within operations as ‘business as usual’. This can reduce costs and increase internal learning, but surveys should be kept as short as possible so that it is manageable to have them integrated with everyday tasks.
• It is important to be aware that for some data there may be negative implications to having field staff collecting data from clients. Data may be unreliable if there is insufficient buy-in from field staff. This type of data may be collected by Head Office staff.
• If data is only needed occasionally, external assistance can be beneficial.
• Skills required: Good relationship building skills, communication skills, familiarity with clients
I nd i ca tor Mapp ing
Step 4: Decide on who is collecting data
12
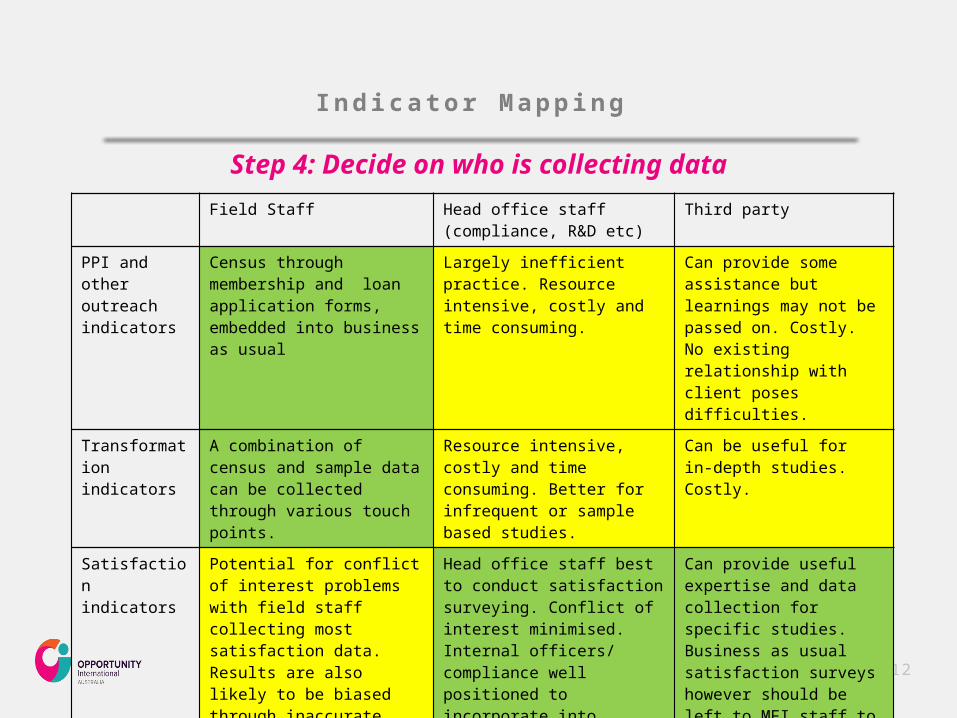
Field Staff Head office staff (compliance, R&D etc)
Third party
PPI and other outreach indicators
Census through membership and loan application forms, embedded into business as usual
Largely inefficient practice. Resource intensive, costly and time consuming.
Can provide some assistance but learnings may not be passed on. Costly. No existing relationship with client poses difficulties.
Transformation indicators
A combination of census and sample data can be collected through various touch points.
Resource intensive, costly and time consuming. Better for infrequent or sample based studies.
Can be useful for in-depth studies. Costly.
Satisfaction indicators
Potential for conflict of interest problems with field staff collecting most satisfaction data. Results are also likely to be biased through inaccurate responses. If field staff better to use branch managers or admin staff.
Head office staff best to conduct satisfaction surveying. Conflict of interest minimised. Internal officers/ compliance well positioned to incorporate into business as usual.
Can provide useful expertise and data collection for specific studies. Business as usual satisfaction surveys however should be left to MFI staff to increase efficiency.
Specialised data collection
May not have the skills or expertise to be able to carry out efficient and accurate data collection of this nature. Can be more costly.
Specialised departments/staff in research may have necessary skills to conduct research.
Can be more efficient and cost efficient to seek external assistance for infrequent and/or specialised data collection

I nd i ca tor Mapp ing
Step 5: Embed data verification into operations
13
Data verification can occur at a number of stages in the data collection process that include:• At point of data collection by data collection staff• Post data collection follow up verification by separate staff member• Verification before data entry into storage system by back office staff• Verification within system
Occurrence of data verification
Activities required
At the time of data collection by data collection staff
Verification process should be embedded into:• Survey forms• Data collection methodology
Staff need to be trained effectively to use survey forms and conduct data collection methodology effectively
Post data collection follow up
Staff members trained to verify data efficiently and effectively
Before data entry into system
Back office staff trained to verify data efficiently and effectively
Verification within system Adjustments to system to be made

I nd i ca tor Mapp ing
Step 6: Determine where data is to be stored
14
Where possible, social data should be stored in the core banking system alongside financial and operational data and this should be a high priority for all MFIs. Social data and financial/operational data can increase the value of each other by adding context and meaning, and enable you to make informed and targeted decisions that positively impact on your financial and social performance.
Social data storage location
Implications
MIS/Core banking system Data can be analysed easily and effectively. Value of social data increases alongside financial and operational data.
Partial data in MIS, rest in separate database
Data analysis is less efficient and more costly.
All data separate from MIS (e.g Excel)
Data can still be analysed to some extent but loses much of its value for effective decision making if not analysed with financial data
Data captured but not stored in system (e.g still on paper)
Data analysis is difficult or impossible and likely not used. The value of data is lost.
I nd i ca tor Mapp ing
Step 7: Decide who is going to manage and analyse data
15
It is important to ensure that staff have the appropriate skills necessary to manage and analyse data. This will generally be back office staff/SPM champion, rather than field staff.
Where there is a lot of data, or the data is complex, seeking external support may be necessary/more efficient.
Skills required:• Data entry staff: Basic computer skills, familiarity with spreadsheet
applications such as Excel• Analysis/reporting: Statistical knowledge/familiarity; good presentation skills;
strong writing skills; critical thinking skills; someone who understands current practices and organisational objectives, good MS Office skills, especially Excel.
I nd i ca tor Mapp ing
Step 8: Decide on reporting requirements
16
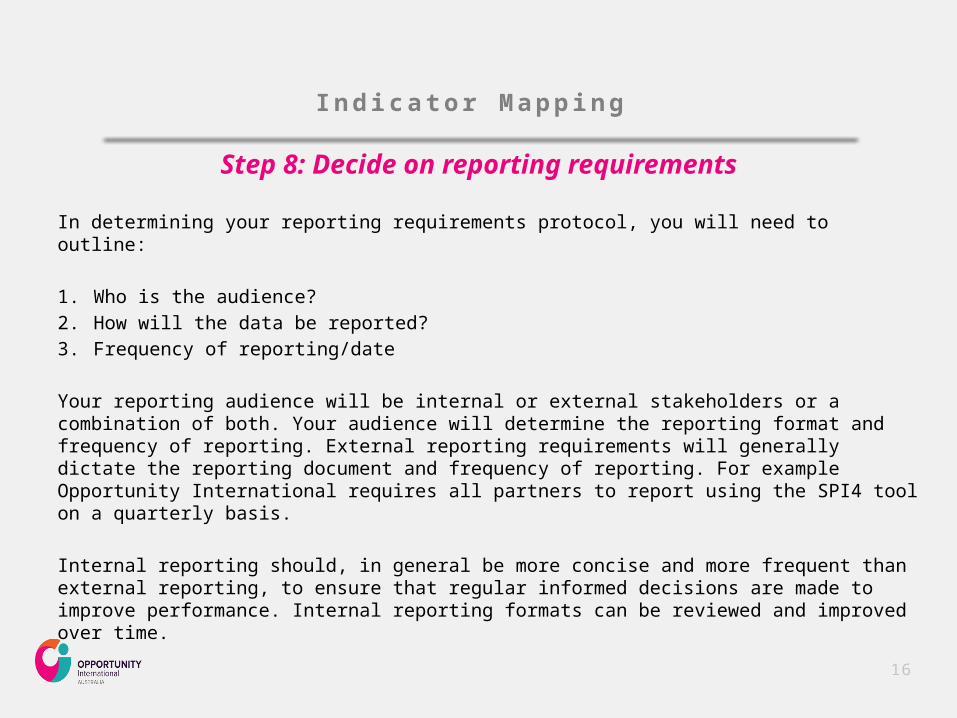
In determining your reporting requirements protocol, you will need to outline:
1. Who is the audience? 2. How will the data be reported?3. Frequency of reporting/date
Your reporting audience will be internal or external stakeholders or a combination of both. Your audience will determine the reporting format and frequency of reporting. External reporting requirements will generally dictate the reporting document and frequency of reporting. For example Opportunity International requires all partners to report using the SPI4 tool on a quarterly basis.
Internal reporting should, in general be more concise and more frequent than external reporting, to ensure that regular informed decisions are made to improve performance. Internal reporting formats can be reviewed and improved over time.
Step 8: Decide on reporting requirements
17
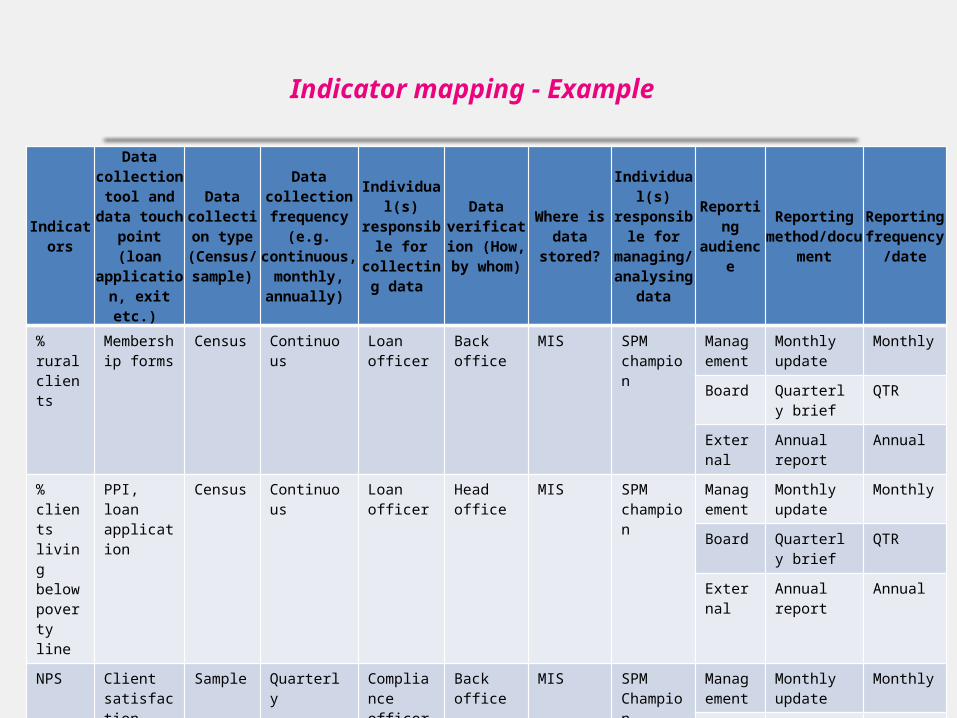
Indicators
Data collection tool and
data touch point (loan applicatio
n, exit etc.)
Data collection type
(Census/sample)
Data collection frequency
(e.g. continuous,
monthly, annually)
Individual(s)
responsible for
collecting data
Data verificatio
n (How, by whom)
Where is data
stored?
Individual(s)
responsible for
managing/
analysing data
Reporting
audience
Reporting method/doc
ument
Reporting frequenc
y/date
% rural clients
Membership forms
Census Continuous
Loan officer
Back office
MIS SPM champion
Management
Monthly update
Monthly
Board Quarterly brief
QTR
External
Annual report
Annual
% clients living below poverty line
PPI, loan application
Census Continuous
Loan officer
Head office
MIS SPM champion
Management
Monthly update
Monthly
Board Quarterly brief
QTR
External
Annual report
Annual
NPS Client satisfaction survey
Sample Quarterly Compliance officer
Back office
MIS SPM Champion
Management
Monthly update
Monthly
Board Quarterly brief
QTR
External
Annual report
Annual
Indicator mapping - Example
18
Conc lus ion In the next stage you will design your surveying tools, including:
• PPI and other outreach indicators
• Transformation surveys
• Client satisfaction surveys
• Exit interviews
Congratulations! You have completed the Planning Stage for your Social Performance Indicators.
After completing the Indicator Mapping section of the Workbook that accompanies this guide, you will have effectively planned the End-to-End process to collect, process, analyse, and ultimately use Social Performance data for each of your Social Performance Indicators.
Completing this workbook will be extremely helpful later as you embark on to the Implementation Stage!