Embed Size (px)
Citation preview

Planning for Sustainable Materials Management in North Central Texas
2015 - 2040
North Central Texas Regional Solid Waste Management Plan
North Central Texas Council of Governments October 2015

1
This document has been prepared by the North Central Texas Council of Governments Environment and Development Department on behalf of the Texas Commission on Environmental Quality, Contract 582-14-40586. The work that provided the basis for this publication was supported by funding under an award with the Texas Commission on Environmental Quality. The substance and findings of the work are dedicated to the public. The author and publisher are solely responsible for the accuracy of the statement and interpretations contained in this publication. Such interpretations do not necessarily reflect the view of the State or indicate endorsement or support of the findings and recommendations.

2
Table of Contents
Acknowledgements ..................................................................................................................................................................................... 3
What is NCTCOG? ........................................................................................................................................................................................ 6
Chapter 1: Overview of Materials Management in North Central Texas ......................................................................... 8
Chapter 2: North Central Texas Population and Growth Trends ...................................................................................... 12
Chapter 3. North Central Texas Economic Activity and Growth Trends ....................................................................... 20
Chapter 4. North Central Texas Waste Facilities Analysis and Trends .......................................................................... 26
Chapter 5. Advancing Materials Management in North Central Texas ......................................................................... 44
Chapter 6. Advancing Source Reduction and Recycling of Other Wastes .................................................................. 63
Chapter 7. Conclusion.............................................................................................................................................................................. 74
Chapter 8. North Central Texas Materials Management Implementation Plan ........................................................ 77
Chapter 9. Funding Materials Management Implementation Initiatives ....................................................................... 85
Appendix A. Regional Maps .................................................................................................................................................................. 88
Appendix B. 2014 MSW Annual Report for Landfills in North Central Texas Region .............................................. 99
Appendix C. Forecasted Population Change 1990-2040 for 12-County Metropolitan Planning Area ......... 102
Appendix D. Regional Studies and Waste Management Resources ........................................................................... 103
Appendix E. Glossary of Terms ......................................................................................................................................................... 106

3
Acknowledgements
NCTCOG Executive Board 2015 – 2016
President John Horn County Judge Hunt County Vice-President Lissa Smith Mayor Pro-Tem City of Plano Secretary-Treasurer Tom Lombard Councilmember North Richland Hills Past President Kathryn Wilemon Mayor Pro Tem City of Arlington Bruce Archer Councilmember City of Mesquite
J.D. Clark County Judge Wise County Michael Glaspie Councilmember City of Arlington Kelly Allen Gray Councilmember City of Fort Worth Clay Jenkins County Judge Dallas County Dan McClendon Mayor Pro Tem City of Burleson Bobbie Mitchell Commissioner Denton County
Keith Self County Judge Collin County Kevin Strength Mayor City of Waxahachie Chris Watts Mayor City of Denton Laura Wheat Mayor Town of Westlake B. Glen Whitley County Judge Tarrant County Lee Kleinman Councilmember City of Dallas Ex Officio, Nonvoting Member Representative Jeff Leach Member of the Texas Legislature

4
2015 – 2016 Resource Conservation Council
Chair Stephen Massey Community Services Director City of Allen
Vice-Chair Cecile Carson Senior Director, Affiliate Development Keep America Beautiful
David Alexander Hunt County Asst. EMC Hunt County Lorrie Anderle Recycling Coordinator City of Arlington Lonnie Banks Managing Director, Environmental Waste Services City of Garland Robert Berndt Environmental Specialist Tarrant County
Greta Calvery Area Public Affairs Manager Waste Management Elizabeth Combs Public Relations and Recycling Coordinator Progressive Waste Solutions
Grace Darling Board Member Arlington Conservation Council Chad Davis Wise County Engineer Wise County Shane Davis Environmental Services and Solid Waste Manager City of Farmers Branch Reid Donaldson Senior Area Municipal Services Republic Waste Valerie Familo Senior Contract Compliance Specialist City of Fort Worth Kathy Fonville Water Conservation and Recycling Coordinator City of Mesquite Michelle Hahn Operations/Energy Manager Plano ISD Brenda Haney Solid Waste Services Director City of Irving Bob Hart City Manager/Director of Economic Development Corporation City of Kennedale
Kelly High Director, Sanitation Services City of Dallas Lora Hinchcliff Municipal Solutions Manager Living Earth Anthony Jenkins Assistant Director of Environmental Health Dallas County Jeff Jones Assistant City Manager City of Hurst A. Vance Kemler Director of Solid Waste City of Denton Kevin Mattingly Director Public Works Town of Little Elm Jeff Mayfield Assistant Deputy Director North Texas Municipal Water District Dennis McCreary Assistant Superintendent for Facilities, Planning & Construction Northwest ISD Robert Medigovich Waste Minimization/Recycling Consultant Community Waste Disposal, Inc.

5
Howard Redfearn Environmental Manager City of Mansfield Patricia Redfearn Solid Waste Manager City of Grand Prairie Cheri Reynolds Howard Regional Business Development Manager ECS Refining Robert Smouse Environmental Waste Services Manager City of Plano James Terry Senior Deputy Fire Marshal Denton County Emergency Services Zac Trahan Statewide Program Director Texas Campaign for the Environment Lisa Weaver Sustainability Manager City of Lewisville
Charles Whitaker Executive Director Environmental Co-op Nick Williams Director of Public Works City of Stephenville

6
What is NCTCOG?
The North Central Texas Council of Governments (NCTCOG) was created by state enabling legislation in 1966, comprising a service area that included the local governments in 10 counties. Through action of the Governor’s office, the service area has expanded to include the local governments in 16 counties. NCTCOG is a political subdivision of the state and a voluntary association of local governments with a membership of 235 political jurisdictions. It is not a government as it cannot levy taxes or enact laws.
Its primary purposes are to perform long-range, comprehensive plans for matters that transcend jurisdictional boundaries, promote the sound development of the 16-county region, and facilitate cooperation and coordination among its member governments. These responsibilities will continue to increase in importance as the region’s population is forecast to grow from 6.8 million people to 10.6 million by 2040.
An Executive Board serves as the policy body for NCTCOG and is composed of local elected officials. The Board approves and oversees the plans, projects, and programs that NCTCOG undertakes to serve its member governments. The Department of Environment and Development has many specific programs focused around safe and clean waters, reducing flooding, managing waste, supporting energy and water conservation, and supporting excellence in development. In addition, the department provides technical assistance to the local governments of North Central Texas in planning, coordinating, and implementing community development and environmental policies, programs, and projects. Each of these programs and projects has an advisory committee that guides development and implementation of programs and projects. These committees have local government members who are subject matter experts and often have seats for business interests and citizens of the region. This ensures that those who will administer or be affected by one of these programs or projects have a strong voice in how they are crafted. Local government and other stakeholders who volunteer their time on committees ensure that NCTCOG actively practices its Mission Statement, which reads as follows:
“We are an association of, for, and by local governments. We assist our members in planning for common needs, cooperating for mutual benefit, and recognizing regional opportunities for improving the quality of life in North Central Texas.“ For more information about NCTCOG, visit www.nctcog.org.

7
Chapter 1: Overview of Materials Management in North Central Texas

8
Chapter 1: Overview of Materials Management in North Central Texas
1.1 Legislative Basis for Solid Waste Planning in Texas The 1976 Resource Conservation and Recovery Act (RCRA) is the federal public law that provides the framework for the proper management of hazardous and nonhazardous solid waste. The goal of RCRA is to protect public health and the environment while preserving resources. In Texas, the Texas Solid Waste Disposal Act, Texas Health and Safety Code Chapter 361, outlines that “it is this state’s policy and the purpose of this chapter to safeguard the health, welfare, and physical property of the people and to protect the environment by controlling the management of solid waste, including accounting for hazardous waste that is generated.” In support of the state’s goal to protect people and property, regional councils of governments and regional planning agencies are required to develop regional solid waste management plans that conform to the state regulations codified in Texas Administrative Code, Title 30, Chapter §330, Subchapter O. The purpose of a regional solid waste management plan is to identify the overriding concerns, goals, objectives, and recommended actions for solid waste management over a long-range period for the entire planning area. The regional plan shall conform to the requirements of Texas Health and Safety Code §363.064, and be the result of a planning process related to proper management of solid waste in the planning area. The regional plan provides the overriding structure and commitment to comply with the requirements for regional planning. Additionally, a regional implementation plan identifies the concerns, goals, and objectives, and recommended actions to accomplish the stated solid waste management goals and objectives. The management of solid waste in Texas is overseen by the Texas Commission on Environmental Quality (TCEQ). TCEQ’s main role is to ensure the generation and management of municipal solid waste is conducted in a safe manner to protect human health and the environment. TCEQ accomplishes this through permitting and monitoring and administering programs to reduce waste. Previously, TCEQ had developed and adopted statewide solid waste management plans; however, in 2003, House Bill 7 repealed the requirements for the state to provide a statewide solid waste management plan. From this point forward, efforts and requirements to support solid waste management planning remained at the councils of governments and regional planning councils.
1.2 Regional Solid Waste Planning in North Central Texas The 12 county Metropolitan Planning Area (MPA), which includes urbanized areas as well as any adjacent territory forecasted to become urbanized in the next 20 years, in the North Central Texas region is anticipated to grow by 57% between 2015 and 2040, making managing and disposing of materials in a responsible manner, as well as reducing consumption and recovering value through recycling and repurposing, increasingly important.1 Materials management – or solid waste management – is important to plan for long-term to ensure a high quality of life is maintained for the residents of North Central Texas. Further, supporting shorter-term actions and programs of local governments, the private sector, and residents that consider alternative solutions and options to disposing waste in landfills is an important step in reaching long-term solid waste management goals.
The North Central Texas 16-county region has been actively engaged in regional solid waste planning and supporting local governments to encourage solid waste management programs and projects since the 1980s. As
1 NCTCOG, 2015

9
the designated regional planning agency for municipal solid waste in the North Central Texas region, NCTCOG is responsible for developing, maintaining, and updating a Regional Solid Waste Management Plan. The first Regional Solid Waste Management Plan for North Central Texas was published in 1990, with a subsequent amendment of that document in 2002. This document, Planning for Sustainable Materials Management in North Central Texas, updates the 2002 regional plan that was approved by the TCEQ Commissioners in 2007. The Planning for Sustainable Materials Management in North Central Texas plan (herein referred to as the Regional Plan) reflects the evolution of solid waste management in North Central Texas from 2002 to 2015; goals of the regional solid waste advisory committee; updated recommendations and actions needed to address solid waste priorities and emerging trends in materials management in North Central Texas. The title of this plan refers to “materials management” rather than “solid waste” to emphasize materials contain value after being discarded or serving its initial use. The recovery of these resources is a major focus of the Regional Plan as well as emphasizing the entire lifecycle associated with a material – from manufacturing to disposal. Additionally, the Regional Plan establishes metrics that can be used to assess impacts of programs and projects over the long-term. The Regional Plan has been updated and structured to reflect the Environmental Protection Agency’s (EPA) Waste Management Hierarchy, shown in Figure 1. This hierarchy complements the Regional Plan’s goals and objectives and emphasizes the importance of preferred waste management strategies.
Figure 1. EPA Non-Hazardous Waste Management Hierarchy (Source: EPA, 2015)
1.3 2015 Regional Plan Update Process
The 2015 Regional Plan update was developed through stakeholder engagement and public review processes. The Resource Conservation Council (RCC), which is the solid waste advisory committee for the North Central Texas region, oversaw the development of the updated regional plan. NCTCOG provided administrative support to develop the draft and finalize the Regional Plan. Throughout the year-long process to update the Regional Plan,

10
NCTCOG conducted a survey of local governments, independent school districts, and other stakeholders; conducted stakeholder interviews with key Federal and State entities; and collected and analyzed data. As a result, regional solid waste needs, challenges, and opportunities were identified which led to the development of a solid waste regional analysis and updated Implementation Plan. The draft Regional Plan was provided for public comment in July 2015 and three public meetings and open houses were held to collect additional input on the draft document. The draft plan was approved by the RCC and endorsed by the NCTCOG Executive Board in October 2015.
1.4 2015 Regional Plan Goals
The following statement was adopted as a guiding vision to address materials management in the region: The goal of the 2015 Planning for Sustainable Materials Management in North Central Texas is to reduce waste,
ensure materials are reused and recycled whenever possible, reduce illegal dumping, and safely handle remaining waste at permitted facilities. In support of this overarching vision statement and goal, the Regional Plan focuses on five goal areas to emphasize in solid waste management initiatives in North Central Texas. These five areas include:
• Support Materials Management Education and Training • Promote Creation and Expansion of Waste Management Programs • Measure Regional Waste Reduction Efforts • Support Innovative Technologies for Other Waste • Promote Collaborative and Public/Private Sector Partnerships
A series of objectives and action recommendations were identified that support each of these Regional Plan goal areas and are included in the Implementation Plan, on page 76.

11
Chapter 2: North Central Texas Population and Growth Trends

12
Chapter 2: North Central Texas Population and Growth Trends
The North Central Texas Council of Governments (NCTCOG) serves a 16-county region surrounding the major urban areas of Dallas and Fort Worth, as shown in Figure 2. Regional population and employment trends and forecasts determine where residents will live, work, and carry out activities in the future. Evaluating population trends is an important part of the solid waste management planning process, as future development and population shifts impact the waste generation and capacity needs in the North Central Texas region. Furthermore, population growth in areas that were once rural can lead to solid waste management challenges for the supporting cities and counties that could be countered with proper planning and proactive implementation measures.
2.1 North Central Texas Existing Population
The region continues to experience high levels of population growth and forecasts project this trend will continue through 2040. According to the North Texas Commission’s 2015 Profile of North Texas, North Texas grows by 1 person every 5 minutes. The continued growth in the North Central Texas region is important to agencies tasked with providing sufficient solid waste management services, alternatives, and adequate capacity for disposal of municipal solid waste. Several methods of growth analysis are used to establish existing, and forecasted growth trends in the North Central Texas region. NCTCOG is not the only agency that produces existing population estimates and forecasts for the region. The Census Bureau and Texas State Data Center also have estimate programs.
Figure 2. NCTCOG 16-County Service Area (North Central Texas Region)
.

13
According to the 2010 U.S Census, Texas is home to 5 of the 20 fastest-growing metropolitan areas in the country. The Dallas-Fort Worth MPA, shown in Figure 3, was one of the fastest growing areas in the United States during the 2000s. The MPA had the second largest increase in population after the Houston-Sugar Land-Baytown MSA. From 2000 to 2010, the 16-county NCTCOG region’s population increased by 23.2 percent, an addition of approximately 1.2 million residents (from 5,309,277 in 2000 to 6,539,950 in 2010). Since the 2010 U.S. Census, the North Central Texas region has added a total of about 400,000 new residents as shown in Table 1. As of January 1, 2015, NCTCOG estimates the regional population to be 6,939,250.
Figure 3. North Central Texas 12-County Metropolitan Planning Area (Source: U.S Census and NCTCOG, 2015)
Figure 4 is a graph of the regional population change from 2001 to 2014. In 2014, the North Central Texas 16-county region added 96,910 residents, up from a low period in 2010 where 62,623 residents were added. This graph indicates that the region’s growth is beginning to bounce back from the recession and the rate of growth is beginning to increase. Although the number of residents moving to the region is increasing, the peak of population growth was in 2004 when over 200,000 residents were added to the North Central Texas region.

14
Table 1. Population Change for the 16-County North Central Texas Region (Source: US Census Bureau, NCTCOG Population Estimates, 2015)
Analysis of growth is important to understand growth patterns and where residents are choosing to live. Figure 5 demonstrates estimated population broken down by counties in the North Central Texas region. The counties with the greatest total population in 2015 are Tarrant and Dallas as shown in Figure 5. These two counties are home to some of the fastest growing cities in the region . Figure 6 displays the top 11 cities in the North Central Texas region that contributed to just over half of the entire regional population growth in 2014.
Figure 4. Annual Absolute Population Growth from 2001 – 2014 in the 16-County Region (Source: NCTCOG, 2015)
146,
150
148,
400
157,
450
207,
400
196,
350
136,
700
136,
900
94,8
80
90,1
70
62,6
23
68,8
40
81,6
60
89,2
60
96,9
10
2001
2002
2003
2004
2005
2006
2007
2008
2009
2010
2011
2012
2013
2014
POPU
LATI
ON
GRO
WTH
2000 U.S. Census, April 1
2010 U.S. Census, April 1
2014 NCTCOG Estimate, January 1
2015 NCTCOG Estimate, January 1
5,309,277 6,539,950 6,842,340 6,939,250

15
Figure 5. 2015 Estimated Population by North Central Texas County (Source: NCTCOG, 2015)
2.2 North Central Texas Forecasted Population Growth
State and local entities in North Central Texas rely on population forecasts to aid in their planning for a number of services such as water and waste management. NCTCOG forecasts MPA growth to provide information for planning transportation and other infrastructure program’s needs. NCTCOG’s 2040 population forecast is the most recent forecast available for what is referred to as the 12-county MPA. Combined with the Texas Water Development Board forecast for the remaining four counties of Erath, Navarro, Palo Pinto, and Somervell, Figure 7 provides NCTCOG’s 2040 population forecast for the 12-county MPA. Figure 8 displays the 2040 forecast totals for each county in the NCTCOG 12-county MPA and shows the growth trends since 1990 for these counties. As shown in Figure 8, the four core counties of Collin, Dallas, Denton, and Tarrant will continue to constitute the majority of population growth and urbanized area in the year 2040. However, population concentrations are shifting between these counties. For example, in 1990, Dallas County’s population was 45% of the overall 12-county population; it is forecasted to only make up 30% in 2040. Collin County, however, will make up 14% of the 12-county population in 2040 as opposed to 6% of the population in 1990.

16
Figure 6. The 11 Fastest Growing Cities in North Central Texas (Source: NCTCOG, 2015)
2.3 Summary
The North Central Texas region has shown sustained growth over previous decades and is projected to continue to grow over the next 25 years. Understanding current and future growth patterns and trends is vital for regional waste providers, servicers, and local governments for proper planning to ensure that future waste management needs will be met for current and future residents. Additionally, areas in North Central Texas are anticipating tremendous growth to provide opportunities to focus materials management efforts, enhance existing programs, and develop new programs to increase the most preferred waste management initiatives such as source reduction, recycling, and composting. Growing cities and counties provide opportunities to proactively implement pilot projects, enhance education, and expand programs to address waste management service needs, save money, and reduce needed landfill capacity.

17
Figure 7. 2040 Population Forecast for 16-County Region (Source: NCTCOG and Texas Water Development Board, 2015) **
** Erath, Navarro, Palo Pinto, and Somervell Population Projections were taken from TWDB 2016 Regional Water Plan Population & Water Demand Projections
18
Figure 8. Population Change from 1990 – 2040 for 12-County Metropolitan Planning Area (Source: NCTCOG, 2015)2
2 US Census, www.census.gov and 2040 Population Forecast, NCTCOG Research and Information Services
0%10%20%30%40%50%60%70%80%90%
100%
1990 Census 2010 Census 2040 Forecast

19
Chapter 3: North Central Texas Economic Activity and Growth Trends

20
Chapter 3. North Central Texas Economic Activity and Growth Trends
3.1 Regional Economic Activity
The North Central Texas region has been an economic activity hub for decades. The region has a great amount of positive economic activity due to diversified industries. According to the North Texas Commission’s 2015 Profile of North Texas, North Texas has a gross domestic product (GDP) of $447 billion, which is 30% of the state’s GDP. North Central Texas has the most diverse economy in Texas and it has a 3.6% job growth rate – out-pacing the nation’s 2.1%. If North Texas was a country, it would rank 27th in GDP, just between Belgium (26) and Venezuela (28). Major industries in North Texas include Healthcare, Energy, Aviation, Finance and Real Estate, High Tech, Manufacturing, and Logistics. North Texas is also home to 18 Fortune 500 Headquarters (2014 Fortune 500 list) and 15 major colleges and universities. Additionally, the top 25 major employers employ a combined workforce of 299,299 employees out of a labor force of approximately 3.5 million. The largest of these, American Airlines, employs 24,700 employees. Figure 9 displays the North Texas Labor Force by Industry as of 2014. Trade, Transportation and Utilities industry sector makes up approximately 20% of the labor force while the Information industry is the smallest at 2.5%. Quality of life is an important element of large employers choosing to move their headquarters and large corporate offices to the region. North Central Texas boasts a wide variety of retail and retail and cultural activities that serve an increasingly diverse population. North Central Texas has the fourth lowest median home sales price of the top 20 US metro areas; a median age of 24; 23 state parks within 100 miles of North Texas; 400 public parks; 18 malls or commercial centers; the tenth largest retail market in the US; 833 sports venues and 110 museums; and 60 lakes and reservoirs. Maintaining and continuing to expand these important quality of life aspects will continue to attract a diverse portfolio of corporations and industries.3
3.2 Dallas-Fort Worth Existing Employment and Employment Trends
Employment trends in the North Central Texas region have continued to include positive growth. From 1980-2010, employment rose 120%. This figure is indicative of the diverse industries discussed previously that provide a wide variety of job types and service areas for a diverse labor force. Additionally, as population increases, the need for more jobs continues to expand. The region has continued to attract employers due to a variety of reasons including affordable real estate, weather, a good transportation system, and a robust economy. Figure 10 demonstrates the expansive growth since 1980 to 2010 and the forecasted growth to 2040 for households, population, and employment in North Central Texas.
3 2015 Profile of North Texas. North Texas Commission. Accessed July 2015.

21
Figure 9. North Texas Labor Force by Industry (Source: North Texas Commission, 2015)
Figure 10. Household, Population, and Employment Growth, 1980 – 2040 (Source: Decennial Census and NCTCOG, 2015)
20.7%
16.4%
12.5%12.2%
10.3%
8.0%
8.0%
6.0%
3.6% 2.5%
Trade, Trans & Utilities
Professional & Business
Government
Education & Health
Leisure & Hospitality
Financial Activities
Manufacturing
Mining & Construction
Other Services
Information
2.98
6.34
10.68
1.79
3.94
6.69
1.10
2.32
3.73
0
2
4
6
8
10
12
1980 2010 2040
CO
UN
T IN
MIL
LIO
NS
PopulationEmploymentHouseholds

22
3.3 Economic Impact of the Solid Waste Industry
The diverse industries in the North Texas region provide a strong economic foundation and contributes to growing jobs and attracts new industries and businesses. The waste industry is a major economic driver at the national, state, and regional level. The U.S. International Trade Commission estimates that management of waste in the U.S. generates $42.8 billion in revenue annually as of 2002. According to the U.S. Bureau of Labor Statistics, waste management on the national level supports over 28,000 businesses and employs nearly 400,000 people. The Texas Recycling Data Initiative (TRDI) indicates that the recycling industry supports 12,678 jobs in the state. Including indirect and induced impacts of recycling are responsible for over 43,000 jobs and provide $8.8 billion to the Texas economy.
3.4 Dallas-Fort Worth Forecasted Employment Growth
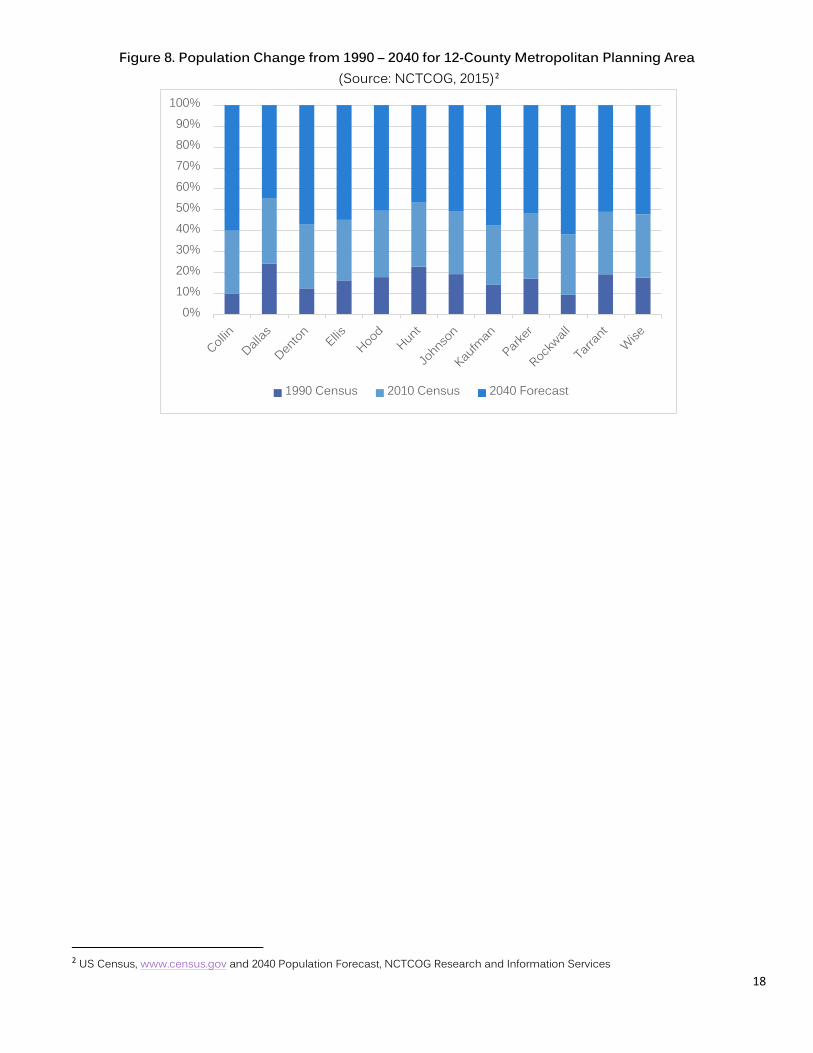
The North Central Texas region will continue to grow in population as well as employment. Between 2010 and 2040 the North Central Texas Region is expected to produce 2,750,550 new jobs. Employment growth by county is shown in Table 2. Dallas County is forecasted to have the highest increase in the number of jobs followed by Tarrant County. As shown in Table 3, the City of Dallas is projected to yield the largest increase of jobs by 2040 followed by the City of Fort Worth. Regions with job growth will not only maintain current residents, but they will also attract individuals seeking employment. Employment projections are relevant when assessing future waste demands and the need for new or expanded infrastructure to accommodate new businesses and industry. Additionally, these high growth areas of employers provide opportunities to initiate, expand, or improve waste management programs and provide focus areas to achieve the greatest impacts in waste reduction and improve recycling.
Table 2. Employment Forecast by County
(Source: NCTCOG, 2015) County 2010
Employment 2040
Employment 2010 – 2040
Change Collin 449,125 762,919 313,794 Dallas 1,872,745 3,197,471 1,324,726
Denton 248,693 445,079 196,386 Ellis 58,054 96,874 38,820
Hood 18,947 29,450 10,503 Hunt 42,689 70,102 27,413
Johnson 65,295 105,195 39,900 Kaufman 40,789 64,037 23,248
Parker 52,608 80,406 27,798 Rockwall 34,140 53,369 19,229 Tarrant 1,026,370 1,739,330 712,960
Wise 31,454 47,227 15,773 MPA Total 3,940,909 6,691,459 2,750,550
23
Table 3. Top Cities in Employment Growth (Source: NCTCOG, 2015)
City 2010 Employment
2040 Employment
2010 – 2040 Change
Dallas 1,036,119 1,789,713 753,594 Fort Worth 448,844 848,623 399,779
Irving 252,379 421,711 169,332 Arlington 183,860 302,664 118,804
Plano 235,983 327,269 91,286 Garland 80,870 155,326 74,456
Richardson 130,309 195,655 65,346 Mesquite 60,515 116,320 55,805 Grapevine 52,953 107,612 54,659 Carrollton 88,243 139,318 51,075
Figure 11. 2040 Jobs per Acre Forecast for 12-County MPA
(Source: NCTCOG, 2015)

24
Figure 11 demonstrates the forecasted jobs per acre in 2040. The existing urban areas will continue to contain most of the jobs in the North Central Texas region. The expansion of area of areas of employment will be relevant when developing waste management strategies and private-public partnerships to expand reuse, source reduction, and recycling activities. These areas could provide large impacts in materials management and provide opportunities to proactively implement programs and strategies with new businesses and enhance existing businesses and industry programs.
3.5 Summary
The economic outlook for the North Central Texas region will continue to be an important factor in corporations and residents choosing to move their businesses and families here. The availability of jobs and a qualified, skilled workforce are important considerations when determining to move a business or a family. Recently, several major corporations have chosen to move their corporate headquarters or other facilities to the region and this is expected to continue to occur. This expected growth in commercial, industry, and private sector businesses provides many opportunities to expand source reduction, recycling, and composting initiatives as well as partnerships in the region. Many partners can play a role in facilitating the enhancement and expansion of material management programs in existing and new businesses. The region will continue to emphasize both commercial and residential programs that address a variety of needs and desired outcomes. Local governments providing support for their commercial sector in terms of program development assistance, education and outreach, and supporting regional resources such as www.timetorecycle.com will continue to be emphasis areas of the regional plan to support improved commercial sector adoption and expansion of material management programs.

25
Chapter 4: North Central Texas Waste Facilities Analysis and Trends

26
Chapter 4. North Central Texas Waste Facilities Analysis and Trends
4.1 Defining Solid Waste Defining solid waste is important as it can have different meanings depending on the source. Like the evolution of materials in the waste stream, the nomenclature used in classifying waste is in transition. This progression of terminology has been driven by the growing awareness of economic and environmental components involved in a material’s lifecycle. In 1976, as an effort to curtail the growing expanse of waste generation, the United States Congress passed the Resource Conservation and Recovery Act, RCRA, which remains the foremost federal law on waste disposal. Solid waste as defined by RCRA includes any solid, semi-solid, liquid, or contained gaseous materials discarded from industrial, commercial, mining, or agricultural operations, and from community activities. The Environmental Protection Agency (EPA) is the federal agency responsible for implementing the goals of RCRA. Municipal solid waste (MSW) is summarized by the EPA as items that are disposed of after use such as “packaging, food, grass clippings, sofas, tires, computers, and refrigerators”, and excludes wastes that are hazardous, industrial, or from construction.4 The Texas Administrative Code (TAC) defines MSW as “solid waste from or incidental to municipal, community, commercial, institutional, and recreational activities, including garbage, rubbish, ashes, street cleanings, dead animals, abandoned automobiles, and all other solid waste other than industrial solid waste”.5 It is important to recognize that the Texas classification of MSW does include construction and demolition (C&D) waste as well as municipal sludge. These items are excluded from the EPA’s definition of MSW and may indicate a higher per capita MSW disposal rate and landfilled tons estimations for both the state and the region when compared to the EPA’s national rates.6
National data gathered on MSW generation and management by the EPA is consistent in both methodology and scale and is helpful when analyzing local trends on MSW or developing a rough approximation of generation for a specific geographic planning area. Handling materials discarded in a safe and responsible manner is one of the fundamental roles of municipal governments. Following guidelines set in place by both the state and federal level, local governments are the primary party responsible for managing materials at the end of their lifecycle and as they enter the waste stream.
4.2 Costs of Solid Waste Services
The costs of providing residential and commercial waste collection in Texas is borne by the waste generator – or residents and businesses. Local governments in the North Central Texas region either provide waste collection services as a city function or contract with private-sector service providers for these services. The costs of providing these services are collected through fees. Additionally, when residents or businesses use landfills, disposal fees are collected to assist with funding the operation and maintenance of the landfill. Tipping fees, or solid waste disposal fees, on average have been on the rise. This holds true on the national, state, and regional
4 Advancing Sustainable Materials Management: 2013 Fact Sheet, EPA 5 Municipal Solid Waste in Texas: A Year in Review, TCEQ 2013 6 Advancing Sustainable Materials Management: 2013 Fact Sheet, EPA

27
levels. The average tipping fee per ton disposed for the nation was $49.78 in 2013 and $31.72 for the state of Texas. Lower than the nation’s and state’s average, in 2013 the North Central Texas region had an average of $28.79 per ton. As shown in Figure 12, the trend demonstrates that tipping fees are rising in the North Central Texas region. Factors, such as increased regulation, fuel costs, and land availability may contribute to changes in waste disposal costs.7
Figure 12. Average Annual Tipping Fees in North Central Texas 2010-2014 (Source: TCEQ, 2015)
Other fees can also exist in the waste cycle including fees to recycle certain waste streams such as Household Hazardous Waste, electronics, fees to collect residential and commercial recycling, and additional fees on certain products when purchased to assist with paying for the costs to safely and properly dispose of those products when their useful life is over – such as car batteries. The cost of providing alternative collection and disposal services was one of the largest barriers found in the 2015 Regional Solid Waste Survey conducted by NCTCOG. The development or expansion of recycling and reuse infrastructure is often cost prohibitive and may incur ongoing expenses. As the cost for landfill disposal rises, increasing source reduction and recycling facilities become a more viable option. Of the stakeholders who participated in the survey, 21 out of 25 respondents stated that they have franchised or contracted solid waste services with private waste haulers. These contracts are negotiated by cities and the price for collection is often dependent on the level of service. Opportunities may be identified for local governments to collaborate or share services to buy down costs of solid waste services.
4.3 Waste Generation
Waste generation is the amount of materials that are produced prior to recycling, composting, or landfilling. The EPA reports waste generation based on production data (by weight) for the materials and products in the waste stream.8 In 2013, total MSW generated in the U.S was 254.1 million tons, an increase of 3 million tons from 2012. National per capita generation rates have grown since 1960, with per capita generation rates peaking in 2000 at
7 National Solid Wastes Management Association (NSWMA) Municipal Solid Waste Landfill Facts. October 2011. 8 Advancing Sustainable Materials Management: 2013 Fact Sheet, EPA
$26.53
$27.72
$29.08 $28.79
$30.46
$24.00
$25.00
$26.00
$27.00
$28.00
$29.00
$30.00
$31.00
2010 2011 2012 2013 2014
Average Tipping Fee (by ton)

28
4.74 pounds generated per person per day. The EPA reported a national MSW generation rate of 4.4 pounds per person per day in 2013, which is about the same as 2012 and is one of the lowest rates since 1980. Data is not available for the amount of waste generated in Texas or in the North Central Texas region. Reducing the amount of waste generated by residents and businesses is an important initiative referred to as source reduction. This concept is further described in Chapter 5 and provides the major trends and concepts associated with reducing waste prior to it ever becoming waste. These concepts include product stewardship, reducing packaging, zero waste initiatives, and reusing products to extend their useful life.
4.4 Waste Disposal and Treatment
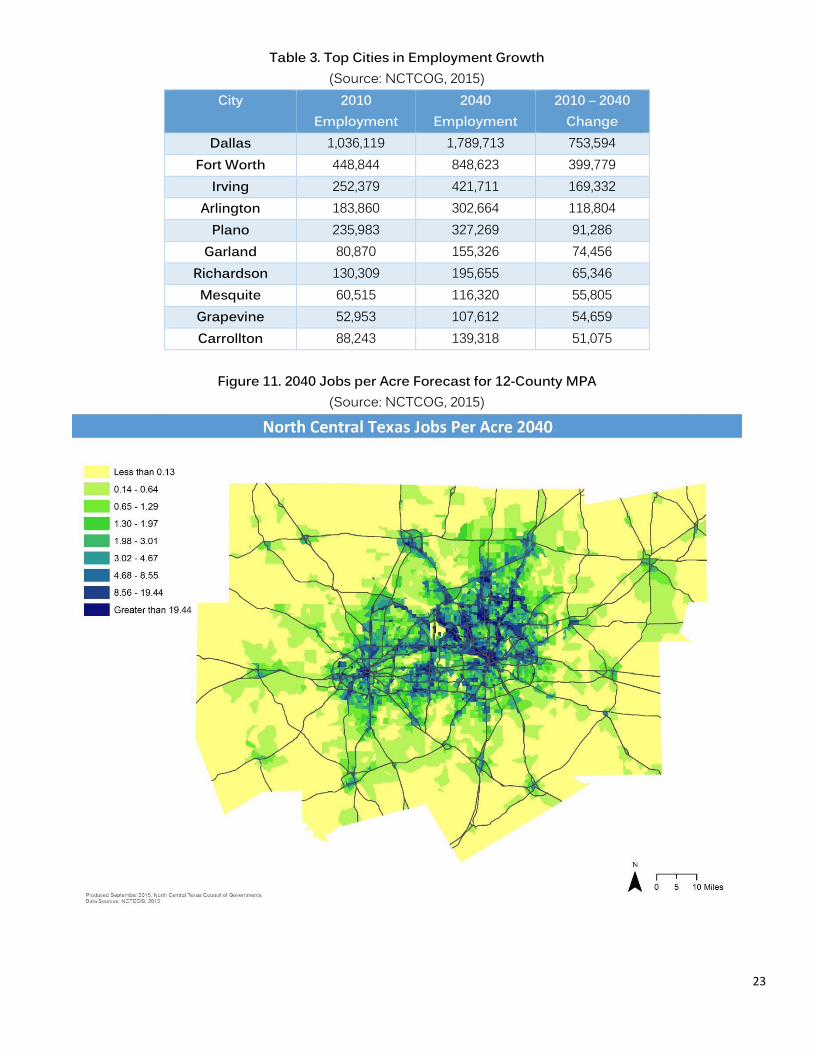
Waste disposal is defined as materials that have been discarded and have entered a landfill. Although least preferred in EPA’s waste management hierarchy, disposing of waste in landfills is the most common form of waste management and is an important component of an integrated waste management system. The EPA reported that in 2013, 52.8% of MSW generated was landfilled. The national per capita disposal rate of 2.32 pounds per day in 2013 was a slight increase from the 2.31 pounds per person per day reported in 2012. Information on landfill disposal for the State of Texas and the North Central Texas region is reported annually to the TCEQ by MSW facility operators. In 2013 the TCEQ reported that in Texas over 30.5 million tons of waste was disposed in the state’s 197 active landfills. Construction and demolition (C&D) material represented 17% of total waste disposed in Texas. There was also little change in the state’s per capita disposal rate between 2012 and 2013, and a rate of 6.33 pounds per person per day was reported in 2013 compared to 6.37 in 2012. According to the TCEQ, the North Central Texas region disposed of 8.5 million tons of materials in 2013 in the region’s 21 active MSW landfills.9 A 2011 NCTCOG study, estimated that approximately 65% of waste disposed in North Central Texas originated from industrial, commercial, and institutional (ICI) sources.10 The North Central Texas region had almost identical per capita disposal rates for 2012 and 2013 with the respective rates of 6.66 and 6.71 pounds per day.11 Figure 13 demonstrates the per capita pounds disposed per day rates of the country, state, and North Central Texas region over the span of a decade. As previously mentioned, rates for the national level do not include C&D materials and municipal sludge which are included in the state and region’s rates.
9 Municipal Solid Waste in Texas: A Year in Review, TCEQ 2013 10 North Central Texas Council of Governments Regional Recycling Rate Update 2011 11Municipal Solid Waste in Texas: A Year in Review, TCEQ 2013
29
Figure 13. Per Capita Landfill Disposal Rate per Day (Source EPA and TCEQ, 2015)
*Estimates for national rates of disposal per person per day does not include C&D materials and municipal sludge
4.5 Regional Imports and Exports of Solid Waste
Waste that is imported to MSW landfills from out of state is reported to the TCEQ, however there is no requirement to report waste that is exported from Texas. In 2013, TCEQ reported that 13% of waste disposed in the state was generated outside of Texas. Imported waste represents an even smaller share of waste disposed in North Central Texas. For Fiscal Year (FY) 2014, CSC Disposal and Landfill was the only MSW landfill in North Central Texas to report accepting waste from out of state, estimated to have accepted 67,803 tons of Class I Non Hazardous Industrial Waste, industrial sludge containing metals or organics, from Kansas.12 As shown in Table 4, several processing facilities also reported receiving waste from out of state.
12 TCEQ Central Registry Query, 2015
8.55 8.668.11 8.27 8.01 7.64
6.836.51 6.54 6.66 6.717.20 7.21 7.11 7.10
7.61 7.45 7.13
6.22 6.15 6.37 6.33
2.49 2.62 2.63 2.57 2.54 2.54 2.38 2.41 2.32 2.31 2.32
2003 2004 2005 2006 2007 2008 2009 2010 2011 2012 2013
North Central Texas Texas U.S*

30
Table 4. Processing Facilities Accepting Waste from Outside of Texas in 2014 (Source: TCEQ, 2015)
Permit Number
Facility Name County Facility Type States Served
Total Tons Imported from Out-of-State
2069A Liquid Environmental Solutions of Texas,
Dallas Facility
Dallas Liquid Waste Processor
LA,OK 832
40265 Stericycle Garland Dallas Medical Waste
Autoclave
FL, IL 708
40241 Oncore Technology Tarrant Medical Waste
Processor
AK, OK 64
4.6 Components of Solid Waste (Characterization)
The characterization of MSW is fundamental to proper waste management to determine the opportunities for material recovery and assess point sources of particular types of waste.13 Studies on waste characterization are costly and budget constraints of both state and local governments have led to limited data and resources being used to characterize waste within a planning region. National waste characterization data may be used as a resource when measuring local and state rates, though discrepancies may exist due to attributes distinctive to certain areas. For the purpose of the Regional Plan, national, state, and regional data is used as available. It is important to acknowledge that measurements may have been analyzed for the three geographic regions using differing methodologies and gaps may exist in certain years for the state and regional level data sources. Nationally, in 2013, the largest waste component was paper at 27% (approximately 69 million tons) of the total MSW generated. This was followed by food waste at 14.6%, yard trimmings at 13.5%, and plastics at 12.8%. These four categories made up 67.9% of all waste generated in 2013. Other categories including glass, wood, metals, rubber, leather and textiles, and other items accounted for a combined 32.1% of the total MSW, shown in Figure 14. The state’s characterization of MSW disposed are based on broad categories and estimates are not categorized by material comparable to national assessments. The TCEQ reported in 2013, shown in Figure 15, that of the MSW landfilled, 66% was municipal waste and that construction and demolition (C&D) material was the second largest component comprising of 17% of total MSW landfilled. Currently there is no data on the characterization of MSW generated for the state or region.
13 2008 Tennessee Waste Characterization Study, Tennessee Department of Environment and Conservation 2008

31
Figure 14. Total MSW Generation (by Material), 2013, 254 Million Tons (before recycling) (Source: ASMM 2013 Fact Sheet, EPA 2015)
Figure 15. Types and Amounts of MSW Landfilled in Texas in 2013 (Source: TCEQ, 2013)
Municipal, 66%Construction/
Demolition, 17%
Class 2&3 Non-Hazardous
Industrial Waste, 5%
Sludge, 5%
Brush, 1%
Contaminated soil, 2%
Additional wastes, 4%

32
4.7 Landfill Capacity In 2009, it was estimated that there were a total of 1,900 active MSW landfills in the United States, a significant decrease from 1988 when there were approximately 7,900 MSW landfills.14 A decline in active landfills has also been the trend in Texas, with 763 MSW landfills accepting waste in 1987 compared to 197 active landfills in 2013.15
The closure of many landfills may be attributed to the implementation of Subtitle D of RCRA, addressing the technical design and operations criteria that states must follow when regulating and permitting non-hazardous MSW disposal facilities.16 Many rural landfills were unable to operate cost-effectively under these new regulations and many were forced to close. As a result, many counties in the North Central Texas region have experienced a combination of higher disposal costs and increased illegal dumping. As of 2013, in the North Central Texas region there are 21 active landfills in operation. Some landfills are owned by private landfill operators, while other landfills are owned and operated by local governments or other public entities such as local water districts. There are two types of landfills in the region, Type I and Type IV facilities. As defined by TCEQ, Type I facilities are categorized as a “standard landfill for the disposal of MSW”. Type IV landfills “may only accept brush, construction and demolition material, and other similar waste that will not putrefy”. Figure 16 is a map of the permitted landfills in North Central Texas. This map demonstrates that most of the active landfills are located within the more urbanized areas of the region. Hood, Kaufman, Palo Pinto, Rockwall, Somervell, and Wise counties currently do not have active landfill facilities. While the number of landfills in the region has decreased over time, the available regional capacity has continued to increase. In 1992, the North Central Texas region’s remaining landfill disposal capacity was estimated at 123 million tons; and in 2000, the remaining capacity was 249 million tons. As of 2013, approximately 371 million tons of remaining landfill capacity exist in the North Central Texas region, an increase in regional landfill capacity of 200% over the past 20 years. This increase in regional landfill capacity is due to additional permitted capacity that has been acquired through new and expanded facilities, thus increasing the remaining capacity in terms of volume that can be accepted as well as the estimated years of capacity.17 As of 2013, the average remaining years of capacity is approximately 98 years for all 21 landfills in the North Central Texas region.18 Table 5 provides the remaining capacity in years for each of the landfills. Two landfills in Ellis County account for a combined remaining capacity of 1,177 years.19 When these two landfills are removed, the remaining capacity average among the remaining 19 landfills is 46 years. It is important to note that the estimated lifetime of landfills does not factor in population growth and is calculated based on weight not volume.
14 Municipal Solid Waste Landfills Economic Impact Analysis for the Proposed New Subpart to the New Source Performance Standards, EPA June 2014 15 Municipal Solid Waste in Texas: A Year in Review, TCEQ 2013 16 Managing Non-Hazardous Municipal and Solid Waste (RCRA), EPA 17 Municipal Solid Waste in Texas: A Year in Review, TCEQ 2013 18 Municipal Solid Waste in Texas: A Year in Review, TCEQ 2013 19 Municipal Solid Waste in Texas: A Year in Review, TCEQ 2013

33
Figure 16. Active Landfills in North Central Texas in 2013 (Source: TCEQ, 2015)
4.8 Estimating Future Landfill Capacity
Based on the current regional disposal rate of 6.71 pounds per person per day and a 2040 population projection of approximately 10.7 million people, it is estimated that the North Central Texas region will need enough landfill capacity in 2040 to accommodate of over 12 million tons of waste annually, an increase from 2014 of 41%. Reductions in the amount of MSW disposed in regional landfills will require supporting and implementing programs and partnerships throughout the region to achieve greater source reduction and recycling to ensure sufficient future capacity. Projects and programs that provide residents and businesses alternatives to disposing of waste in the landfill; policies and initiatives aimed at strengthening product stewardship initiatives; and expanding recycling markets to increase resource recovery are important initiatives that the Regional Plan supports to assist in assuring adequate capacity for the 16 county region.
4.9 New Landfill and Other Waste Facility Siting
While the most recent landfill was constructed in 2004, the process to build a new landfill or other MSW facility involves a permitting process through TCEQ. During the permit process, NCTCOG, is responsible for review of the MSW facility, solid waste permit, and registration applications. In the NCTCOG Regional and Local Review of MSW

34
Facility Applications Final Report published in 2005, a regional process was established for review of MSW facility applications.20 The goal of this regional process is to determine whether an application demonstrates conformance with the existing Regional Plan. TCEQ uses the Regional Plan and NCTCOG’s conformance evaluation process as an opportunity to assess the land use compatibility and local community concerns pertaining to a proposed solid waste facility. Although there is no formal criteria mandated by the state for regional conformance review, an objective process is an important criteria for evaluation. In the North Central Texas region, the RCC reviews MSW facility siting applications and makes a recommendation to TCEQ on the facility’s consistency with the Regional Plan. The committee assesses how a facility will to contribute to the attainment of the Regional Plan goals and if it is in compliance with any local zoning requirements or ordinances. Issues addressed by TCEQ, such as airport safety, floodplains, wetlands, and fault areas, are not addressed in the regional facility application review to avoid redundancy. Landfill capacity and land use compatibility are key factors considered in the regional review process in determining conformance with the Regional Plan.
4.9.1 County MSW Facility Siting
Under Section §364.012 of the Texas Health and Safety Code, counties have the authority to adopt an ordinance within its boundaries prohibiting MSW disposal facilities that would threaten public health, safety, and welfare. Although counties have other options available to address MSW facility siting, a county ordinance is the only option to which a county can state where MSW facilities are prohibited, but in doing so they must also include where they will allow siting of MSW facilities. With a properly implemented ordinance, the RCC will defer to and accept the county’s ordinance when making a land use conformance recommendation. NCTCOG does have a role in educating cities and counties on the reasons for developing a local siting criteria or facility siting ordinances and encourages collaboration between cities and counties to guarantee that bordering local governments do not have conflicting land use plans. In the North Central Texas region, Navarro County adopted a local siting ordinance using NCTCOG solid waste grant funds.
4.9.2 Regional Closed Landfill Inventory
Over time, as landfills reach their capacity and permit limits, a landfill must either expand or close. Texas House Bill 2537 mandated that all regional solid waste management plans include an inventory of existing and closed landfill units, including their location. In 1999, Senate Bill 1447 amended the Texas Health and Safety Code and mandated that the inventory include: 1) landfill units no longer in operation; 2) exact boundaries of landfills; 3) a map of each landfill unit; 4) the current owner of the land; and, 5) the current use of the land. NCTCOG has inventoried all known landfill sites with adequate boundary descriptions including those where locations are only estimated. If the exact boundaries are not known, the best approximation of each unit’s boundaries are included to provide information that can be used as a resource for cities, the public, and private sector when planning or developing a piece of property. A total of 623 sites have been identified as of 2015 for the North Central Texas region, where 136 were permitted by the state and 487 were unauthorized and are now considered abandoned landfill sites.
20 Regional and Local Review of MSW Facility Applications, NCTCOG, 2005

35
The North Central Texas Closed Landfill Inventory is maintained and housed by NCTCOG and can be accessed on the NCTCOG website. Figure 17 is a map of the Closed Landfill Inventory for the North Central Texas region.
Figure 17. North Central Texas Closed and Abandoned Landfills (Source: NCTCOG, 2015)
4.10 Waste Transportation and Materials Management Processing Infrastructure
The transport of waste and waste processing infrastructure are important aspects in the cycle of managing products. The transportation and collection of waste can be large portions of city budgets. The cost associated with resource recovery processing facilities can be prohibitive for diverting new materials beyond the traditional curbside materials. Both are important points to consider when planning for long term regional infrastructure.
4.10.1 Waste Collection and Transport
Waste collection and transportation infrastructure is an integral part of the waste cycle. State enabling legislation requires local governments to provide waste collection and disposal for all residents within their jurisdictions. To provide these services, waste collection and transportation services are provided by a number of private

36
companies that contract with local governments and counties. Several local governments also provide their own solid waste collection and transportation.
NCTCOG has also supported the improvement of solid waste hauler fleet vehicles by providing vehicle incentives and funding for the past decade. Solid waste haulers comprise a large inventory of heavy-duty vehicles that produce diesel emissions that contribute to poor air quality. NCTCOG’s Transportation Department conducts a variety of initiatives with solid waste service providers focused on improving regional air quality. Since 2006, NCTCOG has awarded over $900,000 to replace 67 waste hauler vehicles in the region with newer trucks with cleaner-burning engines. NCTCOG continues to periodically offer grant funding for vehicle replacement as funds are available. Staff also heavily promotes grant funding available from other agencies, particularly the Texas Commission on Environmental Quality (TCEQ) Texas Emissions Reduction Plan (TERP) funding. With all funding efforts, refuse haulers are a frequent priority focus due to the cost-effectiveness of reducing air pollution from these vehicles relative to other vehicle types. In addition to grant funding efforts, NCTCOG continuously works with the refuse hauler industry through the DFW Clean Cities (DFWCC) program, housed within NCTCOG. DFWCC is one of nearly 100 coalitions designated throughout the country by the Department of Energy. The mission of the Clean Cities program is to support local actions to reduce petroleum use in transportation, which promotes the nation’s economic, environmental, and energy security. DFWCC furthers this mission at the local level by collaborating with local fleets to find petroleum reduction solutions that work for each fleet’s application. Strategies include the use of alternative fuels or advanced technology vehicles (e.g. hybrids), idle reduction, or improving fuel economy. Many regional fleets have invested in these technologies; hydraulic hybrids, biodiesel, and natural gas-powered refuse haulers are particularly common choices and are found in both municipal and private sector fleets across the region, with more and more fleets adopting these options each year. Strategies to reduce the number of truck trips necessary also help improve air quality by reducing the amount of miles traveled and, therefore, pollution emitted.
4.10.2 Unpermitted Processing Facilities
Under Texas Administrative Code Rule §330.11, only notification is required for certain facilities, such as citizens’ collection stations (CCS) and facilities that collect and process only non-putrescible source separated recyclables.21 In the North Central Texas region, there are a number of these types of facilities and diversion activities at these facilities have a great impact on the region. Because TCEQ does not permit these facilities, a regional inventory of their locations is not tracked at the statewide level. In 2013 Republic opened a 90,000 square foot MRF in Fort Worth that services Dallas, Denton, Parker, and Tarrant counties in collecting and processing recyclables.22 The facility, which still retains a transfer station permit, has the ability to process 35 tons of recycled materials per hour and is estimated to receive 250 tons of recyclables per day.23 As new facilities are built and become active, NCTCOG will inventory them and include them in subsequent regional plans. These facilities provide an important role in supporting waste diversion, source reduction, and resource recovery activities.
21 Texas Administrative Code, http://texreg.sos.state.tx.us/public/readtac$ext.TacPage?sl=T&app=9&p_dir=F&p_rloc=124143&p_tloc=14895&p_ploc=1&pg=2&p_tac=&ti=30&pt=1&ch=330&rl=3, 22 Republic Services Material Recovery Facility Fact Sheet. http://site.republicservices.com/site/north-central-texas/en/documents/fact%20sheet%20-%20low%20vis.pdf 23 Republic Services Material Recovery Facility Fact Sheet. http://site.republicservices.com/site/north-central-texas/en/documents/fact%20sheet%20-%20low%20vis.pdf

37
Expanding the network of professing facilities and the materials accepted and processed by these facilities in the region is an objective supported by the Regional Plan. Citizen’s Collection Stations Citizen’s Collection Stations according to the Texas Administrative Code Rule §330.3 is a facility established for the convenience and exclusive use of residents not commercial or industrial users or collection vehicles, except in small communities where regular collections are not available. Small quantities of commercial waste may be deposited by the generator of the waste and the facility may consist of one or more storage containers, bins, or trailers. Under the Texas Administrative Code §330.11, CCS are required to notify TCEQ, but may be exempted for recycling and other activities.24 Establishing additional CCS in rural areas offers residents a cost-effective alternative to illegal dumping. Many CSS also function as drop-off sites for recyclables, which compliments a cities curbside recycling program. Many communities within North Central Texas offer 40-yard roll-off collection containers and compactors utilized for a variety of commodities. Some communities have expanded their CCS to include balers used to bundle corrugated cardboard for resale. Additional options for increasing rural and unincorporated access to disposal options is for long-term strategic relationships between sub-regional entities to coordinate solid waste management on behalf of multiple communities. Many smaller communities throughout the state have established joint use/ownership agencies to share disposal facilities through an interlocal agreement. Through these agreements, each city is responsible for its own collection services but communities work together to ratify budgets, agreements with others, and contracts by the participating city councils. Smaller communities have increasingly looked to other regional entities to provide support for expanding solid waste services, including river authorities and water districts. North Texas Municipal Water District (NTMWD) and Upper Trinity Regional Water District (UTRWD) have solid waste programs for residents in their service areas. NTMWD began providing solid waste transportation and disposal services at the request of five of their member cities (Plano Richardson, Allen, McKinney, and Frisco). NTMWD also operates three transfer stations, two located in Plano (Custer Road and Parkway Transfer Station) and one in Richardson (Lookout Drive Transfer Station). NTMWD also provides transportation from the transfer stations to the landfill and operates a joint-use sanitary landfill. UTRWD offers communities a mobile Household Hazardous Waste (HHW) Collection Program to safely transport and dispose of HHW waste for communities that do not have access to these programs on a consistent basis. Communities must contract with UTRWD for the program and are billed based on the number of households participating. These wastes are taken to the City of Fort Worth HHW facility for disposal through a contract between the Fort Worth and UTRWD.
24 Texas Administrative Code, http://texreg.sos.state.tx.us/public/readtac$ext.TacPage?sl=T&app=9&p_dir=F&p_rloc=124143&p_tloc=14895&p_ploc=1&pg=2&p_tac=&ti=30&pt=1&ch=330&rl=3,

38
4.10.3 Permitted and Registered Processing Facilities
After the garbage truck leaves a single-family or multi-family residence or a business, the truck usually completes its route by arriving at a transfer station. A transfer station is a facility designed to allow the transfer of materials from the vehicles in which they are collected, or originally transported by the generator, to larger vehicles for transport to their final destination. It is important to note that a transfer station is not a storage facility such as one where individual residents can dispose of their wastes in bulk storage containers that are serviced by collection vehicles.25 The costs of hauling to a transfer station are often less than transporting to the landfill directly. Transfer stations provide a significant financial incentive to rural cities that face long hauling distances to landfills. In determining the cost effectiveness of a transfer station, important factors to consider are the cost of disposal, distance to landfill, annual tonnage hauled, and fuel costs.26Transfer stations are required to be registered or permitted with the TCEQ and may also function as a processing facility. Although the primary reason for a transfer station may be to reduce costs, outside of landfills, most diversion activities in the state of Texas is done by transfer stations. Table 6 shows permitted and registered transfer stations in the region and the amount of waste handled at each station in 2013. In 2013, approximately 14% of MSW disposed in the North Central Texas region was processed through one of 17 transfer stations prior to being hauled to a landfill for disposal. Figure 18 is a map of the transfer stations in North Central Texas. As shown by the map, most of the transfer stations are located within the more urbanized areas of the region, with a few locations in the more rural counties. Due to the lack of adequate solid waste infrastructure in less populated areas, illegal dumping often occurs as a result. Providing these facilities or improving access to these type of facilities in rural communities/ less populated areas is one of the action recommendations of the Regional Plan.
25 Texas Administrative Code, http://texreg.sos.state.tx.us/public/readtac$ext.TacPage?sl=T&app=9&p_dir=F&p_rloc=124143&p_tloc=14895&p_ploc=1&pg=2&p_tac=&ti=30&pt=1&ch=330&rl=3, 26 How to Plan, Design, and Finance Small Transfer Stations and Citizens’ Collection Stations, 2010 NCTCOG

39
Figure 18. North Central Texas Municipal Solid Waste Transfer Stations (Source: TCEQ, 2015)
Additionally, NCTCOG has used the solid waste funding from TCEQ to improve disposal options in these communities by providing rural residents increased collection and disposal options. Increasing options for bulky items such as furniture and appliances is still an area where NCTCOG and other stakeholders have opportunities to partner and coordinate to address these challenges in rural areas. One opportunity lies in supporting the hub-and-spoke recycling model, which several states have adopted to bridge the gap between the rural and urban infrastructure. The hub-and-spoke recycling model provides access for rural residents and reduces transport costs. The “hubs” are regional centers either for solid waste or recycling, located in larger communities that accept materials from smaller towns and remote collection centers, called spokes. This model consolidates the trips to citizen collection stations where most materials are already sorted by material type. Improving access to these spokes and increasing the citizen collection stations in the rural areas of North Central Texas is another emphasis of the Regional Plan.

40
4.11 Summary Waste generation and disposal is impacted by a variety of aspects including technological advancements, advances in waste processing, changes in consumer behavior, product demands, consumption patterns, social trends, and legislative and political shifts. This variety of factors that affect the rates of waste generation and characterization are important to identify and understand when addressing strategies to support reduction of waste generation and disposal of waste in landfills.
Ongoing data collection, both regionally and statewide, is important in monitoring the trends in per capita disposal, generation, and characterization of waste. The Regional Plan supports the continued tracking and establishment of trends to assess the region’s progress in reducing the per capita generation and disposal rates and increasing the amount of recoverable materials from disposal. Innovative technologies, partnerships, education, and infrastructure will support the expansion of programs and projects to facilitate these needed changes. One important element that contributes to the regional per capita disposal rate is the continued expansion of rural infrastructure in North Central Texas. The U.S Census defines two types of urban areas: Urbanized Areas with 50,000 people or more, and Urban Clusters of at least 2,500 and less than 50,000 people; a rural area includes all territory that is not defined as urban.27 While the rural and/or unincorporated areas of the region account for approximately 8% of the region’s total population, these areas comprise 75% of the regional land area.28 This large area with many small communities provides opportunities to support the hub-and-spoke model of small transfer and citizen collection stations. Private-public partnerships, government-government partnerships, and a coordinated approach to establishing and expanding this infrastructure is a key action supported by the Regional Plan to provide options and convenience to residents and businesses for waste disposal in rural areas. Many waste streams are becoming increasingly challenging to collect and process due to safety, health, or other social or environmental considerations associated with these wastes. Efforts to achieve greater impacts in specific waste streams source reduction, recycling, or proper disposal are supported by the Regional Plan and will continue to be a priority when considering new facilities that treat and dispose of these wastes. Expanding existing programs and facilities needs to correspond with the development of infrastructure to handle emerging waste streams such as medical waste disposal, electronics, recycling, and composting sites as described in the Advancing Materials Management in North Central Texas section. Due to the existing challenges that will likely increase with additional growth, illegal dumping will continue to be an emphasis area of waste management strategies in the region and is supported by several actions included in the Regional Plan. Facilitating and supporting regional prevention activities and coordinated approaches to providing infrastructure and education programs are important steps to preventing illegal dumping. Supporting site clean-ups, law and prosecutor training, and enforcement programs are important components to emphasize and continue to assist local governments in providing safe and healthy communities for their current and future residents.
27 Census.Gov https://www.census.gov/geo/reference/urban-rural.html 28 NCTCOG, 2015

41
Table 5. North Central Texas Active Landfills (Source: TCEQ, 2013) *Remaining landfill lifetime does not take into account projected population growth
County Permit Site Name Type Public/ Private Owner
Tons Accepted in
2013
Remaining Landfill
Capacity in Cubic Yards-
2013
Reported Compaction Rate
in Pounds Per Cubic Yards- 2013
Remaining Landfill Capacity in Tons
(based on reported compaction rate)-
2013
Remaining Lifetime (Years)-
2013*
Collin 2294 121 Regional Disposal Facility I Public 782,791 123,582,500 1,426 88,114,323 112
Dallas
62 City of Dallas McCommas Bluff
Landfill I Public 1,461,947 94,769,073 1,400 66,338,351 45
996C City of Grand Prairie Landfill I Public 162,366 12,620,777 909 5,736,143 43 1394B Hunter Ferrell Landfill I Public 146,573 14,049,928 1,574 11,078,627 67
1895A Charles M Hinton Jr Regional
Landfill I Public 342,020 34,801,352 1,200 20,880,811 49
Denton
1025B DFW Recycling and Disposal
Facility I Private 1,289,430 13,484,050 1,760 11,865,964 11
1312A Camelot Landfill I Public 298,876 6,748,680 1,785 6,023,197 20 1590A City of Denton Landfill I Public 176,509 11,244,878 1,009 5,673,041 32 1749B Lewisville Landfill IV Private 174,688 22,072,848 2,230 24,611,226 141
Ellis 42C
Waste Management Skyline Landfill
I Private 1,120,400 30,974,333 1,440 22,301,520 20
1209B CSC Disposal and Landfill I Private 27,566 31,044,259 1,163 18,052,237 655 1745B Ellis County Landfill I Private 57,155 39,855,933 1,496 29,812,238 522
Erath 664 City of Stephenville Landfill IV Public 6,956 948,134 850 402,957 81 Hunt 1195A Republic Maloy Landfill I Private 97,829 6,116,927 1,234 3,774,144 39
Johnson 534 City of Cleburne Landfill I Public 1,446 22,995 1,000 11,498 8
1417B IESI Turkey Creek Landfill I Private 425,474 9,823,550 1,460 71,171,192 17 Navarro 2190 City of Corsicana Landfill I Public 97,617 23,923,666 1,000 11,961,833 114 Parker 47A IESI Weatherford Landfill I Private 173,240 2,625,016 1,400 1,837,511 11
Tarrant 218C
City of Fort Worth South East Landfill
I Public 501,336 26,630,094 1,747 23,261,387 46
358B City of Arlington Landfill I Public 781,355 11,000,913 1,670 9,185,762 12 1983B IESI Fort Worth C and D Landfill IV Private 359,439 4,432,990 1,560 3,457,732 10
Region 8,485,013 520,772,896 Average:1,396 435,551,694 51.33

42
Table 6. 2013 Facility Data on Transfer Stations in Region by County (Source: TCEQ, 2013)
County No. on Map
Permit/Registration No.
Site Name Tons Handled in 2013
Collin
1 2045A Custer Road Transfer Station
231,975
2 1494 Parkway Transfer Station 110,395
3 53 Lookout Drive Transfer Station
127,886
Dallas
4 12 City of Garland Transfer Station
106,442
5 60 Fair Oaks Transfer Station 55,272
6 227 City of University Park Transfer Station
12,364
7 1145 Harry Hines Transfer Station
146,365
8 1263 City of Mesquite Transfer Station
45,284
9 1453 City of Dallas Transfer Station
54,430
10 40196 Community Waste Disposal Transfer Station
64,782
Johnson 11 40168 Cleburne Transfer Station 46,725
Palo Pinto 12 40104 IESI TX Lake Country
Mingus Transfer Station 31
Somervell 13 40181 Somervell County Transfer
Station 2,765
Tarrant
14 2275 Fort Worth Transfer Station Material Recovery Facility
14,036
15 2306 IESI Minnis Drive Transfer Stations
7,076
16 40052 Southwest Paper Stock Transfer Station
14,872
17 40186 WM Westside Transfer Station
144,956
Total 1,185,656

43
Chapter 5: Advancing Materials Management in North Central Texas

44
Chapter 5. Advancing Materials Management in North Central Texas
5.0 Supporting the Waste Management Hierarchy
Responsible management of the materials consumed is important for a variety of reasons including environmental quality, recovery of economic value, and public safety. Although 50 years ago there was less waste materials generated per person, landfilling was the predominant method of disposal and options were limited for recovery at the end of the material’s life cycle. In addressing the complexity of handling waste materials, the EPA developed a hierarchy, Figure 19, demonstrating best practices of waste management.
Figure 19. EPA Non-Hazardous Waste Management Hierarchy (Source: EPA, 2015)
The state of Texas outlines in the Texas Health and Safety Code §361.022 the same hierarchy of preferred methods including: 1) source reduction and waste minimization; 2) reuse or recycling of waste; 3) treatment to destroy or reprocess waste to recover energy or other beneficial resources; and, 4) land disposal.29 Consistent with both the national and state’s priorities, the North Central Texas region has adopted the same preferred waste management strategies which serves as the foundation of the Regional Plan materials management strategy. The national, statewide, and local efforts continue to focus on three key areas of waste management that are succinctly summarized by the EPA as: 30
• Source Reduction: Waste prevention, is designing products to reduce the amount of waste that will later need to be thrown away and also to make the resulting waste less toxic.
29 Texas Health and Safety Code, http://www.statutes.legis.state.tx.us/Docs/HS/htm/HS.363.htm#363.004 30 EPA, Municipal Solid Waste Website. Accessed July 2015. www.epa.gov.

45
• Recycling: The recovery of useful materials, such as paper, glass, plastic, and metals, from the trash to use to make new products, reducing the amount of virgin raw materials needed.
• Composting: Collecting organic waste, such as food scraps and yard trimmings, and storing it under conditions designed to help it break down naturally, to then be used as a natural fertilizer.
The preferred waste management initiatives focus on reducing the amount of waste generated and/or disposed of in the landfill. Prior to expanding on these preferred methods, the concepts of zero waste, the evolving ton, resource recovery, and product stewardship are discussed below as they assist in supporting the three preferred waste management strategies.
5.1 Moving Towards Zero Waste
The definition of Zero Waste can vary from source to source. The Zero Waste International Alliance defines Zero Waste as “designing and managing products and processes to systematically avoid and eliminate the volume and toxicity of waste and materials, conserve and recover all resources, and not burn or bury them”.31 The common theme conveyed by Zero Waste advocates is the need to address the limitations of recycling alone and develop a more integrated approach to the management of materials. Working with manufacturers is fundamental to achieving Zero Waste initiatives. Both private and public sector entities in North Central Texas have adopted Zero Waste goals. The City of Dallas developed a solid waste plan to manage the discarded materials generated in the city over the next 50 years. The long term goal of the plan is to reach the ultimate reduction goal of ‘Zero Waste’ by 2040.32 The Zero Waste plan promotes a comprehensive systems-approach to waste prevention by:
• Having products and packaging designed for the environment; • Reducing the materials used in products and packaging; • Using less toxic, more benign materials in production and manufacturing; • Providing longer product lives by developing more lasting products; and, • Having products that are repairable and easily dissembled at the end of their useful life.
The City of Dallas also plans to encourage commercial haulers to provide recycling services to all of their customers with specific emphasis on multi-family and commercial generators.
Several businesses in North Central Texas have also developed Zero Waste goals. As part of the company’s overarching goal to reach Zero Waste at over 100 manufacturing sites by 2020, the General Motors (GM) plant in Arlington is a certified landfill free facility.33 Figure 20 demonstrates the steps by which GM Plants have taken to achieve landfill-free status. By integrating recycling and source reduction throughout production, the GM plant in Arlington has received recognition from the EPA for accomplishing the Energy Star Challenge.
31 Zero Waste International Alliance http://zwia.org/standards/zw-definition/ 32 City of Dallas Local Solid Waste Management Plan 2011-2060 February 2013 http://dallascityhall.com/departments/sanitation/DCH%20Documents/pdf/DallasLocalSWMP_Vol-I-II.pdf 33 General Motors http://arlington.gmplantnews.com/Facilities/public/us/en/arlington/environment.html

46
Figure 20. General Motor’s Steps to Achieving Landfill-Free Status (Source General Motors, 2015)
While supporting Zero Waste initiatives at a regional scale was not a high-priority based on a 2015 regional NCTCOG survey, it is a concept that some local governments and businesses are pursuing. Concepts such as zero waste will improve waste management programs, reduce landfill disposal rates, and reduce the amount of landfill space needed in the future. While Zero Waste supports initiatives to be landfill-free, the evolution of what waste is constantly changes and impacts the weight, reuse and recycling options, and the cost to process and dispose of certain wastes.
5.2 Understanding the Evolving Ton
The solid waste industry has experienced a transition of materials emerging in the waste stream. While the industry has previously experienced change in materials generated, as in the case of packaging from glass to aluminum to plastics, it is important to recognize consumer trends when planning for future material management. This change in what materials and products people use in their daily lives can be attributed to new technologies, manufacturing of consumer goods, and other trends. This evolution of what ends up as waste products is sometimes referred to as a concept of the evolving ton. The evolving ton concept incorporates the trends in waste streams that show declining paper usage, increased plastics packaging, and increased plastic containers. Additionally, manufacturers are increasingly using light weight plastics to reduce the weight of products thus reducing costs of shipping over long distances and to achieve other environmental benefits; however many recycling facilities are unable to process this material cost-effectively. This is largely due to the existing model of revenue in which revenue is sustained by weight, yet cost is incurred by volume. As packaging and waste streams become lighter, the costs increase due to the requirement to process higher volumes to make processing cost-effective. While lighter packaging and waste streams have benefits associated with reducing carbon dioxide emissions

47
during the manufacturing process, this loss of density in materials does present a challenge at the end of a product’s life-cycle. The evolving ton is impacting the waste generation and waste disposal characteristics nationally and regionally. The amount of waste generated and disposed of assists the waste industry, local governments, and other stakeholders in identifying opportunities to enhance source reduction, diversion, and disposal methods and impacts the amount of waste going to landfills. The evolving waste stream has forced many cities and counties to reevaluate how they manage and contract solid waste services and has also provided additional opportunities to enhance waste management programs by improving source reduction and recycling. Additionally, as waste streams and products change, the value of the waste changes leading to new opportunities to see waste as an economic resource, and to support additional resource recovery initiatives.
5.3 Waste as a Commodity and Resource Recovery
Resource recovery views MSW as a commodity that carries economic value even after entering the waste stream. Recognizing the inherent value of materials that are customarily placed in landfills, resource recovery attempts to draw economically viable commodities from the waste stream. Cities such as the City of Denton have invested resources into development of resource recovery parks. The City of Denton Eco-W.E.R.C.S (waste to energy, recycling, composting, and solar) at Pecan Creek serves as a central location for reuse, composting, and recycling activities in the City to recover as much economic value from waste as possible. Figure 21 is a map of the many facilities that are available at the City of Denton to support resource recovery initiatives and provide a convenient location for residents to use.
Figure 21. City of Denton Landfill at ECO-W.E.R.C.S Map (Source: City of Denton, 2015)
48
As mandated by the Texas Health and Safety Code §363.041, the Municipal Solid Waste Management and Resource Recovery Advisory Council is a statewide committee that is appointed by the TCEQ commissioners to perform a variety of tasks including making recommendations to promote resource recovery. Initiatives such as Denton’s recovery park are important to advancing statewide resource recovery goals, meeting Denton’s goals, and providing opportunities for future resource recovery markets to be established. Supporting additional resource recovery initiatives, such as establishment of resource recovery parks and provision of convenient facilities for urban and rural residents and businesses to recycle and compost a variety of materials, are supported by the Regional Plan.
5.4 Supporting Product Stewardship
Product stewardship is the shared responsibility for the end-of-life management for products which are deemed hazardous to human health or the environment. The product stewardship concept includes supporting changes in product design and production, changes in consumer behavior, and decisions regarding cost of proper disposal. Product stewardship does consider the costs and responsibilities of a variety of parties including product designers, manufacturers, consumers, and regulators. Extended producer responsibility (EPR) is a stewardship concept that requires manufacturers to maintain responsibility for their product throughout the product lifecycle and extends this responsibility to post-consumer management of a product and its packaging. EPR policy focuses on two specific policy areas: 1) shifting the financial and management responsibility, with government oversight, upstream to the manufacturer and away from the public sector; and, 2) providing incentives to manufacturers to incorporate environmental considerations into the design of their products and packaging. Voluntary participation by manufacturers to support EPR has shown benefits from both the public and private side. Fewer raw products need to be purchased to create the same products and the public has clear consistent messaging of where used goods are accepted. In Texas, the Texas Product Stewardship Council (TXPSC) was formed to integrate the principles of product stewardship into the policy and economic structures of Texas. This organization of local stakeholders works with a variety of government, private sector, and non-profit partners to reduce waste and advance good public policy to the materials management industry and support producer responsibility to establish, fund, and manage end of life management systems for their products. TXPSC provides resources and best practices for local governments and provides a forum for discussion and advancement of product stewardship in Texas.
5.5 Advancing Materials Management in North Texas: Source Reduction and Reuse
The top three preferred waste management strategies on the waste management hierarchy are expounded upon to address how the region is advancing materials management in these areas. Source reduction and reuse are the most preferred waste management methods. Source reduction, or waste prevention, is defined by EPA as the reduction of the quantity or harmfulness of materials prior to entering the MSW waste stream.34 Under the Texas Health and Safety Code §363.002, it is the “state’s policy to safeguard the health, general welfare, and physical property of the people and to protect the environment by encouraging the reduction in solid waste generation”.35 Directing waste away from landfills, extension of
34 Advancing Sustainable Materials Management: 2013 Fact Sheet, EPA 35 Texas Health and Safety Code, http://www.statutes.legis.state.tx.us/Docs/HS/htm/HS.363.htm#363.004

49
material’s lifecycle, and reducing the consumption of new materials is a cornerstone in preserving landfill capacity and protecting the region’s environment. The redesign of manufactured goods to include less packaging, reducing materials used in the production of a good, changing the way a product is consumed, or extending the life of products and packaging so that less waste is generated are examples of source reduction activities. Source reduction does not require collection or treatment and therefore provides additional benefits over recycling. Keep America Beautiful, an environmental non-profit, gives a succinct explanation of source reduction describing it as shrinking the amount we throw out through changes in the design, manufacture, packaging or use of a product – and using fewer toxics. 36 Many companies have begun using product packaging touted for using less plastic, cardboard, or other materials. Some packaging is also being made with alternative ingredients found to be less toxic to consumers and the environment, such as Bisphenol A (BPA)-free water bottles. As many of these companies have manufacturing facilities and sell their products worldwide, the North Central Texas region benefits from these source reduction strategies. Local businesses, cities, and other agencies are also supporting source reduction by using less toxic materials, purchasing more durable products, or cutting unnecessary items from their purchasing lists. Several cities in Texas have banned single use plastic bags by consumers at all retailers. Bans like this are in their infancy. The bans have many unexpected challenges as well as related benefits. Reducing single use plastic bags have improved efficiency for Material Recovery Facilities (MRFs) near Austin by reducing equipment downtime since implementing the city’s ban in 2013. Some unforeseen initial challenges include increased disposal of reusable bags by residents who had a surplus of reusable bags, sourcing reusable bags from sustainable sources, and use of plastic bags passed on to the consumer.37 In North Central Texas, the City of Denton supports a number of source reduction strategies and emphasizes waste minimization, materials reuse, and maximum material recovery in the city’s sustainability plan, “Simply Sustainable, A Strategic Plan for Denton's Future”. 38 The City coordinates with local partners, including the University of North Texas, Denton Independent School District, Texas Women’s University, and various non-profits to help facilitate the city’s materials management goals. The City expanded its ability to divert waste from the landfill by maintaining a ReUse store to foster material reuse and recycling. The city has very progressive plans to standardize access to recycling programs for every Denton resident in multi-family housing, and all commercial businesses through a Universal Recycling program.
The establishment and expansion of source reduction programs, such as those at the City of Denton, supporting education and outreach to minimize the amount of waste generated, and recovering the maximum economic potential of products through encouraging product reuse and expansion of markets are all initiatives supported by the Regional Plan. Encouraging the commercial and private sectors to adopt source reduction programs, educating these sectors about the economic benefits of source reduction, and providing incentives or recognition programs for these sectors are important objectives of the Regional Plan as well. These sectors are important platforms to reaching and educating additional consumers. The Regional Plan supports expansion and establishment of source reduction and reuse programs by local
36 Keep America Beautiful Source Reduction and Reuse 37 Austin Resource Recovery Results of the Single-Use Bag Ordinance in Austin, Texas June 2015 38 Simply Sustainable, A Strategic Plan for Denton’s Future February 2012

50
governments, commercial sector, non-profits, schools and school districts, and education of consumers as ways to reduce the per capita disposal rates in the region.
5.6 Advancing Materials Management in North Central Texas: Recycling
Recycling converts materials that have carried out their intended use into a commodity that can be used to manufacture new products. Recycled feedstock often costs less and causes less environmental damage than mining and processing new materials. Additionally, recycling facilities provide a positive economic impact by creating jobs. House Bill 2763, passed during the 84th Texas State Legislature, requires TCEQ to conduct a study on the current and potential economic impacts of recycling. The intent of this study will be to provide analysis of the revenue lost by the state and local governments when recyclable materials are disposed of in landfills.39 As stated by TCEQ, the study will address the ongoing recycling activities in the state as well as identify strategies to be used by the private and public sector to increase recycling.40
In 2013, Americans recycled and composted over 87 million tons of materials generated, equivalent to a 34.3% recycling rate.41 This recycling rate is calculated using an approach known as the materials flow methodology.42 As stated in the Texas Health and Safety Code §361.422, the state of Texas set a source reduction and recycling goal of 40% in 1999 that still remains in place.43 However, there are no reporting requirements set by the state for materials that are diverted from landfills, such as from curbside recycling programs, making an accurate recycling rate difficult to calculate.
Figure 22 provides a comparison of the recycling rates calculated for the region, state, and nation. Although the recycling rate for the North Central Texas region has increased by 7% over a five year period, the rates for the region and the state are well below the 2013 national average of 34.3% and state’s source reduction and recycling goal of 40%. The 2010 recycling rate for the North Texas region is similar to the Texas Recycling Data Initiative (TRDI) recycling rate of 18.9%. This first statewide recycling rate was established based on a survey of waste processors in the state and reported that over 6 million tons were recycled in Texas in 2013.44 While the TRDI did not provide a regional recycling rate, this statewide initiative was an important benchmark to establish for the state and provides a foundation upon which to measure the impacts of recycling and other waste management strategies. Table 8 shows the regional recycling rates in 2005 and 2010, established from regional recycling rate studies.45
39 Study on the Economic Impacts of Recycling, TCEQ 40 Study on the Economic Impacts of Recycling, TCEQ 41 Texas Recycling Data Initiative (TRDI), 2015 http://www.recyclingstar.org/wp-content/uploads/2015/02/TRDI_Report_print-0204.pdf 42 Advancing Sustainable Materials Management: 2013 Fact Sheet, EPA 43 Texas Health and Safety Code, http://www.statutes.legis.state.tx.us/Docs/HS/htm/HS.363.htm#363.004 44 Texas Recycling Data Initiative (TRDI), 2015 http://www.recyclingstar.org/wp-content/uploads/2015/02/TRDI_Report_print-0204.pdf 45 NCTCOG, 2011

51
Table 8. 2005 and 2010 Regional Recycling Rates (Source: NCTCOG, 2011)
Year and Category Total Generation
(Tons) Recycling Rate
(%) 2005 Residential 2,822,498 12.2
2005 ICI 7,535,740 17.1 2005 Overall 10,358,237 15.8
2010 Residential 3,100,673 19.0 2010 ICI 5,921,722 23.6
2010 Overall 9,022,396 22.0%
Figure 22. National, State, and Regional Recycling Rates
(Source: NCTCOG, Texas Health and Safety Code, TRDI, and EPA)
5.6.1 Curbside Recycling Analysis
Curbside recycling programs, especially single-stream programs, have become the mainstay of residential recycling programs for many communities across Texas. Of the 60 cities that participated in the 2011 Regional Recycling Rate Update, over 40% stated to have a curbside recycling program.46 The TRDI study, using data from a total of 20 large and local material recovery facilities (MRF), reported that 554,598 tons of curbside recyclable material was processed in Texas in 2013.47 In Texas the average amount of recycled materials generated per household was 503 pounds annually.48
46 NCTCOG, 2011 47 Texas Recycling Data Initiative (TRDI), 2015 http://www.recyclingstar.org/wp-content/uploads/2015/02/TRDI_Report_print-0204.pdf 48 Texas Recycling Data Initiative (TRDI), 2015 http://www.recyclingstar.org/wp-content/uploads/2015/02/TRDI_Report_print-
12.2%
19.0% 18.90%
31.3% 31.4% 32.5% 33.2% 33.3% 33.8% 34.0% 34.7% 34.5% 34.3%
40% 40% 40% 40% 40% 40% 40% 40% 40% 40%
0%
5%
10%
15%
20%
25%
30%
35%
40%
45%
2004 2005 2006 2007 2008 2009 2010 2011 2012 2013
North Central Texas Texas Nation Source Reduction/Recycling Goal for State of Texas

52
Recycling collection is increasingly single-stream rather than source-separated, as it was just a few decades ago. While single-stream adds convenience for users, and consequently increases the volume of recycling collection, single-stream recyclables are more likely to be contaminated than source separated materials. Recycling contamination is any material that is placed in a recycling container that is not intended for collection and may include recyclable materials that are deposited at a location where that material is not accepted for processing. As a result of increased contamination, nationally there has been a 20% increase in the processing costs of recycling, which is being transferred to local governments, residents, and commercial users.49 According to the 2015 TRDI report, the average contamination rate of curbside recyclables is conservatively 13%. Contamination of recyclables increases costs of processing and impairs supplying the demand for recovered materials. As local governments in the region continue to offer single-stream recycling to residents, improving the economic value and environmental benefits of recycling programs requires reducing contamination of recyclables. Market demand of recycled materials increase when they are of a higher quality and larger volume. Providing education to citizens on what is acceptable for curbside recycling is fundamental to collecting valuable materials. According to a 2015 NCTCOG solid waste survey, 41% of respondents indicated that they offered recycling collection, either via city services or through a contract with a private hauler. Another 20% of respondents indicated they provided citizen convenience centers or drop-off locations for their residents to use in lieu of providing collection at homes. Increasing the number of local governments that provide recycling services is an important goal of the Regional Plan. Educating local governments on negotiating recycling contracts, alternatives to providing residential pick-up services, and expanding citizen collection stations are important actions recommended by the Regional Plan to enhance the convenience of recycling in the region. With the varying and sometimes disjointed services available across the region, education and awareness is another important means of promoting the reduction and recycling of municipal solid waste. Regional stakeholders have come together to organize a number of campaigns to enhance and promote the continued use of recycling services in the region. An ongoing educational resource was established as another avenue to disseminate information about recycling and waste reduction as well as the resources available to residents in the North Central Texas region. This regional clearinghouse of recycling information – TimeToRecycle.com – includes an extensive resource map for residents to find information on source reduction, recycling, and solid waste grant information. Since the website’s formation, thousands of North Central Texas residents have visited the website and contributed to regional waste management efforts. The website has evolved with additional information incorporating e-cycling, manufacturer take back programs, and industry specific recycling and source reduction programs and initiatives.
5.6.2 Multi-Family Recycling
Traditionally, recycling programs have been limited to only single-family residences, despite multi-family housing, such as apartments or condominiums, comprising of almost 40 percent of housing in the North
49 The Changing Waste Stream, Waste Management 2014

53
Central Texas region.50 Some cities in the region, have begun to address how residents of multi-family housing are faced with different challenges to recycle such as lack of recycling infrastructure, than single-family residents. Some cities are implementing ordinances mandating that recycling services be provided to residents of multi-family housing. Following the examples of cities such as Austin and San Antonio, the City of Fort Worth adopted a multi-family recycling ordinance in 2011 for complexes with more than 8 units.51 From the time that the ordinance was passed, Fort Worth spent two years planning for implementation. Property owners are required to submit a recycling plan for the city’s approval as well as provide educational materials to inform residents that recycling is available at their complex. Waste management brokers worked with and coached apartment managers on how to successfully execute recycling programs for their complexes. Fort Worth has 99% compliance rate and continues to collaborate with residents and landlords to promote recycling at multi-family complexes. The cities of Allen and Lewisville also require mandatory multi-family recycling programs. Some cities such as the Cities of Cedar Hill, Colleyville, Mesquite, Richardson, and Richland Hills provide multi-family recycling through a franchised arrangement while a few provide drop-off services to their residents such as Mansfield and Mineral Wells. Some multi-family owners are initiating apartment recycling programs due to demand from their residents and to support sustainability initiatives. One example of this effort is the Villas at Chase Oaks in Plano that offers recycling to their residents. The complex collaborated with the City of Plano’s Commercial Recycling Coordinator and Republic Services to provide residents visuals of recyclables and to determine the best locations to place recycling containers.52 Villas at Chase Oaks now has a recycling rate of 35% and has decreased waste disposal costs, leading to other financial benefits such as increased resident renewal rate. Expanding services to multi-family residences was identified as a key initiative In the City of Dallas’ solid waste management plan.53 Although Dallas does not require recycling for multi-family housing, the city has strategically placed recycling drop off bins to provide residents a more convenient opportunity to recycle. Several other cities in the region have tried various programs with multi-family housing complexes with varying degrees of success. As the region grows, the multi-family housing sector will continue to make up a large percentage of what is considered commercial waste services. Expanding existing services and creating new programs that improve recycling convenience will be important to supporting continued improvement of the regional and statewide recycling rate. Supporting the adoption of programs and ordinances that promote multi-family recycling, sharing best practices among communities, promoting public-private partnerships to expand programs, and educating the apartment and multi-family housing industry about the costs and benefits of programs, are important initiatives supported by the Regional plan.
50 NCTCOG. http://www.nctcog.org/ris/census/2010/sf1.asp?Geo=NCTCOG 51 Briefing on Fort Worth Multi-family Recycling Ordinance, Fort Worth 2015 52 Villas at Chase Oaks Recycling, Tina Paysinger 2015 53 City of Dallas Local Solid Waste Management Plan 2011-2060 February 2013

54
5.6.3 Commercial and Special Event Recycling
As previously mentioned, a large amount of waste produced in the region is generated by commercial sources. In 2011, NCTCOG estimated that the industrial, commercial, and institutional (ICI) recycling rate was 23.6%, with paper being the largest component of materials recycled.54 Most commercial waste in industrial, office, and retail buildings have a high amount of cardboard and specific commodities that can be recycled. Based on a 2015 NCTCOG solid waste survey, only 10% of respondents indicated that they require commercial/business recycling programs. Several cities make recycling services available to businesses but do not necessarily require recycling. For example, the City of Allen provides recycling services to all businesses by use of poly carts or bin containers as do several other local governments. Expanding existing and supporting development of new commercial recycling programs is an important initiative supported by the Regional Plan. Commercial institutions constitute a large portion of communities and offer key opportunities to promote recycling to customers as do special event centers such as stadiums and concert venues. Because the region’s commercial sector will grow over the next 25 years, targeting commercial businesses and special event facilities are important actions supported by the Regional Plan to improve recycling rates. Working with local governments to expand recycling services to businesses, educating business owners, working to develop cost-effective approaches to recycling collection, and educating customers are important initiatives to expand recycling at commercial and special event facilities.
5.6.4 Local Government Recycling
While 62% of respondents to a 2015 NCTCOG solid waste survey indicated they provide some type of recycling collection program, it can be assumed that a large percentage of local governments do not offer any form of recycling programs in their communities. Expanding the opportunities for residents and commercial/businesses to recycle in North Central Texas is a high priority for cities and the region. Improving the recycling rate from the 2010 rate of 22% is an important goal of the Regional Plan. Facilitating and bringing together public and private stakeholders to begin to improve recycling collection facilities, building a larger recycling infrastructure, improving education on recycling contracting and negotiation, and educating residents on acceptable recyclables are all important initiatives supported by the Regional Plan to move towards more standardizing recycling services and improving recycling convenience in North Central Texas.
5.7 Advancing Materials Management in North Central Texas: Composting
According to the U.S. Environmental Protection Agency (EPA), the nation discarded 167 million tons of MSW in 2013, almost 30% of which was food and yard trimmings.
A composting facility as per 30 Texas Administrative Code 30 TAC 332 is a facility for processing the stabilized product of decomposition which is used or sold for use as a soil amendment, artificial top soil, growing medium amendment, or other similar uses. Items that can be composted include:
• Feed stock that includes any source-separated meat, fish, dead animal carcasses, oils, greases, or dairy materials; and,
54 NCTCOG, 2011

55
• Operations which incorporate the above with source-separated yard trimmings, clean wood material, vegetative material, paper, or manure.
There are many forms of composting that are available to turn yard waste and other organic materials, including food waste, into useful soil amendments and top soil products.
5.7.1 Yard and Green Waste
According to the 2015 NCTCOG solid waste survey, approximately 70% of respondents indicated they collect yard waste either via municipal, contract, or citizen convenience center/drop-off locations. While many local governments provide opportunities to collect yard waste, there is still a large amount of yard waste ending up in regional landfills. Yard and organic waste provide a large opportunity to recover these items prior to being landfilled. Under the Texas State and Health Code §361.428, incentives have been set in place for composting programs that reduce MSW in the waste stream by 15%. Composting yard waste is one way to recover the materials and use them for an economic benefit. The cities of Denton, Mesquite, and Plano are examples of local governments that have successfully created compost, soil blend, and mulches that can be used for gardens and landscaping. Collection of yard trimmings, clean wood, vegetative material, paper, or manure to produce a product for soil amendment, and top soil prolongs the life span of landfills. Several composting facilities exist in the region to process yard waste that has been collected from cities. Expanding the services available to collect yard waste, expanding resident and business outreach on the availability of options and alternatives, and supporting regional composting infrastructure network are supported by the Regional Plan to reduce the amount of yard waste ending up in the landfill.
Figure 23. Total MSW Discards (by material), 2013 (Source: ASMM: 2013 Fact Sheet, EPA 2015)

56
5.7.2 Food Waste
As shown in Figure 23, food was the single largest component of waste disposed, or 21% of MSW.55 In the United States (US), uneaten food annually accounts for 25% of all fresh water used, 4% of total US oil consumption, 23% of methane emissions. In addition to having an environmental impact, uneaten food is worth an estimated $165 billion/year nationally.56 Food wastes can be diverted from the trash in a multitude of ways beyond composting including, proper portioning of meals, charitable donation, feed for animals, and the rendering of fats, oils, and grease (FOG) for production of biofuels.57 The EPA and the United States Department of Agriculture (USDA) have set forth the first national food waste reduction goal to cut food waste in half by 2030.58 To achieve this goal, the USDA and EPA are collaborating with local, state, schools, and non-profit organizations, the private sector, and other organizations to divert food out of landfills. Diverting food wastes has become especially prevalent for grocery stores, sporting and entertainment venues, and college campuses. The AT&T stadium in Arlington has participated in donating excess food from events to local shelters. The University of Texas at Arlington (UTA) participates in composting the food waste from the on campus dining halls to be used as valuable soil amendment in their organic community garden.59 Developing new programs for food waste (composting) can be expensive and often times existing programs are overlooked and opportunities for collaboration are forgone. The Regional Plan supports the enhancement of partnerships to donate excess foods to a beneficial use and innovative programs and contracting services that or divert food from landfills.
5.8 Advancing Materials Management in North Central Texas: Energy Recovery
As defined by the EPA, energy recovery is the conversion of non-recyclable waste materials into useable heat, electricity, or fuel through a variety of processes. In 2013, the EPA reported that 12.9% of MSW generated was combusted with energy recovery. While a large portion of the waste arriving at a landfill is disposed of in the landfill, some waste is processed for energy recovery. Recognized as a renewable energy source, landfill gas (LFG) is recovered and used for energy and direct-use projects in Texas using various methods North Central Texas has the most active gas recovery facilities of any other region in Texas. Methane is captured at landfills to reduce the amount of greenhouse gases (GHGs) emitted into the atmosphere. In the 2015 survey of local governments conducted by NCTCOG, of the cities that state to be contemplating landfill management alternatives, all responded that they are considering methane capture for power generation. As of 2015, the region has 11 sites that capture methane, shown in Figure 24. According to the EPA Landfill Methane Outreach Program, these sites cumulatively led to avoided emissions of 0.28 million metric tons carbon dioxide equivalent in 2015.60 This is
55 Advancing Sustainable Materials Management: 2013 Fact Sheet, EPA 56 Environmental Protection Agency 57 Advancing Sustainable Materials Management: 2013 Fact Sheet, EPA 58 USDA and EPA Join with Private Sector, Charitable Organizations to Set Nation's First Food Waste Reduction Goals, USDA http://www.usda.gov/wps/portal/usda/usdahome?contentid=2015/09/0257.xml 59 UT Arlington’s Food Recovery Challenge, 2014 60 EPA, LMOP Benefits of LFG Energy Projects. http://www3.epa.gov/lmop/benefits/index.html

57
equal to the annual GHG emissions of 99.7 tons of landfilled waste, equivalent to the GHG of 58,568 passenger vehicles or 662.3 million miles driven61. Most often, captured methane is used as an electricity source for other facility needs. One example in the region includes a partnership between the Cities of Arlington and Fort Worth to power Fort Worth’s Village Creek wastewater treatment plant with methane captured from the Arlington landfill. In some cases, methane can also be processed into renewable natural gas fuel to power vehicles, which can then fuel the refuse haulers which bring waste to and from the landfill. The City of Dallas’ McCommas Bluff Landfill is the largest of only three such sites in the country owned and operated by Clean Energy; it can produce 60,000 gasoline-gallon-equivalents of renewable natural gas each day. According to the California Air Resources Board, this fuel can reduce carbon emissions up to 90% compared to diesel or gasoline. Production of LFG can be accelerated using anaerobic digestion. Enhanced Leachate Recirculation (ELR) increases the rate of gas generation and allows for more onsite electricity production, while also decreasing the time for landfill stabilization. Cities receive income from these projects both in the form of carbon credits as well as energy sales. Several of these facilities were developed as a result of public/private partnerships between cities and energy companies demonstrating the value of LFG among various stakeholders. Under those arrangements, cities have the opportunity to provide little or no capital in LFG collection infrastructure.62 The DFW Recycling and Disposal Facility processed the most LFG in 2013 and sold over 30 million kilowatts. Table 9 provides additional information on the amount of gas processed at each facility. New and innovative technologies not only help local governments handle existing materials effectively and efficiently as well as increase landfilled materials, these technologies can also be more cost effective over the long term compared to outdated equipment. With cost being the prevalent hurdle to expanding waste management programs, investment in innovative technologies can assist local governments in reducing expenses over the long-term and support source reduction and recovery. Technologies can also be utilized by landfills to recover gas for a beneficial use. By utilizing enhanced leachate recirculation (ELR), the City of Denton Landfill’s system generates enough methane gas to power the equivalent of 3,000 homes. Additionally, the Texas Administrative Code does have specific rules for landfills utilizing leachate and gas condensate recirculation that owners and operators would be required to be in compliance with. Education programs and workshops for operators on filing the necessary permit applications for ELR projects may help increase energy recovery in the region. The Regional Plan supports the evaluation and adoption of additional energy recovery programs and projects in North Central Texas to utilize LFG and recover the economic potential of this fuel but also improve air quality by reducing emissions.
5.9 Advancing Materials Management in North Texas: Waste Treatment and Disposal
The treatment and disposal of waste is the least preferred method of waste management in the waste management hierarchy. When reducing, recycling, composting, or retrieving energy from the waste is not a viable option, treatment and disposal is required.
61 EPA, GHG Equivalency Calculator, http://www.epa.gov/cleanenergy/energy-resources/calculator.html 62 EPA, LMOP Texas Landfill Gas Energy Workshop. http://www.epa.gov/lmop/workshops/tx-workshop.html

58
Figure 24. Active Gas Recovery Facilities in North Central Texas (Source: TCEQ, 2013)
5.9.1 Grease and Grit Traps
Several facility types in the North Central Texas region exist to treat and dispose of wastes that are hard to manage. These include grease and grit traps. Other wastes such as grease and grit are transported as wastes from facilities such as restaurants, car washes, or industrial facilities. Grease and grit traps or interceptors are required at facilities to protect the municipal wastewater systems and prevent grease and other potentially hazardous wastes from entering the sewer or wastewater stream. Liquid waste as defined by TCEQ is “any waste material that is determined to contain ‘free liquids’.” Liquid waste processing facilities treat grease trap waste, grit trap waste, sludge and septage. Liquid Transfer Stations are characterized, per TCEQ, as a MSW Type V Facility that processes only grease trap waste, grit trap waste, septage, or a combination of these three liquids. In 2013, the region had five liquid waste processing facilities and two Liquid Transfer Stations. As shown in Table 10, the total tons of liquid waste handled by these facilities in 2013 was 354,239 tons.

59
Table 9. Gas Process and Power Generated by Active Gas Recovery Facilities in 2013 (Source: TCEQ, 2013)
Site name County Gas processed (ft³)
Gas Distributed Off-site (ft³)
Power Generated and Used (kilowatt hours)
Power Generated and Sold (kilowatt hours)
McKinney Landfill Collin 0 0 22,322,150 21,491,965 McCommas Bluff LFG Processing
Facility Dallas 2,887,530,000 1,740,698,000 0 0
Trinity Oaks Landfill Dallas 432,012,776 0 15,997,100 1,044,800 Waste Management Skyline Landfill Dallas/
Ellis 864,344,000 0 38,752,928 2,041,072
DFW Recycling and Disposal Facility Denton 1,818,508,080 0 73,374,176 32,566,657 City of Denton Landfill Denton 286,119,523 0 4,817 13,517,976
Camelot Landfill Gas to Electric Facility
Denton 0 0 25,095,897 24,168,789
IESI Turkey Creek Landfill Johnson 556,918 278,459 0 0 Fort Worth Methane Tarrant 267,426,174 0 473,150 11,125,000
Landfill Gas Processing Plant Tarrant 653,829 653,829 0 0 Westside Landfill Gas To Electric
Facility Tarrant 719,896,000 0 31,411,995 1,343,288

60
Table 10. Liquid Waste Disposal and Processing Facilities and Liquid Transfer Stations in North Central Texas Region
(Source: TCEQ, 2013) Permit Site Name County Type 2013 Tons
1421 PSC Recovery Systems Dallas 5GG 55,265
2069A Liquid Environmental Solutions of TX Dallas Facility
Dallas 5GG 121,119
40080 Harrington Environmental Liquid Transfer Station
Johnson 5TL 4,000
1225D Cold Springs Processing & Disposal Tarrant 5GG 76,558
2256 Southwaste Disposal Dallas Facility Tarrant 5GG 89,077
2379 Liquitek Arlington Liquid Waste Facility
Tarrant 5GG 8,220
Total 354,239
5.9.2 Household Hazardous Waste Household Hazardous Waste (HHW) is another important waste category that must be collected and treated due to human and environmental safety and health concerns. HHW is further addressed in Chapter 6 of the Regional Plan.
5.9.3 Illegal Dump Sites
Illegal dumping continues to be a significant challenge in North Central Texas. In 2012 and 2013, cities and counties in North Central Texas that received TCEQ funds to help clean up illegal dump sites reported removing 15,630 pounds of waste. This is just a small portion of the communities that are struggling with this waste management issue. Some of the larger communities in the region spend millions of dollars annually cleaning up litter and illegal dump sites. Illegal dumping also contributes to other environmental and health and safety concerns such as mosquito breeding and water pollution. Many counties and cities have enforcement programs to curb illegal dumping because the cleaning of illegal dump sites and prosecution of illegal dumpers is a high-cost action local governments must incur to keep their communities clean and safe. Illegal dumping is pervasive in the region because as a NCTCOG study revealed, illegal dumpers are not willing to pay the cost of proper disposal and perceive the risk of being caught as low. Additionally, conviction of this environmental crime often involves low fines, and do not serve as a substantial deterrent. Furthermore, because of the rapid growth rate of many communities that were once rural and are now suburban, illegal dumping activity has increased from on-going construction projects and additional residents. In response to the statewide challenge of illegal dumping, the Texas Litter Abatement Act (Texas Health and Saftey Code, Chapter 365) was amended. The amendement added jail time and felony charges for amounts that reached a certain weight threshhold of commercial and non-commercial dumping. North Central Texas cities and counties to date have used TCEQ funding towards start-up environmental enforcement programs, surveillance cameras, preventative signage, environmental crimes trainings for enforcement officals, and educational activities. Site cleanups are also part of many local government initatives.

61
Regionally, an illegal dumping hotline was established for callers to anonymously report illegal dump sites. The reportDFWdumping.org website serves as a regional illegal dumping resource to be used and promoted by local governments to report and provide education about illegal dumping and offer proper disposal alternatives for a variety of waste commodities. Supporting education and training of law enforcement and the public and encouraging the adoption of preventative programs within local governments are important initiatives supported by the Regional Plan to begin to address the challenge of illegal dumping. Illegal dumping affects both urban and rural communities in the region and is an important challenge to continue to pursue to maintain and improve quality of life.

62
Chapter 6: Advancing Source Reduction and Recycling of Other Wastes

63
6.0 Advancing Source Reduction and Recycling of Other Wastes
While source reduction, recycling services, and infrastructure do exist in the region to process many different waste streams, some waste streams have been identified as priority opportunities for additional source reduction, recycling, and infrastructure expansion efforts. Based on feedback from 2015 solid waste survey, most local entities would like to see NCTCOG and other stakeholders focus on improving take-back options for specific items. These other waste streams have been identified by local governments and other solid waste stakeholders as key areas to focus regional efforts to establish and/or expand initiatives. The categories of other wastes identified and discussed as priority areas include:
• Construction and Demolition Debris • Electronic Materials • Household Hazardous Waste • Medical Waste • Pharmaceutical Materials • Textile Materials • Tires
These seven other wastes are important areas of focus for regional waste management initiatives. Expanding partnerships and identifying regional opportunities to address these other waste challenges are important to achieving regional goals and are supported by the Regional Plan objectives and action recommendations.
6.1 Construction and Demolition Debris
Materials are often generated in the construction, demolition, and renovation of residential and commercial buildings.63 A significant fraction of residential renovation debris is discarded by homeowners into the household trash and disposed of in Municipal Solid Waste (MSW) landfills. Discarded items include replacement plumbing, electrical fixtures, lumber, and other building materials used in home repair or improvement projects. These materials are often bulky and take up large amounts of space, or capacity, in landfills. The Environmental Protection Agency (EPA) defines construction and demolition (C & D) debris as materials generated during the construction, renovation, and demolition of buildings, roads and bridges. C & D waste often contains bulky, heavy materials that include: • concrete • wood (from buildings) • asphalt (from roads and roofing shingles) • gypsum (the main component of drywall) • metals • brick
• glass • plastics • salvaged building components (doors,
windows, and plumbing fixtures) • trees, stumps, earth, and rock from clearing
sites
63 Texas Recycling Data Initiative (TRDI), 2015 http://www.recyclingstar.org/wp-content/uploads/2015/02/TRDI_Report_print-0204.pdf

64
According to the TCEQ, in 2013 landfills in the state diverted 312,881 tons of C & D material from the solid waste stream in Texas, comprising 24% of the total tons diverted by landfills.64 The North Central Texas region contains three Type IV landfills, which accept only brush, C & D material, and other non-decaying wastes. Cumulatively, the three Type IV facilities in the region accepted 541,083 tons of materials in 2013, with the IESI Fort Worth C & D Landfill receiving approximately 350,000 tons of waste. Currently the IESI Fort Worth C & D Landfill is in the process of requesting a TCEQ permit amendment for vertical expansion to extend the landfill’s remaining years. Aggregately the region’s 21 landfills reported diverting over 70,000 tons of C & D material in 2014, 20% of all materials diverted by landfills. C & D material recovery facilities (MRF), as well as various landfills with onsite C & D recycling set-ups, are the principal recyclers of C & D material. Recently, the TRDI survey estimated that over 2 million tons of C & D material was recycled in Texas in 2013.65 NCTCOG estimated that from September 2009 to August 2010, over 12,800 tons of C & D materials were recycled by residents in the region while ICI sources recycled over 70,000 tons of C & D materials, roughly 2% of all residential recycling and 5% of total ICI recycling, respectively.66 Several C & D facilities do exist in North Central Texas including a C & D transfer station/MRF in the City of Celina, a facility at the City of Dallas McCommas Bluff Landfill, and onsite concrete crushing at the City of Denton Landfill. Several private companies in the region such as Big City Crushed Concrete offer recycling services for C & D material. Local governments are also addressing this challenge through the adoption of building codes and ordinances. Since 2007, the City of Frisco’s Green Building Program requires all new commercial and multi-family structures to recycle all C & D waste. The city prohibits concrete and metal from landfill disposal and all unused concrete and metal is separated and sent to a city approved recycling facility. The City of Dallas also has a green building program that requires half of waste material from building projects be diverted from landfills and that 45% of building materials is recycled, recyclable, locally sourced or bio-based.67 The ordinance was implemented in two phases and applies to businesses as well as multi-family housing.68 The City of Plano provides developers a monetary incentive to divert C & D debris. Builders that utilize recycling bins provided by the city have the opportunity to receive a refund on their mandatory building deposit.69 Newly constructed buildings that achieve a 60% diversion rate will be refunded their entire deposit. C & D debris must be recycled at one of the city’s approved recycling facilities or builders may face a penalty. Plano’s commercial recycling program diverted 59,000 tons of C & D debris in fiscal year 2014 while program participants received a refund as well as reducing disposal costs.
64 Municipal Solid Waste in Texas: A Year in Review, TCEQ 2013 65 Texas Recycling Data Initiative (TRDI), 2015. http://www.recyclingstar.org/wp-content/uploads/2015/02/TRDI_Report_print-0204.pdf 66 NCTCOG, 2011 67 Green Building Ordinance Overview. City of Dallas, 2013. 68 Green Building Ordinance Overview. City of Dallas, 2013. 69 City of Plano Commercial Recycling Construction & Demolition Debris Recycling Deposit Program.

65
Increasing the recycling rate for C & D materials is an important focus of regional waste management efforts. Addressing the challenge of this bulky waste being landfilled is important to reduce disposal rates and increase recycling of this material to recover the waste’s economic value. Initiatives such as the adoption of ordinances, programs, and infrastructure expansion are important to achieving these goals and are recommended by the Regional Plan. C & D materials are a valuable commodity that can be easily recycled into a new product. The Regional Plan promotes the recycling of C & D material not only to conserve landfill capacity but to also to support local markets for recovered goods. 6.2 Electronic Materials While generation of some traditional materials may be declining, the generation of electronic materials (or e-materials) are considered to be one of the fastest growing waste streams in the world with a 3% to 5% estimated annual growth rate.70 The EPA estimates that currently, the average American household uses 24 electronic products, with that number expected to grow as new technology develops.71 As consumers frequently upgrade their phones and computers to the latest technology, the problem arises of what to do with their obsolete products. Many components of electronics are rare earth materials (e.g. gold, lead, and palladium) that could help develop a greater demand for recycled materials rather than use of virgin materials. Potential revenue from recycling electronics initially could reach $2.4 billion.72 Electronics are also comprised of toxic materials that may contaminate soil and water if disposed of in landfills, making proper management of electronic materials at the end of the lifecycle crucial.
While the amount of electronics entering the waste stream is growing, the recycling of electronics remains low. In 2013, only 47,271 tons of electronics were recycled in the state of Texas, making electronics less than 1% of total materials recycled.73 In 2014, landfills in the North Central Texas region diverted 446 tons of electronic materials.74
Technology companies are contributing to increasing recycling practices by improving the ease of
recycling these materials and adopting new green purchasing practices criteria. Efforts to improve electronic waste source reduction and reuse are important and include product refurbishment to extend a product’s lifetime and donation to reuse stores such as Goodwill.
Although Texas law now requires television and computer-equipment manufacturers to offer end of life recycling opportunities to consumers, take-back programs only apply to residents and any electronics collected are disposed rather than reused. Additionally, there have been inconsistencies in the services provided by retailers and a lack of convenient take back opportunities may deter consumers from handling unwanted electronics responsibly. To fill some of the gaps in available electronic recycling services, cities in the region have partnered with private sector electronic recycling companies to provide recycling services to residents. Most cities that provide electronic recycling services do not charge residents.
70 Cucchiella, et al. Recycling of WEES: An economic assessment of present and future e-waste streams. June 1, 2015. Renewable and Sustainable Energy Reviews. 71 Sustainable Materials Management Electronics Challenge. EPA, 2015. 72 Cucchiella, et al. Recycling of WEES: An economic assessment of present and future e-waste streams. June 1, 2015. Renewable and Sustainable Energy Reviews. 73 TRDI, 2015. 74 TCEQ Central Registry Query, 2015

66
Due to increased awareness of e-materials being dumped in developing countries, tools are available to ensure that electronics are taken to responsible recyclers. R2 and e-Stewards certifications are standards that help consumers know that they are utilizing a responsible recycler. Their websites help individuals locate recyclers that follow best management practices for end of life recycling electronics. A few examples of recyclers in the region that meet these standards are ECS Refining, GEEP international, United Electronic Recycling, and Universal Recycling Technologies. Because the use of technology and expansion of product availability will continue, improving the recycling infrastructure available for this waste will continue to be important as population growth contributes to additional production of electronic waste. Efforts to increase education about options such as repairing, reselling, donating, or recycling used electronics are an important and are supported by the Regional Plan. Additionally, supporting existing and new partnerships to address the need for additional take back locations and local and regional collection events are efforts that will improve community awareness and responsible electronic recycling.
6.3 Household Hazardous Waste
Household hazardous waste (HHW) facilities offer the ability to dispose of materials that cannot otherwise be disposed of in landfills. HHW is defined as “Any solid waste generated in a household by a consumer which, except for the exclusion provided in 40 Code of Federal Regulations (CFR) §261.4(b) (1), would be classified as a hazardous waste under 40 CFR Part 261.”75 The term has the same meaning as "hazardous household waste." HHW typically includes, but is not limited to, items such as:
• Corrosive cleaners (such as drain cleaner and lye-based oven cleaner) • Fluorescent light bulbs (including CFLs) • Fuels (gasoline, propane, diesel) • Mercury • Paints (oil-based or some anti-mildew latex) • Pesticides • Pool chlorine and acid • Wood stains or varnishes
Texas Health and Safety Code §361.023, concerning hazardous waste, attests that it is the state’s goal to reduce the generation of HHW through source reduction and recycling or reuse.76 TCEQ reported that in 2014, 7,272 tons of HHW were collected in the state of Texas, almost 20% more than in 2013. Although the total number of tons collected increased between 2013 and 2014, the amount of HHW being reused declined. Statewide, 461 tons of HHW was reused in 2014 compared to 497 tons in 2013. In 2014, the North Central Texas region collected 50% (3,612 tons) of the total statewide amount from permanent facilities and mobile collection stations. Of the total collected only 130 tons was reused. The collection of HHW has increased in the region considerably over the past decade. While one-day collection events continue to play an important role in supporting regional improvements in HHW collection, the region
75 Texas Health and Safety Code, http://www.statutes.legis.state.tx.us/Docs/HS/htm/HS.363.htm#363.004 76 Texas Health and Safety Code, http://www.statutes.legis.state.tx.us/Docs/HS/htm/HS.363.htm#363.004

67
has moved to a more permanent means of collecting HHW. Since 2010, the region has grown from two permanent HHW facilities to four, shown in Figure 24. These facilities are located in Dallas, Lewisville, Fort Worth, and Greenville and serve a large population and geography as demonstrated by Table 11. The Greenville location was the first rural HHW collection center in the region and a fifth permanent HHW facility is currently under construction in Mansfield. Local governments are responding to the need to provide a variety of alternative HHW disposal solutions. In addition to permanent HHW facilities, some cities offer curbside collection of HHW. For example, the City of Denton offers HHW curbside collection to all residents in single-family homes as well as multi-family residences. As the region continues to grow, there is an increasing need for HHW disposal. As a result, more local governments are offering alternative disposal solutions which helps to minimize such waste from entering landfills and water systems. More local governments have established permanent collection sites to provide citizens the opportunity to dispose of their HHW year round, however, additional disposal services are needed in the rural areas of the region. Furthermore, enhancing education and outreach about the importance of proper disposal and disposal options is important to increasing the amount of HHW collected in the region. Improving the amount of collected HHW that is reused to create new goods and supporting partnerships to improve the convenience of HHW recycling through infrastructure expansion are included as priorities in the Regional Plan.
Figure 25. Permanent Household Hazardous Waste Facilities in North Central Texas (Source: NCTCOG, 2015)

68
Table 11. Communities Served by Permanent Household Hazardous Waste Facilities
(Source: NCTCOG, 2015) Facility Location
Communities Served
Dallas Addison, DeSoto, Farmers Branch, Highland Park, Mesquite, Rowlett, Seagoville, University Park, Dallas, Duncanville, Garland, Irving, Richardson, Sachse, Sunnyvale, Unincorporated Dallas County
Fort Worth Arlington, Azle, Bedford, Benbrook, Burleson, Cedar Hill, Cleburne, Colleyville, Crowley, Dalworthington Gardens, Decatur, Forest Hill, Fort Worth, Glenn Heights, Godley, Grand Prairie, Grapevine, Haltom City, Haslet, Hood County, Hurst, Johnson County, Joshua, Keller, Kennedale, Lake Worth, Lakeside, Mansfield, Midlothian, North Richland Hills, Oak Leaf, Pantego, Parker County, Richland Hills, River Oaks, Roanoke, Saginaw, Sherman, Southlake, Trophy Club, Unincorporated Tarrant County, Upper Trinity Regional Water District, Watauga, Waxahachie, Weatherford, Westlake, Westover Hills, Westworth Village, White Settlement
Greenville Caddo Mills, Campbell, Commerce, Unincorporated Hunt County, Greenville, Lone Oak, Quinlan, Union Valley, West Tawakoni, Wolfe City
Lewisville Lewisville 6.4 Medical Waste It is estimated that in the region, 5 out of the top 10 largest employers at a single location are healthcare related facilities.77 The healthcare industry is a key economic sector in the region; one that is constantly expanding as additional hospitals, clinics, and doctor offices are built to service the healthcare needs of a growing population. While healthcare institutions are an important component of communities, these facilities can general a large amount of waste. For example, hospitals are one of the largest generators of medical waste, but also produce electronic and food waste.78 The medical waste produced by these facilities is identified as either untreated or treated by the Texas Administrative Code. Most treated medical waste may be disposed of in a MSW Type 1 Landfill. Many private solid waste service providers handle the transport of medical waste from healthcare facilities. Of the total amount of waste generated by healthcare activities, about 80% is general waste. The remaining 20% is considered hazardous material that may be infectious, toxic or radioactive.79 Because of the amount of medical waste produced by healthcare facilities is so great and the processing facilities for medical waste are limited in the region, reducing medical waste and expanding professing facilities for medical waste are important challenges to be addressed in the future. Over 30% of respondents in the NCTCOG 2015 solid waste survey indicated they desired more increased collection programs and outreach targeting medical waste reduction.
6.5 Pharmaceutical Materials Proper disposal of medications that are no longer needed or expired is challenging, especially since mismanagement poses a risk to public safety and environmental quality. A lack of disposal options may incline residents to leave unused pharmaceuticals in their homes. Unintended consequences of storing
77 NCTCOG, 2015 http://www.nctcog.org/ris/demographics/majemp.asp 78 Alijabre, Salih. 2002. Hospital Generated Waste: A Plan for its Proper Management. 79 WHO Waste from health-care activities, 2015

69
medications at home include drugs falling into the hands of children or substance abusers. Improper disposal of pharmaceuticals takes a variety of forms including flushing medications down the toilet or washing them down the sink. This disposal method impacts the water as it is treated at wastewater treatment plants.
Because the improper disposal of pharmaceuticals is a challenge for residents in communities around the region, many communities have participated in drug collection programs sponsored by agencies such as the Drug Enforcement Agency (DEA). Some police departments now provide collection boxes for residents to dispose of their unused/unwanted medications.
Other actions at the federal and state level have occurred to begin to address the regulatory issues with pharmaceutical take backs and reuse. For example, the Drug Enforcement Agency (DEA), authorized by the Safe and Secure Drug Disposal Act of 2010, helped to develop regulations to allow non-DEA registrants (long-term care facilities) to dispose of unused controlled medications.80 Alameda County, California developed an innovative law titled the Safe Drug Disposal Ordinance, requiring drug manufacturers to cover the costs of pharmaceutical take-back programs as well as safely dispose of the medications collected. Since the 2012 law was approved in Alameda, other local governments have adopted similar rules holding drug manufacturers responsible for the end-of-life management of their products.81
Reusing medication is another option that some communities are exploring to reduce pharmaceutical waste. According to a New York Times poll, 75% of Americans have left a prescription unfilled due to cost.82 In Oklahoma, the Utilization of Unused Prescription Drug Act allows for unused and unexpired medications to be recycled and put to a beneficial use. The Tulsa County Medical Society developed a pilot program that transfers prescriptions donated from assisted living centers and nursing homes to the Tulsa County Pharmacy for redistribution to patients unable to afford prescriptions. Operating on less than $6,000 annually, the Tulsa County Recycled Medications Program has reused over $16 million worth of drugs since its inception in 2004. Not only does the program divert pharmaceuticals from contaminating water and landfills, it also reduces healthcare costs attributed to uncontrolled illnesses.
In 2001, the Texas Drug Donation Program was enacted and allows individuals, manufacturers, and sellers to donate unused prescription medications to charitable medical clinics that dispense drugs to financially disadvantaged persons for no or reduced cost. Very strict safety rules apply to the drug donation programs and many may not be aware of this program nor fully exploring the possible partnerships and impacts this type of program could have on reuse of pharmaceuticals.
Developing a solution to this complex and challenging problem of pharmaceuticals and proper disposal of medications is a priority for the region to address. Many communities have taken advantage of drug collection or take-back events and some now provide 24-7 secure drop-off locations at city facilities, such as
80 Senate Bill 3397 111 Congress, Second Session 81 Product Stewardship Institute, U.S. Supreme Court Decides Not to Hear Pharmaceutical Industry Case Against Drug Disposal Law accessed: http://www.productstewardship.us/news/233389/U.S.-Supreme-Court-Decides-Not-to-Hear-Pharmaceutical-Industry-Case-Against-Drug-Disposal-Law.htm 82 New York Times, How the High Cost of Medical Care is Affecting Americans, 2014 accessed: http://www.nytimes.com/interactive/2014/12/18/health/cost-of-health-care-poll.html

70
police departments. Developing innovative, regional solutions that can address this challenging waste type will be an ongoing initiative supported by the Regional Plan.
6.6 Textile Recycling
The state of textile recycling is evolving in the U.S. and although the average American buys five times as much clothing as they did in 1980, only 15 percent of used clothing is recycled or donated. This leaves an average of 10.5 million tons of textiles dumped in landfills each year. Textiles account for 5% of all landfill space and the average U.S. citizen throws away 70 pounds of clothing and other textiles annually. Recently, North Central Texas has expanded recycling of textiles. This primarily has been in the form of local unmanned drop off locations that support the re-use or recycling of these items. These recycling containers accept clothing, shoes, toys, and household textiles regardless of its current state. Once textiles are sent for recycling, approximately 45% is resold to thrift stores, 30% are cut and used as rags, 20% are ground down and repurposed (e.g. attic insulation, carpet pads), and the remaining 5% is landfilled. Curbside textile recycling has become a viable service to provide an additional opportunity to reduce landfilled materials and increase collection of profitable recyclables. The only city in the region known to be considering curbside textile recycling is Plano. Other major cities in the region seek to connect their residents with non-profit and private companies that can pick up the recyclables and keep the items out of the landfill. Reuse opportunities such as Goodwill, thrift stores, and web-based platforms that encourage the re-use of textiles and other goods that are no longer wanted could be important partners in the region to continue to expand source reduction and landfilling of these items.
6.3 Tires
Tire disposal is a substantial waste problem in the state of Texas and an estimated 24 million tires were illegally dumped in Texas in 2012.83 In 2014 almost 260 tons of tires was diverted by landfills in the region.84 Additionally in 2012 and 2013, communities and counties in North Central Texas that received regional solid waste grants from NCTCOG reported collecting 29,500 used tires for reuse or recycling. The TCEQ oversees the collection, processing and recycling or disposal of over 22 million tires discarded each year in Texas. The large quantity of tires being illegally dumped not only degrades the environment but also endangers public health by serving as a breeding ground for mosquitos. Under the Texas Administrative Code, scrap tire generators and transporters that meet certain requirements must register with the TCEQ.85 Authorized scrap tire facilities process tires by retreading, shredding, or conversion to energy. Beneficial end uses for processed tires include land reclamation projects, erosion control, and sports surfaces. Proper management of used and scrap tires, including recycling and other beneficial end uses, improves the environment and public health.
83 Texas Association of Regional Councils Latest Regional Solid Waste Grants Program Funding Report, accessed 08/11/15 http://www.txregionalcouncil.org/display.php?page=solidWaste.php 84 TCEQ Central Registry Query, 2015 85 Scrap Tire Management in Texas, TCEQ 2015

71
Results of a survey of local governments and private industry conducted by NCTCOG determined that tires are the item most commonly banned from landfills in the region and also are the item that most local governments would like to see expanded collection opportunities and outreach focused on. Lack of disposal options may contribute to the amount tires being dumped illegally. More options for proper disposal as well as public education are necessary to prevent the illegal disposal of tires.
6.8 Summary
While regional trends in waste generation, disposal, and recycling continue to evolve, efforts at the regional and local level to provide resources for residents and the business community to enhance and increase recycling and composting will continue to be a key goal of regional stakeholders and partners involved in waste management. Further, partnerships and education to encourage greater source reduction are priority areas of interest to continue to pursue and emphasize as the region continues to grow. Additionally, sustainable materials management or the idea that incorporates the use and reuse of materials in the most productive and sustainable ways across their entire life cycle will be a focus in future waste management initiatives. A process for benchmarking and evaluating of current regional source reduction efforts that is consistent throughout the region will need to be established. This information will allow local governments to track their waste reduction efforts and compare progress to other cities in the region. Consistency with the state’s and the EPA’s reporting methodology will allow regional analysis to be compared to the national and state level when measuring progress. The 2005 and 2010 NCTCOG regional recycling rate provides a point reference in which cities in the region can use to measure the success of recycling programs. It is encouraged that municipalities maintain the same methodology found in those studies so that remain pertinent.
Identifying and creating opportunities for cities to collaborate with each other, stakeholders, and industries improves the chances for waste reduction and increased reuse, diversion, and recycling of materials. In rural areas, cooperation on the county level can result in expanded services that are more cost-effective than initiating projects in individual cities. As more people move to the Dallas-Fort Worth region, the existing landfills in urban areas will accommodate the solid waste demands produced by population growth. The limitations of landfill expansion make source reduction, reuse, and recycling vital for the longevity and health of the metropolitan region. In many cities, curbside recycling infrastructure is underutilized and increased education is necessary to meet waste reduction goals.86 Rapidly growing regions are also pressed to develop solid waste infrastructure to process materials produced by population growth. Local governments’ expansion of recycling programs has started to include options in addition to curbside programs. Based on the results of a survey conducted by the NCTCOG, local governments and organizations view cost as the biggest barrier to expanding solid waste programs. Coupled with the cost is the lack of markets available to sell the materials to recoup costs for many cities.
86 Curbside Value Partnership 2015 http://recyclingpartnership.org/

72
Rural areas in the region struggle with illegal dumping crimes triggered by a lack of collection sites and enforcement of laws. Respondents of a survey conducted by the NCTCOG expressed that a lack of enforcement was the biggest hurdle to addressing illegal dumping. A more comprehensive approach to reducing illegal dumping in rural areas necessitates collaboration at the county level or with larger cities to establish recycling infrastructure in underserved areas. The hub and spoke model, used by the New Mexico Recycling Coalition, allows small communities to deliver recyclables to larger cities, increasing effectiveness of the program and reducing transportation costs, and serves as a model to rural communities. Based on survey results, expanding solid waste programs is cost prohibitive and additional funding as well as more efficient operations can boost opportunities to increase recycling, source reduction, and reuse of materials. According to a NCTCOG study in 2011, residential waste only makes up about a third of all waste generated, making cooperation with industrial, commercial, and institutional (ICI) waste producers key to waste reduction. There is one material recovery facility (MRF) for concrete recovery in the region, but also some private companies in the region recycle concrete that can be used for a variety of purposes such as road topping material or backfilling a retaining wall. As the region continues to grow and sustains waste diversion and recycling goals, the need for more disposal facilities in the region will increase. Emerging waste streams require new infrastructure capable of handling materials safely and efficiently. Unintended consequences may arise it there is not adequate infrastructure to handle diverted waste.

73
Chapter 7: Conclusion

74
7.0 Conclusion
The North Central Texas region is expected to experience more than 50% growth by the year 2040. This large growth in population and employment will bring new businesses, schools, and many other facilities and institutions that elevate the importance of providing sufficient and expanded infrastructure to appropriately manage municipal solid waste. This high level of growth will also necessitate the establishment and expansion of source reduction, recycling and composting, and other diversion strategies and programs. Evolving solid waste management and planning from a focus on waste disposal to a more complete materials management perspective will support long-term reduction in disposal rates. Based on feedback from the 2015 solid waste survey, the top challenges for local governments include:
• Costs of providing alternative collection and disposal services • Bulky items and yard waste • Illegal dumping • Tires
Among some of the top priority actions that the Regional Plan supports for long-term advancement of materials management and to address the aforementioned challenges in North Central Texas include:
• Supporting regional, local government, non-profit, and private sector waste diversion initiatives at all levels of the waste management hierarchy
• Enhancing education and outreach to local governments, general public, businesses, special event centers, and other partners to establish or improve source reduction, recycling, and composting programs
• Supporting regional opportunities and partnerships to develop and sustain new markets that serve to expand the economic value of waste
• Establishing and expanding urban and rural infrastructure to create a regional network of facilities, collection centers, etc. that serve to make source reduction, recycling, composting, and proper disposal of household hazardous wastes more convenient
• Supporting work with manufacturers and designers to develop packaging and products that are more sustainable throughout their life-cycle
• Supporting public-public and public-private partnerships that produce greater cost-effectiveness and improve waste management services and expand waste reduction options
• Supporting a regional forum for the advancement of materials management programs and projects in North Central Texas through the provision of regional technical assistance and tools, clearinghouse of funding opportunities, administration of grants, and provision of education and outreach opportunities to local governments and other partners
• Measuring and tracking key regional indicators
With over 160 cities in the North Central Texas region, many opportunities exist to advance sustainable materials management strategies through partnerships with other local governments and with the private and non-profit sectors. The Resource Conservation Council, with administrative support from the North

75
Central Texas Council of Governments, will provide a forum for the development of regional initiatives that can be supported by local governments and others to advance materials management programs and reduce per capita disposal rates in the region. These initiatives will become increasingly important as the region grows and consumers continue to purchase and discard wastes. The Regional Plan supports many important initiatives that will lead to the provision of enhanced waste management alternatives and options to a growing population and the long-term maintenance of the high quality of life for existing and future residents in the North Central Texas region

76
Chapter 8: North Central Texas Materials Management Implementation Plan

77
Chapter 8. North Central Texas Materials Management Implementation Plan
The implementation section lays out the critical programs and initiatives necessary to realize the goals and policies of the Regional Plan. Table 12 organizes the recommended steps or actions by goal areas, identifies the waste management hierarchy element addressed, and potential partnerships to achieve the actions and goals. The goals, objectives, and recommended actions provide a roadmap for the North Central Texas Council of Governments (NCTCOG) and other stakeholders to collaborate to implement regional and local government policies, plans, and programs to achieve positive outcomes and advance materials management in North Central Texas.
• Source Reduction and Recycle (SRR) • Recycling and Composting (RC) • Energy Recovery (ER) • Treatment and Disposal (TD)

78
Table 12. Regional Plan Goals, Objectives, and Action Recommendations
Action Recommendations Waste Management Hierarchy Element
Other Key Partners
Regional Goal: Support Materials Management Education and Training Objective: Support outreach and education programs to facilitate long-term increases in source reduction, reuse, and recycling Promote the exchange of information and education between local governments, private sector, public, and other stakeholders about regional source reduction, reuse, recycling, product stewardship, and other appropriate and emerging materials management topics
SRR; RC Cities, counties, non-profits, waste
associations and industry, business/private sector
Support the use of popular technologies and media to market and educate the public and commercial sector for special waste collection events, recycling programs, and proper disposal methods for toxic materials
SRR; RC; TD Cities, counties, non-profits, waste
associations and industry, business/private sector
Support targeted outreach and education programs to major employers and employment centers
SRR; RC; TD Cities, counties, non-profits, waste
associations and industry, business/private sector
Objective: Educate the public about proper waste management opportunities and alternatives to reduce illegal dumping Provide regional training opportunities to share knowledge and best management practices, collect case studies, and provide a regional information clearinghouse to reduce illegal dumping
TD Cities, counties, code enforcement officials,
non-profits, waste associations and industry, business/private sector
Support and promote public education and outreach activities related to proper waste collection and alternative disposal methods, such as the regional reduce, reuse, and recycling and illegal dumping resource clearinghouses
TD Cities, counties, code enforcement officials,
non-profits, waste associations and industry, business/private sector
Encourage implementation of cost-effective illegal dumping programs such as demonstration projects, clean-up events, purchasing of clean-up trailers, and other innovative projects through enhanced government to government and public/private sector collaboration
TD Cities, counties, code enforcement officials,
non-profits, waste associations and industry, business/private sector
Objective: Educate the public about proper management and alternative options for Household Hazardous Waste (HHW)
Promote public and private sector use of environment-friendly goods and services TD Cities, counties, non-profits, waste
associations and industry, business/private sector
Encourage cities and counties to collaborate with private, non-profit, and other local government partners to establish and maintain HHW collection/reuse centers or regularly occurring collection events
TD Non-profits, waste associations and industry,
business/private sector

79
Action Recommendations Waste Management Hierarchy Element
Other Key Partners
Promote public awareness about options to donate certain types of HHW (e.g. paint and electronics) to donation or reuse centers such as Habitat for Humanity and Goodwill Industries, including maintenance of the regional reduce, reuse, and recycling resource clearinghouse
TD Non-profits, waste associations and industry,
business/private sector
Regional Goal: Promote Creation and Expansion of Waste Management Programs Objective: Encourage establishment, maintenance, and expansion of government, single and multi-family residential, and commercial waste source reduction, reuse, and recycling programs Encourage city and county programs that promote and provide opportunities for residents to participate in source reduction, recycling, composting, and waste diversion programs (e.g. composting facilities, electronics and pharmaceutical take-back programs, food waste programs, etc.)
SRR; RC Cities, counties, non-profits, waste
associations and industry, business/private sector
Encourage the implementation of source reduction, waste reduction, and recycling programs for all local governments, including school districts, special districts, and other governmental organizations
SRR; RC
Cities, counties, non-profits, waste associations and industry
Provide training and resources and encourage cities to establish or expand multi-family and commercial recycling programs and support development of additional recycling facilities for residents
RC Cities, counties, non-profits, waste
associations and industry, business/private sector
Enhance and coordinate public education and outreach to increase demand for and participation in multi-family and commercial recycling programs
RC Cities, counties, non-profits, waste
associations and industry, business/private sector
Encourage government-to-government and public/private sector collaboration to establish cost-effective government, single and multi-family residential, and commercial recycling programs
RC Cities, counties, non-profits, waste
associations and industry, business/private sector
Encourage and support implementation of best management practices in contracting for solid waste and recycling collection and transportation services
N/A Cities, counties, waste industry,
business/private sector
Provide resources to encourage cities to review and update local regulations and safety codes to allow for greater source reduction, reuse, and recycling opportunities, such as allowing food donation or enhanced recycling collection
SRR; RC Cities, counties, non-profits, waste
associations and industry, business/private sector
Provide training and peer exchange opportunities to meet single-family and multi-family residential, commercial, and government recycling regulatory (e.g. ordinance development and waste services contracting) and program development needs
RC Cities, counties, non-profits, waste
associations and industry, business/private sector

80
Action Recommendations Waste Management Hierarchy Element
Other Key Partners
Encourage partnerships between local governments and large venues and event centers to establish recycling and food waste minimization programs
SRR; RC Non-profits, waste associations and industry,
business/private sector Objective: Expand reuse and recycling of construction and demolition materials Support development and implementation of ordinances, building codes, and other regulatory and non-regulatory measures to encourage greater construction and demolition materials reuse and recycling opportunities
SRR; RC Cities, counties, school districts,
business/private sector
Support development of new product markets and expansion of existing product markets for construction and demolition materials
SRR; RC Cities, counties, non-profits, waste
associations and industry, business/private sector, universities
Encourage construction and demolition best management practices during new construction, building retrofits and rehabilitation, and infrastructure development and replacement
SRR; RC Cities, counties, school districts, home and commercial builders, and business/private
sector Encourage builders and infrastructure developers to utilize lifecycle cost analyses and consider green construction and building practices
SRR; RC Cities, counties, home and commercial builders, and business/private sector
Encourage implementation of best management practices for recycling and reuse of construction and demolition materials produced by local government public works projects, including cities, counties, school districts, and special districts
SRR; RC Cities, counties, school districts, special
districts,
Support alternative practices to demolition and development and expansion of reuse and recycling facilities for construction and demolition materials
SRR; RC Local governments, counties, and private
sector Objective: Expand existing collection and management alternatives for other wastes and establish and expand new product markets
Support establishment and expansion of used and scrap tire management programs through local governments and private/public partnership programs
SRR; RC Local governments, counties, cities, private
sector
Encourage expansion of reuse and recycling services outside of the curbside materials typically collected
SRR; RC Local governments, cities
Encourage and support development and maintenance of programs for collection and disposal of household hazardous waste beyond one day events
SRR; RC Local governments, counties, cities
Encourage implementation of and expansion of electronics recycling programs and projects
SRR; RC Local governments, counties, cities
Support enhanced education on proper disposal of residential waste and development of residential medical waste disposal programs and processing facilities
TD Local governments, counties, cities

81
Action Recommendations Waste Management Hierarchy Element
Other Key Partners
Encourage implementation of pharmaceutical take-back programs by local governments and private/public partnerships and support enhanced education on proper pharmaceutical disposal
SRR; TD Local governments, counties, cities, private
sector
Encourage local government and public/private sector collaboration to decrease food waste disposed of in landfills such as educating the public and private sector about food waste source reduction, developing food waste disposal and processing infrastructure (e.g. community gardens or compost center), and increasing the convenience of food waste disposal
SRR; RC; TD Local governments, counties, cities, private
sector
Support innovative and creative approaches for transforming trash components into new products for new purposes and creation of new product markets
SRR; RC Local governments, counties, cities, private
sector
Support new or the expansion of existing energy recovery programs to decrease landfill discards
ER Local governments, counties, cities
Objective: Facilitate the development and implementation of integrated solid waste management plans Encourage incorporation of materials management policies, goals, and actions into local government planning documents such as the comprehensive plan or sustainability plans
SRR; RC; ER; TD Cities, counties, school districts, special
districts
Encourage and support updates and regular review of existing waste management plans, ordinances, and development/zoning codes to incorporate best management practices and current state of practice in source reduction and reuse; recycling and composting; energy recovery; treatment and disposal
SRR; RC; ER; TD Cities, counties, school districts, special
districts
Support continued evaluation of organization’s goals and programs to be responsive to and meet the needs of the residents and business sector
N/A Cities, counties, school districts, special districts, public, private/business sector
Encourage government-to-government and public/private partnerships in waste management implementation plans
SRR; RC; ER; TD Cities, counties, school districts, special
districts, non-profits, private/business sector
Encourage plans, goals, and implementation programs that support the waste management hierarchy and provide waste management planning resources for local governments, school districts, and special districts
SRR; RC; ER; TD Cities, counties, school districts, special
districts, TCEQ
Encourage and support development of disaster debris management plans by local governments
TD Cities, counties, special districts, TCEQ
Encourage innovative reuse of landfill and waste disposal sites including energy recovery, renewable energy, and redevelopment opportunities
ER Cities, counties, special districts, private
sector/waste industry, TCEQ

82
Action Recommendations Waste Management Hierarchy Element
Other Key Partners
Objective: Promote integrated waste management practices and provide ample, convenient collection, and disposal options in rural and underserved areas
Encourage the establishment and expansion of transfer stations and citizen collection stations in rural or underserved areas
TD Cities, counties, school districts, special districts, private/business sector, TCEQ
Support the planning, design, and/or construction of citizens’ collection stations TD Cities, counties, school districts, special
districts, private/business sector
Encourage government-to-government (e.g. multi-county) and private/public partnerships to establish cost-effective collection and disposal options
TD Cities, counties, school districts, special districts, private/business sector, TCEQ
Regional Goal: Measure Regional Waste Reduction Efforts Objective Encourage survey and evaluation techniques to establish baseline and effectively track waste reduction
Measure and track progress and impacts of source reduction and reuse; recycling and composting; energy recovery; and treatment and disposal programs
SRR; RC; ER; TD EPA, TCEQ, waste industry and associations,
cities, counties
Develop regional reporting system to mirror TCEQ and EPA models to enhance data collection and reporting at the regional level
N/A EPA, TCEQ, waste industry and associations,
cities, counties
Support statewide and regional efforts to establish and update waste generation, reduction, reuse, recycling, and discard rates
SRR; RC; ER; TD EPA, TCEQ, waste industry and associations,
non-profits, cities, counties
Objective: Encourage the maintenance of disposal and processing capacity to meet the needs of the region Support source reduction and reuse, recycling and composting, and energy recovery initiatives to reduce additional landfill capacity needs
SRR; RC; ER; TD EPA, TCEQ, waste industry and associations,
non-profits, cities, counties Regional Goal: Support and Encourage Innovative Technologies for Other Waste Objective: Encourage innovative technologies to reduce, manage, and process emerging waste streams
Identify and provide opportunities to incentivize private sector to transition to innovative technologies that reduce or process emerging waste streams
SRR; RC; TD Cities, counties, non-profits, private/business
sector, TCEQ
Encourage pilot programs and partnerships with local governments and private sector to demonstrate viability, feasibility, and cost effectiveness of technologies
SRR; RC; TD Cities, counties, non-profits, private/business
sector, TCEQ
Promote innovative approaches to establish new product markets through development of technologies and processes that maximize waste value and create economic opportunity
SRR; RC; TD Cities, counties, non-profits, private/business
sector, TCEQ

83
Action Recommendations Waste Management Hierarchy Element
Other Key Partners
Regional Goal: Promote Public and Private Sector Partnerships Objective: Increase coordination between cities’ and counties’ organizational entities to reduce illegal dumping Provide support and development of regional illegal dumping resources and information exchange for local governments focused on illegal dumping prevention and enforcement
TD Cities, counties, non-profits, private/business
sector, TCEQ
Expand waste collection opportunities and provide enhanced resident and private sector education in rural and underserved areas
SRR; RC; TD Cities, counties, non-profits, private/business
sector, TCEQ Encourage collaboration among rural communities to create efficient and cost effective recycling collection and material recovery processing
RC; TD Cities, counties, non-profits, private/business
sector, TCEQ Encourage funding of initiatives such as the Closed Loop Fund to increase source reduction and reuse; and, recycling and composting
SRR; RC Cities, counties, non-profits, private/business
sector Encourage regional, multi-government, and local/neighborhood cleanup efforts in rural and underserved areas through diverse partnerships
TD Cities, counties, non-profits, private/business
sector Create collaborations with private and public sectors to increase recycling and material recovery
RC Cities, counties, non-profits, private/business
sector Provide and maintain regional illegal dumping resource clearinghouse and information resources
SRR; RC; TD Cities, counties, non-profits, private/business
sector Objective: Assure that applicants for state permits demonstrate compliance with the adopted regional solid waste plan Follow recommended Permit Application Review process as outlined in Regional and Local Review of MSW Facility Applications
N/A Cities, counties, permit applicants, and
private sector Encourage and support adoption and update of county siting ordinances N/A Counties Provide recommendations for conformance with the Regional Plan and land use compatibility in counties in the region with no siting ordinance and extraterritorial jurisdictions of cities
N/A Cities and counties
Objective: Maintain and update the Closed and Abandoned Landfill inventory Maintain and update closed and abandoned landfill inventory as new information is received from local governments or owners/operators and/or landfills are closed
N/A Cities, counties, landfill owners/operators,
TCEQ Respond to requests for closed and abandoned landfill inventory, maintain closed and abandoned landfill records, and update and maintain online and print resources
N/A TCEQ
Maintain and update notification process on new site closure and development over former landfills
N/A Cities, counties, TCEQ
84
Chapter 9: Funding Materials Management Implementation Initiatives

85
Chapter 9. Funding Materials Management Implementation Initiatives
The 2015 Regional Plan focuses on a number of strategies and actions that a variety of partners can implement to achieve greater source reduction, reuse, and recycling impacts. While some of the actions can be achieved through expanded partnerships, many will require additional funding outside of traditional local government and private sector budgets. A number of funding opportunities exist to establish, maintain, or grow solid waste management programs in cities, non-profits, businesses, and industry. These funding opportunities include federal, state, foundation, corporate, and industry association grants. Many non-profits, federal agencies, industry association such as Keep America Beautiful, Solid Waste Association of North America, and the United States Environmental Protection Agency, provide a wealth of resources including case studies, technical assistance, and training opportunities. Another opportunity for funding waste management programs is through NCTCOG. Every two years, the Texas Commission on Environmental Quality (TCEQ) distributes funds to regional planning agencies across the State. These solid waste funds are generated by solid waste disposal fees the TCEQ collects at landfills. Each legislative session, the State Legislature allocates these funds through TCEQ to regional planning councils based on population and the amount of fees collected. NCTCOG administers a grant program, with the assistance of the Resource Conservation Council, to distribute these funds to local governments and other eligible entities for solid waste projects that align with the goals and objectives of the regional plan. Since 1996, there have been over 50 cities, counties, school districts, schools, and special districts awarded grants to improve solid waste management. Figure 26 shows the cities that have been awarded grants in the 16-county North Central Texas area. There have been an additional 16 schools and school districts, 11 counties, and 7 special districts that have received grants from 1996 – 2015. Several known funding and technical assistance opportunities are provided below. This is not an exhaustive list of resources that might be available to organizations considering solid waste management programs or projects. • The Recycling Partnership: Provides grants and technical assistance for curbside recycling with a goal to
meet demand/supply gap between industries that need processing infrastructure and communities. More information can be found at http://recyclingpartnership.org.
• United States Department of Agriculture (USDA) Rural Development Solid Waste Management Grants: More information can be found at http://www.rd.usda.gov/
• Texas Commission on Environmental Quality Regional Solid Waste Grants Program: Program to provide grants to regional councils of governments to fund solid waste management activities and various local and regional projects that help implement solid waste management plans. More information can be found at https://www.tceq.texas.gov.
• Closed Loop Fund: Provides zero interest loans to municipalities that develop recycling infrastructure. More information can be found at http://www.closedloopfund.com/.

86
• Keep America Beautiful partners with business sponsors to provide grants to support waste reduction, recycling, litter prevention, and other preferred methods for material management. More information can be found at http://www.kab.org/site/PageServer?pagename=grants_home
Figure 26. Cities Awarded Solid Waste Grant Funds, 1996 – 2015
(Source: NCTCOG, 2015)

87
Appendices

88
Appendix A. Regional Maps
• 2015 North Central Texas 16-County Region • North Central Texas Metropolitan Area • 2015 North Central Texas Population by County • 2040 North Central Texas Population by County • North Central Texas Jobs per Acre 2040 • 2015 North Central Texas Existing Landfills • North Central Texas Closed and Abandoned Landfills • 2015 North Central Texas Active Gas Recovery Facilities • North Central Texas Transfer Stations • 2015 North Central Texas Remaining Landfill Capacity • Cities Awarded Solid Waste Grant Funds, 1996 – 2015

89

90

91

92

93

94

95

96

97

98

99

100
Appendix B. 2014 MSW Annual Report for Landfills in North Central Texas Region
*Landfill was not assessed during FY2014
County Permit Landfill
Tipping Fee
Counties Served Landfill
Disposal (total tons)
Total Diverted Materials (in tons)
Assessed Capacity on 8/31 as of this FY (yd3)
Public/Private Ownership
Type
Collin
2294 121 Regional
Disposal Facility $31.00
Collin, Dallas, Denton, Grayson, Hunt, Fannin
816,479 7841 122038282 Public I
62 City of Dallas
McCommas Bluff Landfill
$21.50 Ellis, Dallas 1,872,789 211.4 0* Public I
996C City of Grand Prairie $32.00 Tarrant, Ellis, Dallas, Johnson 167,972 177111.9 12290455 Public I
Dallas
1394B Hunter Ferrell
Landfill $40.00 Dallas 162,787 7391 14313475 Public I
1895A Charles M Hinton Jr
Regional Landfill $26.71
Collin, Rockwall, Tarrant, Dallas, Kaufman
389,836 45611.9 34801352* Public I
1025B DFW Recycling and
Disposal Facility $21.00
Denton, Tarrant, Dallas, Collin, Grayson
1,261,273 837 12098375 Private I
Denton
1312A Camelot Landfill $29.62 Collin, Tarrant, Denton, Dallas 268,618 31.1 6337758 Public I
1590A City of Denton
Landfill $43.50 Denton, Coke, Tarrant 191,250 64058 10827752 Public I
1749B Lewisville Landfill $18.41 Collin, Denton, Dallas 187,906 12.1 21376601 Private IV
42C Waste Management
Skyline Landfill $18.50
Johnson, Parmer, Tarrant, Ellis, Hood, Palo Pinto, Kaufman,
Dallas Rockwall 1,207,060 1003 29407161 Private I
Ellis
1209B CSC Disposal and
Landfill $52.78
Dallas, Tarrant, Travis, Navarro, Harris, Johnson, Denton, Ellis,
Hill 659 0 31044259* Private I
1745B Ellis County Landfill $29.40 Kaufman, Van Zandt, Ellis,
Smith, Henderson Navarro, Dallas
57,966 0 39855933* Private I
Erath 664 City of Stephenville
Landfill $50.00
Hood, Erath, Somervell, Hamilton, Comanche
7,407 217.3 948134.2* Public IV
Hunt 1195A Republic Maloy
Landfill $30.71
Collin, Delta, Fannin, Franklin, Grayson, Hopkins, Wood,
97,800 0 6116927* Private I
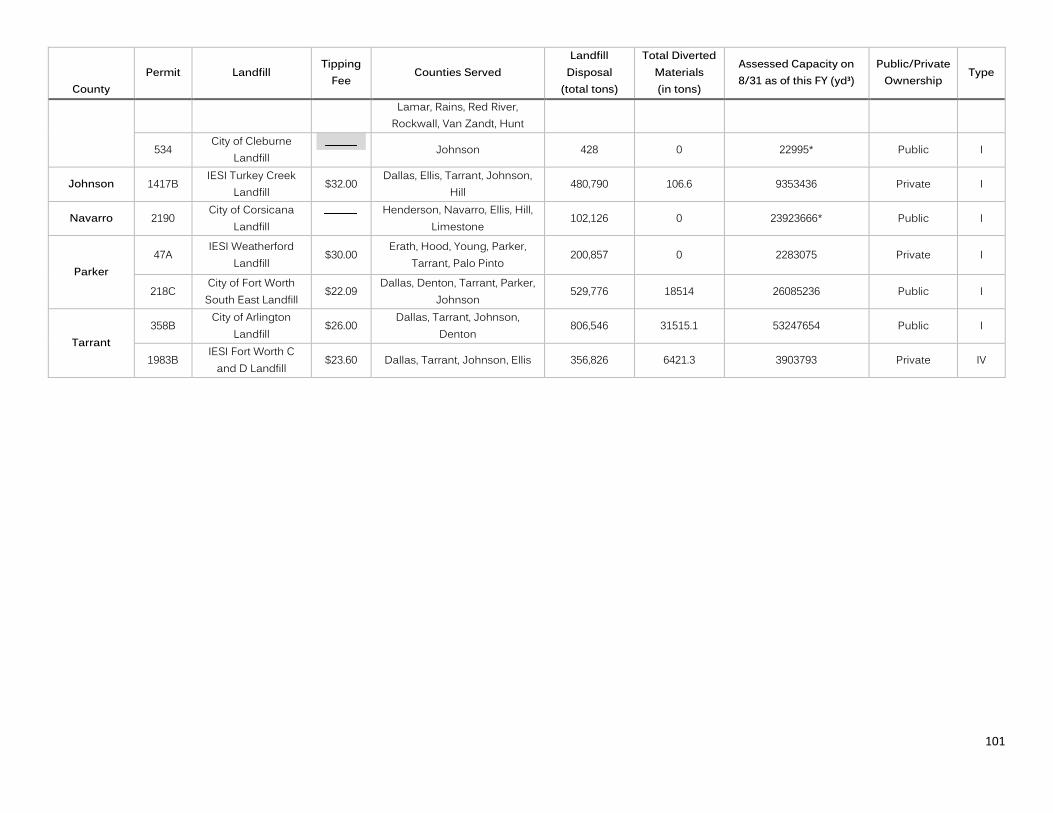
101
County Permit Landfill
Tipping Fee
Counties Served Landfill
Disposal (total tons)
Total Diverted Materials (in tons)
Assessed Capacity on 8/31 as of this FY (yd3)
Public/Private Ownership
Type
Lamar, Rains, Red River, Rockwall, Van Zandt, Hunt
534 City of Cleburne
Landfill
Johnson 428 0 22995* Public I
Johnson 1417B IESI Turkey Creek
Landfill $32.00
Dallas, Ellis, Tarrant, Johnson, Hill
480,790 106.6 9353436 Private I
Navarro 2190 City of Corsicana
Landfill
Henderson, Navarro, Ellis, Hill,
Limestone 102,126 0 23923666* Public I
Parker 47A
IESI Weatherford Landfill
$30.00 Erath, Hood, Young, Parker,
Tarrant, Palo Pinto 200,857 0 2283075 Private I
218C City of Fort Worth
South East Landfill $22.09
Dallas, Denton, Tarrant, Parker, Johnson
529,776 18514 26085236 Public I
Tarrant 358B
City of Arlington Landfill
$26.00 Dallas, Tarrant, Johnson,
Denton 806,546 31515.1 53247654 Public I
1983B IESI Fort Worth C
and D Landfill $23.60 Dallas, Tarrant, Johnson, Ellis 356,826 6421.3 3903793 Private IV

102
Appendix C. Forecasted Population Change 1990-2040 for 12-County Metropolitan Planning Area
County 1990 Census 2000 Census 2010 Census 2040 Forecast Percent Increase 2010 to 2040
Collin 264,036 491,675 782,341 1,560,421 50% Dallas 1,852,810 2,218,899 2,368,139 3,357,469 29%
Denton 273,525 432,976 662,614 1,241,681 47%
Ellis 85,167 111,360 149,610 283,898 47% Hood 28,981 41,100 51,182 81,578 37% Hunt 64,343 76,596 86,129 131,022 34%
Johnson 97,165 126,811 150,934 252,521 40%
Kaufman 52,220 71,313 103,350 210,097 51% Parker 64,785 88,495 116,927 195,286 40%
Rockwall 25,604 43,080 78,337 166,357 53% Tarrant 1,170,103 1,446,219 1,809,034 3,094,649 42%
Wise 34,679 48,793 59,127 101,865 42%
Total 4,111,750 5,309,277 6,539,950 10,676,844 39%

103
Appendix D. Regional Studies and Waste Management Resources
Over the last decade, NCTCOG has undertaken a series of regional studies to focus on specific challenges in waste management. These studies provide a series of recommended actions, sample documents, processes, and outcomes that have been integrated into the 2015 Regional Plan. A summary of each regional study is provided below for reference. The full text documents are available on the NCTCOG Solid Waste website.
Source Reduction and Recycling
NCTCOG 2010 Regional Recycling Rate Update – (Phase II) The North Central Texas Council of Governments (NCTCOG) conducted the 2010 Regional Recycling Rate Update Study. NCTCOG conducted the original NCTCOG Regional Recycling Rate Benchmarking Study in 2007 with the purpose of developing a baseline recycling rate for the 16-county North Central Texas planning region. The results were derived from collection of recycling and disposal data from municipalities, processors, landfills and the TCEQ. Over 80 communities were selected to participate in this effort and the results of the 2010 Update documents progress in the recycling rate on a regional and city-by-city basis. Recycling Contract Negotiation Guidebook – 2009 The Recycling Contract Negotiation Guidebook has been developed to provide a resource to local governments and private companies in North Central Texas to develop more effective recycling service contracts. This study provides a comprehensive overview of recycling collection and processing contract issues. Regional Recycling Ordinance and Building Design Guidelines – 2009
The Recycling Ordinance and Building Design Guidelines were developed to address infrastructure and building procedures for recycling programs at multi-family and commercial properties. In addition, they intended to provide a resource to local governments in North Central Texas on recycling ordinances that can be implemented to enhance recycling efforts. Regional Recycling Rate Benchmarking Study (Phase I) – 2007
In June 2006, the North Central Texas Council of Governments (NCTCOG) conducted the Regional Recycling Rate Benchmarking Study. The purpose of this Study was to develop recycling rates for the 16-county North Central Texas region. Residential, ICI (industrial, commercial, and institutional) and overall recycling rates were used to serve as a benchmark to measure the success of future recycling initiatives.

104
Construction and Demolition (C&D)
Phase III Construction and Demolition (C&D) Material Recovery Facility Study – 2007
This study looked at amounts of C&D materials disposed of at a North Texas landfill, including the C&D waste volume, waste sources, and type of C&D waste generated. A 20-year C&D waste generation planning forecast for the areas served by the landfill was developed in order to get a better idea of how projected growth will impact the amount of materials that could potentially be processed at a C&D material recovery facility (MRF). A market analysis was conducted within the North Central Texas Region for the sale of possible C&D materials that would be processed at a MRF. Site selection criteria was developed to evaluate the advantages and disadvantages for potential locations and a conceptual MRF was developed.
Construction and Demolition Waste Minimization Strategies for North Central Texas Region – 2005
This study included case studies and cost benefit analyses of five C&D waste minimization programs and practices that are currently in place or may be feasible in the region including the development of a C&D material recovery facility (MRF).
Regional Construction and Demolition (C&D) Debris Reduce/Reuse/Recycle (R3) Study – 2003
In FY2003, NCTCOG completed a construction & demolition debris project involving the development of a report, a database of C&D recyclers, and an action plan for C&D waste reduction in the region.
Disposal Options
Rural & Underserved Area Disposal Needs Study – 2003
The North Central Texas Council of Governments (NCTCOG) developed a report concerning solid waste collection and disposal options for residents and businesses in the rural and underserved areas of the 16-county NCTCOG region. The Rural and Underserved Area Disposal Needs Study provides a county-by-county analysis of disposal needs, as well as, in-depth descriptions concerning options available to local governments (especially counties) to manage their solid waste. The options focus on solutions that can be realistically implemented by rural counties. Regional and Local Review of MSW Facility Applications – 2005 The North Central Texas Council of Governments is responsible for regional solid waste management planning in the North Central Texas Region. The Texas Commission on Environmental Quality (TCEQ) has directed the councils of governments (COGs) to develop a process for review of municipal solid waste (MSW) facility, solid waste permit and registration applications. In this guidance, TCEQ has directed that COG regional plans should identify those factors that will be used by the applicant to evaluate whether a proposed MSW application will demonstrate conformance with the regional plan. Review of County Solid Waste Facility Siting and Rural Service Needs – 2006 The North Central Texas Council of Governments (NCTCOG worked with 13 out of the 16 counties in the North Central Texas region to help these counties decide whether they would have an interest in developing an MSW siting ordinance and to help them address solid waste issues facing their rural and

105
underserved areas. The three counties that were not included in this study either had already developed a siting ordinance or were not interested in developing one. Disaster Debris Management – 2005 The Disaster Debris Management Study for North Central Texas was approved by NCTCOG's Executive Board on June 23, 2005 and is now available for viewing and downloading in PDF format.

106
Appendix E. Glossary of Terms
Anaerobic - A biochemical process or condition occurring in the absence of oxygen. Baler - A machine used to compress recyclables into bundles to reduce volume. Biomass - Amount of living matter in the environment. BPA - According to the EPA, Bisphenol A or BPA is a high production volume (HPV) chemical widely used in manufacturing polycarbonate plastics and epoxy resins used in nearly every industry. Citizen’s Collection Station (CCS) - A facility established for the convenience and exclusive use of residents (not commercial or industrial users or collection vehicles), except that in small communities where regular collections are not available, small quantities of commercial waste may be deposited by the generator of the waste. The facility may consist of one or more storage containers, bins, or trailers. Commercial Solid Waste - All types of solid waste generated by stores, offices, restaurants, warehouses, and other nonmanufacturing activities, excluding residential and industrial wastes. Compost - Relatively stable decomposed organic material; the result of the composting process. Composting - The controlled biological decomposition of organic solid waste under aerobic conditions. Composting Facility - A site or facility for processing the stabilized product of decomposition which is used or sold for use as a soil amendment, artificial top soil, growing medium amendment, or other similar uses. Construction and Demolition Waste (C&D) - Waste resulting from construction or demolition projects; includes all materials that are directly or indirectly the by-products of construction work or that result from demolition of buildings and other structures, including, but not limited to, paper, cartons, gypsum board, wood, excelsior, rubber and plastics. Container - Any portable device in which a material is stored, transported, or processed. Curbside Collection - Collection of recyclable materials at the curb, often from special containers, to be taken to various processing facilities. Discard - To abandon a material and not use, re-use, reclaim, or recycle it. A material is abandoned by being disposed of; burned or incinerated (except where the material is being burned as a fuel for the purpose of recovering usable energy); or physically, chemically, or biologically treated (other than burned or incinerated) in lieu of or prior to being disposed. Drop-off Site - A method of collecting recyclables or compostable materials in which the materials are taken by individuals to collection sites and deposited into designated containers. End of Lifecycle - The point at which a product or material is no longer useful to the person possessing it and is either discarded or abandoned and enters into the waste stream. Energy Recovery - The conversion of non-recyclable waste materials into useable heat, electricity, or fuel through a variety of processes. Evolving Ton - The evolving ton concept incorporates the trends in waste streams that show declining paper usage, increased plastics packaging, and increased plastic containers. Additionally, manufacturers are increasingly using light weight plastics to reduce the weight of products thus reducing costs of shipping over long distances and to achieve other environmental benefits; yet many recycling facilities are unable to process this material cost-effectively. This is largely due to the existing model of revenue, which is measured by weight. As packaging and waste streams become lighter, the costs increase due to the requirement to process higher volumes to make processing cost-effective. Electronic Materials - A computer, computer monitor, and computer peripheral, device containing cathode ray tube, printer, or television.

107
Food Waste - Animal or vegetable wastes resulting from handling, storage, sale, preparation, cooking and serving of foods. Garbage - Spoiled or waste food that is thrown away, generally defined as wet food waste; although in common usage garbage refers to all materials that are discarded unnecessarily. Generation - The act or process of producing solid waste Glass - An inorganic product of fusion that has cooled to a rigid condition without crystallizing. Grease Trap Waste - Material collected in and from a grease interceptor in the sanitary sewer line of a commercial, institutional, or industrial food service or processing establishment, including the solids resulting from dewatering processes Green Waste - A combination of non-animal food and yard waste collected and composted together. Grit Trap Waste - Includes waste from interceptors placed in the drains prior to entering the sewer system at maintenance and repair shops, automobile service stations, car washes, laundries, and other similar establishments. Hazardous Waste - Any solid waste identified or listed as a hazardous waste by the administrator of the United States Environmental Protection Agency under the federal Solid Waste Disposal Act, as amended by the Resource Conservation and Recovery Act of 1976. Household Hazardous Waste (HHW) - Any waste from households, hotels or motels, bunkhouses, ranger stations, crew quarters, camp grounds, picnic grounds, and day-use recreation areas that would be subject to regulation as hazard wastes if it were not from households. Incinerator - Any device that is used for the reduction of combustible solid wastes by burning under conditions of controlled airflow and temperature. Industrial Solid Waste - Solid waste resulting from or incidental to any process of industry or manufacturing, or mining or agricultural processes. Institutional Solid Waste - Solid wastes generated by schools, hospitals, universities, museums, governments, and other institutions. Some communities define institutional solid was as commercial waste. Landfill - A solid waste management unit for the disposal of solid waste involving the placement of solid waste on or beneath the land surface. Leachate - A liquid that has passed through or emerged from solid waste and contains soluble, suspended, or miscible materials removed from such waste. Liquid Waste - Any waste material that is determined to contain “free liquids” as defined by the United States Environmental Protection Agency (EPA) Method 9095. Local Government - A county, municipality, or other political subdivision of the state exercising the authority granted under Section 361.165 of the Solid Waste Disposal Act. Materials Recovery - The concept of resource recovery, emphasis is on separating and processing waste materials for beneficial use or reuse. Medical Waste - Treated and untreated special waste from healthcare-related facilities that is comprised of animal waste, bulk blood, bulk human blood, bulk human body fluids, microbiological waste, pathological waste, and sharps. Mulch - Ground or mixed yard wastes placed around plants to prevent evaporation of moisture and freezing of roots and to nourish the soil.

108
Municipal Solid Waste (MSW) - Per the Environmental Protection Agency, MSW are items that are disposed after use such as packaging, food, grass clippings, sofas, tires, computer, and refrigerators, and excludes wastes that are hazardous, industrial, or from construction. According to the Texas Administrative Code (TAC), MSW is solid waste from or incidental to municipal, community, commercial, institutional, and recreational activities, including garbage, rubbish, ashes, street cleanings, dead animals, abandoned automobiles, and all other solid waste other than industrial solid waste. It is important to recognize that the Texas classification of MSW does include construction and demolition (C&D) waste as well as municipal MSW Landfill Type I - The standard landfill for the disposal of MSW. The commission may authorize the designation of special-use areas for processing, storage, and disposal or any other functions involving solid waste sludge. MSW Landfill Type IV - The landfill unit may only accept brush, construction, or demolition waste, and/or rubbish. A Type IV landfill unit may not accept putrescible wastes, conditionally exempt small-quantity generator waste, or household wastes. NCTCOG - A political subdivision of the state and a voluntary association of local governments with a membership of 235 political jurisdictions. It is not a government as it cannot levy taxes or enact laws. Its primary purposes are to perform long-range, comprehensive plans for matters that transcend jurisdictional boundaries, promote the sound development of the 16-county region, and facilitate cooperation and coordination among its member governments. Organic Waste - Waste material from substances composed primarily of chemical compounds of carbon in combination with other elements, primarily hydrogen. These materials include paper, wood, food wastes, plastics, and yard waste. Paper - The name for all kinds of material or felted sheets of fiver formed on a fine screen for a water suspension. Permitted Landfill - Any type of municipal solid waste landfill that received a permit from the State of Texas to operate and has not completed post-closure operations. Per Capita Disposal Rate - The average amount of waste disposed (landfill or incinerated) per person per year for a given year. Planning Region - A region of the state identified by the governor as an appropriate region for municipal solid waste planning as provided by Section 4006 of the federal Solid Waste Disposal Act, as amended by the RCRA. Plastics - Non-metallic compounds that result from a chemical reaction, and are molded or formed into rigid or pliable construction material and fabrics. Processing - The extraction of materials, transfer, volume reduction, conversion to energy or other separation and preparation of solid waste for reuse or disposal, including treatment or neutralization of hazardous waste designed to change the physical, chemical, or biological character or composition of hazardous waste. Recyclable Materials - A material that has been recovered or diverted from the nonhazardous waste stream for purposes of reuse, recycling, or reclamation, a substantial portion of which is consistently used in the manufacturing of products that may otherwise be produced using virgin or raw materials. Recycled material is not solid waste but may become solid waste at such time, if any, as it is abandoned or disposed of rather than recycled.

109
Recycled Materials - Materials, good, or products that consist of recyclable material or materials derived from postconsumer waste, industrial waste, or hazardous waste which may be used in place of a raw or virgin material in manufacturing a new product. Recycling - A process by which a given waste material is separated from the waste stream and is processed so that it may be used again as a raw material for products which may or may not be similar to the original. Recycling Rate - The quantity of material recycled compared to the sum of recycled and disposed material. Resource Conservation Council (RCC) - A subcommittee consisting of representatives from local governments, the private sector, citizen organizations, and industry trade associations is responsible for conducting review and recommendations of MSW facility siting applications. The Regional Plan - The Regional North Central Texas Materials Management Plan. Residential Waste - Waste materials generated in single and multiple family homes. When multiple family units exceed four, these wastes are usually collected in large containers by commercial haulers. Resource Recovery - The process of obtaining useful material or energy from solid waste and includes energy recovery, material recovery, and recycling. Reuse - The return of a commodity into the economic stream for use in the same kind of application as before without change in its identity. Rubbish - Non-putrescible solid wastes, including ashes, consisting of both combustible and non-combustible materials, such as paper, cardboard, tin cans, wood, glass, bedding, crockery or litter of any kind. Septage - The liquid and solid material pumped from a septic tank, cesspool, or similar sewage treatment system. Scrap –Tire - Any tire that can no longer be used for its original intended purpose. Single-stream Recycling - Collection programs that allow participants to put all recyclable materials (e.g. paper, bottles, cans etc.) into one collection container. These materials are then transported to a single-stream MRF. Sludge - Any solid, semi-solid, or liquid waste generated from a municipal, commercial, or industrial wastewater treatment plant, water-supply treatment plant, or air pollution control facility, exclusive of the treated effluent from a wastewater treatment plant. Solid Waste - A general term for discarded materials destined for disposal, but not discharged into a sewer or the atmosphere. Solid waste can be composed of a single material or a heterogeneous mix of various materials including semi-solids. As defined by RCRA, solid waste includes any solid, semi-solid, liquid, or contained gaseous materials discarded from industrial, commercial, mining, or agricultural operations, and from community activities. Solid Waste Disposal - The disposal of all solid wastes through landfilling, incineration, composting, chemical treatment, and any other method which prepares solid waste for final disposition. Solid Waste Management - A planned program for effectively controlling the generation, storage, collection, transportation, processing and reuse, conversion or disposal of solid waste in a safe, sanitary, aesthetically acceptable, environmentally sound and economic manner. It includes all administrative, financial, environmental, legal, and planning functions as well as the operational aspects of solid waste handling and resource recovery systems. Sorted-stream - Collection programs that require participants to place each recyclable material in the appropriate collection bin when the first discard the item.

110
Source Reduction - The design, manufacture, acquisition, and reuse of materials including products and packaging, so as to minimize the quantity and/or toxicity of waste produced. Source reduction prevents waste either by redesigning products or by otherwise changing societal patterns of consumption, use, and waste generation. Subtitle-D Regulations - The portion of the RCRA dealing with non-hazardous solid waste treatment, storage, and disposal facilities. Sustainability - Using, developing, and protecting resources in a manner that enables people to meet current needs and provides that future generations can also meet future needs, from the joint perspective of environmental, economic, and community objectives. Tipping Fee - The charge to unload waste materials at a transfer station, processing plant, landfill, or other disposal site. Transfer Station - A facility used for transferring solid waste from collection vehicles to long-haul vehicles (one transportation unit to another transportation unit). It is not a storage facility such as one where individual residents can dispose of their wastes in bulk storage containers that are serviced by collection vehicles. Virgin Material - Raw material used in manufacturing that has not yet become a product. Trash - Materials considered worthless, unnecessary, or offensive that is usually thrown away. Generally defined as dry waste material, but in common usage it is a synonym for garbage, rubbish or refuse. Waste - Useless, unwanted, or discarded material resulting from natural community activities. Waste includes solids, liquids and gases. Solid Wastes are classified as refuse. Waste Processing - An operation such as shredding, compaction, composting, or incineration, in which the physical or chemical properties of wastes are changed. Waste Reduction - The practice of producing smaller quantities of disposable waste. Waste reduction usually entails changing manufacturing processes and packaging practices to foster more recycling and less dependency on disposable goods. Waste Stream - The waste output of a region, community, or facility. Yard Waste - Leaves, grass clippings, pruning, and other natural organic matter discarded from yards and gardens. The term does not include stumps, roots, or shrubs with intact root balls. Zero Waste - Designing and managing products and processes to systematically avoid and eliminate the volume and toxicity of waste and materials, conserve and recover all resources, and not burn or bury them.

111
Appendix F. Public Meeting Comments
Comment NCTCOG Response
Will Zero Waste be included in the plan? Zero Waste has been included in the plan as an emerging trend in local solid waste management, such as the City of Dallas's Zero Waste plan.
Will source reduction be included in the plan? Yes, in accord with the Waste Management Hierarchy set forth by the EPA and the Texas Health and Safety Code §363.002, the Regional Plan places source reduction as the most preferred method in material management.
Has the NCTCOG corresponded with TCEQ in see if the region's plan is consistent with the state's plan?
Currently there is no state solid waste management plan in Texas. NCTCOG staff has been in regular correspondence with TCEQ to confirm that the Regional Plan includes all necessary information outlined in the
Texas Administrative Code. Does the plan address the value of materials discarded as a
commodity not just as trash? Yes, the transition of the terminology from "solid waste" to ‘materials
management" is to reflect the value of materials even after products serve their initial purpose. Recovering value through Resource Recovery is a
priority addressed in the plan.
Does the plan specify criteria for facility siting in the region? Under Section §364.012 of the Texas Health and Safety Code, counties have the authority to adopt an ordinance within its boundaries
designating where MSW disposal facilities are prohibited and allowed. NCTCOG has offered workshops on local siting criteria or facility siting
ordinances and encourages collaboration between cities and counties to guarantee that bordering local governments do not have conflicting land
use plans.