Embed Size (px)
Citation preview
PLANNING FOR FAIRNESS: EQUITY IN FRENCH URBANISME AND
GRENOBLE’S DE BONNE ECO-NEIGHBORHOOD
By Brittany Gada
A Thesis
Submitted in Partial Fulfillment
of the Requirements for the Degree of
Master of Science
in Applied Geospatial Science
Northern Arizona University
December 2017
Approved by:
Alan Lew, Ph.D., Chair
Brian Petersen, Ph.D.
Rebecca Dawn Hawley, Ph.D.
ABSTRACT
PLANNING FOR FAIRNESS: EQUITY IN FRENCH URBANISME AND
GRENOBLE’S DE BONNE ECO-NEIGHBORHOOD
BRITTANY GADA
Most planning departments in U.S. cities today incorporate strategies to address inequity
in its many forms into their missions and project designs. Despite this attention to the problem,
overall urban inequality is on the rise around the world. Considering this trend, planners must
begin to reevaluate the methods being used to address equity issues. First, in an attempt to bring
light to this issue, this research delves into the urban planning history, philosophy, and law of one
country that has been relatively successful in the fight against inequalities, France. Next, the
particularities and methods of French urbanisme (urban planning) are linked to the concept of
equity by examining how it is conceptualized and operationalized in French urban planning
practice and policy. Finally, through the application of an advocacy planning framework, this
research employs qualitative methodologies to investigate the results of the Quartier De Bonne
eco-neighborhood project developed by the city of Grenoble, France and to evaluate the project’s
effectiveness in meeting social equity goals. Through an in-depth consideration of French
planning literature, official planning policy, GIS spatial analyses, interview analysis, and GIS
methods, final conclusions seek to identify areas of improvement for equity planning methods
and project evaluation. Finally, implications for other cities hoping to address inequity in their
communities using similar strategies are discussed. These include the importance of policy
!ii
action, public participation, and a mixed-methods approach to post-project evaluation to ensure
successful equity planning projects in the U.S.
Keywords: equity planning, advocacy planning, equity analysis, Geospatial Information Systems,
Qualitative GIS, Grenoble, France, eco-neighborhood, urbanisme
!iii
Table of Contents
Chapter 1: Introduction and Overview…………………………………….…………..………… 1
1. Introduction………………………………………………………………………………… 1
2. Research Problem Statement and Purpose………………………………………………… 3
3. Research Questions…………………………………………………….………..………… 9
4. Definitions……………………………………………………………….…………..…… 10
5. Scope of Research……….…………………………..…………………………………… 15
Chapter 2: Literature Review…………………………………………………………………… 17
1. Equity Planning as a Movement and a Discipline……….……………..………………… 18
2. A Brief History of Urban Planning in France and Post-World War II Policy…………….. 23
3. Équité à la Française and its Role in Urban Planning Today……………………………. 30
4. The Current Role of GIS in Equity Planning and Opportunities Presented by QGIS.…… 62
Chapter 3: Case Study……………………………………………………………………………68
1. Eco-Neighborhood De Bonne Case Study Overview……………………………….……..68
2. The De Bonne Project’s Objectives…………………………………………….…………..71
3. Strategies for Equity Goal Attainment…………………………………………….……….74
4. Assessment of Objectives and Strategies Used to Promote Social Equity…………………81
Chapter 4: Research Methodology……………………………………………………………… 84
1. Semi-Structured Interview Overview………………………………………………………86
2. Raw Survey Data Preparation for Interview Analysis…………….…….……….…………89
3. Raw Data Preparation for Use in GIS and QGIS………………………………….……….92
4. GIS and QGIS Methods Used for Analysis………………………………………………..95
!iv
Chapter 5: Case Study Research Results…………………………………………………….…. 98
1. First Impressions: Findings of Interview Analyses…………………………………….… 98
2. A Different Look: QGIS Techniques for Qualitative Data Analysis……………………. 110
Chapter 6: Discussion……………………………………………………………………….… 128
1. Effectiveness of Using Qualitative Data to Evaluate De Bonne’s Equity Performance… 129
2. Research Challenges and Opportunities for Improvement…………………………….… 130
3. Implications of Qualitative Methods and QGIS for U.S. Equity Planning……………… 133
4. Concluding Thoughts: Identifying Lessons from French Equity Planning……………… 139
References……………………………………………………………………………………... 145
Appendix A: De Bonne User Survey Materials………………………………………….……. 152
Appendix B: IRB Documentation………………………………………………………….….. 156
Appendix C: Raw Survey Data……………………………………………………….……….. 159
Appendix D: Link to ESRI Story Map……………………..………………….……………… 163
!v
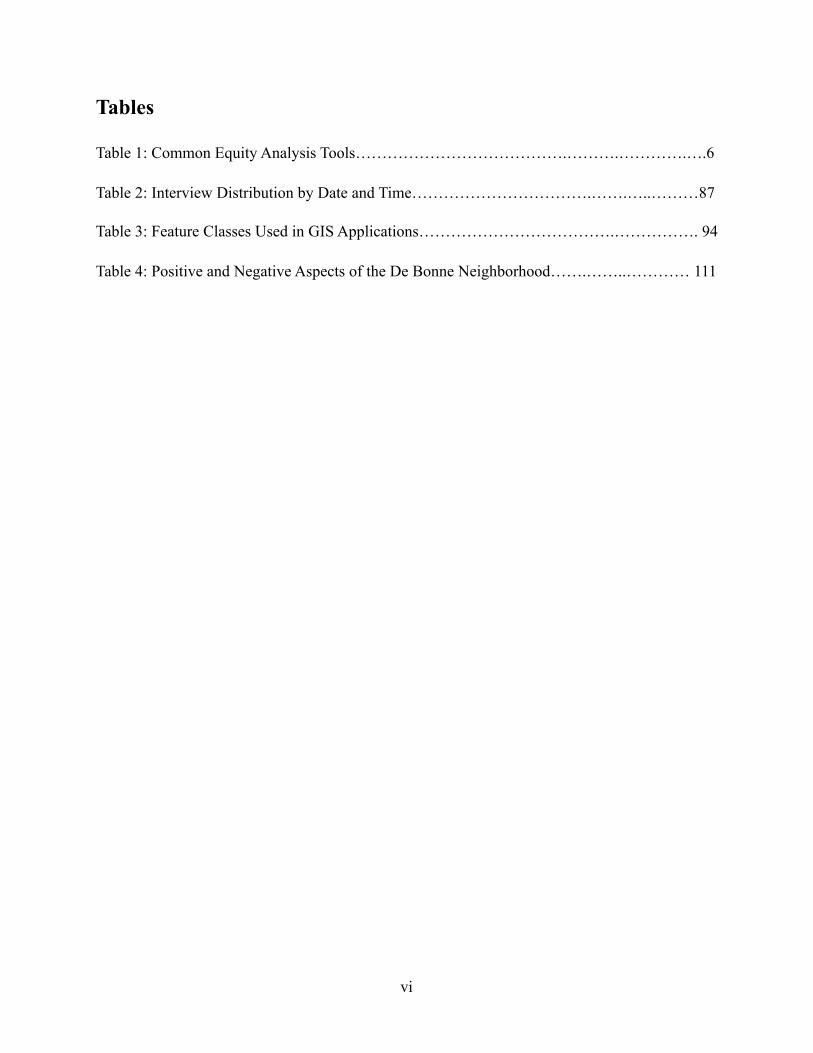
Tables
Table 1: Common Equity Analysis Tools………………………………….……….………….….6
Table 2: Interview Distribution by Date and Time…………………………….…….…..………87
Table 3: Feature Classes Used in GIS Applications……………………………….……………. 94
Table 4: Positive and Negative Aspects of the De Bonne Neighborhood…….……..………… 111
!vi
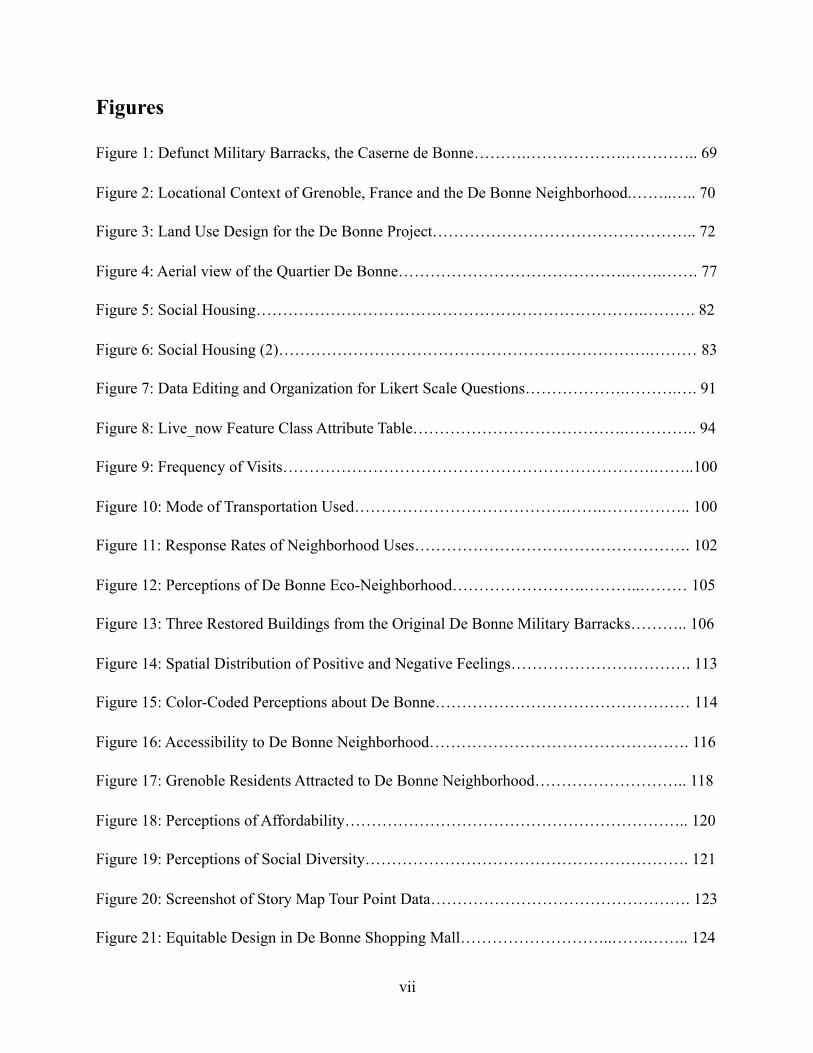
Figures
Figure 1: Defunct Military Barracks, the Caserne de Bonne……….……………….………….. 69
Figure 2: Locational Context of Grenoble, France and the De Bonne Neighborhood.……..….. 70
Figure 3: Land Use Design for the De Bonne Project………………………………………….. 72
Figure 4: Aerial view of the Quartier De Bonne…………………………………….…….……. 77
Figure 5: Social Housing……………………………………………………………….………. 82
Figure 6: Social Housing (2)…………………………………………………………….……… 83
Figure 7: Data Editing and Organization for Likert Scale Questions……………….……….…. 91
Figure 8: Live_now Feature Class Attribute Table………………………………….………….. 94
Figure 9: Frequency of Visits…………………………………………………………….……..100
Figure 10: Mode of Transportation Used………………………………….…….…………….. 100
Figure 11: Response Rates of Neighborhood Uses……………………………………………. 102
Figure 12: Perceptions of De Bonne Eco-Neighborhood…………………….………..……… 105
Figure 13: Three Restored Buildings from the Original De Bonne Military Barracks……….. 106
Figure 14: Spatial Distribution of Positive and Negative Feelings……………………………. 113
Figure 15: Color-Coded Perceptions about De Bonne………………………………………… 114
Figure 16: Accessibility to De Bonne Neighborhood…………………………………………. 116
Figure 17: Grenoble Residents Attracted to De Bonne Neighborhood……………………….. 118
Figure 18: Perceptions of Affordability……………………………………………………….. 120
Figure 19: Perceptions of Social Diversity……………………………………………………. 121
Figure 20: Screenshot of Story Map Tour Point Data…………………………………………. 123
Figure 21: Equitable Design in De Bonne Shopping Mall………………………..…….…….. 124
!vii
Figure 22: Neglected Private Gardens………………………………………………………… 124
Figure 23: Social Cohesion on Esplanade Le Ray…………………………………………….. 124
!viii
Chapter 1: Introduction and Overview
1. Introduction
Although cities around the world are growing rapidly in size, technological advancement,
and wealth, instances of social and economic inequality are on the rise. According to the
Organization for Economic Cooperation and Development (OECD), levels of income inequality
have increased seven-fold in the past 25 years in OECD countries (2016). High levels of income
inequality allude to government policies which fail to fairly distribute accumulated wealth to its
citizens primarily though the provision of public goods, services, and other amenities. This
wealth accumulation manifests itself in the form of the tax base which the government uses to
finance various projects which, in the broadest sense, aim to improve constituents’ quality of life.
Around the world, inequalities exist between individuals, between neighborhoods, and
between regions. It seems that these gaps are the most exacerbated in our cities where
globalization spurs economic growth and corporate enterprise, where mass migration to urban
areas is reshaping both physical and social spaces, and where cultural expression and diversity
highlight both our similarities and our differences. Cities have the potential to move their
diverse populations beyond urban co-habitation towards an equitable, co-creative society that
develops according to principles of social justice and sustainability as opposed to development in
fits and spurts in select areas for select people (PolicyLink, 2014).
This utopia is a difficult reality to achieve in today’s urban societies since a diverse
population naturally produces a myriad of interests, priorities, and values with a narrow common
ground. At the intersection of all conflicting visions for our metropolises is the urban planner.
!1
Attempting to improve the built environment while balancing economic, social, and
environmental imperatives, planners must adhere to local, state, and federal laws while taking
into consideration the contrary voices of city residents, city councilmembers, actors from the
private sector, and advocacy groups. Despite the good intentions of planners, many cities have
placed priority on developing downtown, commercial areas to attract investment or and increase
economic growth instead of introducing first and foremost projects and policies which strive to
reduce urban inequities (Krumholz, 1975; Krumholz, 1994).
Although globalization and the concentration of economic activity in cities have had a
major impact on the transformation of urban areas and the exacerbation of inequalities around
the world, some countries and their cities have been more successful in abating the widening
gaps between individual incomes and access to opportunities. As an important tool for
understanding global inequality, the GINI Index assigns countries a score based on an intricate
algorithm that measures a nation’s degree of inequality based on income distribution (CIA World
Factbook, 2013). When referencing this index, European and especially Scandinavian countries
have the lowest scores, thereby exemplifying the lowest levels of income inequality in the world
with scores roughly between 21 and 28 for the past several years (CIA World Factbook, 2013).
The U.S., in comparison, figures much higher on the list with a score of 45, sandwiched between
Peru and Cameroon, demonstrating greater income inequality than countries such as Russia
(41.2), Venezuela (39), and Iran (44.5) (CIA World Factbook, 2013). As previously mentioned,
urban planning and urban politics play a central role in creating, managing, and reducing
inequities as they touch the lives of all city residents. In this way, planners can either open doors
!2
of opportunity for residents or bolster existing barriers to economic, social, and environmental
fulfillment.
This research aims to understand the urban planning process and politics that contribute
to the experience of France. This country has a GINI score of 29.2, ranking 130th out of 150
countries on the GINI Index (CIA World Factbook, 2013). Considering this score, France
exhibits much less inequality in its broader society than the U.S.. Much of this can be attributed
to successes in urban areas since the vast majority of France’s population resides in the
metropolises of Paris, Marseille, and Lyon as well as its numerous agglomerations including
Nice, Bordeaux, Toulouse, Lille, and their smaller sister, Grenoble. By examining history,
philosophy, politics, and a case study in Grenoble, France, this research seeks to understand the
significance and manifestation of the concept of equity in a country shaped by a rich history, a
unique brand of democracy, and complex urban policy.
2. Research Problem Statement and Purpose
The case of France presents a unique look into urban politics, design, and process within
the context of reducing inequities due to its governmental structure, the evolution of French
urbanisme (urban planning), and socio-cultural understandings of basic human rights and the
role of the welfare state. In addition to these particularities, France, like several other European
countries, does not collect census data on race or — until very recently — household income. In
the U.S., planners have traditionally relied heavily on these two datasets for political decision-
making and post-project evaluation especially when addressing urban inequities. Due to this
!3
distinction, this research will first provide an overview of social equity and common equity
planning tools employed in the U.S. prior to exploring equity planning in France.
Social Equity and Equity Tools for U.S. Planners
Social equity, as it is understood within the field of equity planning, refers primarily to
the distribution of benefits and burdens — opportunities and challenges, conveniences and
inconveniences, positive effects and negative effects — among all members of society. Social
equity exists when benefits and burdens are distributed evenly between all socio-economic
groups. Because of the political and institutional design of modern society, the allocation of
benefits and burdens is ultimately based on the decisions of those with political power
(government officials, policy makers, etc.). Over the course of modern history, some such
decisions unfairly prioritized the allocation of benefits to certain demographic groups, thereby
creating and perpetuating instances of social inequity. In the context of urban planning, benefits
refer to many aspects of the built environment including access to job centers, dignified housing,
convenient public transportation, safe streets, access to public services, access to parks, and
many others. Burdens refer to the negative impacts of development and decision-making such as
unsafe pollution exposure, noise, unaffordable housing or services, blight, physically or socially
disconnected communities, and others. Benefits and burdens and how they are distributed can be
the result of action or inaction on behalf of elites. During the 1900s, U.S. cities quickly began to
see increased social inequities with racial and economic minority groups receiving a greater
share of societal burdens than their white counterparts (Krumholz, 1994). Equity planning arose
in response to this phenomenon in an effort to use the technical and political expertise of
!4
planners to counteract and prevent the unfair distribution of burdens to vulnerable groups
(Metzger, 1996).
For planners and policymakers interested in promoting more equitable urban
environments in the U.S. today, there are many tools available from a variety of different
sources. These tools range from data resources to assess current inequities and track progress
towards equity goals to federal policies that impose considerations of equity in the design of the
built environment. One thing that all equity analysis tools have in common is their multi-
dimensional structure. There is no existing tool that directly outlines the process a planner or
policymaker must undertake to ensure equity or to eradicate it since there is no single solution.
On the contrary, equity analysis is the complex pursuit of first identifying the inequities that exist
and then implementing a myriad of strategies in an attempt to more fairly distribute benefits and
burdens to target populations. For this reason, equity planners and other advocates for fairer
cities must exercise a broad understanding of urban complexities related to sociology,
economics, urban design, transportation, housing policy, statistics, and business development.
Often working in teams of experts to accomplish equity goals, planners and policymakers must
strive to understand how these individual components of a city’s dynamics contribute to existing
inequities, how they influence each other, and how they can be manipulated for the betterment of
society as a whole.
Table 1 (Common Equity Analysis Tools, below) provides a brief overview of several
equity analysis tools used in the U.S in various contexts. This table provides a non-exhaustive
list of these tools and is meant to illustrate the diverse toolsets available to planners and decision-
makers. In addition to the multi-dimensional approaches utilized by these tools, each resource
!5
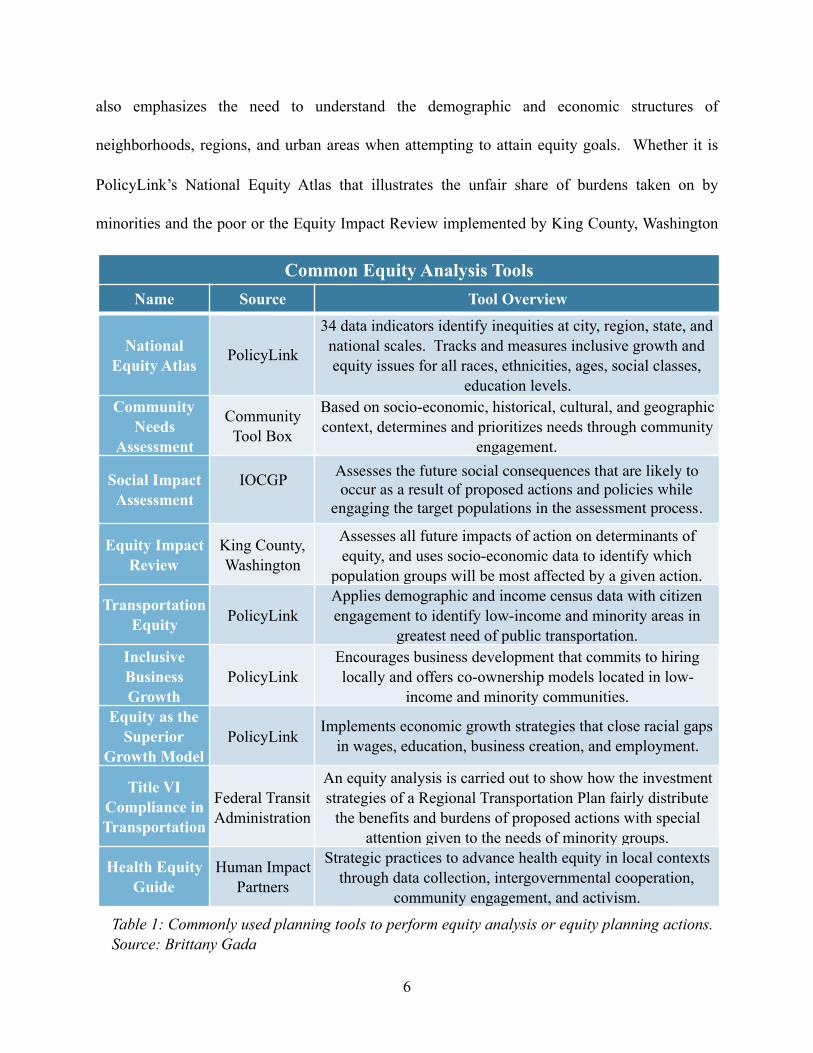
also emphasizes the need to understand the demographic and economic structures of
neighborhoods, regions, and urban areas when attempting to attain equity goals. Whether it is
PolicyLink’s National Equity Atlas that illustrates the unfair share of burdens taken on by
minorities and the poor or the Equity Impact Review implemented by King County, Washington
!6
Common Equity Analysis ToolsName Source Tool Overview
National Equity Atlas
PolicyLink
34 data indicators identify inequities at city, region, state, and national scales. Tracks and measures inclusive growth and equity issues for all races, ethnicities, ages, social classes,
education levels.Community
Needs Assessment
Community Tool Box
Based on socio-economic, historical, cultural, and geographic context, determines and prioritizes needs through community
engagement.
Social Impact Assessment
IOCGP Assesses the future social consequences that are likely to occur as a result of proposed actions and policies while
engaging the target populations in the assessment process.
Equity Impact Review
King County, Washington
Assesses all future impacts of action on determinants of equity, and uses socio-economic data to identify which
population groups will be most affected by a given action.
Transportation Equity PolicyLink
Applies demographic and income census data with citizen engagement to identify low-income and minority areas in
greatest need of public transportation.Inclusive Business Growth
PolicyLinkEncourages business development that commits to hiring locally and offers co-ownership models located in low-
income and minority communities.Equity as the
Superior Growth Model
PolicyLinkImplements economic growth strategies that close racial gaps
in wages, education, business creation, and employment.
Title VI Compliance in Transportation
Federal Transit Administration
An equity analysis is carried out to show how the investment strategies of a Regional Transportation Plan fairly distribute
the benefits and burdens of proposed actions with special attention given to the needs of minority groups.
Health Equity Guide
Human Impact Partners
Strategic practices to advance health equity in local contexts through data collection, intergovernmental cooperation,
community engagement, and activism.
Table 1: Commonly used planning tools to perform equity analysis or equity planning actions. Source: Brittany Gada
that requires planners to identify which socio-economic groups will be most affected by an
action, equity tools rely heavily on census data related to race and income (PolicyLink, 2016;
King County, Washington, 2010). Without this data, transportation planners, for example,
receiving federal funds would not be able to comply with the federal government’s Title VI
regulations of the Civil Rights Act of 1964 which requires documented proof that no racial
discrimination occurred in project design or fund allocation often through the use of an equity
analysis (Office for Civil Rights, 2013; FTA, 2016). As a result of such federal regulations but
primarily due to entrenched methodologies surrounding equity analysis and planning, U.S.
planners and policymakers will find that all of the tools at their disposition (such as those seen in
Table 1) prioritize action for the explicit benefit of target populations identified as high-need,
vulnerable, at-risk, or disadvantaged based on race and household income characteristics.
Research Problem Statement
Taking into account this understanding of equity, the equity tools traditionally used in the
U.S., and the focus on race and income data collected by the U.S. Census, the constraints placed
on equity planners wishing to apply similar tools in France become clear considering the lack of
racial data and the limited availability of income data. To explore how French planners and
policymakers understand equity and attempt to address equity issues considering this major
difference in data availability and methodology, this research will adopt the following problem
statement:
How do French urban planners define social equity and seek to promote it through planning policies and projects without access to quantitative data on race and, until recently, income?
!7
The general purpose of this research is to first explore the French conceptualization of
equity and to then evaluate the various equity outcomes of a chosen planning project. Evaluation
is conducted using qualitative methods to identify areas of success and potential areas of
improvement surrounding equity goals. This research defines social equity as even access to
services and opportunities across income and cultural groups (Litman, 2014). Based on this
understanding of the term, a review of political history, philosophy, and legal codes surrounding
French urban planning is first undertaken.
Next, this is accompanied by a case study of an eco-neighborhood project in Grenoble,
France. This city, located in the heart of the French Alps, exhibits a very dense urban
environment surrounded by mountains on all sides. Historically an industrial city, Grenoble has
since transitioned to become France’s leading research hub. Not only is this city unique in
France due to its highly-developed tertiary economy, Grenoble has also set itself apart in recent
years by electing France’s first Green Party Mayor showing a city-wide dedication to
environmentalism and innovation. The chosen case study, the De Bonne Eco-Neighborhood
project, resulted from the unique combination of these qualities as it demanded the dense
construction pattern, technical expertise, and political will necessary to successfully execute such
a project.
The case study portion of this research identifies the ways in which social equity was
operationalized in the design and implementation of Grenoble’s De Bonne Eco-Neighborhood
project. This eco-project’s success in meeting equity goals is evaluated using georeferenced,
qualitative data on community perceptions of the space in terms of equity ideals including
affordability, accessibility, and others. Based on this assessment, the analysis ultimately reveals
!8
ways in which qualitative data can be used to create more effective, nuanced equity planning
strategies and evaluation methods for use by planning departments in France, the United States,
and further afield.
This research uses Grenoble’s De Bonne Eco-Neighborhood project as a case study for
the following reasons:
1. As the second-most innovative city in Europe as awarded by the European Commission’s
iCapital contest, this medium-sized city has implemented a wide variety of strategies to
address its urban challenges, including socio-economic disparities between the city center
and the periphery, public transit needs, and affordable housing shortages (2014);
2. European cities tend to exhibit more robust, integrated planning methods that target
equity issues while also promoting sustainability. The variety of methods used by the De
Bonne project brings forth new strategies for use in other cities in diverse contexts
seeking to counteract inequities;
3. Although Grenoble is small in comparison to most global cities (with a population of
approximately 160,000), it presents many of the same challenges as its larger
counterparts such as disproportionate crime levels across neighborhoods, limited land
available for new development and construction, rising pollution levels, among others.
Therefore, Grenoble offers a generalizable case for comparison with other cities
interested in urban planning strategies to target growing inequities.
3. Research Questions
To respond to the research problem, this study will address the following research questions:
!9
• Do French urban planners define social equity in the same way as U.S. planners?
• Do French urban planners use different equity planning tools than American planners
considering the omission of racial data and until recently income data?
• Did the City of Grenoble, France’s eco-neighborhood De Bonne project strive to alleviate
inequities through the project’s design and implementation?
• Is it possible to use qualitative data to assess the equity outcomes of the De Bonne
project?
• Can U.S. planners benefit from the use of qualitative data when designing and assessing
projects meant to reduce inequities?
4. Definitions
In order to respond in both an accurate and comprehensive manner to the aforementioned
research questions, it is necessary to define and expand upon concepts explored by this research.
The following terms have been considered:
Equality (versus Equity) refers to the even distribution of goods and services without
consideration of demographic, social, cultural, ability-related, gender, economic, or other
differences in our societies. Everyone pays into the system, and everyone receives the same
share of costs and benefits (Litman, 2014). Equality can be juxtaposed with the idea of equity
which takes into account the societal differences, historical implications, and racial/ethnic
prejudices that have led to the creation of policies and actions that unfairly affect certain
population groups.
!10
Social Equity is a key consideration of advocacy planning, equity planning, and
sustainable development. It signifies the need to attain “fairness of cost/benefit distributions over
space and across different population groups” (Farber et al., 2013). The concept of equity has
been analyzed through several different lenses and the following types of equity have been
proliferated in contemporary research:
• Horizontal Equity closely relates to the idea of equality in that it signifies the “equal
treatment of equals” (Litman, 2014). In this way, everyone, regardless of any socio-
economic or cultural trait, is treated in the same manner and receives the same share of
the cost-benefit burden as a result of planning and policy actions.
• Vertical Equity (based on income and social class) focuses on the economic and social
needs of populations to better distribute resources to groups with a higher identified need
(Litman, 2014). Other terms associated with this type of vertical equity are social justice,
environmental justice, and social inclusion. Planning that addresses equity in this way
would allocate more resources to low-income and minority groups and less resources to
higher-income and white groups to compensate for existing inequities (Rawls, as cited in
Litman, 2014). Vertical equity as it relates to income and social class will be used as the
general understanding for the terms “equity” and “social equity” for the purposes of this
research.
• Vertical Equity (based on need and physical ability) is most typically referenced in
transportation planning and mobility studies. It addresses the need for “universal designs”
and systems that meet the needs of all travelers, including those with special mobility
needs (Litman, 2014).
!11
Advocacy Planning is an urban planning framework, adopted by this research as a lens,
introduced by planning scholar, Paul Davidoff, in his 1960 article “Advocacy and Pluralism in
Planning”. This framework challenged long-held planning beliefs that planning is an apolitical
professional field that is restricted to the physical space (Krumholz, 1994). Opening up the
planning field to questions of social justice, equity, and inclusivity in the planning process, the
profession expanded into the world of urban politics and policymaking (Krumholz, 1994).
Equity Planning is a discipline in the realm of urban planning that uses the principles of
Davidoff’s Advocacy Planning framework to inform professional actions and obligations. Using
advocacy planning as a guide, the field of equity planning “deliberately [seeks] to redistribute
power, resources, or participation away from local elites and toward poor and working-class city
residents” (Krumholz, 1994). This is accomplished by working against downtown-centric
planning models, engaging with local community groups to collaboratively identify needs, and
promoting progressive politics at the local level through community activism. The work of
equity planners if typically concentrated in urban areas where instances of racial and economic
inequalities are the most pronounced.
Geospatial Information Systems (GIS) is defined as a branch of information
technology that supports the storage, management, retrieval, manipulation, display, modeling and
analysis of geographic information (Delaney, as citied in Taylor and Lange, 2016). Used across
many professional disciplines, the primary uses of GIS in urban planning are for project and
policy development pertaining to land use, zoning, infrastructure development, new construction,
and other forms of spatial planning.
!12
Qualitative GIS (QGIS) is an emerging sub-field of GIS that has developed from critical
geographic perspectives that seek to focus GIS work “on the individual and the local” due to a
need for “alternative cartographies that represent the diversity and complexity of peoples’ lived
experiences” (Dorling & Kwan, as cited in Boschmann & Cubbon, 2014). Specifically, QGIS
attempts to “[collect] unique spatial data of individual experiences, [visualize] socio-spatial
processes, [break] down particular barriers of positionality in research, and [develop] new uses
of GIS (Boschmann & Cubbon, 2014).
Sustainable Development is a type of territorial development that “maintains or
enhances economic opportunity and community well-being while protecting and restoring the
natural environment upon which people and economies depend” (Davidson and Dolnick, 2004).
This definition has been interpreted in various ways:
• The Three-Legged Stool conceptualization of sustainable development refers to the need
for all policies and initiatives to uphold the three pillars of sustainable development —
environmental conservation, social justice, and economic development. Without equal
distribution of weight (importance) to all three legs of the stool, sustainable development
will not be accomplished. The Three-Legged Stool applies to all circumstances and
places where sustainable development is sought such as in both the public and private
sectors and in rural, suburban, and urban areas.
• The Brundtland Report, officially titled “Our Common Future” released by the United
Nations World Commission on Environment and Development, first defined sustainable
development as “the ability to make development sustainable to ensure that it meets the
needs of the present without compromising the ability of future generations to meet their
!13
own needs” (1987). This original definition marked the beginning of a global initiative
towards sustainability and resiliency in the face of the risks presented to future
generations by climate change.
• The United Nations’ 17 Objectives of Sustainable Development, adopted in 2015,
represent perhaps the most comprehensive operationalization of sustainable development
principles. Expanding upon both the three-legged stool conceptualization and the
Brundtland Report, the 17 objectives detail specific global action items related to social
structures, the economy, and the environment to be accomplished in a 15-year time
frame. Examples of the objectives are: eradicating poverty and hunger, spreading good
health and well-being, reducing inequalities, supplying affordable and clean energy,
creating decent work and economic growth, taking action on climate change, and
developing sustainable cities and communities (United Nations, n.d.).
Eco-Neighborhood (écoquartier) is a mixed-land use development that adheres to all
three pillars of sustainable development practice, social justice, environmental protection and
conservation, and economic development. In doing so, an eco-neighborhood incorporates
methods for energy production and conservation, affordable housing and other social services,
the promotion of active modes of transportation, and robust, local economic development
strategies.
Social Housing in the context of France takes on a slightly different meaning and
operationalization than in the United States. In addition to having price ceilings per meter
squared, social housing units are built with federal financial support including public subsidies,
special interest loans, and other fiscal benefits to construct housing affordable for those low-
!14
income households deemed eligible. Similar to the United States, social housing in France is
considered either locatif (for rent) or ascension à la propriété (for sale). To the French public,
social housing is known as HLM or Moderated-Income Housing. Social housing costs are
historically two or three times less per meter squared than the costs of private housing (Ministère
de la Cohésion des Territoires, 2016, personal translation). However, the price per meter squared
depends on which of the three eligibility categories (very low income, low income, and middle
income) the household is given based on monthly income. Affordable housing policy and
construction is one of the primary strategies used in France to alleviate social inequities.
5. Scope of the Research
The proposed research is carried out in two parts. In response to the first two research
questions concerning conceptions of equity in French urban planning and its operationalization,
this research begins with a brief exploration of equity planning in the United States followed by
an in-depth look into the philosophical and legal histories of France that have contributed to
pursuits of equity in that country. The differences in the definitions of equity and the tools used
to assess it and alleviate it in both countries is then discussed. The second part of this research
analyzes one chosen case study for its methods and efficacy in promoting equity outcomes in
response to the third research question. The research only considers a single case study in the
interest of designing a manageable research agenda. On the one hand, this limits the scope of the
research. While on the other hand, it allows for a more in-depth consideration of the project’s
design and implementation process. Finally, the implications of incorporating more qualitative
!15
research into the field of urban planning are discussed, specifically through the use of GIS and
QGIS techniques in response to the final two research questions.
In order to conduct an assessment of the conceptualization and operationalization of
equity in France, the research is conducted through the lens of an advocacy planning framework.
Davidoff’s planning model is the precursory model to the later field of equity planning. By
definition, Advocacy Planning is “a framework in which advocacy planners in government use
their research, analytical, and organizing skills to influence opinion, mobilize underrepresented
constituencies, and advance and perhaps implement policies and programs that redistribute
public and private resources to the poor and working class in cities” (Metzger, 1996: 113). The
model dictates that planners take an active, professional role in promoting the needs and interests
of these groups in a way that directs their expertise away from physical and land-use planning
models and towards addressing urgent social and economic issues of the time (Metzger, 1996).
According to the model, any group or person who does not feel empowered to participate in the
planning process should be directly sought out by planners to identify his/her needs and the
needs of the community before addressing them through planning action (Metzger, 1996).
Through this framework, the chosen case study, Grenoble’s quartier (neighborhood) De
Bonne eco-neighborhood project, is analyzed to assess how well it addressed the needs of
various groups, especially those who are typically underrepresented in city planning, to promote
social equity. This project was chosen due to its consideration for the following advocacy
planning principles: 1) The quartier De Bonne project attempted to serve diverse needs of
disadvantaged populations and underserved groups with a special focus on low-income groups
and families; 2) It presented a stated purpose of redistributing resources to those populations; and
!16
3) The project made a demonstrable, meaningful impact in the community and presents a
generalizable, meaningful case for other cities.
Grenoble’s quartier De Bonne eco-neighborhood project began in 2001 and was
gradually completed in 2010. The endeavor transformed approximately 21 acres of public land
within blocks of downtown and sought to increase accessibility for residents, create a vibrant
local economy, encourage socio-economic diversity, and uphold strict, self-imposed
environmental standards for all development at the site (Centre de ressources PCET, 2014). In
order to accomplish these goals, the City of Grenoble partnered with private investment firms,
local development contractors, and architectural and design agencies to develop five hectares of
public green space, construct 435 new housing units (of which social housing comprises 40%),
renovate 415 existing housing units, and bring in one hotel, thirty new businesses, additional
services and leisure facilities, and new office space (Centre de ressources PCET, 2014). All new
and renovated development was required to conserve natural resources, produce more energy
than the structure consumes, and encourage soft modes of transportation (Centre de ressources
PCET, 2014). Furthermore, the quartier De Bonne project successfully used infill strategies to
create new development in a dense built environment as well as innovative de-zoning techniques
to encourage social and economic diversity in addition to walkability.
Chapter 2: Literature Review
This review first examines the rise of equity planning as a framework and as a discipline
in urban planning in a U.S. context. Next, literature and government documents pertaining to
historical and socio-political conceptions of equity in French urban planning are explored. This
!17
addresses the first two research questions which consider the concept of equity and its
operationalization through policies and tools in this particular context. Additionally, the French
understanding of equity will also be explored through a glance at several major urban thinkers
from the 20th century. Then, the existing importance of GIS in urban planning is examined.
Finally, this review examines literature that discusses the potential opportunities that Qualitative
GIS methods offer to the fields of urban planning and equity planning in cities everywhere.
1. Equity Planning as a Movement and a Discipline
Since the beginning of organized, professional urban planning within the context of local
government in the early 1900s, there have been a number of urban planning models and
movements which caught the attention of some and the scorn of others within the field.
Throughout the 1900s, urban planning focused its attention and expertise on land-use planning
and the physical development of urban space typically following a downtown-centric planning
model which favored infrastructure development, business creation, real estate, and zoning
regulation (Metzger, 1996). Priority was placed on adding to and improving the built
environment of urban centers, and while many of these initiatives aimed to help members of the
working class, large economic and racial disparities quickly erupted (Duerksen, Dale, & Elliott,
2013).
In response, several planners banded together to form the social reform movement of the
1950s and 1960s led by the voices of Jane Jacobs, Michael Harrington, and Jacob Riis. The
central message of this movement was to design planning strategies in such a way that they
would alleviate poverty, improve the quality of life of the most vulnerable, and promote equal
!18
access to amenities and opportunity (Duerksen, Dale, & Elliott, 2013). Elements of the social
reform movement have endured and been incorporated into today’s urban politics and planning
models.
Despite this movement, downtown-centric planning continued to dominate the field of
urban planning. As business districts boomed and new real estate blossomed, socio-economic
inequities continued to grow. During the 1960s, it became clear that the disparities were more
exasperated than ever before. Some planners realized that the urban renewal strategies of the
previous decade and traditional planning models in general had failed to address the needs of the
poor and often caused disadvantaged populations more harm than good (Metzger, 1996). Led by
planner and lawyer, Paul Davidoff, the advocacy planning model emerged in which professional
planners were tasked with forgoing traditional land-use planning strategies and becoming
advocates for the poor’s social and economic needs (Metzger, 1996).
Advocacy planning has become an urban planning framework that informs the field of
equity planning. This professional field developed when a small group of planners decided to
bring advocacy planning ideals into a local government planning context. Today, advocacy
planning and equity planning are often used interchangeably, however, the structures these two
models take on in government are rather different. For advocacy planning, Davidoff imagined a
much different organizational structure in comparison with traditional planning departments.
Advocacy planners would primarily work out in the field connecting with populations and
designing planning proposals on their behalf, thereby giving voice to underrepresented groups in
the planning process (Davidoff, 1965). For Davidoff, advocacy planning would open up the
arena of planning processes to allow for more debate and education of the public in order to
!19
foster competitiveness which would yield more nuanced, effective planning policies to address
social inequities (Forester, 1994). Equity planners, on the other hand, attempt to promote the
central principles of advocacy planning within the organization and rules of conduct associated
with city planning departments. Equity planners use their skills, familiarity with city politics and
planning regulations, and professional resources to mobilize the underrepresented and promote
policies that redistribute public and private resources more fairly (Metzger, 1996).
In this way, Davidoff’s advocacy planning model infiltrated city governments around the
United States through equity planners of the 1970s and 1980s such as Norman Krumholz in
Cleveland and Robert Mier in Chicago. Politically supported by progressive mayors who were in
favor of a pluralist agenda, these equity planners used the principles of advocacy planning in the
design of comprehensive plans and planning department objectives that promoted social equity,
equity of access and mobility, and equity of economic opportunity for disadvantaged populations
(Clavel, 1994; Metzger, 1996). Not all equity planners, however, experienced the same successes
as Krumholz and Mier. Throughout the same time period, some equity planners struggled to
gain support for their planning vision and many reported feeling as if they were swimming
upstream or trying to mobilize resources that systematically worked against social equity goals
(Krumholz & Clavel, 1994).
Equity planning as a framework and a profession faced a great deal of backlash from
traditional planners and some members of academia. One such critic of advocacy planning,
Frances Fox Piven, raised questions about advocacy planners’ inability to contribute alternate
planning methods to accomplish equity goals after the failure of urban renewal policies (Cloward
& Piven, 1974). Piven argued against the utility of incorporating public participation into the
!20
technical planning process, insisting that advocacy planning is not the most effective way to
bring about societal change and assist the poor (Cloward & Piven, 1974). Despite this criticism,
several American cities such as Santa Monica, Berkley, Burlington, and Hartford succeeded in
electing progressive mayors and council members in the 1980s and 1990s who promoted
advocacy planning principles and strategies of citizen participation and redistribution of wealth
(Clavel, 1986).
Today, many cities in the United States exhibit mission statements, planning department
objectives, or focus groups dedicated to promoting equity in urban planning. One city leading
this trend is Seattle, Washington whose mayor seeks to build thriving communities through
integrated and equitable financial means and planning methods (City of Seattle, 2016).
Currently, Seattle is actively encouraging the development of a more equitable urban space
through initiatives such as the Housing Affordability and Livability Agenda which combines
principles of advocacy planning (such as redistribution of resources, direct citizen engagement,
and protection of the disadvantaged through policy) with traditional land-use planning methods
that re-zone residential areas to facilitate mandatory affordable housing units in all new multi-
family housing constructions (City of Seattle, 2016).
Additionally, King County, Washington passed the Equity and Social Justice Ordinance
which defines the multidisciplinary approach necessary for this region to reduce injustices by
considering equity in all decisions to increase fairness and opportunity for racial minorities, low-
income groups, and low English-proficiency populations (2010). This ordinance requires the use
of the Equity Impact Review tool (also noted in Table 1) in certain scenarios to guarantee that the
potential impacts of a policy decision or government action are identified and that the negative
!21
effects towards disadvantaged groups are mitigated (King County, 2010). Although King County
and Seattle continue to exhibit severe inequities in terms of access to housing, exposure to
pollution, and distribution of wealth, these governments have begun the complex process of
attempting to reduce inequities throughout times of strong economic growth (2016).
In France, Grenoble is an urban leader in equitable development that uses planning to
encourage social cohesion, economic growth, and environmental justice. For example,
expansion of Grenoble’s tramway beginning in 2013 actively attempts to link peripheral
neighborhoods to job and transit centers (train station and bus depots) (SMTC, 2014). Of the
new construction, one new tramway line in particular intentionally connects lower-income
communities to the city center to provide more convenient access to urban amenities and
employment opportunities. Another transit program lowered tariffs for low-income adults,
young adults, students, children, and the elderly starting on September 1, 2015 (SMTC, 2014).
Other actions include lowering the speed limit within city limits to reduce pollution burdens on
residents in proximity to major roads, creating a pool of funds to finance citizen-led projects, and
developing an online platform to quickly connect at-risk individuals with the services they need
(City of Grenoble, 2017).
The examples of Seattle and Grenoble demonstrate the core principles of advocacy
planning and equity planning methods. These cities promote equity while operating within the
context of local government and promoting direct lines of communication between community
members, planners, and city politicians. However, despite these successes and increased attention
to equity issues in local government, urban inequity in general is still on the rise in the United
States. As a result, equity planners continue to seek more innovative ways of incorporating the
!22
ideals of equity planning leaders like Davidoff and Krumholz. In order to effectively redistribute
public resources and create a more equitable city, integrated policy solutions designed through
public input and debate must be prioritized.
2. A Brief History of Urban Planning in France and Post-World War II Policy
The Start of French Urbanisme
Urban planning, or urbanisme, in France dates back to the middle ages when population
growth and commercial activity in Paris began to necessitate the organized planning of streets,
public spaces, and sewer and solid waste disposal. As Paris’s arrondissements developed, so too
did its unique brand of architectural heritage and urbanisme. In the mid-1800s, the physical
fabric of Paris was changed forever by Georges-Eugène Haussmann, also known as the Baron
Haussmann, who was arguably the most influential planner in French urban history. This
controversial public figure, appointed Prefect of the Seine by Emperor Napoléon III, brought
blighted, densely populated areas (deemed slums) crumbling to the ground in the name of urban
renewal to be replaced by Paris’s iconic, wide boulevards that now criss-cross the capital.
Bringing outrage from some and praise from others, Haussmann effectively redesigned
the city of Paris by the end of his tenure as a public servant. Not only did Baron Haussmann
commission several iconic buildings of Paris such as the Palais Garnier and Les Halles, he also
accomplished the following: 1) installed the city’s first sewer system, 2) extended the network of
city streets from 670km to 845km, 3) expanded the length of the drinkable water system by
nearly 1,000km, 4) planted 80,000 trees, 5) equipped nearly 20,000 more Parisian households
!23
with gas hookups, and 6) lengthened city sidewalks to a 2,000km long network by 1870
(Willsher, 2016).
Quantitative changes to the French capital also came with more qualitative undertakings
as well. Napoléon III also mandated an upheaval of qualitative housing standards to rid the city
of rampant disease caused by poor housing conditions and unsanitary treatment of sewage.
Haussmann used urban design to ensure well-lit and well-ventilated housing by mandating the
following building regulations: 1) building heights must take into account the width of the street
in order to ensure sunlight reaches the entire facade and 2) 25% of the îlot, or block, must remain
unbuilt (typically the center cour, or courtyard) to guarantee air-flow and sunlight. Despite the
controversies surrounding slum removal and elitist architecture, Haussmann single-handedly
shaped the planning traditions of Paris and left his mark in many French cities that followed his
lead in urban design throughout the following decades.
WWII and its Lasting Effect on French Urban Form and Housing Policy
Paris, and the rest of France, experienced a major shift in urban planning following the
destruction of nearly two million housing units brought on by World War II (Vayssière, 2004).
The results of the six-year war coupled with an additional 450,000 units deemed insalubrious by
the French government caused a severe quantitative and qualitative housing shortage (Vayssière,
2004). Despite the obvious lack of housing, the French state focused its resources in
industrialization instead of growing the real estate market (Cupers, 2011). As a result, by 1955
the housing crisis had developed into a four million unit shortage due to slow, post-war housing
construction, an urban population boom, and even more housing deemed unfit for habitation
(Vayssière, 2004).
!24
The French government had no choice but to take on the shortage as a national initiative.
This pivot not only asserted the role of the state in the urban planning sector, it also entrenched
the concept of social housing into French politics as a public good to be provided by the state to
all citizens (Cupers, 2011). The heavy hand of the French government during this time is evident
in the text of the Plan Courant which normalized social housing construction standards,
introduced several national funding schemes to facilitate rapid housing construction, and
launched the national campaign for mass housing developments, known as the grands ensembles
(Cupers, 2011).
The grands ensembles quickly began to develop on the outskirts of all major French
cities. By definition these mass housing structures were low-cost, largely prefabricated
constructions designed for a universal user identified as a working-class, nuclear, French family
(Cupers, 2011). Always located at the urban periphery, the grands ensembles housed thousands
of families, sometimes with as many as 15,000 residents (Newsome, 2005). During this period
of large-scale urbanization of the suburbs, the French government introduced two new legislative
tools in 1958 — first, the designation of a ZUP, an Urban Development Priority Zone of 500
housing units or more and second, the introduction of zoning laws in France (EPF Nord-Pas-De-
Calais, 2009). The ZUP designation by the Ministry of Construction and the new zoning laws
granted the national government even more control over the development of the grands
ensembles. Over the course of the next decade, the grands ensembles were replicated across the
country, and in 1965 alone, France added over 400,000 units to its housing stock (Cupers, 2011).
At this time in French urbanisme, the role of planning in society was very clear. Namely,
it was the role of the government to procure land and construct basic amenities for the working
!25
class. These actions were undertaken by necessity due to the housing crises of the mid-1940s to
mid-1950s as opposed to by moral imperative on behalf of the state. As the role of the French
government in housing construction and city planning became more and more profound,
standardization of the public need became the norm. The peripheral, mega-structures of the
grands ensembles that erupted out of the principle of the universal user were quickly labeled as
out-of-touch with the real needs of its residents as well as physically and socially disconnected
from the rest of the city (Cupers, 2011). In this way, the grands ensembles exacerbated existing
spatial inequalities between the upper-class and the working and middle classes where the latter
became effectively annexed to the periphery of the city and therefore further removed from
urban services and amenities.
By the late 1950s, controversy had erupted around the grands ensembles even though
large-scale construction continued to take place across the country. Journalists began labeling
these massive housing structures as “dormitory suburbs” and “silos for people” (Cupers, 2011).
Protests quickly erupted in major urban hubs across the country to combat the future construction
of the grands ensembles and to insist to the French government that these large, lifeless housing
complexes required improved amenities to facilitate social cohesion and a better quality of life
for residents (Cupers, 2011). Localized protests like that of the grand ensemble of Sarcelles
outside of Paris quickly developed into a national outcry, and by 1977 the French government
had massively limited its role in city planning and housing construction. By reducing financial
assistance for new construction investments, eliminating the ZUP designation, and changing the
French standard for social housing design and implementation, the national government gave
way for local and private forces to act (Cupers, 2011).
!26
The controversy of the grands ensembles and the epistemological repercussions of mass,
standardized housing also led to a key provision of the French urban planning process — the
importance of participation in planning (Cupers, 2011). First identified simply as user input, this
introduced a new, qualitative mainstay of urban planning design, research, and procedure. Public
participation was seen as a means to better understand the needs of communities in order to
avoid the universal designs that contributed to the demise of the grands ensembles. The
significance of qualitative input in planning grew from the late-1970s until the late-1990s when
citizen participation was written into French law under the Loi Voynet (EPF Nord-Pas-De-Calais,
2009).
Decentralization of Government Competencies and its Effect on Urban Planning Practice
With the importance of qualitative information in urban planning through citizen
engagement established on a national scale, French urbanisme experienced a drastic change in
comparison with the previous thirty years in terms of national priorities and roles. Large-scale,
low-cost, rapid construction agendas gave way to a more qualitative focus on the physical state
of housing units and their social integration with other units, other neighborhoods, and with the
rest of the city. Architectural trends changed as a result, and housing construction slowed. The
government introduced new laws aimed at improving both the built and natural environments
with legislation that regulated population density (1975) and protected natural spaces and species
(1976). This new shift culminated in the adoption of the Lois Defferre, also known as the lois de
décentralisation, in which the state distributed urban planning competencies and funding
methods to various administrative scales — the communes (towns or cities), the départements
(departments), and the régions (regions) (EPF Nord-Pas-De-Calais, 2009).
!27
Since the lois de décentralisation came into effect, local authorities across France have
had the greatest influence on the design and development of urban areas. Although the state still
directs national agendas in various sectors, it is the responsibility of the towns, departments, and
regions to coordinate and complete projects, documents, and public investments related to urban
planning and social welfare. Regions and departments play limited, but crucial roles in urban
planning as well as the provision of basic state-funded services. For example, regions, the
largest of the new administrative areas, are in charge of all aspects of the built and natural
environments that span across multiple departments. Specifically, France’s 26 regions manage
regional natural parks (PNR) such as the PNR of the Chartreuse in the French Alps. Regions
must also direct the construction and maintenance of all regional transportation such as airports
and all Regional Express Transport (TER) train and bus services (Tabarly, 2009). Broad regional
politics and planning agendas are directed by the SRADT planning document (Schéma régional
d’ aménagement et du développement du territoire [Regional Outline of Planning and Territorial
Development]) which is designed and implemented by regional agencies called DREALs
(Regional Management of the Environment, Planning, and Housing) (Delmas, 2011).
In comparison with regions, France’s 96 departments are primarily in charge of social
policy and social welfare services including child welfare, disability, social and professional
integration, housing services for the disabled and the elderly, and unemployment services
(Arsenault, 2005). In addition to its welfare activities, departments play an essential role in the
French hierarchical planning structure in which departments implement the agendas set by the
regional DREALs through the SRADT. The department’s planning agency, the DDT
(Departmental Management of Territories), carries out this task. Although the department’s role
!28
in planning is limited to the maintenance of departmental roads and school transportation, its role
in providing for the social needs of all residents is a vital companion to the more technical
competencies directed to France’s most local authoritative scale, the commune.
Following the lois de décentralisation, France saw a major shift in the political roles of
local governing bodies with French cities seeing the largest boost in planning-related
competencies. Throughout this transition, mayors and even deputy mayors in France’s larger
cities experienced increased political power that put them at the center of local public
policymaking (Le Galès, 2001). Mayors along with city councils exercise considerable authority
in the development policies, objectives, and projects that occur in French cities in part due to the
legal resources at their disposition since the decentralization process in the mid-1980s. While
mayors often set broad development objectives, it is the PLU (Plan local d’urbanisme [Local
Plan for Urban Planning]) planning document that articulates the city’s planning agenda in
alignment with the national planning objectives established in France’s Urban Planning Code.
Based on these objectives detailed in Article L101-2 of the code, cities must strive to: protect and
conserve natural, cultural, and built heritage; promote both urban and rural development;
prioritize mixed-use land uses and social housing construction; reduce automobile use and all
sources of pollution; improve energy performance; and guarantee a high-quality built
environment (Legifrance, 2017).
With this shift in planning procedure also came a shift in the ideology of French
urbanisme. Previously, the only responsibility of the public sector, in this case the French
government, was to construct the built environment. Now, the goal of urban planning in France
is to directly improve the lives of its citizens through urban and social projects (Delmas, 2011).
!29
Not only does urban planning encompass issues of physical space, it now must contend with
economic, social, political, and environmental challenges. These new imperatives were gradually
laid out by French law after the lois de décentralisation through various legislative acts as seen
in the example of Article L101-2 above. Other laws have also detailed the public goods to be
provided through organized planning such as transportation and social housing. The mandatory
provision of certain amenities and services to all was soon accompanied by several laws insisting
upon the role of cities in reducing social inequalities and exclusions, promoting diversity and
social cohesion, and facilitating residents’ access to economic, cultural, and educative
opportunities (EPF Nord-Pas-De-Calais, 2009). Although never explicitly mentioned, the
underlying concepts of equality, the public good, and equity can be seen within the text of these
laws which will be explored in detail in the second part of section 2.3.
3. Équité à la Française and its Role in Urban Planning Today
Major Thinkers in the French Urban Thought
France has a rich history of urban sociology, philosophy, and planning that has resonated
with urban actors around the world since the beginning of the 20th century. Although this is not
an exhaustive exploration of major French thinkers in this discipline, three different voices in the
movement to incorporate the social aspect of human existence into planning are laid out. These
voices — a philosopher, a clergyman, and a planner — had unique understandings of urban life,
the role of the state, and the importance of social dynamics. A review of the literature written by
and about these three great minds begins with Henri Lefebvre’s concept of the right to the city,
then explores Louis-Joseph Lebret’s Catholic understanding of a human economy before
!30
studying Gaston Bardet’s call for soul in our cities. This section concludes with Le Corbusier’s
attack on these concepts through his proliferation of the progressive planning model and the
machinisme (mechanization) of space.
Henri Lefebvre and the Right to the City
One of the most prominent voices resonating with equity planners around the world is
that of Henri Lefebvre, a 20th century French philosopher, whose idea of a universal droit à la
ville or “right to the city” has shaped discourse in urban politics for decades. Lefebvre, taking
inspiration from Marx, Hegel, Nietzsche, and Heidegger, wrote on issues of sociology, rural and
urban studies, and state affairs. Although his philosophical work spanned disciplines, Lefebvre
always based his intellectual pursuits in revolutionizing contemporary society to move beyond
capitalism, consumerism, and the dominance of the state (Purcell, 2013). The concept of the
right to the city has been proliferated by governments such as those in Montreal and Brazil, by
the United Nations, and by activists in the United States and in Europe (Purcell, 2013).
When activists and urban policymakers call upon the right to the city to enact change, one
common thread is the focus on the inhabitant as the true owner of the urban landscape — an
urban landscape shaped by all aspects of human experience (Purcell, 2013). The inhabitant, not
the property owners or government alone, must dictate how the city evolves since it is the
inhabitant who shapes the shared and lived spaces of the city. In this way, Lefebvre contradicts
classical urbanist interpretations of urban space as a purely physical, built environment that
facilitates 20th century capitalism. For Lefebvre, the city is a compilation of everything that is
uniquely human — the complexities that define us (the inhabitant) beyond class, gender, income,
and other reductionist understandings of the human experience (Purcell, 2013). In order to
!31
actively reintegrate the true human experience back into urban governance (and back into society
in general), Lefebvre calls for a revolution of socialism that transfers power away from the state
and the property-owning bourgeoisie to an open democratic project of self-governance by the
inhabitant (Purcell, 2013).
While some critics of Lefebvre have called his vision for self-governance utopian,
Lefebvre argues that this would only be the beginning of a reawakening of society that would
have revolutionary impacts on our cities and our world. So much of Lefebvre’s work has
explored the urban realm since he believes that this societal revolution will take form in the large
cities of the world since they are traditional centers of history, culture, social interaction, and
diversity that have been distorted by the capitalist machine into lifeless, sterile physical spaces.
This interpretation of the city forms the base of Lefebvre’s call for an urban revolution — what
he calls an urgent utopia beyond capitalism (Purcell, 2013).
This distinction between the traditional city and the soulless city of contemporary society
is the first pillar of Lefebvre’s right to the city. It is necessary to fully understand what it means
to be and live a city before revolution can take place. La ville, the city, to Lefebvre refers to the
modern city that has been dominated by capitalist structures of exchange value and mutilated by
artificial, man-made barriers (physical, spatial, structural, institutional, political, etc.) such as
zoning and property rights (Purcell, 2013). While la ville is non-living, l’urbain, the urban, is
life itself. L’urbain is a place that desires and cultivates meaningful encounters where barriers
are removed and inhabitants are de-alienated from urban space and from each other (Purcell,
2013). Simply put, la ville is the house as l’urbain is the home. While la ville reduces human life
to socio-economic characteristics (therefore removing life and what is human), l’urbain
!32
embodies the French word of habiter, to live — not only to exist in a place but to make it your
own through everyday experiences. For equity planners drawing from this core principle of the
right to the city, it is their professional responsibility to facilitate the creation of l’urbain through
direct engagement with the inhabitant and the integration of urgent social issues in to planning.
In order for the transition from la ville to l’urbain to take place, the four remaining pillars
of Lefebvre’s right to the city must be activated and upheld. Before citizen engagement can
effectively occur, a new social contract, the second pillar, must be adopted. Lefebvre argues for
the widening and deepening of the existing social contract between the state and the public to
include additional rights, one of which is the right to the city (Purcell, 2013). This social
contract can be seen as the roots of Lefebvre’s revolutionary citizen activation plan and
facilitates the final three pillars of the right to the city. First, citizen activation depends upon
inhabitant participation, or the permanent participation and rising up of individuals to engage in
the “living struggle” for the urbain (Purcell, 2013:150). As a result, the process of autogestion,
self-management, then naturally begins. Autogestion leads to the diminishing of state power as
the populous engages in “grassroots decision making and the decentralization of control to
autonomous local units” begins (Purcell, 2013: 147). Finally, as the power of the state and the
bourgeoisie fade, reappropriation, or redistribution of ownership, of city space to the collective
whole occurs.
A re-examining of Lefebvre’s five pillars — a new social contract, l’urbain, inhabitant
participation, autogestion, and reappropriation — sees many trends aligned with advocacy
planning, namely engaging with underrepresented groups (the working and minority classes) to
collaboratively identify needs and redistributing resources to these groups. However, Lefebvre
!33
calls on inhabitants to carry out this revolution on their own without the help of a planner.
Lefebvre’s writing on the city in general consistently discounts the role of the professional, the
politician, and the property owner, insisting that all three feed into hegemonic constructions of
society. While the equity planner would seek to facilitate the five pillars of the right to the city
through the platform of local government, Lefebvre would call it a maintenance of the status-quo
and a threat to true autogestion. Although this term has entered mainstream urban politics and
discourse, there are no existing representations of the right to the city that fully incorporate
Lefebvre’s true meaning due to its radical nature. Despite this, the core concepts of the right to
the city can be seen in numerous examples of French social and urban policies including the Loi
[Law] LOV that formally gives citizens a right to the city (EPF Nord-Pas-De-Calais, 2009).
Louis-Joseph Lebret: The Catholic Voice
While Lefebvre’s vision for more equitable, self-governed cities stems from Marxist and
anti-capitalist roots, Lebret’s understanding of 20th century urban inequities and how to
counteract them originates from his devout Catholicism. As a servant of both the French
government during the Vichy era and of the Vatican, Lebret’s understanding of the world and of
economic development was shaped by the events of World War II, decolonization, and the rise of
communism (labeled atheist communism by the Church and by Lebret) (Chamedes, 2015).
Lebret saw a chance for the Catholic Church to guide both post-war reconstruction and
decolonization efforts of the French in a way that promoted Catholicism as the one true religion
and discouraged future wars. Although Lebret’s rhetoric often reflected the widely-accepted
prejudices of the “other”, the “less-developed”, and the pagan religions, the core concepts of
!34
urban planning and a reformed economy detailed in his work played a quintessential role in
shaping urban politics in France during the second half of the 20th century.
Lebret, the Vatican's lead contributor in the push towards a reformed type of economic
and territorial development, founded the an organization called Économie et Humanisme
(Economy and Humanism) that released publications detailing the Church’s approach to
development post-World War II. In these publications, Lebret coined the term économie
humaine (human economy) which advocated for the revision of economic structures into an
ethical practice that prioritizes “a broad conception of human well-being” in all spheres of
development as well as the distribution of goods and services to all regardless of ability to pay
(Chamedes, 2015: 57; Puel, 2015). By definition, Lebret argues that a human economy is one
that moves “populations and sub-populations… from a ‘less human’ state to a ‘more human’
state at the fastest possible speed with the lowest costs possible” (Lebret, cited in Puel, 2015, my
translation). This can only be accomplished by taking into account the cultural heritage and
diverse needs of individuals throughout the development process.
The question of fundamental needs in a core component of Lebret’s understanding of
development. In his writing, Lebret details his own understanding of the hierarchy of needs. He
calls them, “essential needs” that are indispensable to life and good health, “transcendental
needs” that give meaning to life, and “comfort needs” that increase well-being and ease of
existence (Lebret, 1950: 571; Puel, 2015, my translation). Lebret’s unique conceptualization of
needs places man’s social and spiritual desires at the heart of essential needs, arguing that life
does not exist without them. For Lebret, the satisfaction of man’s needs must be a central
concern of all democracies in an effort to move towards a more “human” economy that is at the
!35
service of man (rather than of the state of corporations) as well as more community-oriented,
more civilized, more universal in scope, more cultured, and more brotherly (Puel, 2015).
Convinced that this new approach to economic development and territorial planning was
the only way to protect the Catholic institution and western civilization, Lebret called for
balanced development through a human economy that facilitated a montée universelle (rising-up
of all) around the world (Puel, 2015). To accomplish this, Lebret advocates “[rejecting] free-
market economics, [maintaining] the importance of state intervention in economic matters”, and
creating le bien commun, collective commodities and facilities that benefit all equally
(Chamedes, 2015: 57; Puel, 2015). According to Lebret, territorial planning must be both
equitable and ethical in its approach to guarantee that everyone benefits from economic and
technical progress. Indeed, he asserts that “technical progress without ethical progress limits the
efficacy of development”, and harmonious development can only be achieved by balancing
“scientific, technical, urban, sanitary, cultural, moral, [and] spiritual progress” (Bevant, 2012: 5;
Lebret, 1950: 573, my translation). For Lebret, this is precisely the role of the expert in a
planning context— the obligation to ensure balanced development by applying technical
knowledge at a human scale that takes into account the different levels of social organization, the
three categories of human needs, and the importance of le bien commun.
Throughout his career as a development specialist and prominent member of the Catholic
Church, Lebret’s influence spanned cities, governments, and continents. After founding the
scholarly journal, Économie et Humanisme, Lebret’s work attracted the attention of France’s
territorial development Minister, Claudis Petit, who enlisted Lebret’s expertise in the creation of
the France’s first Planning Charter (Célestin, 1986). Shortly thereafter, Lebret’s development
!36
model was put into action with several territorial and economic planning projects in France and
in Brazil, where Lebret had conducted missionary work during the years previous. Finally, in
1958, Lebret founded the International Institute for Research and Training for Harmonized
Development (IRFED) which propelled his vision to an even larger global scale that engaged
students and professionals in his teachings of equitable, balanced development (IRFED, 2005).
Both Lefebvre and Lebret prioritize social and cultural elements of human civilization in
planning and advocate for a revision of the standard economic and political orders to put the
entire array of human needs at the forefront of development. However, while Lebret argues that
this change must occur within the confines of traditional democracy and top-down economic
structures as they exist today, Lefebvre has always maintained that the only way to accomplish
equitable urban development is to put the power in the hands of the people and break down all
state and capitalist institutions. The teachings of Lefebvre and Lebret have both been
perpetuated in the various interpretations of the right to the city in contemporary development
policy and through the continued activism of IRFED around the world.
Marcel Poëte and Gaston Bardet: Put the Soul Back in Planning
Whereas Lefebvre and Lebret were not urbanists by trade, Gaston Bardet was a trained
planner in the traditional teachings of Marcel Poëte, one of the forefathers of French urbanisme
and Bardet’s instructor at the Sorbonne's Institute of Urban Planning. Poëte, a Parisian urban
researcher from the early 1900s, was the founder of the culturalist urban planning movement that
pushed for a holistic understanding of the “nature of society” that takes into account the
economic, historic, social, and geographic contexts of cities (Bullock, 2010: 352). Based on this
position, culturalists are the direct opponents of urban modernists (such as Le Corbusier who is
!37
discussed in the following section) as they look for lessons from the world’s historic cities to
make improvements to contemporary urban environments instead of looking towards new
technologies for solutions (Bullock, 2010).
As Poëte’s student and future colleague, Bardet’s approach to urban planning mirrored
Poëte’s multidisciplinary urbanisme. As Bardet transitioned from understudy to a leading
Parisian urbanist and architect, several core concepts are present in Bardet’s writings and other
works. First, Bardet’s understanding of urban complexities was informed by Poëte’s depiction of
cities as living beings that are shaped by the collective and constantly changing identities of the
populous (Bollock, 2010). In this way, cities cannot be seen only for their physical forms but
also for the social and cultural interactions driving the evolution of urban areas. To illustrate this
point, Poëte details several defining characteristics of cities in his book Une Vie de Cité such as
lines of communication, the presence of the foreigner, evolving patterns of thought, and the
power of the state in local affairs (Bollock, 2010). To Poëte, without these more sociological
elements of urban life, the city does not exist. A true city is in constant, creative evolution due to
an interaction between man, nature, and physical space, and it is the responsibility of the planner
to first study the social and cultural implications of this interaction before considering
geographic or economic factors of urban form (Poëte and Bardet, cited in Frey, 2001: 33).
A second trend seen in Bardet’s work is his consideration of the soul of a city. In his text
Missions d’Urbanisme (Missions of Urban Planning), Bardet defines the primary responsibility
of urban planners — who are “simultaneously sociologist[s] and artist[s]” — as putting the soul
back in cities once again (Frey, 2001: 33, my translation). Referencing a similar concept to
Lefebvre’s l’urbain, Bardet insists that planners have a larger role in city design than the
!38
construction of physical space. On the contrary, it was this singular pursuit of planners and
developers that led to the destruction of the city soul (Bardet, 1948). He argues that the
construction of railroads and highways to facilitate economic growth through trade physically
divided our cities, thereby dividing the social and cultural fabrics of neighborhoods and
weakening community ties. Bardet explains that urban form and the urban being have been
divorced by this land use strategy and that planners must once again find harmony between the
tangible and intangible elements of contemporary cities.
Third, Bardet links his concepts of an urban soul to his broader discussion of a
humanisme politique (political humanism). Through Bardet’s lens of culturalist urban planning,
political humanism strives to build the strength of the collective whole at the expense of
individualism and liberalism to focus politics on the well-being of the whole rather than the well-
being of a select few (Bollock, 2010). For planners following Bardet’s principles, it is their
responsibility to facilitate this political humanism through urban policy and the construction of a
physical form that facilitates the attainment of man's social, cultural, and spiritual needs while
strengthening community ties. Political humanism would serve as an active alternative to
modernist models that remove social considerations from planning (Bollock, 2010).
Finally, Bardet followed Poëte’s conceptualization of scale in terms of urban planning.
Advocating for planning design and process at the “scale of man”, Bardet sought to focus efforts
at a regional scale in a way that broke down the developing mega-cities of the 1940s and 1950s
to smaller, interconnected cities that could better cater to man’s social needs (Bardet, 1948;
Bollock, 2010). To accomplish this, he argued that planners must fight against rapid population
growth in cities, the increased mechanization of city space leading to congestion, and urban
!39
sprawl (Bardet, 1948). In order to develop Bardet’s interconnected regional hubs, planners must
move beyond the confines of building regulations. They must seek to develop regional economic
and cultural centers that promote growth outside of metropolises and use planning to reduce the
wealth and resource inequities present in mega-cities (Bardet, 1948).
As a major influence during pre-war, wartime, and post-war reconstruction in French
urban planning, Bardet left his mark on the field primarily through his writing. Although many of
his teachings emphasizing the social importance of cities and the treat of mechanization were
overshadowed by modernist voices such as Le Corbusier, Bardet’s culturalist approach to
planning is arguably more frequently represented in French urban planning practice of the 21st
century than modernism’s progressive models.
Discord Among Experts: Le Corbusier and the Progressive Model
Although Lefebvre, Lebret, and Bardet made major contributions to the fields of urban
sociology, development, and planning, none enjoyed the international renown of France’s Le
Corbusier. Born in Switzerland, Charles-Édouard Jeanneret, known as Le Corbusier throughout
his career, was arguably the most influential planner of the 20th century. The impact of his
career can be seen around the world in building codes, core planning and architectural teachings,
and in city policy worldwide. Known as the father of modern architecture, Le Corbusier
radically changed the way planners and architects design city space based on his work from the
1920s until his death in 1965.
During this time, the main principles of Le Corbusier’s town and building design were
proliferated throughout France and eventually abroad. Many of these principles directly conflict
with the writings of Lefebvre, Lebret, and Bardet who all argued for unique elements of human
!40
experience to be reflected in urban planning and policy to put life and soul back into modern
cities. In contrast, Le Corbusier adhered to a more Americanized style, called the Progressive
Model that reflected the vast industrialization of society and the rise of the automobile in the
design of the built environment around the world.
The Progressive Model of urban planning, prominent from 1910 to 1960, put forth five
main principles. First, progressivists sought a universal design made of simple geometric shapes
and right angles that conform to the uses and needs of l’homme universel, the universal man
(Choay, 1965). The concept of the universal man rejects diversity and insists that human needs
are identical and few (Zuppinger, 2009). In this way, the progressive model creates designs and
development projects that are strictly inhuman — spaces and buildings exist for a particular use,
and man is expected to take on that use, rather than creating spaces for diverse human needs.
Le Corbusier even removed man from the home by designing what he called machines à habiter
(machines in which to live). Second, the progressive model prioritizes health and hygiene as to
rid cities of filth and disease (Choay, 1965). To accomplish this, Le Corbusier’s designs
emphasized the addition of greenery to buildings and ensured well-lit facades. Third,
progressivist urban planning prefers less dense construction which led to phenomenons of urban
sprawl around the world (Choay, 1965). In line with this principle, the vast majority of Le
Corbusier’s residential designs were single-family detached homes or massive collective housing
units (similar to the grands ensembles) on urban peripheries. Fourth and perhaps most
important, strict zoning laws were synonymous with the progressive planning model (Choay,
1965). By glorifying the automobile in street and building placement and design, zoning was
made prolific in the middle of the 20th century, and urban sprawl continued. Distances between
!41
the home, work, and services grew. Roads were widened and parking lots added to
accommodate the use of the automobile. Human uses were divided into very large, broad
functions. Finally, in addition to the automobile, progressivists like Le Corbusier glorified
technological and industrial advancement in general and attempted to design a built environment
of today that could facilitate the technologies of tomorrow (Choay, 1965).
By comparing the writings of Lefebvre, Lebret, and Bardet to those of Le Corbusier, it is
easy to see the contrast. Although Lebret, Bardet, and Le Corbusier all centered their planning
principles within the confines of political and bureaucratic systems, Le Corbusier maintained the
status quo in line with capitalist, modern conceptions of physical, urban space. Lebret and
Bardet on the other hand sought to use the existing political structures to reshape the urban and
economic landscape to better reflect and accommodate human nature. This advocated use of
existing planning structures to improve overall quality of life and reduce inequities heavily
mirrors the methods used by equity planners in the U.S. Several principles of Lefebvre’s right to
the city resemble some key equity planning ideals such as community participation, grassroots
movements, and the cultural and social relevance of cities. However, due to Lefebvre’s distrust
for political elites (including planners), the right to the city is more comparable to advocacy
planning principles that breakdown bureaucratic and politic norms of engagement and
policymaking. Le Corbusier’s progressive model directly advocates against all advocacy
planning principles as it removes all conceptions of man and of human needs, cultural and
historic relevance, and all forms of citizen participation in development. He saw urban planning
as a discipline of experts who saw no place for Lefebvre’s inhabitant. While Lefebvre, Bardet,
!42
and to some extent Lebret advocated for the urban (a city built for all elements of the human
experience, a city with soul), Le Corbusier worked with the city (the sterile, non-living city).
The importance of Le Corbusier’s breadth of work can be seen in various single
constructions and city plans around the world. Arguably, Le Corbusier’s teachings contributed
more to French urbanisme than the work of Lefebvre, Lebret, and Bardet, directly counteracting
any progress towards a more equitable process. Despite this, the pillars of the right to the city, a
human economy, and soulful urban planning can be seen in various urban planning codes and
national laws beginning in the 1970s until today. Reflections of these principles present in
French law will be considered in the following section.
The Importance of the Law and Institutions in French Urbanisme
As was seen with the implementation of the lois de décentralisation, much urban
planning in France is delegated from the national scale down through the regions, departments,
and finally to the communes. Although local authorities have a great deal of power in the
process, all decisions are bound by national territorial development objectives and obligations
laid out in the Urban Planning Code and a variety of different laws and decrees. This sustained
power of the state even after decentralization occurred cannot be overlooked since France has
traditionally been a country marked by a strong bureaucracy and top-down decision-making.
This was first characterized by the ruling bourgeoisie prior to the French revolution and later
seen with ruling political regimes like the Vichy regime in the early 1940s (Baudouï, 2014). This
section will provide an overview of national French laws and city policy that guide the country’s
understanding of social equity as well as its operationalization in practice at the local level.
Notable Laws of the Late 1970s and 1980s
!43

As previously mentioned, the French republic has a long, robust legal tradition that
establishes top-down imperatives for local authorities through national policymaking. In terms
of laws that strive to promote greater equity across the country, national policies focused on
housing reform and the extension of universal basic human rights beginning in the 1970s and
continuing throughout the 1980s (EPF Nord-Pas-De-Calais, 2009). First in 1970, the Loi [Law]
Vivien took action against insalubrious housing, a major problem in France throughout the 20th
century, while Loi 77-1 in 1977 created various welfare programs for social housing recipients
including renters and owners loans as well as direct financial assistance to renters (EPF Nord-
Pas-De-Calais, 2009). Next, a wave of laws establishing universal rights to housing and to
transportation began in the 1980s (EPF Nord-Pas-De-Calais, 2009). In France, the establishment
of safe, affordable and sanitary housing as a fundamental right with the Loi Quilliot was a major
milestone. A universal right to transportation was also established in the same year with the Loi
LOTI (Interior Transport Orientation Law). This law decrees that everyone has the right to a
public transportation system that is affordable for the individual and the town and that provides
reasonable access to all (EPF Nord-Pas-De-Calais, 2009). With these two laws and the previous
focus on insalubrious housing, France showed an increased attention to the basic needs of its
lower and middle classes.
Equity Laws of the 1990s to Today: Towards Equity Action
Although the equity-related laws of the 1970s and 1980s were significant at the time,
they only represent the beginning of a much more robust political agenda starting in the 1990s
that spanned several presidential terms with different political party affiliations. This agenda
shifted its focus from a more ceremonial guarantee of fundamental rights to an expansion and
!44
operationalization of those rights which continues to this day. This process began in 1990 with
the Loi Besson which revisited and put into motion the Loi Quilliot’s right to housing by creating
an amortization process for rental housing investments and by establishing an individual right to
housing assistance for any person facing financial hardship (EPF Nord-Pas-De-Calais, 2009).
Furthermore, the Loi Besson proclaimed that a universal right to housing is in the national
interest and removed key loopholes for social housing construction (EPF Nord-Pas-De-Calais,
2009). Later, in 1994 another law (Loi 94-624) was passed providing additional support for
social housing recipients by facilitating a home ownership process for renters that continues to be
a major component of social housing services today (EPF Nord-Pas-De-Calais, 2009).
In close relation to the Loi Besson in 1990, the Loi LOV (City Orientation Law) passed in
1991 played an integral role in the operationalization of social housing as the primary means to
promote equity in French cities. Not only does this law specify that the construction of social
housing is in the national interest, it requires towns and cities to build social housing in order to
promote socio-economic diversity and to fight trends of social housing clusters at city
peripheries (EPF Nord-Pas-De-Calais, 2009). In this way, the Loi LOV also proclaims a right to
the city defined as “the right of inhabitants to life and housing conditions that favor social
cohesion and strive to avoid or eliminate segregation” (EPF Nord-Pas-De-Calais, 2009, my
translation). This law was bolstered by the adoption of two more laws in 1995 (Loi 95-74) and
1996 (Loi 96-987). The first declares that it the city’s responsibility to guarantee the coexistence
of diverse social groups. The second aims to facilitate this social diversity with the creation of
additional subsidies for social housing construction (EPF Nord-Pas-De-Calais, 2009). It is
important to note that the right to the city seen in the Loi LOV does not perfectly reflect
!45
Lefebvre’s principles. However, this law and others that enshrine ideals of social diversity and
affordable housing do allude to Lefebvre’s urbain in which urban form facilitates and prioritizes
social interaction and community linkages.
The influx of new laws guaranteeing fundamental rights and seeking to eliminate social
segregation in cities continued at a rapid pace throughout the remainder of the 1990s and into the
2000s. A major expansion of nationally-recognized human rights occurred with the adoption of
Loi 98-657 (Law to Fight Against Exclusions) in 1998 that guarantees rights to “employment,
housing, health, justice, education, culture, and family and childhood protection” while
expanding rental expulsion protections and refining the social housing allocation process (EPF
Nord-Pas-De-Calais, 2009, my translation). Around the same time, the Loi Voynet (1999) was
also adopted which established sustainable development and citizen participation imperatives for
development projects (EPF Nord-Pas-De-Calais, 2009). For the first time, the concept of
sustainable development was written into French law by identifying its three pillars of “social
progress, economic efficacy, and environmental protection” as well as the need to preserve
resources for future generations (Legifrance, 1999: Article 1, my translation). In terms of social
progress, the Loi Voynet established that it is the responsibility of the government to ensure
equity of economic opportunity to all by providing “equal access to knowledge and to public
services,… [by] reducing wealth inequalities between regions” (Legifrance, 1999: Article 1, my
translation). In this way, the national government seeks to support the populations of regions
facing social or economic difficulty by correcting spatial inequalities through the fair
redistribution of public resources and nuanced interventions according to local contexts and
!46
needs (Legifrance, 1999: Article 2). Furthermore, it formally implicates all citizens in territorial
project design, implementation, and evaluation (Legifrance, 1999).
In 2000, one of the most influential laws for French urban planners was passed called the
Loi SRU (Law for Solidarity and Urban Renewal). First, this law created the current planning
documents used by all local-level planners whether it be the PLU for cities, the SCOT (Blueprint
for Coherence in Territorial Organization) for inter-communal (inter-town) cooperatives, or the
Cartes Communales (Town Maps) for very small towns (EPF Nord-Pas-De-Calais, 2009).
Second, the Loi SRU established the requirements for social housing construction and renovation
based on a town’s population. Essentially, Article 55 of the law dictates that towns and cities
meeting certain population requirements must have at least 20% of its housing stock designated
as social housing (EPF Nord-Pas-De-Calais, 2009). These same requirements were later
extended to 250 additional towns with the Loi DALO in 2007 which also designated the federal
government as the guarantor of the universal right to housing (EPF Nord-Pas-De-Calais, 2009).
Then again in 2013, the Loi Dufflot was adopted which increased social housing obligations for
certain towns from 20 to 25% of total housing stock (Ville de Grenoble, 2014).
Furthermore, in 2003 the French government adopted Loi Borloo 2003-710 (called the
Law for the Orientation and Programming for the City and Urban Renovation) with an explicit
intent to “reduce social inequalities and the development gaps between regions” (EPF Nord-Pas-
De-Calais, 2009: 9, my translation). This law takes a multidimensional approach to diminishing
inequities on a regional scale by taking into account economic, health, educational, and security
imbalances (EPF Nord-Pas-De-Calais, 2009). To address social inequities at a more local level,
this law also created a national observatory to monitor the change in social equity indicators at
!47
various geographic scales (including the IRIS, the French equivalent to a census tract), a national
urbain renovation program (PNRU) to set the policy in motion, and a national urban renovation
agency (ANRU) to implement the program (EPF Nord-Pas-De-Calais, 2009).
Politique de la Ville: A National Directive for Urban Equity
Although many French laws have contributed to the country’s many interpretations and
means of reducing inequities at various scales, one national directive in particular has driven this
agenda. Orchestrated by the state with the participation of local authorities, the Politique de la
Ville (unceremoniously translated as City Policy) strives to target inequalities in disadvantaged
communities while improving the quality of life of their inhabitants (Legifrance, 2014). Created
during the 1970s in response to the economic, social, and built degradation of the grands
ensembles on the peripheries of large French cities, the Politique de la Ville has since undergone
many evolutionary phases aligned with experimental periods to promote efficacy in policy
design to reduce income and development gaps in high-need areas (ORIV, 2012; Ministère de la
Cohésion du Territoire, 2017).
The most recent phase of the Politique de la Ville began in 2014 with the adoption of the
Loi Lamy also known as the Loi de programmation pour la ville et la cohésion urbaine
[Programming Law for the City and Urban Cohesion]. This law put forth three primary
objectives of urban renewal, social cohesion, and economic development and job growth
(Ministère de la Cohésion du Territoire, 2017). Based on these objectives and in coordination
with the state, local governments (either metropolitan areas or inter-city cooperatives) create a
contrat de ville (a city contract) that is signed and adopted by the four primary actors: the state,
local government, economic partners, and local associations (Ministère de la Cohésion du
!48
Territoire, 2017). The contrat de ville, drafted every five years, defines the specific objectives
and strategies that will be used at the local level to carry out the obligations of the Politique de la
Ville surrounding improvement of the urban built environment, social cohesion through
participation, the role of associations, social housing, and economic development (Grenoble-
Alpes Métropole, 2015).
Based on these objectives, the French government modified the process that selects high-
need neighborhoods across the country. Originally called a ZUS (a sensitive urban zone) by law
in 1996 (Loi 96-987), a high-need neighborhood in France is now referred to as a QPV (a priority
neighborhood of the politique de la ville). The QPVs are the focal point of the contrat de ville
where the upcoming strategies to fight inequities are detailed. QPVs are identified and chosen
by the state based on the following characteristics: 1) “a minimum population” and 2) “a gap in
economic and social development as determined by residents’ income” (Grenoble-Alpes
Métropole, 2015:7). Once QPVs are selected by national decree, local authorities begin
assembling citizen counsels for each high-need neighborhood. These councils are staffed on a
volunteer basis and must have an equal representation of men and women as well as an equal
number of residents and local association representatives (Ministère de la Cohésion du Territoire,
2017). The members of the citizen council are tasked to work with an expert contingency from
the local government with the same number of representatives as the citizen council (Ministère
de la Cohésion du Territoire, 2017). It is the mission of the citizen councils to encourage co-
creation between experts and residents by creating a participation environment that feels safe and
open to residents. Citizen councils often take this responsibility further by leading the
!49
implementation of the collaborative projects themselves within the neighborhood (Grenoble-
Alpes Métropole, 2015).
Since the citizen council in each QPV is implicated in every phase of the planning
process of the contrat de ville, the idea resembles Lefebvre’s ideal of autogestion in which the
inhabitants self-organize and make grassroots decisions together. Although the local government
orchestrates the citizen councils and decisions are made jointly with association leaders and
technical experts, the citizen council represents France’s most concrete policy action in line with
the right to the city and social equity in planning in general. Through the Politique de la Ville,
the French government has taken up the torch of advocacy planning principles in which they
identify existing social inequities and economic development gaps, collaborate with local actors
to find nuanced solutions, and then implement action in accordance with the co-created contrat
de ville.
Insights from French Planning History, Philosophy, and Law
Based on the research of the preceding literature review chapters, several important
characteristics of French urbanisme as they relate to social equity must be highlighted. These
characteristics stem from French history with traditions of top-down rule present for centuries,
from post-war destruction, and from influential thinkers like Lefebvre whose right to the city
(specifically l’urbain) and citizen participation ideals have proliferated French policy. In
addition to emphasizing the overarching characteristics that guide French urban planners in their
efforts to eliminate inequities, this section also discusses the different ways French policymakers
define social equity in terms of language and strategy. This examination will provide a basis of
comparison between French and American conceptualizations of social equity.
!50
Defining Characteristics of French Urban Policy
The first characteristic that defines French conceptualizations of equity is the
transcendent importance of universal rights. This can be seen through the numerous laws passed
starting in the 1970s (Loi Quilliot, Loi 82-1153, Loi LOV, Loi 98-657, Loi DALO, described in
preceding section) that identified the French government as the guarantor of rights to housing,
transportation, to the city, and others (EPF Nord-Pas-De-Calais, 2009). By adopting these
national laws, French policymakers not only recognized a federal commitment to equality in
many forms, they also put into motion a sequence of laws to concretize these rights at the local
level. For example, the Loi SRU in 2000 established local social housing construction
obligations after Laws Quilliot (1982) and 98-657 (1998) affirmed a right to housing.
The second characteristic that can be derived from this research is the ultimate power of
national-level institutions in ensuring equity to individual citizens as well as economic equity
between regions. As previously mentioned, France has a long history of strong top-down rule,
and the provision of rights and services to its citizens is no exception to that trend. Although
local authorities were granted a great deal more autonomy in urban planning competencies with
the adoption of the decentralization laws in 1982, the national government continues to set
nationwide planning objectives. Today these objectives are centered around the three pillars of
sustainable development that were first enshrined in the text of the Loi Voynet (1999) with the
language “social progress, economic efficacy, and environmental protection” (Legifrance, 1999:
Article 1). These principles were later added into the Urban Planning Code which now details
that planners must ensure “social diversity in the housing stock,… a balanced geographic
distribution of urban land uses,… jobs,… shops, and services,… an improvement of energy
!51
performance,… a decrease in motorized travel, [and] the development of alternative modes of
transportation” (Legifrance, 2017: Article 101-2). By setting national imperatives for local
planners and policymakers, it sets a high standard of development in terms of promoting equity
for all French towns, departments, and regions. As a result, these planning authorities (primarily
cities) may only pass local laws or design projects that create more stringent development
regulations. For example, some French cities like Grenoble have designed planning projects that
incorporate a percentage of social housing in excess of the 25% of total housing stock required
by national law with the Loi Dufflot (Centre de ressources PCET, 2014; Legifrance, 2013).
Although French law incorporates many different elements of equity including access of
opportunity and access to public services, the third characteristic that must be noted is the
primary focus of equity-related policy is the provision of safe, sanitary, affordable housing
through detailed, national housing policy. As previously seen, housing policy in France has been
evolving throughout the past fifty years. This process began with the declaration of a right to
housing and is now operationalized in the Politique de la Ville based on its most recent form put
forth by the Loi Lamy in 2014 (Legifrance). Due to the reoccurrence and strengthening of social
housing obligations in national law, it can be argued that social equity can be defined primarily
as a right to housing through access to social housing programs. Based on the texts of the laws
studied, the French national government has focused its policymaking on social housing since it
believes that this social service will act as a motor for social desegregation (seen in the Loi LOV)
as well as the means to access all other universal rights (education, employment, transportation,
and others) (seen in the Loi 98-657) (Legifrance, 1991; Legifrance, 1998).
Fourth, as seen in the laws studied and in the writings of Lefebvre, Lebret, and Bardet, a
!52
progression of national and city policy has taken place to slowly transform the primary
objectives of urban planning in France. This progression of the role of the urban planner has
gone from designer of the built environment in wartime France to facilitator of human rights
(especially housing) post-World War II to guarantor of sustainable development and social
cohesion. Today, the role of the urban planner can largely be classified as a contributor to the
common good of society through various development projects that aim to improve quality of
life (primary goal of Politique de la Ville) and to rebalance the distribution of social services
(seen in many laws, for example the Loi Borloo in 2003).
Finally, it is possible to recognize certain elements of Lefebvre’s, Lebret’s, and Bardet’s
unique interpretations of a more equitable, socially balanced city. First, regardless of its efficacy,
the Politique de la Ville strives to create a scenario similar to Lefebvre’s urbain. Through its
focus on citizen engagement, cooperation with local associations, and action tailored to local
contexts, the Politique de la Ville emphasizes the importance of Lefebvre’s inhabitant as well as
the weight of social input and cohesion. At the very least, this policy is on a path towards the
urbain and away from the sterile city of Le Corbusier. This also resonates with Bardet’s
advocacy for soulful city planning that works towards the common good while considering the
historical and social dynamics of localities. Next, Lebret’s economic humanism preached that a
balanced development is necessary to facilitate a montée universelle (the rising-up of all). While
the Politique de la Ville’s géographie prioritaire, or high-need areas (QPVs) defined by the state,
seeks a targeted approach to strive for a rising-up in disadvantaged areas, other laws like the Loi
Borloo (2003) sought more wide-ranging action to promote the harmonious development
associated with Lebret’s economic humanism.
!53
Definitions of Social Equity: A France-U.S. Comparison
In response to the first research question concerning definitions of social equity in the
U.S. and France, several differences must be noted in terms of word choice and formal
definitions by governments. The first difference pertains to the vocabulary used to convey the
concept of social equity itself. While the term is used prolifically in the U.S., French
policymakers and planners rarely use the term équité (equity) at all.
The following words have been used in the French policies studied to represent action
around social equity:
1) Social diversity (“mixité sociale” in the Loi LOV and the Loi 96-987);
2) Social cohesion (“cohésion sociale” in the Loi LOV, Loi 2005-32 to “reduce social
fractures”, the Loi DALO, and the Loi Lamy) (EPF Nord-Pas-De-Calais, 2009, my
translation);
3) Equal economic opportunity (“égalité des chances” in Loi 2005-32);
4) Development gaps (“les écarts de développement” in the Loi Borloo and the Loi Lamy);
5) Inequalities (“inégalités sociales” in the Loi Borloo and “all forms of inequalities” in the
Loi Lamy) (EPF Nord-Pas-De-Calais, 2009, my translation; Legifrance, 2014, my
translation);
In comparison, the U.S. tends to use the word “equity” or its adjective form “equitable”
to describe a variety of related planning methods and goals. Synonyms that are often used to
convey the same message are social justice, equity of opportunity, and inclusive policy. For
example, King County in Washington state created a Strategic Plan for Equity and Social Justice
in to guide its equity policy put in place with the Equity and Social Justice Ordinance in 2010
!54
(King County, 2016). Not only are the words “equity” and “social justice” used in its title, this
plan’s agenda is informed by the eight determinants of equity identified in the document which
include “child and youth development, economic development and jobs, environment and
climate, health and human services, housing, information and technology, the justice system, and
transportation and mobility” (King County, 2016). While the words “social equity” or
“determinants of equity” are not used in the cited examples of French law, the Loi Borloo (2003)
discussing social inequalities and the Loi 2005-32 (2005) aiming to reduce social fractures
together mention each of the eight determinants of equity detailed in the King County plan (EPF
Nord-Pas-De-Calais, 2009). Therefore, it is possible to argue that despite a difference in word
choice between French and American policies, the general intent of the language itself
establishes a comparable meaning. Both countries recognize the social, economic, and
environmental gaps in the share of benefits and burdens among certain communities and regions
that require the need for social equity policy.
The larger difference between the two truly lies in the definitions of the communities
suffering from these gaps in development and resource distribution. In the U.S., such definitions
tend to incorporate racial, economic, linguistic, and spatial characteristics. Descriptive terms
such as disadvantaged, vulnerable, underserved, distressed, and underrepresented communities
will often be used to characterize low-income communities with large populations of people of
color that tend to have a significant proportion of English language learners (see examples such
as PolicyLink’s National Equity Atlas indicators (2016), King County’s Equity and Social Justice
Strategic Plan (2016), PolicyLink’s equity summary of President Obama’s FY2016 Budget
!55
(2016), and California Environmental Protection Agency’s definition of disadvantaged
communities (2014)).
The most striking difference between the definition of these communities in the two
countries is France’s exclusion of questions of racial equity. While U.S. policymakers and
planners base much of their equity work around issues faced by minority groups, France hardly
makes reference to this population characteristic. Indeed, King County’s stance on the
importance of including racial data in equity policy can be seen in its definition of being pro-
equity as “being racially just and inclusive, and consistently taking action to eliminate the root
causes of inequities” (King County, 2016: 5). Furthermore, Paul Davidoff included the
importance of race considerations in advocacy planning in his article “Working Towards
Redistributive Justice” insisting that racial data cannot be ignored as it is a principle
characteristic of inequities in society (1975).
Although France collects data on foreign heads of household, they go no further in
collecting data on race or ethnicity like the U.S. does throughout its census procedures (INSEE,
2017). In any case, the limited data available on ethnic demographic information in France is not
incorporated into any definitions of disadvantaged communities. Instead, French law has
provided two clear definitions for what it considers a high-need neighborhood to which it
distributes a greater share of financial and technical resources, primarily through the
implementation procedures detailed in the Politique de la Ville. The first definition used to
identify these neighborhoods was a Sensitive Urban Zone, or ZUS, previously mentioned in
relation to the Loi 96-987 in 1996. According to this law, a ZUS is characterized by “the
presence of grands ensembles or a degraded housing stock [and] an imbalance between housing
!56
and employment opportunities” (Legifrance, 1996: Article 2). Based on this definition, the data
indicators used to determine neighborhoods adhering to this description in addition to the
presence grands ensembles are percentage of residents receiving social housing benefits,
percentage of unemployed residents, a large youth population, and a large blue-collar workforce
(Fitoussi, 2004).
The second given definition in French law is that of a QPV, or a priority neighborhood
for the Politique de la Ville, aligned with the priority geography described in the Loi Lamy of
2014. The QPV designation replaced the ZUS categorization of communities suffering from
inequities. The Loi Lamy defines a QPV as a neighborhood with a minimum population
characterized by gaps in social and economic development based on declared household income
(Legifrance, 2014). Due to the adoption of this law, this is the first time that household income
has been used as an indicator for disadvantaged communities eligible to receive extra assistance
from the state.
More astonishingly, income data for households at a fine enough scale for urban planners
to work with, namely the IRIS level (comparable to the U.S. census tract), is also relatively new.
This delayed development for the use for income data can be attributed to a law passed in 1978
that only permits the inclusion of sensitive questions in surveys when that sensitive information
is the specific subject of an approved study and when surveyed individuals give their consent to
share that information (Fitoussi, 2004). It wasn’t until 2004 that IRIS-level data on household
income was available after it was collected in 2001 for the first time (INSEE, 2004). Today, only
the years 2001to 2013 of IRIS-level income data are available to the public (INSEE, 2017).
Operationalizing Social Equity in France: Effective Tools or Heavy Bureaucracy?
!57
Aligned with the first characteristic of French urban policy of top-down directives,
critiques of French social policy and social welfare programs exist. While it may be positive that
the French government takes initiative on many social equity and sustainability issues, it is
argued that such heavy bureaucracy may actually diminish the efficacy of republican values like
participation and robust social services. However, in terms of equity planning, urban policy
objectives designed by the state and implemented in coordination with local authorities has the
obvious benefit of universal action. In this way, France mandates action on climate change,
social inequities, economic development gaps, and other policy issues. Whereas in the U.S., it is
primarily a city, county, or state’s decision to implement similar policies with the exception of a
few federal policies such as the obligation to fairly distribute federally-funded projects and
services (as determined by Title VI of the Civil Rights Act of 1964) or our public housing and
social welfare programs aimed at more equitable distribution and access of services (Office for
Civil Rights, 2013; Frederickson, 2005). Many cities in the U.S. have taken up the torch
themselves to act on socio-economic gaps between neighborhoods within their jurisdictions often
through passionate public administrators focusing local policies on equity issues.
However, the lack of broader federal policy requiring such action as it exists in France
has allowed many U.S. cities to take a route of inaction despite the presence of socially or spatial
segregated neighborhoods, degraded built environments, and high levels of poverty
(Frederickson, 2005). Or perhaps even more troubling, many U.S. lawmakers or public
administrators resist their moral compass for fear of pushback from peers and especially from
their constituents to cries of “big government” (Frederickson, 2005). While many French cities
exhibit the same socio-economic tendencies, the “big” French government takes positive action
!58
by mandating intervention to counteract different kinds of inequities with assistance in
implementation and monitoring from government agencies (as dictated by the Politique de la
Ville) (Legifrance, 2014). Indeed, the Laws LOV (1991) and SRU (2000) sought to counteract
the same unwillingness of some local public authorities (primarily mayors) to implement equity
policy that has been seen in the U.S. by making certain social equity policies mandatory
throughout France (Baudouï, 2014).
Although increased bureaucracy as seen in the French model may be helpful for U.S.
equity planners seeking to implement a progressive political agenda, the fact remains that French
law has created a multitude of agencies and actors implicated by equity-related policies. This
has created a highly technical, convoluted process making it especially difficult for residents to
understand the planning process and to engage with it (ORIV, 2012). The newest version of the
Politique de la Ville adopted in 2014 strives to streamline the actors, obligatory planning
documents, and citizen engagement methods to improve the process altogether. Notably, this law
created a citizen council which works with city experts to identify priorities and design projects
(Ministère de la Cohésion du Territoire, 2017). The committee is voluntary and mandates a
50-50 representation of men and women in the resident category as well as of planning experts
(Ministère de la Cohésion du Territoire, 2017). Time will tell if the modifications have been
successful in encouraging participation and opening up the planning process while simplifying
planning procedure in France.
Another critique of highly bureaucratic social service structures like France’s social
housing programs, job insertion services, and unemployment and disability services is that it
creates what was called a “ticket window democracy” or “ticket window equity” (Donzelot &
!59
Estèbe, citied in Baudouï, 2014). This critique argues that such a technical, top-down process
leaves residents to simply wait in line until their number is called to receive or participate in
equity services. Through a lens of ticket window equity, the process and the law surrounding the
social services guaranteed to all residents by French law are so complex that beneficiaries never
openly engage with the process or contribute to it. On the contrary, beneficiaries simply receive
what is allocated to them with little understanding of why or how the services are distributed
(Donzelot & Estèbe, citied in Baudouï, 2014). Therefore, the recipient is treated as a client as
opposed to a collaborator in the process, and the equity service being provided remains a top-
down, false representation of true equity in the allocation of services (Donzelot & Estèbe, citied
in Baudouï, 2014).
Although the heavy bureaucracy of French governance in relation to equity policy and
implementation has produced a more equitable society overall in comparison with the U.S. (as
demonstrated by France’s GINI score of 29.2 compared the U.S.’s 45), France is currently going
through a process of self-evaluation of the policies put into place with the most recent
modification of the Politique de la Ville in 2014 (as described above) (CIA World Factbook,
2013). Specifically, its Observatoire national de la politique de la ville (ONPV) (National
Observatory of City Policy) is tasked with evaluating the performance of local authorities in
implementing the objectives of the Politique de la Ville using the tools disseminated in
accordance with this law (ONPV, 2017). The tools provided to local authorities are the contrat
de ville and the citizen councils (as detailed above). Because of the national laws requiring local
governments to apply these two tools to equity projects, the contrat de ville and the citizen
councils are the guiding forces of all French equity action at the local level.
!60
Therefore, in response to the second research question of this study, U.S. and French
planners have drastically different tools at their disposal to enact equity policy and equity-related
projects. Regardless of the efficacy of each groups’ tools, it is the structure and policymaking
culture of the two governments respectively that determines what tools are available and what
tools must be applied. In the case of the U.S., the political power of states, cities, and counties
gives local authorities the autonomy to use various equity assessments and tools in the design of
policies and projects. This freedom is both an asset for equity planners and a hurdle. While
freedom allows for creativity and innovation in the design and use of equity tools, the lack of
direction or obligation from the federal government creates a difficult political environment in
which equity planners are often fighting upstream (Krumholz & Clavel, 1994).
In the case of France, the rigid nature of urban planning policy in general leaves local
actors very little freedom in the tools they use. There is also limited room for creativity given the
constant oversight of national observatories and implementation procedures that must fit into the
national directive. However, tools provide a set of fixed objectives, indicators, and methods
determined by the state for each locality containing a QPV. Therefore, it ensures that the many
determinants of equity are addressed in ways that are appropriate for each neighborhood context
but also in ways that are approved and monitored by the state (Grenoble-Alpes Métropole, 2015).
Finally, France will see a more widespread impact as a result of the equity tools it implements at
the local level, whereas the U.S. will see results in select localities that choose to implement
equity-related policies and carry out social justice initiatives.
!61
4. The Existing Role of GIS in Equity Planning and Opportunities Presented by QGIS
One of the most important supplemental tools available to equity planners everywhere are
Geospatial Information Systems (GIS). These programs have long been used in urban planning
for project and policy development pertaining to land use, zoning, infrastructure development,
and new construction. As a visual mapping aid, GIS provides an effective communication
method between the city government, planners, and the general public to convey plans through
an easily comprehensible medium. As a strong statistical analysis tool, GIS allows planners to
store and manipulate various data using the same technological platform. The different types of
data can be placed into three broad categories: 1) “natural” data pertaining to physical,
topographic landscape of an area, 2) “artificial” data related to the built environment, and 3)
“immaterial” data such as data representing different characteristics of city residents’ socio-
economic status, behaviors, or preferences (Mineau, 2003). As a result, GIS has become an
important component of project planning and related decision-making in an attempt to
understand the spatial qualities of an area based on GIS spatial analyst functions, database
management, and spatial modeling (Yeh, 2005).
However, the use of GIS as a tool for equity analysis or equity planning is a much more
recent trend in urban planning. Since the creation of GIS software, its role in spatial analysis has
been clear considering the convenience of using GIS to visualize the spatial distribution of the
natural and built environment. Slowly, planners and researchers began using GIS to analyze the
equitability of spatial distribution of amenities, services, and facilities such as green space,
transportation networks, health and rehabilitation services, playgrounds, and other urban
!62
amenities (Chang and Liao 2011, Comer and Skraastad-Jurney 2008, Farber et al. 2014,
Passalent et al. 2013, Talen and Anselin 1998, Brambilla et al. 2013). The equity analysis studies
in these cases utilized census data on the socio-economic profiles of affected populations to
evaluate locational equity, or how fairly a particular service or amenity is distributed based on
need (Comer, Skraastad-Jurney, 2008).
Another common application of GIS technology is the assessment of equity of access to
public goods and services. Equity of access goes beyond locational equity’s one-dimensional
assessment of equity (in which equitable distribution exists if that service falls within a given
boundary) and instead considers how people get from their residence to the amenity itself and
how long it takes (Tsou, Hung, Chang, 2005). In addition, equity of access examines the impact
range of the service based on size (surface area or service capacity) and spatial separation
between the same service (Tsou, Hung, Chang, 2005). GIS tools used in this way can be a strong
technological asset to planners who are seeking to increase services in their cities with limited
financial and political resources. In questions of equity, GIS can provide a simple way of
communicating the need for projects that target inequitable access or spatial distribution to
diverse audiences of community members, planners, and bureaucrats.
Despite the utility of GIS in urban planning and the more restricted field of equity
planning, GIS methods have received criticism for their unilateral approach to analysis through
quantitative means alone (Jung & Elwood 2010; Frank, 1992; Mark, 1999). For planners
interested in spatial analysis and modeling for real-world solutions, GIS represent a narrow
understanding of the urban complexities represented by Euclidian interpretations of quantitative
data (Frank, 1992). Since urban planning has major implications for human subjects and human
!63
reasoning, a more nuanced approach is necessary to analyze the qualitative aspects of the
discipline and find practical solutions to address inequities in urban contexts.
Considering the criticism of traditional GIS planning, spatial distribution, and equity
analysis models, new methods arose based on the recognition that spatial analyses are incomplete
without the inclusion of qualitative data. In the mid-1990s, Egenhofer and Mark first describe
qualitative data in geography research as “naive geography” or a study that is concerned with
common-sense understandings of the geographic world (1995). A common-sense approach was
deemed necessary in order to create GIS that were both compatible with qualitative
methodologies and able to be used by people with varying skill levels (Egenhofer & Mark,
1995). Qualitative data in this context is seen as a compliment to quantitative analyses which
address absolute values as opposed to qualitative’s consideration of the magnitude and
significance of events in large pools of data (Egenhofer & Mark, 1995). This work paved the
way for future research incorporating this common-sense, qualitative knowledge of space into
geography, GIS, and urban planning.
In GIS, the integration of qualitative data stemmed from a resurgence of mixed-methods
approaches in spatial research in the late-1990s and early 2000s in which techniques for the
representation of non-quantitative knowledge emerged (Jung & Elwood, 2010). These new
strategies were implemented by many disciplines in a variety of contexts, and through the
resulting applications, a body of work linking concepts of human geography and GIS developed.
The resulting adaptation of GIS technology became known as Qualitative GIS (QGIS), and it
soon materialized into a field of its own with some researchers utilizing the existing capabilities
!64
of GIS to incorporate qualitative data and others transforming GIS software altogether to support
qualitative data needs (Jung & Elwood 2010; Cope & Elwood 2009).
Since France does not collect quantitative data related to the race and, until recently, the
incomes of its citizens as does the United States, the use of QGIS would be an ideal tool to carry
out equity analyses for urban planning purposes. Considering the importance of public
participation in France in project design and implementation, QGIS has the ability to link public
discourse and opinion to spatial patterns that may inform policy decisions and planning actions
related to equity issues such as locational equity, equity of access, and distributive justice. The
aforementioned examples of GIS in equity analysis and planning in the United States all relied
heavily upon socio-economic data of individuals at different geographical scales of analysis. In
the case of France, these analyses are not possible due to the lack of sophisticated quantitative
data on disadvantaged and vulnerable populations. In this way, the use of GIS in French urban
planning has been primarily restricted to analyzing the built environment and patterns of use as
opposed to studies exploring user preference or patterns of behavior based on socio-economic
status. In order to bring GIS into the realm of equity planning and analysis in France without
access to socio-economic census data, new data must be generated as a substitute. In its stead,
qualitative data about individuals’ conceptions, perceptions, and understandings of space could
be gathered to evaluate locational need, equity of access, and the equitability outcomes of
planning actions (i.e. did a project create a more equitable situation?). Considering the
importance of public participation in French urban planning, citizen engagement platforms
would be an ideal way to gather this qualitative information for project design phases as well as
post-project evaluation phases of planning. By linking the qualitative information supplied by
!65
participants with spatial characteristics present in their comments/sketch maps/narratives, QGIS
could be used to facilitate more insightful research into urban equity studies centered around
vulnerable groups that values community perceptions rather than geo-statistical data alone.
Similar strategies that incorporate qualitative information into GIS are explored through the case
study component of this research.
There are many concrete examples of sophisticated QGIS methods in research beginning
in the early 2000s. Concepts such as geo-narrative analysis describe the use of GIS methods to
conduct narrative analysis that highlight the social, cultural, and institutional dynamics in
relation to spatial significance (Kwan & Ding, 2008). Sketch mapping is another research tool in
geography that links human cognition and reasoning with GIS. Similar to a mental map, sketch
maps use a ground-up citizen mapping approach to spatially represent the complexities of
individuals’ lives and their unique relationships to physical space (Boschmann & Cubbon, 2014).
These strategies and others such as Collaborative GIS, Public Participation GIS, 3D-
Visualization and Qualitative GIS all incorporate qualitative data to some degree and project it
into cartographic form in different ways (Kwan & Ding, 2008).
In the majority of QGIS work, the capabilities of GIS programs have either been
manipulated or extended (through the creation of extension packages) to store and analyze
qualitative data sources like multi-media and textual data (Jung & Elwood, 2010; Kwan & Ding,
2008; Matthews et al., 2005; Kwan & Lee, 2004). Some researchers have criticized the use of
extension packages in GIS because they stunt the capabilities of qualitative data analyst tools to
facilitate integration into GIS (Jung & Elwood, 2009). Instead, some researchers choose to use
various computer-assisted qualitative data analysis software (CAQDAS) tools in conjunction
!66
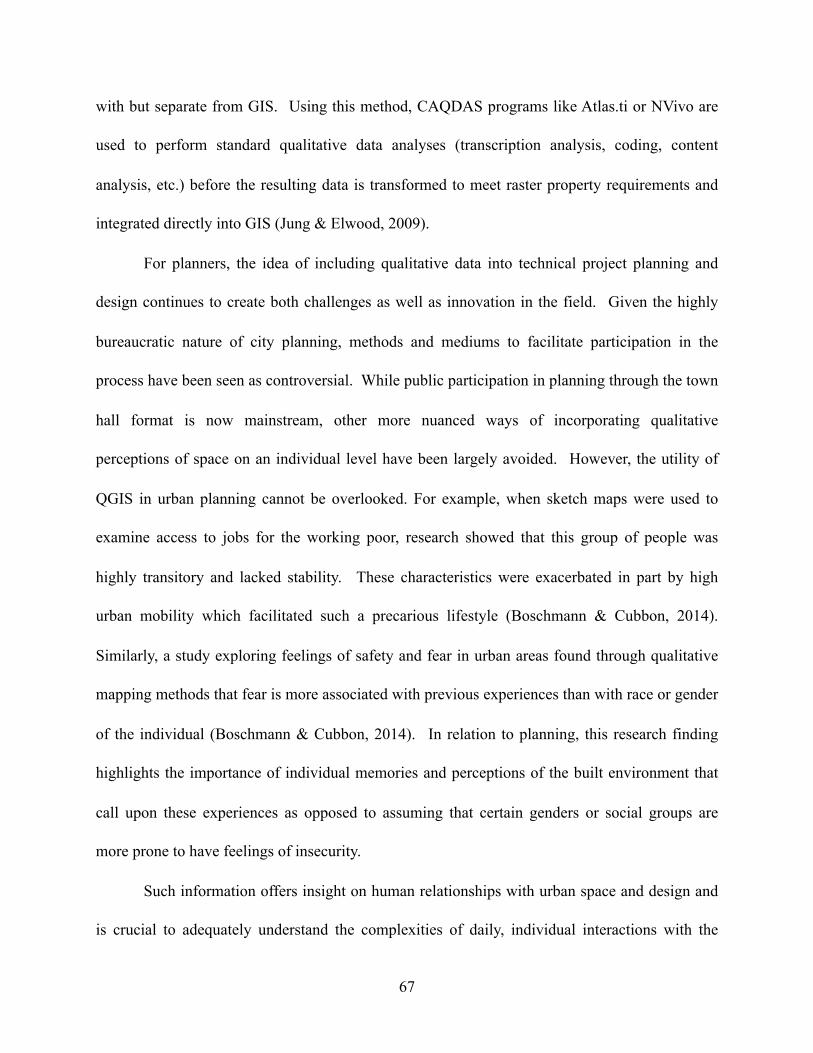
with but separate from GIS. Using this method, CAQDAS programs like Atlas.ti or NVivo are
used to perform standard qualitative data analyses (transcription analysis, coding, content
analysis, etc.) before the resulting data is transformed to meet raster property requirements and
integrated directly into GIS (Jung & Elwood, 2009).
For planners, the idea of including qualitative data into technical project planning and
design continues to create both challenges as well as innovation in the field. Given the highly
bureaucratic nature of city planning, methods and mediums to facilitate participation in the
process have been seen as controversial. While public participation in planning through the town
hall format is now mainstream, other more nuanced ways of incorporating qualitative
perceptions of space on an individual level have been largely avoided. However, the utility of
QGIS in urban planning cannot be overlooked. For example, when sketch maps were used to
examine access to jobs for the working poor, research showed that this group of people was
highly transitory and lacked stability. These characteristics were exacerbated in part by high
urban mobility which facilitated such a precarious lifestyle (Boschmann & Cubbon, 2014).
Similarly, a study exploring feelings of safety and fear in urban areas found through qualitative
mapping methods that fear is more associated with previous experiences than with race or gender
of the individual (Boschmann & Cubbon, 2014). In relation to planning, this research finding
highlights the importance of individual memories and perceptions of the built environment that
call upon these experiences as opposed to assuming that certain genders or social groups are
more prone to have feelings of insecurity.
Such information offers insight on human relationships with urban space and design and
is crucial to adequately understand the complexities of daily, individual interactions with the
!67
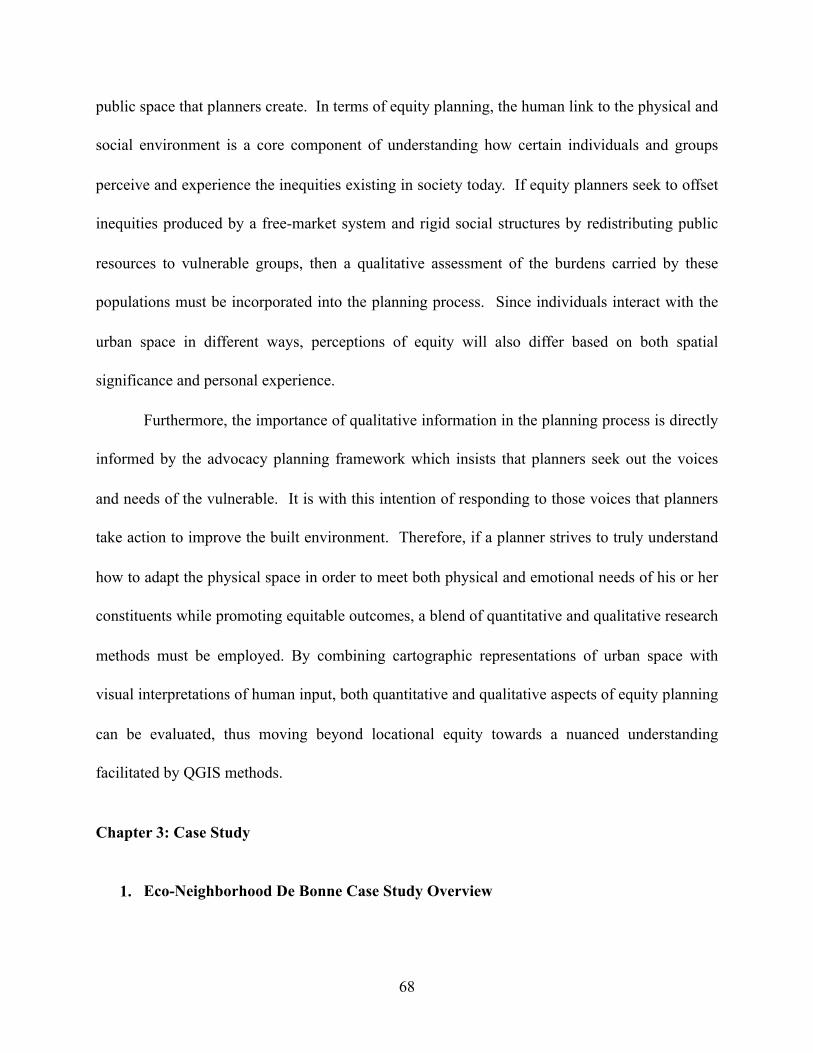
public space that planners create. In terms of equity planning, the human link to the physical and
social environment is a core component of understanding how certain individuals and groups
perceive and experience the inequities existing in society today. If equity planners seek to offset
inequities produced by a free-market system and rigid social structures by redistributing public
resources to vulnerable groups, then a qualitative assessment of the burdens carried by these
populations must be incorporated into the planning process. Since individuals interact with the
urban space in different ways, perceptions of equity will also differ based on both spatial
significance and personal experience.
Furthermore, the importance of qualitative information in the planning process is directly
informed by the advocacy planning framework which insists that planners seek out the voices
and needs of the vulnerable. It is with this intention of responding to those voices that planners
take action to improve the built environment. Therefore, if a planner strives to truly understand
how to adapt the physical space in order to meet both physical and emotional needs of his or her
constituents while promoting equitable outcomes, a blend of quantitative and qualitative research
methods must be employed. By combining cartographic representations of urban space with
visual interpretations of human input, both quantitative and qualitative aspects of equity planning
can be evaluated, thus moving beyond locational equity towards a nuanced understanding
facilitated by QGIS methods.
Chapter 3: Case Study
1. Eco-Neighborhood De Bonne Case Study Overview
!68
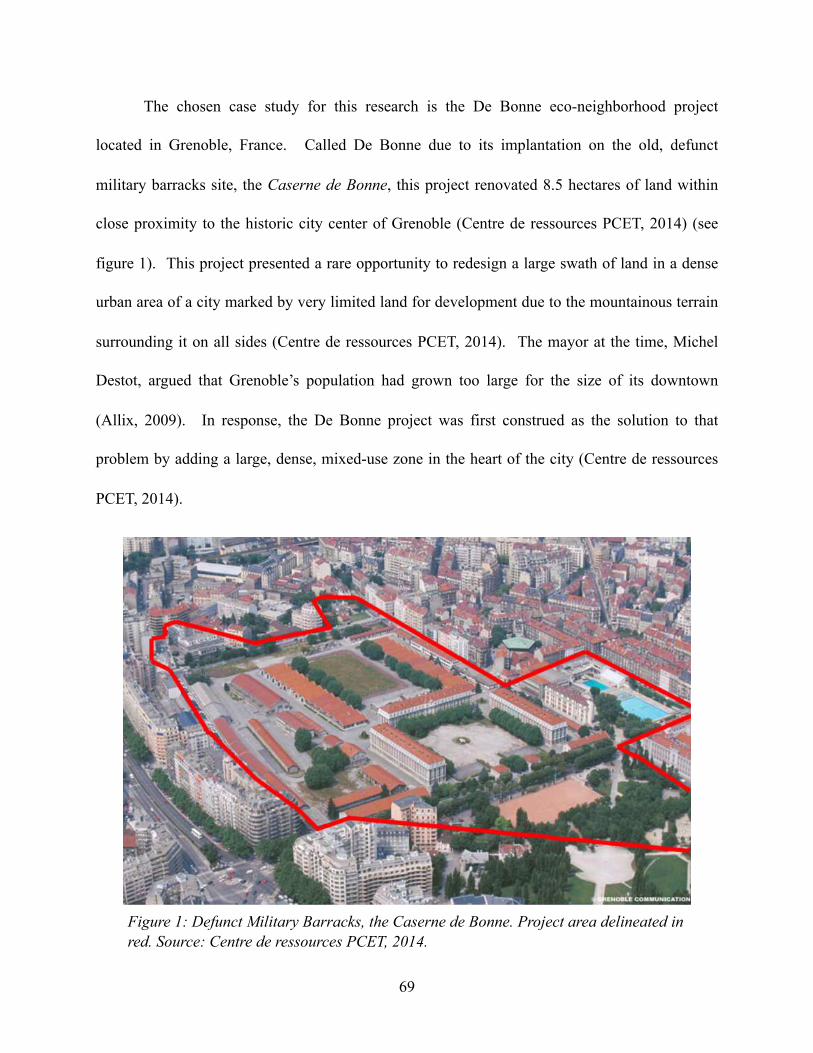
The chosen case study for this research is the De Bonne eco-neighborhood project
located in Grenoble, France. Called De Bonne due to its implantation on the old, defunct
military barracks site, the Caserne de Bonne, this project renovated 8.5 hectares of land within
close proximity to the historic city center of Grenoble (Centre de ressources PCET, 2014) (see
figure 1). This project presented a rare opportunity to redesign a large swath of land in a dense
urban area of a city marked by very limited land for development due to the mountainous terrain
surrounding it on all sides (Centre de ressources PCET, 2014). The mayor at the time, Michel
Destot, argued that Grenoble’s population had grown too large for the size of its downtown
(Allix, 2009). In response, the De Bonne project was first construed as the solution to that
problem by adding a large, dense, mixed-use zone in the heart of the city (Centre de ressources
PCET, 2014).
!69
Figure 1: Defunct Military Barracks, the Caserne de Bonne. Project area delineated in red. Source: Centre de ressources PCET, 2014.
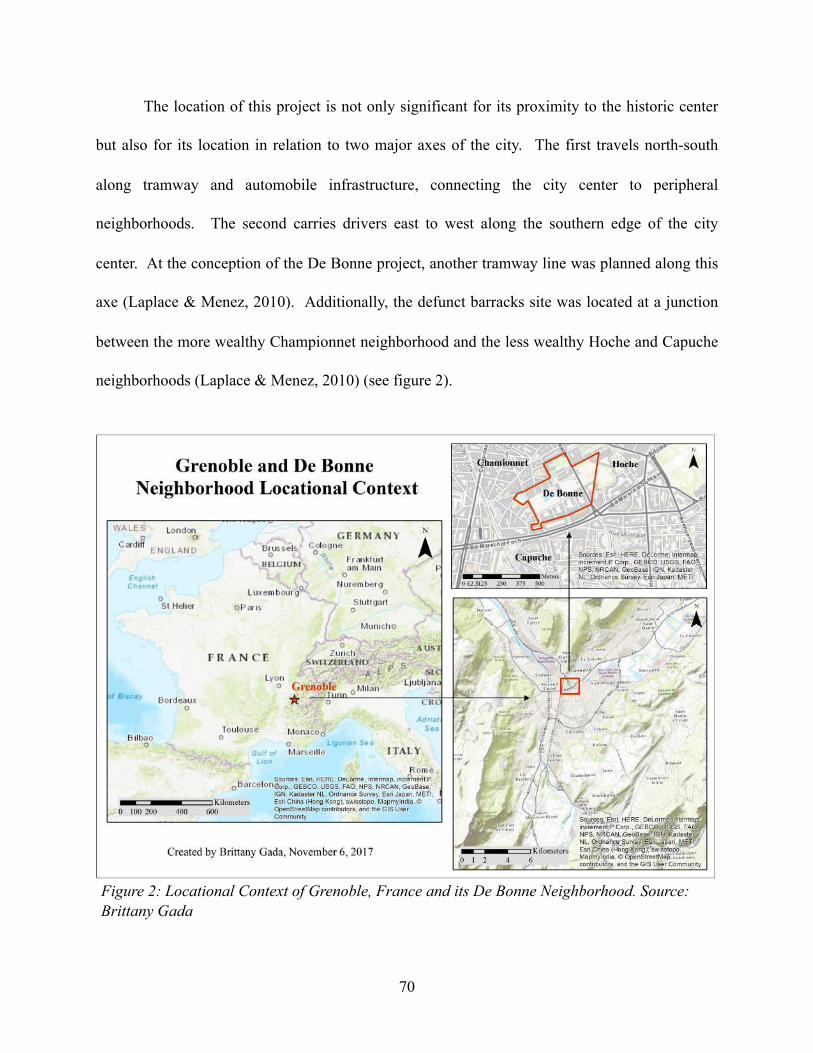
The location of this project is not only significant for its proximity to the historic center
but also for its location in relation to two major axes of the city. The first travels north-south
along tramway and automobile infrastructure, connecting the city center to peripheral
neighborhoods. The second carries drivers east to west along the southern edge of the city
center. At the conception of the De Bonne project, another tramway line was planned along this
axe (Laplace & Menez, 2010). Additionally, the defunct barracks site was located at a junction
between the more wealthy Championnet neighborhood and the less wealthy Hoche and Capuche
neighborhoods (Laplace & Menez, 2010) (see figure 2).
!70
Figure 2: Locational Context of Grenoble, France and its De Bonne Neighborhood. Source: Brittany Gada
At a time when families were moving to the city’s suburbs en masse, the De Bonne
project was seen as a key opportunity to attract middle-income families back to the city center
(Centre de ressources PCET, 2014). This goal aligned with the general objectives detailed in the
city of Grenoble’s master planning documents which stressed the need for sustainable housing
initiatives, more public transportation options, and environmentally-friendly development across
the city (Laplace & Menez, 2010).
2. The De Bonne Project’s Objectives
The objectives of the De Bonne project were directly informed by the goals laid out in
Grenoble’s planning documents, however, the project’s scope quickly outpaced the city’s initial
vision. In subscribing to the city’s recent trend of sustainability-oriented projects, De Bonne was
no different (Laplace & Menez, 2010). Drawing from the experiences of Grenobe’s Vigny-
Musset project completed in 2001, De Bonne used similar strategies to create a dense built
environment with diverse housing options within a context of site renovation rather than ground-
up construction (Laplace & Menez, 2010). Furthermore, the project sought to adhere to the
environmental regulations put forth by the European Concerto program which stressed the
importance of energy conservation, the creation of renewable energy sources, the reduction of
CO2 emissions, and a transition towards more sustainable lifestyles (Concerto, cited in Laplace
& Menez, 2010).
In line with both the City of Grenoble’s general planning goals and the ecological
requirements put forth by the project Concerto, De Bonne’s various actors began the process of
creating its own development agenda in 2002 in collaboration with other local planners,
!71
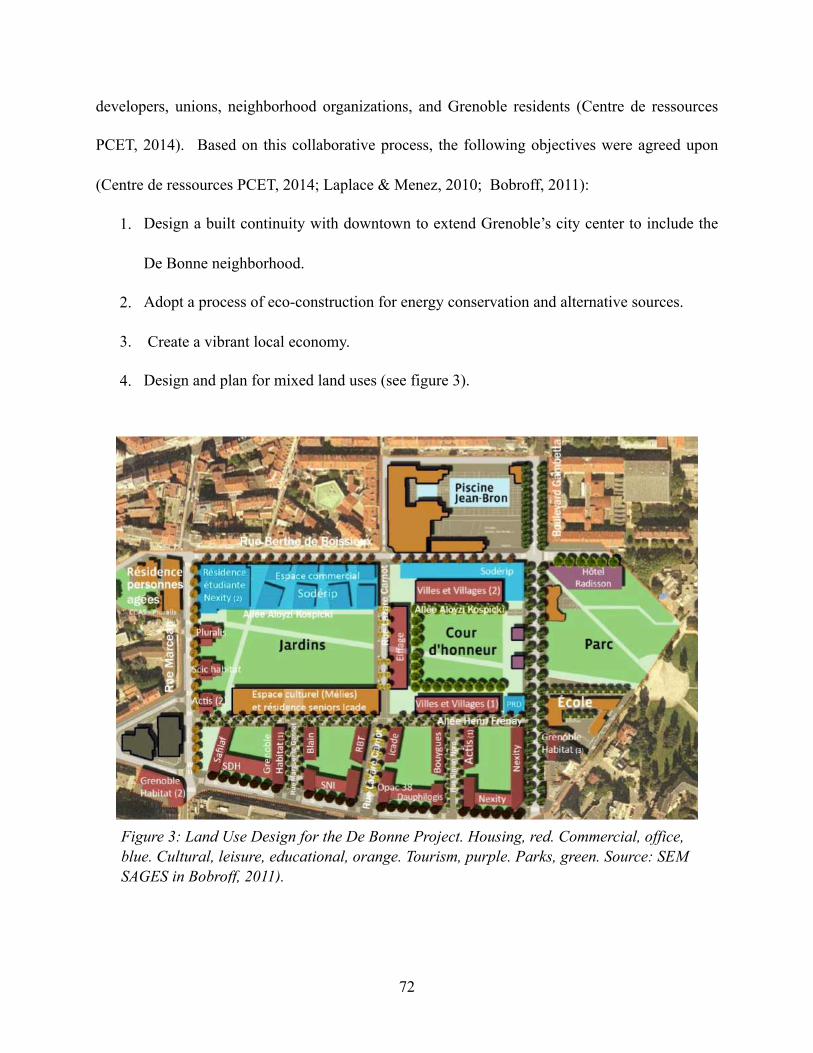
developers, unions, neighborhood organizations, and Grenoble residents (Centre de ressources
PCET, 2014). Based on this collaborative process, the following objectives were agreed upon
(Centre de ressources PCET, 2014; Laplace & Menez, 2010; Bobroff, 2011):
1. Design a built continuity with downtown to extend Grenoble’s city center to include the
De Bonne neighborhood.
2. Adopt a process of eco-construction for energy conservation and alternative sources.
3. Create a vibrant local economy.
4. Design and plan for mixed land uses (see figure 3).
!72
Figure 3: Land Use Design for the De Bonne Project. Housing, red. Commercial, office, blue. Cultural, leisure, educational, orange. Tourism, purple. Parks, green. Source: SEM SAGES in Bobroff, 2011).
5. Ensure social diversity in terms of household structure and age in a way that promotes
social cohesion.
6. Promote active and shared modes of transportation.
7. Guarantee accessibility for all throughout the neighborhoods outdoor and indoor spaces.
The stated objectives of this project are strongly rooted in sustainable development and
more specifically the expected characteristics of an eco-neighborhood. Eco-neighborhoods
essentially adhere to all standards imposed by sustainable development guidelines. However,
they are also obligated to meet strict eco-construction standards for the treatment of water, waste,
and biodiversity as well as buildings’ ability to conservatively use energy (Laplace & Menez,
2010). These eco-construction standards were undertaken due to De Bonne’s voluntary
candidature for the European eco-project, Concerto, for which this project won the top prize in
2005 (Laplace & Menez, 2010). Because De Bonne’s objectives subscribed to all eco-
neighborhood and sustainability guidelines, they incorporate the three pillars of smart,
sustainable development including social, economic, and environmental concerns.
In terms of social equity, several of the objectives identified by the project stand out.
First, the project’s attention to social diversity is particularly significant. Rather than focusing on
racial and income-related diversity as U.S. planners tend to prioritize, De Bonne’s decision-
makers, similar to most French planning references to social diversity, chose to plan for
intergenerational diversity in addition to diversity of household structures and incomes through
housing design. The project also sought to promote social cohesion through the organization of
its built environment. Next, De Bonne also formed objectives surrounding mobility and
accessibility that strove to promote social equity in more indirect ways. Namely, the focus on
!73
active and shared modes of transportation ensured that visitors and residents of varying incomes
can benefit from the space. Owning a private vehicle, typically a possession of wealthier social
classes, is not necessary to enjoy the facilities provided by De Bonne. Additionally, the
prioritization of active modes facilitates social interactions within the neighborhood by reducing
travel to a human scale and by promoting a safe pedestrian environment for all, especially for
children and the elderly. The project’s attention to accessibility across the neighborhood also
shows great attention to social equity. Not only are public spaces accessible to individuals of all
physical abilities, building designs also guaranteed that all areas of apartment buildings and units
are accessible to all (Laplace & Menez, 2010). Finally, the De Bonne’s project’s objective
related to creating a vibrant local economy also indirectly supports social equity. By ensuring
that new businesses introduced in the neighborhood respond to the needs of current residents in
the surrounding neighborhoods as well as to the needs of future De Bonne residents, the project
attempted to prevent damage to the existing local economy while promoting affordable and
necessary shops and services.
3. Strategies for Equity Goal Attainment
After agreeing on the direction for the project and its set objectives, De Bonne’s various
actors (the City of Grenoble, national government representatives, lead architect and planner,
research groups, and residents) began debating which designs and methods would be used to
attain each project goal. The first strategy used was a strong citizen engagement program that
surpassed the basic requirements mandated by French law that include town hall meetings and
site visits (Laplace & Menez, 2010). Instead, the De Bonne project leaders created a reflexion
!74
group made up of professionals (planners, architects, association representatives, investors) and
residents alike that met during each phase of the project to make collective decisions (Laplace &
Menez, 2010). Together, this group drafted various documents for the project including an
“ABC Architectural, Environmental, and Urban Quality Guide” to inform design decisions
(Bobroff, 2011: 68, my translation). These documents were created through an intense debate
and focus group process between experts, the reflexion group, and local residents with the goal
of using a democratic participation process to ensure sustainable development (Bobroff, 2011).
Furthermore, the City of Grenoble created a public space called La Plateforme in 2004 to serve
as an information center for the general public and a forum for debate in regards to all major
urban projects taking place in Grenoble, including De Bonne (Bobroff, 2011; Laplace & Menez,
2010). The final strategy used to promote citizen engagement was implemented at the end of the
project. Because the De Bonne project’s design incorporated new, high-tech energy conservation
tools and design strategies, there was a need to train new residents in best-use practices to ensure
proper handling of the technology and to promote maximum utility cost savings (ARGOS,
2012). To accomplish this, project leaders designed informational welcome packets and created
an ongoing training program for each building (Laplace & Menez, 2010).
During the various meetings of the reflexion group, professionals and residents worked
together to detail the strategies that would be used to respond to each objective set during the
first phase of the project. First, in order to extend Grenoble’s downtown to include De Bonne,
the following strategies were implemented: 1) introduced the same density as the city center, 2)
ensured continuity with surrounding neighborhoods by linking streets, bike lanes, and pedestrian
paths and continuity with the rest of the city by creating a network of major public spaces, and 3)
!75
guaranteed mixed-uses at the neighborhood and building scales through de-zoning techniques to
replicate the diversity of functions in the city center (Laplace & Menez, 2010).
Second, residents and professionals were both very concerned about building up the local
economy with a new offering of shops and services rather than harming local businesses through
competition with larger corporate stores in the De Bonne shopping mall (SAGES, 2011). In
order to prevent this, the reflexion group met with local business owners and leaders of the
Championnet community organization who discussed which new services and shops would be an
asset to the community and which would damage the existing local economy (SAGES, 2011).
Two main strategies were used to encourage maximum benefit to the local economy. First, the
reflexion group identified potential themes for new shops that would enhance the offer for
shopping across the neighborhood. These themes would vary by product focus and by price
point. The second strategy implemented was focused on continuous design that linked De
Bonne’s pedestrian routes to the shops in the Championnet neighborhood as well as to the city
center. In this way, De Bonne shoppers would find themselves in an attractive walking
environment that would naturally increase storefront exposure for local businesses in the area
(SAGES, 2011).
As previously mentioned, a process of de-zoning was adopted to plan for a variety of land
uses in the neighborhood. Using this process, the city designated De Bonne as a special planning
area in its planning document, the PLU (the Plan Local d’Urbanisme), within which all land use
zones were eliminated to ensure maximum flexibility of functions in the neighborhood (Laplace
& Menez, 2010). This flexibility was also extended to individual buildings primarily to mix
residences with associative and cultural spaces. Additionally, planners and landscape architects
!76
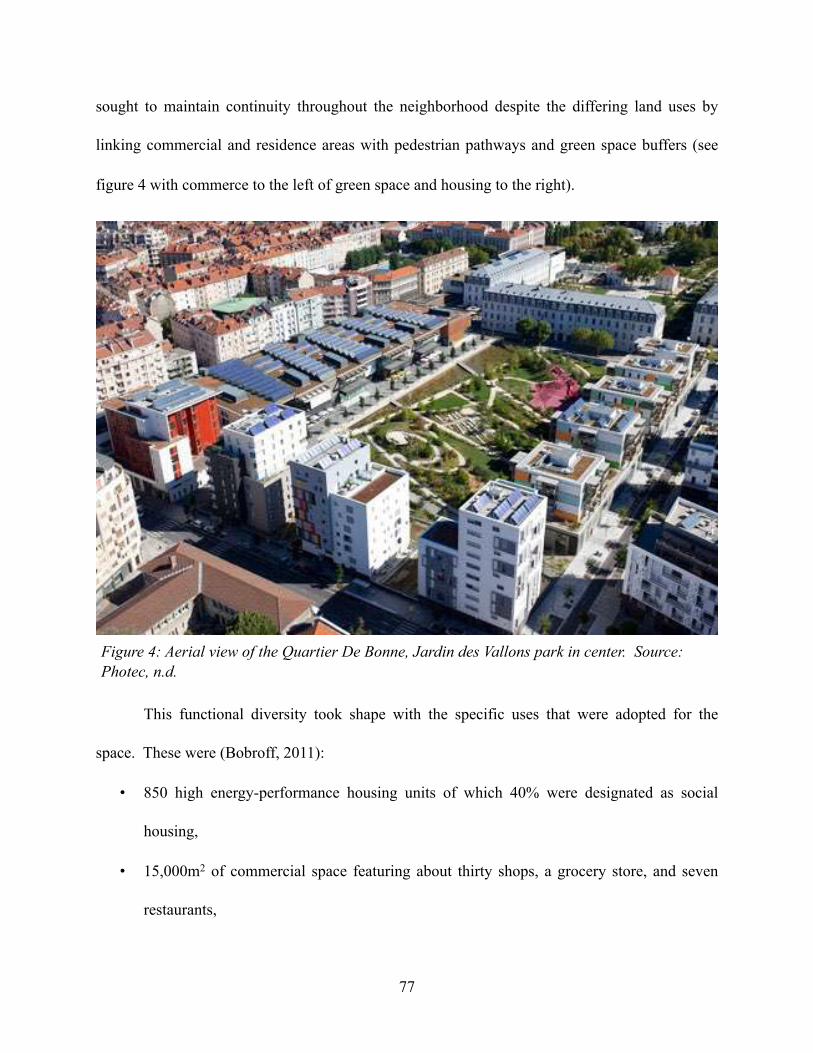
sought to maintain continuity throughout the neighborhood despite the differing land uses by
linking commercial and residence areas with pedestrian pathways and green space buffers (see
figure 4 with commerce to the left of green space and housing to the right).
This functional diversity took shape with the specific uses that were adopted for the
space. These were (Bobroff, 2011):
• 850 high energy-performance housing units of which 40% were designated as social
housing,
• 15,000m2 of commercial space featuring about thirty shops, a grocery store, and seven
restaurants,
!77
Figure 4: Aerial view of the Quartier De Bonne, Jardin des Vallons park in center. Source: Photec, n.d.
• 5,000m2 of high energy-performance office space
• 1 four-star hotel with 120 rooms
• 1 student housing facility
• 1 assisted-living facility
• 1 retired living community facility
• 1 elementary school
• 1 cultural space for independent films and artistic expositions
• 5 hectares of urban green space with an integrated rainwater management system
Similarly, many of these mixed land uses were also put into place to ensure that the
objective of creating a socially diverse neighborhood was attained. First, the student housing,
assisted-living, and retired living community facilities were included in the neighborhood
specifically for that reason. Furthermore, lower-income students and elderly persons may not
have access to a vehicle and would benefit from the density and diversity of land uses in the De
Bonne neighborhood. Second, a mix of housing unit types were included to present a variety of
options to future renters and owners. Units ranged from studios to five bedroom apartments for
larger families (ARGOS, 2012). Prices for both buyers and renters were controlled to ensure
affordability and especially to attract middle-class families who do not qualify for social housing
benefits to the neighborhood (Bobroff, 2011). This strategy was also put in place to prevent
gentrification of the new neighborhood and the surrounding areas to rebalance the socio-
economic dynamic within the city center (Bobroff, 2011). Third, the project set a minimum
percentage of housing destined for social housing recipients at 35% and engaged Grenoble’s
most well-versed social housing developers, ACTIS and OPAC 38, in the design and
!78
implementation of the project (Bobroff, 2011). The De Bonne project also constructed 24
housing units designated as accession sociale, meaning social housing qualifiers enter into a
payment program to attain ownership of the unit (Laplace & Menez, 2010). Fourth, to encourage
social cohesion between diverse residents, a local association center was installed in the
neighborhood that was able to house about 20 different associations with a conference hall and
meeting rooms (Laplace & Menez, 2010). Finally, project architects and landscape designers
ensured that all public spaces were accessible to the elderly and to persons with limited mobility.
Furthermore, they constructed 120 housing units that conform to the mobility needs of these
groups (Bobroff, 2011).
This strategy to ensure accessibility for all also extended beyond the borders of the De
Bonne neighborhood. Accessibility in all its forms was prioritized to guarantee that visitors
could quickly access the neighborhood’s new facilities, that residents could conveniently access
the rest of the city, and that both groups could easily and safely access all areas of the
neighborhood itself including green spaces, commercial areas, leisure facilities, and other
services (Centre de ressources PCET, 2014). Strategies implemented in addition to handicap-
accessible design regulations to promote accessibility for all included: 1) development of
pedestrian and bicycle infrastructure inside the neighborhood and outside to link the
neighborhood to public transportation stops and to downtown Grenoble, 2) construction of the
new tramway line to serve the neighborhood in conjunction with the De Bonne project, and 3)
limit private vehicle use for residents and visitors through restricted parking availability for
housing units and costly paid-parking for visitors. All of these strategies also simultaneously
!79
promoted active and shared modes of transportation which were a key strategy to minimize the
carbon footprint of the neighborhood.
Finally, the De Bonne project placed a high priority on energy conservation and
renewable energy sources in the interests of meeting Concerto environmental requirements and
of responding to the effects of climate change. Since the City of Grenoble’s planning agenda
also subscribed to sustainability objectives, many strategies used in the De Bonne project
adhered to the city’s general development criteria (Laplace & Menez, 2010). Many strategies
used to accomplish this goal were integrated with other objectives such as goals concerning
accessibility and active transportation as well as high density, mixed land-use construction. In
terms of eco-construction specifically, many strategies and design methods used for the De
Bonne project were both innovative and revolutionary. Not only were designs at the cutting edge
of green construction with green roofs and terraces, solar panels, permeable surfaces, and the
incorporation of recycled building materials from De Bonne’s site demolitions, several design
elements were completely new innovations for optimal energy conservation (Centre de
ressources PCET, 2014; SAGES, 2011). For example, exterior isolation materials had to be
redesigned to reduce the weight of isolation to simultaneously maximize performance, eliminate
thermal bridges in the structure, and support the weight of balconies and other aesthetic facade
fixtures (SAGES, 2011). Other examples of energy conservation strategies were the use of dual-
flow ventilation, high-performance double-paned windows, solar panels for hot water generation,
and a co-generative process for all heating and electricity needs using natural gas (SAGES,
2011). While these strategies were innovative for the De Bonne eco-neighborhood, many also
represented firsts in France in the field of eco-construction.
!80
4. Assessment of Objectives and Strategies Used to Promote Social Equity
Based on the stated objectives of the De Bonne eco-neighborhood project and the
strategies used to attain them, this assessment responds to the third research question. Based on
the information provided by the case study literature review, it is clear that the project’s decision-
makers intended to promote a socially equitable community through design strategies,
participation methods, and housing affordability. While there was arguably a larger focus on
environmental concerns as seen in the project’s attention to Concerto eco-construction guidelines
and renewable energy sources, the De Bonne project ultimately satisfied all three pillars of
sustainable development including social equity. Since this research defines social equity as
even access to services and opportunities across income and cultural groups, the findings of this
case study research concludes that the De Bonne project performs highly in terms of social
equity promotion.
Although there is very limited information available to concretely assess if the
neighborhood has fostered a socio-economically diverse population, the social housing and
housing affordability methods used by this project demonstrate dedication to that social equity
principle. Although the project only targeted 35% social housing on site, 40% was ultimately
attained (SAGES, 2011). Not only were there a high number of units available for social
housing recipients, social housing developers, ACTIS and OPAC 38, intentionally designed
comfortable, energy-efficient, high-quality units (Bobroff, 2011). Although the social housing
buildings have a lesser aesthetic in comparison with other De Bonne apartment buildings, many
social housing buildings still feature balconies, green roofs, and attractive designs (see figures 5
!81
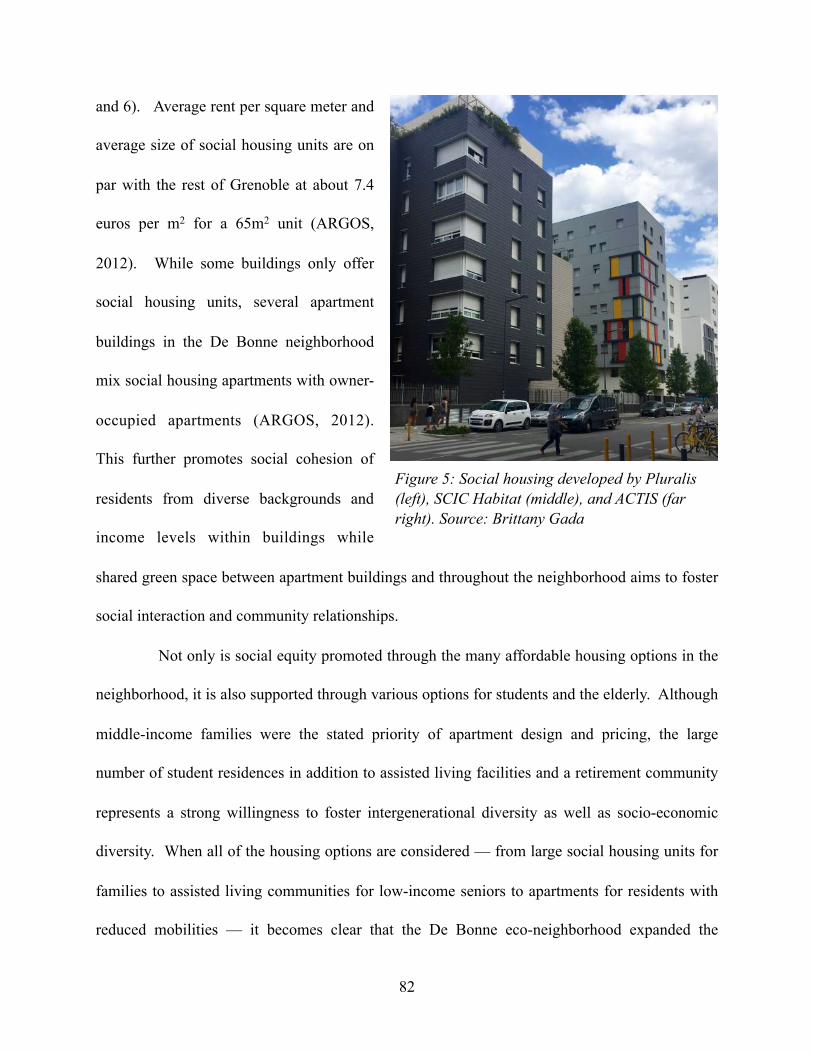
and 6). Average rent per square meter and
average size of social housing units are on
par with the rest of Grenoble at about 7.4
euros per m2 for a 65m2 unit (ARGOS,
2012). While some buildings only offer
social housing units, several apartment
buildings in the De Bonne neighborhood
mix social housing apartments with owner-
occupied apartments (ARGOS, 2012).
This further promotes social cohesion of
residents from diverse backgrounds and
income levels within buildings while
shared green space between apartment buildings and throughout the neighborhood aims to foster
social interaction and community relationships.
Not only is social equity promoted through the many affordable housing options in the
neighborhood, it is also supported through various options for students and the elderly. Although
middle-income families were the stated priority of apartment design and pricing, the large
number of student residences in addition to assisted living facilities and a retirement community
represents a strong willingness to foster intergenerational diversity as well as socio-economic
diversity. When all of the housing options are considered — from large social housing units for
families to assisted living communities for low-income seniors to apartments for residents with
reduced mobilities — it becomes clear that the De Bonne eco-neighborhood expanded the
!82
Figure 5: Social housing developed by Pluralis (left), SCIC Habitat (middle), and ACTIS (far right). Source: Brittany Gada
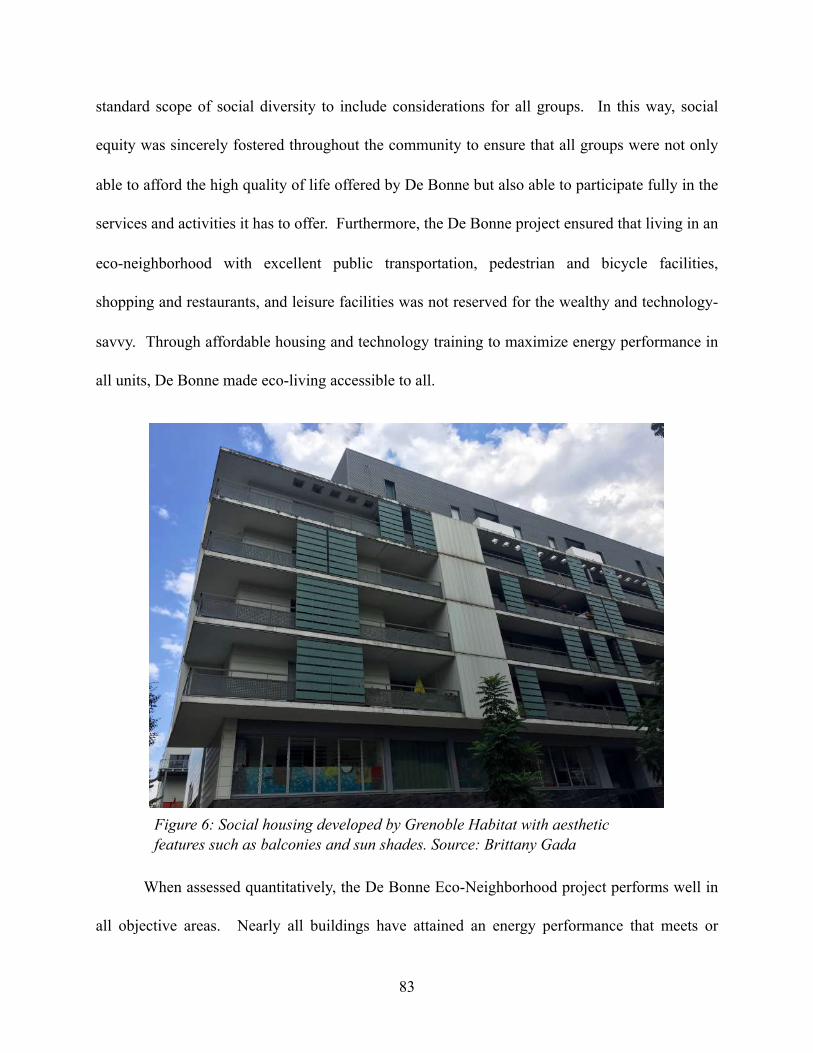
standard scope of social diversity to include considerations for all groups. In this way, social
equity was sincerely fostered throughout the community to ensure that all groups were not only
able to afford the high quality of life offered by De Bonne but also able to participate fully in the
services and activities it has to offer. Furthermore, the De Bonne project ensured that living in an
eco-neighborhood with excellent public transportation, pedestrian and bicycle facilities,
shopping and restaurants, and leisure facilities was not reserved for the wealthy and technology-
savvy. Through affordable housing and technology training to maximize energy performance in
all units, De Bonne made eco-living accessible to all.
When assessed quantitatively, the De Bonne Eco-Neighborhood project performs well in
all objective areas. Nearly all buildings have attained an energy performance that meets or
!83
Figure 6: Social housing developed by Grenoble Habitat with aesthetic features such as balconies and sun shades. Source: Brittany Gada
exceeds expectations for the design (ARGOS, 2012). Furthermore, 36% of resident participants
in a post-project survey conducted by a research company, ARGOS, reported that they have
changed their habits and have adopted a more environmentally-friendly lifestyle since moving
into the neighborhood (2012). Housing prices conform to the averages in Grenoble for both
social rentals and owner-occupied units (ARGOS, 2012). Only seven out of 46 boutique spaces
(15%) in the shopping mall are unoccupied (personal observation on July 20, 2017). The
shopping center and green spaces attract visitors from within Grenoble as well as from the
surrounding areas (ARGOS, 2012). Finally, the De Bonne neighborhood is connected to other
neighborhoods with several bike paths, attractive pedestrian walkways, 17 bus stops, and two
tramway stops within 200 meters of the neighborhood boundary (personal observation on July
20, 2017; OpenStreetMap, 2017).
Chapter 4: Research Methodology
The basis of this research stems from France’s unique approach to equity planning which
differs greatly from planning methods in the U.S. As previously mentioned, France does not
collect data pertaining to race or ethnicity. Household income data at the census tract (IRIS)
level was also not published until 2004 for the year 2001 (INSEE, 2004). These are two datasets
that U.S. planners rely heavily upon when designing and implementing equity-related projects.
This is primarily due to the guidance of the advocacy planning framework itself which insists
that race and income are inextricable components of inequities that must be directly addressed
through equity planning projects and procedures (Davidoff, 1975). In regards to this pillar of the
advocacy planning framework, French urban policy and planning does not fit into this model due
!84
to its disregard for data on race as well as the absence of data relating income to various social
characteristics of populations. Furthermore, although income data at the IRIS level is now
available, it remains in a primitive stage of data collection. Specifically, only data pertaining to
household income by quartile, decile, median, and average are published with no breakdown
comparing income to other variables such as level of education attained, age, sex, race, or
household family structure is included as in U.S. Census Bureau data collection (INSEE, 2017;
2016). Without race and income data — two datasets that have been crucial to planning action
for decades in the U.S. — planners in France have been substituting other variables to deduce
indirect relationships with socio-economic inequities. Examples of such datasets are
unemployment rates and education levels used as substitutes for income data as well as
percentage of social housing recipients and foreign heads of household statistics for social
characteristics (INSEE, 2017).
Considering this difference in comparison with standard U.S. equity planning methods,
this research methodology first explores how a case study project defined and attempted to foster
the construction of an equitable and sustainable new neighborhood near downtown Grenoble,
France. This is explored through a review of the available literature on the project. This first
step is significant since there was no data available on household income, poverty, or race at the
IRIS level during the initial design phase of the case study project in 2001. This section provides
an overview of the project including its context within Grenoble, its objectives, and the strategies
used to accomplish them. This includes a discussion of how each strategy implemented related
to social equity within the sustainability goals targeted by the project.
!85
The second section of the research methodology discusses the use of in-person interviews
to gather qualitative data pertaining to De Bonne users’ perceptions of the space in relation to
social equity goals and sustainability. First, this section explains the purpose of the interviews
and how the question design seeks to solicit the necessary qualitative data. Next, the procedure
used to conduct the surveys with users on location in the De Bonne neighborhood is described.
Finally, this sub-section details how this research documented and then exploited the raw data
derived from individual interviews in order to perform data analysis.
Finally, this methodology includes how this research converted quantifiable, qualitative
data resulting from in-person interviews into spatial data for use in adapted applications of
Qualitative GIS (QGIS). True QGIS methods such as geo-narrative analysis or CAQ-GIS were
not used due to time constraints and access to certain software to perform the required data
manipulation and analyses. Instead, QGIS methods in this research signify the integration of
qualitative data into GIS, rather than the adoption of an existing QGIS technique. The challenges
and opportunities presented by this approach are addressed later in the discussion section of this
research following an examination of the case study research results. The following methodology
section then concludes with an explanation of the QGIS tools that were used to spatially
represent the qualitative data derived from user surveys. The QGIS tools are first introduced
before their appropriateness for use in this study are discussed.
1. Semi-Structured Interview Overview
While the quantitative results of this project are clear, this research seeks to determine if a
more nuanced understanding of the De Bonne project’s performance in terms of meeting equity
!86
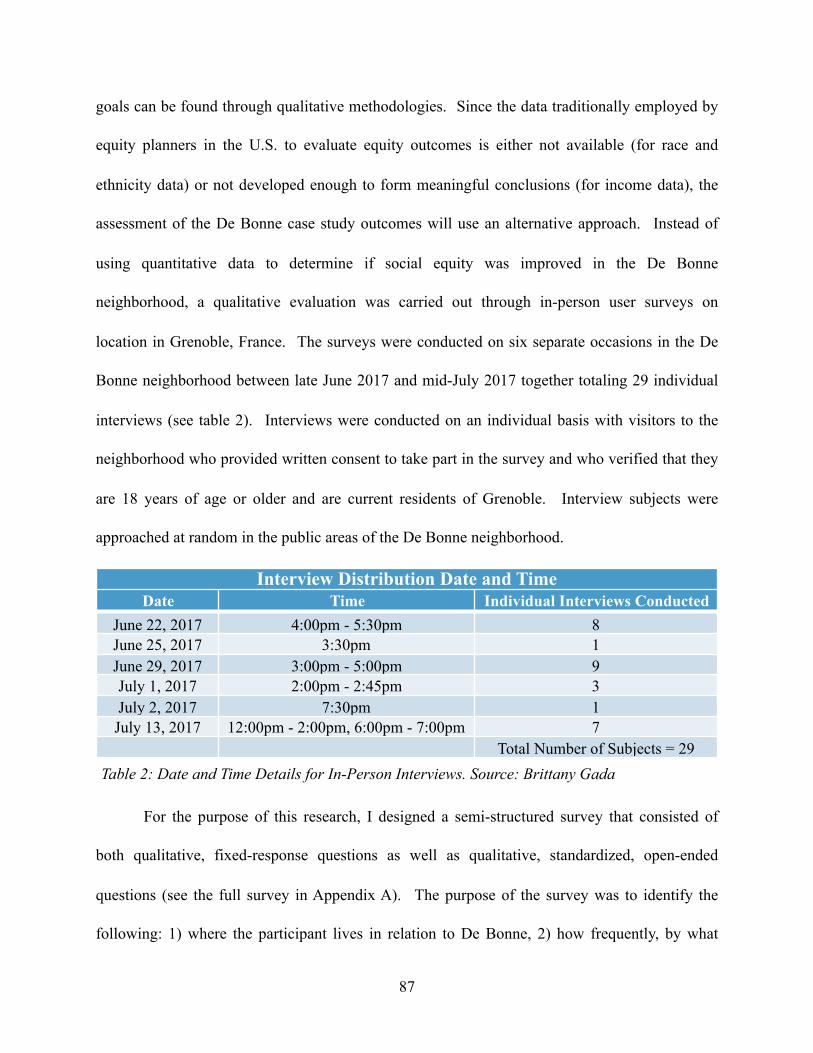
goals can be found through qualitative methodologies. Since the data traditionally employed by
equity planners in the U.S. to evaluate equity outcomes is either not available (for race and
ethnicity data) or not developed enough to form meaningful conclusions (for income data), the
assessment of the De Bonne case study outcomes will use an alternative approach. Instead of
using quantitative data to determine if social equity was improved in the De Bonne
neighborhood, a qualitative evaluation was carried out through in-person user surveys on
location in Grenoble, France. The surveys were conducted on six separate occasions in the De
Bonne neighborhood between late June 2017 and mid-July 2017 together totaling 29 individual
interviews (see table 2). Interviews were conducted on an individual basis with visitors to the
neighborhood who provided written consent to take part in the survey and who verified that they
are 18 years of age or older and are current residents of Grenoble. Interview subjects were
approached at random in the public areas of the De Bonne neighborhood.
For the purpose of this research, I designed a semi-structured survey that consisted of
both qualitative, fixed-response questions as well as qualitative, standardized, open-ended
questions (see the full survey in Appendix A). The purpose of the survey was to identify the
following: 1) where the participant lives in relation to De Bonne, 2) how frequently, by what
!87
Interview Distribution Date and TimeDate Time Individual Interviews Conducted
June 22, 2017 4:00pm - 5:30pm 8June 25, 2017 3:30pm 1June 29, 2017 3:00pm - 5:00pm 9July 1, 2017 2:00pm - 2:45pm 3July 2, 2017 7:30pm 1July 13, 2017 12:00pm - 2:00pm, 6:00pm - 7:00pm 7
Total Number of Subjects = 29Table 2: Date and Time Details for In-Person Interviews. Source: Brittany Gada
mode of transportation, and for what reasons they come to the neighborhood, and 3) how the
participant feels about the neighborhood in terms of select success indicators. The indicators
used by the surveys sought to gauge how well the De Bonne project performed in terms of
sustainability and social equity in the opinion of the interviewee. These indicators were: social
diversity, accessibility, affordability, practicality (of services), aesthetic quality, dynamism, sense
of community, ecological sustainability, and needs fulfillment (see survey copy in Appendix A).
This research sought to design semi-structured interviews which would, on the one hand, yield
quantifiable qualitative data for later use in QGIS. On the other hand, the design would also
allow the subject to speak freely and candidly about his/her feelings, perceptions, and ideas
surrounding the De Bonne neighborhood.
Fixed-response questions were the primary focus of the interview design. These included
both multiple choice questions (closed, preset responses) and Likert Scale statements soliciting a
“score” ranging from “strongly disagree” to “strongly agree” (“no opinion” was also possible).
The multiple choice questions were designed to primarily gain more information about the
subject’s use of the space in terms of frequency, reason, and mode. The Likert Scale questions,
on the other hand, strove to gauge the subject’s perceptions and feelings about the extent to
which the De Bonne project accomplished concrete equity goals. To elaborate, subjects were
asked how they feel about statements such as “The De Bonne neighborhood is accessible from
my home or place of work” or “The De Bonne neighborhood provides affordable amenities and
services”. Without explicitly using the term “equity” during interviews (due to its infrequent use
in the French language and convoluted meaning), multiple concepts that together embody the
!88
larger idea of social equity were addressed in the form of indicators (listed above) to gain a well-
rounded understanding of the participant's feelings on the subject.
Open-ended questions were limited for this research since the interviews had to produce
measurable, qualitative data for use in later QGIS applications through the use of standardized
questions. These questions were also limited due to time constraints for fieldwork research. The
open-ended questions that were included in the interview aimed to identify the following: 1)
where the subject lived before the neighborhood was built, 2) where the subject lives now, 3) the
subject’s favorite aspect of the neighborhood 4) the subject's least favorite aspect, 5) where the
subject went before the finalization of the De Bonne neighborhood or shopping and leisure
activities, and 6) any final comments the subject would like to add. Open-ended questions
numbers one, two, five, and eight request that the subject responds by indicating a location (or
locations) on a map of Grenoble (see survey and map in Appendix A). This map was identical
for all subjects and resulted in spatial data that was mapped and compounded with fixed-
response question results for use in QGIS applications. This semi-structured interview design
paired with spatial, qualitative data facilitates the quantification and comparison of qualitative
data derived from the fixed-response and open-ended questions to gauge overall perceptions of
the De Bonne neighborhood in terms of achieving broad equity goals.
2. Raw Survey Data Preparation for Interview Analysis
This research used the following procedure to prepare raw data for subsequent analysis.
In order to track data derived from individual surveys, data were recorded in two ways. First, a
picture was taken of the interviewee’s responses recorded directly on the map of Grenoble (for
!89
questions one, two, five, and eight) immediately following the conclusion of the survey. This
picture was renamed with a unique identifier for each subject ranging from S1 to S29 (subject 1
to subject 29). Responses on the map were then erased for use with the next subject. Second, I
created an online version of the survey using the online survey generator tool, Survey Planet, to
keep a digital record of all fixed-response survey responses. This online survey was for personal
use only. After conducting all interviews for one day, I entered the responses from each survey
participant into the Survey Planet version. This tool keeps an automatic record of the subject’s
number (Participant 1 to Participant 29) which was used to link digital, recorded survey
responses to the pictures of map-based survey responses titled by subject number.
Once all 29 interviews were completed and entered into the online survey, I exported the
raw data to an Microsoft Excel spreadsheet. Rows, columns, and individual data cells were
edited to facilitate data analysis. First, columns detailing the time, location, browser used, and
time elapsed during the survey of each participant record were deleted since they were irrelevant
to the research. Second, the header row of the table was simplified to remove excess text from
the question text included in the raw survey data when exported. Next, text-format responses to
question three (how often do you come to De Bonne?) were edited into numerical responses
from 1 (rarely) to 4 (very often). This facilitated easier data management and allowed responses
to be counted using the FREQUENCY function. Then, all yes-or-no responses were converted
into a 0 (no) or 1 (yes) for simplicity in GIS applications. This method was also used to simplify
responses to question 6 regarding subjects’ primary reasons for coming to the neighborhood.
When exported in raw data form, responses for this question were recorded using a true/false
system. For example, if a subject responded to question six that shopping is a primary reason to
!90
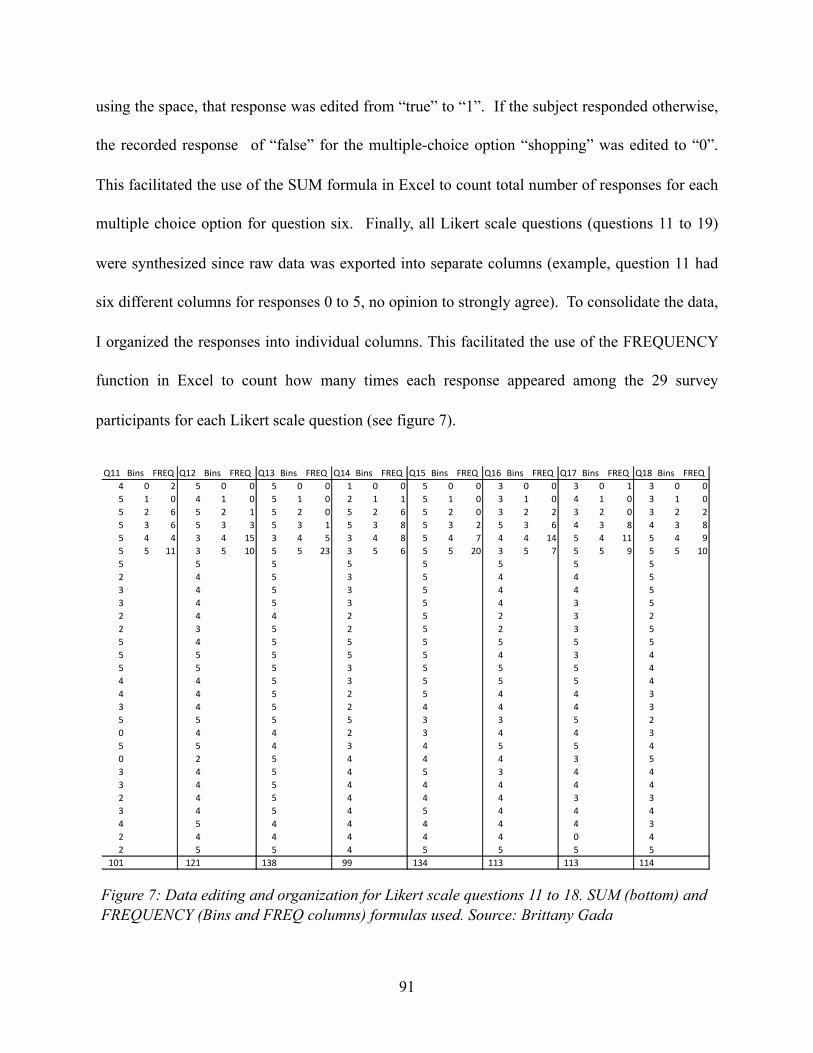
using the space, that response was edited from “true” to “1”. If the subject responded otherwise,
the recorded response of “false” for the multiple-choice option “shopping” was edited to “0”.
This facilitated the use of the SUM formula in Excel to count total number of responses for each
multiple choice option for question six. Finally, all Likert scale questions (questions 11 to 19)
were synthesized since raw data was exported into separate columns (example, question 11 had
six different columns for responses 0 to 5, no opinion to strongly agree). To consolidate the data,
I organized the responses into individual columns. This facilitated the use of the FREQUENCY
function in Excel to count how many times each response appeared among the 29 survey
participants for each Likert scale question (see figure 7).
!91
Q11 Bins FREQ Q12 Bins FREQ Q13 Bins FREQ Q14 Bins FREQ Q15 Bins FREQ Q16 Bins FREQ Q17 Bins FREQ Q18 Bins FREQ4 0 2 5 0 0 5 0 0 1 0 0 5 0 0 3 0 0 3 0 1 3 0 05 1 0 4 1 0 5 1 0 2 1 1 5 1 0 3 1 0 4 1 0 3 1 05 2 6 5 2 1 5 2 0 5 2 6 5 2 0 3 2 2 3 2 0 3 2 25 3 6 5 3 3 5 3 1 5 3 8 5 3 2 5 3 6 4 3 8 4 3 85 4 4 3 4 15 3 4 5 3 4 8 5 4 7 4 4 14 5 4 11 5 4 95 5 11 3 5 10 5 5 23 3 5 6 5 5 20 3 5 7 5 5 9 5 5 105 5 5 5 5 5 5 52 4 5 3 5 4 4 53 4 5 3 5 4 4 53 4 5 3 5 4 3 52 4 4 2 5 2 3 22 3 5 2 5 2 3 55 4 5 5 5 5 5 55 5 5 5 5 4 3 45 5 5 3 5 5 5 44 4 5 3 5 5 5 44 4 5 2 5 4 4 33 4 5 2 4 4 4 35 5 5 5 3 3 5 20 4 4 2 3 4 4 35 5 4 3 4 5 5 40 2 5 4 4 4 3 53 4 5 4 5 3 4 43 4 5 4 4 4 4 42 4 5 4 4 4 3 33 4 5 4 5 4 4 44 5 4 4 4 4 4 32 4 4 4 4 4 0 42 5 5 4 5 5 5 5
101 121 138 99 134 113 113 114
Figure 7: Data editing and organization for Likert scale questions 11 to 18. SUM (bottom) and FREQUENCY (Bins and FREQ columns) formulas used. Source: Brittany Gada
3. Raw Data Preparation for Use in GIS and QGIS
To prepare the map-based survey responses for use in GIS and, more specifically, in
QGIS applications was to plot all spatial responses into ESRI’s ArcMap software. However,
several initial steps were carried out to facilitate this. First, I created an appropriate GIS data
filing system called a file geodatabase using ESRI’s ArcCatalog program. This file geodatabase,
labeled grenobledata.gdb, was given a coordinate system appropriate for Grenoble, France
(RGF93_Lambert_93 which is used for most GIS applications in Europe). Second, all necessary
contextual shapefiles were downloaded from a freely-available OpenStreetMap source into the
grenobledata file geodatabase. The OpenStreetMap shapefiles, however, were not specific to
Grenoble. They included data for the entire Rhône-Alpes region. Therefore, the third step to
prepare the GIS data for this research was to clip all OpenStreetMap shapefiles to Grenoble’s
city limits. Using the buildings shapefile included in the OpenSteetMap download, all IRIS
entries located in Grenoble were selected using the Select By Attributes tool. Next, a new
feature layer was created from the selection using the Create Layer From Selected Features
function followed by the export data function. This feature layer was exported using the data
frame’s coordinate system (RGF93_Lambert_93) into the grenobledata file geodatabase using
the name GRonly_IRIS.
Using the new GRonly_IRIS polygon feature class, all other necessary shapefiles
downloaded from OpenStreetMap were clipped (using the Clip tool in the Extract toolbox) to the
feature class’s boundary. I created the following feature classes using this process: 1)
GR_railways, 2) GR_transport_stops, and GR_roads. Once these feature classes were created, I
!92
created metadata for each dataset detailing the source of the information. Finally, all contextual
feature classes were added into a new ArcMap document and saved Thesis.mxd.
After these preliminary steps to create the necessary geodatabase filing system and
contextual feature classes, I proceeded with GIS data entry for survey responses. First, all
relevant feature classes and non-spatial data tables for use in the thesis research derived from
survey data were first created in the grenobledata file geodatabase using ArcCatalog using the
same coordinate system as the existing Grenoble feature classes (RGF93_Lambert_93). This
operation created empty feature classes. Attribute table fields and their parameters were also
added at this time. Any new feature classes (point, line, or polygon) created in this way were
then added into ArcMap and edited separately to create individual features during an editing
session. When necessary, data records were also added to the feature class’s attribute table
during the initial editing session as individual features were created. I ensured that each created
feature corresponded to an individual survey participant’s responses when applicable. For
example, when creating the first point (Object ID or OID 1) in the live_now feature class, I
plotted the spatial response from subject 1’s map image record and then entered in this subject’s
survey responses into the attribute records corresponding to questions 3 (frequency of visits) and
4 (mode of transportation used) as well as if they moved closer to De Bonne since the project’s
completion (see figure 8 for example of live_now attribute table).
This process was adopted to create the following feature classes: 1) lived_pre2011
(question 1), 2) live_now, 3) debonne_bound, 4) debonne_bldgs, and 5) debonne_green (see
table 3 for description of all feature classes used by this research). Finally, the feature classes
were then added into a new ArcGIS map document titled ThesisSurveyData.mxd and organized
!93
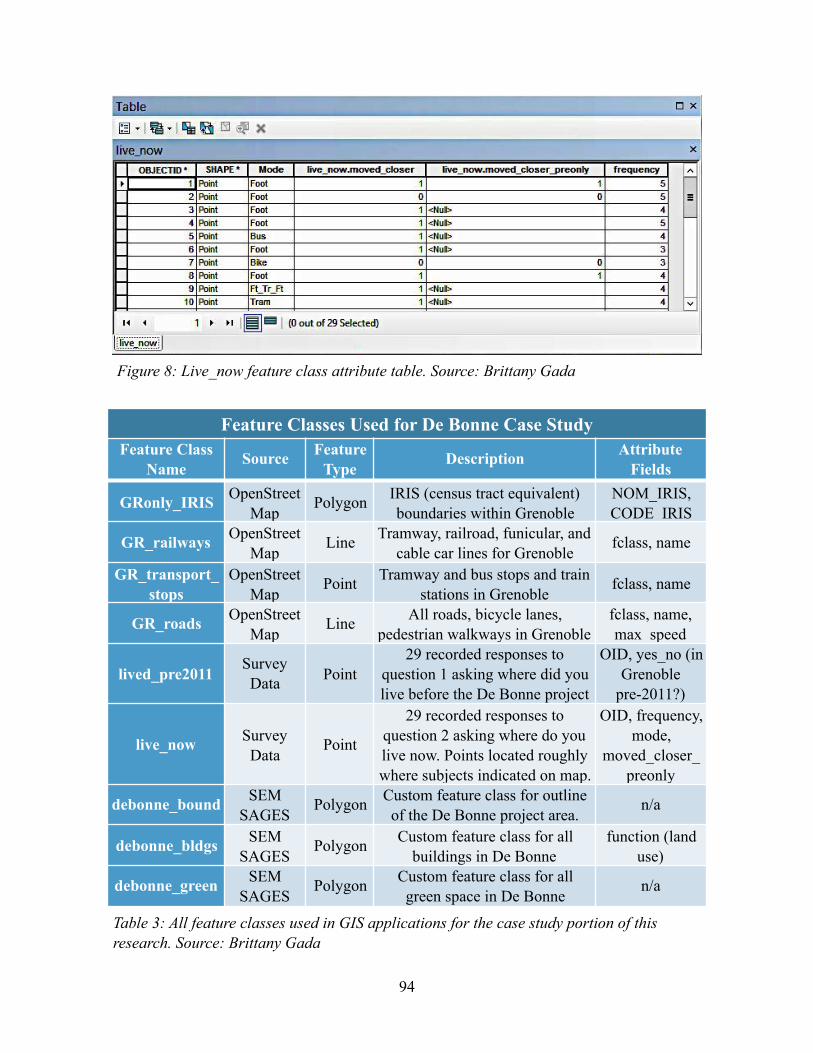
!94
Feature Classes Used for De Bonne Case StudyFeature Class
NameSource Feature
TypeDescription Attribute
Fields
GRonly_IRIS OpenStreetMap
Polygon IRIS (census tract equivalent) boundaries within Grenoble
NOM_IRIS, CODE_IRIS
GR_railways OpenStreetMap
Line Tramway, railroad, funicular, and cable car lines for Grenoble
fclass, name
GR_transport_stops
OpenStreetMap
Point Tramway and bus stops and train stations in Grenoble
fclass, name
GR_roads OpenStreetMap
Line All roads, bicycle lanes, pedestrian walkways in Grenoble
fclass, name, max_speed
lived_pre2011Survey Data Point
29 recorded responses to question 1 asking where did you live before the De Bonne project
OID, yes_no (in Grenoble
pre-2011?)
live_now Survey Data
Point
29 recorded responses to question 2 asking where do you live now. Points located roughly where subjects indicated on map.
OID, frequency, mode,
moved_closer_preonly
debonne_bound SEM SAGES
Polygon Custom feature class for outline of the De Bonne project area.
n/a
debonne_bldgs SEM SAGES
Polygon Custom feature class for all buildings in De Bonne
function (land use)
debonne_green SEM SAGES
Polygon Custom feature class for all green space in De Bonne
n/a
Table 3: All feature classes used in GIS applications for the case study portion of this research. Source: Brittany Gada
Figure 8: Live_now feature class attribute table. Source: Brittany Gada
into separate data frames (Lived Before 2011, Currently Live, and De Bonne). All contextual
feature classes were then added to each data frame. The map document was then ready for
spatial analysis.
4. GIS and QGIS Methods Used for Analysis
This research seeks to use alternative GIS methods that incorporate the qualitative data
gathered through in-person interviews to evaluate the success of the De Bonne project in meeting
social equity goals. While most planning, and more specifically, equity planning evaluation
methods revolve around evolutions of quantitative data over time, the evaluation of this case
study will instead focus on how local users perceive the space to assess success in meeting equity
goals. Since the qualitative data resulting from the surveys are inherently linked to the spatial
context of the De Bonne neighborhood and its surrounding areas, various techniques were used
to analyze this qualitative data in a spatial way using GIS and simplified QGIS techniques.
First, qualitative survey data was incorporated into the chosen GIS platform, ArcMap. I
used the following procedure to add all records of survey question responses to each feature (to
each subject): 1) In an Excel workbook, each set of responses for Likert questions were added to
new, individual sheets and titled accordingly; 2) Each sheet was formatted to include a unique
identifier for each subject (an OID) and the set of responses; 3) Each sheet was exported
individually into a CSV format; 4) Using the Add Table (multiple) function in ArcCatalog, all
CSV tables were added to the grenobledata file geodatabase; 5) All tables were added into the
data frame in ArcMap including the live_now feature class; 6) Each table was joined to the
live_now feature class using the one-to-one relationship established using the ObjectID (feature
!95
class) and OID (tables) fields. Using this series of procedures, all qualitative data regarding user
perceptions were added to the live_now feature class for subsequent data analysis. Once the data
was added into ArcMap in this way, symbology features of ArcMap can be used to visualize the
spatial distribution of responses in terms of the point of origin of the subject (current residence
using live_now feature class), mode of transportation used, or visitation frequency. Furthermore,
data can be filtered using Select By Attributes or Select By Location tools and subsequently
symbolized to analyze subsets of data. For example, it is possible to look for differences in
Likert scale responses among subjects who answered that they visit the neighborhood very often
as opposed to those who only visit sometimes.
Not only is the qualitative data from surveys linked to the subjects’ residences, it is
certainly linked to the space of the De Bonne neighborhood itself. In this way, a sort of “heat
map” of subjects’ feelings can be created to identify the areas of the neighborhood where people
feel either positively or negatively about the space. Since the built-in ArcMap tool used to create
traditional heat maps is only compatible with population density data, the method used to create
a feelings map of the De Bonne neighborhood used a custom approach. This was carried out by
creating a new polygon feature class of the different spaces in the neighborhood (Esplanade Le
Ray, Jardin des Vallons, Caserne de Bonne shopping mall, housing, water basin, etc). Polygons
for different neighborhood areas were assigned a value of 1 or 0 (positive feeling and negative
feeling, respectively) based on feelings and opinions expressed during user responses to open-
ended questions during surveys. I used various symbology and color schemes to represent this
data. This allows viewers to easily see the spaces in the neighborhood where improvements or
attention are needed.
!96
Finally, a simplified form of QGIS is used to document subjects’ commentary and
personal images in reference to their spatial significance in the De Bonne neighborhood. Due to
time constraints, this research was not able to gather a large number of individual interviews or
more detailed qualitative data using a greater number of open-ended questions in the surveys. As
a result, the data collected does not necessitate data-heavy qualitative analysis or the use of
qualitative data analysis platforms like Nvivo (as used in Kwan’s geo-narrative methodology,
2008) or Atlas.ti (as used in Verd & Porcel, 2012 and Jung & Elwood, 2010) that are compatible
with GIS-based softwares like GoogleEarth or ArcMap. Instead, a more simplified approach was
taken to accomplish a similar result that was better suited to the data collected. Namely, ESRI’s
Story Map service was used to integrate the qualitative data from surveys into a GIS
environment. Story Maps is ESRI’s premier service allowing users to “combine authoritative
maps with narrative text, images, and multimedia content” (ESRI, 2017). The Story Map series
offers a variety of different online templates available through ESRI's ArcOnline platform to
display qualitative data in a variety of creative formats depending on data needs and suitability.
The Story Map tool chosen to evaluate the case study location was ESRI’s Story Map
Tour product. This particular product was chosen over other templates because of its ease of use
both for the Story Map builder and the Story Map viewer as well as its ideal layout for viewing
qualitative data side-by-side with spatial characteristics. Story Maps are also easily shared on
various online platforms such as Facebook and personal websites as well as via email which
makes it an attractive tool for this research. Using the Story Map Tour tool, select images from
personal photographs of the De Bonne neighborhood and narrative quotations from surveys were
incorporated into the Story Map platform. This custom Story Map Tour provides an alternative
!97
view of the neighborhood that quantitive applications of GIS cannot provide to better understand
and evaluate the outcomes of this project in terms of equity.
Chapter 5: Case Study Research Results
This section discusses the results from the qualitative analysis of the De Bonne project’s
outcomes in terms of social equity. The results are broken down into two sections. First, the
findings of the interview analyses alone are reported. Second, an alternative evaluation of the
results using the qualitative data derived from subject interviews is offered through adapted
QGIS methods.
1. First Impressions: Findings of Interview Analyses
The first set of results stem from a quantitative analysis of the qualitative data gathered
from the 29 semi-structured, in-person interviews. The results from the following fixed-response
interview questions are explained in this section:
1. Question 3: How often do you come to the De Bonne neighborhood?
• Rarely
• Sometimes
• Often
• Very Often
2. Question 4: What mode of transportation do you use to come to the De Bonne
neighborhood?
• Foot
• Bike
• Bus
• Tramway
• Car
!98
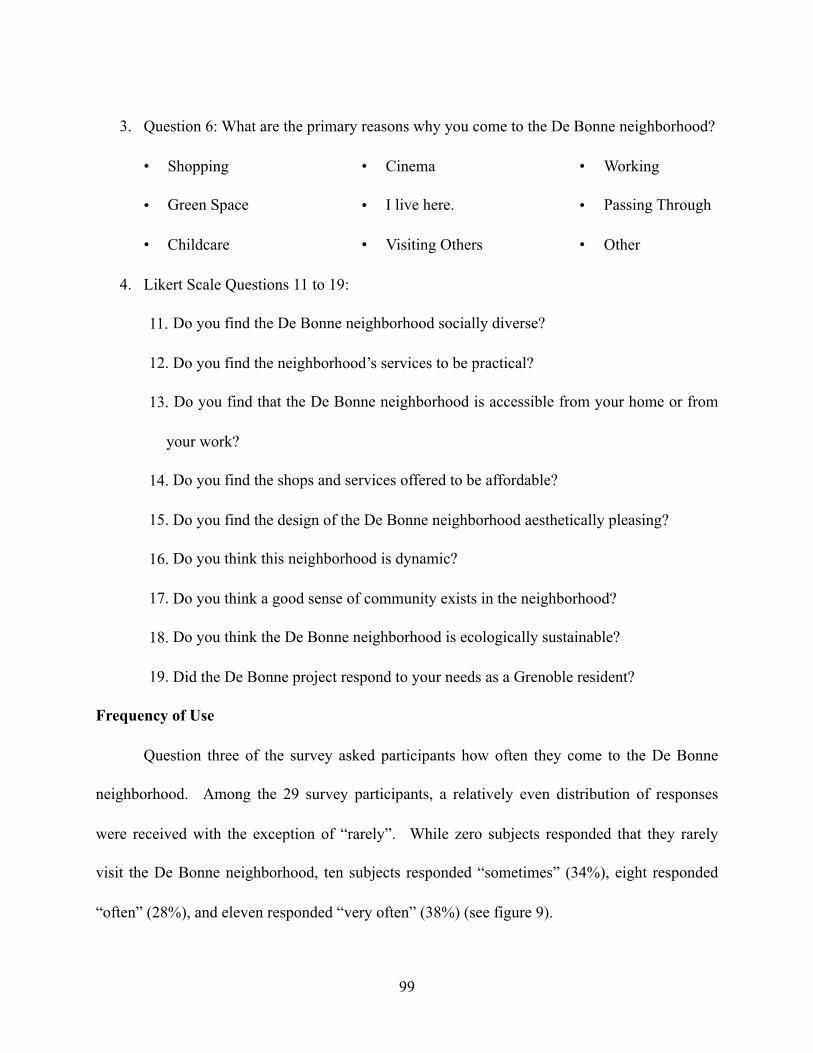
3. Question 6: What are the primary reasons why you come to the De Bonne neighborhood?
• Shopping
• Green Space
• Childcare
• Cinema
• I live here.
• Visiting Others
• Working
• Passing Through
• Other
4. Likert Scale Questions 11 to 19:
11. Do you find the De Bonne neighborhood socially diverse?
12. Do you find the neighborhood’s services to be practical?
13. Do you find that the De Bonne neighborhood is accessible from your home or from
your work?
14. Do you find the shops and services offered to be affordable?
15. Do you find the design of the De Bonne neighborhood aesthetically pleasing?
16. Do you think this neighborhood is dynamic?
17. Do you think a good sense of community exists in the neighborhood?
18. Do you think the De Bonne neighborhood is ecologically sustainable?
19. Did the De Bonne project respond to your needs as a Grenoble resident?
Frequency of Use
Question three of the survey asked participants how often they come to the De Bonne
neighborhood. Among the 29 survey participants, a relatively even distribution of responses
were received with the exception of “rarely”. While zero subjects responded that they rarely
visit the De Bonne neighborhood, ten subjects responded “sometimes” (34%), eight responded
“often” (28%), and eleven responded “very often” (38%) (see figure 9).
!99
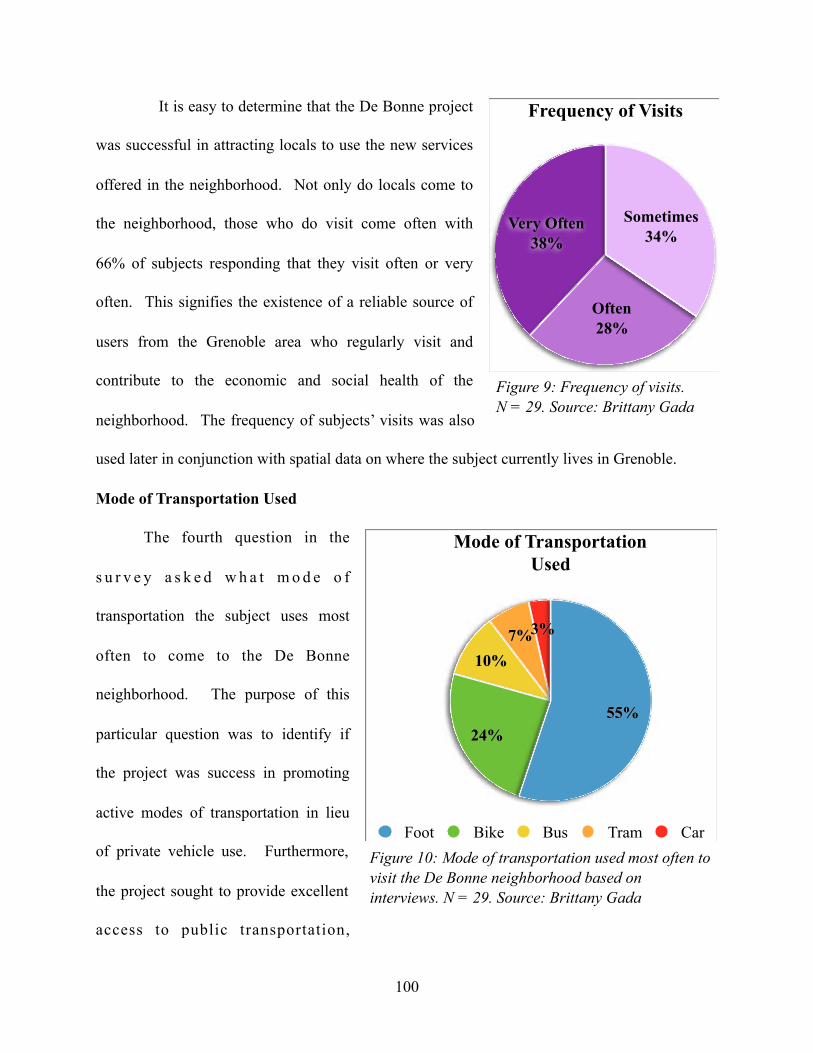
It is easy to determine that the De Bonne project
was successful in attracting locals to use the new services
offered in the neighborhood. Not only do locals come to
the neighborhood, those who do visit come often with
66% of subjects responding that they visit often or very
often. This signifies the existence of a reliable source of
users from the Grenoble area who regularly visit and
contribute to the economic and social health of the
neighborhood. The frequency of subjects’ visits was also
used later in conjunction with spatial data on where the subject currently lives in Grenoble.
Mode of Transportation Used
The fourth question in the
s u r v e y a s k e d w h a t m o d e o f
transportation the subject uses most
often to come to the De Bonne
neighborhood. The purpose of this
particular question was to identify if
the project was success in promoting
active modes of transportation in lieu
of private vehicle use. Furthermore,
the project sought to provide excellent
access to public transportation,
!100
Frequency of Visits
Very Often 38%
Often 28%
Sometimes 34%
Figure 9: Frequency of visits. N = 29. Source: Brittany Gada
Mode of Transportation Used
3%7%10%
24%55%
Foot Bike Bus Tram CarFigure 10: Mode of transportation used most often to visit the De Bonne neighborhood based on interviews. N = 29. Source: Brittany Gada
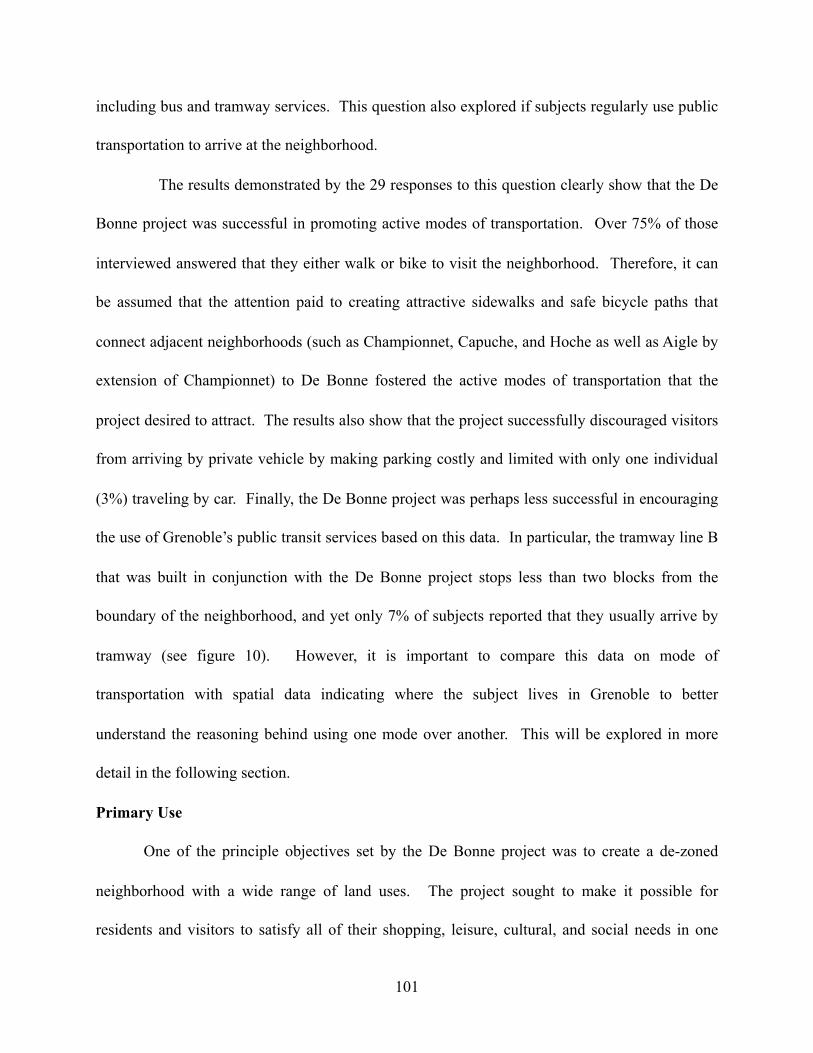
including bus and tramway services. This question also explored if subjects regularly use public
transportation to arrive at the neighborhood.
The results demonstrated by the 29 responses to this question clearly show that the De
Bonne project was successful in promoting active modes of transportation. Over 75% of those
interviewed answered that they either walk or bike to visit the neighborhood. Therefore, it can
be assumed that the attention paid to creating attractive sidewalks and safe bicycle paths that
connect adjacent neighborhoods (such as Championnet, Capuche, and Hoche as well as Aigle by
extension of Championnet) to De Bonne fostered the active modes of transportation that the
project desired to attract. The results also show that the project successfully discouraged visitors
from arriving by private vehicle by making parking costly and limited with only one individual
(3%) traveling by car. Finally, the De Bonne project was perhaps less successful in encouraging
the use of Grenoble’s public transit services based on this data. In particular, the tramway line B
that was built in conjunction with the De Bonne project stops less than two blocks from the
boundary of the neighborhood, and yet only 7% of subjects reported that they usually arrive by
tramway (see figure 10). However, it is important to compare this data on mode of
transportation with spatial data indicating where the subject lives in Grenoble to better
understand the reasoning behind using one mode over another. This will be explored in more
detail in the following section.
Primary Use
One of the principle objectives set by the De Bonne project was to create a de-zoned
neighborhood with a wide range of land uses. The project sought to make it possible for
residents and visitors to satisfy all of their shopping, leisure, cultural, and social needs in one
!101
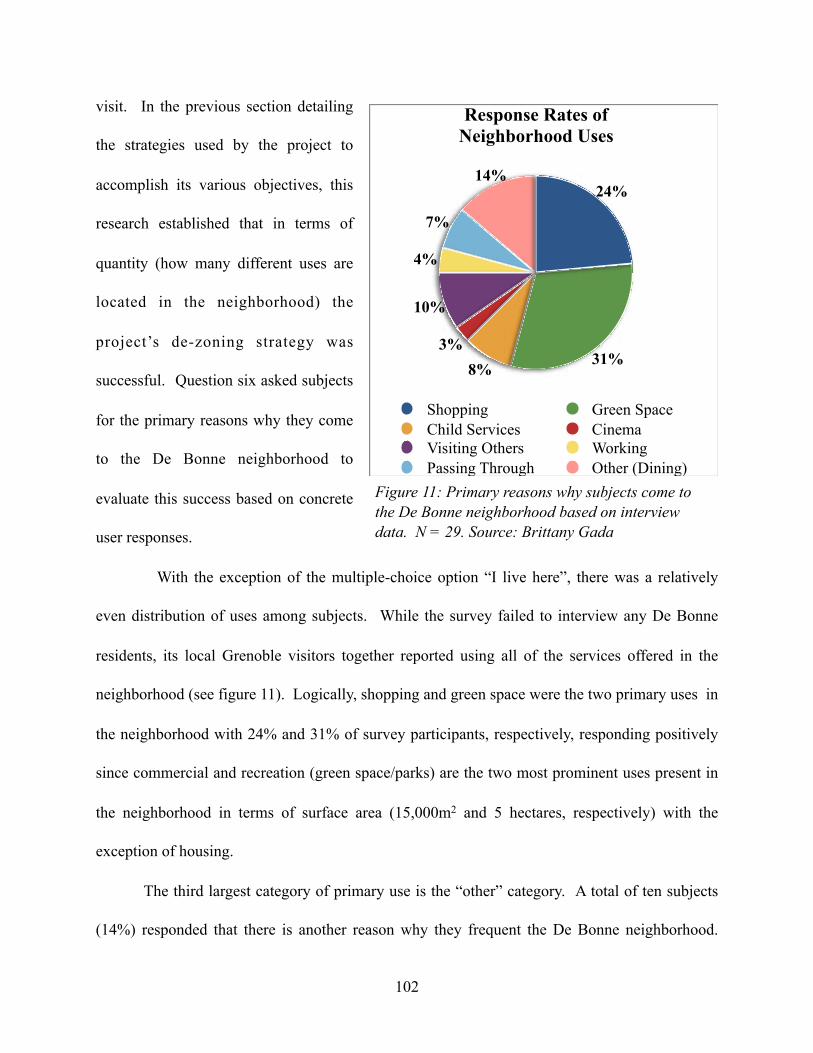
visit. In the previous section detailing
the strategies used by the project to
accomplish its various objectives, this
research established that in terms of
quantity (how many different uses are
located in the neighborhood) the
project’s de-zoning strategy was
successful. Question six asked subjects
for the primary reasons why they come
to the De Bonne neighborhood to
evaluate this success based on concrete
user responses.
With the exception of the multiple-choice option “I live here”, there was a relatively
even distribution of uses among subjects. While the survey failed to interview any De Bonne
residents, its local Grenoble visitors together reported using all of the services offered in the
neighborhood (see figure 11). Logically, shopping and green space were the two primary uses in
the neighborhood with 24% and 31% of survey participants, respectively, responding positively
since commercial and recreation (green space/parks) are the two most prominent uses present in
the neighborhood in terms of surface area (15,000m2 and 5 hectares, respectively) with the
exception of housing.
The third largest category of primary use is the “other” category. A total of ten subjects
(14%) responded that there is another reason why they frequent the De Bonne neighborhood.
!102
Response Rates of Neighborhood Uses
14%
7%
4%
10%
3%8%
31%
24%
Shopping Green SpaceChild Services CinemaVisiting Others WorkingPassing Through Other (Dining)
Figure 11: Primary reasons why subjects come to the De Bonne neighborhood based on interview data. N = 29. Source: Brittany Gada
Within the “other” category, the primary use was dining at one of De Bonne’s cafes or
restaurants (seven of the ten “other” responses). The survey design failed to include the option
“dining” as a possible response to this question which explains the high response rate for the
“other” category. The fourth most prevalent response was visiting others in the neighborhood.
Instead of participating in the commercial aspects of the neighborhood, 10% of participants
primarily participate in the social environment of the space. While on site conducting
interviews, it was clear that the neighborhood facilitates a comfortable and peaceful outdoor area
to engage in social activities with friends and family. This will be explored in more detail using
QGIS methods in the following section.
Finally, a relatively small percentage of subjects responded that they primarily come to
the neighborhood for childcare services or playground use (only 6 positive responses).
Considering the presence of an elementary school, a daycare, a playground, and over 800
housing units with a large percentage of families, I expected this to be a more prevalent use in
the neighborhood. This low response rate may be due to the absence of De Bonne residents
participating in the survey since this group is most likely to use the childcare services in the
neighborhood.
Overall, the De Bonne neighborhood successfully created a neighborhood with a variety
of functions that are regularly used by Grenoble residents. The especially high response rates for
shopping and enjoying green space show that local users find that the shops offer goods and
services that they need or find valuable and that the green space provides an attractive area to
enjoy a calm, outdoor environment. These findings support an assumption that the De Bonne
project successfully created an affordable, attractive, convenient, and socially healthy space.
!103
However, this assumption will be explored in more detail using the data resulting from Likert
scale questions examining user perceptions.
Likert Scale Questions — Equity and Sustainability Indicators
The largest section of the in-person interviews included the fixed-response Likert scale
questions that sought to gauge the subjects’ opinions on various equity and sustainability
indicators in relation to the De Bonne neighborhood. The responses to these questions (numbers
11 to 19) ranged from “no opinion” (value 0) to “strongly agree” (value 5). Figure 12, below,
synthesizes the cumulative response rates for all Likert scale questions from the 29 subjects. As
previously mentioned, the indicators used to analyze subjects’ opinions on the project’s
performance in terms of social equity and sustainability were: 1) social diversity, 2) practicality
(of services), 3) accessibility, 4) affordability, 5) aesthetic quality, 6) dynamism, 7) sense of
community, 8) ecological sustainability, and 10) needs fulfillment.
The two highest performing indicators based on the responses to the Likert scale
questions were in regards to accessibility and aesthetic quality. For accessibility, 97% of subjects
either agreed or strongly agreed that the neighborhood is accessible from their home or place of
work. Only one subject remained neutral on the topic, and no one responded negatively. Not
only was accessibility a key objective for the project itself, accessibility is a strong indicator of
equity and sustainability. This is especially true considering the prevalence of subjects also
responding that they access the neighborhood most often by active modes or shared modes of
transportation rather than by private vehicle use. This shows success in promoting equity of
access, economic sustainability (easily accessible places by multiple modes of transportation will
!104
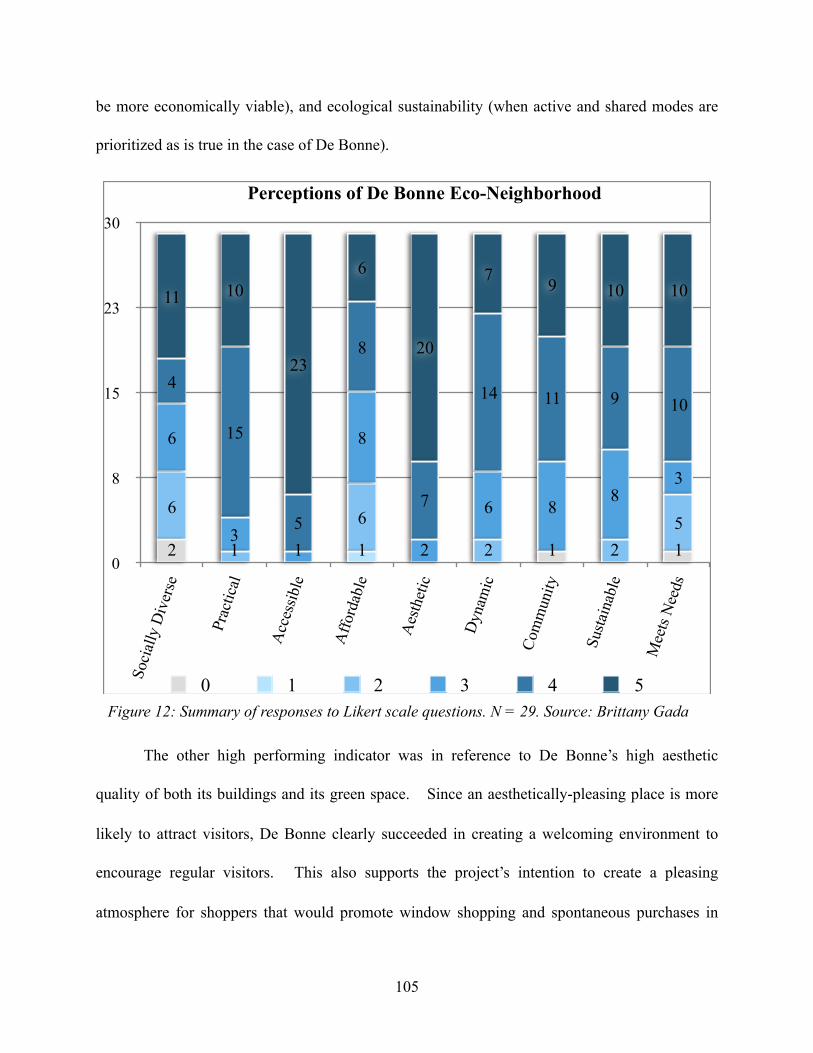
be more economically viable), and ecological sustainability (when active and shared modes are
prioritized as is true in the case of De Bonne).
The other high performing indicator was in reference to De Bonne’s high aesthetic
quality of both its buildings and its green space. Since an aesthetically-pleasing place is more
likely to attract visitors, De Bonne clearly succeeded in creating a welcoming environment to
encourage regular visitors. This also supports the project’s intention to create a pleasing
atmosphere for shoppers that would promote window shopping and spontaneous purchases in
!105
Perceptions of De Bonne Eco-Neighborhood
0
8
15
23
30
Soci
ally
Div
erse
Prac
tical
Acc
essib
le
Affo
rdab
le
Aes
thet
ic
Dyn
amic
Com
mun
ity
Susta
inab
le
Mee
ts N
eeds
101097
20
6
23
1011
1091114
7
8
5
15
4
38
86
2
8
13
6
522
6
1
6
1 112
0 1 2 3 4 5Figure 12: Summary of responses to Likert scale questions. N = 29. Source: Brittany Gada
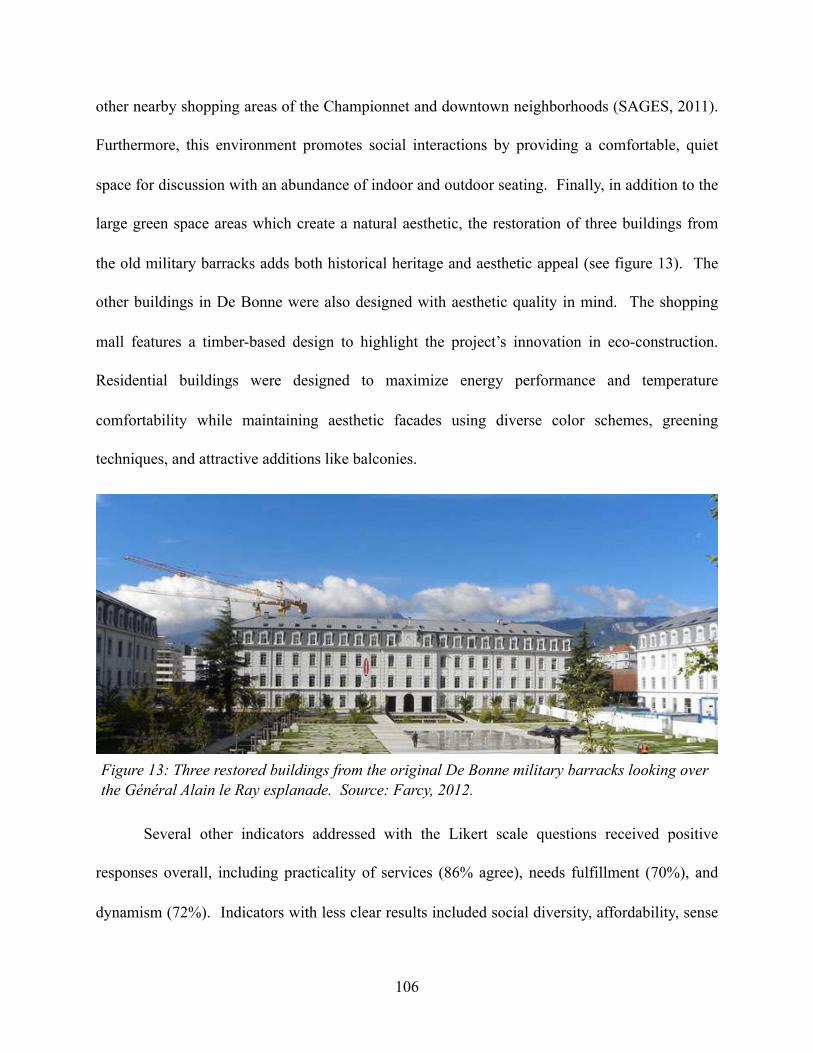
other nearby shopping areas of the Championnet and downtown neighborhoods (SAGES, 2011).
Furthermore, this environment promotes social interactions by providing a comfortable, quiet
space for discussion with an abundance of indoor and outdoor seating. Finally, in addition to the
large green space areas which create a natural aesthetic, the restoration of three buildings from
the old military barracks adds both historical heritage and aesthetic appeal (see figure 13). The
other buildings in De Bonne were also designed with aesthetic quality in mind. The shopping
mall features a timber-based design to highlight the project’s innovation in eco-construction.
Residential buildings were designed to maximize energy performance and temperature
comfortability while maintaining aesthetic facades using diverse color schemes, greening
techniques, and attractive additions like balconies.
Several other indicators addressed with the Likert scale questions received positive
responses overall, including practicality of services (86% agree), needs fulfillment (70%), and
dynamism (72%). Indicators with less clear results included social diversity, affordability, sense
!106
Figure 13: Three restored buildings from the original De Bonne military barracks looking over the Général Alain le Ray esplanade. Source: Farcy, 2012.
of community, and ecological sustainability. While nearly half of subjects agreed that the De
Bonne neighborhood is socially diverse, six subjects specifically responded that they “disagree”
indicating that the neighborhood is not socially diverse. Six others remained neutral, and two
indicated that they have no opinion. A key objective of the De Bonne project was to promote
social diversity among residents primarily through the high percentage of social housing units
available and focus on housing designs for families. Despite this, the social equity indicator of
social diversity received mix opinions. One survey subject in particular who reported working in
De Bonne’s shopping mall — and is therefore present in the neighborhood most days of the week
— responded negatively to this statement. While success on this indicator cannot be determined
by this question alone since subjects were all non-residents (therefore basing responses on
singular observations in time), it does put into question the project’s success on this topic since
half of users do not believe De Bonne is socially diverse.
Similar to the results for the social diversity indicator, it was difficult to determine if a
good sense of community exists in the De Bonne neighborhood. This is not only a key indicator
of social cohesion but also a specific objective of shared-space designs including the communal
green space between apartment buildings, associative spaces, and children’s playgrounds.
Although a majority (68%) of subjects agreed that they think the neighborhood has a positive
community spirit, eight subjects chose to respond in a neutral manner, and one gave no opinion.
Once again, it is impossible to truly understand the social health of a neighborhood without
living there. Therefore, perceptions on De Bonne’s sense of community are the result of direct
observations made by visitors on various occasions.
!107
The next equity indicator that received indeterminate responses surrounded the issue of
affordability. The Likert scale statement about affordability specifically questioned the
affordability of De Bonne's shops and services. Housing affordability was intentionally left out
due to the uncertainty of implicating De Bonne residents in the survey. Less than half of survey
participants (48%) agreed that the shops and services in the neighborhood are affordable.
However, nearly a quarter of subjects (24%) disagreed while the remaining subjects chose to stay
neutral on the topic. This finding was unexpected due to the high frequency of return customers
to the De Bonne shops (as indicated by frequency of visits data). There may be several reasons
for the range in the results surrounding affordability. First, among the roughly thirty shops in the
mall, there is a wide range of price points even for similar products. For example, in France two
major outdoor equipment stores are Decathlon and Au Vieux Campeur. Both are located in the
De Bonne shopping mall with Decathlon featuring significantly lower price points than Au Vieux
Campeur (personal observation, July 20, 2017). Similar cases exist for clothing and shoe stores
in the mall. This could lead to differing opinions about affordability based on where the subject
chooses to shop. Next, the only grocery store in the De Bonne neighborhood is a French chain
called Monoprix. This grocery store traditionally charges higher prices than its competitors —
an issue that was brought up several times during the surveys with users. Finally, opinions about
the affordability of shops and services is informed by each individual subject’s household
income and how much disposable income they feel that they have to spend on non-essential
items available for purchase in the De Bonne neighborhood. Although subjects were not asked
about their household incomes, the limited income data available at the neighborhood level show
that De Bonne is surrounded by neighborhoods of differing income levels with the Championnet
!108
neighborhood reflecting the presence of an upper-middle class and other nearby neighborhoods
(Capuche, Hoche, and Aigle) showing data for lower- and middle-income residents (INSEE,
2017). Survey data on affordability will be explored in the QGIS results using corresponding
data on location of subjects’ current residences, mode of transportation used, and frequency of
visits to the neighborhood.
Finally, subjects gave mixed responses for the ecological sustainability indicator.
Arguably, this was the principle objective of the De Bonne project — to design a new
neighborhood that surpassed any energy performance level seen in French eco-construction and
while conforming to the standards imposed by the European Union’s Concerto program.
Surprisingly, eight subjects could not decide if the neighborhood is ultimately an ecologically
sustainable place and remained neutral. More surprising still were the two subjects who
answered that they disagree. One subject who did not feel that De Bonne was ecologically
sustainable even noted in response to the final question of the survey (“Is there anything else you
would like to add about the De Bonne neighborhood?”) that “They tried to create a green
neighborhood, but in the end it’s not green at all” (Subject 11, in-person interviews).
Survey Results Summary
An exploration of the quantifiable, qualitative data gathered through the 29 in-person
interviews shows overall success in meeting equity and sustainability goals by the De Bonne
project. The data shows that De Bonne attracts regular visitors who typically arrive in the
neighborhood using active or shared modes of transportation. This signifies accessibility for all
to De Bonne’s services and to its ecologically sustainable environment even for those without
access to a private vehicle. Enjoying the green space in the neighborhood is the primary reason
!109
why subjects came to De Bonne, often combining this use with satisfying social needs of visiting
with friends and family. Not only do these visitors come to the neighborhood often, all 29
subjects responded that they enjoy spending time at De Bonne (survey question 20, see Appendix
A). In general, subjects perceive that the project was successful in attaining improved social
equity and sustainability in the neighborhood based on relatively high scores for accessibility,
sense of community, and ecological sustainability indicators. However, perception data must be
explored in more detail using QGIS to identify spatial relationships with qualitative data
especially for the affordability indicator. Furthermore, the social diversity indicator for social
equity was inconclusive using the data made available through user surveys due to the lack of
resident participation in surveys.
2. A Different Look: Qualitative Data Analysis Findings using QGIS
The problem statement for this research seeks to explore how urban planners in France
define social equity and seek to promote it. The fourth research question of this research
examines how the outcomes of French equity projects may be able to be evaluated considering
the limited quantitative data available on race and income. Since most planners in the U.S.
follow procedures that prioritize quantitative data when evaluating a project’s success in meeting
equity goals, this research is interested in determining if it is possible to use qualitative data to
assess outcomes instead of or as a supplement to quantitative data. Since planning is intrinsically
linked to space, this research uses GIS to find creative ways of integrating qualitative data with
spatial data to form conclusions about how De Bonne users perceive the success of the project in
meeting equity objectives. This section discusses the results from the three qualitative
!110
techniques that integrated data with GIS capabilities — perception polygons, pattern analysis
using point and perception data, and an ESRI’s Story Map Tour.
Perception Polygons
The purpose of converting qualitative data from surveys into spatial polygon data was to
more effectively visualize how areas of the De Bonne neighborhood are viewed by local users.
By tracing over areas using the auto-complete polygon tool to create features and assigning
attribute data according to positive (1) and negative (0) feelings based on survey data, a clear
picture of user perceptions took shape. Not only were negative perceptions of space color-coded
for positive and negative feelings (blue and red, respectively), polygons were assigned varying
shades of the corresponding color based on the frequency of the perception among users. For
example, limited shopping options received the highest response rate among negative
perceptions totaling 9 responses. Therefore, this aspect fell into the top third of response
frequency, so polygons representing shopping options were coded in dark red. In contrast,
negative feelings about limited bicycle parking were much less frequent. Only one subject
identified this as a negative aspect, so it fell into the bottom one-third of responses and was
coded pink. Table 4 lists the various areas and aspects of the De Bonne neighborhood and how
they were color-coded based on frequency of responses for each aspect.
Based on the imagery provided by the ArcMap platform, the following results can be
deciphered. First, the surface area of positively perceived areas in the De Bonne neighborhood
totals approximately 0.1km2 while negatively perceived areas cover about half of that surface
with a total of about 0.05km2. Therefore, in terms of surface area, local users perceive only one-
third of the De Bonne neighborhood in a negative way. Negativity in the context of this research
!111
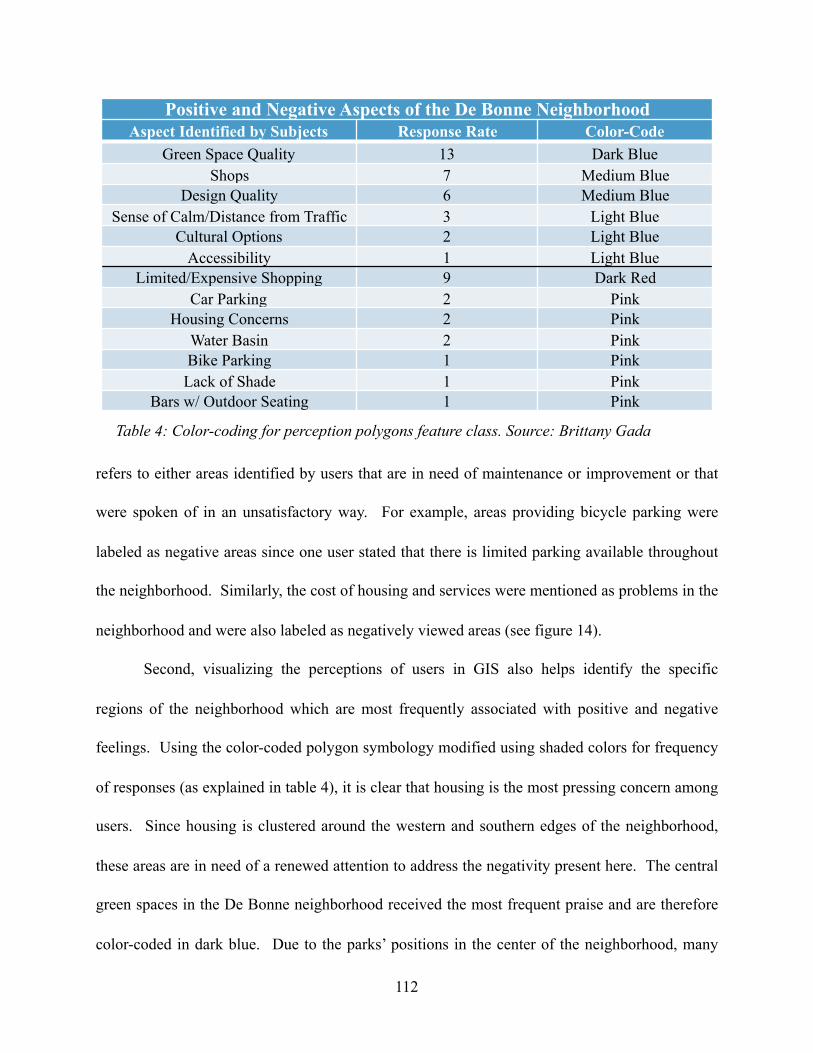
refers to either areas identified by users that are in need of maintenance or improvement or that
were spoken of in an unsatisfactory way. For example, areas providing bicycle parking were
labeled as negative areas since one user stated that there is limited parking available throughout
the neighborhood. Similarly, the cost of housing and services were mentioned as problems in the
neighborhood and were also labeled as negatively viewed areas (see figure 14).
Second, visualizing the perceptions of users in GIS also helps identify the specific
regions of the neighborhood which are most frequently associated with positive and negative
feelings. Using the color-coded polygon symbology modified using shaded colors for frequency
of responses (as explained in table 4), it is clear that housing is the most pressing concern among
users. Since housing is clustered around the western and southern edges of the neighborhood,
these areas are in need of a renewed attention to address the negativity present here. The central
green spaces in the De Bonne neighborhood received the most frequent praise and are therefore
color-coded in dark blue. Due to the parks’ positions in the center of the neighborhood, many
!112
Positive and Negative Aspects of the De Bonne NeighborhoodAspect Identified by Subjects Response Rate Color-Code
Green Space Quality 13 Dark BlueShops 7 Medium Blue
Design Quality 6 Medium BlueSense of Calm/Distance from Traffic 3 Light Blue
Cultural Options 2 Light BlueAccessibility 1 Light Blue
Limited/Expensive Shopping 9 Dark RedCar Parking 2 Pink
Housing Concerns 2 PinkWater Basin 2 PinkBike Parking 1 PinkLack of Shade 1 Pink
Bars w/ Outdoor Seating 1 Pink
Table 4: Color-coding for perception polygons feature class. Source: Brittany Gada
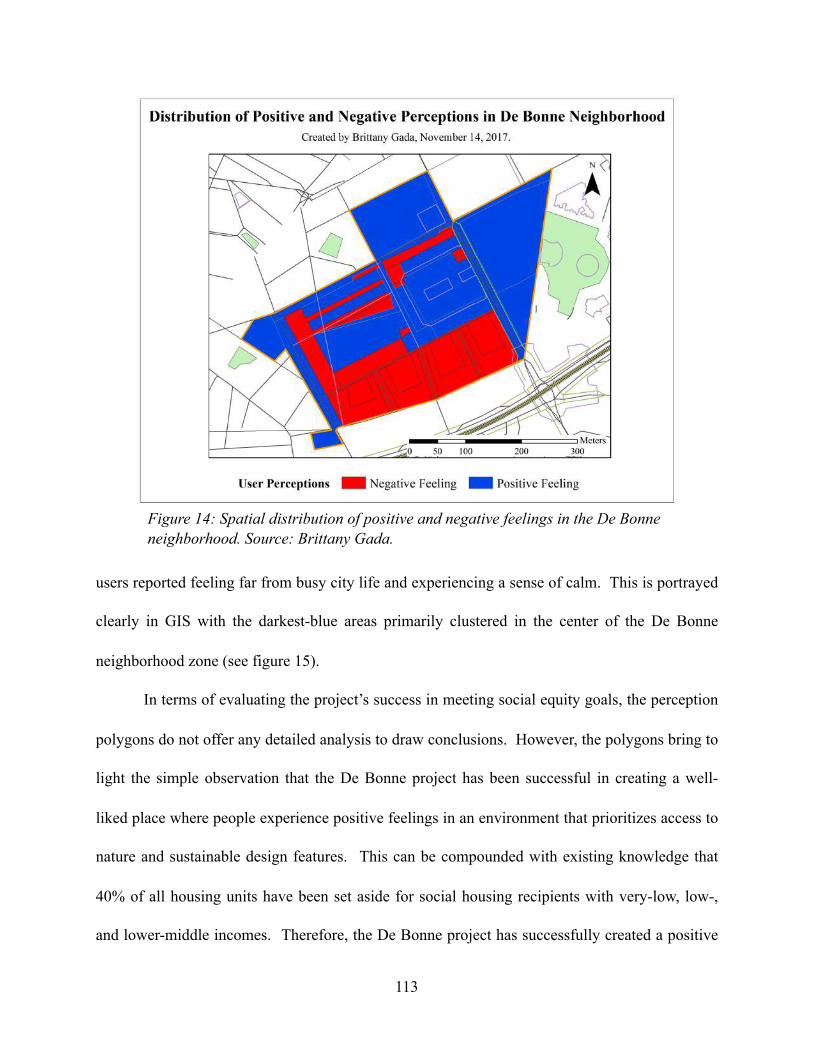
users reported feeling far from busy city life and experiencing a sense of calm. This is portrayed
clearly in GIS with the darkest-blue areas primarily clustered in the center of the De Bonne
neighborhood zone (see figure 15).
In terms of evaluating the project’s success in meeting social equity goals, the perception
polygons do not offer any detailed analysis to draw conclusions. However, the polygons bring to
light the simple observation that the De Bonne project has been successful in creating a well-
liked place where people experience positive feelings in an environment that prioritizes access to
nature and sustainable design features. This can be compounded with existing knowledge that
40% of all housing units have been set aside for social housing recipients with very-low, low-,
and lower-middle incomes. Therefore, the De Bonne project has successfully created a positive
!113
Figure 14: Spatial distribution of positive and negative feelings in the De Bonne neighborhood. Source: Brittany Gada.
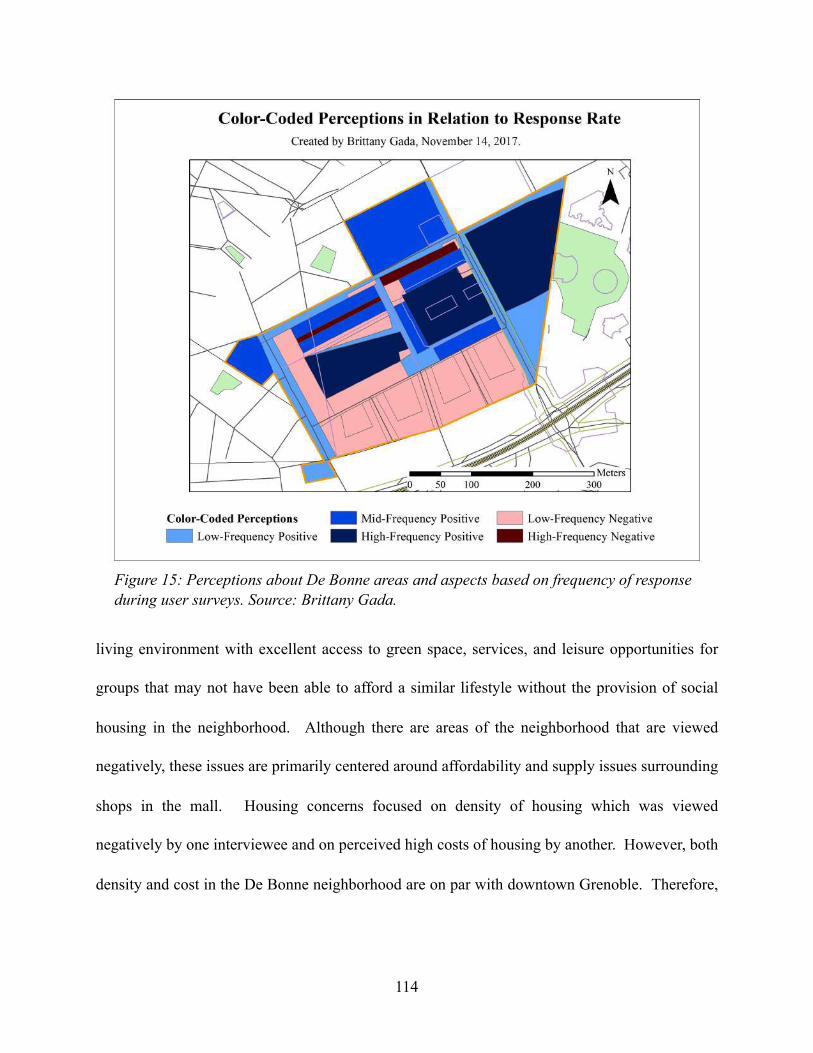
living environment with excellent access to green space, services, and leisure opportunities for
groups that may not have been able to afford a similar lifestyle without the provision of social
housing in the neighborhood. Although there are areas of the neighborhood that are viewed
negatively, these issues are primarily centered around affordability and supply issues surrounding
shops in the mall. Housing concerns focused on density of housing which was viewed
negatively by one interviewee and on perceived high costs of housing by another. However, both
density and cost in the De Bonne neighborhood are on par with downtown Grenoble. Therefore,
!114
Figure 15: Perceptions about De Bonne areas and aspects based on frequency of response during user surveys. Source: Brittany Gada.
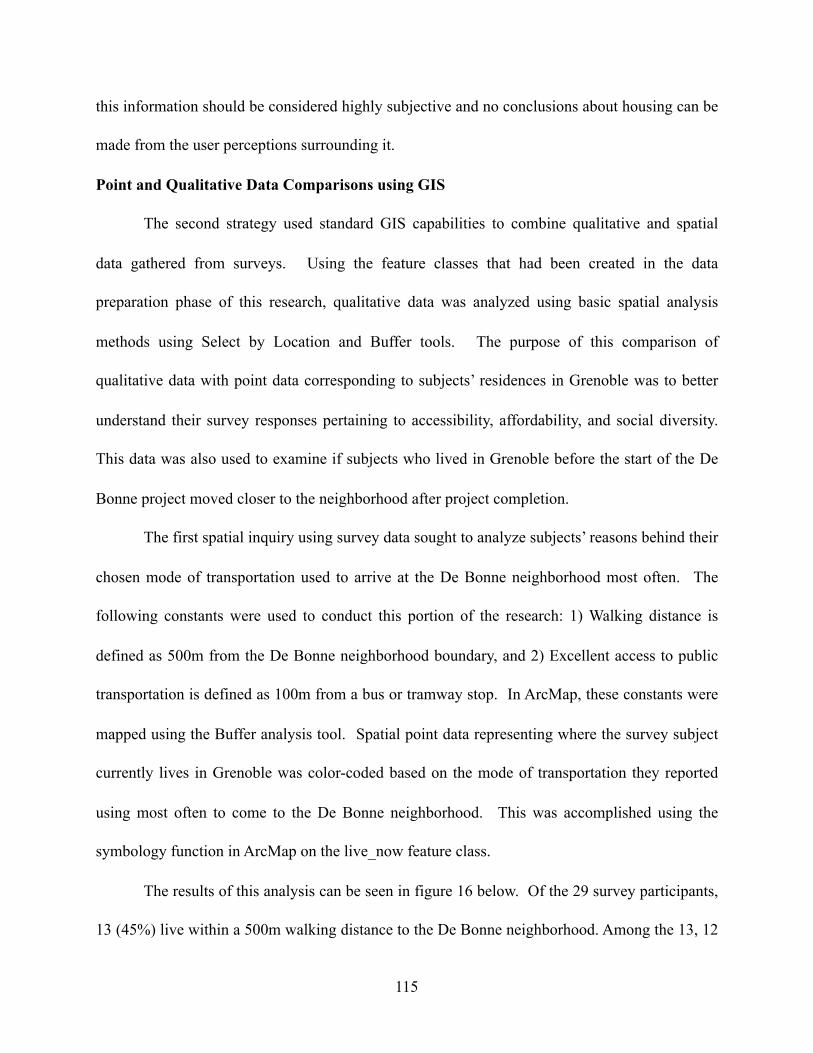
this information should be considered highly subjective and no conclusions about housing can be
made from the user perceptions surrounding it.
Point and Qualitative Data Comparisons using GIS
The second strategy used standard GIS capabilities to combine qualitative and spatial
data gathered from surveys. Using the feature classes that had been created in the data
preparation phase of this research, qualitative data was analyzed using basic spatial analysis
methods using Select by Location and Buffer tools. The purpose of this comparison of
qualitative data with point data corresponding to subjects’ residences in Grenoble was to better
understand their survey responses pertaining to accessibility, affordability, and social diversity.
This data was also used to examine if subjects who lived in Grenoble before the start of the De
Bonne project moved closer to the neighborhood after project completion.
The first spatial inquiry using survey data sought to analyze subjects’ reasons behind their
chosen mode of transportation used to arrive at the De Bonne neighborhood most often. The
following constants were used to conduct this portion of the research: 1) Walking distance is
defined as 500m from the De Bonne neighborhood boundary, and 2) Excellent access to public
transportation is defined as 100m from a bus or tramway stop. In ArcMap, these constants were
mapped using the Buffer analysis tool. Spatial point data representing where the survey subject
currently lives in Grenoble was color-coded based on the mode of transportation they reported
using most often to come to the De Bonne neighborhood. This was accomplished using the
symbology function in ArcMap on the live_now feature class.
The results of this analysis can be seen in figure 16 below. Of the 29 survey participants,
13 (45%) live within a 500m walking distance to the De Bonne neighborhood. Among the 13, 12
!115
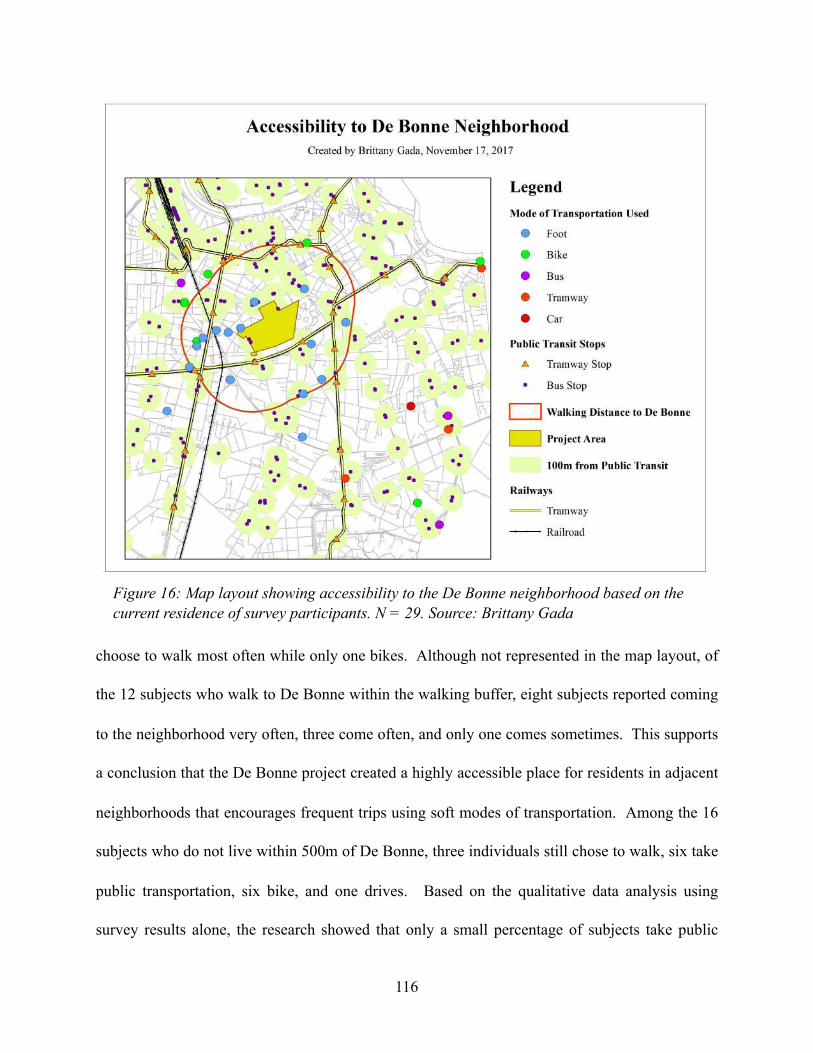
choose to walk most often while only one bikes. Although not represented in the map layout, of
the 12 subjects who walk to De Bonne within the walking buffer, eight subjects reported coming
to the neighborhood very often, three come often, and only one comes sometimes. This supports
a conclusion that the De Bonne project created a highly accessible place for residents in adjacent
neighborhoods that encourages frequent trips using soft modes of transportation. Among the 16
subjects who do not live within 500m of De Bonne, three individuals still chose to walk, six take
public transportation, six bike, and one drives. Based on the qualitative data analysis using
survey results alone, the research showed that only a small percentage of subjects take public
!116
Figure 16: Map layout showing accessibility to the De Bonne neighborhood based on the current residence of survey participants. N = 29. Source: Brittany Gada
transportation (about 20%) despite De Bonne’s excellent proximity to public transportation stops.
However, when viewed in GIS, it is clear that this low number can be attributed to the relatively
high percentage of participants who live within walking distance of the neighborhood.
Furthermore, four subjects who do not live within the 500m walking zone live within 50m of the
500m buffer where biking and walking are the preferred modes. Finally, among the nine subjects
who live within excellent access to public transportation and live outside of the walking distance
zone, four subjects still chose to walk or bike. This can be attributed to the excellent pedestrian
and bike lane connections that have been developed specifically to promote a preference of soft
modes of transportation over other modes. In this way, this spatial analysis proves that the De
Bonne project successfully created a highly-accessible neighborhood. This is supported by
strong agreement based on survey responses in addition to the number of subjects living within
proximity to public transportation stops.
The second way spatial data was used to evaluate the De Bonne project looked at where
subjects live now in comparison with where they lived before the De Bonne neighborhood was
completed. To perform this analysis, a new feature class was created from the live_now feature
class using the select by attributes tool. Using this tool, all subjects who lived in Grenoble
before project completion were selected. This selection was copied and exported to the data
frame as a new feature class. This process removed subjects who did not live in Grenoble before
project completion from the analysis because it is not relevant to the study if this group moved
closer to De Bonne. Next, a comparison was made between the previous and current residences
of the 13 subjects who lived in Grenoble before the De Bonne project began (see figure 17).
Among these 13, nine subjects (nearly 70%) moved closer (color green on map in figure 17) to
!117
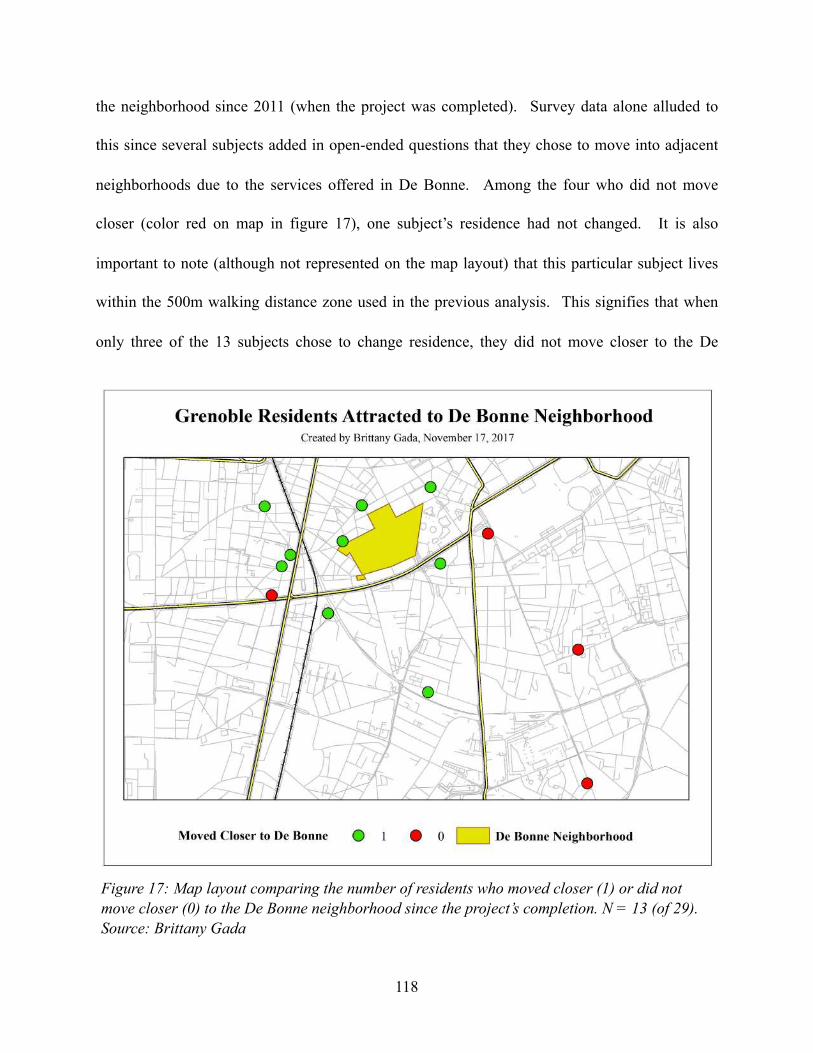
the neighborhood since 2011 (when the project was completed). Survey data alone alluded to
this since several subjects added in open-ended questions that they chose to move into adjacent
neighborhoods due to the services offered in De Bonne. Among the four who did not move
closer (color red on map in figure 17), one subject’s residence had not changed. It is also
important to note (although not represented on the map layout) that this particular subject lives
within the 500m walking distance zone used in the previous analysis. This signifies that when
only three of the 13 subjects chose to change residence, they did not move closer to the De
!118
Figure 17: Map layout comparing the number of residents who moved closer (1) or did not move closer (0) to the De Bonne neighborhood since the project’s completion. N = 13 (of 29). Source: Brittany Gada
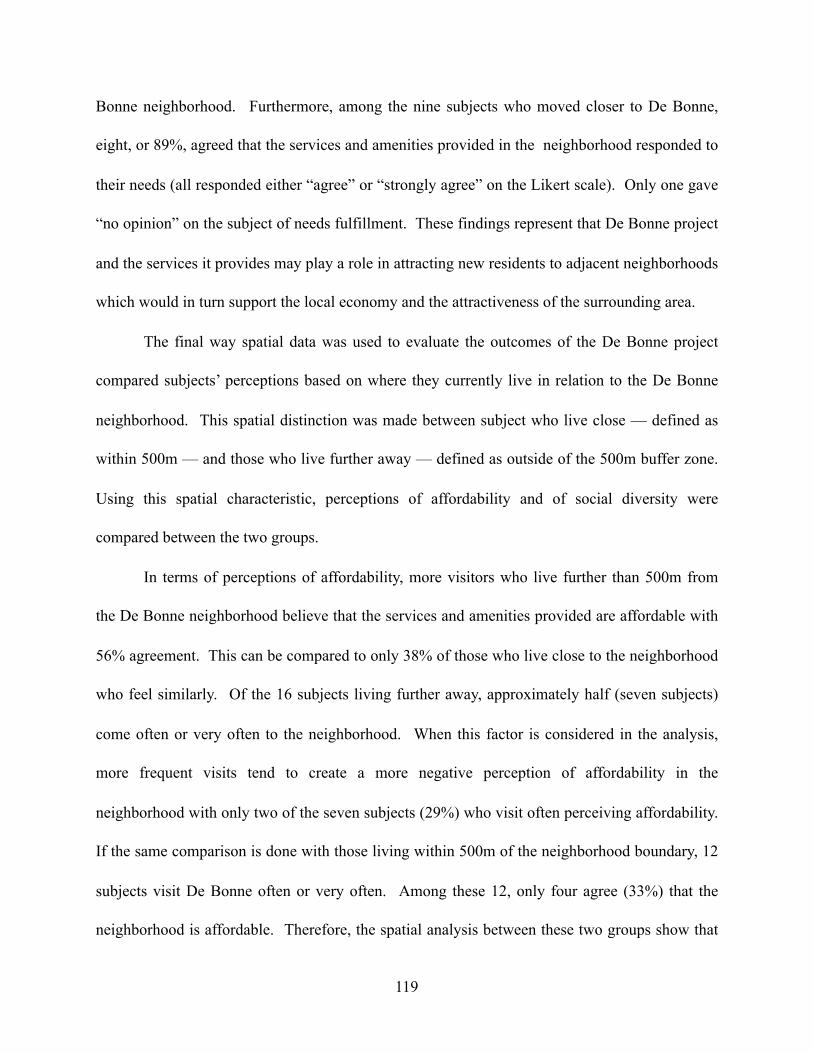
Bonne neighborhood. Furthermore, among the nine subjects who moved closer to De Bonne,
eight, or 89%, agreed that the services and amenities provided in the neighborhood responded to
their needs (all responded either “agree” or “strongly agree” on the Likert scale). Only one gave
“no opinion” on the subject of needs fulfillment. These findings represent that De Bonne project
and the services it provides may play a role in attracting new residents to adjacent neighborhoods
which would in turn support the local economy and the attractiveness of the surrounding area.
The final way spatial data was used to evaluate the outcomes of the De Bonne project
compared subjects’ perceptions based on where they currently live in relation to the De Bonne
neighborhood. This spatial distinction was made between subject who live close — defined as
within 500m — and those who live further away — defined as outside of the 500m buffer zone.
Using this spatial characteristic, perceptions of affordability and of social diversity were
compared between the two groups.
In terms of perceptions of affordability, more visitors who live further than 500m from
the De Bonne neighborhood believe that the services and amenities provided are affordable with
56% agreement. This can be compared to only 38% of those who live close to the neighborhood
who feel similarly. Of the 16 subjects living further away, approximately half (seven subjects)
come often or very often to the neighborhood. When this factor is considered in the analysis,
more frequent visits tend to create a more negative perception of affordability in the
neighborhood with only two of the seven subjects (29%) who visit often perceiving affordability.
If the same comparison is done with those living within 500m of the neighborhood boundary, 12
subjects visit De Bonne often or very often. Among these 12, only four agree (33%) that the
neighborhood is affordable. Therefore, the spatial analysis between these two groups show that
!119
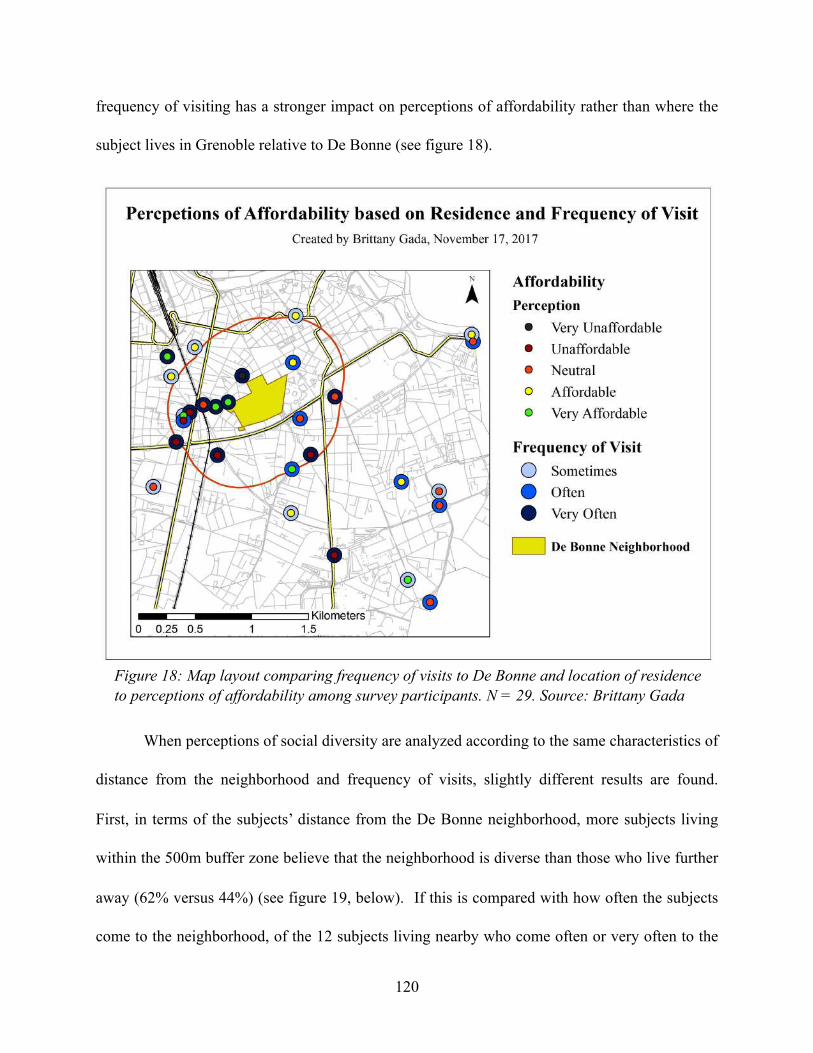
frequency of visiting has a stronger impact on perceptions of affordability rather than where the
subject lives in Grenoble relative to De Bonne (see figure 18).
When perceptions of social diversity are analyzed according to the same characteristics of
distance from the neighborhood and frequency of visits, slightly different results are found.
First, in terms of the subjects’ distance from the De Bonne neighborhood, more subjects living
within the 500m buffer zone believe that the neighborhood is diverse than those who live further
away (62% versus 44%) (see figure 19, below). If this is compared with how often the subjects
come to the neighborhood, of the 12 subjects living nearby who come often or very often to the
!120
Figure 18: Map layout comparing frequency of visits to De Bonne and location of residence to perceptions of affordability among survey participants. N = 29. Source: Brittany Gada
neighborhood, seven (58%) agree that the neighborhood is socially diverse. Among the seven
subjects who live further away from the neighborhood and report coming often (or vey often),
only three (43%) think De Bonne is socially diverse. Therefore, those subjects living closer to
the De Bonne neighborhood are more likely to think it is a socially diverse place. Furthermore,
it was more likely that subjects living nearby who come often will think the neighborhood is
socially diverse. The same comparison does not hold true for subjects living further away who
are actually less likely to agree that the neighborhood is socially diverse if they come more often.
Based on these results, it is impossible to conclude why subjects living further away from the De
!121
Figure 19: Map layout comparing perceptions of social diversity to location of residence and frequency of visiting. N = 29. Source: Brittany Gada
Bonne neighborhood tend to think that the project did not create a socially diverse place.
Despite the reasoning behind their responses during user surveys, the lack of consensus on this
topic among all users shows that visitors to the neighborhood are not convinced that social
diversity exists. This signifies that more may need to be done to ensure social diversity of both
visitors and residents of De Bonne.
Story Map Tour
The final method used to incorporate qualitative data into GIS was ESRI’s Story Map
Tour. Using the template provided on ESRI’s ArcOnline platform, images taken on location
were imported into the online program from the photo-sharing website, Flickr, which is
supported by the Story Maps software. After importing the images, spatial markers were moved
to correspond with their accurate location in the neighborhood. Next, images were matched
with comments and research results pertaining to the subject addressed by the image. Using this
qualitative information, all images were given appropriate captions to describe the research
findings. Finally, spatial markers were also assigned a color based on the topic addressed by the
image. The possible categories were: 1) design highlights in purple, 2) sustainable design
features in green, 3) positively-viewed areas in blue, and 4) negatively-viewed areas in red (see
figure 20).
In comparison with the perception polygons created in ArcMap, the Story Map Tour
allowed for a more visually-pleasing representation of the qualitative data collected through
surveys and photographs. Due to the program’s flexibility with narrative and image data, Story
Maps yield similar results to the perception polygons method but allow the map builder to add
more detailed information about each location and the perceptions associated with it. Although
!122
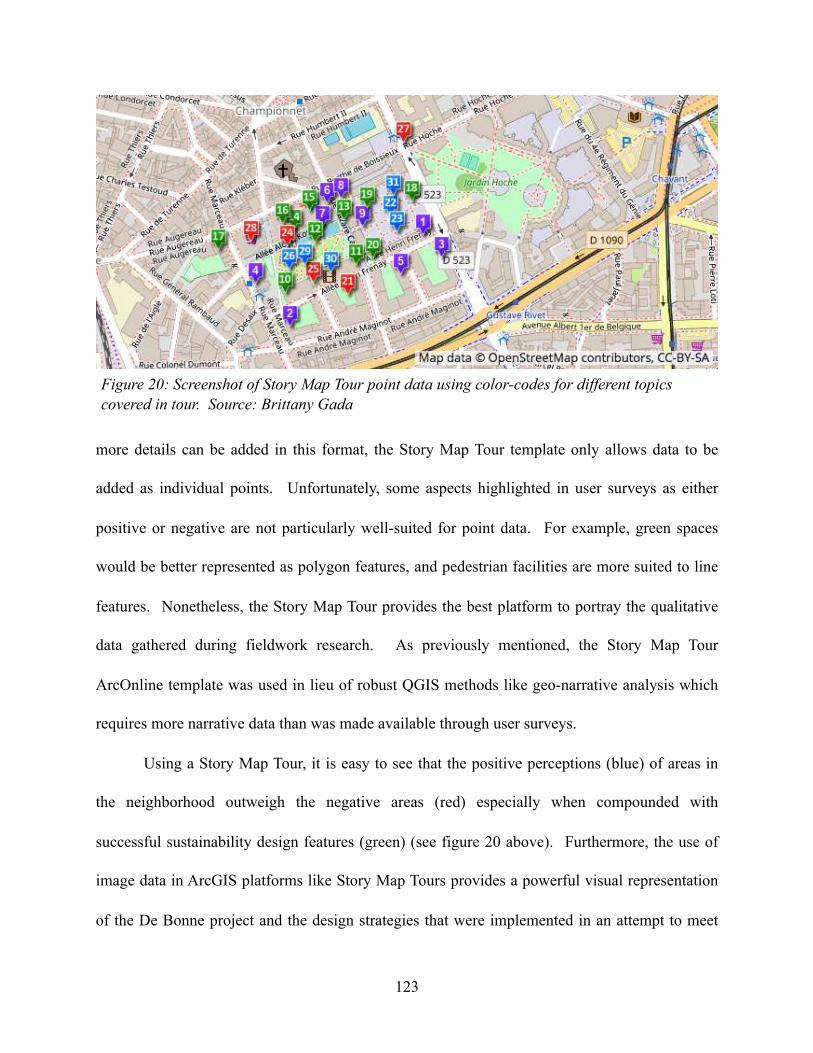
more details can be added in this format, the Story Map Tour template only allows data to be
added as individual points. Unfortunately, some aspects highlighted in user surveys as either
positive or negative are not particularly well-suited for point data. For example, green spaces
would be better represented as polygon features, and pedestrian facilities are more suited to line
features. Nonetheless, the Story Map Tour provides the best platform to portray the qualitative
data gathered during fieldwork research. As previously mentioned, the Story Map Tour
ArcOnline template was used in lieu of robust QGIS methods like geo-narrative analysis which
requires more narrative data than was made available through user surveys.
Using a Story Map Tour, it is easy to see that the positive perceptions (blue) of areas in
the neighborhood outweigh the negative areas (red) especially when compounded with
successful sustainability design features (green) (see figure 20 above). Furthermore, the use of
image data in ArcGIS platforms like Story Map Tours provides a powerful visual representation
of the De Bonne project and the design strategies that were implemented in an attempt to meet
!123
Figure 20: Screenshot of Story Map Tour point data using color-codes for different topics covered in tour. Source: Brittany Gada
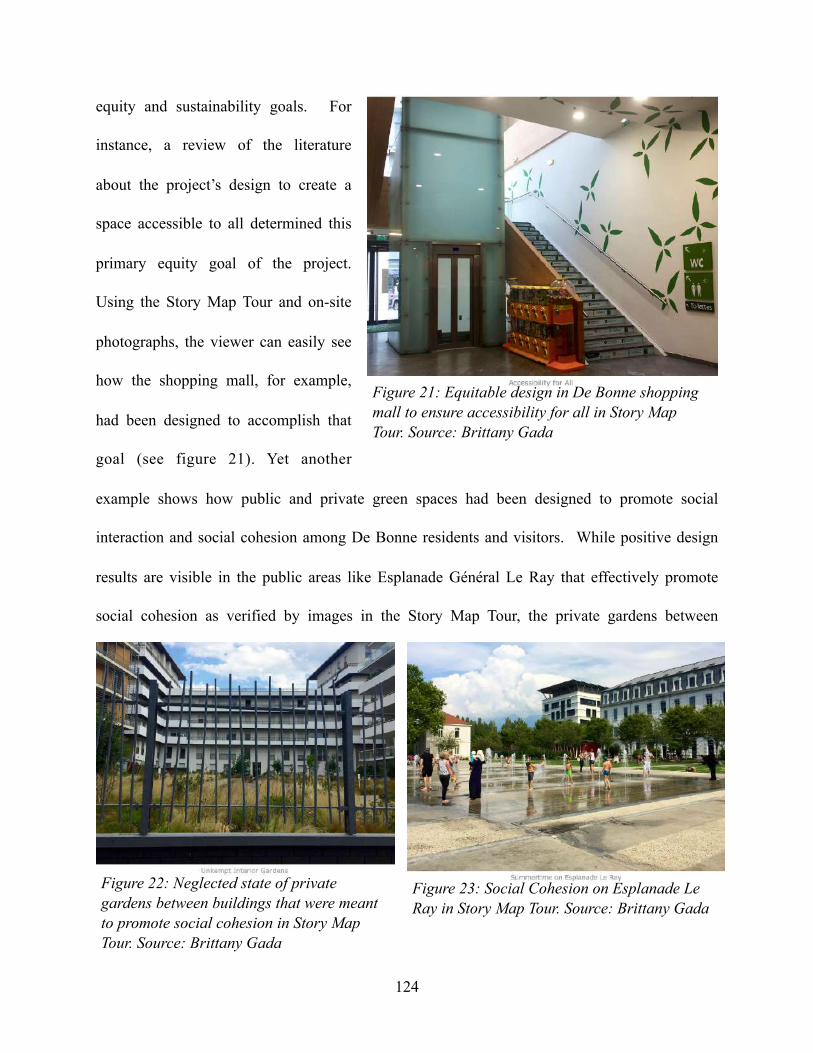
equity and sustainability goals. For
instance, a review of the literature
about the project’s design to create a
space accessible to all determined this
primary equity goal of the project.
Using the Story Map Tour and on-site
photographs, the viewer can easily see
how the shopping mall, for example,
had been designed to accomplish that
goal (see figure 21). Yet another
example shows how public and private green spaces had been designed to promote social
interaction and social cohesion among De Bonne residents and visitors. While positive design
results are visible in the public areas like Esplanade Général Le Ray that effectively promote
social cohesion as verified by images in the Story Map Tour, the private gardens between
!124
Figure 23: Social Cohesion on Esplanade Le Ray in Story Map Tour. Source: Brittany Gada
Figure 22: Neglected state of private gardens between buildings that were meant to promote social cohesion in Story Map Tour. Source: Brittany Gada
Figure 21: Equitable design in De Bonne shopping mall to ensure accessibility for all in Story Map Tour. Source: Brittany Gada
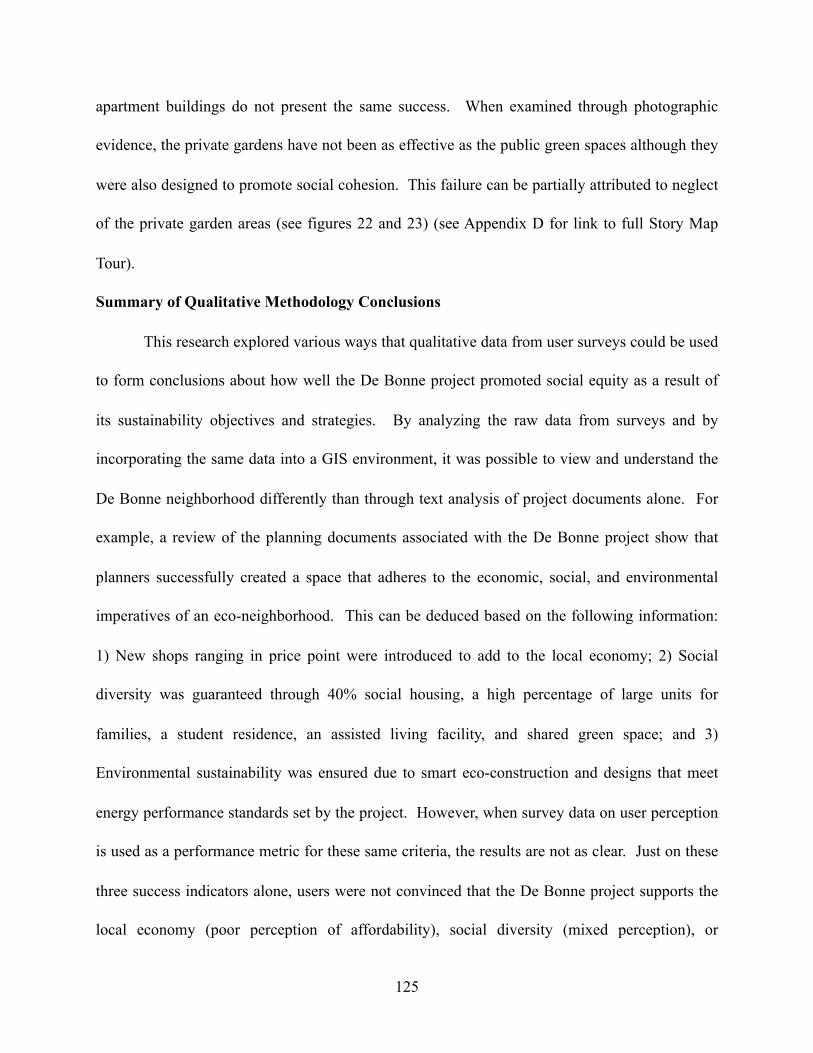
apartment buildings do not present the same success. When examined through photographic
evidence, the private gardens have not been as effective as the public green spaces although they
were also designed to promote social cohesion. This failure can be partially attributed to neglect
of the private garden areas (see figures 22 and 23) (see Appendix D for link to full Story Map
Tour).
Summary of Qualitative Methodology Conclusions
This research explored various ways that qualitative data from user surveys could be used
to form conclusions about how well the De Bonne project promoted social equity as a result of
its sustainability objectives and strategies. By analyzing the raw data from surveys and by
incorporating the same data into a GIS environment, it was possible to view and understand the
De Bonne neighborhood differently than through text analysis of project documents alone. For
example, a review of the planning documents associated with the De Bonne project show that
planners successfully created a space that adheres to the economic, social, and environmental
imperatives of an eco-neighborhood. This can be deduced based on the following information:
1) New shops ranging in price point were introduced to add to the local economy; 2) Social
diversity was guaranteed through 40% social housing, a high percentage of large units for
families, a student residence, an assisted living facility, and shared green space; and 3)
Environmental sustainability was ensured due to smart eco-construction and designs that meet
energy performance standards set by the project. However, when survey data on user perception
is used as a performance metric for these same criteria, the results are not as clear. Just on these
three success indicators alone, users were not convinced that the De Bonne project supports the
local economy (poor perception of affordability), social diversity (mixed perception), or
!125
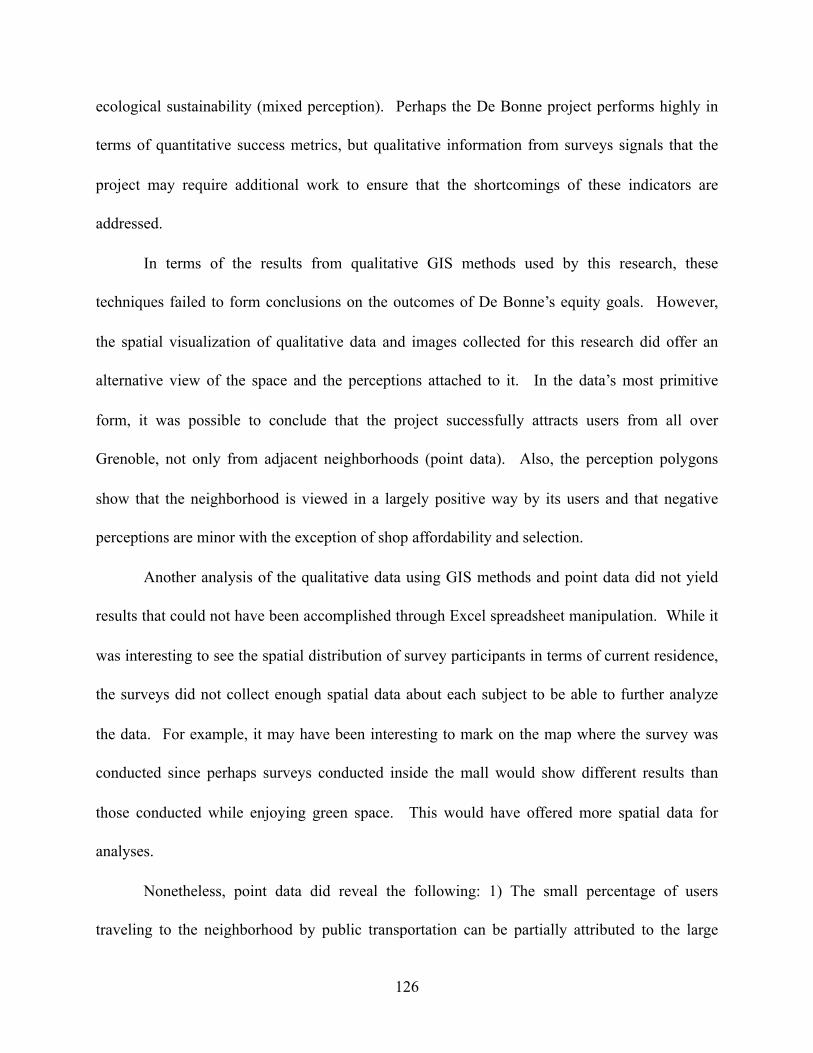
ecological sustainability (mixed perception). Perhaps the De Bonne project performs highly in
terms of quantitative success metrics, but qualitative information from surveys signals that the
project may require additional work to ensure that the shortcomings of these indicators are
addressed.
In terms of the results from qualitative GIS methods used by this research, these
techniques failed to form conclusions on the outcomes of De Bonne’s equity goals. However,
the spatial visualization of qualitative data and images collected for this research did offer an
alternative view of the space and the perceptions attached to it. In the data’s most primitive
form, it was possible to conclude that the project successfully attracts users from all over
Grenoble, not only from adjacent neighborhoods (point data). Also, the perception polygons
show that the neighborhood is viewed in a largely positive way by its users and that negative
perceptions are minor with the exception of shop affordability and selection.
Another analysis of the qualitative data using GIS methods and point data did not yield
results that could not have been accomplished through Excel spreadsheet manipulation. While it
was interesting to see the spatial distribution of survey participants in terms of current residence,
the surveys did not collect enough spatial data about each subject to be able to further analyze
the data. For example, it may have been interesting to mark on the map where the survey was
conducted since perhaps surveys conducted inside the mall would show different results than
those conducted while enjoying green space. This would have offered more spatial data for
analyses.
Nonetheless, point data did reveal the following: 1) The small percentage of users
traveling to the neighborhood by public transportation can be partially attributed to the large
!126
percentage of participants who live within 500m of the De Bonne neighborhood. The percentage
of public transportation users was also decreased due to another portion of subjects choosing
active modes over shared modes of transportation despite their excellent access to public transit
stops. Therefore, although only 20% of subjects typically take public transportation to come to
De Bonne, the spatial analysis using point data proved that the project successfully created a
highly accessible neighborhood that effectively facilitates and prioritizes active modes of
transportation; 2) Among subjects who lived in Grenoble before the De Bonne project, nearly
70% have moved closer to the De Bonne neighborhood since the project’s completion. This
finding was supported by user comments during surveys noting that they moved closer
specifically because of De Bonne’s services and amenities. Furthermore, 89% of the subjects
who moved closer agree that the services and amenities brought into the De Bonne neighborhood
responded to their needs as Grenoble residents; 3) Finally, visitors who lived further away from
De Bonne, regardless of how often they visited, tend to perceive that social diversity does not
exist in the neighborhood with 66% responding negatively to the Likert scale statement. Among
visitors who live closer, perceptions of social diversity were more likely with approximately two-
thirds of subjects finding that the neighborhood is socially diverse. This research does not
attempt to make assumptions to explain why these perceptions differ between the two groups
(based on the distance of their residence from De Bonne, but it was possible to identify these two
trends by comparing spatial data and qualitative Likert scale data from surveys in GIS.
Further analysis using the Story Map Tour shows that although design features of the
space are viewed positively, the neighborhood presents several upkeep issues that are viewed
negatively and require attention (such as cleanliness of the water basin, the maintenance of
!127
private gardens, and graffiti). This problem, while not directly related to social equity objectives,
alters user perceptions of the space and would not have been identified through text analysis
alone. Another quality of the neighborhood that was mentioned during user surveys that was
more appropriately represented using the Story Tour was the sense of calm users experience
when enjoying De Bonne’s green spaces. This was not a stated objective of the project
designers, but a qualitative exploration of the neighborhood yielded a strong sentiment
surrounding calmness and a separation from the busy city.
Therefore, although the qualitative GIS methods used by the project offered an alternative
format to view and analyze interview data, the user survey and methods could have been
adjusted to yield more meaningful results. While the user survey alone was relatively effective
in understanding how visitors to De Bonne view the project based on key social equity and
sustainability indicators, methods incorporating GIS were not as successful. Potential revisions
to this research design, especially in reference to GIS methods, are discussed in the following
section to highlight strategies that would have added to the depth and efficacy of this case study
exploration and analysis.
Chapter 6: Discussion
To synthesize the findings of this research surrounding the five research questions, the
subsequent discussion will address the following topics. First, final conclusions about the
effectiveness of the qualitative methods used to evaluate equity outcomes used by the case study
research are explored. Next, research challenges and potential areas of improvement are
identified. Potential extensions of this research and future opportunities are also highlighted.
!128
Then, an assessment of the implications of using qualitative data and QGIS applications in U.S.
equity planning and project evaluation is offered. In conclusion, final thoughts about equity
planning in France as well as the importance of qualitative data in planning are discussed.
1. Effectiveness of Using Qualitative Data to Evaluate De Bonne’s Equity Performance
In response to the fourth research question addressing the possibility of using qualitative
data to assess equity outcomes of the De Bonne project, this research concludes that is indeed
possible. Using quantifiable, qualitative survey data, images, observations, and quotations from
surveys, perception polygons, a Story Map Tour, and point data were created. Organizing the
data in this way made it possible to highlight some successes and shortcomings of the De Bonne
project in meeting social equity and sustainability goals. For example, survey data showed that
affordability was a primary concern of De Bonne visitors. Although cost is subjective to the
individual user, this alludes to poor performance in equitably providing goods and services in the
neighborhood to all at a reasonable cost. In contrast, the accessibility indicator combined with
the percentage of social housing in the neighborhood signifies that the high-quality services and
public space provided by De Bonne has been made easily accessible to all groups regardless of
social status or current residence in Grenoble.
However, based on the specific methods used, the effectiveness of this methodology was
put into question. Due to the time constraints of this project, not enough qualitative data were
collected through user surveys to establish definitive results. While the quality of the qualitative
data was adequate for the planned data analysis methods, the quantity of the data was not
sufficient. If the time available for fieldwork permitted more user surveys, a more appropriate
!129
goal would have been 100 user interviews as opposed to 30 in order to yield more conclusive
results. Additionally, the survey failed to involve De Bonne residents who were the primary
concern of the equity goals established by the project surrounding social housing, accessibility,
affordability, and sustainability. This group would have added valuable perception data to this
assessment due to their continuous presence in the neighborhood and familiarity with its
services. Without participation from residents, a qualitative evaluation of the project’s equity
outcomes is incomplete. Furthermore, resident participation would have been a key component
of a true design adhering to an advocacy framework, especially if social housing residents were
implicated in the case study research. Unfortunately, resident participation was not prioritized by
this research. As a result, the research was unable to establish conclusions using survey data
from users alone. Therefore, this research concludes that it was indeed possible to use qualitative
data to evaluate the De Bonne project’s performance in meeting equity goals, but this goal was
not accomplished due to insufficient interviews and the lack of participation by residents.
2. Research Challenges and Opportunities for Improvement
The conclusions of this research were hindered by several factors and could have been
improved with a few select strategies. First, research results were limited by the lack of
participation of professional actors involved in the De Bonne project. The case study portion of
this research originally targeted both users (visitors and residents) of the neighborhood and
professional actors of the De Bonne project in separate surveys. For professional actors, surveys
attempted to gauge how this group incorporated equity ideals into the project design and if they
believed that equity goals were attained by the completed De Bonne project. Unfortunately,
!130
none of the professional actors contacted replied to survey inquiries. As a result, the research
design was modified to adapt to the lack of data from this group by incorporating a review of the
literature available on the project. While I was still able to conduct the case study research
without this additional qualitative survey data, the case study conclusions would have benefited
from a larger data pool as well as from data from a professional source.
Next, a longer timeframe to conduct research would have been beneficial to the case
study project. Not only would it have allowed the research more time to increase the number of
interviews, it would have also been ideal to vary the season during which research was
conducted. This fieldwork research for the case study was carried out in the summer. On the
one hand, this was strategic since the De Bonne neighborhood sees the highest rates of use in the
summer. On the other hand, it may have been interesting to compare survey results between
different seasons since users would certainly be less likely to enjoy outdoor green space on cold
winter days and may respond differently to some survey questions such as primary use and
perception questions. This research also attempted to conduct interviews at different times of the
day in conjunction with the shopping mall’s opening hours from 10am to 8pm. This approach
was relatively successful and resulted in an even distribution of interviews between noon and
7pm. However, more time for fieldwork research would have also added to the number of
interviews conducted at various times of the day.
In reference to the number of interviews, this also limited the case study research
conclusions. Although the research targeted 30 user surveys in the research design, once data
was transcribed and analyzed, it became clear that the case study would have benefited from
greater data volume. If I had been able to conduct triple the number of surveys (between 90 and
!131
100), this would have greatly enriched the conclusions of the research. If the timeframe for this
research could have been extended, the research design would have also been modified to
increase the length of the interviews themselves to produce a higher-volume and higher-quality
of qualitative data from individual surveys.
Finally, several opportunities for improvement were identified. Improvements involve
both modifications to the research conducted as well as potential extensions of this research to
increase the effectiveness and richness of the results. First, the qualitative methodology used by
this research could have been improved to increase effectiveness by reducing the structure of the
user survey. This would have allowed for more candid commentary about the topics addressed
in the interviews. This particular technique was not well-suited to the timeframe of this research,
so this approach was not included in the research design. However, this thesis work could easily
be expanded upon in the future using a more flexible survey structure to solicit more qualitative
data quantity (through more interviews) as well as better data quality (with a more flexible data
collection structure).
Another opportunity for future research would be to conduct a true geo-narrative analysis
to evaluate the success of the De Bonne project in meeting equity goals. Geo-narrative analysis,
as pioneered by Kwan and Ding (2008), is particularly suited to this research since it identifies
spatial data within participants’ commentary about the causes and effects of events, perceptions
of space and life experiences, and other qualitative information. This approach would require a
large pool of De Bonne residents engaging in data collection to yield more narrative data about
residents’ perceptions of the project’s performance. In order to accomplish this, the research
timeline would first have to be extended. Next, data collection would require organizing several
!132
focus groups, walking tours, and lengthy one-on-one interviews with residents to gather enough
narrative information. This would in turn require the development of a relationship with the City
of Grenoble and the community organizations present in the neighborhood to facilitate the events
necessary to collect all of the qualitative data. Finally, adding a sketch map component with
resident participants would also be an effective way of expanding the positive and negative
perceptions of space portion of this research. Sketch maps could be integrated into GIS using the
methods used by Jung and Elwood in their CAQ-GIS (integration of CAQDAS and GIS) in
which sketch maps were assigned geographic coordinates and clipped to the size of raster grid
cells to be imported into an ArcMap document (2010). Once integrated into GIS using this
method, sketch maps could be incorporated into the geo-narrative analysis to enrich results.
3. Implications of Qualitative Methods and QGIS for U.S. Equity Planning
Based on the findings of the case study research, this research concludes that qualitative
data are valuable to urban planning project evaluation, especially when evaluating equity
outcomes. While this research did not yield definitive results about the De Bonne project,
extensions of this study would have added to the research findings with additional qualitative
data collection. The use of qualitative methods is particularly suited for applications in a French
urban planning context considering the lack of relevant socio-economic data available at the
neighborhood level. Therefore, equity project evaluation must incorporate other variables that
offer insight into whether a specific project created a more equitable situation in a community.
While France tends to accomplish these analyses using indirectly related data (level of education,
unemployment rate, and since 2004, household income), qualitative data on community
!133
perceptions of increased or decreased equity following a planning action may provide more
concrete information in comparison with other variables.
If the De Bonne project is taken as an example, the following scenario may occur. The
De Bonne project was designed to make an eco-neighborhood lifestyle both physically and
financially accessible for all to create a socially diverse community. If this project’s success is
evaluated using unemployment, level of education, and income data at the IRIS scale, it is
difficult to deduce if social equity goals have been accomplished. This problem can primarily be
attributed to three issues. First, the French IRIS scale — the finest scale available — is much
larger than the De Bonne neighborhood. De Bonne would be grouped into the more affluent
Championnet IRIS which would not be an accurate representation of the demographic
composition of the De Bonne neighborhood alone. Second, the nature of the project itself would
skew quantitative data because it constructed a large number of new housing units on a defunct,
uninhabited site. This drastically transformed the spatial and demographic composition of the
neighborhood. Even if a finer level of analysis were possible beyond the IRIS using this data, a
quantitative analysis of the De Bonne neighborhood would yield inconclusive results since no
one lived there before the project. It is possible to use the Championnet IRIS data that is
available in lieu of nonexistent De Bonne data. However, a comparison of Championnet data is
irrelevant to the De Bonne project since the IRIS boundary extends far past the scope of the De
Bonne project. Third, the lack of data on race and ethnicity in France continues to pose a serious
problem for equity planners who are forced to evaluate social diversity based on household
income and family composition alone.
!134
Considering the challenges of evaluating this example using only quantitative data, the
logic for incorporating qualitative data into equity planning project evaluation becomes clear. In
order to evaluate the specific outcomes of an equity project, it is necessary to gather information
about the specific groups affected by the project. In some cases, evaluation may be possible
using the quantitative data available in France, especially when data can be used on a larger
scale. Other times, a project touched the lives of a specific group of people, as is true in the case
of De Bonne. Data on this group is most relevant to the project. Although it would be possible
to simply construct a resident survey asking questions about race, income, and access (if
permission was granted by the French government to ask sensitive questions about race as
dictated by French law), qualitative data would be key to fully understand if the De Bonne
project truly responded to the material and social needs of residents.
When the use of qualitative data in a U.S. equity planning context is considered, the
implications of applying qualitative methods are slightly different. First, the primary difference
between French and American planning contexts remains that the U.S. has much more
sophisticated data that is useful when planning and evaluating equity projects. Typically, this
data is available at a fine enough scale for the vast majority of planning concerns. It is for this
reason that the majority of equity planning assessments and methods prioritize the use of
quantitative data. It is publicly available and relatively easy and inexpensive to work with.
Qualitative data, on the other hand, requires time, event planning, and money for staff, supplies,
and outreach. As a result, qualitative data is primarily used as a component of project planning,
rather than project evaluation.
!135
In spite of the logistical and financial challenges, this research concludes that it is most
effective to combine qualitative data collection with traditional quantitative methods when
evaluating equity planning projects in the U.S.. This argument is upheld by the following
principles. First, the advocacy planning framework requires the consideration of race in all
equity planning activities. Davidoff stressed this throughout his writings about the discipline
(Advocacy and Pluralism in Planning, 1965; Working Towards Redistributive Justice, 1975). He
insists that the historical and social contexts of prejudice in the U.S. surrounding race
necessitates the use of race as a key indicator within the Advocacy Planning framework
(Davidoff, 1975). In this way, data on race is a crucial variable for planners who are specifically
seeking to redistribute opportunities and services to underrepresented groups as the Advocacy
Planning framework instructs. Furthermore, the definition of social equity adopted by this
research also supports the incorporation of data on race and income into post-project analysis. It
insists that equity planning projects create a scenario in which even access to opportunities and
services exists across income and cultural groups (Litman, 2014). Considering this definition
and the influence of the Advocacy Planning framework, it is necessary to include quantitative,
socio-economic data that informs conditions of access of diverse groups in response to equity
planning actions.
Unfortunately, quantitative analyses leave out necessary data pertaining to people’s
perceptions about how a project improved (or did not improve) their personal experience of
social equity. Although social equity is clearly informed by its quantitative underpinnings
referencing race and income data, social equity is also about personal interpretations of an
individual’s lived experiences. Lived experiences and an individual’s interpretation of them are
!136
crucial to better understand how a person and how a community as a whole feels about their
access to opportunities and services. For example, perhaps a quantitative evaluation of equitable
access to public transportation services determines that a particular neighborhood has adequate
access because no household is more than a quarter-mile from a bus stop. A qualitative
evaluation of the same issue in the same neighborhood may find that many residents perceive
that they have poor access for a variety of reasons pertaining to personal or environmental
factors. Similarly, an equity planning project may focus on business development in a
neighborhood to improve access to employment opportunities. Perhaps this project is deemed
successful since average household incomes in the neighborhood increased and unemployment
decreased in the years following the project. However, qualitative data may elucidate that other
factors have damaged residents’ ability to increase disposable incomes despite job creation in the
area. These are simple examples to illustrate that planners should not assume that statistics and
spatial information should represent the entirety of the lived experiences of a community. For
this, a combination of quantitative and qualitative methods must be used.
There has been much debate regarding the effectiveness of quantitative and qualitative
methodologies in social science research. Arguments dating back to Durkheim’s study in 1951
on rates of suicide in European countries stress that qualitative data only offers limited
contributions to knowledge about society since it only deals with “‘micro’ social
settings” (Travers, 2001: 7). Durkheim refers to qualitative data as common-sense knowledge
that should be ignored in the social sciences (Travers, 2001). While some researchers choose to
focus on macro approaches using quantitative data as a result of this critique, others stress the
importance of human interpretations of the world in social science research. An early supporter
!137
of qualitative methods was Max Weber who implemented such methods in his famous study, The
Protestant Ethic, in 1958 (Travers, 2001). Weber argued that since humans have free will, the
ability to think, and experience emotion, it is impossible to understand society without studying
these aspects of the natural world at the human scale (Travers, 2001).
Today, both quantitative and qualitative methods are both widely used with many
researchers implementing mixed-methods approaches. Conducting evaluations of planning
actions that target social inequities is a prime scenario for the integration of both methods. Not
only do quantitative methods using statistics and GIS functions provide an analysis at a macro
scale to identify large trends and demographic characteristics of groups, qualitative methods are
key in understanding how residents think about and experience the outcomes of a project every
day. In the case of the De Bonne project, an ideal analysis would have first used quantitative
methods to track changes in race and household income composition of the neighborhood after
project completion as is traditionally done in the U.S. (if that data had been available). The
analysis would have then expanded upon the qualitative interview methods that were used in this
case study research to gauge how residents feel the project met their needs and offered them
greater access to social and economic opportunity and a better quality of life overall.
Therefore, when assessing social equity in neighborhoods as a component of post-project
evaluation as was examined with the De Bonne case study, this research concludes that it is a
best practice to use both quantitative and qualitative methodologies when data is available. For
U.S. planners, the combination of these methods would be particularly powerful. Planners
should strive to supplement the quantitative, socio-economic data that is traditionally used in
U.S. equity planning with narrative, qualitative data collected through more robust citizen
!138
engagement strategies for the most effective post-project evaluation methodology. Instead of
concentrating participation in the design phase of planning, participation should also be
incorporated into evaluation phases to gauge success through resident perception and lived
experience in response to the project. If a planner in the U.S. strives to truly understand how to
adapt physical space in order to meet both physical and emotional needs of his or her
constituents while promoting equitable outcomes, a blend of quantitative and qualitative research
methods must be employed. The effectiveness of this mixed-methods approach can be further
improved by applying QGIS techniques to quantitative and qualitative data analysis to find
relationships between the spatial and narrative realities resulting from an equity planning project.
Thus, equity planning moves beyond the pursuit of locational equity and towards a nuanced
understanding of how a project affected the inequities faced by underrepresented, diverse groups
to concretely improve quality of life on a daily basis.
4. Concluding Thoughts: Identifying Lessons from French Equity Planning
The primary goal of this research was to examine how equity planning in France differs
from the same professional pursuit in the United States. By identifying common definitions and
strategies used in the two countries to promote equity and by exploring a case study in France,
this research made several revelations on that topic. By searching for representations of equity in
urban planning that sought to promote even access to services and opportunity across income and
cultural groups, it became clear that French and American ideas about equity differ significantly.
Not only do the strategies used to promote equity in planning practice and policy differ greatly
between the two countries, the general understanding of what identifies an inequitable situation
!139
is also different. Specifically, U.S. equity planners adhere to the principles set forth by Paul
Davidoff's advocacy planning framework which insist that racial characteristics of disadvantaged
communities be taken into account when attempting to address inequities. Therefore, not only
are inequities formally defined according to racial data, all equity project planning, equity
analysis, and project evaluation are conducted through a racial lens. In comparison with France,
data on race or ethnicity is not available to equity planners. Therefore, it is not incorporated into
definitions of equity in this country, nor is it used to plan equity projects. Falling outside of the
advocacy planning framework, French planners seeking to reduce inequities focus instead on
income data and other variables such as unemployment or youth populations.
The strategies used to combat inequities are also drastically different due to France's
political structure. Namely, the French government identifies geographic areas suffering from
inequities by national decree (the QPV’s). This decree formally engages local planners and
residents in each QPV in a national program designed to address social, economic, and
environmental inequities. Although U.S. equity planners benefit from flexibility in the tools and
strategies they can use to address inequities, the French government leads efforts on a national
scale through policy (the politique de la ville) and national agencies charged with implementing
it through coordinated programs.
This difference in strategy also reveals another core difference between equity planning
in the U.S. and in France. Arguably, it is the primary reason why France experiences a much
lower rate of inequity than the U.S. While equity initiatives in the U.S. are led at a local scale
(city, county, or state), French initiatives operate on a national level through blanket policy that
mandates action is taken against inequities. Despite the growing trend of equity action in U.S.
!140
urban planning, the fact remains that the influence of the state, city, or county is crucial in
promoting equity. Equity planning occurs as a result of local agendas and differs greatly
between geographic areas. In comparison, French national policy guides urban planning.
Specifically, equity planning and sustainability principles are written into the French urban
planning code in its objectives as well as in the planning operations that it requires. Additionally,
French law has given all citizens the right to housing, economic opportunity, and a right to the
city through participation. Urban planning in France is seen as a means to provide for these
rights and to improve the quality of life of all citizens. Even though U.S. planners have
increased flexibility in the tools and strategies they use to reduce inequities, the efficacy of a
national directive and program to address these issues cannot be overlooked.
While the U.S. would undoubtedly see a widespread reduction in social inequities if
policy change occurred at the federal level to mandate equity action across the country, the
constitutional structure of the U.S. government effectively prevents such a change. Whereas
France has a national government structure, the Tenth Amendment of the U.S. Constitution
designed a federal government. Legal precedent established by the U.S. Supreme Court
upholding the Tenth Amendment insists that the federal government cannot mandate action to
state or local governments that does not fall within the realm of powers granted to it by the
Constitution (U.S. Const. amend. X). In this way, the Constitution does not allow for a federal
policy that necessitates equity action by individual states or local authorities similar to that of
France’s national policies like the politique de la ville. Although legal precedent can be
overturned in the U.S. Supreme Court, a much more effective agenda to promote equity action
would focus on enacting regional policy change at the state government level. Considering the
!141
existing powers of state governments, a regional approach is not only a politically viable course
of action but also one that is better suited to the size and scope of U.S. geography and
demographics. Therefore, since enacting a French-style national equity directive is highly
improbable due to our federal government structure, this research advocates instead that states
pass policies, establish programs, and introduce funding streams to support actions at the local
level that aim to reduce inequities. Through this albeit fragmented approach, the U.S. would still
be able to ensure widespread positive change surrounding equity issues similar to the French
national model if all U.S. states adopted such policies.
Although the De Bonne Eco-Neighborhood project was not an initiative led by the equity
programs of the French government, the project’s designers sought to create a new neighborhood
that promoted social, economic, and environmental equity in the heart of Grenoble. By
developing a vibrant, socially diverse community with excellent access to green space and active
modes of transportation, this project addressed social equity issues through an integrated design.
Not only did the project go far beyond social housing requirements (by developing double the
minimum requirement of 20%), it also ensured that everyone — regardless of income, age,
family structure, or physical ability — could fully participate and benefit from an ecologically
sustainable lifestyle and built environment.
Although community perception of this project’s success in meeting equity goals was
unclear, there was a strong trend towards positivity among surveyed users. Not only did every
subject respond that they enjoy spending time in the neighborhood, about two-thirds come
frequently to enjoy the services and atmosphere provided by De Bonne. To explore community
perception in more detail, this research recommends engaging residents in focus groups and one-
!142
on-one interviews to gather more qualitative data to conduct a true geo-narrative analysis to
evaluate the outcomes of equity goals. A geo-narrative analysis is well suited to the De Bonne
project since it would allow researchers to gauge residents’ perceptions and lived experiences
surrounding equitable access to services and opportunity in the neighborhood. Without an
exploration of how residents feel about the state of equity in their community, a true evaluation
of the project’s equity outcomes is incomplete.
Although qualitative data is used extensively throughout urban project planning in the
U.S., the use of qualitative data in project evaluation represents a serious missed opportunity for
U.S. planners. Because of the plethora of data provided by the U.S. Census and the American
Community Survey, the convenience of using quantitative data alone often means that further
community engagement after a project’s completion to collect qualitative data is either non-
existent or limited. The lessons that could be learned from exploring community perceptions
after equity planning projects take place would not only provide the information necessary to
continue improving that specific project, but they would also guide future planning action to
yield more effective equity solutions that are best adapted to community needs.
In conclusion, there is much to be learned from the equity planning experience in France.
Although France’s GINI score cannot be attributed to its planning efforts alone, urban planning
practice and policy greatly influence the state of inequities in French cities. France has certainly
introduced policies in the past that have exacerbated both social and economic inequities,
primarily through its housing policy centered around the grands ensembles. However, it is clear
through an examination of French law that the country as a whole has adopted many policies and
initiatives since this catastrophe that strive to counteract the wrongs that occurred and that
!143

continue to negatively impact many French communities. Through the guarantee of universal
rights, robust community engagement requirements, and a constant reflexion on the efficacy of
its policies in improving quality of life, France has shown that it is a leader in the pursuit of
greater equity. However, it is unfair to say that France truly adheres to a process of equity
planning. Rather than relying on the efforts of equity planners working upstream of the status
quo, French national policy requires action to create more equitable communities. Therefore,
equity planning as it is understood in the U.S. does not exist in France. Instead, equity planning
is simply synonymous with urban planning.
!144
References
Allix, G. (2009, November 4). La caserne De Bonne, quartier modèle et économe du centre de Grenoble [The Caserne de Bonne, Economizing, Model Neighborhood in the Center of Grenoble]. Le Monde. Retrieved November 14, 2017, from http://www.lemonde.fr/ planete/article/ 2009/11/04/la-caserne-de-bonne-quartier-modele-et-econome-du-centre- de-grenoble_1262583_3244.html. American Planning Association (2002). Growing Smart Legislative Guidebook Chapter 3: Definitions. Retrieved October 10, 2017 from https://www.planning.org/growingsmart/ guidebook/three.htm. ARGOS (2012). Rapport d’évaluation externe du quartier de Bonne – Année 1 [External Evaluation Report of the De Bonne Neighborhood — Year 1]. Retrieved May 20, 2017, from http://www.grenoble.fr/99-donnees-publiques.htm. Bardet, G. (1948). Le nouvel urbanisme. Retrieved October 24, 2017, from http:// www.genomenglish.com/read.php?id=3T4FAAAAMAAJ. Baudouï, R. (2014). Penser la transition éthique de l’urbanisme pour l’aménagement de villes durables. Le cas de la France et de la Suisse [Thoughts about the Ethical Transition of Urbanisme for Sustainable City Planning. The Case of France and Switzerland]. Éthique publique, 16(1), n.p. DOI : 10.4000/ethiquepublique.1404. Bevant, D. (2012). Territoires, dynamiques sociale et économique, selon L.-J. Lebret [Land, Social Dynamics, and Economy, according to L.J. Lebret]. In Colloque Vers une Économie Humaine: Pensées critiques d’hier pour aujourd’hui. Retrieved October 24, 2017, from ismea.perroux.free.fr. Bobroff, J. (2011). La Caserne de Bonne: Project Emblématique d’un Développement Durable à la Française [The Caserne de Bonne: Emblematic French Sustainable Development Project]. Retrieved September 10, 2017, from www.urbanisme-puca.gouv.fr/IMG/pdf/ Zac_de_Bonne.pdf. Bollock, N. (2010, July). Gaston Bardet: post-war champion of the mainstream tradition of French urbanisme. Planning Perspectives, 25(3), 347-363. doi: 10.1080/02665433.2010.481183. Boschmann, E. E., & Cubbon, E. (2014). Sketch Maps and Qualitative GIS: Using Cartographies of Individual Spatial Narratives in Geographic Research. The Professional Geographer, 66(2), 236-248. doi:10.1080/00330124.2013.781490. Brambilla, M., Michelangeli, A., & Peluso, E. (2013, December). Equity in the City: On Measuring Urban (Ine)quality of Life. Urban Studies, 50(16), 3205-3224. doi: 10.1177/0042098013484539. California Environmental Protection Agency (2014). Approaches to Identifying Disadvantaged Communities (Office of Environmental Health Hazard Assessment). Retrieved October 30, 2017, from https://www.arb.ca.gov/cc/capandtrade/auctionproceeds/workshops/ calepa-approaches-to-identify-disadvantaged-communities-aug2014.pdf. CAUE. (n.d.). La zone d’aménagement concertée [Special planning district]. Retrieved March 1, 2017, from http://caue14.com/le-conseil-aux-collectivites/memento/zac/.
!145
Célestin, G. (1986). Lebret et l’aménagement du territoire [Lebret and Town Planning]. Retrieved October 10, 2017, from http://lebret-irfed.org/spip.php?article738. Centre de ressources PCET. (2014, June 16). Aménagement de la ZAC de Bonne [Development of the ZAC de Bonne]. Retrieved March 1, 2017, from http://observatoire.pcet-ademe.fr/ action/fiche/36/amenagement-de-la-zac-de-bonne. Chamedes, G. (2015). The Catholic Origins of Economic Development after World War II. French Politics, Culture, and Society, 33(2), 55-75. doi: 10.3167/fpcs.2015.330204. Chang, H., & Liao, C. (2011). Exploring an integrated method for measuring the relative spatial equity in public facilities in the context of urban parks. Cities, 28, 361-371. doi:10.1016/ j.cities.2011.04.002. Choay, F. (1965) Tableau Récapitulatif des Courants Théoriques in L’urbanisme, utopie et réalité [Summary Table of Theoretical Trends in Urban Planning, Utopia, and Reality]. Retrieved October 10, 2017, from www.julienrodriguez.fr/images/.../F-choay-tableau- recapitulatif.pdf. City of Seattle. (2016, August). Housing Affordability and Livability Agenda (Office of Planning & Community Development). Retrieved December 7, 2016, from http://www.seattle.gov/ Documents/Departments/HALA/HALA_Overview_web.pdf. City of Seattle. (2016). Office of Planning and Community Development. Retrieved December 07, 2016, from http://www.seattle.gov/dpd/cityplanning/cityplanning/default.htm. Clavel, P. (1986). The Progressive City: Planning and Participation, 1969-1984. New Brunswick, NJ: Rutgers University Press. Clavel, P. (1994). The Evolution of Advocacy Planning. Journal of the American Planning Association, 60(2), 146-149. doi:10.1080/01944369408975564. Cloward, R. A., & Piven, F. F. (1974). The Politics of Turmoil: Essays on Poverty, Race, and the Urban Crisis. New York, NY: Pantheon Books. Comer, J. C., & Skraastad-Jurney, P. D. (2008). Assessing the Locational Equity of Community Parks through the Application of Geographic Information Systems. Journal of Park and Recreation Administration, 26(1), 122-146. Retrieved September 5, 2016, from Ebscohost. Community Toolbox. (2017). Assessing Community Needs and Resources. Retrieved October 24, 2017, from http://ctb.ku.edu/en/assessing-community-needs-and-resources. Cope, M., & Elwood, S. (2009). Qualitative GIS: A Mixed-Methods Approach. Retrieved December 8, 2016. Cupers, K. (2011). The Expertise of Participation: Mass Housing and Urban Planning in Post- War France. Planning Perspectives, 26(1), 29-53. doi: 10.1080/02665433.2011.527546. Davidoff, P. (1965). Advocacy And Pluralism In Planning. Journal of the American Institute of Planners, 31(4), 421-432. doi:10.1080/01944366508978187. Duerksen, C., Dale, C., & Davidoff, P. (1975). Working towards Redistributive Justice. Journal of the American Institute of Planners, 41(5), 317-318. doi: 10.1080/01944367508977676. Davidson, M., & Dolnick, F. (Eds.). (2004, April). A Planner's Dictionary (American Planning Association). Retrieved October 10, 2017, from https://www.planning.org/publications/ report/9026853/.
!146
Delmas, J. (2011). Acteurs et enjeux de l’aménagement des territoires. [Actors and Issues of Territorial Planning.] Reading. Retrieved May 10, 2017, from https://www.lyceedadultes .fr/sitepedagogique/documents/HG/HG1S/1S_G02_1eres_T1_Q1_C2_Acteurs_et_ enjeux_de_l_amenagement_du_territoire.pdf. Elliott, D. (2013). The Citizen's Guide to Planning (4th ed.). Washington, DC: APA Planners Press. Egenhofer, M. J., & Mark, D. M. (1995, September). Naive Geography. Lecture Notes in Computer Science, 988, 1-15. doi:10.1007/3-540-60392-1_1. EPF Nord-Pas-De-Calais. (2009, November 10). Recensement des principales lois françaises dans les domaines de la planification, de l’urbanisme, du logement et de l’habitat [Collection of Major French Laws in the Urban Planning and Housing Sectors] (France, Établissement Public Foncier). Retrieved May 10, 2017, from http://www.epf-npdc.fr/ Nos-reflexions-nos-recherches/Publications/Recensement-des-principales-lois-francaises- dans-les-domaines-de-la-planification-de-l-urbanisme-du-logement-et-de-l-habitat. ESRI (2017). Story Maps. Retrieved November 14, 2017, from https://storymaps.arcgis.com/en/. European Commission, Innovation Union. (2014, March 11). Barcelona is "iCapital" of Europe [Press release]. Retrieved February 25, 2017, from http://europa.eu/rapid/press- release_IP-14-239_en.htm. Farber, et al. (2014, August). Assessing Social Equity in Distance Based Transit Fares using a Model of Travel Behavior. Transportation Research Part A: Policy and Practice, 67, 291-303. doi:10.1016/j.tra.2014.07.013. Farcy, P. (2012, June 25). Bonne, une caserne militaire devenue un éco-quartier [Bonne, a Military Barracks Becomes an Eco-Neighborhood]. Univers Nature. Retrieved November 14, 2017, from http://www.univers-nature.com/actualite/societe-lois-politique/bonne-une- caserne-militaire-devenue-un-eco%E2%80%90quartier-de-centre%E2%80%90ville- 65139.html. Fitoussi, J.-P. (2004). Ségrégation urbaine et intégration sociale [Urban Segregation and Social Intergration] (Report). Retrieved October 30, 2017, from http://www.ladocumentation francaise.fr/rapports-publics/044000057/index.shtml. Forester, J. (1994). Bridging Interests and Community: Advocacy Planning and the Challenges of Deliberative Democracy. Journal of the American Planning Association, 60(2), 153-158. doi:10.1080/01944369408975567. Frank, A. U. (1992). Qualitative Spatial Reasoning about Distances and Directions in Geographic Space. Journal of Visual Languages and Computing, 3, 343–71. Frederickson, H.G. (2005). The State of Social Equity in American Public Administration. National Civic Review, 31-38. doi: 10.1002/ncr.117. Frey, J.-P. (2001). Gaston Bardet, théoricien de l’urbanisme “culturaliste”. Urbanisme, 319, 32-36. Retrieved October 20, 2017, from http://www.morphocity.fr/app/download/ 5794674531/P33%2C+Bardet+th%C3%A9oricien+de+l%27urbanisme+copie.pdf. FTA. (2016, March 16). Civil Rights Reviews. Retrieved October 24, 2017, from https:// www.transit.dot.gov/regulations-and-guidance/safety/civil-rights-reviews.
!147
Grenoble-Alpes Métropole (2015). Contrat de ville stratégie et objectifs 2015-2020 [City Contract Strategy and Objectives 2015-2020]. Retrieved October 30, 2017, from https:// www.lametro.fr/466-contrat-de-ville-2015-2020.htm. Human Impact Partners. (n.d.). Health Equity Guide Strategic Practices. Retrieved October 24, 2017, from https://healthequityguide.org/strategic-practices/. INSEE. (2004). Indicateurs de structure et de distribution des revenus en 2001 [Indicators of Structure and Distribution of Incomes in 2001]. Retrieved October 30, 2017, from https:// www.insee.fr/fr/statistiques/1893279#documentation. INSEE. (2017). Recherche dans Statistiques « Revenus fiscaux localisés » [Search in Statistics “Local Fiscal Revenue”]. Retrieved October 30, 2017, from https://www.insee.fr/fr/ recherche/recherche-statistiques?q=Revenus%2Bfiscaux%2Blocalis %C3%A9s&debut=0&categorie=3&geo=ICQ-1. IOCGP. (2003, September). Principles and guidelines for social impact assessment in the USA.
Impact Assessment and Project Appraisal, 21(3), 231-250. IRFED. (2004). History. Retrieved October 10, 2017, from http://www.lebret-irfed.org/spip.php? article10. Jung, J., & Elwood, S. (2010). Extending the Qualitative Capabilities of GIS: Computer-Aided Qualitative GIS. Transactions in GIS, 14(1), 63-87. doi:10.1111/j. 1467-9671.2009.01182.x. King County. (2010). Equity Impact Review (Equity and Social Justice Office). Retrieved October 24, 2017, from http://www.kingcounty.gov/~/media/elected/executive/equity- social-justice/2016/The_Equity_Impact_Review_checklist_Mar2016.ashx?la=en. King County. (2016). Executive Summary King County Equity and Social Justice Strategic Plan (Equity and Social Justice Office). Retrieved October 30, 2017, from http:// www.kingcounty.gov/elected/executive/equity-social-justice/strategic-plan.aspx. Krumholz, N. (1975). The Cleveland Policy Planning Report. Journal of the American Planning Association, 41(5), 298-304. Krumholz, N. (1994). Advocacy Planning: Can it Move to the Center? Journal of the American Planning Association, 60(2), 150. Krumholz, N., & Clavel, P. (1994). Reinventing Cities: Equity Planners Tell Their Stories. Philadelphia, PA: Temple University Press. Kwan, M., & Ding, G. (2008). Geo-Narrative: Extending Geographic Information Systems for Narrative Analysis in Qualitative and Mixed-Method Research. The Professional Geographer, 60(4), 443-465. doi:10.1080/00330120802211752. Laplace, L. & Menez, F. (2010). Palmarès EcoQuartier 2009: ÉcoQuartier de la ZAC de Bonne, Ville de Grenoble [Awards List Eco-Neighborhood 2009: Special Planning District de Bonne Eco-Neighborhood, Grenoble]. Retrieved October 15, 2017, from http:// www.centre-est.cerema.fr/fiches-palmares-concours-ecoquartier-2009-a793.html. Lebret, L.J. (1950). D’ “Économie et Humanisme” à l’Économie Humaine [From “Economy and Humanism” to the Human Economy]. Revue Économique, 1(5), 568-582, doi : 10.3406/ reco.1950.406787. Lefebvre, H. (1967). Le Droit à la Ville [The Right to the City]. L'Homme et la Société, 6, 29-35, doi : 10.3406/homso.1967.1063.
!148
Le Galès, P. (2001). Urban Governance and Policy Networks: On the Urban Political Boundedness of Policy Networks. A French Case Study. Public Administration, 79(1) 167-184, doi: 10.1111/1467-9299.00251. Legifrance (1996, November 15) (enacted). Assemblé Nationale and Sénat. Loi no 96-987 relative à la mise en oeuvre du pacte de relance pour la ville. Retrieved October 30, 2017 from, https://www.legifrance.gouv.fr/jo_pdf.do?id=JORFTEXT000000196404. Legifrance (1999, June 25) (enacted). Assemblé Nationale and Sénat. Loi Voynet 99-533: Article 2. Retrieved October 25, 2017 from, https://www.legifrance.gouv.fr/eli/loi1999/6/25/99- 533/jo/texte. Legifrance (2013, January 18) (enacted). Assemblé Nationale and Sénat. Loi Dufflot 2013-61. Retrieved October 25, 2017 from, https://www.legifrance.gouv.fr/affichTexte.do? cidTexte=JORFTEXT000026954420. Legifrance (2014, February 21) (enacted). Assemblé Nationale and Sénat. Loi 2014-173. Retrieved October 25, 2017 from, https://www.legifrance.gouv.fr/eli/loi/2014/2/21/ 2014-173/jo/texte. Legifrance (2016, July 1). Décret n° 2016-901. Retrieved October 25, 2017 from, https:// www.legifrance.gouv.fr/eli/decret/2016/7/1/2016-901/jo/texte. Legifrance (2017, January 1). Code d’Urbanisme: Article L101-2 [Urban Planning Legal Code]. Retrieved October 25, 2017 from, https://www.legifrance.gouv.fr/affichCode.do?cidTexte =LEGITEXT000006074075. Litman, T., 2002. Evaluating transportation equity. World Transp. Policy Pract. 8 (2), 50–65. Retrieved October 10, 2017 from www.vtpi.org/equity.pdf. Mark, D. M. (1999). Spatial Representation: A Cognitive View. In Longley, P. A., Goodchild, M.
F., Maguire, D. J., and Rhind, D. W. (eds) Geographical Information Systems (Second Edition). New York, John Wiley and Sons: 81–9 .
Matthews, S. et al. (2005). Geo-ethnography: Coupling Geographic Information Analysis Techniques with Ethnographic Methods in Urban Research. Cartographica, 40(4), 75-90. Metzger, J. T. (1996, August). The Theory and Practice of Equity Planning: An Annotated Bibliography. Journal of Planning Literature, 11(1), 112-126. doi: 10.1177/088541229601100106. Mineau, D. (2003, December). L'apport des SIG en urbanisme. [The contribution of GIS to urban planning]. Bulletin de l'Association de géographes français, 443-453. Retrieved from http://www.persee.fr/docAsPDF/bagf_0004-5322_2003_num_80_4_2356.pdf. Ministère de la Cohésion des Territoires (2016). Qu’est-ce qu’un logement social? [What is social housing?] Retrieved October 10, 2017 from http://www.cohesion- territoires.gouv.fr/qu-est-ce-qu-un-logement-social. Ministère de la Cohésion des Territoires. (2017). Géographie prioritaire de la politique de la ville [Priority Geography of City Policy]. Retrieved October 30, 2017, from http:// www.cohesion-territoires.gouv.fr/geographie-prioritaire. Newsome, B. (2005). The ‘‘Apartment Referendum’’ of 1959: Toward Participatory Architectural and Urban Planning in Postwar France. French Historical Studies, 28(2), 329-358. doi: 10.1215/00161071-28-2-329.
!149
Office for Civil Rights. (2013, July 26). Civil Rights Requirements Title VI of the Civil Rights Act. Retrieved October 24, 2017, from https://www.hhs.gov/civil-rights/for-individuals/ special-topics/needy-families/civil-rights-requirements/index.html. OECD. (2016). Inequality and Income. Retrieved September 17, 2016, from http:// www.oecd.org/social/inequality.htm. OpenStreetMap. (2017, November 6). Zip [Shapefile]. Geofabrik. Retrieved from http:// download.geofabrik.de/europe/france/rhone-alpes.html. Photec. (n.d.). Urbanisme. Retrieved November 22, 2017, from https://www.photec.fr/la- galerie.php?galerie=4. PolicyLink. (2015). Key Strategies to Advance Equitable Growth in Regions (Issue brief). Retrieved October 24, 2017, from https://www.policylink.org/find-resources/library/ advance-equitable-growth-in-regions. PolicyLink. (2014). Minnesota’s Tomorrow: Equity Is the Superior Growth Model (Issue brief). Retrieved October 24, 2017, from https://www.policylink.org/find-resources/library/ minnesotas-tomorrow-equity-is-the-superior-growth-model. PolicyLink. (2016). National Equity Atlas. Retrieved October 24, 2017, from http://national equityatlas.org/. PolicyLink (2016). Highlighting Equity in the President’s Budget Proposal for FY2016 (Fact Sheet). Retrieved October 30, 2017, from www.policylink.org/find-resources/library/ presidents-budget-proposal-FY2016. PolicyLink. (2016). Transportation for All: Good for Families, Communities, and the Economy ` (Issue brief). Retrieved October 24, 2017, from https://www.policylink.org/find- resources/library/casey-equal-voice-series-transportation. Puel, H. (2015). L’Humanisme Économique de L.-J. Lebret [The Economic Humanism of L.J. Lebret]. Développement et Civilisations, 428, 1-4. Retrieved October 20, 2017, from www.editions-melibee.com/site/.../fr_documents_fichier_113.pdf. Purcell, M. (2013). Possible Worlds: Henri Lefebvre and the Right to the City. Journal of Urban Affairs, 36(1), 141-154, doi: 10.1111/juaf.12034. SAGES (2011). Grenoble: De Bonne un écoquartier dans la ville [Grenoble: De Bonne, An Eco- Neighborhood in the City]. [print source]. SMTC. (2014). La ligne e réussite son entrée ! [Line e’s inauguration is successful !]. Retrieved March 1, 2017, from http://www.smtc-grenoble.org/la-ligne-e-reussit-son-entree. SMTC. (2014, July 9). Vers une tarifications plus juste [Towards fairer tariffs]. Retrieved March 1, 2017, from http://www.smtc-grenoble.org/communique-vers-une-tarification-plus- juste. Talen, E. (1998). Visualizing Fairness: Equity Maps for Planners. Journal of the American Planning Association, 64(1), 22-38. doi:10.1080/01944369808975954. Talen, E. and Anselin, L. (1998). Assessing Spatial Equity: An Evaluation of Measures of Accessibility to Public Playgrounds. Environment and Planning, 30, 595–613. Taylor, D. & Lange, J. (2016). Social Applications of Geographical Information Systems: Technical tools for social innovation, Australian Geographer, 47(4), 417-433. doi: 10.1080/00049182.2016.1231050.
!150
Travers, M. (2001). Qualitative Research through Case Studies. Retrieved November 14, 2017, from https://ebookcentral-proquest-com.libproxy.nau.edu/lib/nau-ebooks/detail.action? docID=1191058. United Nations. (n.d.). Sustainable Development Goals. Retrieved October 11, 2017, from http:// www.un.org/sustainabledevelopment/sustainable-development-goals/. U.S. Const. amend. X. Vayssière, B. (2004). Relever la France dans les après-guerres: reconstruction ou réaménagement? [Raising France up in post-war time: reconstruction or re-planning?]. Guerres Mondiales et Conflits Contemporains, 4(236), 45-60. doi: 10.3917/gmcc. 236.0045. Verd, J. M. & Porcel, S. (2012). An Application of Qualitative Geographic Information Systems (GIS) in the Field of Urban Sociology Using ATLAS.ti: Uses and Reflections. Forum: Qualitative Social Research, 13(2), Article 14. Doi: 10.17169/fqs-13.2.1847. Ville de Grenoble. (2017). Vie municipale. Retrieved February 25, 2017, from http:// www.grenoble.fr/30-vie-municipale.htm. Willsher, K. (2016, March 31). Story of Cities #12: Haussmann rips up Paris – and divides France to this day. The Guardian. Retrieved May 10, 2017, from https:// www.theguardian.com/cities/2016/mar/31/story-cities-12-paris-baron-haussmann-france- urban-planner-napoleon. World Commission on Environment and Development. (1987) Report of the World Commission on Environment and Development: Our Common Future (Brundtland Commission). Retrieved October 10, 2017 from www.un-documents.net/our-common-future.pdf. Yeh, A. G. (2005). Urban Planning and GIS. In P. A. Longley, M. Goodchild, D. J. Maguire, & D. W. Rhind (Eds.), New Developments in Geographical Information Systems: Principles, Techniques, Management and Applications (2nd ed.). Retrieved September 4, 2016, from http://www.geos.ed.ac.uk/~gisteac/gis_book_abridged/. Zuppinger, T. (2009). Humanisme et Urbanisme [Humanism and Urban Planning]. Implications Philosophiques, 9, 1-3, Retrieved October 12, 2017, from http://www.implications- philosophiques.org/Habitat/Zuppinger1.html.
!151
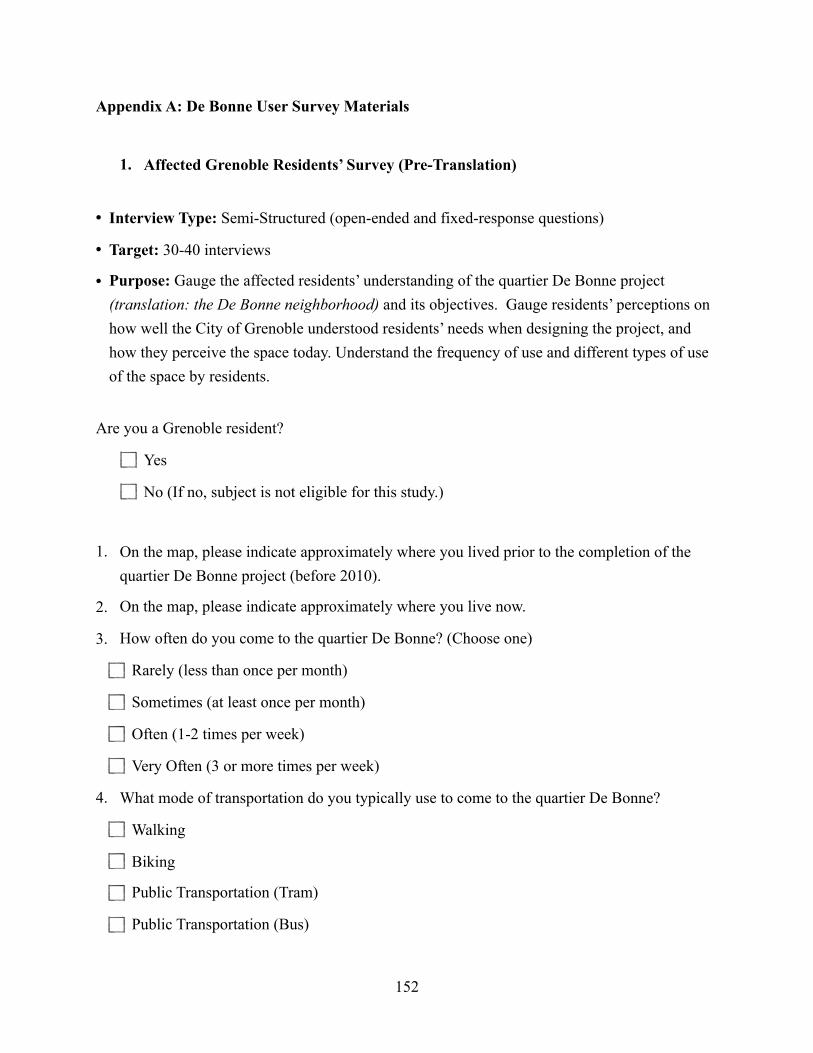
Appendix A: De Bonne User Survey Materials
1. Affected Grenoble Residents’ Survey (Pre-Translation)
• Interview Type: Semi-Structured (open-ended and fixed-response questions)
• Target: 30-40 interviews
• Purpose: Gauge the affected residents’ understanding of the quartier De Bonne project (translation: the De Bonne neighborhood) and its objectives. Gauge residents’ perceptions on how well the City of Grenoble understood residents’ needs when designing the project, and how they perceive the space today. Understand the frequency of use and different types of use of the space by residents.
Are you a Grenoble resident?
Yes
No (If no, subject is not eligible for this study.)
1. On the map, please indicate approximately where you lived prior to the completion of the quartier De Bonne project (before 2010).
2. On the map, please indicate approximately where you live now.
3. How often do you come to the quartier De Bonne? (Choose one)
Rarely (less than once per month)
Sometimes (at least once per month)
Often (1-2 times per week)
Very Often (3 or more times per week)
4. What mode of transportation do you typically use to come to the quartier De Bonne?
Walking
Biking
Public Transportation (Tram)
Public Transportation (Bus)
!152

Personal vehicle
5. On the map, please trace your typical route to come to the quartier De Bonne.
6. What is the primary reason you come here? (Choose one) Shopping
Enjoying open space
I live here.
Going to the cinema
Using childcare services or playground
Visiting friends or family
Working
Passing through
Other _________________
7. [LATER COMBINED WITH QUESTION 6] From the same list, please choose two other reasons why you come to the quartier De Bonne.
Shopping
Enjoying open space
I live here.
Going to the cinema
Using childcare services or playground
Visiting friends or family
Working
Passing through
Other ____________________
9. Based on your response to question 6, on the map please indicate where you went to satisfy that need or engage in that activity before the quartier De Bonne was completed.
10. Is there somewhere you go more often to satisfy that need or engage in that activity than the quartier De Bonne?
No
Yes. Where? ____________________ (indicate on map) Why? _____________________
11. What is your favorite aspect of the quartier De Bonne? (Choose one) Shops
Green space/open space
Cinema/Cultural Activities
Housing or employment options
Aesthetics/Design
Other ________________ 12. On the map, please indicate where you experience positive feelings when spending time in
the
13. quartier De Bonne. On the map, please indicate where you experience negative feelings when spending time in the quartier De Bonne.
14. (Continued Below on Next Page)
!153
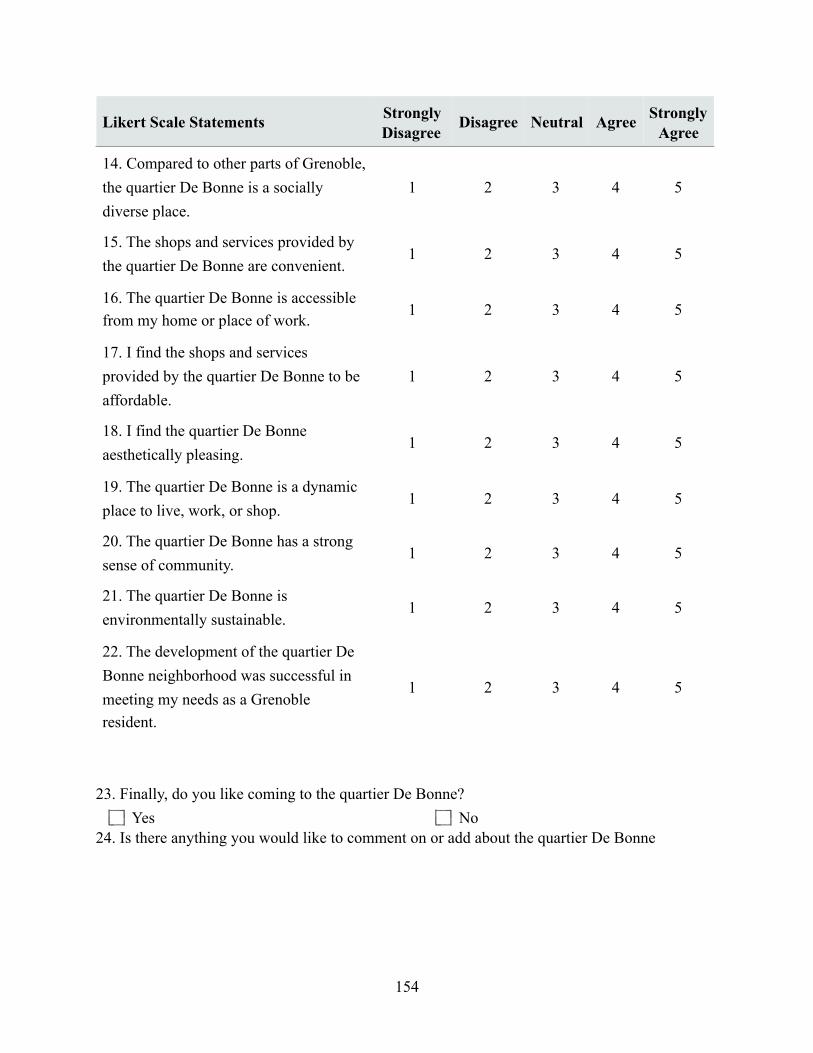
23. Finally, do you like coming to the quartier De Bonne? Yes No
24. Is there anything you would like to comment on or add about the quartier De Bonne
Likert Scale Statements Strongly Disagree
Disagree Neutral Agree Strongly Agree
14. Compared to other parts of Grenoble, the quartier De Bonne is a socially diverse place.
1 2 3 4 5
15. The shops and services provided by the quartier De Bonne are convenient.
1 2 3 4 5
16. The quartier De Bonne is accessible from my home or place of work.
1 2 3 4 5
17. I find the shops and services provided by the quartier De Bonne to be affordable.
1 2 3 4 5
18. I find the quartier De Bonne aesthetically pleasing.
1 2 3 4 5
19. The quartier De Bonne is a dynamic place to live, work, or shop.
1 2 3 4 5
20. The quartier De Bonne has a strong sense of community.
1 2 3 4 5
21. The quartier De Bonne is environmentally sustainable.
1 2 3 4 5
22. The development of the quartier De Bonne neighborhood was successful in meeting my needs as a Grenoble resident.
1 2 3 4 5
!154
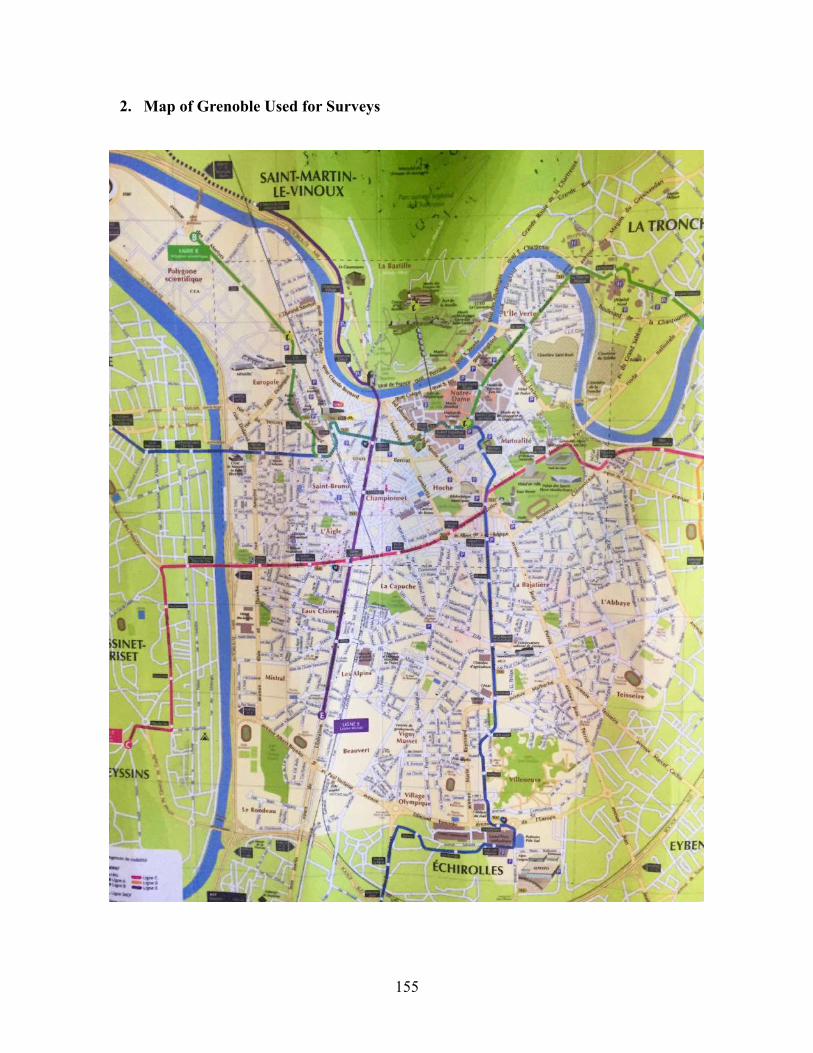
2. Map of Grenoble Used for Surveys
!155
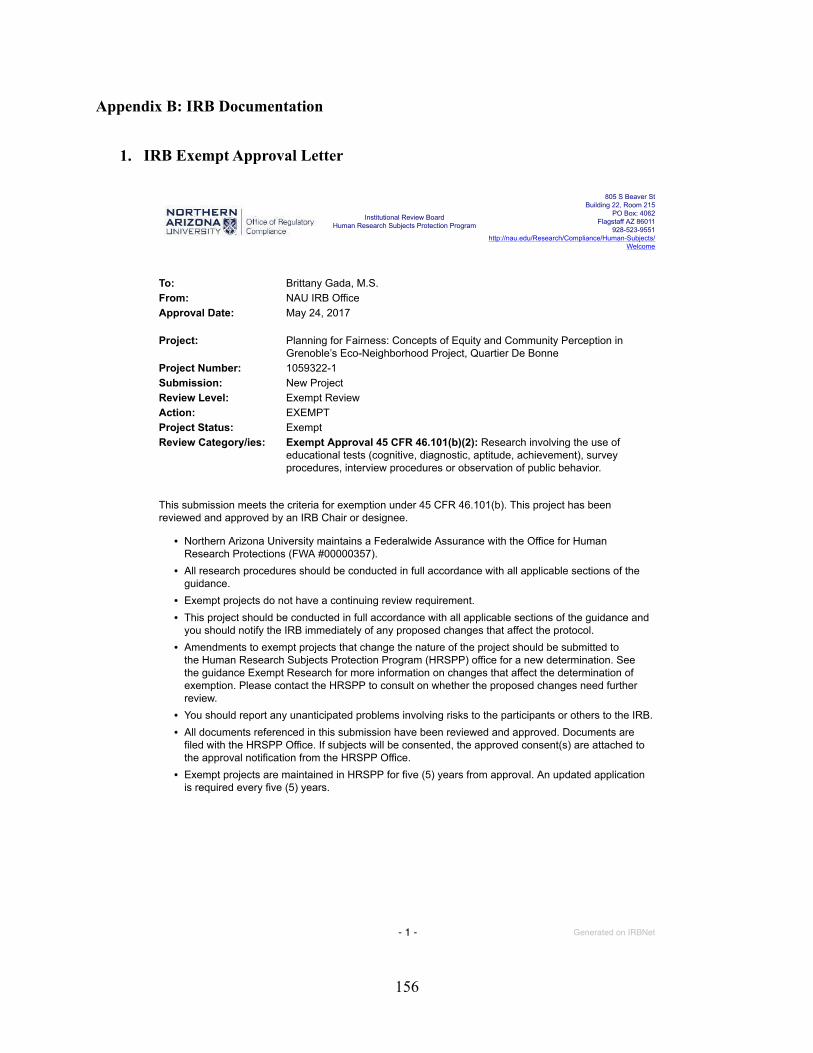
Appendix B: IRB Documentation
1. IRB Exempt Approval Letter
!156
- 1 - Generated on IRBNet
Institutional Review BoardHuman Research Subjects Protection Program
805 S Beaver StBuilding 22, Room 215
PO Box: 4062Flagstaff AZ 86011
928-523-9551http://nau.edu/Research/Compliance/Human-Subjects/
Welcome
To: Brittany Gada, M.S.From: NAU IRB OfficeApproval Date: May 24, 2017 Project: Planning for Fairness: Concepts of Equity and Community Perception in
Grenoble’s Eco-Neighborhood Project, Quartier De BonneProject Number: 1059322-1Submission: New ProjectReview Level: Exempt ReviewAction: EXEMPTProject Status: ExemptReview Category/ies: Exempt Approval 45 CFR 46.101(b)(2): Research involving the use of
educational tests (cognitive, diagnostic, aptitude, achievement), surveyprocedures, interview procedures or observation of public behavior.
This submission meets the criteria for exemption under 45 CFR 46.101(b). This project has beenreviewed and approved by an IRB Chair or designee.
• Northern Arizona University maintains a Federalwide Assurance with the Office for HumanResearch Protections (FWA #00000357).
• All research procedures should be conducted in full accordance with all applicable sections of theguidance.
• Exempt projects do not have a continuing review requirement.• This project should be conducted in full accordance with all applicable sections of the guidance and
you should notify the IRB immediately of any proposed changes that affect the protocol.• Amendments to exempt projects that change the nature of the project should be submitted to
the Human Research Subjects Protection Program (HRSPP) office for a new determination. Seethe guidance Exempt Research for more information on changes that affect the determination ofexemption. Please contact the HRSPP to consult on whether the proposed changes need furtherreview.
• You should report any unanticipated problems involving risks to the participants or others to the IRB.• All documents referenced in this submission have been reviewed and approved. Documents are
filed with the HRSPP Office. If subjects will be consented, the approved consent(s) are attached tothe approval notification from the HRSPP Office.
• Exempt projects are maintained in HRSPP for five (5) years from approval. An updated applicationis required every five (5) years.
2. IRB Approved Informed Consent Document for Surveys (Pre-Translation)Appendix
!157
NAU Adult Consent Template
v2016-04
Human Subject Informed Consent: Group 2
Title of Study: Planning for Fairness: Concepts of Equity and Community Perception in Grenoble’s Eco-Neighborhood Project, Quartier De Bonne
Principal Investigator: Brittany Gada
This is a consent form for research participation. It contains important information about this study and what to expect if you decide to participate. Please consider the information carefully.
Why is this study being done?
The purpose of this study is to evaluate the success of the Quartier De Bonne project in meeting the needs and improving the lives of those it serves. This research considers the perceptions of both professional actors and affected residents to form conclusions.
How many subjects will participate and how long will the study take?
This study will engage between 30-40 Grenoble residents who come to the Quartier De Bonne. Your participation will require approximately 10-15 minutes of your time.
What will happen if I take part in this study?
By taking part in this study, you will be asked to respond to several open-ended and fixed-response interview questions. Most questions are multiple-choice. The interview questions will be related to your opinions, perceptions, and uses of the Quartier De Bonne. All interviews will take place in the public spaces of the Quartier De Bonne, and your responses will be audio-recorded. Your name will never be recorded or used in any research publications related to this study.
Will there be any cost to you to take part in this study?
The only cost to take part in this study is your time. There is no monetary cost to participate.
Will you be paid to take part in this study?
You will not be paid for your participation in this research study.
Can I stop being in the study?
Your participation is voluntary. You may refuse to participate in this study. If you decide to take part in the study, you may leave the study at any time. No matter what decision you make, there will be no penalty to you and you will not lose any of your usual benefits. Your decision will not affect your future relationship with the researcher, with Northern Arizona University or with any organization affiliated with the De Bonne neighborhood.
What are the risks and/or discomforts you might experience if you take part in this study?
The researcher does not anticipate any risks or discomforts when taking part in this study.
Are there any benefits for you (or for others) if you choose to take part in this research
study?
There are no expected benefits for choosing to take part in this research study.
Consent Version: 04/20/2017
Page 1 of 2
Project Number: 1059322-1Approval Date: May 24, 2017This stamp must be on allconsenting documents
!158
NAU Adult Consent Template
v2016-04
Human Subject Informed Consent: Group 2
Will my study-related information be kept confidential?The information you provide while participating in this study will be kept confidential. You will not be asked to provide any personal information that might identify you. However, research records may be reviewed by the following groups:
• Office for Human Research Protections or other federal, state, or international regulatory
agencies• Northern Arizona University Institutional Review Board
Who can you call if you have any questions?If you have any questions about taking part in this study, you can email the Principal Investigator at [email protected].
For questions about your rights as a participant in this study or to discuss other study-related concerns or complaints with someone who is not part of the research team, you may contact the Human Subjects Research Protection Program at +1928-523-9551 or online at http://nau.edu/Research/Compliance/Human-Research/Welcome/.
An Institutional Review Board responsible for human subjects research at Northern Arizona University reviewed this research project and found it to be acceptable, according to applicable state and federal regulations and University policies designed to protect the rights and welfare of participants in research.
Do you understand the information that has been provided to you about this research?
Yes____ No ______
Do you have any questions about this research?
Yes____ No ______
Are you willing to be audio recorded for purposes of this research?
Yes ____ No ______
Are you at least 18 years of age?
Yes____ No ______
Do you agree to participate in this research?
Yes____ No ______
Consent Version: 04/20/2017
Page 2 of 2
Project Number: 1059322-1Approval Date: May 24, 2017This stamp must be on allconsenting documents
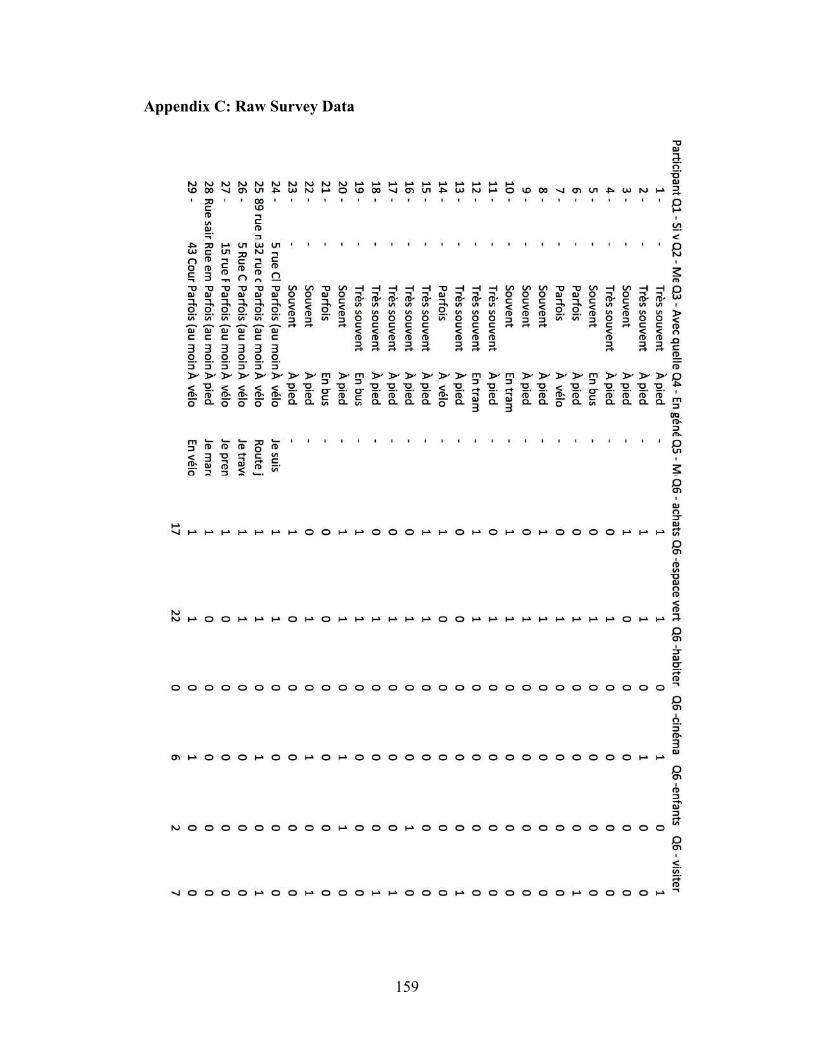
Appendix C: Raw Survey Data
!159
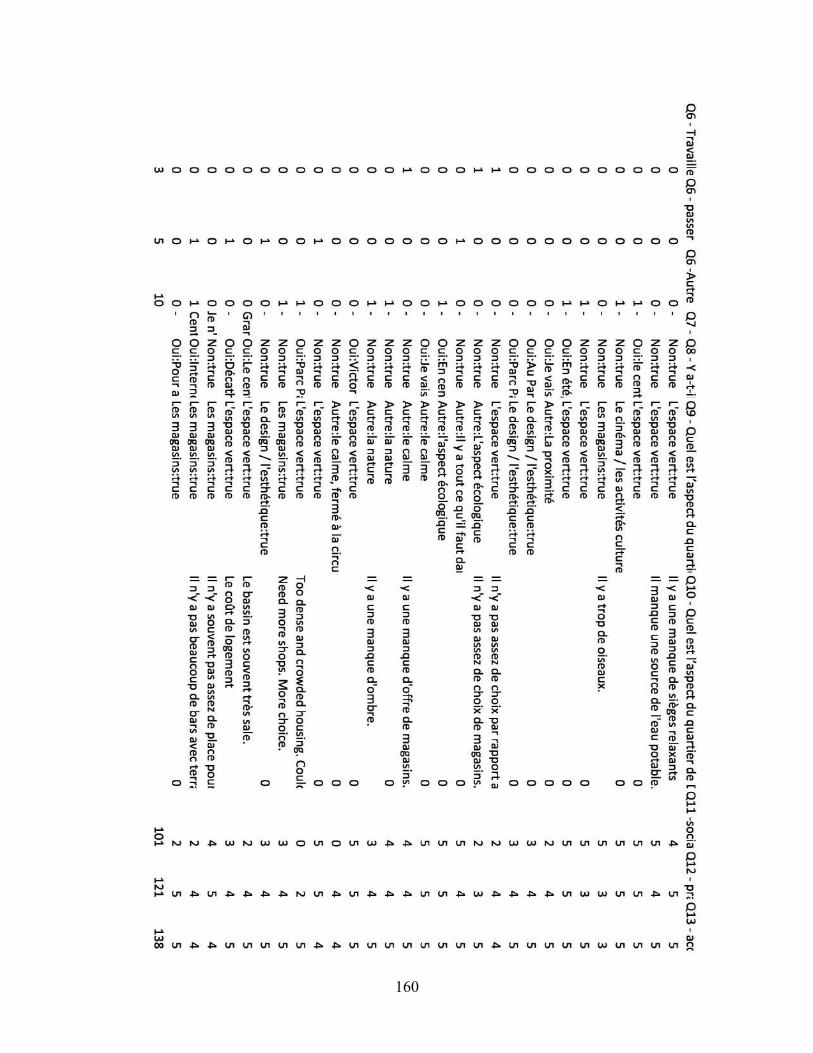
!160
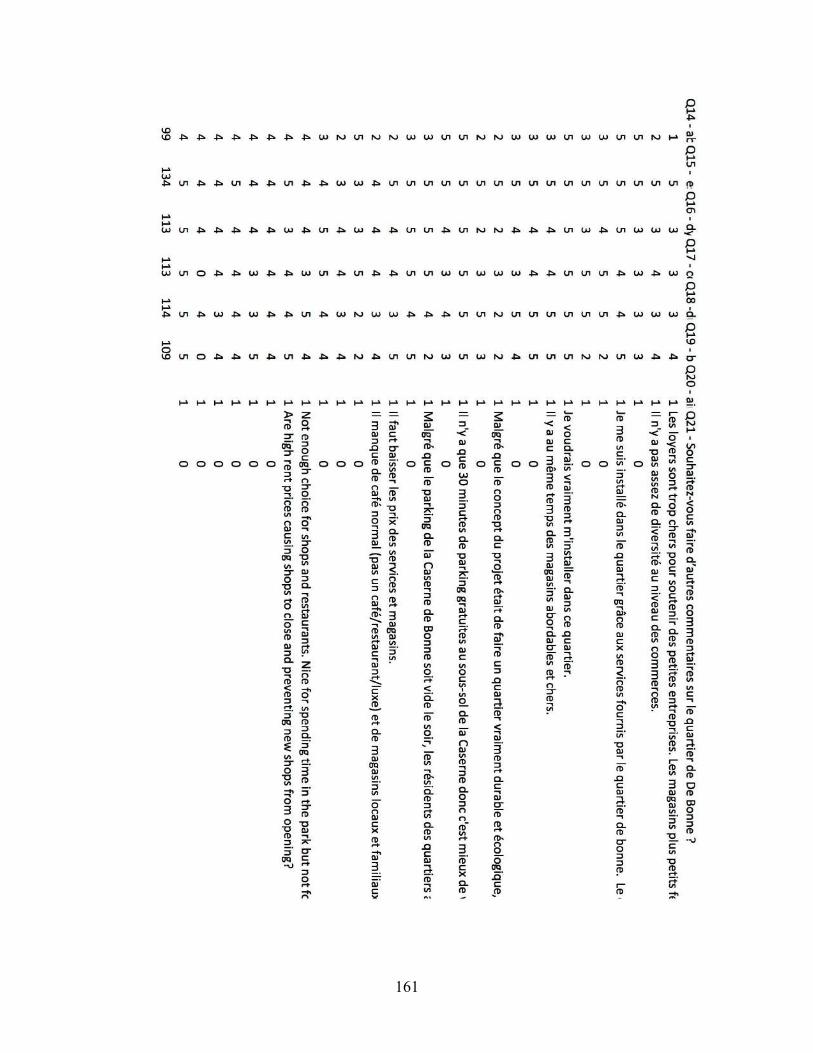
!161
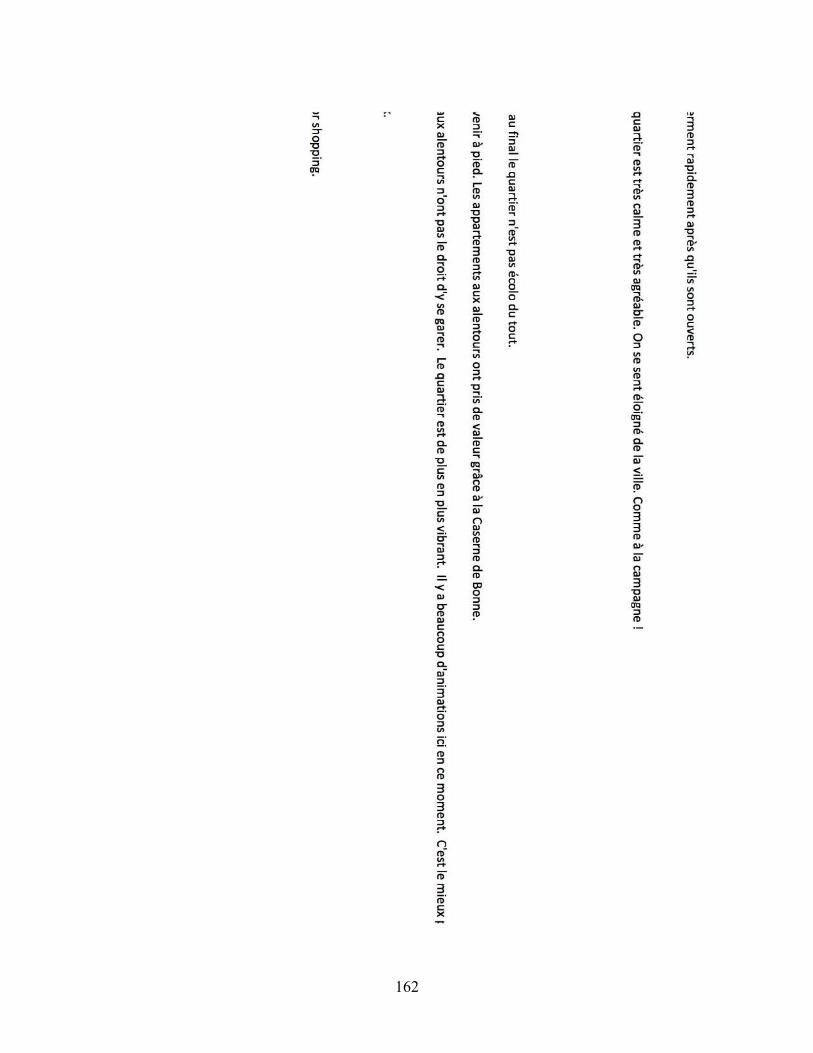
!162

Appendix D: Link to ESRI Story Map
https://www.arcgis.com/apps/MapTour/index.html?appid=41a0b7d569ee4af0ad08181b4ac59d3a
!163