Embed Size (px)
Citation preview

Planning for a Comprehensive Database on Aging Californians: Meeting Public Policy and
Research Needs for Better Information
Frank W. Neuhauser, Henry E. Brady, and Jason S. Seligman
Technical Assistance Program
CALIFORNIA POLICY RESEARCH CENTER
UNIVERSITY OF CALIFORNIA
SPECIAL REPORT

Planning for a Comprehensive Database on Aging Californians: Meeting Public Policy and
Research Needs for Better Information
Frank W. Neuhauser, Henry E. Brady, and Jason S. Seligman
Technical Assistance Program
SPECIAL REPORT

Copyright © 2003 by the Regents of the University of California All rights reserved California Policy Research Center
1950 Addison Street, Suite 202 Berkeley, CA 94720-7410 Phone: (510) 642-5514 Fax: (510) 642-8793 Publications ordering information: (510) 643-9328 Program and publications information: http://www.ucop.edu/cprc E-mail: [email protected]

About the California Policy Research Center and This Report The California Policy Research Center (CPRC) is a University of California program that applies the extensive research expertise of the UC system to the analysis, development, and implemen-tation of state policy as well as federal policy on issues of statewide importance. CPRC provides technical assistance to policymakers, commissions policy-relevant research, and disseminates research findings and recommendations through publications and special briefings.
This report is part of a state-commissioned project undertaken after California enacted Senate Bill 910 (Vasconcellos, Statutes of 1999, Chapter 948), mandating the Secretary of Health and Human Services to develop a plan to address the impending demographic, economic, and social changes triggered by the state’s aging and increasingly diverse population. The Uni-versity of California was asked to conduct the data analyses and provide background infor-mation needed to formulate this plan. CPRC has been coordinating this effort over the past three years, drawing on research experts from UC and other institutions. A faculty working group, chaired by Professor Andrew Scharlach (School of Social Welfare, Berkeley), helped guide the project. As SB 910 mandated “the development of a plan for a longitudinal data base of Califor-nians,” the authors were charged with assessesing the data the state already collects and where the gaps are, what questions the state needs to ask to project resource and service needs for policy planning purposes, and how the questions can be answered by enhancing and linking data that currently exist as well as selectively collecting new data, recognizing resource constraints. The authors wish to acknowledge the cooperation and assistance of many individuals within the California Department on Aging, the Community Care Licensing Division, local Area Agencies on Aging, and the Long-Term Care Integration Project who assisted in this effort. Also, we thank our university collegues, Charlene Harrington, Robert Newcomer, Teresa Dal Santo, and Jon Stiles for the assistance and time they donated to this effort. We appreciate Andrew Scharlach’s substantial contributions to the substance and structure of this report, as well as his many valuable editorial suggestions at all stages of the writing. Finally, this report would not have been possible without the direction of Holly Brown-Williams and the editing skills of Joan Lichterman at the California Policy Research Center.
About the Authors
Frank W. Neuhauser, MPP, is a project director at the Survey Research Center, University of California, Berkeley. Henry E. Brady, PhD, is a professor of public policy and political sci-ence at UC Berkeley, where he also directs the Survey Research Center and UC DATA. Ja-son Seligman, PhD, is a faculty research economist and policy analyst at the Carl Vinson In-stitute of Government at the University of Georgia at Athens. He contributed to this project while completing a doctoral program in economics at UC Berkeley.
The views and recommendations in this report are those of the authors and do not necessarily represent those of the California Policy Research Center or the Regents of the University of California.


v
CONTENTS
Executive Summary .................................................................................................................... ix Introduction ...................................................................................................................................1 Designing a Longitudinal Database .............................................................................................2
Estimating Needs of the Over-60 Population ..........................................................................3 Estimating the Population Meeting Earnings and Disability Eligibility Requirements ......3 Estimating Asset Eligibility Requirements..........................................................................5 Linking Service and Population Data to Estimate Local Demand ..........................................6 Current AAA Data Collection .................................................................................................7 Strategies to Improve Data Collection ...................................................................................11 Creating and Updating Local-Area Demand Estimates .........................................................14 Residential-Care Facilities .........................................................................................................18 Current Data Resources Related to RCFEs ...........................................................................19 RCFE Data-Collection Strategies ...........................................................................................21 Extracting Data .................................................................................................................22 Sampling Methods .............................................................................................................23 Permission Issues ..............................................................................................................24 Survey’s Value ..................................................................................................................24 Nursing Homes, In-Home Support Services, and the Multipurpose Senior Services Program ...................................................................................25 Long-Term Care Integration Project ......................................................................................25 Adding Data to the LTCIP ................................................................................................26 Summary of Recommendations .................................................................................................28 Coordinating These Efforts .....................................................................................................30 Appendixes 1. Income-Tested Programs ...................................................................................................31 2. Definitions of ADL and IADL ...........................................................................................32 3. Census Questions Describing Key Issues for Local-Area Demand ...................................33 4. Recommended ADL/IADL Questions for the California Health Interview Survey ..........35 5. National Data and HRS: Comparing California to the Nation as a Whole ........................37

vi
TABLES 1. NAPIS Reporting ...................................................................................................................7 2. Missing Data Across Key AAA Categories .........................................................................10 3. Minimum Dataset of AAAs .................................................................................................12 4. Distribution of Program Participants by Race/Ethnicity .....................................................16 5. Identification and Emergency Information—LIC 601 ........................................................20 6. Physician’s Report for Residential Care Facilities for the Elderly—LIC 602A .................20 7. Functional Capability Assessment Data—LIC 9172 ...........................................................21 8. LTCIP Data Elements ..........................................................................................................26 9. Minimum Data Set (MDS) Data Elements ..........................................................................27 10. LTCIP Coverage Across Population Segments of Californians Age 60 and Over ..............28
FIGURES 1. Timeline of Service Delivery .................................................................................................2 2. Percent of Each PSA’s Unique Client Count in Selected Programs .....................................8 3. Average Number of Services per Client Across CDA Programs and AAAs, FY 99/00 .......8 4. Age and Gender Distribution Across Counties for Population Over 60 ..............................15 5. Comparing Home-Delivered Meal Demand and Racial/Ethnic Distribution ......................17 6. Estimates of the 65+ Population in Residential Care ...........................................................18 7. Distribution of Facilities and Capacity by Size of RCFE ...................................................22

vii
EXECUTIVE SUMMARY This report offers a comprehensive plan for achieving one of the goals of California’s Senate Bill 910 (Vasconcellos, Statutes of 1999, Chapter 948): to improve data collection in order to for-mulate public policy and legislative action, as well as allocate resources so as to better serve California’s aging population. Our plan acknowledges that, in general, present state administrative data have several weak-nesses that hinder their usefulness for policy decisions. Improving data quality and creating an integrated database will require the cooperation of several state and local agencies and local-area providers of aging services; it will also require some additional state resources to expand research efforts. We refer to our plan as a Comprehensive Database on Aging Californians, which is predicated on filling the present gaps in data without a great deal of expense and effort. To conceptualize a strategy to gather data on the aging population, it is useful to consider services as being delivered to populations with varying levels of disability, age, and resulting needs for care and resources during their lifespan. In most cases, present data on program participation are quite detailed and are a valuable resource. With these data, the state can develop a record identifying participants’ initial contact with any service and progressively track service use for those who use more than one program. The answer to many questions begins with an understanding of the affected population. Program participation is determined by the needs of the population using programs financed by the federal, state, and local governments and their respective eligibility requirements, including:
< Age < Maximum income limits < Disability status < Assets
We have identified three main data sources for developing the necessary population estimates along these demographic dimensions:
< The Decennial Census offers demographic characteristics at very fine levels of geog-raphy. However, the census has two weakness: the data become outdated during the decade, and questions on disability are poorly matched to program disability descriptions that are key to determining eligibility.
< The California Health Interview Survey (CHIS), a collaborative project of the UCLA
Center for Health Policy Research, the California Department of Health Services, and the Public Health Institute, asks a set of questions specifically designed to provide county-level estimates on two key areas of program eligibility: disability status and household income.
viii
< The Health and Retirement Survey (HRS) is a panel of 22,000 Americans over the age of 50 who are questioned every two years concerning a vast array of issues important to aging. In particular, the survey contains an in-depth series of questions on assets. Because this is a panel survey, the spend-down of assets over time can be observed for individuals with different demographic characteristics.
Linking Service and Population Data to Estimate Local-Area Demand Under the Older Americans Act, Congress requires states to report certain data on clients using services provided through Area Agencies on Aging (AAAs), which coordinate a wide array of services at the community level to seniors and adults with functional impairments. The National Aging Program Information System (NAPIS) tracks these data on more than 500,000 Califor-nians who receive services each year in 33 planning and service areas (PSAs). These data could constitute the link between demographic estimates and service use—an early, key link in creating a comprehensive database. Important questions to ask are,
< How well are these data collected? < What key improvements may be necessary to make the data useful for strategic planning?
We have serious concerns about the quality of data the AAAs currently report to the state. First, the data are reported as aggregate statistics and cannot be used for detailed analysis. Second, there are substantial unexplained variations among AAAs with regard to the composition of service demand among agencies, and the average number of services per client in various programs. For example, at least one PSA reports that 90% of its clients receive home-delivered meals and only 10% receive any other service, while other PSAs report that fewer than 18% of their clients receive home-delivered meals. In addition, the average number of services per client differs by a factor of 10 across AAAs. These surprising variations may indicate gaps in reporting. In the majority of cases AAAs contract with providers, usually nonprofits and religious organiza-tions, to deliver services. Because providers’ purpose and training emphasize service delivery rather than data collection, it is often a challenge to obtain high-quality data. For planning purposes, the CDA and other departments need to place a clear emphasis on data collection—including contractual language, financial incentives related to data quality, and auditing of data quality. After examining the completeness of reporting across a number of different providers, we noted several key points:
< Data collection is reasonably good for some types of administrative data: name, zip code, sex, age, and race/ethnicity are reported 90% of the time.
< The Social Security number is missing almost a quarter of the time. This number is the
key linking element between various datasets, and its absence hinders more-complete reporting.

ix
< Other important elements are poorly reported, such as “lives alone” and “income,” especially when clients are registering for specific programs that do not involve income-related eligibility criteria.
< Some PSAs currently add elements beyond the NAPIS requirements, such as education,
but such elements are often poorly reported in administrative data because they appear to be only tangentially related to service delivery.
Strategies for Improving Data Collection The Department of Aging has sponsored major initiatives that have moved the state significantly toward achieving the goals described in this paper. Its pilot projects also have created the tools for using data in ways that substantially enhance the services delivered by state and local agencies. The data-collection strategies all make use of Internet connections to transfer individual-level client registration information and service use between providers and AAAs, with data going in both directions. By creating electronic databases for AAAs, they also allow the state to easily merge data across jurisdictions. Broad implementation of these pilot efforts is likely to be delayed significantly unless the state commits resources for upgrading existing systems. Such a commitment may be difficult in the present highly restricted fiscal environment, but these AAA efforts are at a crucial stage, and the state should not miss the opportunity to build on the momentum and advances of successful pilot efforts. Some aspects of the data-gathering effort should be standardized. Relevant agencies need to agree on a minimum set of data elements, and AAAs and providers should be required to implement a system to collect these data. We suggest a minimum dataset to provide the necessary data in a way that enables linkage with other data sources. Constant monitoring of client data is necessary for improving data quality, and Internet connectivity offers an excellent opportunity to achieve it. The pilot projects we studied link client and service data to a central database using secure real-time Internet connections, which enables the identification of incomplete cases for update at the next client contact. Creating Local-Area Demand Estimates Accurate estimates of demand for services are important for program planning and distributing the state’s resources across AAAs as well as distributing local agency resources among programs. These program-demand estimates depend on 1) local population characteristics, 2) program eligibility requirements, and 3) the link between demographic characteristics and service take-up rates. By using demographic data in conjunction with information on program participation along similar demographic dimensions, it is possible to identify the portion of the population in a local area that would be expected to use particular services. This application of linked data resources is described in the report.
x
Residential-Care Facilities for the Elderly Residential Care Facilities for the Elderly (RCFEs) are an important component of the options available for California’s aging population. The Community Care Licensing Division (CCLD) of the Department of Social Services currently licenses 6,200 RCFEs with approximately 147,000 beds—facilities for approximatley 4% of the state’s population age 65 and older. Because residents’ median length of stay is short relative to the life-expectancy of Californians reaching 65 years of age, the percent who are likely to reside in RCFEs at some point in their lifetime is around 32%. However, our knowledge of residential care facilities is quite poor. Current data systems do not even allow the CCLD to determine how many residents are in RCFEs at any point in time. The more-complicated task of determining how many residents pass through the system, or a distribution of residents’ length of stays and characteristics and health status, is completely beyond current data-collection efforts. Several forms are important potential sources of administrative data on RCFE residents:
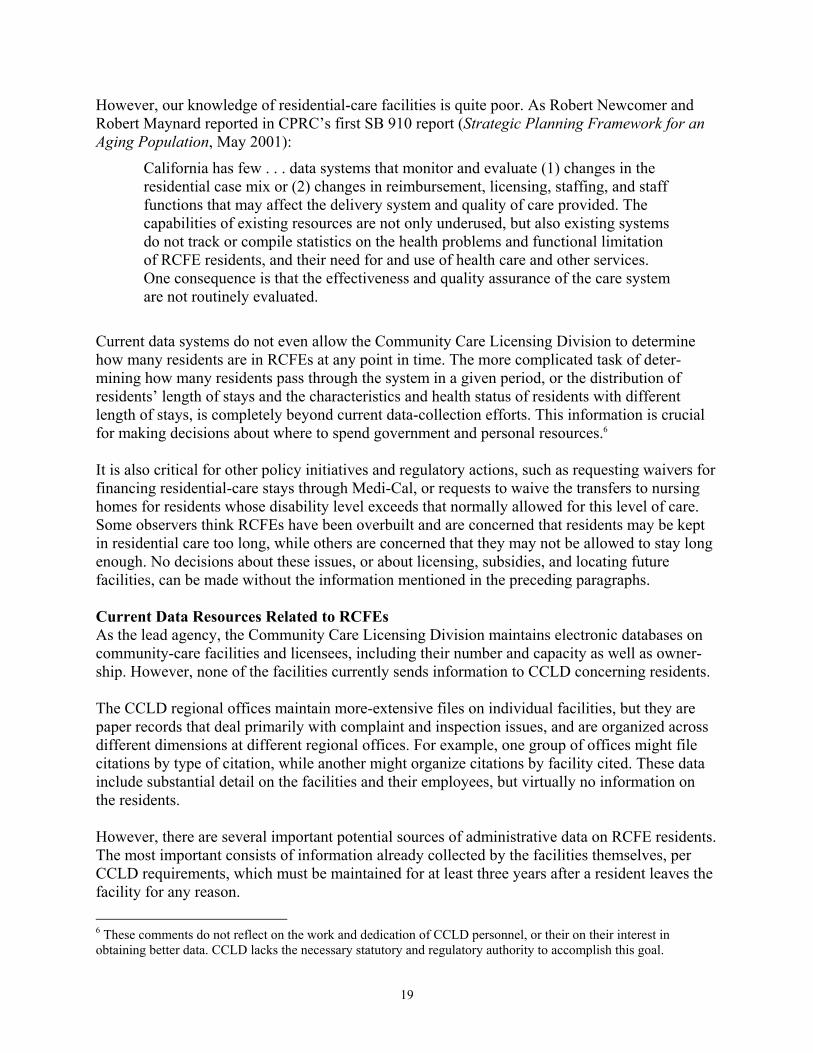
< LIC 601—Identification and Emergency Information: contains basic identification information about each resident, demographic data, length of stay, and secondary contact information.
< LIC 602A—Physician’s Report for Residential Care Facilities for the Elderly: contains a rich description of medical and disability status at admission.
< LIC 9172—Functional Capability Assessment: filled out at admission; includes data on a broad series of functional limitations and is updated periodically.
These data are maintained for three years after the resident leaves the facility. Consequently, triennial sampling of records is sufficient to enable the construction of histories for RCFE residents. RCFE Data-Collection Strategies A number of strategies are evaluated in the report. The preferred strategy involves requiring RCFEs to collect administrative data on a 10% sample of residents using the last digit of their Social Security number; reporting on current and past residents in the 10% sample only once every three years; and using CCLD personnel to monitor the data reporting as a part of their regular facility audits. This data-collection strategy focuses state resources on data quality while limiting the RCFEs’ collection burden. A survey would provide important additional data on RCFE residents, as the administrative data lack detail on a number of issues that are key to understanding the transition to assisted living, such as residents’ and/or their families’ motivation for choosing these living arrangements and how those choices affect the residents’ perception of their quality of life. These data can be linked to administrative data on the population and use of CDA services, and also to Medicare, Medi-Cal, SSI, In-Home Support Services, and other data sources identified in the following section. A complete picture can thus be created about decisions to enter assisted-living facilities, which house a growing portion of the aging population.

xi
Nursing Homes, In-Home Support Services, Multipurpose Senior Services Program The most resource-intensive services are those supplied through nursing homes or their alterna-tive: intensive in-home services for the disabled elderly. Because the majority of these services are supported by federal and state governments through Medicare, Medi-Cal, and SSI, detailed transaction records are available to account for the services. In addition, because this population is particularly vulnerable to fraud and abuse, regulations require the collection of substantial data on client demographics and disability characteristics. We believe the Long-Term Care Integration Project (LTCIP) is the obvious candidate to con-tinue developing the data in this area by bringing together several additional resources not yet included in its datasets. This project, a joint effort by the University of Southern California and the University of California, Los Angeles, integrates a number of databases on long-term care, including clients receiving government support payments for nursing-home stays, In-Home Sup-port Services (IHSS), and the Multipurpose Senior Services Program. The data are complex and difficult to organize usefully for analytical purposes. Nonetheless, LTCIP has created a thoughtful and sophisticated solution to the problems of organizing them, resolved the access and confidentiality issues with the agencies supplying the data, and has com-pleted a major portion of the time-consuming work needed to integrate these resource-intensive services into a Comprehensive Database of Aging Californians. Our discussions with LTCIP suggest adding new data on nursing-home residents, which pres-ently are not available to LTCIP; extending the period of data capturing to include periods before and after recipients of care are participating in a covered program; and including a subsample of all aging Californians in Medicare data, even those who are not participating in programs cov-ered by the LTCIP at present. The current data do not afford researchers a control group for analysis in several areas. A Comprehensive Database on Aging Californians must include not only a sample of the popula-tion in programs, but a sample of the entire over-60 population. Statistical inference to popula-tions, the cornerstone of much policy analysis, is dependent on accurate estimates of the whole population. Adding at least a sample of all Medicare/ Medi-Cal and SSI support-payment histo-ries would provide a more complete picture of service use, medical conditions, and potential fu-ture needs of the entire aging population, as most of this population cohort is eligible for Medi-care. Summary of Recommendations < Focus on improving the data collected by local Area Agencies on Aging and their providers.
Each provider should be required to collect at least a minimum dataset for each registered client.
< Assist local AAAs with developing the hardware and software infrastructure to capture
these augmented data effectively in an administrative database.

xii
< Arrange data transfers from individual PSAs to a database that combines data across PSAs. Such an approach would provide an important advance in delivering client services, especially for those who move or use adjacent service areas, and would be a bonus to the development of a comprehensive database.
< Do not require a single technical standard. All of the systems we studied were compatible
for this purpose. CDA should 1) direct collection of the minimum dataset; 2) recommend a format for recording the data elements; 3) standardize the descriptions of ADLs and IADLs; and 4) continuously evaluate the quality of the data.
< The Community Care Licensing Division should initiate an effort to capture data on a 10%
sample of the RCFE population every three years, using a rotating schedule of one-third of the RCFEs as specified by the division. CCLD auditors would check data quality on a subsample of the 10% sample as part of its regular audit.
< Gather a sample of about 100 files from a number of RCFEs, and review them to determine
which data could be extracted and how to construct a data form. After reviewing the proposed data elements and the form, CCLD should ask one or more of the RCFE associations to recruit volunteer facilities to participate in a pilot project to test the time required to obtain the data and ensure their quality.
< Convene a group of interested parties to explore the development and administration of a
survey of RCFE residents. < Require, by statute or regulation, that nursing homes report the federally mandated
minimum data elements to the state as well as the federal government. < Expand LTCIP to include data from all counties, data from nursing homes, and a sample of
all people over 60 receiving Medicare/Medi-Cal. < When the California Health Interview Survey data become available in late 2003, CDA
should create the demand estimates at the PSA level that are discussed in the section on creating and updating local-area estimates.
< Create public-use files to be made available to researchers, state agencies, local-area
agencies, and other parties. Coordinating These Efforts The obvious candidate to take overall responsibility for coordinating these efforts, and for even-tually linking the data into a Comprehensive Database on Aging Californians, is the Long-Term Care Council. The LTCC already supplies state-level leadership in coordinating a long-term care system. As multiple departments are represented on the council, coordinating the database effort should become a component of the LTCC’s mission.
1
INTRODUCTION
In 1999 the California Legislature passed Senate Bill 910 (Vasconcellos, Statutes of 1999, Chapter 948), a major initiative to improve understanding of the needs of California’s aging population. A key component was an effort to improve data collection in order to formulate public policy and legislative action, as well as allocate resources and provide services. The legislation mandated “The development of a plan for a longitudinal data base of Californians” [9101.5 (a) (1) (C)]. This report offers a comprehensive plan for achieving that goal. The state already gathers data that are rich in detail and implications for public policy, and which can be linked to create a longitudinal portrait of aging Californians. However, improving data quality and weaving these threads together into an integrated database will require the coopera-tion of several state and local agencies, local-area providers of aging services, as well as some additional state resources to expand research efforts. A number of approaches have been considered for creating such a portrait. At one extreme is the creation of a longitudinal survey of successive age cohorts, similar to the federally financed Health and Retirement Survey of a national sample of aging Americans. This kind of survey would provide a rich and detailed picture of California’s aging population, but only after a number of years and substantial expense. At the other extreme, one could assemble past, current, and future administrative data relatively quickly and cheaply to yield a more-limited picture with a number of gaps. In between these endpoints, without a great deal of expense and effort, the state could assemble both current administrative and survey data and fill in the gaps with additional administrative and survey resources. This approach, which we describe and refer to as the Comprehensive Database on Aging Californians, will create a rich and detailed data resource relatively quickly and within reasonable resource constraints. We also explore its strengths and weaknesses relative to the alternatives. The plan we present acknowledges that, in general, present state administrative data are poor and provide an insufficient basis for policy decisions. However, the resources needed to obtain adequate data are required in any case to meet federal reporting standards. These data are also needed to make policy decisions about allocating overall state resources, and allocating aging resources appropriately. The California Department of Aging (CDA) has sponsored major initiatives that have moved the state significantly toward achieving the goals described in this paper. Its pilot projects also have created the tools for using data in ways that substantially enhance the services delivered by state and local agencies. It is precisely the nexus of these pilot-project efforts, provision of informa-tion for public policy purposes, and advances in service delivery to the target populations that make our proposals attractive in an environment of limited resources and increasing demand. In the next section of the report we review the overall conceptual structure of the Comprehensive Database on Aging Californians. In subsequent sections we evaluate demographic data on the

2
aging and disabled population, participation data for CDA programs, residential care facilities, nursing homes, and in-home support services. In each section we address questions of data quality, coverage, and linking, and recommend needed improvements. In the final section we summarize the recommendations we make throughout the report and discuss overall coordination of the effort to create a comprehensive database.
DESIGNING A LONGITUDINAL DATABASE To understand how a longitudinal database on services needed by elderly Californians would be constructed from various data resources for strategic planning purposes, it is useful to concep-tualize different levels of program use, as shown in Figure 1.
Figure 1
Timeline of Service Delivery
While the figure above suggests a linear and discrete use of resources, it is important to keep in mind that many programs overlap, and people may use some programs and not others. For example, people living in residential care facilities may receive services from a local Area Agency on Aging (AAA), and others might live in a residential care facility for a short period and never receive additional services. To create a strategy to gather data on the aging population, it is useful to think of services as being delivered to populations, moving from left to right, with varying levels of disability, age, and resulting needs for care and resources. Consequently, by gathering data on program participation, the state can develop a record based on identifying participants’ initial contact with any service and the progression of service use for those who use more than one program. In most cases, present data on program participation are quite detailed and can offer the state a valuable resource. However, numerous gaps and limitations reduce their usefulness. In the following sections we will describe the data being collected at each level and important improvements that should be undertaken to maximize the value of these data when integrated into a longitudinal database. First we will discuss how the state as well as local jurisdictions
Cal
iforn
iaPo
pula
tion,
60+
CA
AA
C
lient
s/Se
rvic
es
Res
iden
tial C
are
In-H
ome
Supp
ort
Serv
ices
Nur
sing
Hom
es

3
could create descriptions of area populations as a starting point for estimating demand for services. Estimating Needs of the Over-60 Population To determine how best to spend finite resources on social programs and infrastructure needs for California’s aging and disabled population, one might sensibly highlight three dimensions and ask, Where is the greatest unmet demand geographically? How should resources be distributed among programs? How will the demand between local areas change over time? The answer to these questions begins with an understanding of local population needs and the intersection of these needs with programs financed by the federal, state, and local governments and their respective eligibility requirements. The following eligibility levels apply:1
< Age. Some programs have no eligibility requirements other than age. Congregate Meals and legal assistance are two examples.
< Maximum income limits. Several programs ration services on the basis of meeting the
needs of low-income clients first. Usually, the limit is set relative to the poverty line. For example, the Title V-Community Services Employment Program uses 125% of the poverty line. (See Appendix 1 for a list of income-tested programs and those for which poverty status is reported, but not controlling.)
< Disability status. Several programs determine eligibility on the basis of a specific lim-
itation or multiple limitations on activities of daily living (ADLs) and/or instrumental activities of daily living (IADLs). (See Appendix 2 for a description of ADLs and IADs.) Examples of these programs include Homemaker/Chore Services and Assisted Transportation.
< Assets. Among the most important eligibility criteria is the limit on assets. Substantial
spend-down of assets may be required before a client qualifies for income or housing support (e.g., residential-care assistance and nursing-home support).
Given these eligibility requirements, potential demand depends on the size of the population that meets these criteria. Ideally, demographic data available to the state and local areas would allow any jurisdication or service area to estimate relevant populations for each geographic area and program combination.
Estimating the Population Meeting Earnings and Disability Eligibility Requirements California has two outstanding data sources that could be used at this first stage in the devel-opment of the Comprehensive Database on Aging Californians: census data, including the 1 These categories are created to highlight the various constraints on participation. In application, these eligibility requirements overlap in a number of ways. For example, while some aging programs use age as a primary eligibility criterion, they may also target services to individuals with “social or economic vulnerability.” Again, determining eligibility and share of cost under Medi-Cal coverage typically involves consideration of both asssets and income.

4
Decennial Census and the annual American Community Survey, as well as the California Health Interview Survey. The Decennial Census offers demographic characteristics at very fine levels of geographic disaggregation. For example, basic population numbers are available at the “census block” level, approximately equivalent to a city block in dense urban settings. Limited, standard demographic data also are made available when block data are aggregated to “census tract” level, areas with average populations of about 4,000. The census-tract populations can be aggregated to give basic demographic data on specifically defined areas—for example, the area covered by a specific provider for a local Area Agency on Aging. With the Public Use Microdata Sets (PUMS), which are extracted from the Decennial Census, it is possible to create specific, customized data descriptions. These are data on individuals and are useful for analyzing specific groups, such as income distributions for area populations over age 60. The minimum area covered by PUMS consists of a population of approximately 100,000. Since the geographic boundaries of PUMS Areas are determined by local groups in consultation with the Census Bureau, they are usually coincident with cities, counties, and other important metropolitan areas—making them quite well matched to AAA boundaries. Using the Decennial Census has two important weaknesses for our purposes. First, the data become outdated as one gets farther from the census year, especially in a state like California, which experiences large population flows. Using the American Community Survey (ACS) will counter this weakness. This annual survey is smaller than the census, and was planned to create annual updates at the PUMS level. Assuming that Congress makes continued funding available, the ACS could give current estimates of important population characteristics for the over-60 age group. The second weakness of these data applies to the ACS as well as the Decennial Census. Ques-tions about disability status (see Appendix 3) are very limited and inappropriate for estimating program demand where the number and nature of disabilities determines eligibility or is likely to be a crucial determinant of whether an individual who is eligible actually chooses to participate in a program. Fortunately, the California Health Interview Survey (CHIS), a collaborative project of the UCLA Center for Health Policy Research, the California Department of Health Services, and the Public Health Institute, asks a set of questions specifically designed to capture two key areas of program eligibility: disability status and household income. (See Appendix 4 for questions proposed for the 2003 CHIS.) CHIS—a telephone survey conducted every two years on public-health topics and access to health care—is the largest state health survey in the United States. With a sample size of 70,000 households and an oversampling of the older population, the survey is appropriate for estimating most key questions at the county level, except for the least-populated counties. Since CHIS is designed to give county-level estimates and nearly all AAAs are matched to counties or combinations of counties, the CHIS offers an ideal dataset for estimating local-area characteristics involving health, disability, and socioeconomic status.

5
Thus, the first step in creating a comprehensive database on older Californians would be to use the ACS and the CHIS to create estimates of eligible program populations at the level of both local Area Agencies on Aging and counties.2 These estimates would be straightforward for a university or research organization familiar with census and CHIS data. Estimates could be updated every two years as new ACS and CHIS data become available.
Estimating Asset Eligibility Requirements In the previous section we discussed program eligibility requirements for CDA programs and how different datasets could be used to create estimates of program demand. Estimating program demand is much more difficult for nursing-home care, In-Home Supportive Services, and the Multiservice Senior Services Program because the key requirement is personal assets. It is par-ticularly difficult to gather data on individual assets because a number of evaluations must be made, which the affected individual may not even know. In addition, some assets may be excluded, such as primary residence and one automobile. Because assets can be volatile (witness recent stock-market fluctuations), assessing assets, spend-down, and the changing nature of asset distribution for the aging population over time is very important for assessing program demand and projecting state and local government expenditures. There are two approaches to creating reasonably complete asset data to integrate with the Comprehensive Database on Aging Californians. First, California can take advantage of the extensive data on assets, health, retirement, and residence choices contained in the federal government’s Health and Retirement Survey (HRS). HRS is a panel of 22,000 Americans over the age of 50 who are surveyed every two years. The questions cover a vast array of issues important to aging. In particular, the survey contains an in-depth series of questions on assets. Since this is a panel survey, the spend-down of assets over time can be observed for individuals with different demographic characteristics. Because the HRS is a national survey, the samples are too small for many analyses at the state level. Also, the public-release HRS data is available only at the regional level, so state-level evaluations are not possible without special access. In Appendix 5 we explore the comparability of estimates based on regional versus national data. The implication of the analysis is that regional data, where sample sizes are sufficient for most analyses, would be reasonable approximations of state-level parameters. However, moving from there to the county level, where programs are administered, would increase problems with estimation. Consequently, the state should consider an additional strategy: funding an expanded sample of the HRS for California. The current panel of the HRS was begun in the early 1990s. At that time, one state, Florida, funded an expanded sample that
2 Area Agencies on Aging contract with service providers, e.g., nonprofits, to provide the actual aging services. In large geographic or population areas a number of providers may supply services in specific locations. For example, the AAA for the City of Los Angeles divides its area into nine separate geographic service areas, with separate providers covering each area. When AAA areas are subdivided into service areas for dense metropolitan popula-tions, specific service-area characteristics probably could be estimated, especially when census data are the only data required.

6
allowed sufficient sample size for many state-level analyses. A second panel of the HRS is currently being planned that would draw a new sample of Americans over the age of 50 who would be followed up every two years, like the current panel. As a long-term strategy to create a longitudinal picture of aging Californians, funding an expanded sample would likely be a more cost-effective approach than creating a separate California counterpart to the HRS.3 Since the fixed cost of an extensive panel survey is high, the marginal cost of adding an expanded sample of Californians may be relatively inexpensive compared to a California-specific effort that mirrored the HRS. Also, HRS is interested in oversampling Asian Americans in this second panel. Because a California oversample is one way to include more Asian Americans, the HRS may be willing to absorb some of the cost of the California-specific oversample. Furthermore, the HRS oversample may enable California to re-duce the overall size of its own data-collection effort—as long as the state is content to commit itself to the HRS battery of questions or a strict subset thereof.
However, as indicated above, eligibility is only one determinant of demand. Many people who are eligible do not use available services by choice, lack of knowledge, limits on access, and other reasons. The percent of the eligible population using a program is often referred to as the “take-up” or accession rate. Estimating potential program demand requires estimating the take-up rate for the eligible population. These rates are very important for locating services and allocating resources between various services within local jurisdictions. In the next section we discuss how to link program-participation data and population data to make, continually update, and improve estimates of take-up rates.
LINKING SERVICE AND POPULATION DATA TO ESTIMATE LOCAL DEMAND
As part of the reauthorization of the Older Americans Act in 1992, Congress required develop-ment of a reporting system on clients and service use. As a result, a National Aging Program Information System (NAPIS) has been developed and implemented in steps over the past 10 years. Each provider is required to report certain information on the number of clients served and demographic information on clients receiving “registered” services (those that require client registration as a condition of service). This database is a potentially rich link in a comprehensive database. Over 200,000 Californians take advantage of registered services each year though 33 local AAAs. Approximately 500,000 use either registered or unregistered services. Registered services are shown in the first two rows of Table 1. Unregistered services, which are less resource-intensive, are listed in row three. The data in columns two and three are collected as aggregate statistics at the state level and cannot be linked to other datasets. However, at the local level, the data are collected at the individual client level as part of the registration process required under the 1992 reauthorization. Data collection is undertaken by providers, usually nonprofit organizations, delivering services
3 We are currently trying to obtain information on the cost of an expanded sample and information about Florida’s experience using their state-specific sample.

7
for the AAAs. These data, if captured accurately and completely at the provider level and brought together, could constitute the link between demographic estimates and service usage—an early, key link in a comprehensive database. Important questions to ask are, How well are these data collected? and What key improvements may be necessary to make the data useful?
Table 1
NAPIS Reporting
Programs Data Requirements Client Detail
Personal Care, Homemaker, Chore, Home Delivered Meals, Social Adult Day Care/Adult Health, Family Caregiver Support
Unique client counts Service units
Race/ethnicity, age group, ADL/IADL, rural status, lives alone, poverty status
Congregate Meals, Nutrition Counseling, Assisted Transportation
Unique client counts Service units
All of the above except ADL/IADL
Transportation, Legal Services, Nutrition Education, Information and Assistance, Outreach
Unique client counts Service units
No detail
Current AAA Data Collection Even with these very limited data collection requirements NAPIS imposes, we have major concerns about the quality of data the AAAs currently report to the state. Area agencies could not explain the significant differences in the composition of service demand across AAAs. For example, service demand for the same programs differed substantially across agencies of similar size, and some areas appear to report an unreasonably high number of services per client. For these reasons we investigated the NAPIS data reported to the Department of Aging, and summarize the results in figures 2 and 3. Figure 2 presents the distribution of unique clients by programs at local-area agencies. Each client-program combination can be a “unique” client. That is, if clients participate in two programs, then they are counted twice as unique clients, once for each program. The composition of reported demand differs quite dramatically across AAAs and the 33 geographic areas they cover, which CDA refers to as planning and service areas (PSAs). For example, the percent of clients using congregate meals, as reported by AAAs, ranges from 0 to 90% of reported unique clients. Even ignoring the zeroes as reporting errors, the data still exhibit extreme ranges of 18 to 90% for congregate meals, 10 to 50% for home-delivered meals, and similar relative variances for other programs. This means, for example, that at least one PSA reports that 90% of its clients receive home-delivered meals and only 10% receive any other service, while other PSAs report fewer than 18% of its clients receiving home-delivered meals. These variations are surprising and may indicate gaps in the reporting.

8
Figure 2Percent of Each Planning and Service Area's Unique Client Count in Selected Programs
0%
20%
40%
60%
80%
100%
Hom
emak
er
Link
ages
Alzh
eim
er D
ay C
are
Assi
sted
Tran
spro
tatio
n
Con
greg
ate
Mea
ls
Cas
e M
anag
emen
t
Adul
t Day
C
are
Hom
e M
eals
As an alternative, look at reported demand across PSAs in Figure 3, which presents each PSA’s reporting to CDA of the average number of services per client for select programs. Data on services per unique client are reported on the Y-axis using a logarithmic scale, so that each gridline represents 10 times the number of services of the next-lower gridline. The average services per client within each program differs by a factor of 10 across local-area agencies.
Figure 3Average Number of Services per Client (Service Units/Total
Client Counts) Across CDA Programs and AAAs, FY 99/00
1
10
100
1000
10000
Serv
ice
Uni
ts/T
otal
Clie
nt C
ount
s
Pers
onal
ca
re
Hom
e m
eals
Cho
re
Hom
emak
e
Nut
ritio
n
Con
g.M
eals
Cas
e M
anag
emen
Adul
t Day
C
are
Non
R
egis
tere
d
Assi
sted
Tr
ansp
orta
ti

9
The extreme differences in the distribution of demand both across programs within PSAs and within programs across PSAs suggest the need for further research concerning possible explanations, such as:
< Underlying demand differences that characterize the population; < Differences in program awareness, such as those driven by language barriers; < Agencies’ responsiveness to clients, as demonstrated by success of program outreach
efforts or choices about resource distribution; or < Reporting errors at the provider and local-agency level.
With current data resources it is not possible to evaluate how much each of these explanations contributes to differences across PSAs. To the extent that these differences are driven by the first three explanations, it is evidence of the importance of creating accurate estimates of program demand for use by the state and local areas. To the extent that the differences reflect inconsistent or incomplete reporting, they provide strong evidence of the need to improve the quality of administrative data collection at the provider level. Although part of the explanation for the variation in Figure 3 may reflect real differences in demand, there is also clear evidence of substantial reporting errors. For example, some PSAs are reporting an average number of service units per unique client that exceeds the maximum number of units that are delivered to any client. For example, consider Home-Delivered Meals, where some PSAs report an average number of meals per client approaching and exceeding 1,000 per year. To construct a database from administrative data it is very important to consider the actual point of initial data collection. The intent of the Older Americans Act was that AAAs should focus mainly on community planning and development, expansion of services, and managing service providers, not being a service provider. Consequently, in the majority of cases AAAs contract with providers to deliver the services and providers—usually nonprofits and religious organizations—are the contact point with the clients. There are exceptions to this general rule. The CDA has made some services the general responsibilities of AAAs: information and referral/assistance, case management, program development and coordination, disease prevention, and elder abuse. However, by far the majority of services are contracted out, not delivered directly by AAAs. Because providers’ purpose and training focus on service delivery and not data collection, it is often a challenge to develop high-quality data from these sources. Unless the agencies place a clear emphasis on data collection—including contractual language, incentives related to data quality, and followup auditing of data quality—data will often be of poor quality. As an example, consider the completeness of the data curently collected. NAPIS reporting requires, but is not limited to, collection of the elements listed in Table 1. For example, regis-tration will normally include name, address, and contact information (telephone number). If clients are to be tracked to establish “unique” clients, then at least one unique data element should be included. This identifier can be a provider- or agency-assigned number or, more often, the client’s Social Security number. The latter has the obvious advantage that it can be used to
10
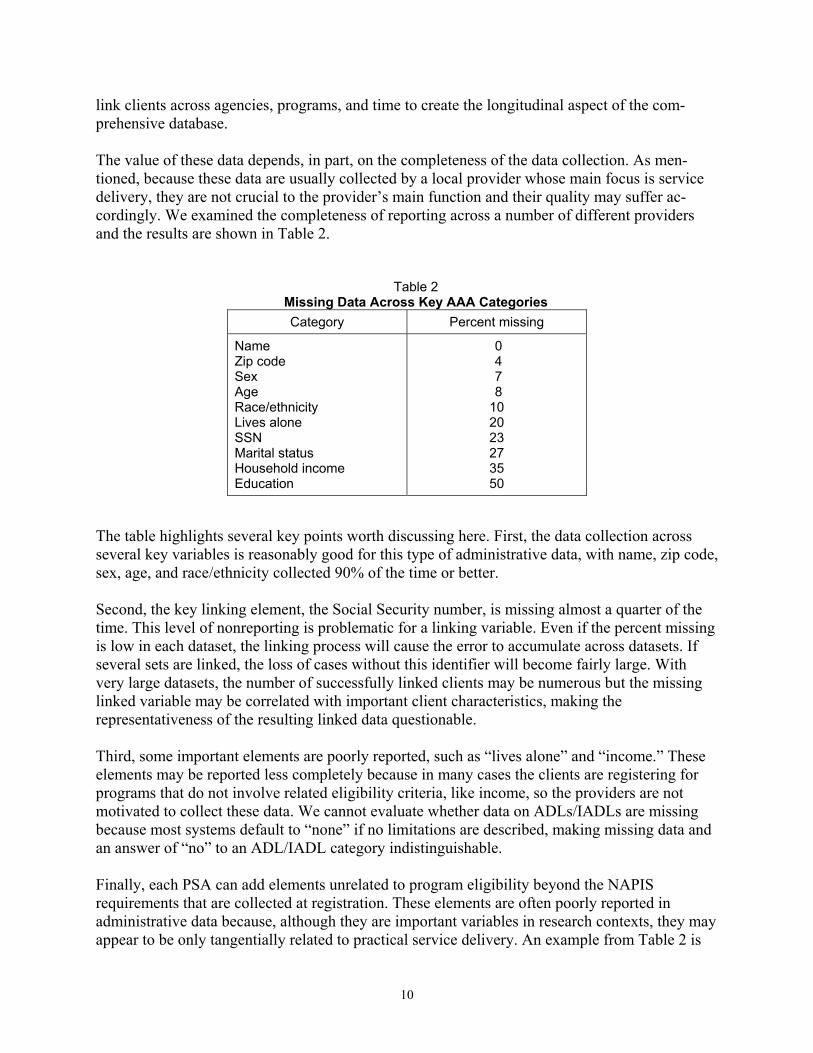
link clients across agencies, programs, and time to create the longitudinal aspect of the com-prehensive database. The value of these data depends, in part, on the completeness of the data collection. As men-tioned, because these data are usually collected by a local provider whose main focus is service delivery, they are not crucial to the provider’s main function and their quality may suffer ac-cordingly. We examined the completeness of reporting across a number of different providers and the results are shown in Table 2.
Table 2 Missing Data Across Key AAA Categories Category Percent missing
Name Zip code Sex Age Race/ethnicity Lives alone SSN Marital status Household income Education
0 4 7 8 10 20 23 27 35 50
The table highlights several key points worth discussing here. First, the data collection across several key variables is reasonably good for this type of administrative data, with name, zip code, sex, age, and race/ethnicity collected 90% of the time or better. Second, the key linking element, the Social Security number, is missing almost a quarter of the time. This level of nonreporting is problematic for a linking variable. Even if the percent missing is low in each dataset, the linking process will cause the error to accumulate across datasets. If several sets are linked, the loss of cases without this identifier will become fairly large. With very large datasets, the number of successfully linked clients may be numerous but the missing linked variable may be correlated with important client characteristics, making the representativeness of the resulting linked data questionable. Third, some important elements are poorly reported, such as “lives alone” and “income.” These elements may be reported less completely because in many cases the clients are registering for programs that do not involve related eligibility criteria, like income, so the providers are not motivated to collect these data. We cannot evaluate whether data on ADLs/IADLs are missing because most systems default to “none” if no limitations are described, making missing data and an answer of “no” to an ADL/IADL category indistinguishable. Finally, each PSA can add elements unrelated to program eligibility beyond the NAPIS requirements that are collected at registration. These elements are often poorly reported in administrative data because, although they are important variables in research contexts, they may appear to be only tangentially related to practical service delivery. An example from Table 2 is

11
the education variable. Education may be an important determinant of program accession, but because this is not relevant to a local provider’s immediate work, half of the time the providers fail to report the education information. In considering a set of data elements to collect through Area Agencies on Aging and/or their providers, it will be helpful for the CDA to standardize a list of carefully chosen data elements to limit the burden of collection. We outline a minimum list below. Strategies to Improve Data Collection Several important initiatives are under way to improve the quality and availability of the local-area agency data, reflecting diverse motivations and approaches. Some of these efforts reflect the results of pilot programs funded under multiyear experimental grants. Others reflect local-agency efforts to improve their own information. A number of efforts build on software and platforms that are common across several local service areas. Some are built specifically for a single jurisdiction. Generally, there does not seem to be an overwhelming reason to insist on a single approach, platform, or software package. The approaches we reviewed seemed robust enough to work in conjunction with each other without the state imposing a single vision. Moreover, the advantages of allowing multiple approaches include the opportunity to encourage innovation and competition among suppliers, which should improve flexibility, ease of use, and cost over time. These data collection strategies all make use of Internet connections to transfer client registration information and service use between providers and AAAs, with data going in both directions. By creating electronic databases for AAAs, they also allow the state to easily merge data across jurisdictions. Although these approaches are compelling for all levels of service provision and planning, from providers to the California Department on Aging, their implementation is likely to be delayed significantly for a number of AAAs because of resource constraints. For example, two-thirds of the AAAs use the Senior Assistance Management System (SAMS) for NAPIS reporting. SAMS 2000, the newest version, will require the AAAs to upgrade their server hardware; the supplier stopped supporting the older version (3.0) at the end of 2002. A state commitment of resources for upgrading systems—whether SAMS, another commercial software package, or a locally developed system—could make the adoption of more detailed and complete reporting requirements attractive and feasible for local-area agencies. Such a commitment in the present extremely restricted fiscal environment may be difficult, but these AAA efforts are at a crucial stage, and the state should not miss the opportunity to build on the momentum and advances of successful pilot efforts to obtain needed information. Some aspects of the data-gathering effort should be standardized. First, the relevant agencies need to agree on including a minimum set of data elements, and AAAs and providers should be required to implement a system to collect these data. In addition, the CDA and AAAs need to track the quality of the data and develop incentives and performance measures for maintaining high-quality data. A particularly important link in data collection is AAA providers, where the actual transactions occur. Thus, an important component of the contract between an area agency and a provider should involve monitoring the accuracy and completeness of data across the key set of elements.
12
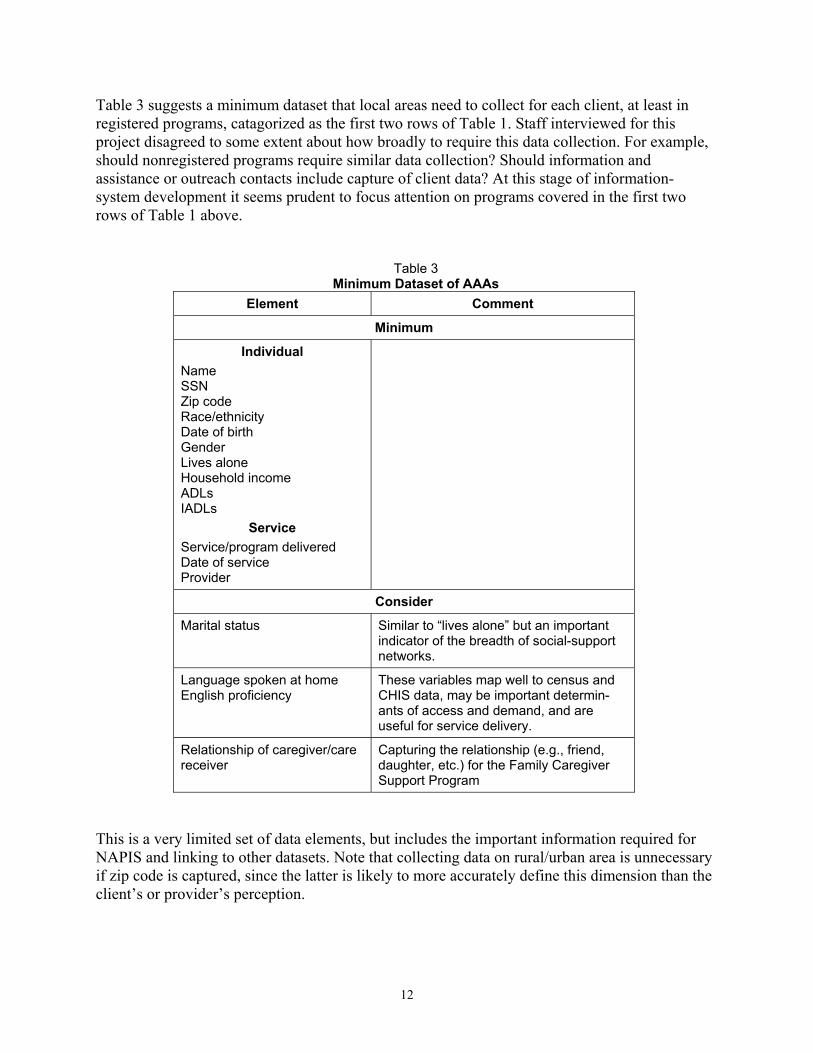
Table 3 suggests a minimum dataset that local areas need to collect for each client, at least in registered programs, catagorized as the first two rows of Table 1. Staff interviewed for this project disagreed to some extent about how broadly to require this data collection. For example, should nonregistered programs require similar data collection? Should information and assistance or outreach contacts include capture of client data? At this stage of information-system development it seems prudent to focus attention on programs covered in the first two rows of Table 1 above.
Table 3 Minimum Dataset of AAAs
Element Comment
Minimum
Individual Name SSN Zip code Race/ethnicity Date of birth Gender Lives alone Household income ADLs IADLs
Service Service/program delivered Date of service Provider
Consider
Marital status Similar to “lives alone” but an important indicator of the breadth of social-support networks.
Language spoken at home English proficiency
These variables map well to census and CHIS data, may be important determin-ants of access and demand, and are useful for service delivery.
Relationship of caregiver/care receiver
Capturing the relationship (e.g., friend, daughter, etc.) for the Family Caregiver Support Program
This is a very limited set of data elements, but includes the important information required for NAPIS and linking to other datasets. Note that collecting data on rural/urban area is unnecessary if zip code is captured, since the latter is likely to more accurately define this dimension than the client’s or provider’s perception.
13
The Family Caregiver Support Program (FCSP), introduced by the OAA Amendments of 2000, poses several special issues. This is a major new initiative to support the needs of caretakers for the long-term disabled. The minimum dataset described above should be collected on both the caregiver and care receiver. Some form of linkage will have to be maintained between both parties. This would include fields that would allow more than one caregiver to be linked to more than one care receiver (which is called a “many-to-many” linkage). The Department of Aging and UC Berkeley are jointly working on a plan to identify the data elements to collect for this program. The product of that effort should be incorporated into the comprehensive database on aging. An additional issue, specific to FCSP, is the importance of accurately recording the recipient of the specific service from caregiver to receiver. Since the AAAs supply this program directly, developing and maintaining good data standards and quality should be straightforward. Several additional data elements should be considered for inclusion in the minimum dataset for AAA programs. Marital status is commonly included in AAA collection. Whereas the element “lives alone” is probably more important for service delivery, demographers and sociologists associate marital status with important emotional and physical support networks of family and friends. Some AAAs collect information about the client’s primary language, which has obvious application to service delivery. This element also has been used innovatively by Web-based information systems at AAAs to focus client searches on appropriate service providers. One question to consider is whether to include English-language proficiency as an additional element for anyone listing another primary language. An argument in its favor is that language variable questions are also included in the census (Decennial and ACS) and California Health Interview Survey and can be coordinated with these data for analysis. Collecting a complete set of data on each client is important to avoid the bias that may result from systematically missing data on particular subgroups, such as non-English-speakers, as well as from inconsistent data collection by different providers who serve specific geographic areas with particular demographic characteristics. Avoiding potential bias is a strong argument for making data quality a component of service contracts between AAAs and providers. Constant monitoring of client data is an effective strategy for improving data quality, and Internet connectivity offers an excellent opportunity to achieve it. The pilot projects we studied linked client and service data to a central database using real-time Internet connections, which enabled flagging incomplete cases and requesting providers to update the information at a subsequent client contact. Some local-area agencies voiced concern about their ability to consistently collect data that are not specifically required by law for delivering services, and especially about participants’ willingness to report Social Security numbers and household income. AAAs also noted providers’ concern about the burden of data collection. Some systems attempt to improve data quality while limiting the burden of collection by collecting data on a random subset of clients. For example, the Employment Development Department (EDD) collects detailed demographic data on a 20% subset of claimants for Unemployment Insurance benefits, and only one in six households receive the long form of the Decennial Census.
14
One strategy to improve data but limit the burden on AAAs and their providers would be to collect basic data on all clients but focus particular attention on a subset, possibly asking more detailed questions of this group. For example, focusing on all clients with a Social Security number ending in 0 or 5 would capture the same-size sample as the EDD’s. If clients refuse to give this number, data collection could focus on those with birth dates ending in 0 or 5, capturing very close to the 20% sample. However, all effort should be made to capture the Social Security number, because it allows linkage across many databases. Given CDA’s large number of clients, a 10% sample is probably quite sufficient. If each AAA had reasonably accurate unique client counts, it would take only a short research project to estimate the statistical power of 10% and 20% samples across different types of analyses. Creating and Updating Local-Area Demand Estimates Accurate estimates of demand for services are important for program planning and distributing the state’s resources across AAAs as well as local agency resources among programs. As described above, these program-demand estimates depend on 1) local population characteristics, 2) program eligibility requirements, and 3) demographic characteristics that affect take-up rates. Demographic characteristics are a nexus between eligibility and access, and often are critical determinants of program participation. For example, although seniors are eligible for congregate meals on the basis of age alone, their participation in the program may be predicted by many demographic characteristics, including living arrangements, income, and age, that determine whether they are likely to need or want congregate meals, prefer to prepare their meals, or are able to travel easily to the congregate meal site. When local populations differ on basic demographic characteristics, planning and service areas may have very different distributions of program demand and participation. For example, using 2000 Census data,4 we split each of the 33 PSA’s populations along two dimensions reported under NAPIS requirements: gender and age (60–74, 75+). Figure 4 shows that even along these very basic dimensions, PSAs exhibited variations (between a factor of three and five) in the percentage of the local population within each group. To the extent that age and gender deter-mine program accession, local-area agencies will face very different demands because of differences in population characteristics.
4 Census of Population and Housing, 2000 [United States]: Summary File 3 [computer file]. Washington, D.C.: U.S. Department of Commerce, Bureau of the Census [producer], 2002. Ann Arbor, Mich.: Inter-University Consortium for Political and Social Science Research [distributor], 2002. We are indebted to Jon Stiles of UC DATA (UC Berkeley) for assistance developing these census estimates and numerous other contributions.

15
Figure 4Age and Gender Distribution Across Counties for
Population Over 60
9.1% 9.0%
3.8%
5.4%
3.2%3.6%
1.1% 1.1%
5.2%5.7%
2.4%
3.5%
0%
2%
4%
6%
8%
10%
% 60-74 male % 60-74 female % 75+ male % 75+ femaleAge-Gender Group
Perc
ent o
f Cou
nty
Popu
latio
n
HighLowAverage
We cannot know clients’ individual preferences beyond those obtained from survey samples. However, by using demographic data in conjunction with information on program participation along similar demographic dimensions it is possible to identify the portion of the population that would be expected to use particular services. Application of the linked data to resource allocation would proceed in several steps. First, analysts would split the population into subpopulations on the basis of important demand criteria (for example, race/ethnicity, age group, and disability status). The resulting categories might include, among others, white males 75–85 years of age with two or more ADLs/IADLs, and black females 65–75 with no disabilities. These would be the denominators of take-up rates. Second, analysts would create the actual client counts for each subgroup—the numerators of the take-up rate—using program-participation data and client demographic characteristics from a comprehensive database. The take-up rate for each subgroup would be derived by combining the numerator and the denominator. Using program-participation data in this way does not give us actual estimates of demand if potential participants were fully informed about services and barriers to access were at a min-imum. Rather, it gives local-area estimates of the expected demand given the average level of knowledge and barriers to participation across all AAAs. Consequently, examining areas with higher-than-expected participation might reveal local efforts that have improved service delivery by increasing outreach and reducing barriers. Finally, these take-up rates can be used in combination with local-area population characteristics to create estimates of demand for each program within each AAA. Differences in demand may explain a significant amount of the variation in the delivery of services exhibited in Figure 2 and

16
Figure 3. To the extent that differences are not explained by the demand estimates, the state could explore AAAs that are more or less successful at achieving typical take-up rates. Are some PSAs using better outreach efforts? Are others locating services more effectively? Are decisions being made differently about how to distribute services between programs, and do these decisions reflect a clear understanding of the trade-off of resource investment in one program versus others? As a simple example, we will examine the Home Delivered Meals Program (HDMP) using only a single dimension of accession, the race/ethnicity of program participants. Table 4 shows the race/ethnicity distribution for a subset of registered programs. An obvious standout is the take-up rate for Asian American/Pacific Islanders, which is quite low compared to their participation in other CDA programs and compared to other groups’ use of HDMP. African-American participation in HDMP is particularly high, which suggests that PSAs with relatively high concentrations of Asian Americans would expect demand for home-delivered meals to be less important in their portfolio of services, and PSAs with high concentrations of African Americans would expect high demand for HDMP.
Table 4 Distribution of Program Participants by Race/Ethnicity
(selected registered programs) Personal
Care Homemaker Chore Home Delivered
Meals Adult Day
Care Case
Management
African American 5.6% 5.8% 3.5% 24.9% 9.9% 12.6%
Hispanic 8.5% 11.1% 4.3% 8.8% 10.7% 22.0%
Native American 0.7% 0.7% 0.5% 0.9% 0.2% 0.5%
Asian/Pacific 24.7% 14.5% 15.2% 3.7% 12.7% 10.0%
Non-Minority 58.7% 63.7% 75.7% 60.7% 64.4% 52.8%
Missing 1.9% 4.1% 0.8% 1.1% 2.1% 2.1%
These differences lead us to ask whether this is consistent with the differences that we observed in reported PSA program delivery, as shown in Figure 2. Are some of the large differences we observed being driven by ethnic diversity? Figure 5 shows a simple univariate trend line for the percent of a PSA’s unique clients in HDMP and the percent of the PSA’s population over 60 that is Asian American/Pacific Islander. Figure 5 illustrates that the distribution of ethnicity among the older population can affect the distribution of program demand for a local-area agency. In this case, PSAs with a greater percentage of Asian Americans among their over-60 population had a lower percentage of unique clients within the Home Delivered Meals Program.5 Continuing with our unrealistically 5 Regression results imply that for each percentage point increase in the portion of the population over 60 that is Asian American/Pacific Islander, there is approximately a 0.7% reduction in the demand for home-delivered meals. Again, this is only a crude example of how these data could be used and is not meant to show actual effects.
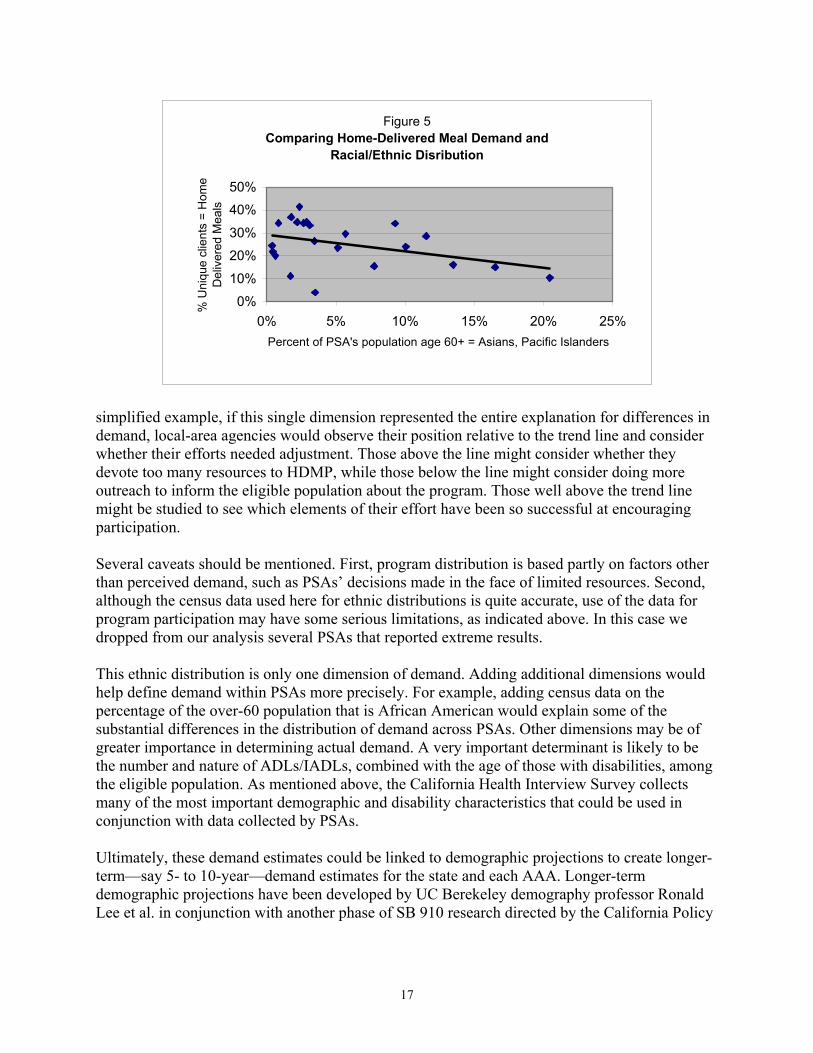
17
simplified example, if this single dimension represented the entire explanation for differences in demand, local-area agencies would observe their position relative to the trend line and consider whether their efforts needed adjustment. Those above the line might consider whether they devote too many resources to HDMP, while those below the line might consider doing more outreach to inform the eligible population about the program. Those well above the trend line might be studied to see which elements of their effort have been so successful at encouraging participation.
Several caveats should be mentioned. First, program distribution is based partly on factors other than perceived demand, such as PSAs’ decisions made in the face of limited resources. Second, although the census data used here for ethnic distributions is quite accurate, use of the data for program participation may have some serious limitations, as indicated above. In this case we dropped from our analysis several PSAs that reported extreme results. This ethnic distribution is only one dimension of demand. Adding additional dimensions would help define demand within PSAs more precisely. For example, adding census data on the percentage of the over-60 population that is African American would explain some of the substantial differences in the distribution of demand across PSAs. Other dimensions may be of greater importance in determining actual demand. A very important determinant is likely to be the number and nature of ADLs/IADLs, combined with the age of those with disabilities, among the eligible population. As mentioned above, the California Health Interview Survey collects many of the most important demographic and disability characteristics that could be used in conjunction with data collected by PSAs. Ultimately, these demand estimates could be linked to demographic projections to create longer-term—say 5- to 10-year—demand estimates for the state and each AAA. Longer-term demographic projections have been developed by UC Berekeley demography professor Ronald Lee et al. in conjunction with another phase of SB 910 research directed by the California Policy
Figure 5Comparing Home-Delivered Meal Demand and
Racial/Ethnic Disribution
0%10%20%30%40%50%
0% 5% 10% 15% 20% 25%Percent of PSA's population age 60+ = Asians, Pacific Islanders
% U
niqu
e cl
ient
s =
Hom
e D
eliv
ered
Mea
ls
18
Research Center (see The Growth and Aging of California’s Population: Demographic and Fiscal Projections, Characteristics and Service Needs).
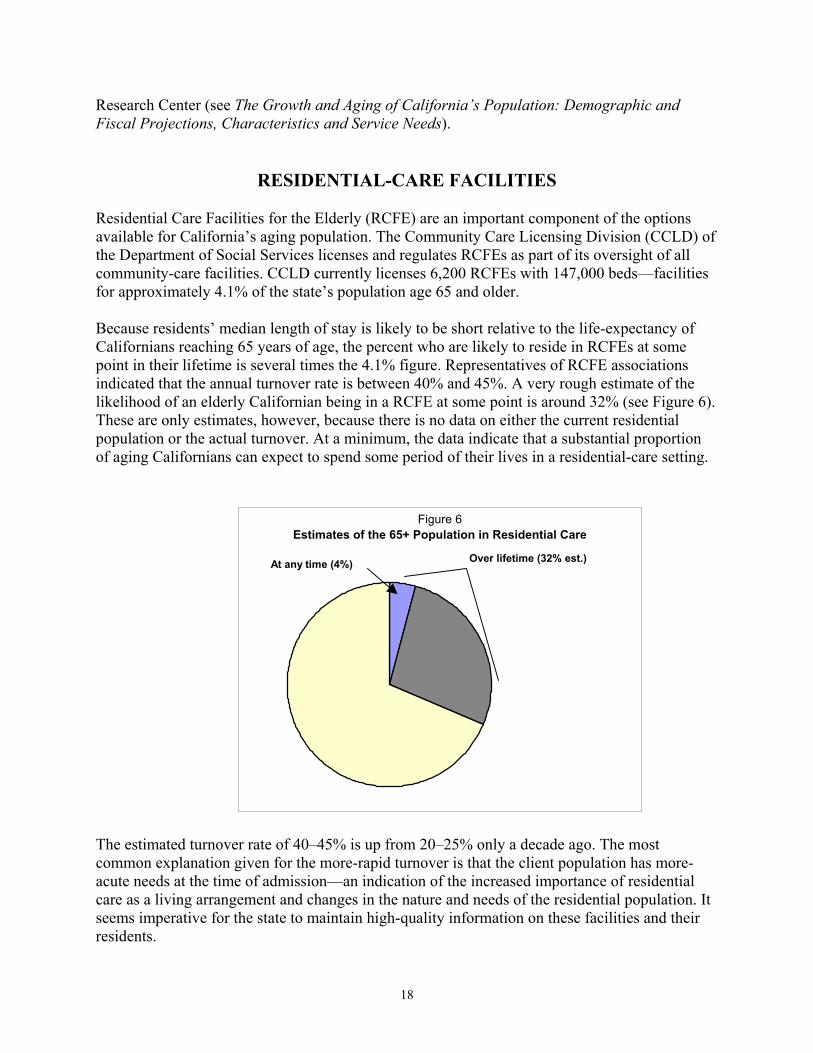
RESIDENTIAL-CARE FACILITIES Residential Care Facilities for the Elderly (RCFE) are an important component of the options available for California’s aging population. The Community Care Licensing Division (CCLD) of the Department of Social Services licenses and regulates RCFEs as part of its oversight of all community-care facilities. CCLD currently licenses 6,200 RCFEs with 147,000 beds—facilities for approximately 4.1% of the state’s population age 65 and older. Because residents’ median length of stay is likely to be short relative to the life-expectancy of Californians reaching 65 years of age, the percent who are likely to reside in RCFEs at some point in their lifetime is several times the 4.1% figure. Representatives of RCFE associations indicated that the annual turnover rate is between 40% and 45%. A very rough estimate of the likelihood of an elderly Californian being in a RCFE at some point is around 32% (see Figure 6). These are only estimates, however, because there is no data on either the current residential population or the actual turnover. At a minimum, the data indicate that a substantial proportion of aging Californians can expect to spend some period of their lives in a residential-care setting.
Figure 6
Estimates of the 65+ Population in Residential Care
At any time (4%) Over lifetime (32% est.)
The estimated turnover rate of 40–45% is up from 20–25% only a decade ago. The most common explanation given for the more-rapid turnover is that the client population has more-acute needs at the time of admission—an indication of the increased importance of residential care as a living arrangement and changes in the nature and needs of the residential population. It seems imperative for the state to maintain high-quality information on these facilities and their residents.
19
However, our knowledge of residential-care facilities is quite poor. As Robert Newcomer and Robert Maynard reported in CPRC’s first SB 910 report (Strategic Planning Framework for an Aging Population, May 2001):
California has few . . . data systems that monitor and evaluate (1) changes in the residential case mix or (2) changes in reimbursement, licensing, staffing, and staff functions that may affect the delivery system and quality of care provided. The capabilities of existing resources are not only underused, but also existing systems do not track or compile statistics on the health problems and functional limitation of RCFE residents, and their need for and use of health care and other services. One consequence is that the effectiveness and quality assurance of the care system are not routinely evaluated.
Current data systems do not even allow the Community Care Licensing Division to determine how many residents are in RCFEs at any point in time. The more complicated task of deter-mining how many residents pass through the system in a given period, or the distribution of residents’ length of stays and the characteristics and health status of residents with different length of stays, is completely beyond current data-collection efforts. This information is crucial for making decisions about where to spend government and personal resources.6
It is also critical for other policy initiatives and regulatory actions, such as requesting waivers for financing residential-care stays through Medi-Cal, or requests to waive the transfers to nursing homes for residents whose disability level exceeds that normally allowed for this level of care. Some observers think RCFEs have been overbuilt and are concerned that residents may be kept in residential care too long, while others are concerned that they may not be allowed to stay long enough. No decisions about these issues, or about licensing, subsidies, and locating future facilities, can be made without the information mentioned in the preceding paragraphs. Current Data Resources Related to RCFEs As the lead agency, the Community Care Licensing Division maintains electronic databases on community-care facilities and licensees, including their number and capacity as well as owner-ship. However, none of the facilities currently sends information to CCLD concerning residents. The CCLD regional offices maintain more-extensive files on individual facilities, but they are paper records that deal primarily with complaint and inspection issues, and are organized across different dimensions at different regional offices. For example, one group of offices might file citations by type of citation, while another might organize citations by facility cited. These data include substantial detail on the facilities and their employees, but virtually no information on the residents. However, there are several important potential sources of administrative data on RCFE residents. The most important consists of information already collected by the facilities themselves, per CCLD requirements, which must be maintained for at least three years after a resident leaves the facility for any reason. 6 These comments do not reflect on the work and dedication of CCLD personnel, or their on their interest in obtaining better data. CCLD lacks the necessary statutory and regulatory authority to accomplish this goal.
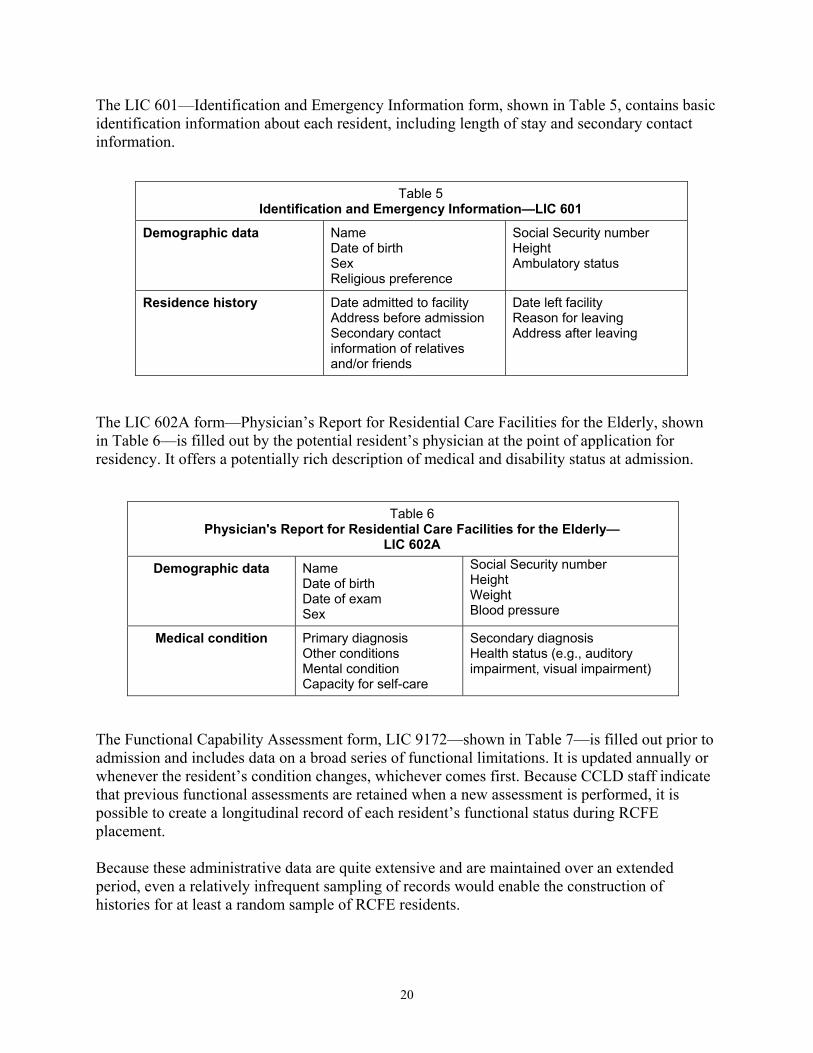
20
The LIC 601—Identification and Emergency Information form, shown in Table 5, contains basic identification information about each resident, including length of stay and secondary contact information.
Table 5 Identification and Emergency Information—LIC 601
Demographic data Name Date of birth Sex Religious preference
Social Security number Height Ambulatory status
Residence history Date admitted to facility Address before admission Secondary contact information of relatives and/or friends
Date left facility Reason for leaving Address after leaving
The LIC 602A form—Physician’s Report for Residential Care Facilities for the Elderly, shown in Table 6—is filled out by the potential resident’s physician at the point of application for residency. It offers a potentially rich description of medical and disability status at admission.
Table 6 Physician's Report for Residential Care Facilities for the Elderly—
LIC 602A
Demographic data Name Date of birth Date of exam Sex
Social Security number Height Weight Blood pressure
Medical condition Primary diagnosis Other conditions Mental condition Capacity for self-care
Secondary diagnosis Health status (e.g., auditory impairment, visual impairment)
The Functional Capability Assessment form, LIC 9172—shown in Table 7—is filled out prior to admission and includes data on a broad series of functional limitations. It is updated annually or whenever the resident’s condition changes, whichever comes first. Because CCLD staff indicate that previous functional assessments are retained when a new assessment is performed, it is possible to create a longitudinal record of each resident’s functional status during RCFE placement. Because these administrative data are quite extensive and are maintained over an extended period, even a relatively infrequent sampling of records would enable the construction of histories for at least a random sample of RCFE residents.

21
Table 7
Functional Capability Assessment Data—LIC 9172
Functional assessment categories
Bathing Grooming Toileting Transferring Repositioning Hearing
Dressing Vision Continence Eating Wheelchair Walking Communication
Other data
Prescription and non-prescription medicines
Descriptions of mental and emotional state
RCFE Data-Collection Strategies None of the individual data noted above is currently available in electronic form. Although some facilities may maintain a subset of the records electronically, they are not required to do so. Contrast this with nursing homes, discussed in the next section, which have been required for years to maintain an electronic record on all residents and periodically report the data to the federal government. One strategy for RCFEs could be to transition all data to electronic reporting and require the facilities to periodically transfer a specific subset of the data to the state. This may not be a politically acceptable or even socially desirable solution, however. Close monitoring of nursing- home patients is considered necessary because this population is particularly vulnerable to abuse, neglect, and health problems, and these patients are often incapable of decision-making, even with the assistance of advocates on their behalf. The choice of moving to a nursing home may not even be one that they make, but one driven by seriously declining physical and mental health that made their previous living arrangements unfeasible. Finally, because most nursing-home residents are supported by government assistance, the government has a role in overseeing this important area of fiscal expenditure. Residential-care facilities are different by their very licensing definition, and a portion of their population may need only limited assistance. In some cases, residents may have decided to enter the facility as much for social reasons as for assistance, and see RCFEs as an attractive alterna-tive to living alone and maintaining a residence. Many are socially and politically active and may not see themselves as a vulnerable population that cannot voice their concerns or leave the facility if unhappy. Finally, the large majority, unlike nursing-home patients, support their residence costs through personal finances rather than through state or federal programs. These factors prompt concerns about the government’s role in collecting data on the disability, health, financial, and personal characteristics of all RCFE residents. A related (perhaps extreme) ex-ample would be the appropriateness of government data collection on people who move out of single-family residences into condominiums. In addition, residential-care facilities for the elderly are dominated by very small operators, with six or fewer beds. (See Figure 7.) Over three-quarters of licensed RCFEs have a capacity of six
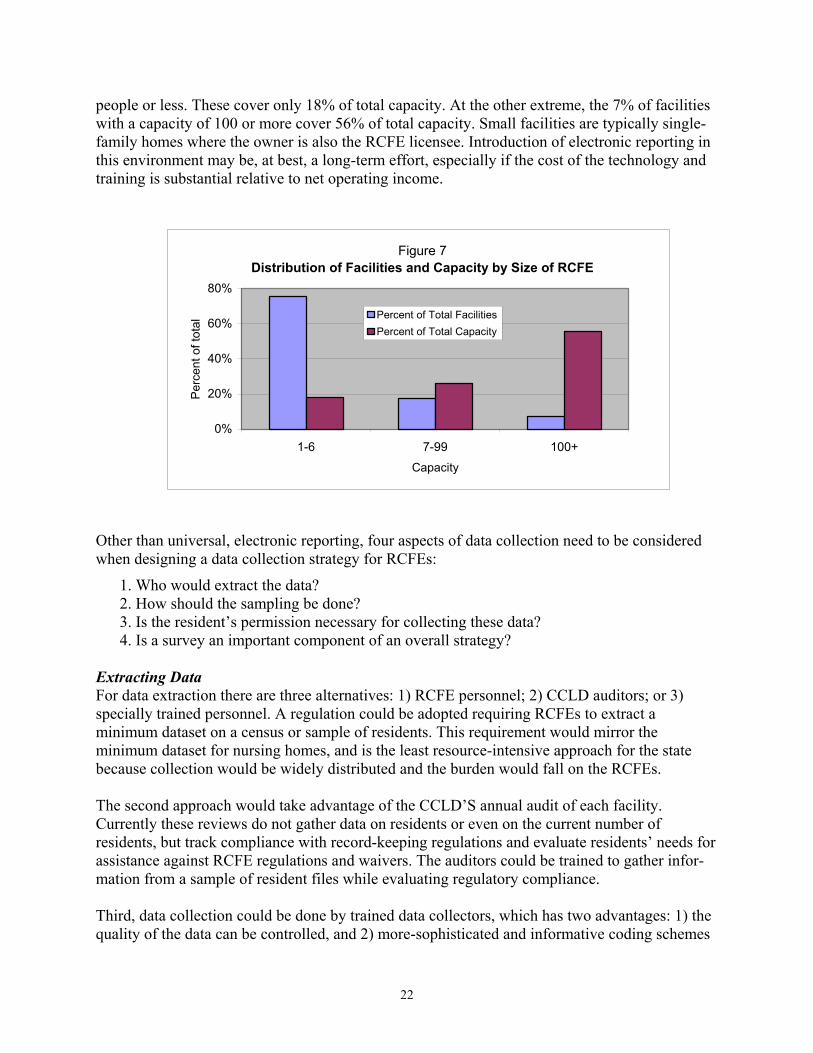
22
people or less. These cover only 18% of total capacity. At the other extreme, the 7% of facilities with a capacity of 100 or more cover 56% of total capacity. Small facilities are typically single-family homes where the owner is also the RCFE licensee. Introduction of electronic reporting in this environment may be, at best, a long-term effort, especially if the cost of the technology and training is substantial relative to net operating income.
Figure 7Distribution of Facilities and Capacity by Size of RCFE
0%
20%
40%
60%
80%
1-6 7-99 100+Capacity
Perc
ent o
f tot
al Percent of Total Facilities
Percent of Total Capacity
Other than universal, electronic reporting, four aspects of data collection need to be considered when designing a data collection strategy for RCFEs:
1. Who would extract the data? 2. How should the sampling be done? 3. Is the resident’s permission necessary for collecting these data? 4. Is a survey an important component of an overall strategy?
Extracting Data For data extraction there are three alternatives: 1) RCFE personnel; 2) CCLD auditors; or 3) specially trained personnel. A regulation could be adopted requiring RCFEs to extract a minimum dataset on a census or sample of residents. This requirement would mirror the minimum dataset for nursing homes, and is the least resource-intensive approach for the state because collection would be widely distributed and the burden would fall on the RCFEs.
The second approach would take advantage of the CCLD’S annual audit of each facility. Currently these reviews do not gather data on residents or even on the current number of residents, but track compliance with record-keeping regulations and evaluate residents’ needs for assistance against RCFE regulations and waivers. The auditors could be trained to gather infor-mation from a sample of resident files while evaluating regulatory compliance. Third, data collection could be done by trained data collectors, which has two advantages: 1) the quality of the data can be controlled, and 2) more-sophisticated and informative coding schemes

23
can be used. A number of data elements may require additional coding to make the data useful for analysis. For example, if the physician records information on the LIC 602A indicating a “mental condition,” the data might be recorded in the electronic database as a simple yes/no (1,0) indicating whether any mental condition exists. On the other hand, data are more useful for planning and policy purposes if they distinguish between different conditions (such as dementia and depression), and even between the levels of severity of a particular diagnosis (e.g., severe versus mild depression). A quick pilot project that retrieved a sample of RCFE files from several sites would allow a research group familiar with administrative data to set up an appropriate data-collection strategy, depending on the state’s perceived needs. The more precise the coding and less precise the narrative, the more demanding the collection process. Difficult coding requires trained file reviewers. However, the cost of the data collection by trained data collectors falls on the state, including travel. If audit personnel are used, the travel is avoided because the visits are part of the audit process. Sampling Methods How to sample the population is another issue to be determined. Collecting data on all residents requires maximum resources. Alternatively, a subset of residents could be sampled at each facility, or the state could use cluster sampling, focusing on a subset of residential facilities and sampling some or all of the residents at each site. Each of these approaches has strengths and weaknesses. Random sampling across all facilities is the most efficient statistically, but it is an efficient use of resources only if the data collection is organized across all facilities using RCFE or CCLD audit personnel. Cluster sampling is efficient if the data are collected by separate, specially trained personnel involving travel to a specified subsample of sites. Random sampling could involve using the last digit of the Social Security number reported on the LIC 601 and 602 forms for all residents. Using a last digit of “0” would pick up a 10% sample of residents, which is probably sufficient for an analysis that is not driven by too fine a categorization. The auditing process could be used to spot-check the compliance and accuracy of the reporting. The 10% sample would be equivalent to reporting data for approximately 20,000 residents per year across the 6,000 RCFEs, with substantial overlap from year to year. The burden of reporting information on a 10% sample of residents could be further reduced by rotating the reporting through one-third of the RCFEs each year. Since regulations require the facilities to retain files on residents for three years after residency, reporting that covers current and past files could recover information on the entire 10% sample even if data are recorded only triennually. Again, audit personnel could be used to instruct the facilities on collection and to review the quality of and compliance with data collection. The once-each-three-year reporting approach results in some overlap on individual residents, allowing confirmation of data quality and capture of a longitudinal picture on a subsample of residents. This approach would approximately halve the sample size to 10,000 per year for a 10% sample, as it would substantially reduce the overlap of samples year-to-year.

24
Moreover, data on changing conditions (such as ADLs/IADLs) that may be collected several times, could be limited to the first and current or last assessment. This would reduce the reporting burden. This approach mirrors that used by the Long-Term Care Integration Project discussed in the next section. This data-collection strategy is parsimonious to enable focusing state resources on the quality and completeness of the data identified for collection and limiting the RCFEs’ collection burden.
Permission Issues Another issue to consider is whether residents’ permission will be required to access data in the administrative files, especially concerning medical conditions and disabilities. If so, cluster sampling becomes the dominant collection strategy, because permission for this population may require in-person contact. Survey’s Value A survey would provide important additional data on RCFE residents, as the administrative data lack detail on a number of issues that are key to understanding the transition to assisted living, such as residents’ and/or their families’ motivation for choosing these living arrangements and how those choices affect the residents’ perception of their quality of life. Surveying this population is likely to require in-person interviewing. Many respondents may have hearing or other limitations that restrict the use of telephones or written survey instruments. Because conducting in-person interviews is time-consuming and expensive, costs can be greatly reduced by clustering the sample to reduce travel and contact expense. We would expect the survey to rotate through facilities annually, possibly with some overlap from year-to-year to add a longitudinal aspect to a subset of interviews. Obviously, sampling will reduce individual con-fidentiality problems. Response to the survey is likely to be high, since group dynamics may work in favor of response and older populations are generally more likely to respond to surveys. As mentioned, a value-added survey would focus on issues that are not available from admin-istrative data. Topics could include the following groupings of questions: how the decision was made to move to assisted living, living conditions prior to the move, family and other caregiver support before and after the move, and support services received from the government before and after the move; the resident’s current quality of life, functional and health status, and financial considerations; and, finally, questions about future expectations about quality of life, duration of residence at the facility, and nursing-home care. These data could be linked to administrative data on the population and use of CDA services, and also linked to Medicare, Medi-Cal, SSI, In-Home Support Services, and other data sources identified in the following section. A complete picture could be created about decisions to enter assisted-living facilities, which house a large portion of the aging population. The CDA should develop a task force to explore the development and implementation of a survey instrument for RCFE residents.

25
NURSING HOMES, IN-HOME SUPPORT SERVICES, AND THE MULTIPURPOSE SENIOR SERVICES PROGRAM
The most resource-intensive services are those supplied through nursing homes or their alternative: intensive in-home services for the disabled elderly. Because the majority of these services are supported by federal and state governments through Medicare, Medi-Cal, and SSI, detailed transaction records are available to account for the services. In addition, because this population is particularly vulnerable, regulations require the collection of substantial data on client demographics and disability characteristics.
Long-Term Care Integration Project The Long-Term Care Integration Project (LTCIP) is a joint effort by the University of Southern California and the University of California, Los Angeles to integrate a number of databases on long-term care. As LTCIP includes all populations in long-term care, including children, its focus is broader than just the aging population. The data are complex and difficult to organize usefully for analytical purposes. Nonetheless, LTCIP has created a thoughtful and sophisticated solution to the problems of organizing the data and has completed a major portion of the time-consuming work needed to integrate these resource-intensive services into a Comprehensive Database on Aging Californians. Because of these factors, as well as its work resolving the access and confidentiality issues with the agencies supplying data, LTCIP is the obvious candidate to continue developing the data in this area by bringing together several additional resources not yet included in its datasets. Current datasets linked by LTCIP cover clients receiving government support payments for nursing-home stays, In-Home Support Services (IHSS), and the Multipurpose Senior Services Program in 19 of California’s counties. Six counties are participating in a pilot project that involves more intensive data preparation and analyses. The IHSS program, funded through the Department of Social Services, helps pay for services that enable the elderly and disabled to remain safely in their own homes. To be eligible, one must be over 65 years of age, blind or otherwise disabled, and have assets and income that do not exceed certain maximum levels. IHSS is considered an alternative to out-of-home care, such as nursing homes or board-and-care facilities, and can include the following services: house-cleaning, meal preparation, laundry, grocery shopping, personal-care (such as bowel and bladder care, bathing, grooming, and paramedical services), accompaniment to medical appointments, and protective supervision for the mentally impaired. Multipurpose Senior Services Program (MSSP) sites provide social and health-care management for frail elderly clients who are certifiable for placement in a nursing facility but who wish to remain in the community. The program arranges for and monitors the use of community services to prevent or delay premature institutional placement. The services must be provided at a lower cost than care in a nursing facility. MSSP is funded by the state Department of Aging and the federal government under a Medicaid home- and community-based, long-term care services waiver.

26
Clients eligible for the program must be 65 years of age or older, eligible for Medi-Cal (with no “share of cost” requirement), functionally impaired, at risk of institutionalization in a nursing facility, and can be served at home within MSSP budget limitations. Because in-home supportive services are typically paid services, their tracking is nearly complete. MSPP can involve arranging paid services (complete tracking) as well as local AAA services that may not be tracked completely, as we observed earlier.
Table 8 LTCIP Data Elements
Identifiers Medicare, Medi-Cal, IHSS, MSSP, SSN
Date of birth Gender Race/ethnicity Zip code County
Education Appears to be available on MSSP only
Type of residence We are not clear on the categorization yet
Lives alone This consists of several categories, including lives with spouse and number of people in household
Assessments for ADL/IADL The LTCIP database is set up to capture the first and last assessment for each year for each of a large number of assessment categories, which allows for a longitudinal picture of the progression of disability
Detail on all payment transactions. Includes medical transactions: procedure, diagnosis, billed and paid amounts, dates of service and provider. For IHSS and MSSP, data consist of units of service by service type.
Medicaid, Medi-Cal, MSSP, IHSS
Adding Data to the LTCIP Several important areas of data are missing from the LTCIP, whose investigators suggested many of the following extensions. 1. The most important dataset on nursing-home residents, the Minimum Data Set (MDS) of the federal Centers for Medicare and Medicaid Services (CMS), is not available to LTCIP, nor are the data even available to the state without extensive interaction with the federal government through CMS. MDS is based on electronic reporting to CMS on each nursing-home patient within 14 days of admission, annually thereafter, and quarterly if the resident’s condition changes.

27
The MDS contains the following important data that should be linked to the LTCIP and ultimately to the Comprehensive Database on Aging Californians.
Table 9 Minimum Data Set (MDS) Data Elements
Name Social Security number Medicaid number Gender Birth date Marital status Race/ethnicity Zip code Date of entry/reentry
Previous residence All residence types in previous five years, but not chronological
ADLs/IADLs Specialized for MDS, necessary to crosswalk to other assessment types; updates would create chronological record of condition
Reason for assessment Source: CMS, MDS Release 2.0
Several states have legislated dual reporting for these data, requiring nursing homes to report to both the state and federal governments. Dual reporting will not add significantly to the burden on nursing facilities, since the process is electronic, but the State of California would have to create a collection mechanism. Dual reporting would simplify the process of gaining access to the data and linking them to the LTCIP and the Comprensive Database on Aging Californians.
2. The value of the LTCIP can be improved by extending the period covered by current data and linking to additional administrative datasets. First, LTCIP currently captures administrative data from several sources, but only during the period when the care recipient is participating in a covered program, such as IHSS or MSSP, or is receiving Medicare/Medi-Cal support for a nursing-home stay. There are no data on services (such as Medicare/Medi-Cal) participants receive prior to their entry into the programs or after they exit. For example, if a resident is in a facility that provides subacute care, paid for by Medicare, while recovering from an injury or illness and then recovers sufficiently to return home without support, a record of that transition and the person’s subse-quent medical and service history are not available to LTCIP. Also, if participants exit IHSS, MSSP, or a nursing facility where they are supported by federal funds, their data are no longer included in LTCIP. Extending the coverage period to include prior- and post-participation data on at least a sample of clients (e.g., those with SSNs ending in “0”) would greatly increase LTCIP’s value for research and policymaking.
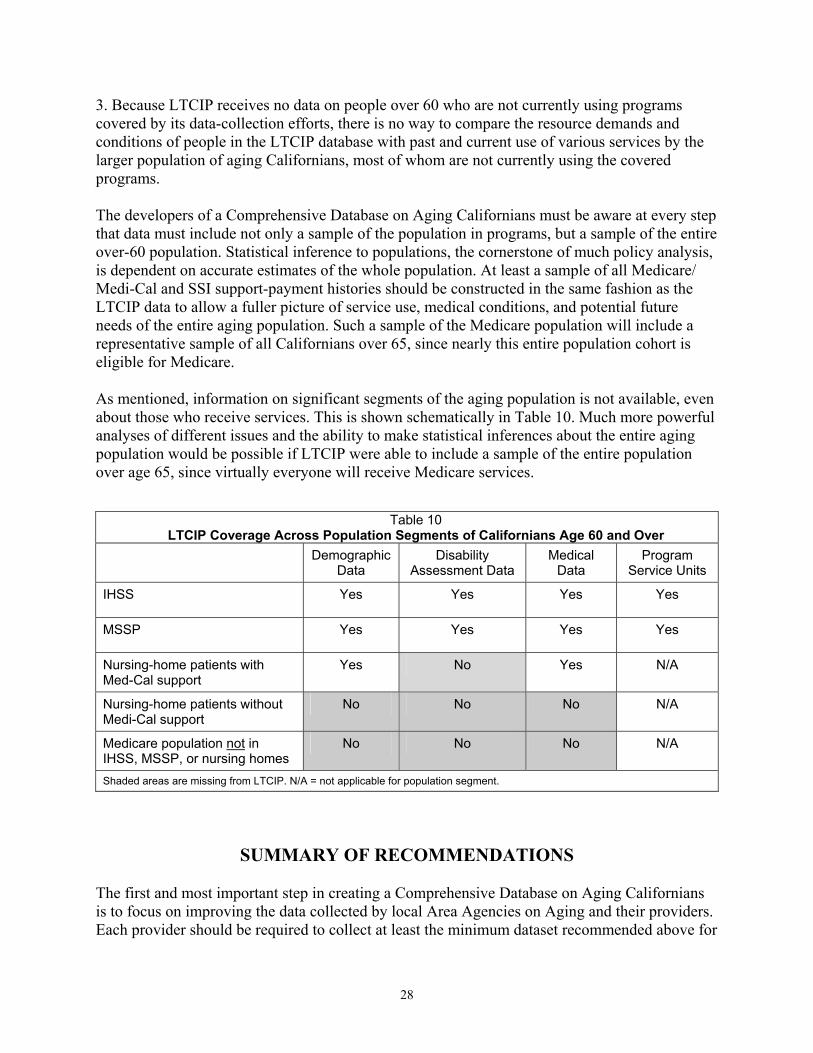
28
3. Because LTCIP receives no data on people over 60 who are not currently using programs covered by its data-collection efforts, there is no way to compare the resource demands and conditions of people in the LTCIP database with past and current use of various services by the larger population of aging Californians, most of whom are not currently using the covered programs. The developers of a Comprehensive Database on Aging Californians must be aware at every step that data must include not only a sample of the population in programs, but a sample of the entire over-60 population. Statistical inference to populations, the cornerstone of much policy analysis, is dependent on accurate estimates of the whole population. At least a sample of all Medicare/ Medi-Cal and SSI support-payment histories should be constructed in the same fashion as the LTCIP data to allow a fuller picture of service use, medical conditions, and potential future needs of the entire aging population. Such a sample of the Medicare population will include a representative sample of all Californians over 65, since nearly this entire population cohort is eligible for Medicare.
As mentioned, information on significant segments of the aging population is not available, even about those who receive services. This is shown schematically in Table 10. Much more powerful analyses of different issues and the ability to make statistical inferences about the entire aging population would be possible if LTCIP were able to include a sample of the entire population over age 65, since virtually everyone will receive Medicare services.
Table 10 LTCIP Coverage Across Population Segments of Californians Age 60 and Over
Demographic Data
Disability Assessment Data
Medical Data
Program Service Units
IHSS
Yes Yes Yes Yes
MSSP
Yes Yes Yes Yes
Nursing-home patients with Med-Cal support
Yes No Yes N/A
Nursing-home patients without Medi-Cal support
No No No N/A
Medicare population not in IHSS, MSSP, or nursing homes
No No No N/A
Shaded areas are missing from LTCIP. N/A = not applicable for population segment.
SUMMARY OF RECOMMENDATIONS
The first and most important step in creating a Comprehensive Database on Aging Californians is to focus on improving the data collected by local Area Agencies on Aging and their providers. Each provider should be required to collect at least the minimum dataset recommended above for

29
each registered client. In addition, each provider should be required to track services by client, consistent with OAA requirements. Second, building on efforts already under way, the Department of Aging should assist the local-area agencies with developing the hardware and software infrastructure to capture these augmented data effectively in an administrative database. A modest incremental increase in resources would allow the CDA to build on the current momentum among planning and service areas towards building networks that connect providers and AAAs. This resource expenditure seems appropriate not only for reporting purposes and to enable construction of a comprehensive database, but even more importantly for improving future service delivery. Third, the department should arrange data transfers from individual PSAs to a database that combines data across PSAs. Again, models for this are available from pilot projects, such as the one from Santa Clara County that integrates data from several PSAs. Such an approach would provide an important advance in delivering client services, especially for those who move or use adjacent service areas, and would be a bonus to the development of a comprehensive database. Linking the PSA data does not require imposing a single technical standard. All of the systems we studied were compatible for this purpose. CDA should 1) direct collection of the minimum dataset; 2) recommend a format for recording the data elements; 3) standardize the descriptions of ADLs and IADLs; and 4) continuously evaluate the quality of the data. Fourth, we recommend that the Community Care Licensing Division initiate an effort to capture data on a 10% sample of the RCFE population. The recommended method would be a statutory or regulatory requirement that RCFEs extract a specified set of data from client files based on the forms already required as part of being a licensed RCFE. Data would be sampled by the RCFEs every three years, using a rotating schedule of one-third of the RCFEs as specified by the div-ision. CCLD auditors would check data quality on a subsample of the 10% sample as part of its regular audit. This sampling method would require the auditors to check data quality at only one-third of the sites audited each year. RCFEs would also be required to submit a sample upon closing if they dropped their license. CCLD should gather a sample of about a 100 files from a number of RCFEs, and review them to determine which data could be extracted and how to construct a data form. This process should be done by a group with specialized experience in data extraction and entry. After reviewing the proposed data elements and the form, CCLD should ask one or more of the RCFE associations to recruit volunteer facilities to participate in a pilot project to test the time required to obtain the data and ensure their quality. The results should be checked against the data quality achieved on the same files by trained reviewers. Fifth, the Community Care Licensing Division and the Department of Aging should convene a group of interested parties to explore the development and administration of a survey of RCFE residents. Such a survey would fill an important gap in our current understanding of this residen-tial arrangement, which is often a transition between other residential settings. Because the characteristics of this population change substantially over time, the survey should be
30
administered periodically. In each case, we recommend that the samples be drawn using a consistent last digit of the Social Security number. Sixth, California should require, by statute or regulation, that nursing homes report MDS data to the state as well as the federal government. This would greatly simplify the process of obtaining the MDS data to link to the LTCIP database, and ultimately to the Comprehensive Database on Aging Californians. Seventh, the LTCIP project should be expanded to include data from all counties, and should include a sample of all people over 60 receiving Medicare/Medi-Cal, as well as MDS data from nursing homes. The sample should be based on the same sample selection used in each other area. For example, a 10% sample, based on the last digit of the Social Security number, would give us a consistent 10% sample across all proposed areas.
Eighth, when the California Health Interview Survey (CHIS) data become available in late 2003, CDA should contract with a research group experienced in using census and survey data for estimating local-area characteristics. The research group should use the CHIS, Health and Retirement Survey, and census data in combination with the latest CDA service data to create the demand estimates at the PSA level that are discussed in the section on creating and updating local-area demand estimates. Finally, as these data become available, public-use files should be made available to researchers, state agencies, local-area agencies, and other parties. Coordinating These Efforts One last point concerns the responsibility for coordinating the effort to build and link these important data. At least three different groups have direct responsibility for collecting data and recommending improvements. The Department of Aging would be the lead agency for data related to the AAA-directed programs as well as IHSS and MSSP. The Community Care Licensing Division of the Department of Social Services would be the lead for developing data related to RCFEs, possibly including a residents’ survey. The Long-Term Care Integration Project would be the best group to work on expanding the LTCIP database to include the recommended additional data. All of these efforts need to be coordinated. The obvious candidate to take overall responsibility for coordinating these efforts, and for eventually linking the data into a Comprehensive Database on Aging Californians, is the Long-Term Care Council. The LTCC already supplies state-level leadership in coordinating a long-term care system. As multiple departments are represented on the council, coordinating the database effort should become a component of the LTCC’s mission.
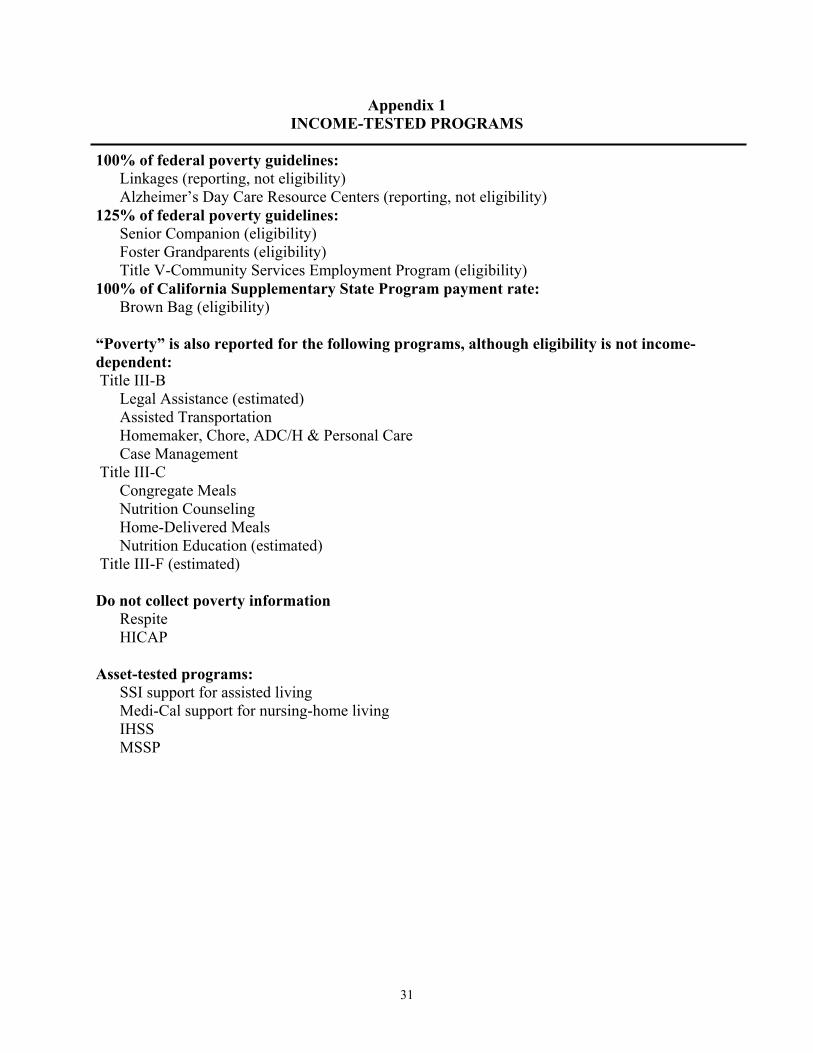
31
Appendix 1 INCOME-TESTED PROGRAMS
100% of federal poverty guidelines: Linkages (reporting, not eligibility) Alzheimer’s Day Care Resource Centers (reporting, not eligibility) 125% of federal poverty guidelines: Senior Companion (eligibility) Foster Grandparents (eligibility)
Title V-Community Services Employment Program (eligibility) 100% of California Supplementary State Program payment rate: Brown Bag (eligibility) “Poverty” is also reported for the following programs, although eligibility is not income-dependent: Title III-B Legal Assistance (estimated) Assisted Transportation Homemaker, Chore, ADC/H & Personal Care Case Management Title III-C Congregate Meals
Nutrition Counseling Home-Delivered Meals Nutrition Education (estimated) Title III-F (estimated) Do not collect poverty information
Respite HICAP
Asset-tested programs:
SSI support for assisted living Medi-Cal support for nursing-home living IHSS MSSP

32
Appendix 2 DEFINITIONS OF ADL AND IADL
Activities of Daily Living
Activities of daily living (ADLs) are activities related to personal care, including bathing or showering, dressing, getting in or out of bed or a chair, using the toilet, and eating. In the National Health Interview Survey respondents were asked about needing the help of another person with personal care needs because of a physical, mental, or emotional problem. People are considered to have an ADL limitation if any causal condition is chronic. If a sample person from the Medicare Current Beneficiary Survey had any difficulty performing an activity alone and without special equipment, or did not perform the activity at all because of health problems, the person was categorized as having a limitation in that activity. The limitation may have been temporary or chronic at the time of the interview. Those who were administered a community interview answered health status and functioning questions themselves if able to do so. A proxy, such as a nurse, answered questions about the sampled person’s health status and functioning for the long-term care facility interview. http://www.cdc.gov/nchs/datawh/nchsdefs/ADL.htm
Source: Health, United States, National Center For Health Statistics Instrumental Activities of Daily Living
Instrumental activities of daily living (IADLs) are activities related to independent living and include preparing meals, managing money, shopping for groceries or personal items, performing light or heavy housework, and using a telephone. If a sample person from the Medicare Current Beneficiary Survey had any difficulty performing an activity alone and without special equipment, or did not perform the activity at all because of health prob-lems, the person was categorized as having a limitation in that activity. The limitation may have been temporary or chronic at the time of the interview. Those who were administered a community interview answered health status and functioning questions themselves if able to do so. A proxy, such as a nurse, answered questions about the sampled person’s health status and functioning for the long-term care facility interview. In the National Health Interview Survey, respondents are asked about needing the help of another person for handling routine IADL needs due to a physical, mental, or emotional problem. People are considered to have an IADL limitation if the causal condition for the IADL limitation is chronic. http://www.cdc.gov/nchs/datawh/nchsdefs/IADL.htm

33
Appendix 3 CENSUS QUESTIONS DESCRIBING KEY ISSUES FOR LOCAL-AREA DEMAND
Bureau of Census data are most useful for estimating characteristics related to state and local areas when the analysis is based on demographic characteristics such as age, race/ethnicity, gender, and household income and composition. Analysis based on the Public Use Microdata Samples allows policymakers, program administrators, and researchers to make estimates at quite small areas geographically, such as local Area Agencies on Aging and even individual provider areas within agencies. The Decennial Census has two goals: 1) counting the population, and 2) providing data for ad-ministering federal programs including the distribution of federal aid dollars. To accomplish this second goal, the census obtains demographic, housing, social, and economic information by asking a 1-in-6 sample of households to fill out a long form. However, since the census is completed only once every 10 years, information on that form becomes outdated. Thus, state planners and others are reluctant to rely on it for decisions that are expensive and affect the quality of life of thousands of people. Moreover, although the long form asks the questions below about the disabilities of household members, they are not well-designed for estimating program eligibility because they do not identify individual ADLs/IADLs. In Appendix 4 we report the disability questions that are asked on the CHIS, which can be matched directly to one or more specific ADL or IADL. Specific Disability-Related Questions Question 16: Does this person have any of the following long-lasting conditions:
a. Blindness, deafness, or a severe vision or hearing impairment? b. A condition that substantially limits one or more basic physical activities such as
walking, climbing stairs, reaching, lifting, or carrying?
Question 17: Because of a physical, mental, or emotional condition lasting 6 months or more, does this person have any difficulty in doing any of the following activities: a. Learning, remembering, or concentrating? b. Dressing, bathing, or getting around inside the home? c. (Answer if this person is 16 YEARS OLD OR OVER.) Going outside the home alone to
shop or visit a doctor’s office? d. (Answer if this person is 16 YEARS OLD OR OVER.) Working at a job or business?
Income and Poverty Estimation at the Household Level A poverty-line measure can be constructed from census microdata using the relationship of household members and their income to construct the appropriate household income and poverty line. American Community Survey The American Community Survey (ACS) is a new approach for collecting accurate, timely information needed for critical government functions. By providing accurate, up-to-date profiles

34
of America’s communities every year, its information is more timely for planning and evaluating public programs for everyone from newborns to the elderly. The questions on the ACS related to disability and income are identical to those on the “2002 Long Form.” Consequently, the ACS offers more current data than the Decennial Census for a smaller sample, but is similarly limited by the level of detail on disabilities and ADLs/IADLs.

35
Appendix 4 RECOMMENDED ADL/IADL QUESTIONS FOR THE
CALIFORNIA HEALTH INTERVIEW SURVEY A number of programs have minimum requirements for participation built around the number and type of ADLs/IADLs. The CHIS questionnaire is well suited to picking up key information con-cerning these issues. CHIS has new questions, AB8 and AB9, that screen for any ADLs/IADLs. Following up positive answers with detailed questions on specific ADLs/IADLs has the advantage of gathering a key set of data without extending the length of the survey (and cost) in any but the small subset of respondents with limitations. NEW AB8 “Because of any impairment or health problem, do you need the help of other persons with your personal care needs, such as eating, bathing, dressing, or getting around the house?” Yes, No, Refused, Don’t Know. If the respondent answers “Yes” to the above question, then ask: NEW AB8a “For which of the following personal care tasks do you require the help of other persons”: (Check all that apply)
Eating Bathing Dressing Getting around the house Going to the bathroom Transferring in and out of bed Other
NEW AB9 “Because of any impairment or health problem, do you need the help of other persons in handling your routine needs, such as everyday household chores, doing necessary business, shopping, or getting around for other purposes?” Yes, No, Refused, Don’t know. Again, if the respondent answers yes, then ask: NEW AB9a “For which of the following routine tasks do you require the help of other persons”:
Everyday household chores Preparing meals Shopping Telephone Transportation Personal finance Managing medications
36
Income Questions on the CHIS The California Health Interview Survey has a terrific income section (Section K), which is especially useful for determining income relative to the poverty levels (basically the program-ming indicated ahead of AK18A). Currently the poverty breaks are 100%, 200%, and 300% of the federal poverty line. Creating a Longitudinal Survey from the CHIS CHIS was originally developed as a cross-sectional survey, meaning that a sample of Californians would be surveyed each time. The current CHIS asks for permission and information to follow up on the same respondents in future waves. Because CHIS oversamples aging Californians, the state will have an opportunity to create a longitudinal survey of this population in the future, at substantial savings over building such a survey from the ground up.

37
Appendix 5 NATIONAL DATA AND HRS:
COMPARING CALIFORNIA TO THE NATION AS A WHOLE HRS Data: What It Is and Why It Is of Value To research aging at a geographic level at or below the state level, one would like detailed data on individuals within the region of analysis. However, collecting data is expensive and time-consuming. Since 1992, a national Health and Retirement Survey (HRS) has been collecting longitudinal data on a cohort of Americans born between 1931 and 1941. In this appendix we report on HRS in the context of the state’s informational needs to identify the usefulness of these data for answering questions relevant to California. Because of concerns regarding respondents’ anonymity, especially while the survey is still being conducted, respondents are identified only by region in the public use version of the data. Thus the region containing California also includes other states along the Pacific Ocean, including Alaska and Hawaii. It is possible to gain access to the restricted data, which in the past HRS has made available to government agencies, such as the Congressional Budget Office, and even to individual researchers who document their willingness to meet strict requirements to safeguard the data. We strongly recommend that the state government proceed to gain access to the restricted data and fulfill all requirements regarding safeguards in order to do so. In the remainder of this appendix we report on the region containing California, compared to the nation as a whole. In that regard, this document will illustrate some financial and medical com-paratives across regions of the United States. Financial Data in HRS Financial data in HRS provide rich detail on Social Security earnings and eligibility, real-estate assets, both primary residence and other property holdings, stock holdings, and other important details for ascertaining the ability of senior citizens to afford retirement and related expenses. For example, in Chart A 5.1, Pacific-region HRS respondents are shown to have IRA balances that are slightly larger than those held in other regions. In another exercise on financial endowment between regions, shown in Chart A 5.2, the HRS data depict the prevalence of private pension income by region. The Pacific region is shown to be comparable to most other regions. This type of information can be quite difficult and expensive to obtain. Having the HRS data helps policymakers anticipate the region’s adequacy in terms of private savings for old age. HRS data also provide a relative look at the region (or state, or county) in comparison to other parts of the nation, allowing policymakers to better anticipate their constituents’ unique financial needs.

38
92%
93%
94%
95%
96%
97%
98%
99%
100%
0 30 60 90 120
150
180
210
240
270
300
330
360
390
420
490
520
650
780
900
960
1,56
0
Amount in Thousands of Dollars
Perc
ent a
t of b
elow
this
leve
l of a
sset
s
Pacific Region
Average of All Other Regions
Chart A 5.1Percent of HRS Respondents with IRA Balances Valued Less than Amounts Shown:
Pacific Region Compared to All Other Regions
39.2%42.9% 45.7%
39.1%36.2% 36.0%
28.3%34.5%
37.7%
0%
10%
20%
30%
40%
50%
New
Engl
and
Mid
Atla
ntic
East
Nor
thC
entra
l
Wes
tN
orth
Cen
tral
Sout
hAt
lant
ic
East
Sou
thC
entra
l
Wes
tSo
uth
Cen
tral
Mou
ntai
n
Paci
fic
Chart A 5.2Percentage of Households Receiving Private Pension Income by Region
HRS
Health Data in HRS Health measures are similarly contained in HRS to a significant level of detail and include information on public and private health insurance programs, as shown in Chart A 5.3. This diagram on Medicare coverage by region indicates that the Pacific region’s population is less likely to have health insurance than populations elsewhere in the nation. By combining this information with demographic information contained within HRS and the census, one can control for average age within the region and better anticipate likely developments regarding coverage in years to come as the whole HRS cohort moves past the normal retirement age. We have included smoking behavior in Chart A 5.4 because smoking is well known to induce large health-related expenses. This diagram illustrates the existence of regional differences. In this case, inhabitants of the Pacific region are less likely to smoke than any other regional

39
population. (Because of rounding, the Pacific and Mountain regions appear to be the same in Chart A 5.4.)
38.0%40.7% 40.0% 40.0%
42.4% 43.9%41.0%
38.6% 37.8%
0%
10%
20%
30%
40%
50%N
ewEn
glan
d
Mid
Atla
ntic
East
Nor
thC
entra
l
Wes
t Nor
thC
entra
l
Sout
hAt
lant
ic
East
Sou
thC
entra
l
Wes
t Sou
thC
entra
l
Mou
ntai
n
Paci
fic
Chart A 5.3Percentage of Respondents with Medicare Coverage by Region
HRS 2000
16.6% 18.0% 17.8% 16.5%20.6% 19.9% 19.6%
15.2% 15.2%
0%
10%
20%
30%
New
Engl
and
Mid
Atla
ntic
East
Nor
thC
entra
l
Wes
t Nor
thC
entra
l
Sout
hAt
lant
ic
East
Sou
thC
entra
l
Wes
t Sou
thC
entra
l
Mou
ntai
n
Paci
fic
Chart A 5.4Percentage of Respondents Currently Smoking by Region
HRS 2000
Final Conclusions Regarding HRS and State Data Needs While by no means comprehensive, the look at HRS data afforded by this appendix indicates that in many instances the Pacific region, which includes California, is quite similar to the rest of the nation. The differences are valuable to note, and can inform policymakers about possible unique hazards facing residents within their states. Re-weighting the data can easily accommodate sample differences for the purpose of more-detailed secondary analysis. We cannot recommend strongly enough the value of California gaining access to the confidential HRS data, which offers the richest detail at the state and local levels.