Embed Size (px)
Citation preview
GOVERNMENT OF JAMMU AND KASHMIRPlanning and Development Department
STATISTICAL HANDBOOKBLOCK CHENANI
2013-14
Issued By:-
Directorate of Economics and StatisticsDistrict Statistics & Evaluation Office
Prepared at:District Statistics & Evaluation Office Udhampur
Statistical Handbook 2013-14 Block Chenani
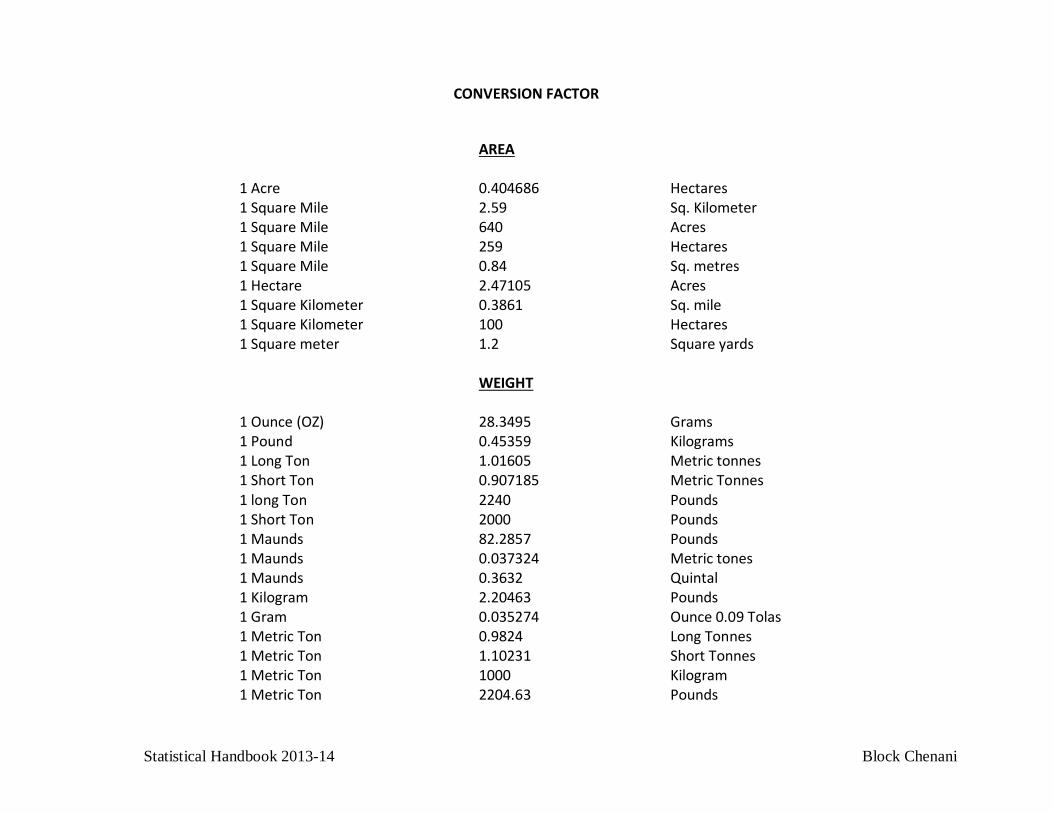
CONVERSION FACTOR
AREA 1 Acre 0.404686 Hectares 1 Square Mile 2.59 Sq. Kilometer 1 Square Mile 640 Acres 1 Square Mile 259 Hectares 1 Square Mile 0.84 Sq. metres 1 Hectare 2.47105 Acres 1 Square Kilometer 0.3861 Sq. mile 1 Square Kilometer 100 Hectares 1 Square meter 1.2 Square yards WEIGHT 1 Ounce (OZ) 28.3495 Grams 1 Pound 0.45359 Kilograms 1 Long Ton 1.01605 Metric tonnes 1 Short Ton 0.907185 Metric Tonnes 1 long Ton 2240 Pounds 1 Short Ton 2000 Pounds 1 Maunds 82.2857 Pounds 1 Maunds 0.037324 Metric tones 1 Maunds 0.3632 Quintal 1 Kilogram 2.20463 Pounds 1 Gram 0.035274 Ounce 0.09 Tolas 1 Metric Ton 0.9824 Long Tonnes 1 Metric Ton 1.10231 Short Tonnes 1 Metric Ton 1000 Kilogram 1 Metric Ton 2204.63 Pounds
Statistical Handbook 2013-14 Block Chenani
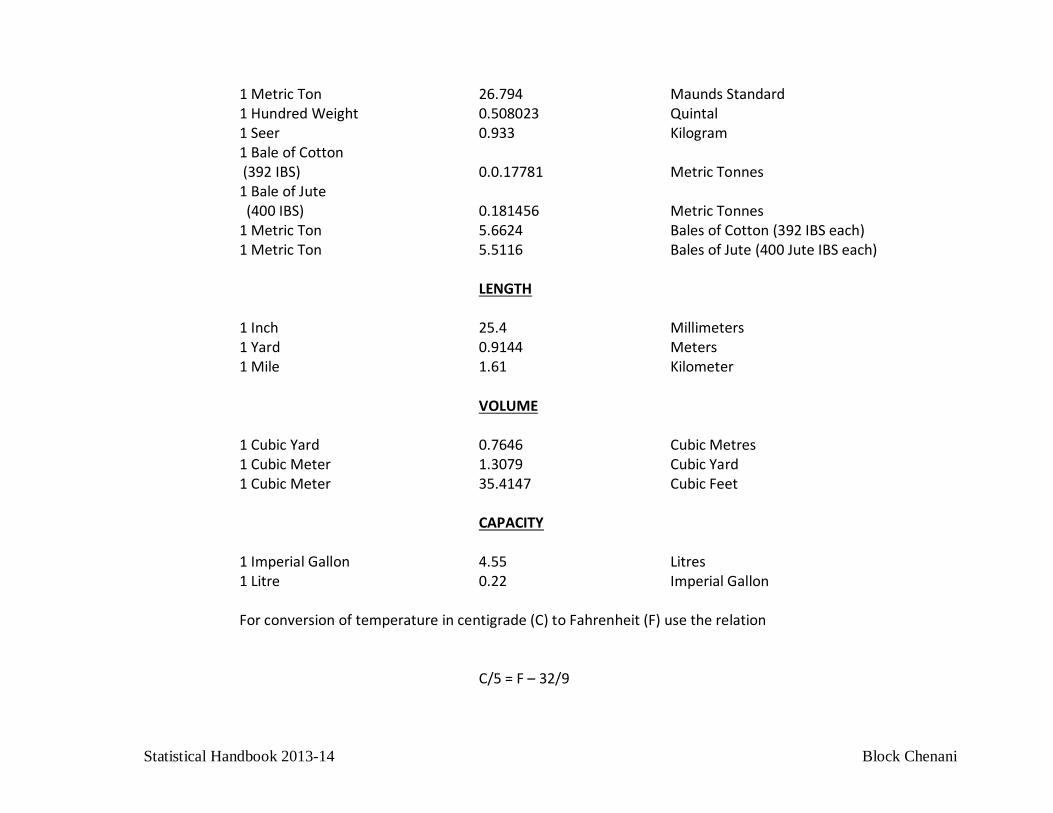
1 Metric Ton 26.794 Maunds Standard 1 Hundred Weight 0.508023 Quintal 1 Seer 0.933 Kilogram 1 Bale of Cotton (392 IBS) 0.0.17781 Metric Tonnes 1 Bale of Jute (400 IBS) 0.181456 Metric Tonnes 1 Metric Ton 5.6624 Bales of Cotton (392 IBS each) 1 Metric Ton 5.5116 Bales of Jute (400 Jute IBS each) LENGTH 1 Inch 25.4 Millimeters 1 Yard 0.9144 Meters 1 Mile 1.61 Kilometer VOLUME 1 Cubic Yard 0.7646 Cubic Metres 1 Cubic Meter 1.3079 Cubic Yard 1 Cubic Meter 35.4147 Cubic Feet CAPACITY 1 Imperial Gallon 4.55 Litres 1 Litre 0.22 Imperial Gallon For conversion of temperature in centigrade (C) to Fahrenheit (F) use the relation C/5 = F – 32/9
Statistical Handbook 2013-14 Block Chenani
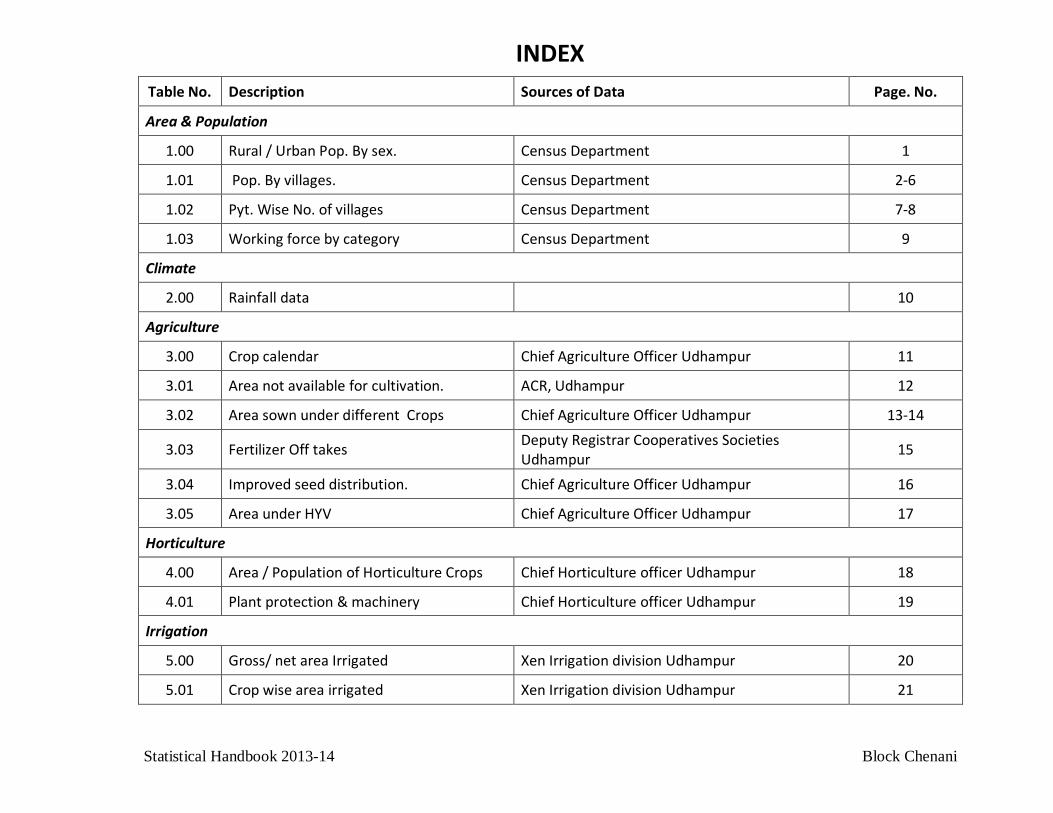
INDEX
Table No. Description Sources of Data Page. No.
Area & Population
1.00 Rural / Urban Pop. By sex. Census Department 1
1.01 Pop. By villages. Census Department 2-6
1.02 Pyt. Wise No. of villages Census Department 7-8
1.03 Working force by category Census Department 9
Climate
2.00 Rainfall data 10
Agriculture
3.00 Crop calendar Chief Agriculture Officer Udhampur 11
3.01 Area not available for cultivation. ACR, Udhampur 12
3.02 Area sown under different Crops Chief Agriculture Officer Udhampur 13-14
3.03 Fertilizer Off takes Deputy Registrar Cooperatives Societies Udhampur 15
3.04 Improved seed distribution. Chief Agriculture Officer Udhampur 16
3.05 Area under HYV Chief Agriculture Officer Udhampur 17
Horticulture
4.00 Area / Population of Horticulture Crops Chief Horticulture officer Udhampur 18
4.01 Plant protection & machinery Chief Horticulture officer Udhampur 19
Irrigation
5.00 Gross/ net area Irrigated Xen Irrigation division Udhampur 20
5.01 Crop wise area irrigated Xen Irrigation division Udhampur 21
Statistical Handbook 2013-14 Block Chenani
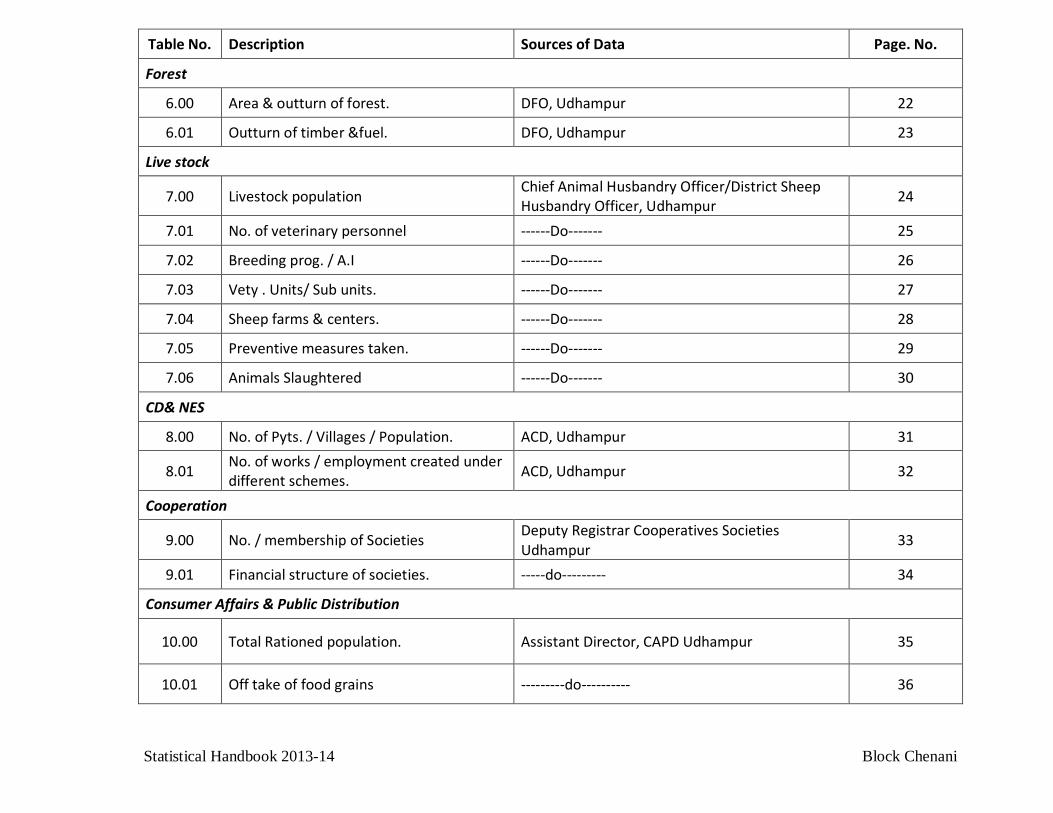
Table No. Description Sources of Data Page. No.
Forest
6.00 Area & outturn of forest. DFO, Udhampur 22
6.01 Outturn of timber &fuel. DFO, Udhampur 23
Live stock
7.00 Livestock population Chief Animal Husbandry Officer/District Sheep Husbandry Officer, Udhampur 24
7.01 No. of veterinary personnel ------Do------- 25
7.02 Breeding prog. / A.I ------Do------- 26
7.03 Vety . Units/ Sub units. ------Do------- 27
7.04 Sheep farms & centers. ------Do------- 28
7.05 Preventive measures taken. ------Do------- 29
7.06 Animals Slaughtered ------Do------- 30
CD& NES
8.00 No. of Pyts. / Villages / Population. ACD, Udhampur 31
8.01 No. of works / employment created under different schemes. ACD, Udhampur 32
Cooperation
9.00 No. / membership of Societies Deputy Registrar Cooperatives Societies Udhampur 33
9.01 Financial structure of societies. -----do--------- 34
Consumer Affairs & Public Distribution
10.00 Total Rationed population. Assistant Director, CAPD Udhampur 35
10.01 Off take of food grains ---------do---------- 36
Statistical Handbook 2013-14 Block Chenani
Table No. Description Sources of Data Page. No.
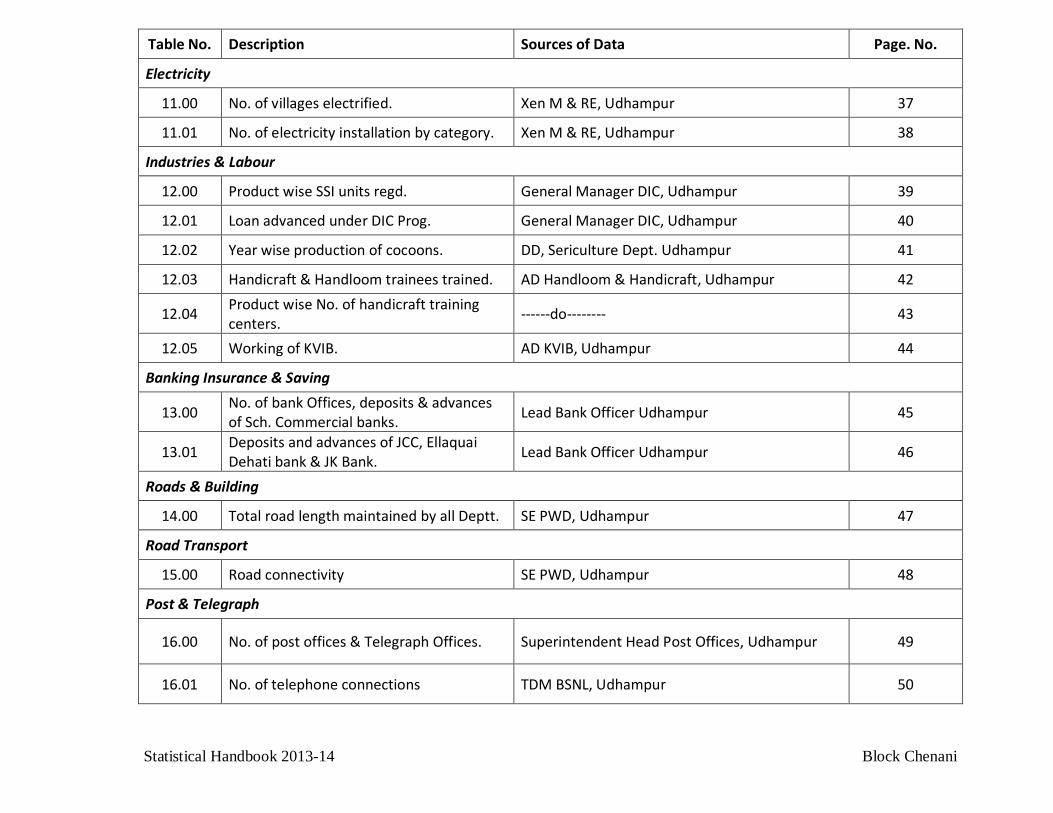
Electricity
11.00 No. of villages electrified. Xen M & RE, Udhampur 37
11.01 No. of electricity installation by category. Xen M & RE, Udhampur 38
Industries & Labour
12.00 Product wise SSI units regd. General Manager DIC, Udhampur 39
12.01 Loan advanced under DIC Prog. General Manager DIC, Udhampur 40
12.02 Year wise production of cocoons. DD, Sericulture Dept. Udhampur 41
12.03 Handicraft & Handloom trainees trained. AD Handloom & Handicraft, Udhampur 42
12.04 Product wise No. of handicraft training centers. ------do-------- 43
12.05 Working of KVIB. AD KVIB, Udhampur 44
Banking Insurance & Saving
13.00 No. of bank Offices, deposits & advances of Sch. Commercial banks. Lead Bank Officer Udhampur 45
13.01 Deposits and advances of JCC, Ellaquai Dehati bank & JK Bank. Lead Bank Officer Udhampur 46
Roads & Building
14.00 Total road length maintained by all Deptt. SE PWD, Udhampur 47
Road Transport
15.00 Road connectivity SE PWD, Udhampur 48
Post & Telegraph
16.00 No. of post offices & Telegraph Offices. Superintendent Head Post Offices, Udhampur 49
16.01 No. of telephone connections TDM BSNL, Udhampur 50
Statistical Handbook 2013-14 Block Chenani
Table No. Description Sources of Data Page. No.
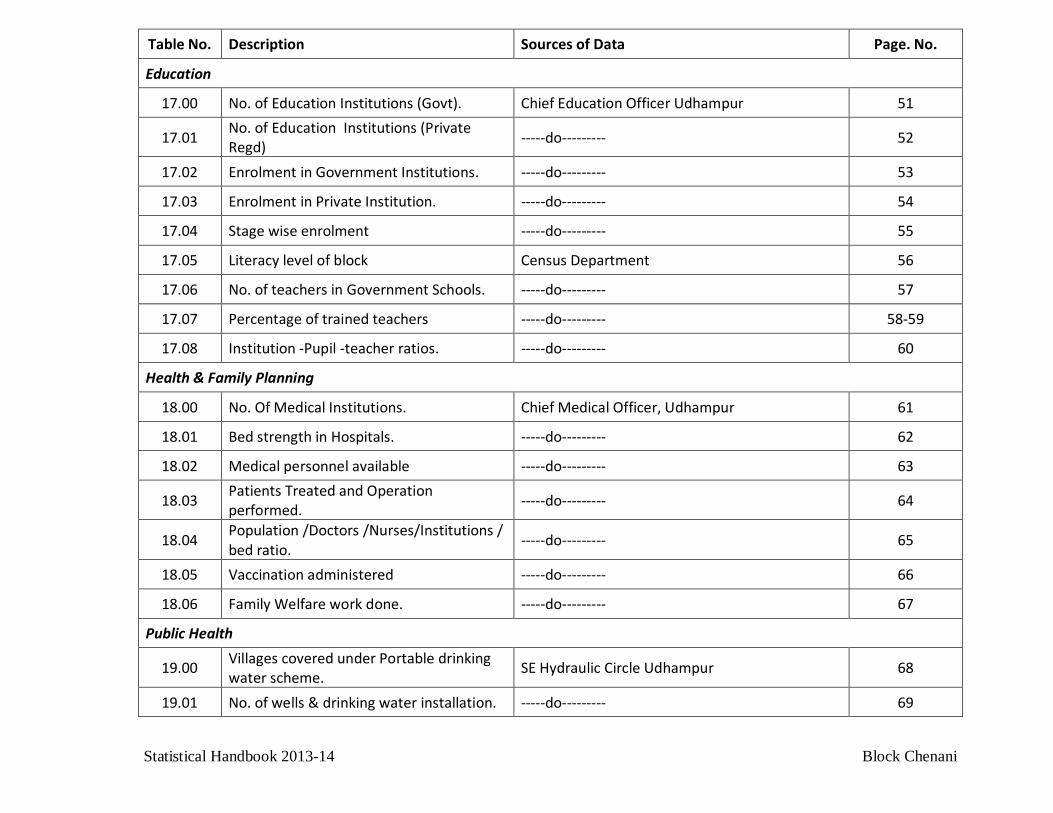
Education
17.00 No. of Education Institutions (Govt). Chief Education Officer Udhampur 51
17.01 No. of Education Institutions (Private Regd) -----do--------- 52
17.02 Enrolment in Government Institutions. -----do--------- 53
17.03 Enrolment in Private Institution. -----do--------- 54
17.04 Stage wise enrolment -----do--------- 55
17.05 Literacy level of block Census Department 56
17.06 No. of teachers in Government Schools. -----do--------- 57
17.07 Percentage of trained teachers -----do--------- 58-59
17.08 Institution -Pupil -teacher ratios. -----do--------- 60
Health & Family Planning
18.00 No. Of Medical Institutions. Chief Medical Officer, Udhampur 61
18.01 Bed strength in Hospitals. -----do--------- 62
18.02 Medical personnel available -----do--------- 63
18.03 Patients Treated and Operation performed. -----do--------- 64
18.04 Population /Doctors /Nurses/Institutions / bed ratio. -----do--------- 65
18.05 Vaccination administered -----do--------- 66
18.06 Family Welfare work done. -----do--------- 67
Public Health
19.00 Villages covered under Portable drinking water scheme. SE Hydraulic Circle Udhampur 68
19.01 No. of wells & drinking water installation. -----do--------- 69
Statistical Handbook 2013-14 Block Chenani
Table No. Description Sources of Data Page. No.
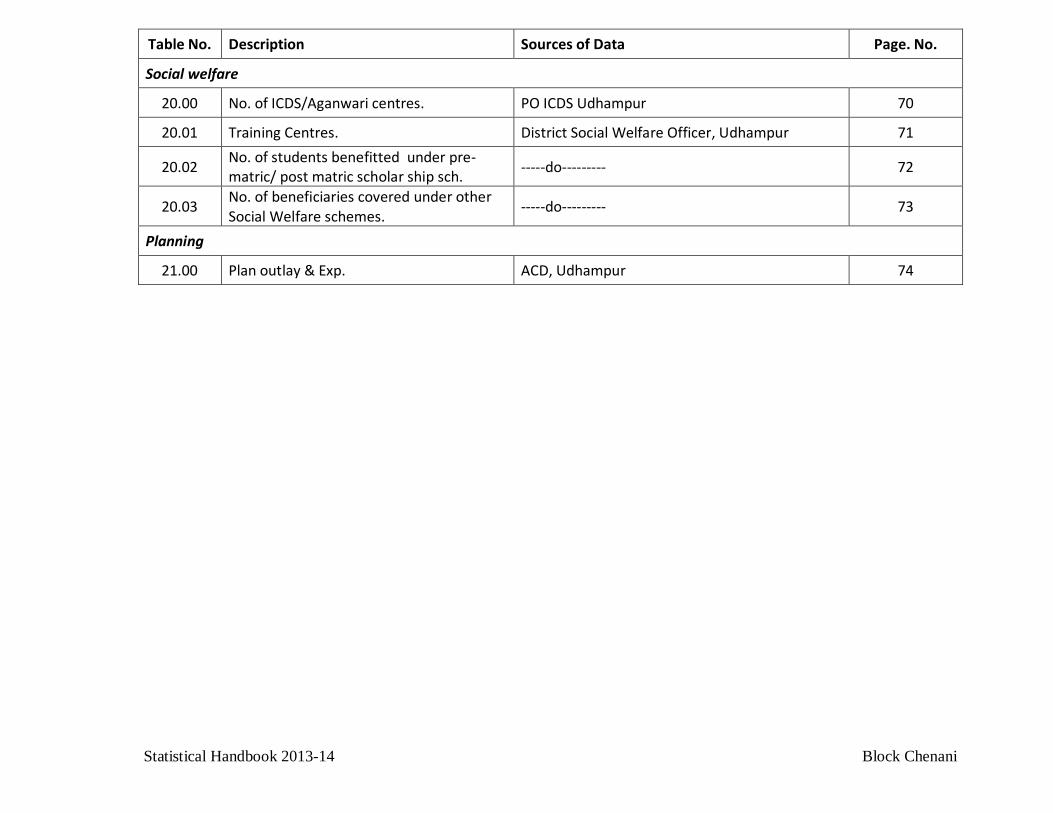
Social welfare
20.00 No. of ICDS/Aganwari centres. PO ICDS Udhampur 70
20.01 Training Centres. District Social Welfare Officer, Udhampur 71
20.02 No. of students benefitted under pre-matric/ post matric scholar ship sch. -----do--------- 72
20.03 No. of beneficiaries covered under other Social Welfare schemes. -----do--------- 73
Planning
21.00 Plan outlay & Exp. ACD, Udhampur 74
Statistical Handbook 2013-14 - 1 - Block Chenani
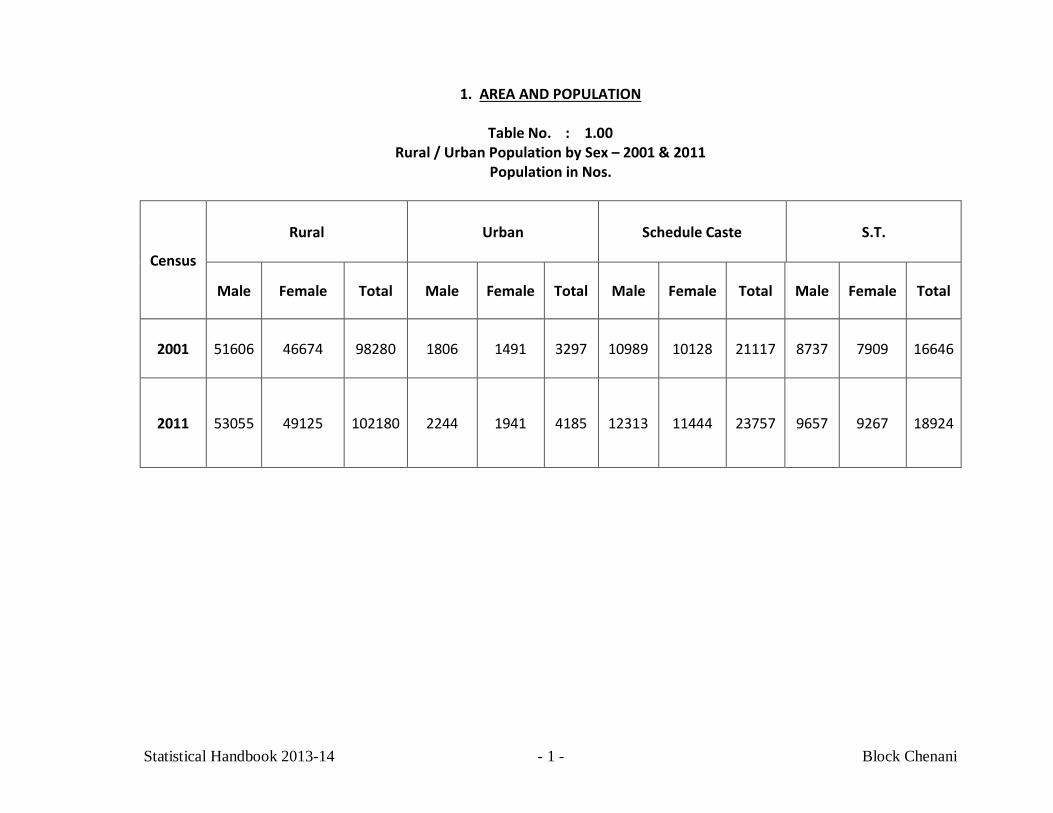
1. AREA AND POPULATION
Table No. : 1.00 Rural / Urban Population by Sex – 2001 & 2011
Population in Nos.
Census
Rural Urban Schedule Caste S.T.
Male Female Total Male Female Total Male Female Total Male Female Total
2001 51606 46674 98280 1806 1491 3297 10989 10128 21117 8737 7909
16646
2011 53055 49125 102180 2244 1941 4185 12313 11444 23757 9657 9267 18924
Statistical Handbook 2013-14 - 2 - Block Chenani
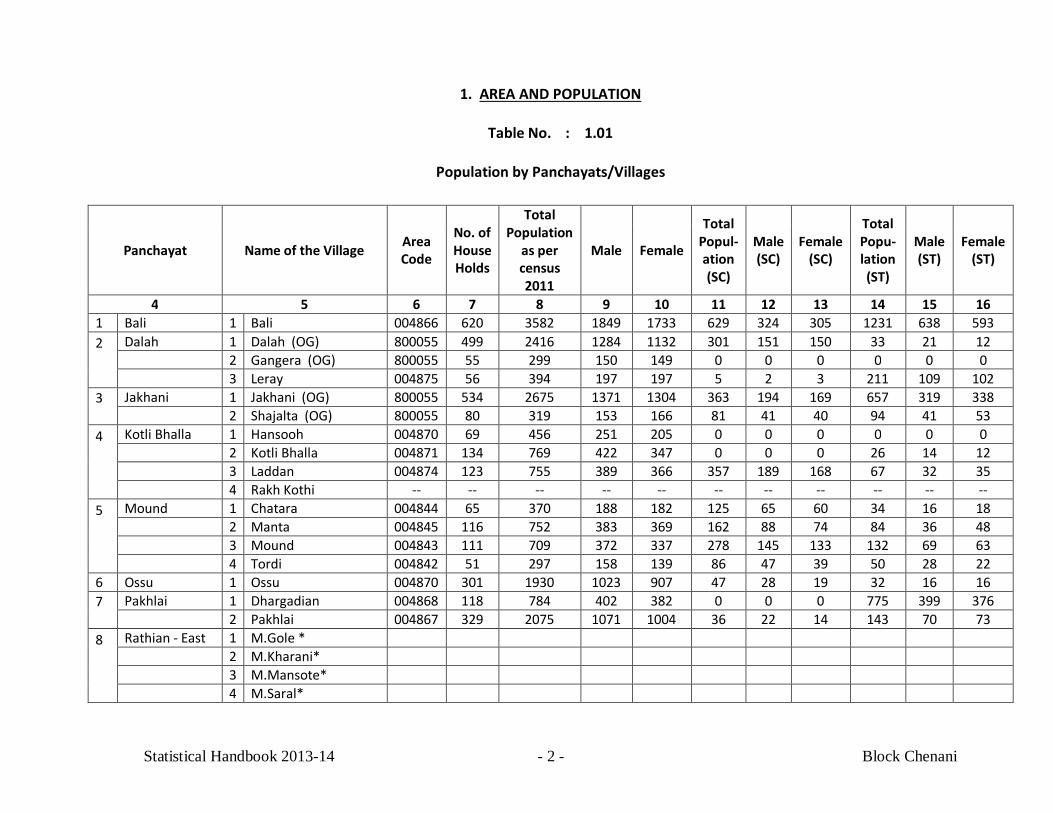
1. AREA AND POPULATION
Table No. : 1.01
Population by Panchayats/Villages
Panchayat Name of the Village Area Code
No. of House Holds
Total Population
as per census 2011
Male Female
Total Popul-ation (SC)
Male (SC)
Female (SC)
Total Popu-lation (ST)
Male (ST)
Female (ST)
4 5 6 7 8 9 10 11 12 13 14 15 16 1 Bali 1 Bali 004866 620 3582 1849 1733 629 324 305 1231 638 593 2
Dalah 1 Dalah (OG) 800055 499 2416 1284 1132 301 151 150 33 21 12 2 Gangera (OG) 800055 55 299 150 149 0 0 0 0 0 0 3 Leray 004875 56 394 197 197 5 2 3 211 109 102
3
Jakhani 1 Jakhani (OG) 800055 534 2675 1371 1304 363 194 169 657 319 338 2 Shajalta (OG) 800055 80 319 153 166 81 41 40 94 41 53
4
Kotli Bhalla 1 Hansooh 004870 69 456 251 205 0 0 0 0 0 0 2 Kotli Bhalla 004871 134 769 422 347 0 0 0 26 14 12 3 Laddan 004874 123 755 389 366 357 189 168 67 32 35 4 Rakh Kothi -- -- -- -- -- -- -- -- -- -- --
5
Mound 1 Chatara 004844 65 370 188 182 125 65 60 34 16 18 2 Manta 004845 116 752 383 369 162 88 74 84 36 48 3 Mound 004843 111 709 372 337 278 145 133 132 69 63 4 Tordi 004842 51 297 158 139 86 47 39 50 28 22
6 Ossu 1 Ossu 004870 301 1930 1023 907 47 28 19 32 16 16 7
Pakhlai 1 Dhargadian 004868 118 784 402 382 0 0 0 775 399 376 2 Pakhlai 004867 329 2075 1071 1004 36 22 14 143 70 73
8
Rathian - East 1 M.Gole * 2 M.Kharani* 3 M.Mansote* 4 M.Saral*
Statistical Handbook 2013-14 - 3 - Block Chenani
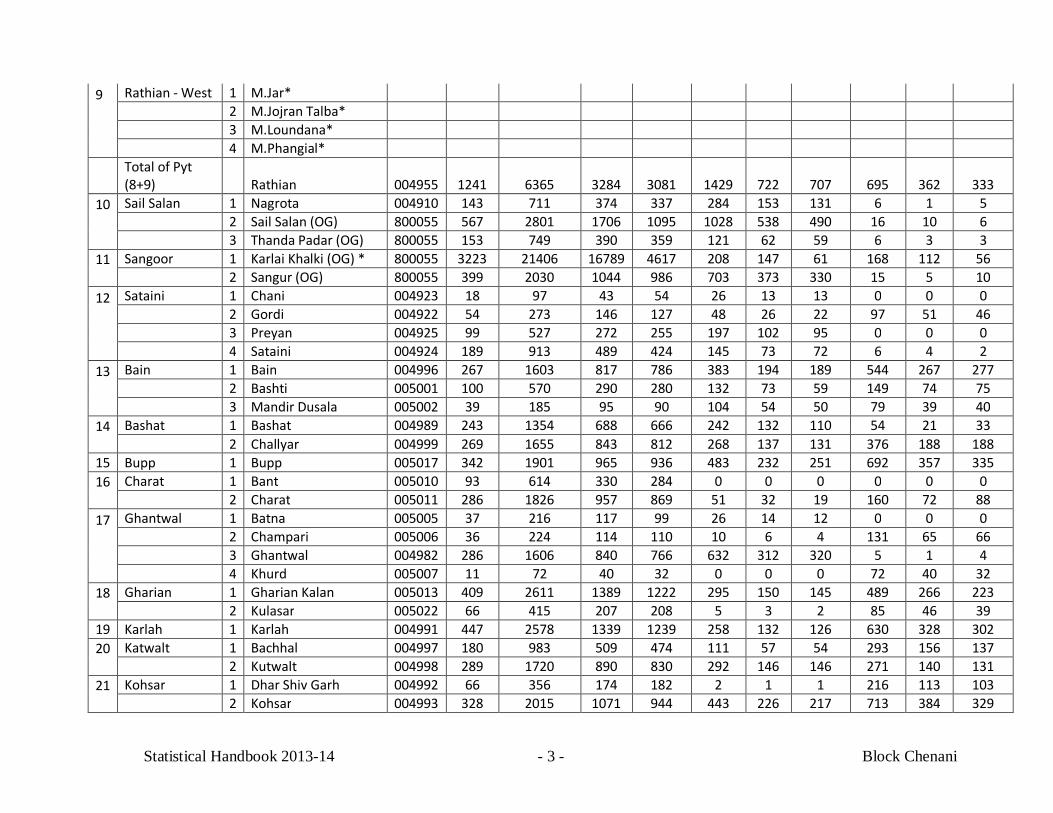
9
Rathian - West 1 M.Jar* 2 M.Jojran Talba* 3 M.Loundana* 4 M.Phangial*
Total of Pyt (8+9) Rathian 004955 1241 6365 3284 3081 1429 722 707 695 362 333
10
Sail Salan 1 Nagrota 004910 143 711 374 337 284 153 131 6 1 5 2 Sail Salan (OG) 800055 567 2801 1706 1095 1028 538 490 16 10 6 3 Thanda Padar (OG) 800055 153 749 390 359 121 62 59 6 3 3
11
Sangoor 1 Karlai Khalki (OG) * 800055 3223 21406 16789 4617 208 147 61 168 112 56 2 Sangur (OG) 800055 399 2030 1044 986 703 373 330 15 5 10
12
Sataini 1 Chani 004923 18 97 43 54 26 13 13 0 0 0 2 Gordi 004922 54 273 146 127 48 26 22 97 51 46 3 Preyan 004925 99 527 272 255 197 102 95 0 0 0 4 Sataini 004924 189 913 489 424 145 73 72 6 4 2
13
Bain 1 Bain 004996 267 1603 817 786 383 194 189 544 267 277 2 Bashti 005001 100 570 290 280 132 73 59 149 74 75 3 Mandir Dusala 005002 39 185 95 90 104 54 50 79 39 40
14
Bashat 1 Bashat 004989 243 1354 688 666 242 132 110 54 21 33 2 Challyar 004999 269 1655 843 812 268 137 131 376 188 188
15 Bupp 1 Bupp 005017 342 1901 965 936 483 232 251 692 357 335 16
Charat 1 Bant 005010 93 614 330 284 0 0 0 0 0 0 2 Charat 005011 286 1826 957 869 51 32 19 160 72 88
17
Ghantwal 1 Batna 005005 37 216 117 99 26 14 12 0 0 0 2 Champari 005006 36 224 114 110 10 6 4 131 65 66 3 Ghantwal 004982 286 1606 840 766 632 312 320 5 1 4 4 Khurd 005007 11 72 40 32 0 0 0 72 40 32
18
Gharian 1 Gharian Kalan 005013 409 2611 1389 1222 295 150 145 489 266 223 2 Kulasar 005022 66 415 207 208 5 3 2 85 46 39
19 Karlah 1 Karlah 004991 447 2578 1339 1239 258 132 126 630 328 302 20
Katwalt 1 Bachhal 004997 180 983 509 474 111 57 54 293 156 137 2 Kutwalt 004998 289 1720 890 830 292 146 146 271 140 131
21
Kohsar 1 Dhar Shiv Garh 004992 66 356 174 182 2 1 1 216 113 103 2 Kohsar 004993 328 2015 1071 944 443 226 217 713 384 329
Statistical Handbook 2013-14 - 4 - Block Chenani
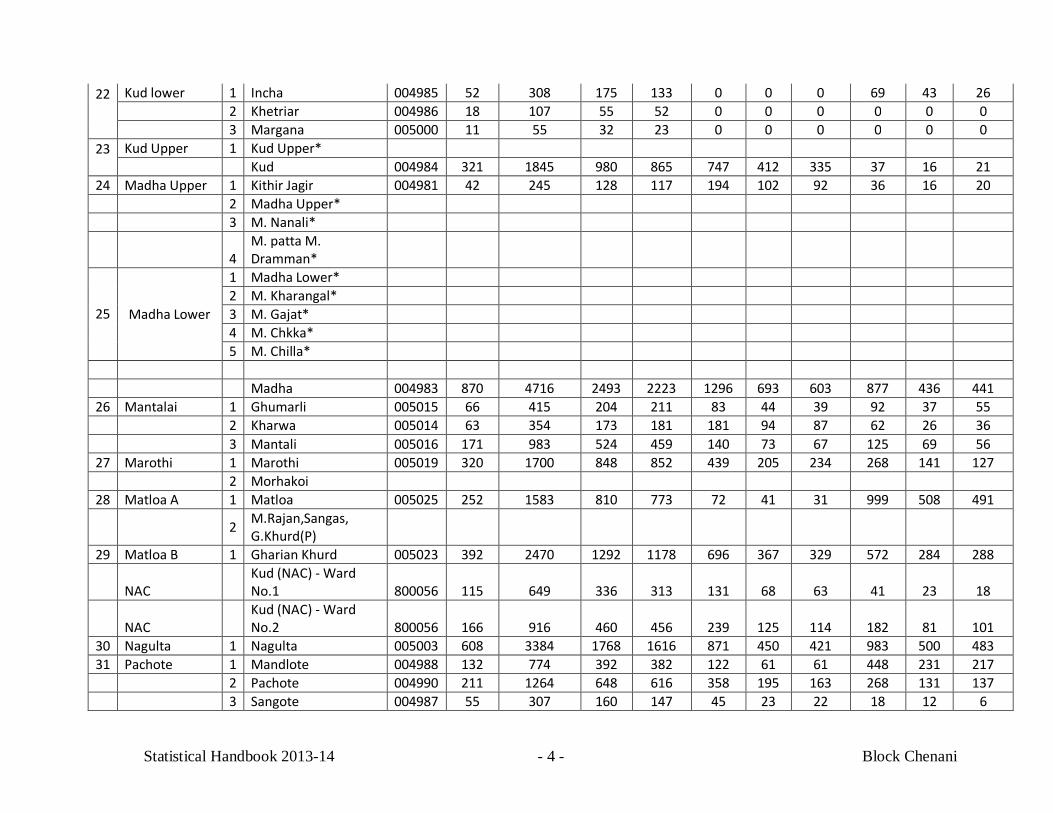
22
Kud lower 1 Incha 004985 52 308 175 133 0 0 0 69 43 26 2 Khetriar 004986 18 107 55 52 0 0 0 0 0 0 3 Margana 005000 11 55 32 23 0 0 0 0 0 0
23
Kud Upper 1 Kud Upper* Kud 004984 321 1845 980 865 747 412 335 37 16 21
24 Madha Upper 1 Kithir Jagir 004981 42 245 128 117 194 102 92 36 16 20 2 Madha Upper* 3 M. Nanali*
4 M. patta M. Dramman*
25
Madha Lower
1 Madha Lower* 2 M. Kharangal* 3 M. Gajat* 4 M. Chkka* 5 M. Chilla*
Madha 004983 870 4716 2493 2223 1296 693 603 877 436 441 26 Mantalai 1 Ghumarli 005015 66 415 204 211 83 44 39 92 37 55 2 Kharwa 005014 63 354 173 181 181 94 87 62 26 36 3 Mantali 005016 171 983 524 459 140 73 67 125 69 56 27 Marothi 1 Marothi 005019 320 1700 848 852 439 205 234 268 141 127 2 Morhakoi 28 Matloa A 1 Matloa 005025 252 1583 810 773 72 41 31 999 508 491
2 M.Rajan,Sangas, G.Khurd(P)
29 Matloa B 1 Gharian Khurd 005023 392 2470 1292 1178 696 367 329 572 284 288
NAC Kud (NAC) - Ward No.1 800056 115 649 336 313 131 68 63 41 23 18
NAC Kud (NAC) - Ward No.2 800056 166 916 460 456 239 125 114 182 81 101
30 Nagulta 1 Nagulta 005003 608 3384 1768 1616 871 450 421 983 500 483 31 Pachote 1 Mandlote 004988 132 774 392 382 122 61 61 448 231 217 2 Pachote 004990 211 1264 648 616 358 195 163 268 131 137 3 Sangote 004987 55 307 160 147 45 23 22 18 12 6
Statistical Handbook 2013-14 - 5 - Block Chenani
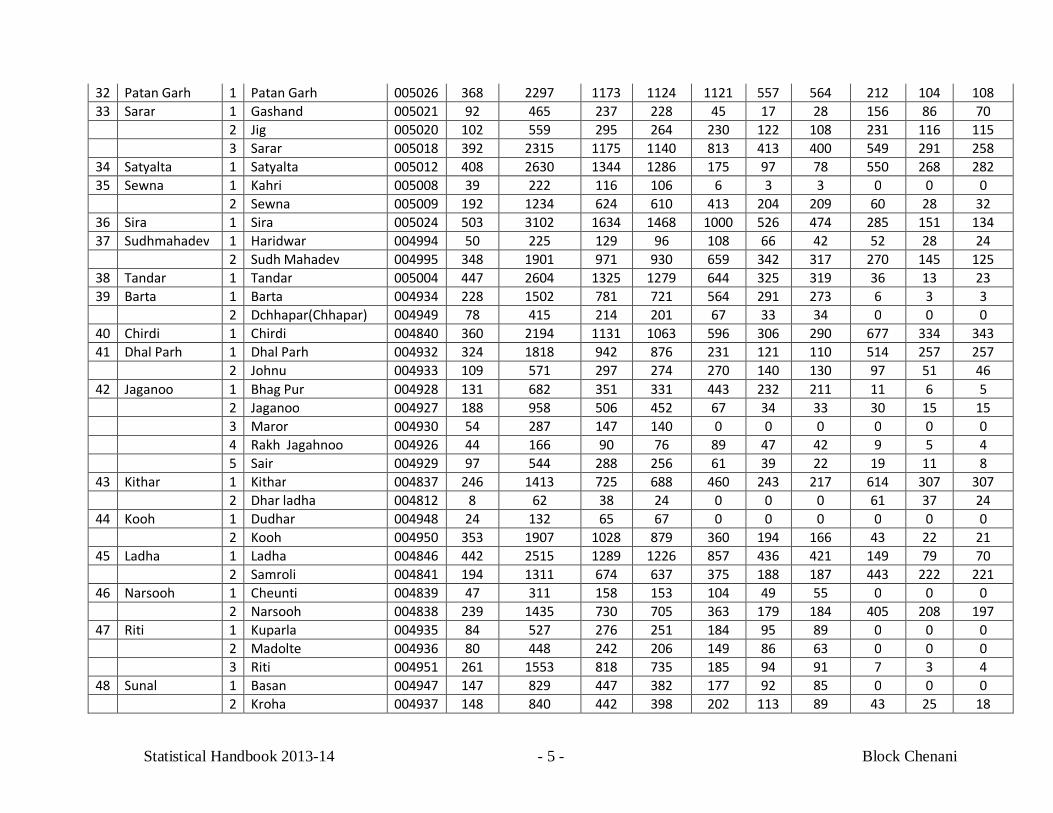
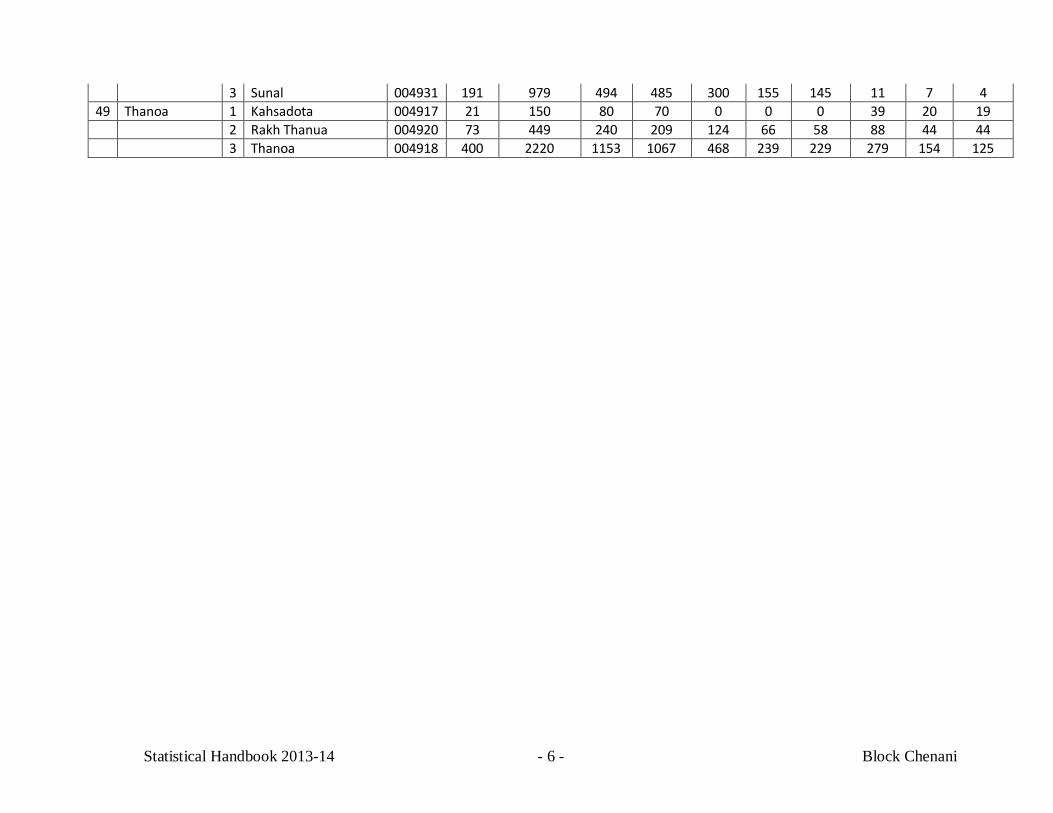
32 Patan Garh 1 Patan Garh 005026 368 2297 1173 1124 1121 557 564 212 104 108 33 Sarar 1 Gashand 005021 92 465 237 228 45 17 28 156 86 70 2 Jig 005020 102 559 295 264 230 122 108 231 116 115 3 Sarar 005018 392 2315 1175 1140 813 413 400 549 291 258 34 Satyalta 1 Satyalta 005012 408 2630 1344 1286 175 97 78 550 268 282 35 Sewna 1 Kahri 005008 39 222 116 106 6 3 3 0 0 0 2 Sewna 005009 192 1234 624 610 413 204 209 60 28 32 36 Sira 1 Sira 005024 503 3102 1634 1468 1000 526 474 285 151 134 37 Sudhmahadev 1 Haridwar 004994 50 225 129 96 108 66 42 52 28 24 2 Sudh Mahadev 004995 348 1901 971 930 659 342 317 270 145 125 38 Tandar 1 Tandar 005004 447 2604 1325 1279 644 325 319 36 13 23 39 Barta 1 Barta 004934 228 1502 781 721 564 291 273 6 3 3 2 Dchhapar(Chhapar) 004949 78 415 214 201 67 33 34 0 0 0 40 Chirdi 1 Chirdi 004840 360 2194 1131 1063 596 306 290 677 334 343 41 Dhal Parh 1 Dhal Parh 004932 324 1818 942 876 231 121 110 514 257 257 2 Johnu 004933 109 571 297 274 270 140 130 97 51 46 42 Jaganoo 1 Bhag Pur 004928 131 682 351 331 443 232 211 11 6 5 2 Jaganoo 004927 188 958 506 452 67 34 33 30 15 15 3 Maror 004930 54 287 147 140 0 0 0 0 0 0 4 Rakh Jagahnoo 004926 44 166 90 76 89 47 42 9 5 4 5 Sair 004929 97 544 288 256 61 39 22 19 11 8 43 Kithar 1 Kithar 004837 246 1413 725 688 460 243 217 614 307 307 2 Dhar ladha 004812 8 62 38 24 0 0 0 61 37 24 44 Kooh 1 Dudhar 004948 24 132 65 67 0 0 0 0 0 0 2 Kooh 004950 353 1907 1028 879 360 194 166 43 22 21 45 Ladha 1 Ladha 004846 442 2515 1289 1226 857 436 421 149 79 70 2 Samroli 004841 194 1311 674 637 375 188 187 443 222 221 46 Narsooh 1 Cheunti 004839 47 311 158 153 104 49 55 0 0 0 2 Narsooh 004838 239 1435 730 705 363 179 184 405 208 197 47 Riti 1 Kuparla 004935 84 527 276 251 184 95 89 0 0 0 2 Madolte 004936 80 448 242 206 149 86 63 0 0 0 3 Riti 004951 261 1553 818 735 185 94 91 7 3 4 48 Sunal 1 Basan 004947 147 829 447 382 177 92 85 0 0 0 2 Kroha 004937 148 840 442 398 202 113 89 43 25 18
Statistical Handbook 2013-14 - 6 - Block Chenani
3 Sunal 004931 191 979 494 485 300 155 145 11 7 4 49 Thanoa 1 Kahsadota 004917 21 150 80 70 0 0 0 39 20 19 2 Rakh Thanua 004920 73 449 240 209 124 66 58 88 44 44 3 Thanoa 004918 400 2220 1153 1067 468 239 229 279 154 125
Statistical Handbook 2013-14 - 7 - Block Chenani
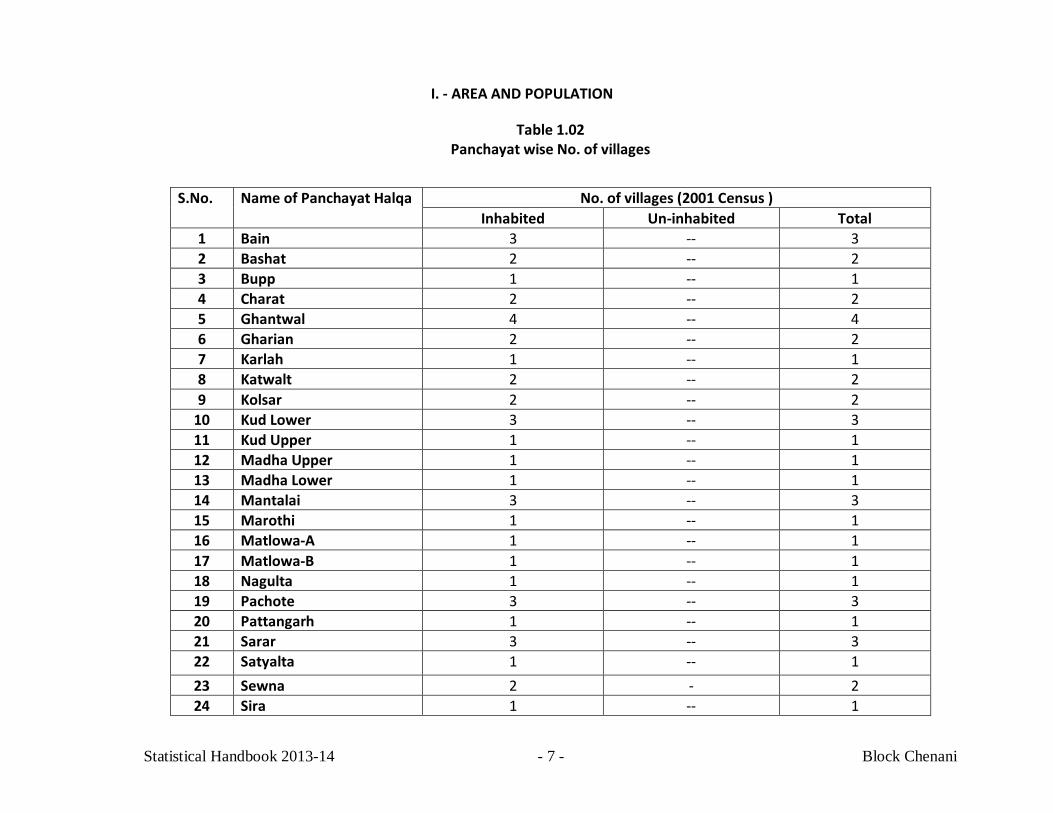
I. - AREA AND POPULATION
Table 1.02 Panchayat wise No. of villages
S.No. Name of Panchayat Halqa No. of villages (2001 Census ) Inhabited Un-inhabited Total
1 Bain 3 -- 3 2 Bashat 2 -- 2 3 Bupp 1 -- 1 4 Charat 2 -- 2 5 Ghantwal 4 -- 4 6 Gharian 2 -- 2 7 Karlah 1 -- 1 8 Katwalt 2 -- 2 9 Kolsar 2 -- 2
10 Kud Lower 3 -- 3 11 Kud Upper 1 -- 1 12 Madha Upper 1 -- 1 13 Madha Lower 1 -- 1 14 Mantalai 3 -- 3 15 Marothi 1 -- 1 16 Matlowa-A 1 -- 1 17 Matlowa-B 1 -- 1 18 Nagulta 1 -- 1 19 Pachote 3 -- 3 20 Pattangarh 1 -- 1 21 Sarar 3 -- 3 22 Satyalta
1 -- 1
23 Sewna 2 - 2 24 Sira 1 -- 1
Statistical Handbook 2013-14 - 8 - Block Chenani
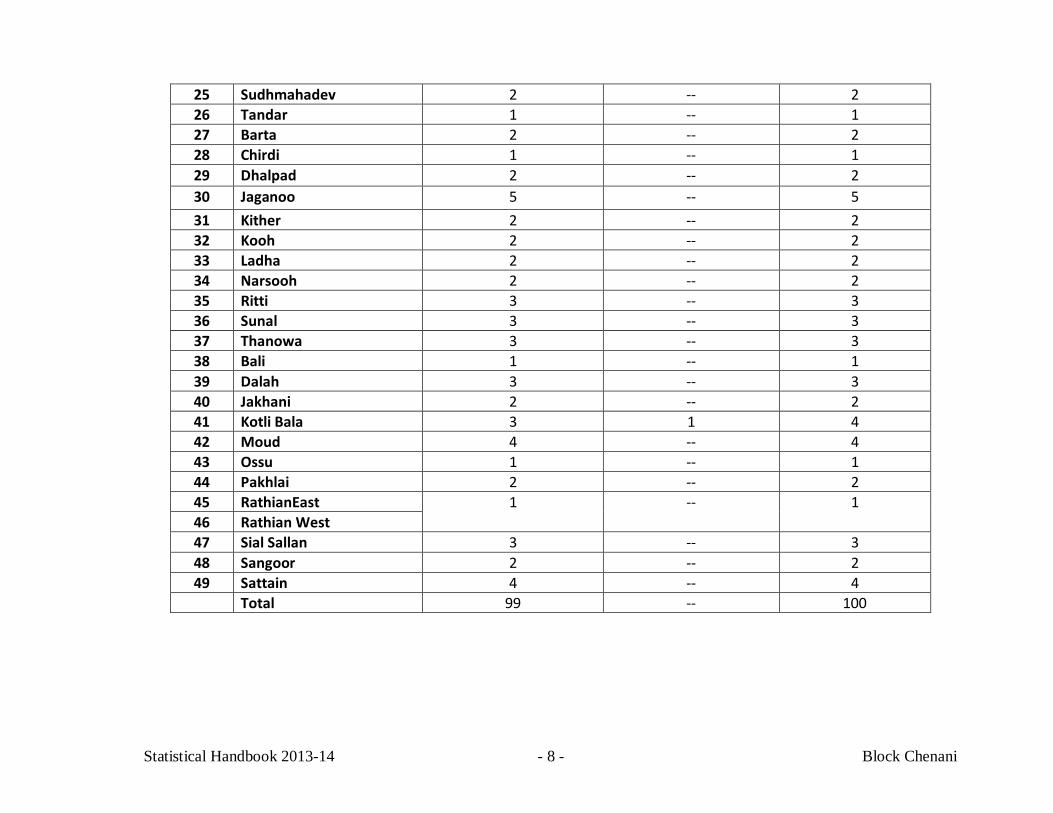
25 Sudhmahadev 2 -- 2 26 Tandar 1 -- 1 27 Barta 2 -- 2 28 Chirdi 1 -- 1 29 Dhalpad
2 -- 2
30 Jaganoo
5 -- 5 31 Kither 2 -- 2 32 Kooh 2 -- 2 33 Ladha 2 -- 2 34 Narsooh 2 -- 2 35 Ritti 3 -- 3 36 Sunal 3 -- 3 37 Thanowa 3 -- 3 38 Bali 1 -- 1 39 Dalah 3 -- 3 40 Jakhani 2 -- 2 41 Kotli Bala 3 1 4 42 Moud 4 -- 4 43 Ossu 1 -- 1 44 Pakhlai 2 -- 2 45 RathianEast 1 --
1
46 Rathian West 47 Sial Sallan 3 -- 3 48 Sangoor 2 -- 2 49 Sattain 4 -- 4
Total 99 -- 100
Statistical Handbook 2013-14 - 9 - Block Chenani
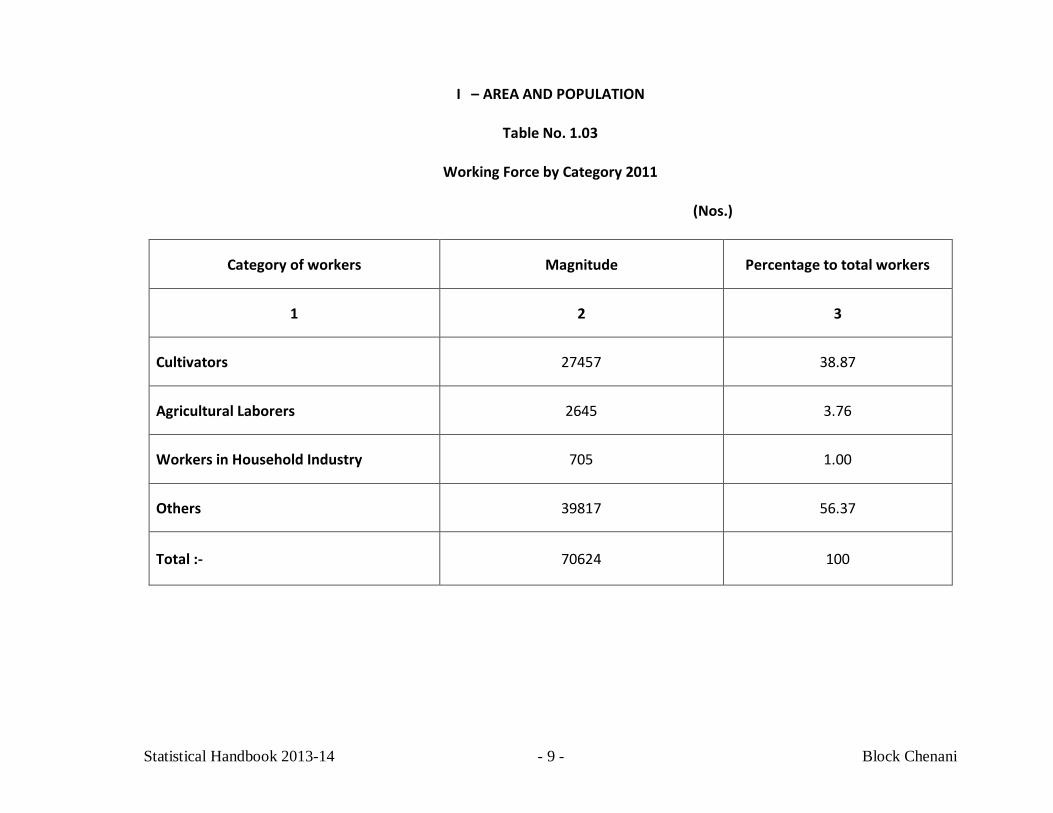
I – AREA AND POPULATION
Table No. 1.03
Working Force by Category 2011
(Nos.)
Category of workers Magnitude Percentage to total workers
1 2 3
Cultivators 27457 38.87
Agricultural Laborers 2645 3.76
Workers in Household Industry 705 1.00
Others 39817 56.37
Total :- 70624 100
Statistical Handbook 2013-14 - 10 - Block Chenani
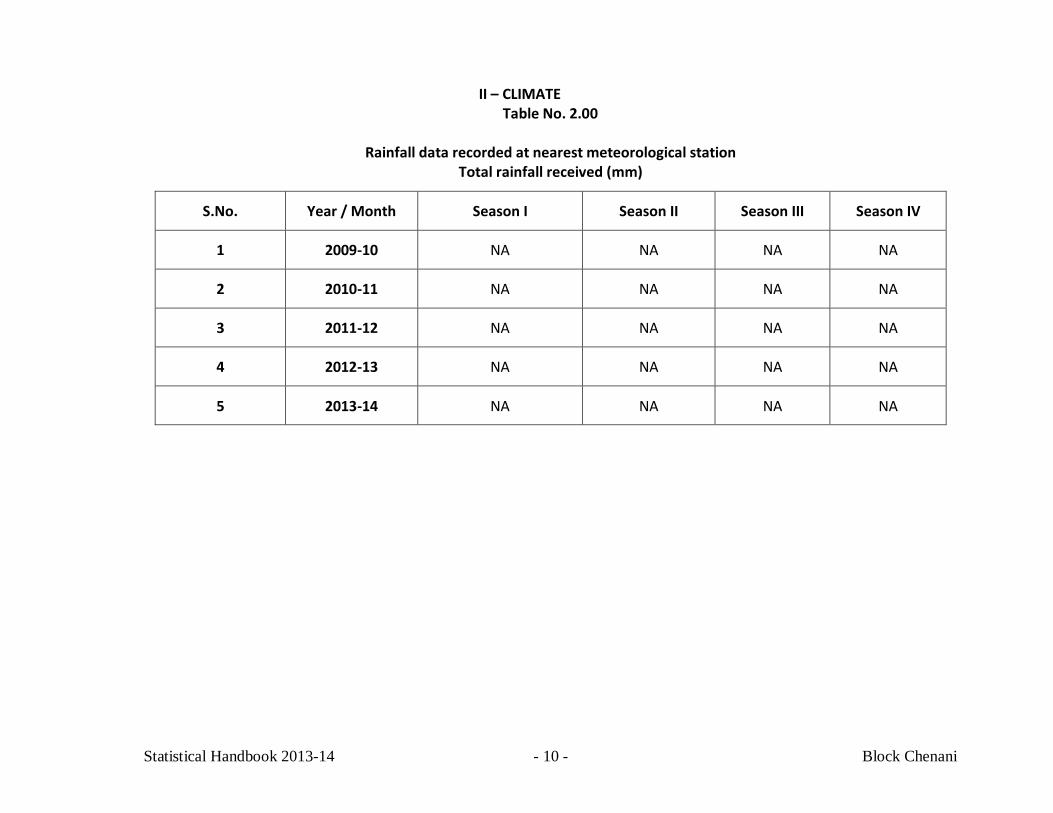
II – CLIMATE Table No. 2.00
Rainfall data recorded at nearest meteorological station
Total rainfall received (mm)
S.No. Year / Month Season I Season II Season III Season IV
1 2009-10 NA NA NA NA
2 2010-11 NA NA NA NA
3 2011-12 NA NA NA NA
4 2012-13 NA NA NA NA
5 2013-14 NA NA NA NA
Statistical Handbook 2013-14 - 11 - Block Chenani
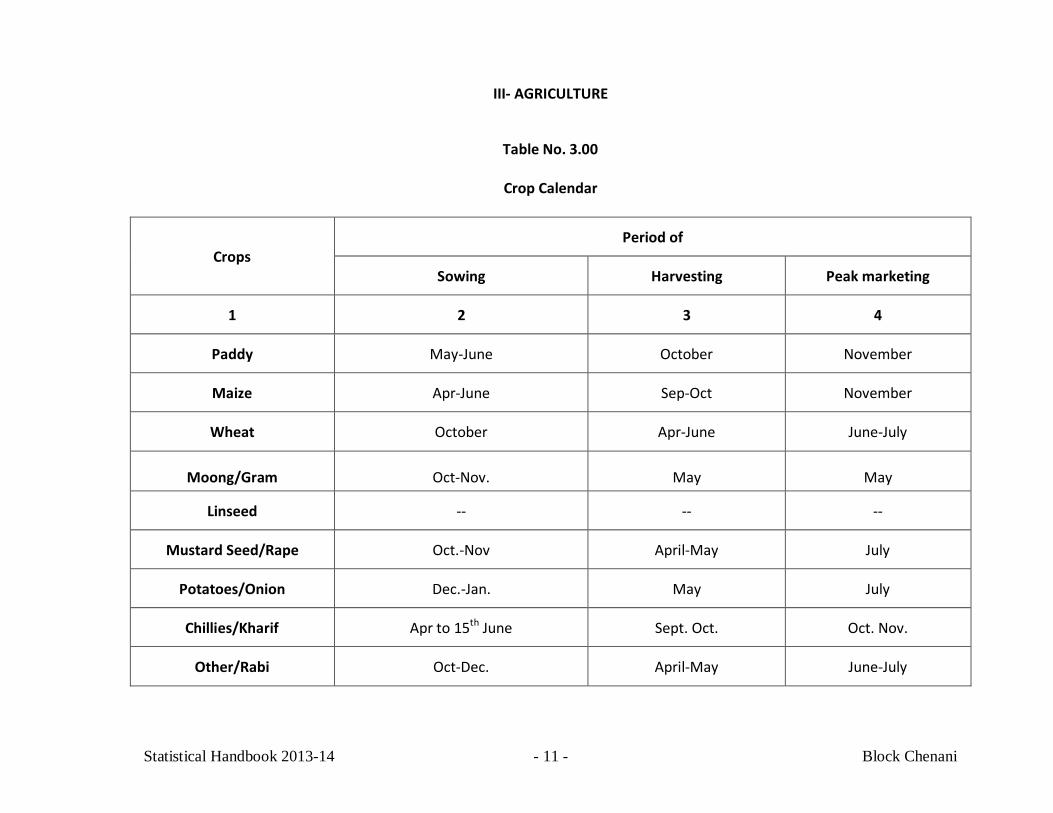
III- AGRICULTURE
Table No. 3.00
Crop Calendar
Crops Period of
Sowing Harvesting Peak marketing
1 2 3 4
Paddy May-June October November
Maize Apr-June Sep-Oct November
Wheat October Apr-June June-July
Moong/Gram Oct-Nov. May May
Linseed -- -- --
Mustard Seed/Rape Oct.-Nov April-May July
Potatoes/Onion Dec.-Jan. May July
Chillies/Kharif Apr to 15th June Sept. Oct. Oct. Nov.
Other/Rabi Oct-Dec. April-May June-July
Statistical Handbook 2013-14 - 12 - Block Chenani
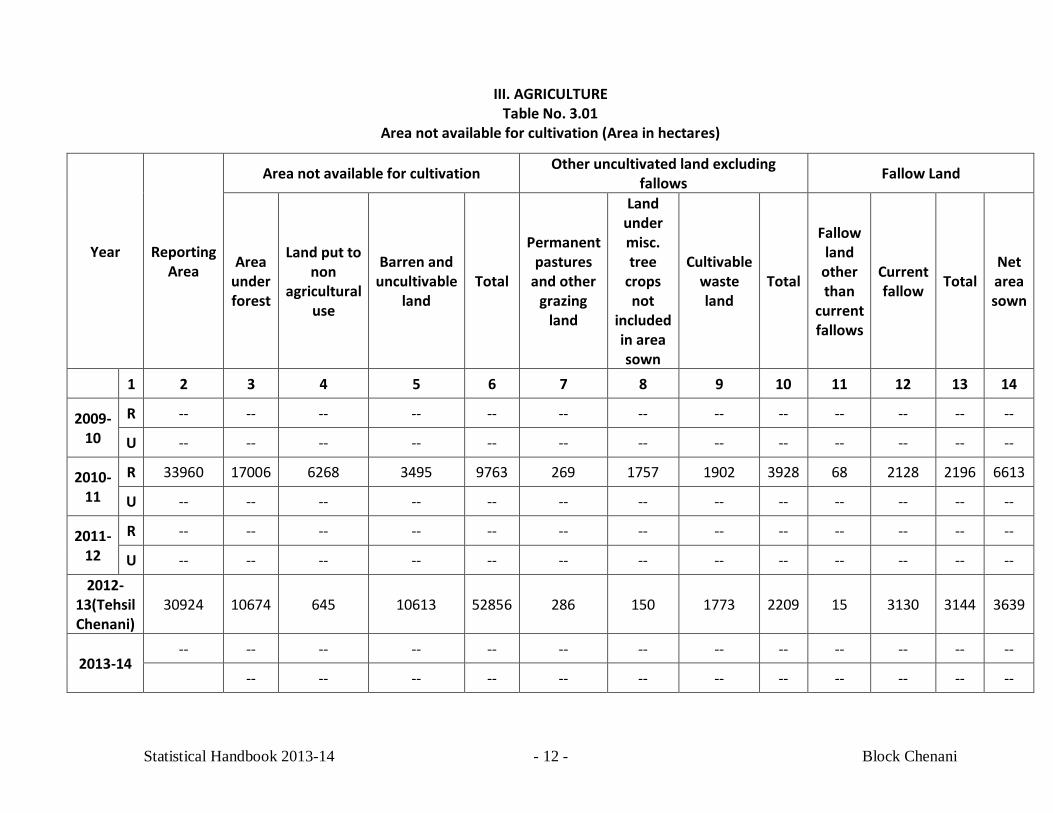
III. AGRICULTURE Table No. 3.01
Area not available for cultivation (Area in hectares)
Year
Reporting Area
Area not available for cultivation Other uncultivated land excluding fallows Fallow Land
Area under forest
Land put to non
agricultural use
Barren and uncultivable
land Total
Permanent pastures
and other grazing
land
Land under misc. tree
crops not
included in area sown
Cultivable waste land
Total
Fallow land
other than
current fallows
Current fallow Total
Net area sown
1 2 3 4 5 6 7 8 9 10 11 12 13 14
2009-10
R -- -- -- -- -- -- -- -- -- -- -- -- --
U -- -- -- -- -- -- -- -- -- -- -- -- --
2010-11
R 33960 17006 6268 3495 9763 269 1757 1902 3928 68 2128 2196 6613
U -- -- -- -- -- -- -- -- -- -- -- -- --
2011-12
R -- -- -- -- -- -- -- -- -- -- -- -- --
U -- -- -- -- -- -- -- -- -- -- -- -- -- 2012-
13(Tehsil Chenani)
30924 10674 645 10613 52856 286 150 1773 2209 15 3130 3144 3639
2013-14 -- -- -- -- -- -- -- -- -- -- -- -- --
-- -- -- -- -- -- -- -- -- -- -- --
Statistical Handbook 2013-14 - 13 - Block Chenani
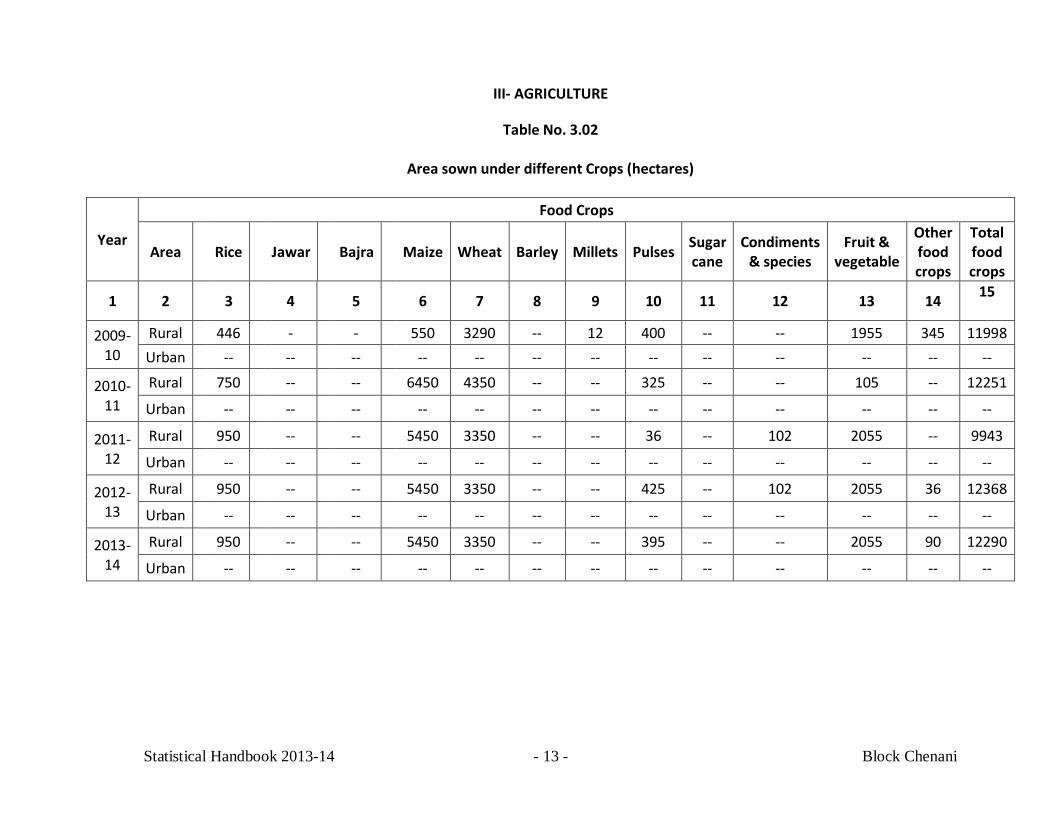
III- AGRICULTURE
Table No. 3.02
Area sown under different Crops (hectares)
Year
Food Crops
Area Rice Jawar Bajra Maize Wheat Barley Millets Pulses Sugar cane
Condiments & species
Fruit & vegetable
Other food crops
Total food crops
1 2 3 4 5 6 7 8 9 10 11 12 13 14 15
2009-10
Rural 446 - - 550 3290 -- 12 400 -- -- 1955 345 11998 Urban -- -- -- -- -- -- -- -- -- -- -- -- --
2010-11
Rural 750 -- -- 6450 4350 -- -- 325 -- -- 105 -- 12251
Urban -- -- -- -- -- -- -- -- -- -- -- -- --
2011-12
Rural 950 -- -- 5450 3350 -- -- 36 -- 102 2055 -- 9943
Urban -- -- -- -- -- -- -- -- -- -- -- -- --
2012-13
Rural 950 -- -- 5450 3350 -- -- 425 -- 102 2055 36 12368
Urban -- -- -- -- -- -- -- -- -- -- -- -- --
2013-14
Rural 950 -- -- 5450 3350 -- -- 395 -- -- 2055 90 12290
Urban -- -- -- -- -- -- -- -- -- -- -- -- --
Statistical Handbook 2013-14 - 14 - Block Chenani
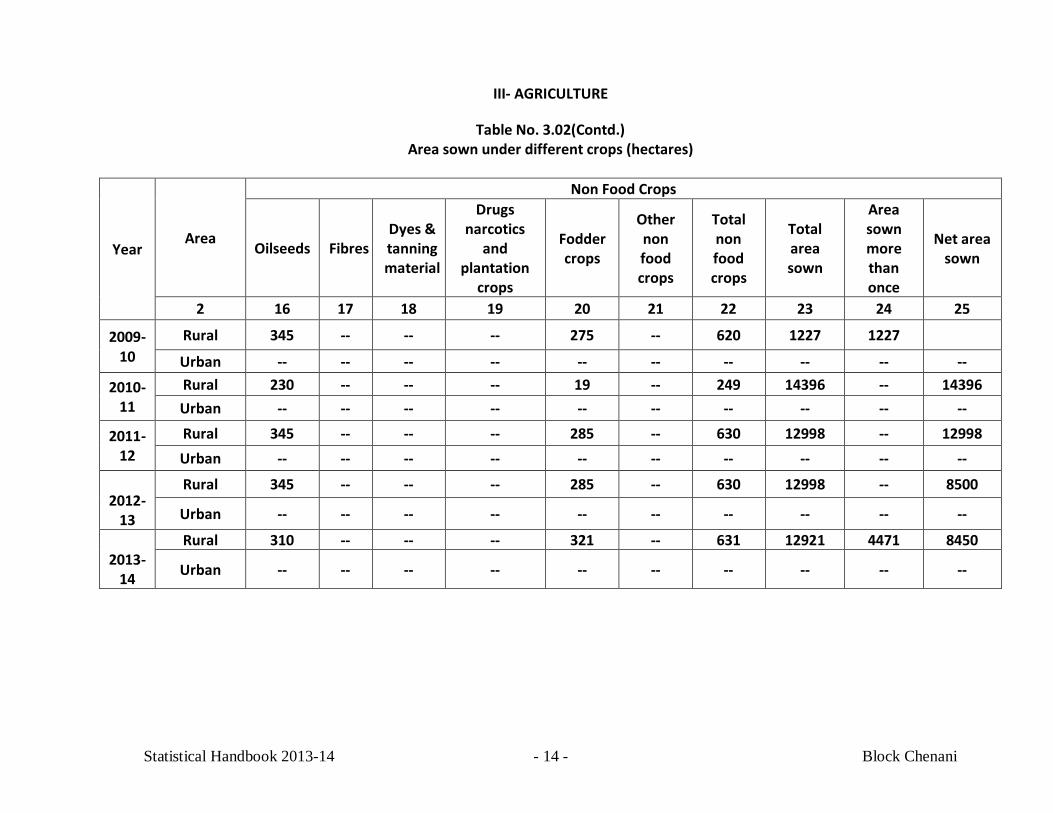
III- AGRICULTURE
Table No. 3.02(Contd.) Area sown under different crops (hectares)
Year Area
Non Food Crops
Oilseeds Fibres Dyes & tanning material
Drugs narcotics
and plantation
crops
Fodder crops
Other non food crops
Total non food crops
Total area sown
Area sown more than once
Net area sown
2 16 17 18 19 20 21 22 23 24 25
2009-10
Rural 345 -- -- -- 275 -- 620 1227 1227
Urban -- -- -- -- -- -- -- -- -- --
2010-11
Rural 230 -- -- -- 19 -- 249 14396 -- 14396 Urban -- -- -- -- -- -- -- -- -- --
2011-12
Rural 345 -- -- -- 285 -- 630 12998 -- 12998 Urban -- -- -- -- -- -- -- -- -- --
2012-
13
Rural 345 -- -- -- 285 -- 630 12998 -- 8500
Urban -- -- -- -- -- -- -- -- -- --
2013-
14
Rural 310 -- -- -- 321 -- 631 12921 4471 8450
Urban -- -- -- -- -- -- -- -- -- --
Statistical Handbook 2013-14 - 15 - Block Chenani
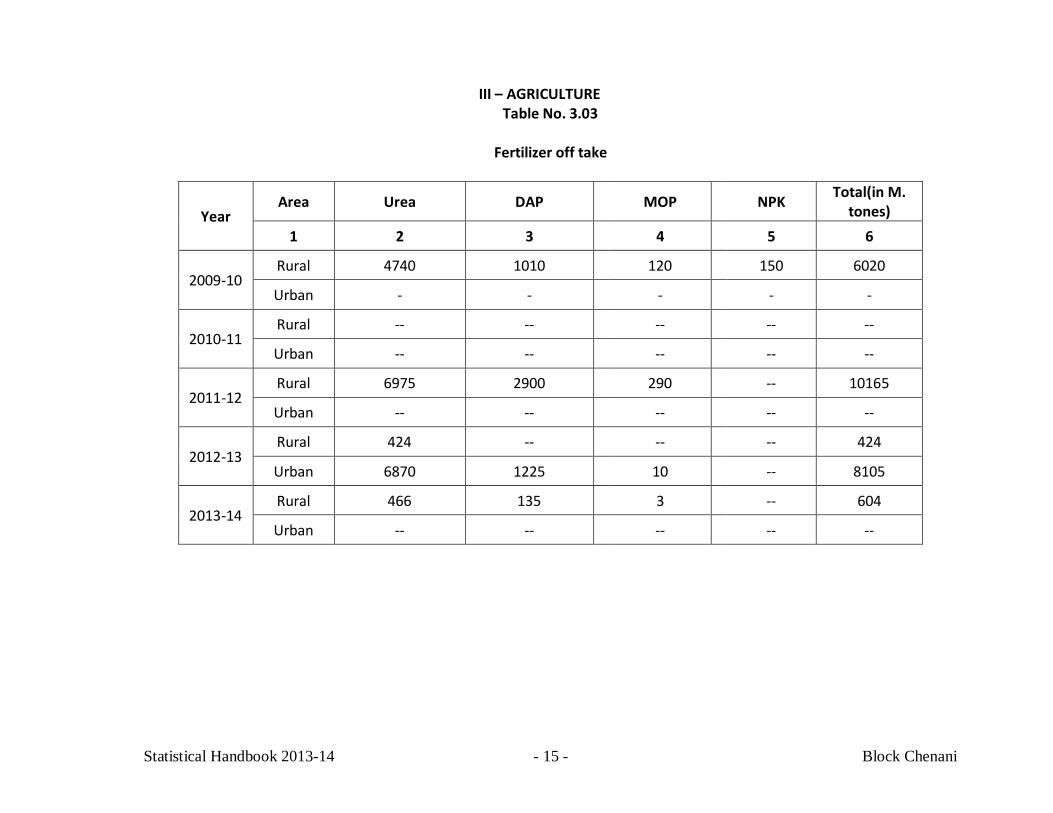
III – AGRICULTURE Table No. 3.03
Fertilizer off take
Year Area Urea DAP MOP NPK Total(in M.
tones) 1 2 3 4 5 6
2009-10 Rural 4740 1010 120 150 6020
Urban - - - - -
2010-11 Rural -- -- -- -- --
Urban -- -- -- -- --
2011-12 Rural 6975 2900 290 -- 10165
Urban -- -- -- -- --
2012-13 Rural 424 -- -- -- 424
Urban 6870 1225 10 -- 8105
2013-14 Rural 466 135 3 -- 604
Urban -- -- -- -- --
Statistical Handbook 2013-14 - 16 - Block Chenani
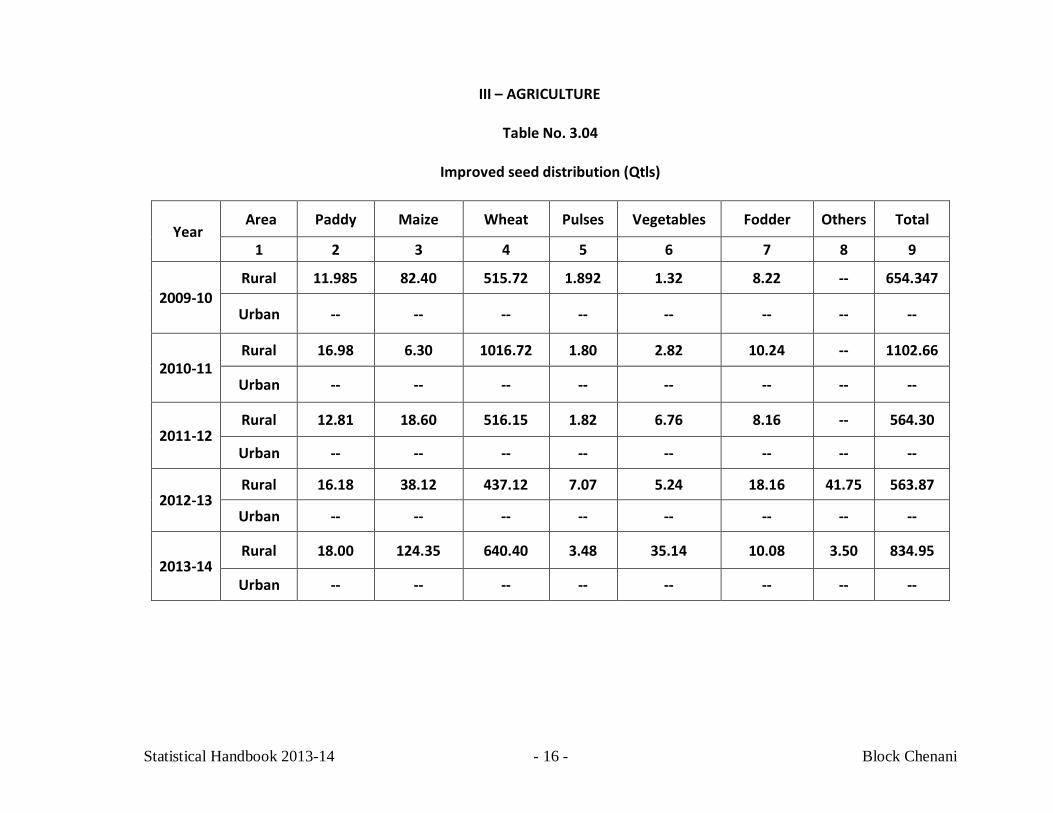
III – AGRICULTURE
Table No. 3.04
Improved seed distribution (Qtls)
Year Area Paddy Maize Wheat Pulses Vegetables Fodder Others Total
1 2 3 4 5 6 7 8 9
2009-10 Rural 11.985 82.40 515.72 1.892 1.32 8.22 -- 654.347
Urban -- -- -- -- -- -- -- --
2010-11 Rural 16.98 6.30 1016.72 1.80 2.82 10.24 -- 1102.66
Urban -- -- -- -- -- -- -- --
2011-12 Rural 12.81 18.60 516.15 1.82 6.76 8.16 -- 564.30
Urban -- -- -- -- -- -- -- --
2012-13 Rural 16.18 38.12 437.12 7.07 5.24 18.16 41.75 563.87
Urban -- -- -- -- -- -- -- --
2013-14 Rural 18.00 124.35 640.40 3.48 35.14 10.08 3.50 834.95
Urban -- -- -- -- -- -- -- --
Statistical Handbook 2013-14 - 17 - Block Chenani
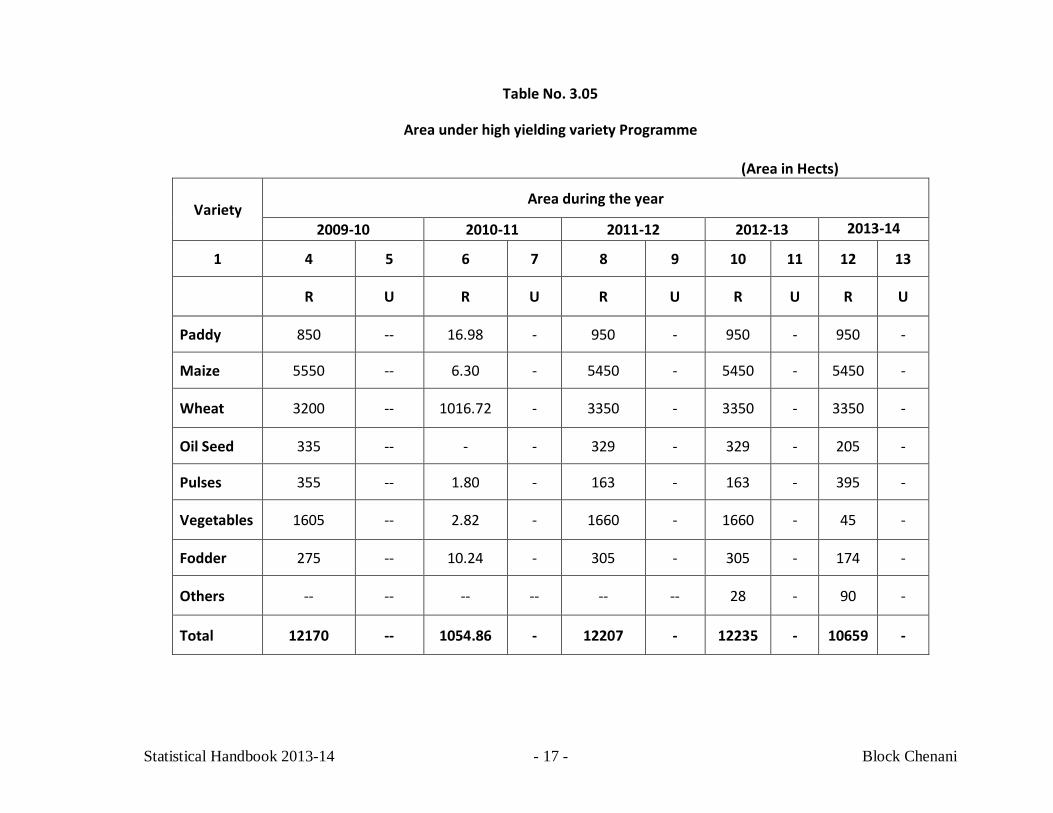
Table No. 3.05
Area under high yielding variety Programme
(Area in Hects)
Variety Area during the year
2009-10 2010-11 2011-12 2012-13 2013-14
1 4 5 6 7 8 9 10 11 12 13
R U R U R U R U R U
Paddy 850 -- 16.98 - 950 - 950 - 950 -
Maize 5550 -- 6.30 - 5450 - 5450 - 5450 -
Wheat 3200 -- 1016.72 - 3350 - 3350 - 3350 -
Oil Seed 335 -- - - 329 - 329 - 205 -
Pulses 355 -- 1.80 - 163 - 163 - 395 -
Vegetables 1605 -- 2.82 - 1660 - 1660 - 45 -
Fodder 275 -- 10.24 - 305 - 305 - 174 -
Others -- -- -- -- -- -- 28 - 90 -
Total 12170 -- 1054.86 - 12207 - 12235 - 10659 -
Statistical Handbook 2013-14 - 18 - Block Chenani
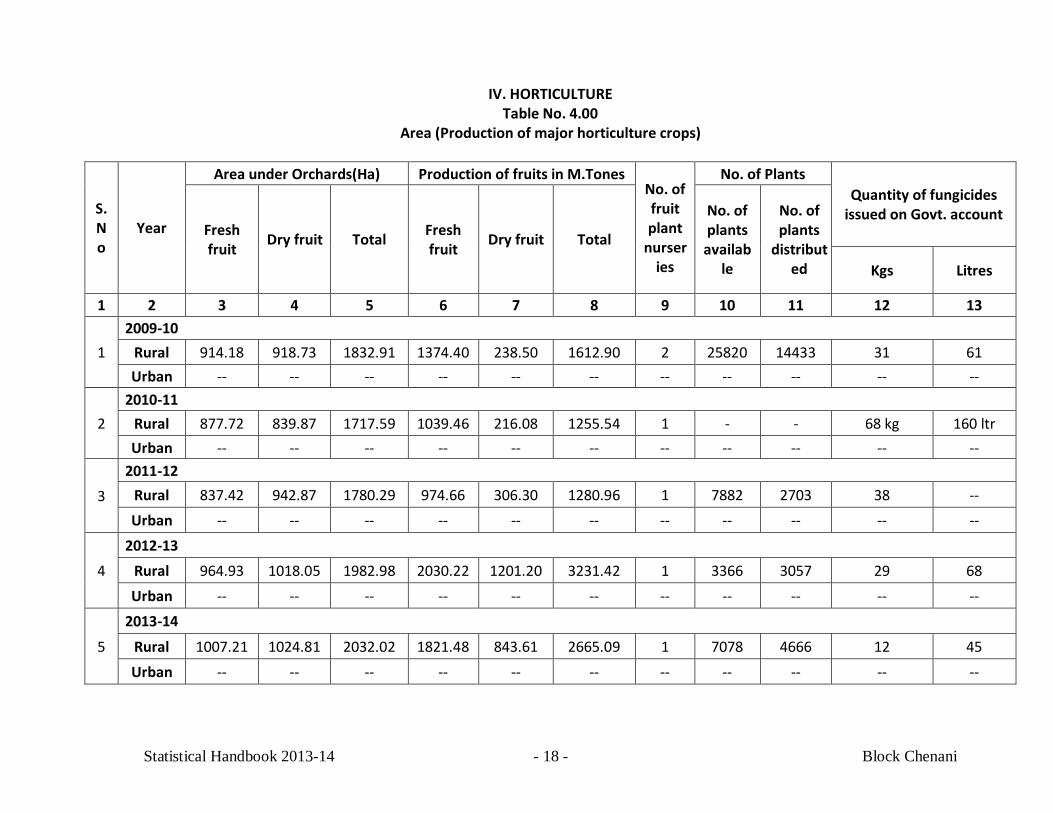
IV. HORTICULTURE Table No. 4.00
Area (Production of major horticulture crops)
S.No
Year
Area under Orchards(Ha) Production of fruits in M.Tones No. of fruit plant
nurseries
No. of Plants Quantity of fungicides
issued on Govt. account Fresh fruit Dry fruit Total Fresh
fruit Dry fruit Total
No. of plants availab
le
No. of plants
distributed Kgs Litres
1 2 3 4 5 6 7 8 9 10 11 12 13
1 2009-10
Rural 914.18 918.73 1832.91 1374.40 238.50 1612.90 2 25820 14433 31 61 Urban -- -- -- -- -- -- -- -- -- -- --
2 2010-11
Rural 877.72 839.87 1717.59 1039.46 216.08 1255.54 1 - - 68 kg 160 ltr Urban -- -- -- -- -- -- -- -- -- -- --
3 2011-12
Rural 837.42 942.87 1780.29 974.66 306.30 1280.96 1 7882 2703 38 -- Urban -- -- -- -- -- -- -- -- -- -- --
4 2012-13
Rural 964.93 1018.05 1982.98 2030.22 1201.20 3231.42 1 3366 3057 29 68 Urban -- -- -- -- -- -- -- -- -- -- --
5
2013-14
Rural 1007.21 1024.81 2032.02 1821.48 843.61 2665.09 1 7078 4666 12 45 Urban -- -- -- -- -- -- -- -- -- -- --
Statistical Handbook 2013-14 - 19 - Block Chenani
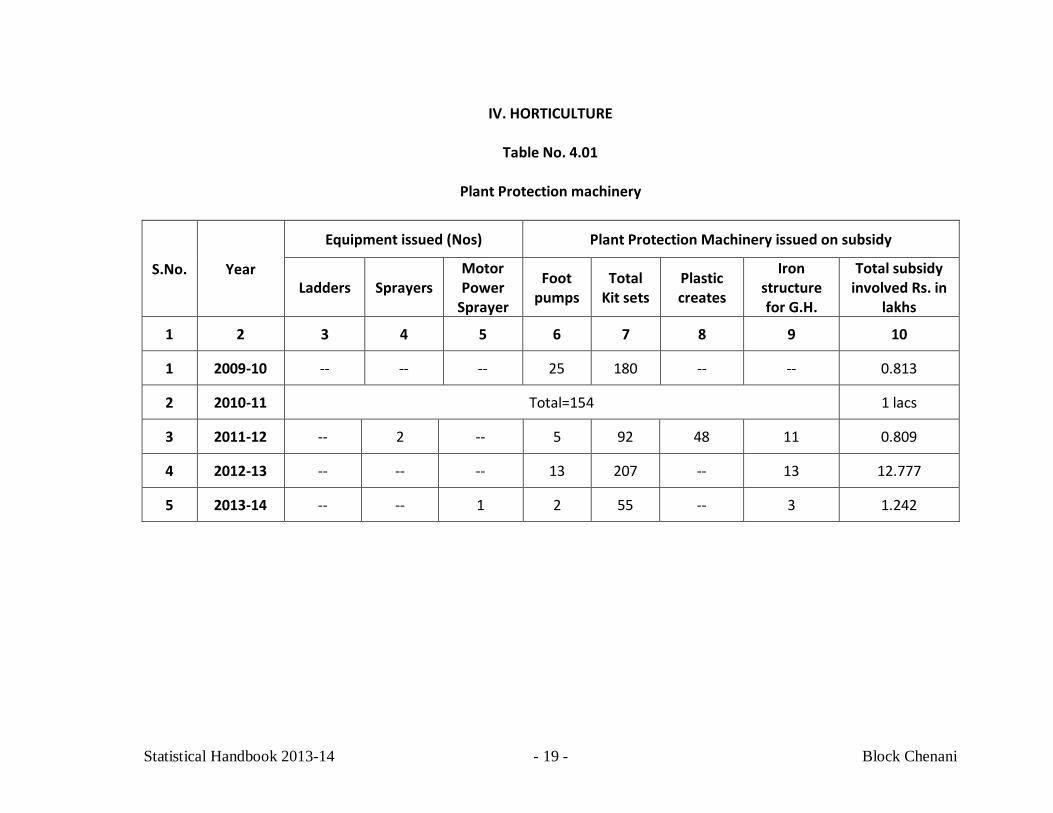
IV. HORTICULTURE
Table No. 4.01
Plant Protection machinery
S.No. Year
Equipment issued (Nos) Plant Protection Machinery issued on subsidy
Ladders Sprayers Motor Power
Sprayer
Foot pumps
Total Kit sets
Plastic creates
Iron structure for G.H.
Total subsidy involved Rs. in
lakhs
1 2 3 4 5 6 7 8 9 10
1 2009-10 -- -- -- 25 180 -- -- 0.813
2 2010-11 Total=154 1 lacs
3 2011-12 -- 2 -- 5 92 48 11 0.809
4 2012-13 -- -- -- 13 207 -- 13 12.777
5 2013-14 -- -- 1 2 55 -- 3 1.242
Statistical Handbook 2013-14 - 20 - Block Chenani
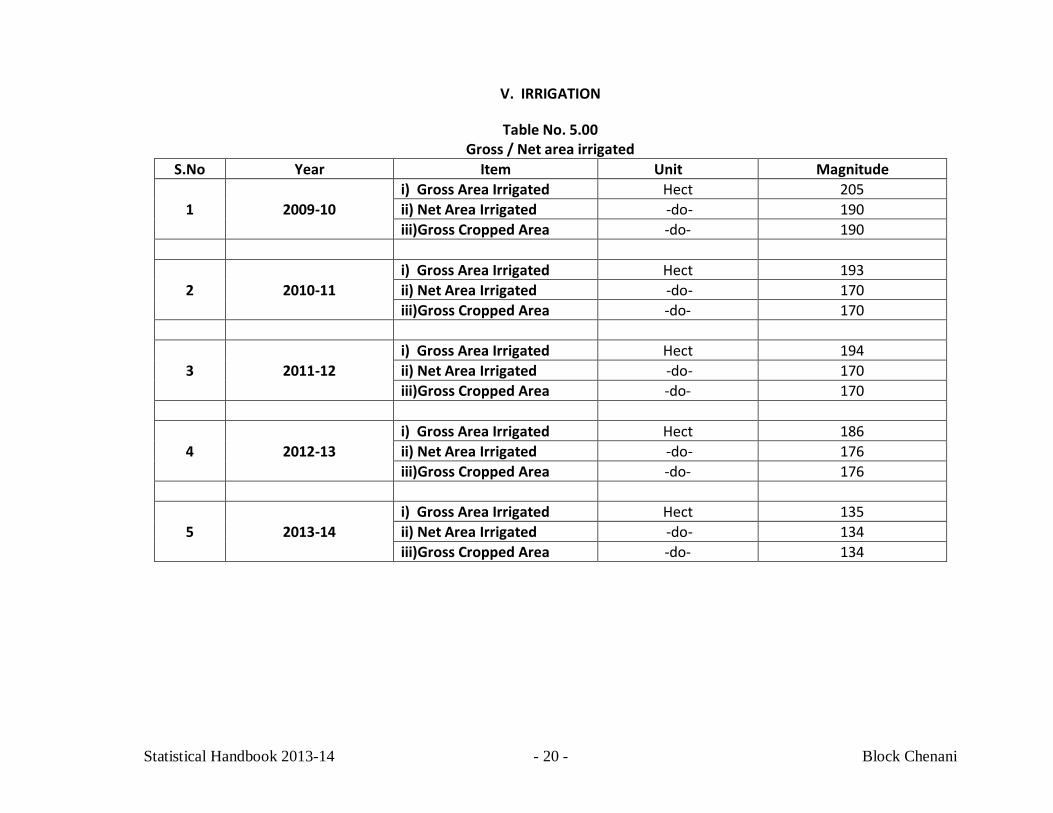
V. IRRIGATION
Table No. 5.00 Gross / Net area irrigated
S.No Year Item Unit Magnitude
1 2009-10 i) Gross Area Irrigated Hect 205 ii) Net Area Irrigated -do- 190 iii)Gross Cropped Area -do- 190
2 2010-11 i) Gross Area Irrigated Hect 193 ii) Net Area Irrigated -do- 170 iii)Gross Cropped Area -do- 170
3 2011-12 i) Gross Area Irrigated Hect 194 ii) Net Area Irrigated -do- 170 iii)Gross Cropped Area -do- 170
4 2012-13 i) Gross Area Irrigated Hect 186 ii) Net Area Irrigated -do- 176 iii)Gross Cropped Area -do- 176
5 2013-14 i) Gross Area Irrigated Hect 135 ii) Net Area Irrigated -do- 134 iii)Gross Cropped Area -do- 134
Statistical Handbook 2013-14 - 21 - Block Chenani
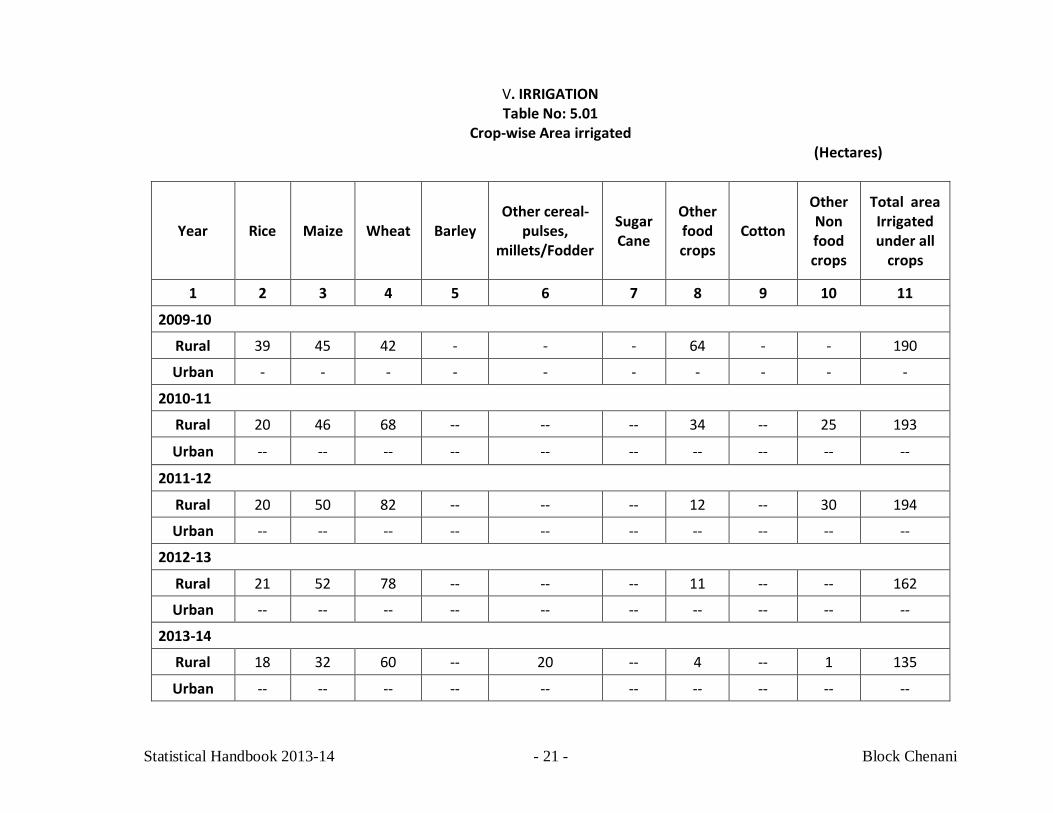
V. IRRIGATION Table No: 5.01
Crop-wise Area irrigated (Hectares)
Year Rice Maize Wheat Barley Other cereal-
pulses, millets/Fodder
Sugar Cane
Other food crops
Cotton
Other Non food crops
Total area Irrigated under all
crops
1 2 3 4 5 6 7 8 9 10 11
2009-10
Rural 39 45 42 - - - 64 - - 190
Urban - - - - - - - - - -
2010-11
Rural 20 46 68 -- -- -- 34 -- 25 193
Urban -- -- -- -- -- -- -- -- -- --
2011-12
Rural 20 50 82 -- -- -- 12 -- 30 194
Urban -- -- -- -- -- -- -- -- -- --
2012-13
Rural 21 52 78 -- -- -- 11 -- -- 162
Urban -- -- -- -- -- -- -- -- -- --
2013-14
Rural 18 32 60 -- 20 -- 4 -- 1 135
Urban -- -- -- -- -- -- -- -- -- --
Statistical Handbook 2013-14 - 22 - Block Chenani
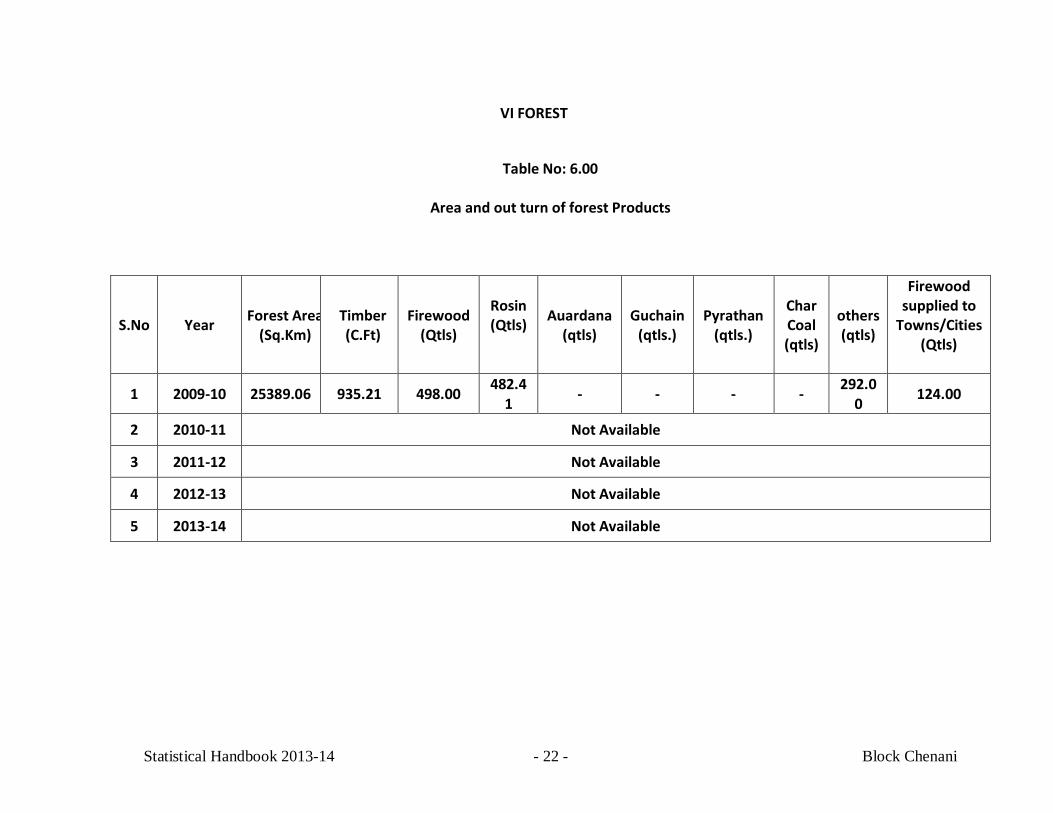
VI FOREST
Table No: 6.00
Area and out turn of forest Products
S.No Year Forest Area (Sq.Km)
Timber (C.Ft)
Firewood (Qtls)
Rosin (Qtls)
Auardana (qtls)
Guchain (qtls.)
Pyrathan (qtls.)
Char Coal (qtls)
others (qtls)
Firewood supplied to
Towns/Cities (Qtls)
1 2009-10 25389.06 935.21 498.00 482.41 - - - - 292.0
0 124.00
2 2010-11 Not Available
3 2011-12 Not Available
4 2012-13 Not Available
5 2013-14 Not Available
Statistical Handbook 2013-14 - 23 - Block Chenani
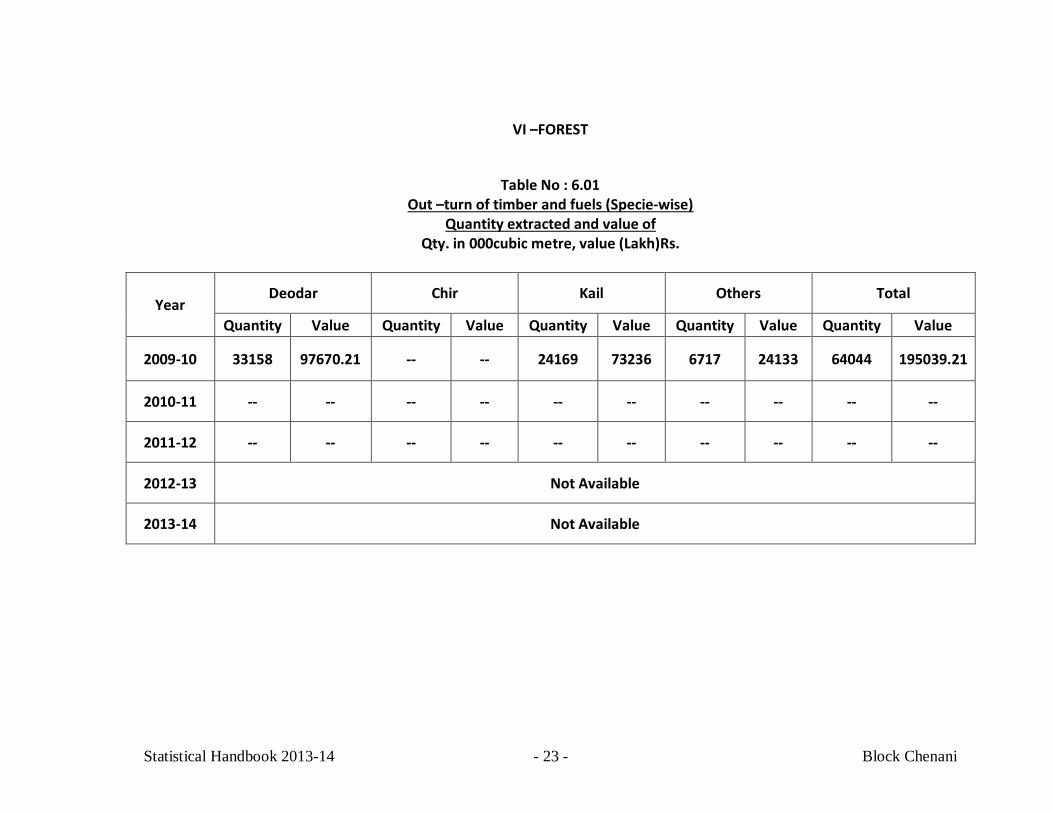
VI –FOREST
Table No : 6.01
Out –turn of timber and fuels (Specie-wise) Quantity extracted and value of
Qty. in 000cubic metre, value (Lakh)Rs.
Year Deodar Chir Kail Others Total
Quantity Value Quantity Value Quantity Value Quantity Value Quantity Value
2009-10 33158 97670.21 -- -- 24169 73236 6717 24133 64044 195039.21
2010-11 -- -- -- -- -- -- -- -- -- --
2011-12 -- -- -- -- -- -- -- -- -- --
2012-13 Not Available
2013-14 Not Available
Statistical Handbook 2013-14 - 24 - Block Chenani
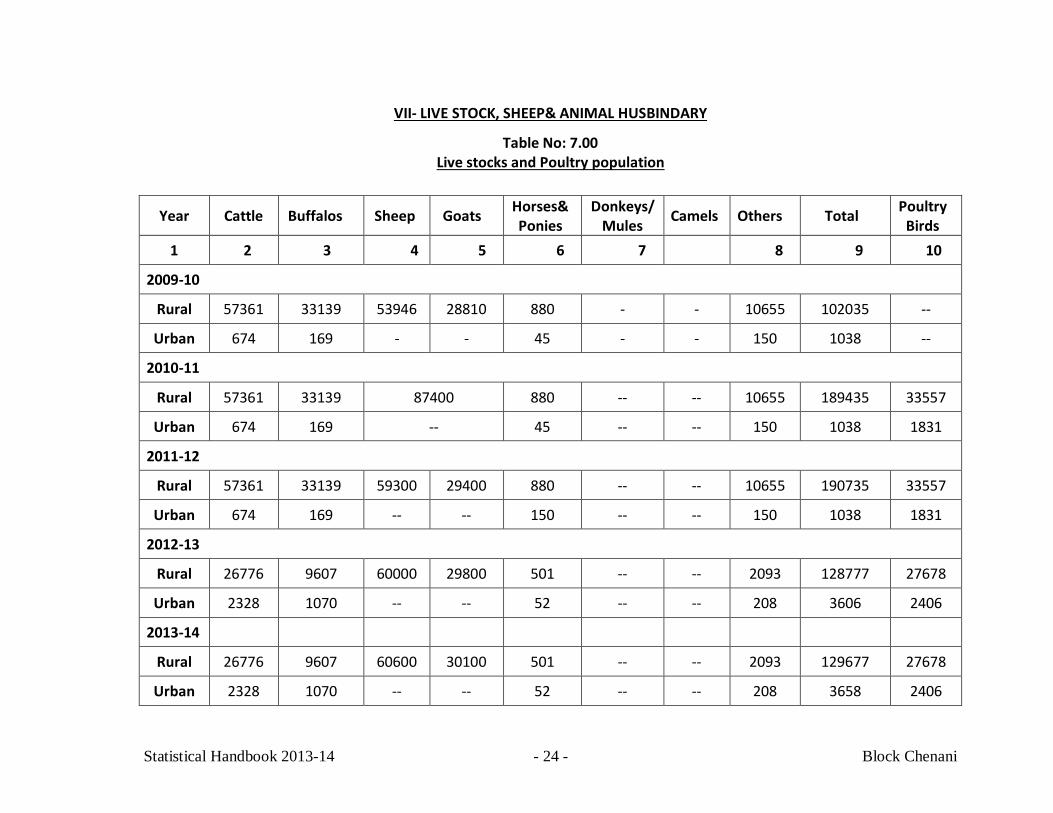
VII- LIVE STOCK, SHEEP& ANIMAL HUSBINDARY
Table No: 7.00 Live stocks and Poultry population
Year Cattle Buffalos Sheep Goats Horses& Ponies
Donkeys/Mules Camels Others Total Poultry
Birds 1 2 3 4 5 6 7 8 9 10
2009-10
Rural 57361 33139 53946 28810 880 - - 10655 102035 --
Urban 674 169 - - 45 - - 150 1038 --
2010-11
Rural 57361 33139 87400 880 -- -- 10655 189435 33557
Urban 674 169 -- 45 -- -- 150 1038 1831
2011-12
Rural 57361 33139 59300 29400 880 -- -- 10655 190735 33557
Urban 674 169 -- -- 150 -- -- 150 1038 1831
2012-13
Rural 26776 9607 60000 29800 501 -- -- 2093 128777 27678
Urban 2328 1070 -- -- 52 -- -- 208 3606 2406
2013-14
Rural 26776 9607 60600 30100 501 -- -- 2093 129677 27678
Urban 2328 1070 -- -- 52 -- -- 208 3658 2406
Statistical Handbook 2013-14 - 25 - Block Chenani
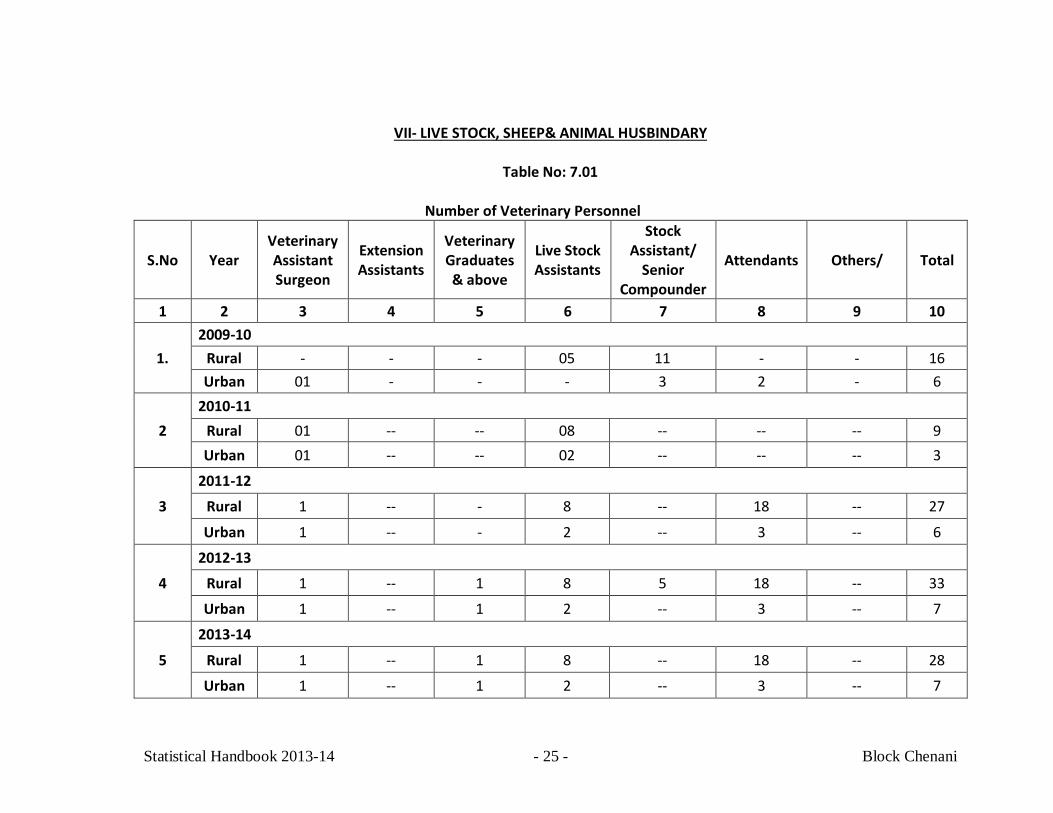
VII- LIVE STOCK, SHEEP& ANIMAL HUSBINDARY
Table No: 7.01 Number of Veterinary Personnel
S.No Year Veterinary Assistant Surgeon
Extension Assistants
Veterinary Graduates & above
Live Stock Assistants
Stock Assistant/
Senior Compounder
Attendants Others/ Total
1 2 3 4 5 6 7 8 9 10
1. 2009-10
Rural - - - 05 11 - - 16 Urban 01 - - - 3 2 - 6
2 2010-11
Rural 01 -- -- 08 -- -- -- 9 Urban 01 -- -- 02 -- -- -- 3
3
2011-12
Rural 1 -- - 8 -- 18 -- 27
Urban 1 -- - 2 -- 3 -- 6
4
2012-13
Rural 1 -- 1 8 5 18 -- 33
Urban 1 -- 1 2 -- 3 -- 7
5
2013-14
Rural 1 -- 1 8 -- 18 -- 28
Urban 1 -- 1 2 -- 3 -- 7
Statistical Handbook 2013-14 - 26 - Block Chenani
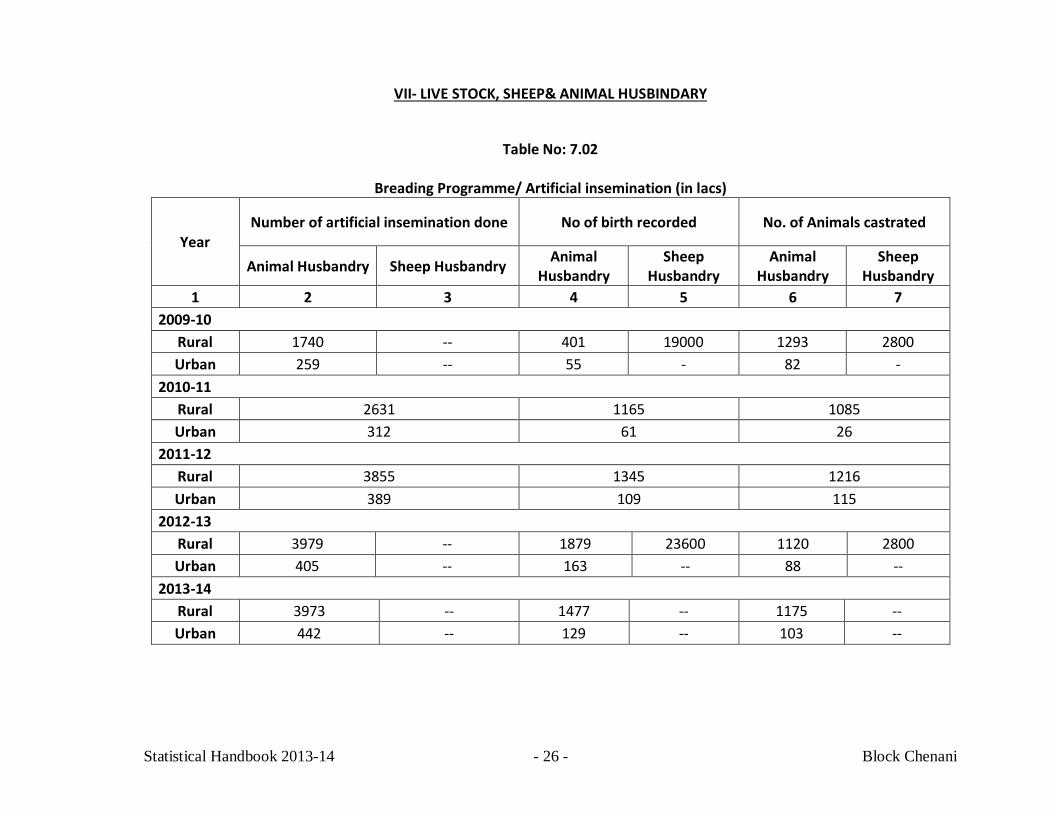
VII- LIVE STOCK, SHEEP& ANIMAL HUSBINDARY
Table No: 7.02
Breading Programme/ Artificial insemination (in lacs)
Year Number of artificial insemination done No of birth recorded No. of Animals castrated
Animal Husbandry Sheep Husbandry Animal Husbandry
Sheep Husbandry
Animal Husbandry
Sheep Husbandry
1 2 3 4 5 6 7 2009-10
Rural 1740 -- 401 19000 1293 2800 Urban 259 -- 55 - 82 -
2010-11 Rural 2631 1165 1085 Urban 312 61 26
2011-12 Rural 3855 1345 1216 Urban 389 109 115
2012-13 Rural 3979 -- 1879 23600 1120 2800 Urban 405 -- 163 -- 88 --
2013-14 Rural 3973 -- 1477 -- 1175 -- Urban 442 -- 129 -- 103 --
Statistical Handbook 2013-14 - 27 - Block Chenani
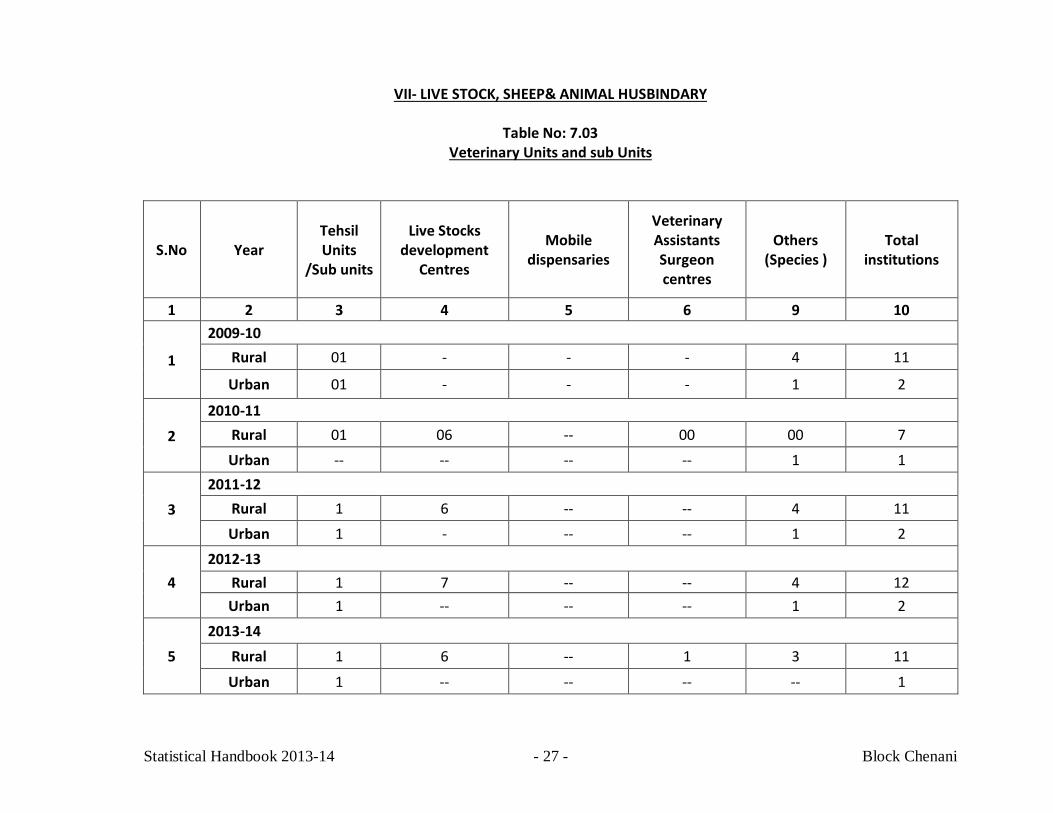
VII- LIVE STOCK, SHEEP& ANIMAL HUSBINDARY
Table No: 7.03 Veterinary Units and sub Units
S.No Year Tehsil Units
/Sub units
Live Stocks development
Centres
Mobile dispensaries
Veterinary Assistants Surgeon centres
Others (Species )
Total institutions
1 2 3 4 5 6 9 10
1
2009-10 Rural 01 - - - 4 11
Urban 01 - - - 1 2
2
2010-11 Rural 01 06 -- 00 00 7 Urban -- -- -- -- 1 1
3 2011-12
Rural 1 6 -- -- 4 11 Urban 1 - -- -- 1 2
4 2012-13
Rural 1 7 -- -- 4 12 Urban 1 -- -- -- 1 2
5 2013-14
Rural 1 6 -- 1 3 11
Urban 1 -- -- -- -- 1
Statistical Handbook 2013-14 - 28 - Block Chenani
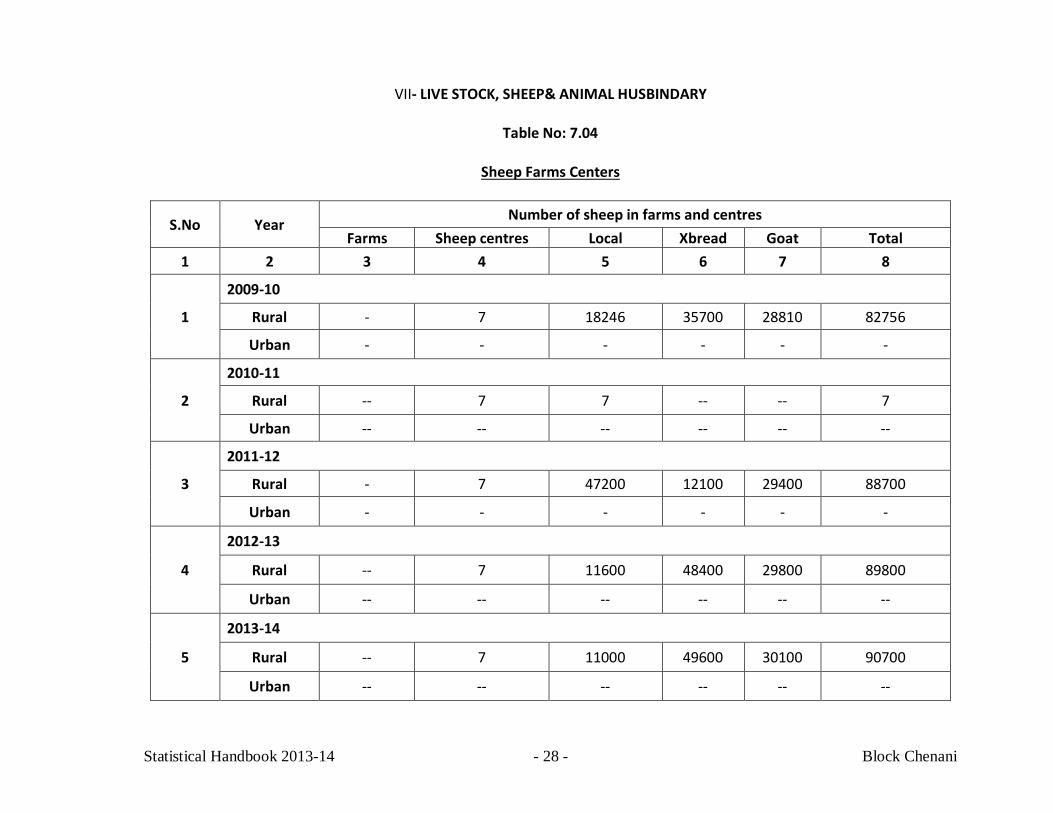
VII- LIVE STOCK, SHEEP& ANIMAL HUSBINDARY
Table No: 7.04
Sheep Farms Centers
S.No Year Number of sheep in farms and centres
Farms Sheep centres Local Xbread Goat Total 1 2 3 4 5 6 7 8
1
2009-10
Rural - 7 18246 35700 28810 82756
Urban - - - - - -
2
2010-11
Rural -- 7 7 -- -- 7
Urban -- -- -- -- -- --
3
2011-12
Rural - 7 47200 12100 29400 88700
Urban - - - - - -
4
2012-13
Rural -- 7 11600 48400 29800 89800
Urban -- -- -- -- -- --
5
2013-14
Rural -- 7 11000 49600 30100 90700
Urban -- -- -- -- -- --
Statistical Handbook 2013-14 - 29 - Block Chenani
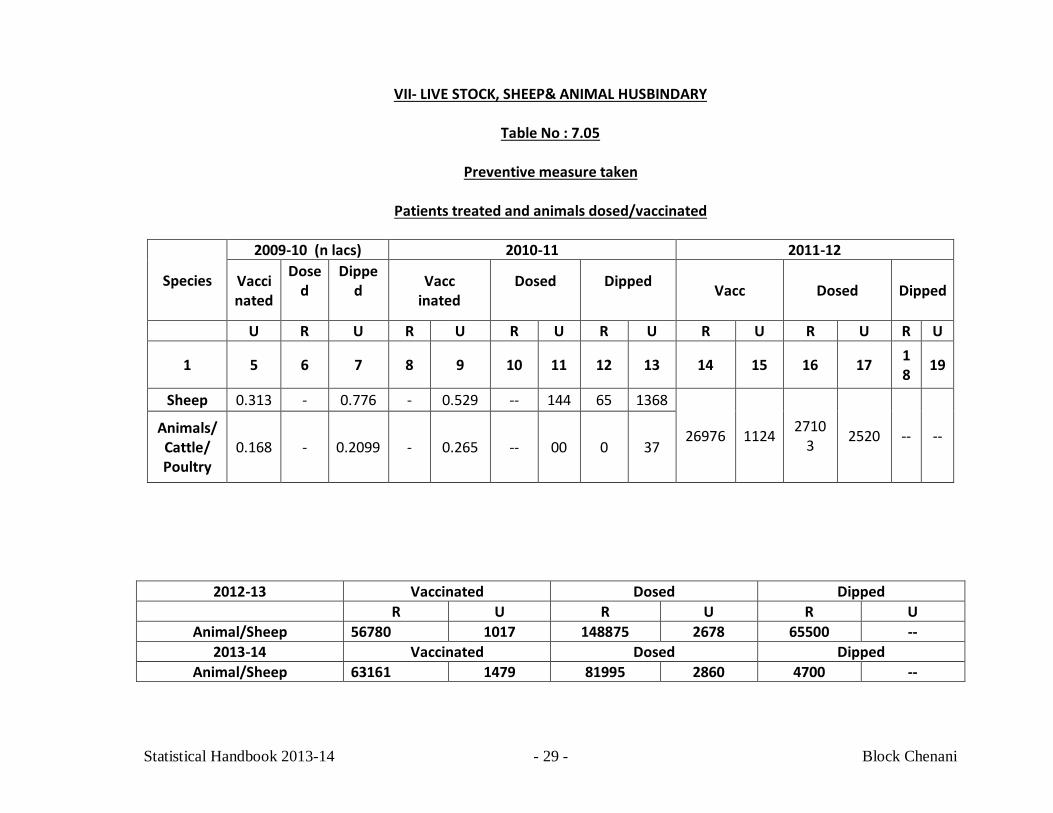
VII- LIVE STOCK, SHEEP& ANIMAL HUSBINDARY
Table No : 7.05
Preventive measure taken
Patients treated and animals dosed/vaccinated
2012-13 Vaccinated Dosed Dipped R U R U R U
Animal/Sheep 56780 1017 148875 2678 65500 -- 2013-14 Vaccinated Dosed Dipped
Animal/Sheep 63161 1479 81995 2860 4700 --
Species
2009-10 (n lacs) 2010-11 2011-12
Vacci nated
Dosed
Dipped
Vacc inated
Dosed
Dipped Vacc Dosed Dipped
U R U R U R U R U R U R U R U
1 5 6 7 8 9 10 11 12 13 14 15 16 17 18 19
Sheep 0.313 - 0.776 - 0.529 -- 144 65 1368
26976 1124 27103 2520 -- -- Animals/
Cattle/ Poultry
0.168 - 0.2099 - 0.265 -- 00 0 37
Statistical Handbook 2013-14 - 30 - Block Chenani
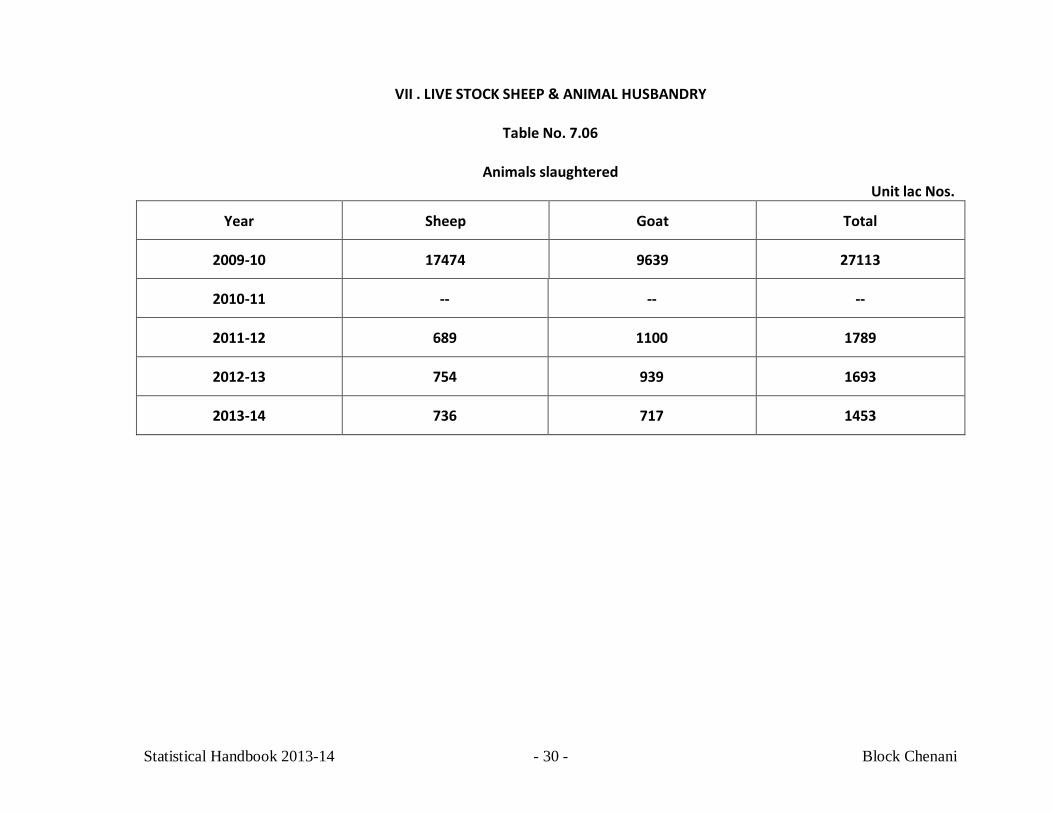
VII . LIVE STOCK SHEEP & ANIMAL HUSBANDRY
Table No. 7.06
Animals slaughtered Unit lac Nos.
Year Sheep Goat Total
2009-10 17474 9639 27113
2010-11 -- -- --
2011-12 689 1100 1789
2012-13 754 939 1693
2013-14 736 717 1453
Statistical Handbook 2013-14 - 31 - Block Chenani
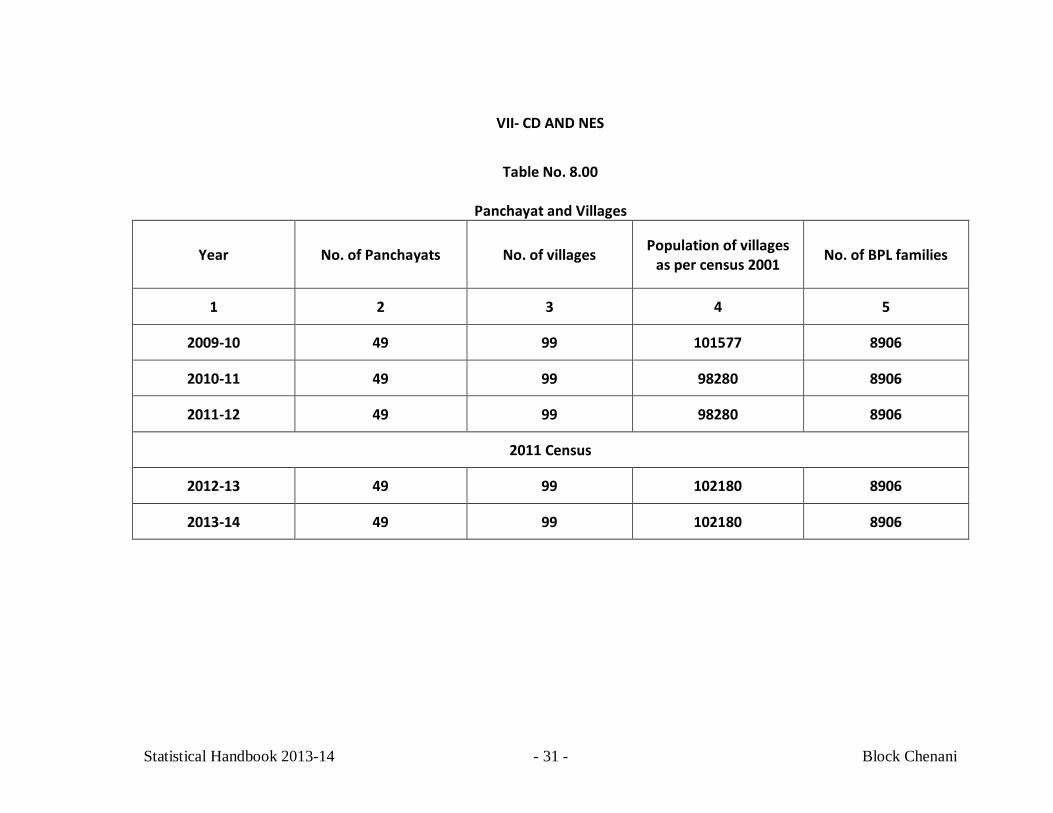
VII- CD AND NES
Table No. 8.00
Panchayat and Villages
Year No. of Panchayats No. of villages Population of villages as per census 2001 No. of BPL families
1 2 3 4 5
2009-10 49 99 101577 8906
2010-11 49 99 98280 8906
2011-12 49 99 98280 8906
2011 Census
2012-13 49 99 102180 8906
2013-14 49 99 102180 8906
Statistical Handbook 2013-14 - 32 - Block Chenani
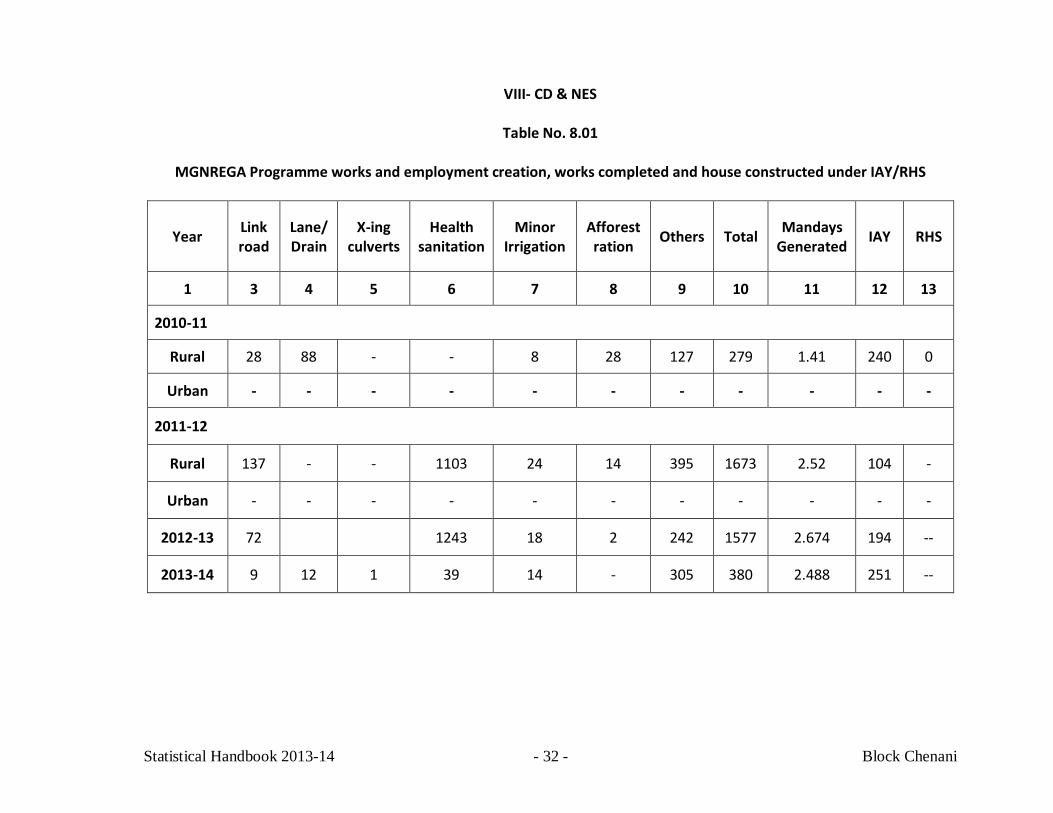
VIII- CD & NES
Table No. 8.01
MGNREGA Programme works and employment creation, works completed and house constructed under IAY/RHS
Year Link road
Lane/ Drain
X-ing culverts
Health sanitation
Minor Irrigation
Afforest ration Others Total Mandays
Generated IAY RHS
1 3 4 5 6 7 8 9 10 11 12 13
2010-11
Rural 28 88 - - 8 28 127 279 1.41 240 0
Urban - - - - - - - - - - -
2011-12
Rural 137 - - 1103 24 14 395 1673 2.52 104 -
Urban - - - - - - - - - - -
2012-13 72 1243 18 2 242 1577 2.674 194 --
2013-14 9 12 1 39 14 - 305 380 2.488 251 --
Statistical Handbook 2013-14 - 33 - Block Chenani
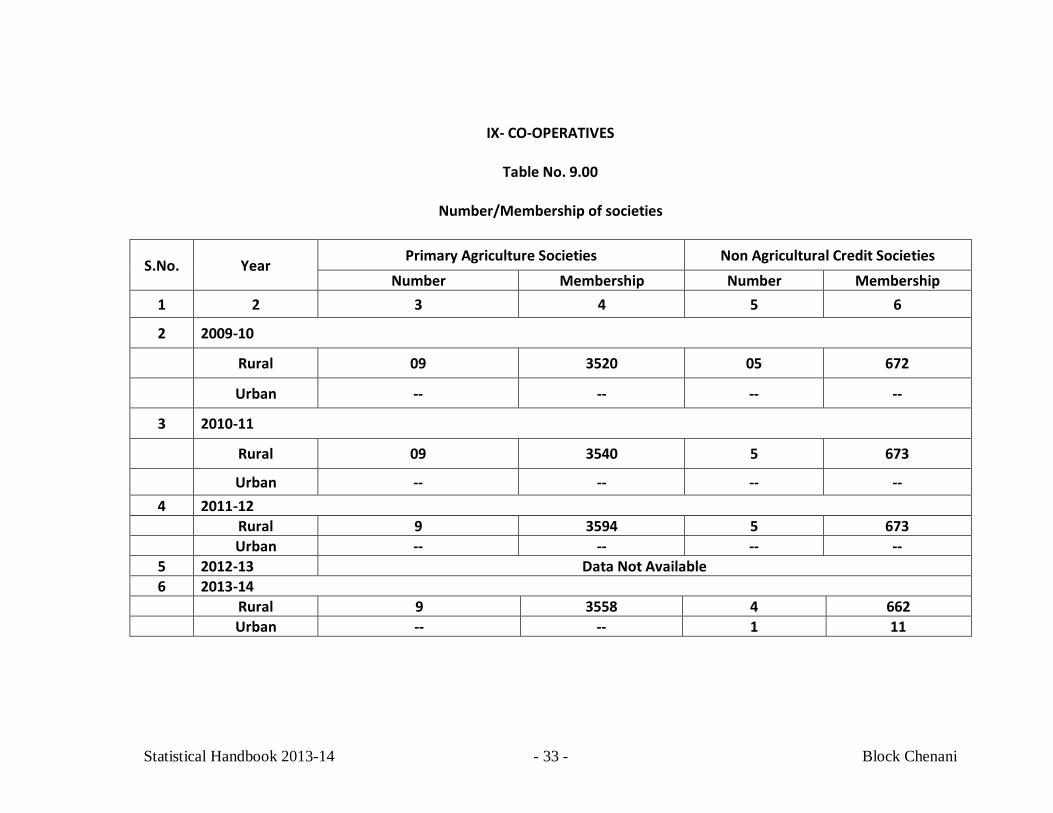
IX- CO-OPERATIVES
Table No. 9.00
Number/Membership of societies
S.No. Year Primary Agriculture Societies Non Agricultural Credit Societies
Number Membership Number Membership 1 2 3 4 5 6
2 2009-10
Rural 09 3520 05 672
Urban -- -- -- --
3 2010-11
Rural 09 3540 5 673
Urban -- -- -- -- 4 2011-12 Rural 9 3594 5 673 Urban -- -- -- --
5 2012-13 Data Not Available 6 2013-14 Rural 9 3558 4 662 Urban -- -- 1 11
Statistical Handbook 2013-14 - 34 - Block Chenani
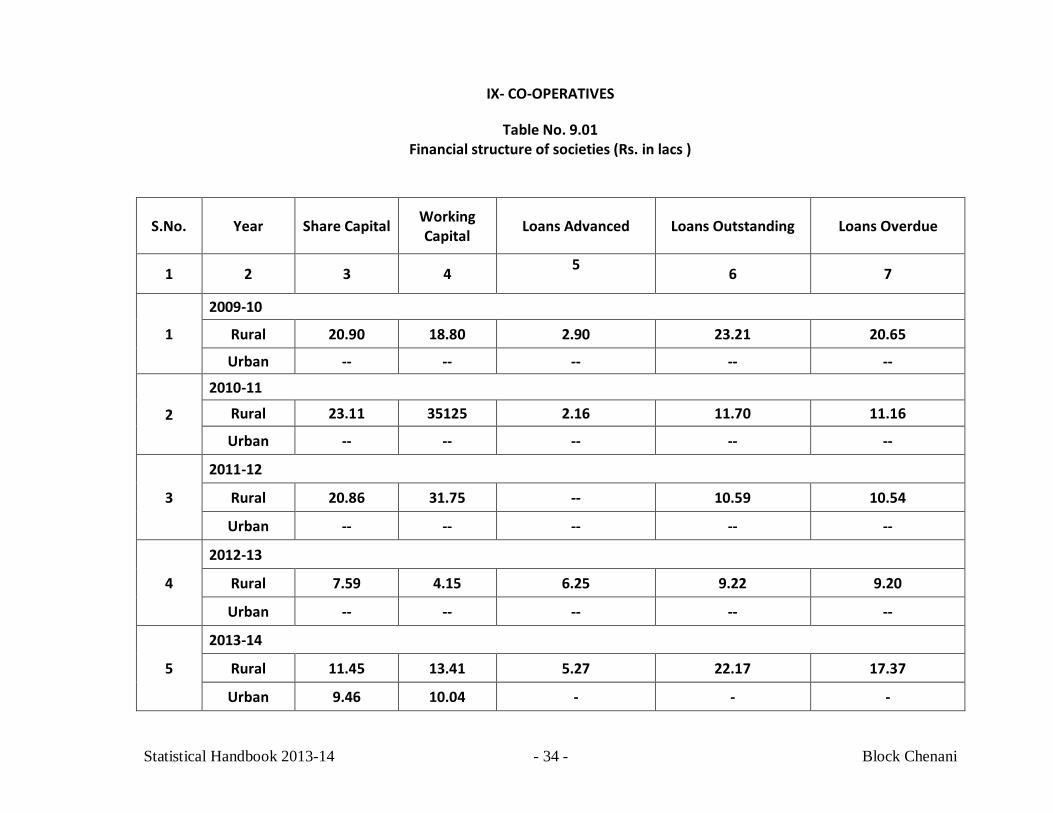
IX- CO-OPERATIVES
Table No. 9.01 Financial structure of societies (Rs. in lacs )
S.No. Year Share Capital Working Capital Loans Advanced Loans Outstanding Loans Overdue
1 2 3 4 5 6 7
1
2009-10
Rural 20.90 18.80 2.90 23.21 20.65
Urban -- -- -- -- --
2
2010-11
Rural 23.11 35125 2.16 11.70 11.16
Urban -- -- -- -- --
3
2011-12
Rural 20.86 31.75 -- 10.59 10.54
Urban -- -- -- -- --
4
2012-13
Rural 7.59 4.15 6.25 9.22 9.20
Urban -- -- -- -- --
5
2013-14
Rural 11.45 13.41 5.27 22.17 17.37
Urban 9.46 10.04 - - -
Statistical Handbook 2013-14 - 35 - Block Chenani
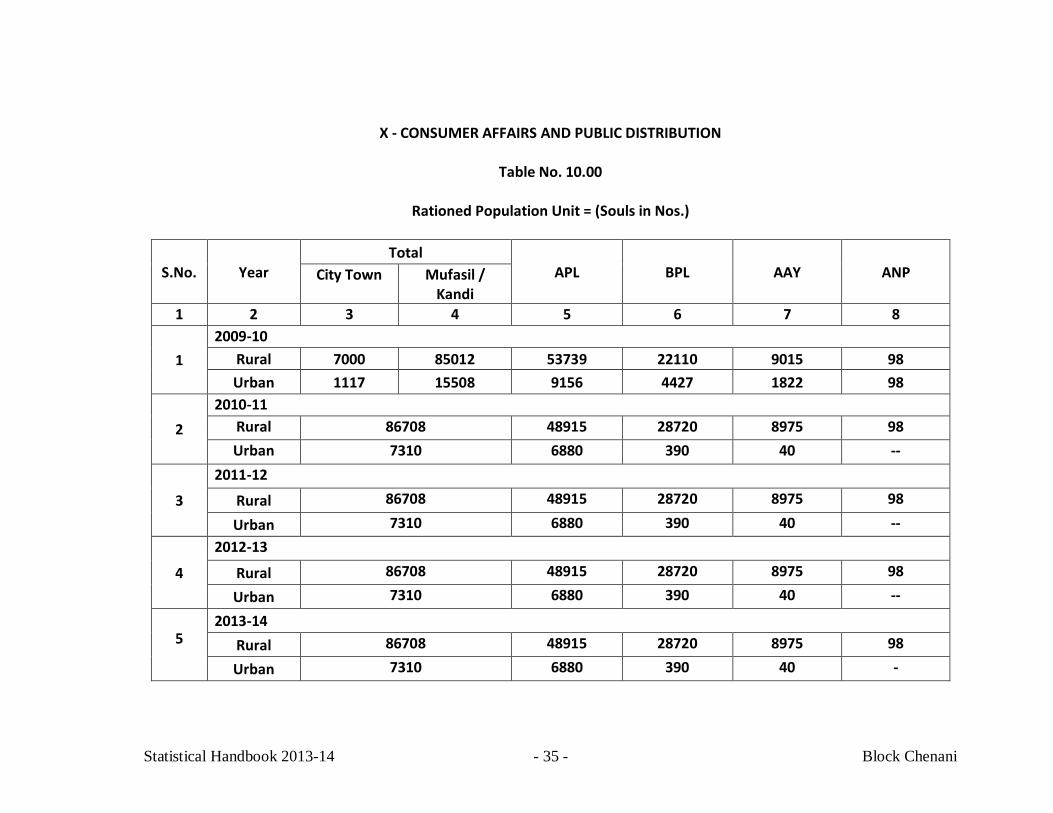
X - CONSUMER AFFAIRS AND PUBLIC DISTRIBUTION
Table No. 10.00
Rationed Population Unit = (Souls in Nos.)
S.No. Year Total
APL BPL AAY ANP City Town Mufasil / Kandi
1 2 3 4 5 6 7 8
1 2009-10
Rural 7000 85012 53739 22110 9015 98 Urban 1117 15508 9156 4427 1822 98
2 2010-11
Rural 86708 48915 28720 8975 98 Urban 7310 6880 390 40 --
3
2011-12
Rural 86708 48915 28720 8975 98
Urban 7310 6880 390 40 --
4
2012-13
Rural 86708 48915 28720 8975 98
Urban 7310 6880 390 40 --
5 2013-14
Rural 86708 48915 28720 8975 98
Urban 7310 6880 390 40 -
Statistical Handbook 2013-14 - 36 - Block Chenani
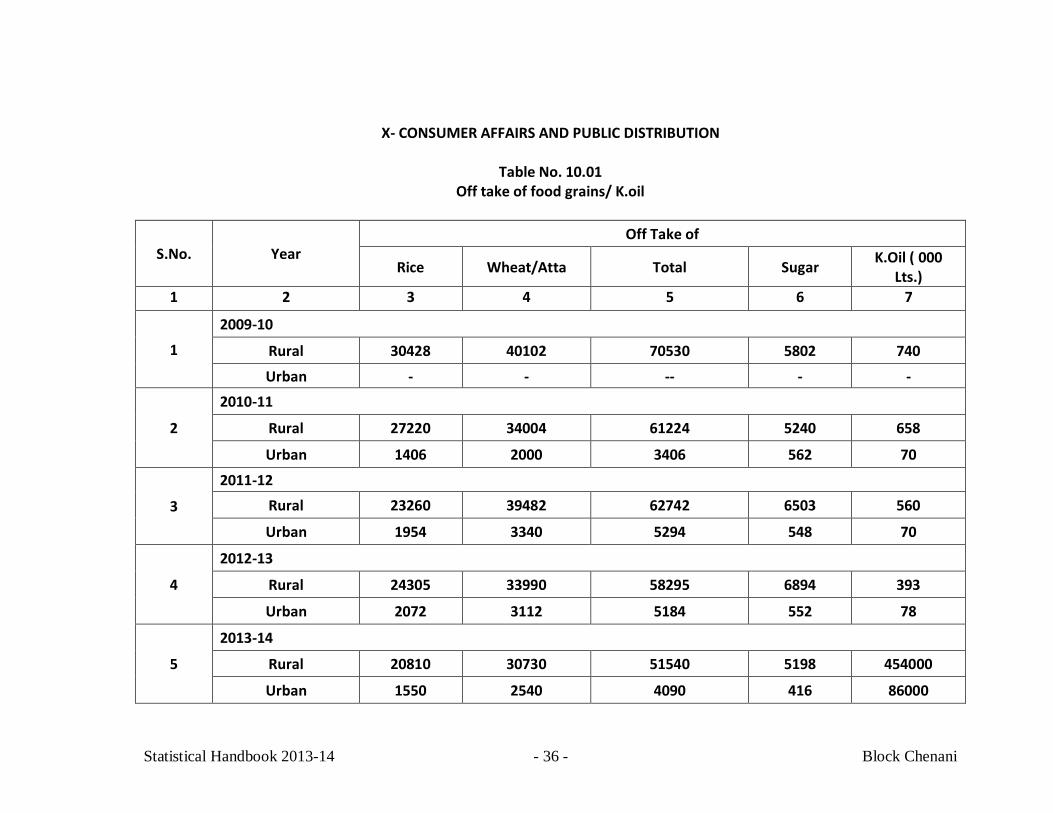
X- CONSUMER AFFAIRS AND PUBLIC DISTRIBUTION
Table No. 10.01 Off take of food grains/ K.oil
S.No. Year Off Take of
Rice Wheat/Atta Total Sugar K.Oil ( 000 Lts.)
1 2 3 4 5 6 7
1
2009-10
Rural 30428 40102 70530 5802 740
Urban - - -- - -
2
2010-11
Rural 27220 34004 61224 5240 658
Urban 1406 2000 3406 562 70
3
2011-12 Rural 23260 39482 62742 6503 560
Urban 1954 3340 5294 548 70
4
2012-13
Rural 24305 33990 58295 6894 393
Urban 2072 3112 5184 552 78
5
2013-14
Rural 20810 30730 51540 5198 454000
Urban 1550 2540 4090 416 86000
Statistical Handbook 2013-14 - 37 - Block Chenani
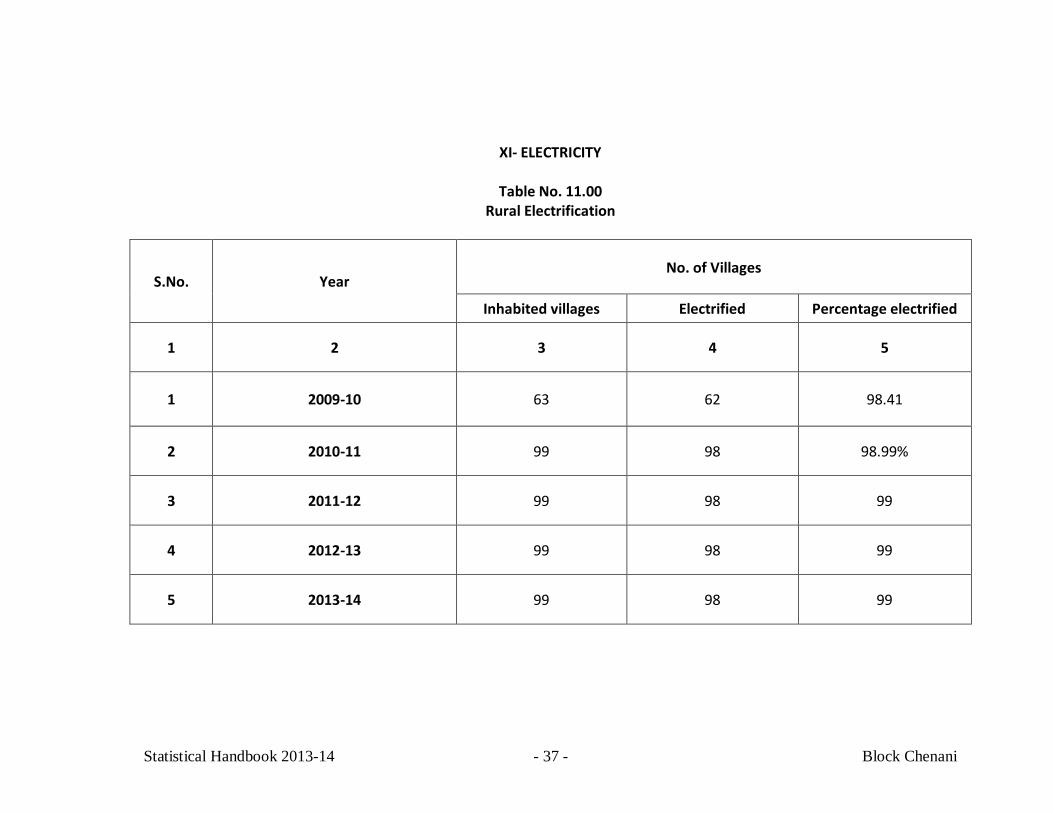
XI- ELECTRICITY
Table No. 11.00 Rural Electrification
S.No. Year No. of Villages
Inhabited villages Electrified Percentage electrified
1 2 3 4 5
1 2009-10 63 62 98.41
2 2010-11 99 98 98.99%
3 2011-12 99 98 99
4 2012-13 99 98 99
5 2013-14 99 98 99
Statistical Handbook 2013-14 - 38 - Block Chenani
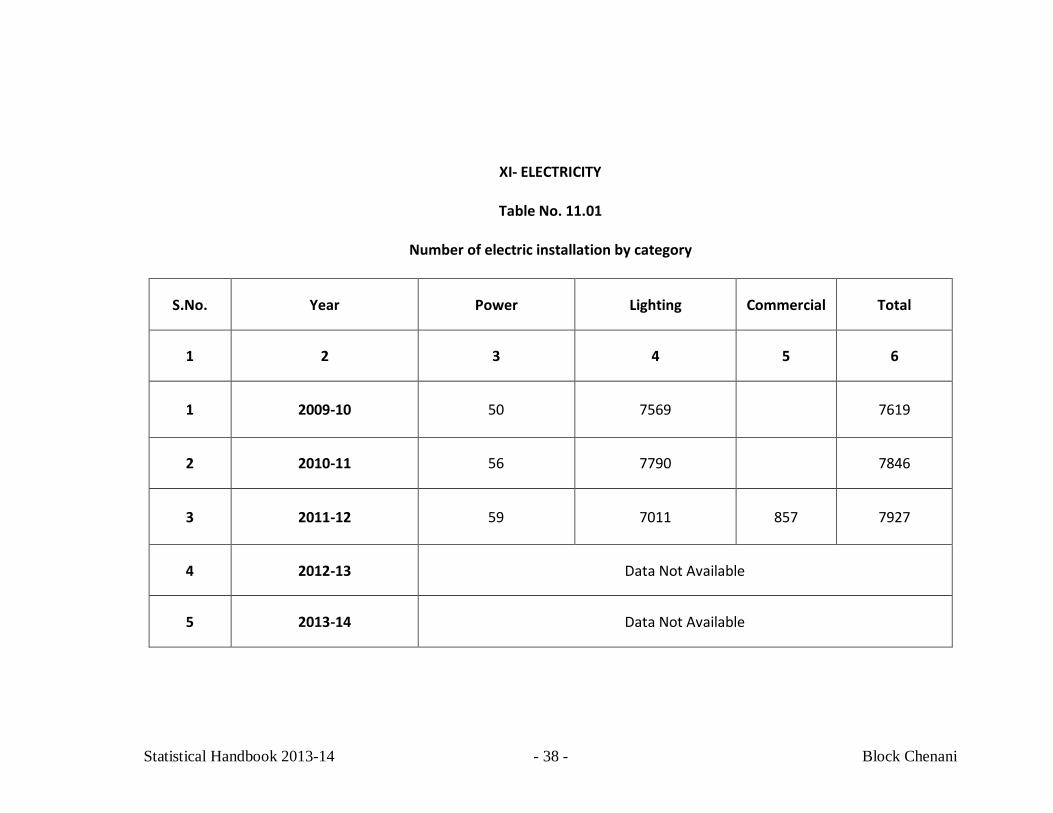
XI- ELECTRICITY
Table No. 11.01
Number of electric installation by category
S.No. Year Power Lighting Commercial Total
1 2 3 4 5 6
1 2009-10 50 7569 7619
2 2010-11 56 7790 7846
3 2011-12 59 7011 857 7927
4 2012-13 Data Not Available
5 2013-14 Data Not Available
Statistical Handbook 2013-14 - 39 - Block Chenani
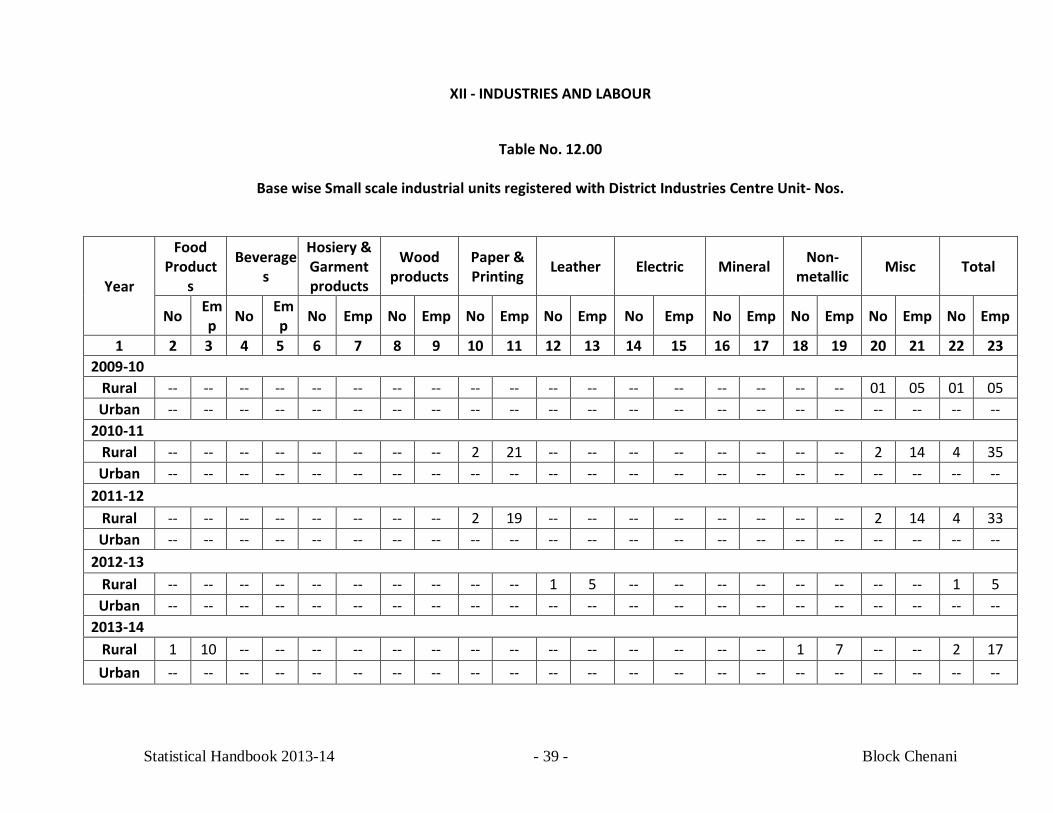
XII - INDUSTRIES AND LABOUR
Table No. 12.00
Base wise Small scale industrial units registered with District Industries Centre Unit- Nos.
Year
Food Product
s
Beverages
Hosiery & Garment products
Wood products
Paper & Printing Leather Electric Mineral Non-
metallic Misc Total
No Emp No Em
p No Emp No Emp No Emp No Emp No Emp No Emp No Emp No Emp No Emp
1 2 3 4 5 6 7 8 9 10 11 12 13 14 15 16 17 18 19 20 21 22 23 2009-10
Rural -- -- -- -- -- -- -- -- -- -- -- -- -- -- -- -- -- -- 01 05 01 05 Urban -- -- -- -- -- -- -- -- -- -- -- -- -- -- -- -- -- -- -- -- -- --
2010-11 Rural -- -- -- -- -- -- -- -- 2 21 -- -- -- -- -- -- -- -- 2 14 4 35 Urban -- -- -- -- -- -- -- -- -- -- -- -- -- -- -- -- -- -- -- -- -- --
2011-12 Rural -- -- -- -- -- -- -- -- 2 19 -- -- -- -- -- -- -- -- 2 14 4 33 Urban -- -- -- -- -- -- -- -- -- -- -- -- -- -- -- -- -- -- -- -- -- --
2012-13 Rural -- -- -- -- -- -- -- -- -- -- 1 5 -- -- -- -- -- -- -- -- 1 5 Urban -- -- -- -- -- -- -- -- -- -- -- -- -- -- -- -- -- -- -- -- -- --
2013-14 Rural 1 10 -- -- -- -- -- -- -- -- -- -- -- -- -- -- 1 7 -- -- 2 17 Urban -- -- -- -- -- -- -- -- -- -- -- -- -- -- -- -- -- -- -- -- -- --
Statistical Handbook 2013-14 - 40 - Block Chenani
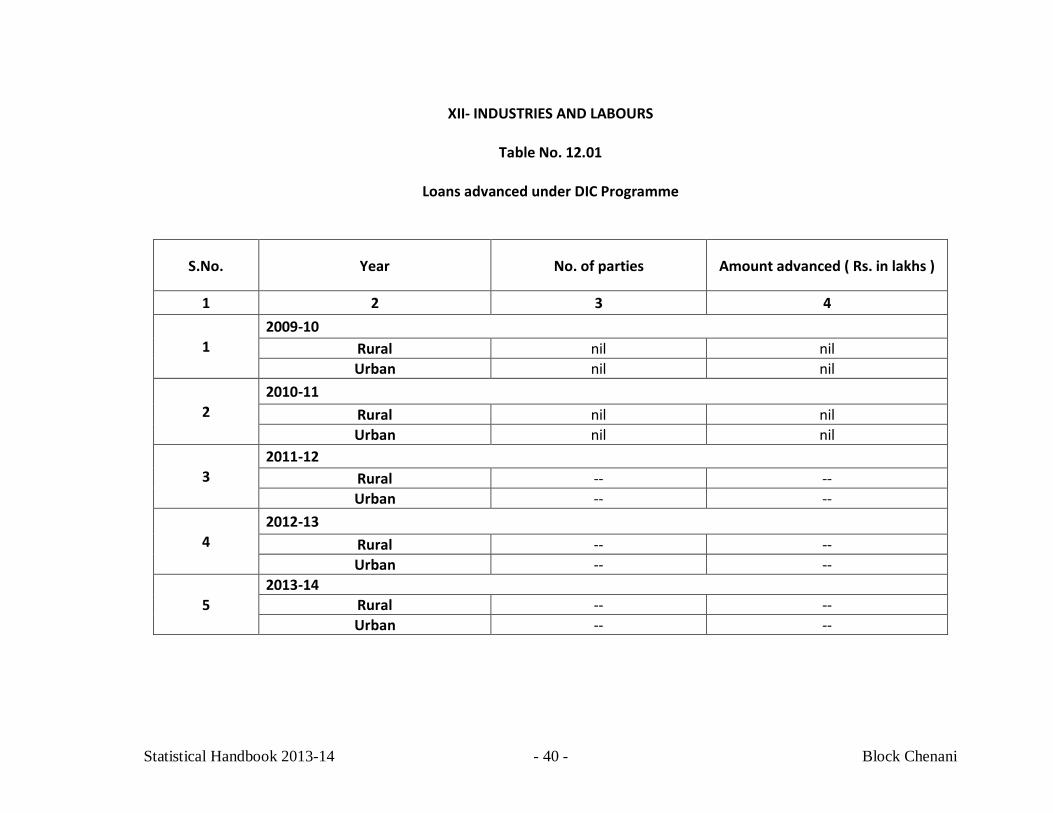
XII- INDUSTRIES AND LABOURS
Table No. 12.01
Loans advanced under DIC Programme
S.No. Year No. of parties Amount advanced ( Rs. in lakhs )
1 2 3 4
1 2009-10
Rural nil nil Urban nil nil
2 2010-11
Rural nil nil Urban nil nil
3 2011-12
Rural -- -- Urban -- --
4 2012-13
Rural -- -- Urban -- --
5 2013-14
Rural -- -- Urban -- --
Statistical Handbook 2013-14 - 41 - Block Chenani
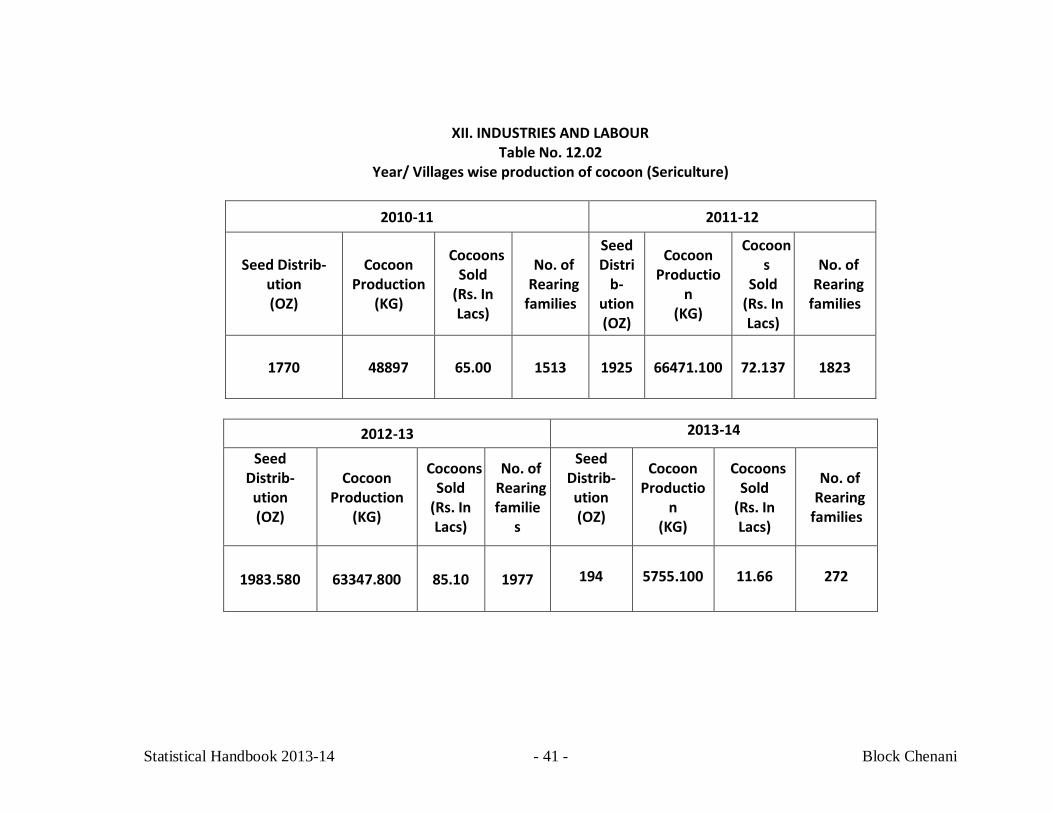
XII. INDUSTRIES AND LABOUR Table No. 12.02
Year/ Villages wise production of cocoon (Sericulture)
2010-11 2011-12
Seed Distrib-ution (OZ)
Cocoon Production
(KG)
Cocoons Sold
(Rs. In Lacs)
No. of Rearing
families
Seed Distri
b-ution (OZ)
Cocoon Productio
n (KG)
Cocoons
Sold (Rs. In Lacs)
No. of Rearing
families
1770 48897 65.00 1513 1925 66471.100 72.137 1823
2012-13 2013-14
Seed Distrib-ution (OZ)
Cocoon Production
(KG)
Cocoons Sold
(Rs. In Lacs)
No. of Rearing familie
s
Seed Distrib-ution (OZ)
Cocoon Productio
n (KG)
Cocoons Sold
(Rs. In Lacs)
No. of Rearing
families
1983.580 63347.800 85.10 1977
194
5755.100
11.66
272
Statistical Handbook 2013-14 - 42 - Block Chenani
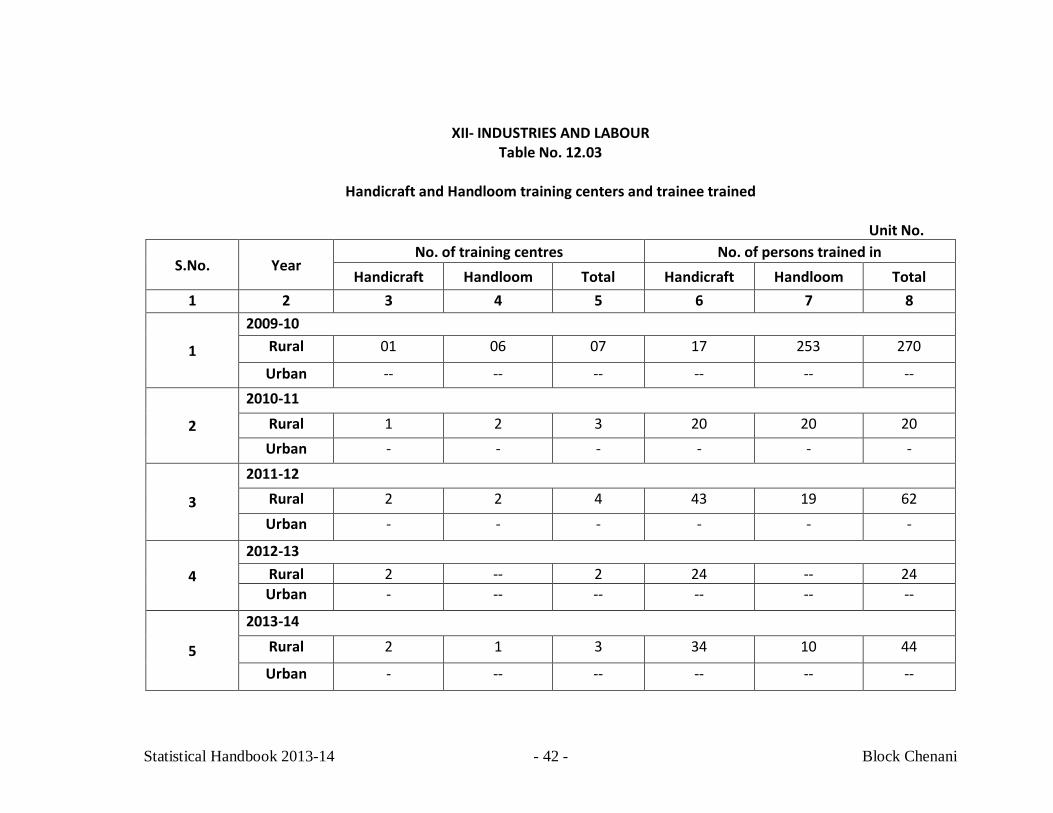
XII- INDUSTRIES AND LABOUR Table No. 12.03
Handicraft and Handloom training centers and trainee trained
Unit No.
S.No. Year No. of training centres No. of persons trained in
Handicraft Handloom Total Handicraft Handloom Total 1 2 3 4 5 6 7 8
1
2009-10 Rural 01 06 07 17 253 270
Urban -- -- -- -- -- --
2
2010-11 Rural 1 2 3 20 20 20 Urban - - - - - -
3
2011-12 Rural 2 2 4 43 19 62 Urban - - - - - -
4 2012-13
Rural 2 -- 2 24 -- 24 Urban - -- -- -- -- --
5
2013-14 Rural 2 1 3 34 10 44
Urban - -- -- -- -- --
Statistical Handbook 2013-14 - 43 - Block Chenani
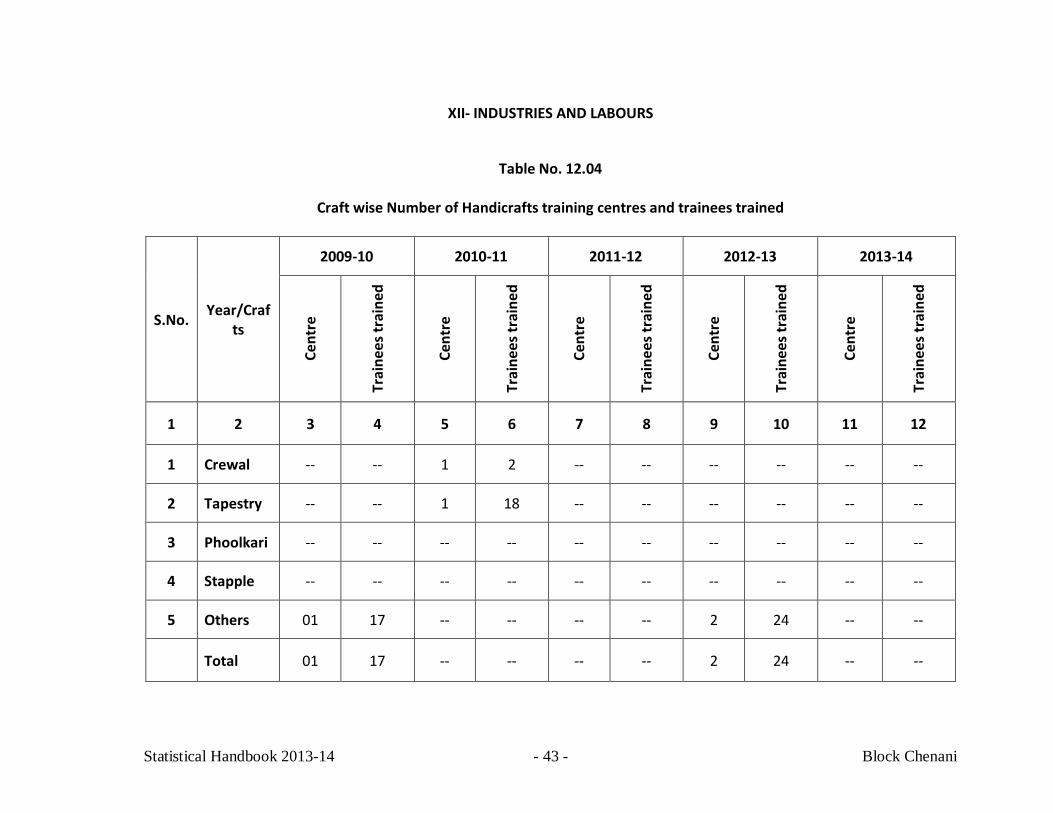
XII- INDUSTRIES AND LABOURS
Table No. 12.04
Craft wise Number of Handicrafts training centres and trainees trained
S.No. Year/Crafts
2009-10 2010-11 2011-12 2012-13 2013-14
Cent
re
Trai
nees
trai
ned
Cent
re
Trai
nees
trai
ned
Cent
re
Trai
nees
trai
ned
Cent
re
Trai
nees
trai
ned
Cent
re
Trai
nees
trai
ned
1 2 3 4 5 6 7 8 9 10 11 12
1 Crewal -- -- 1 2 -- -- -- -- -- --
2 Tapestry -- -- 1 18 -- -- -- -- -- --
3 Phoolkari -- -- -- -- -- -- -- -- -- --
4 Stapple -- -- -- -- -- -- -- -- -- --
5 Others 01 17 -- -- -- -- 2 24 -- --
Total 01 17 -- -- -- -- 2 24 -- --
Statistical Handbook 2013-14 - 44 - Block Chenani
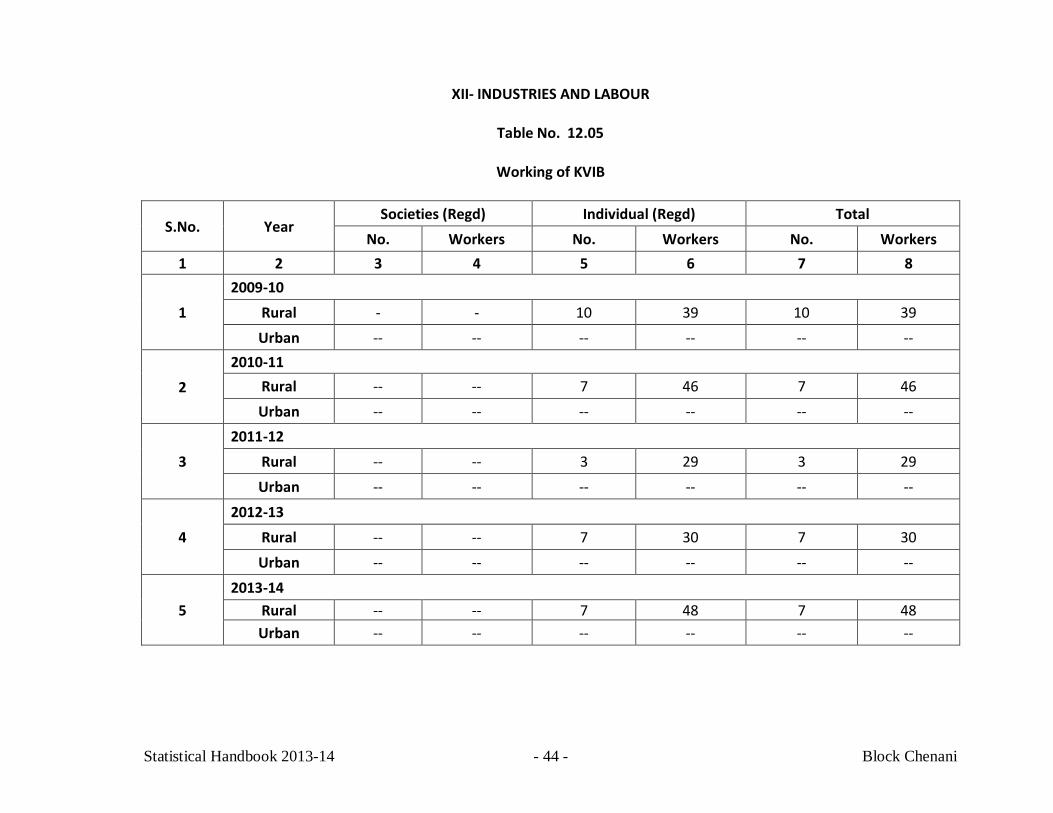
XII- INDUSTRIES AND LABOUR
Table No. 12.05
Working of KVIB
S.No. Year Societies (Regd) Individual (Regd) Total
No. Workers No. Workers No. Workers 1 2 3 4 5 6 7 8
1 2009-10
Rural - - 10 39 10 39 Urban -- -- -- -- -- --
2 2010-11
Rural -- -- 7 46 7 46 Urban -- -- -- -- -- --
3 2011-12
Rural -- -- 3 29 3 29 Urban -- -- -- -- -- --
4 2012-13
Rural -- -- 7 30 7 30 Urban -- -- -- -- -- --
5 2013-14
Rural -- -- 7 48 7 48 Urban -- -- -- -- -- --
Statistical Handbook 2013-14 - 45 - Block Chenani
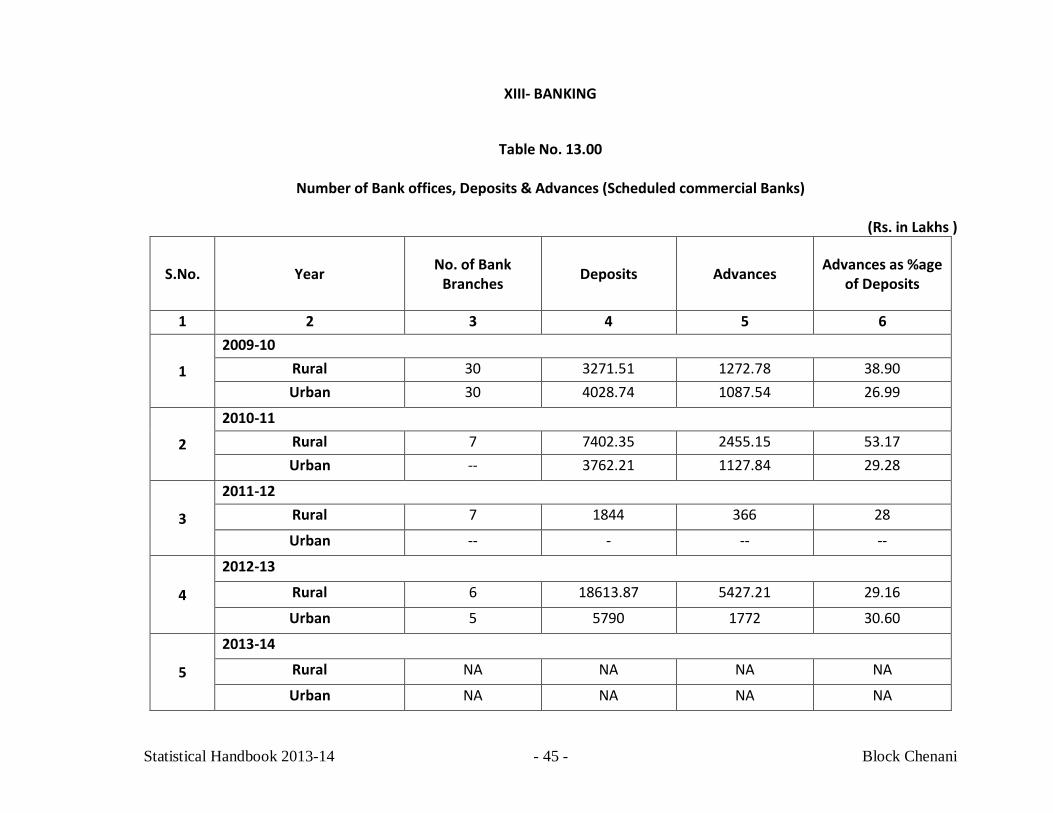
XIII- BANKING
Table No. 13.00
Number of Bank offices, Deposits & Advances (Scheduled commercial Banks)
(Rs. in Lakhs )
S.No. Year No. of Bank Branches Deposits Advances Advances as %age
of Deposits
1 2 3 4 5 6
1
2009-10 Rural 30 3271.51 1272.78 38.90 Urban 30 4028.74 1087.54 26.99
2
2010-11 Rural 7 7402.35 2455.15 53.17 Urban -- 3762.21 1127.84 29.28
3
2011-12 Rural 7 1844 366 28
Urban -- - -- --
4
2012-13
Rural 6 18613.87 5427.21 29.16
Urban 5 5790 1772 30.60
5
2013-14
Rural NA NA NA NA
Urban NA NA NA NA
Statistical Handbook 2013-14 - 46 - Block Chenani
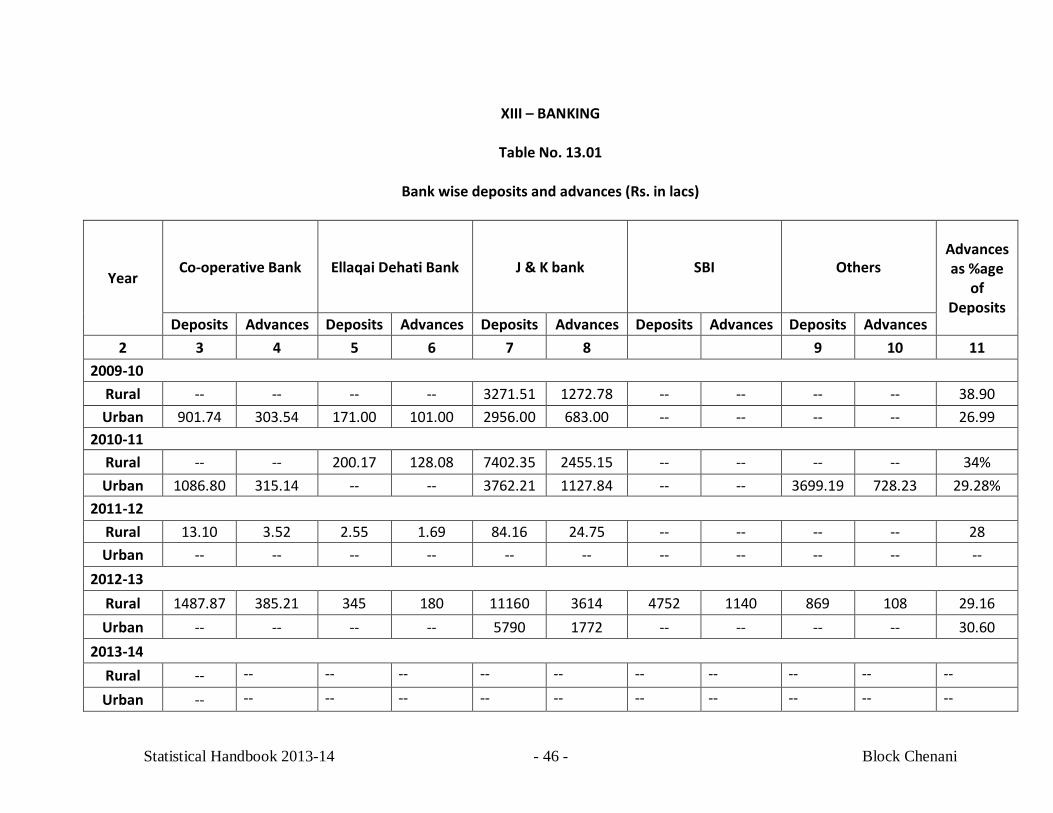
XIII – BANKING
Table No. 13.01
Bank wise deposits and advances (Rs. in lacs)
Year Co-operative Bank Ellaqai Dehati Bank J & K bank SBI Others
Advances as %age
of Deposits
Deposits Advances Deposits Advances Deposits Advances Deposits Advances Deposits Advances 2 3 4 5 6 7 8 9 10 11
2009-10 Rural -- -- -- -- 3271.51 1272.78 -- -- -- -- 38.90 Urban 901.74 303.54 171.00 101.00 2956.00 683.00 -- -- -- -- 26.99
2010-11 Rural -- -- 200.17 128.08 7402.35 2455.15 -- -- -- -- 34% Urban 1086.80 315.14 -- -- 3762.21 1127.84 -- -- 3699.19 728.23 29.28%
2011-12 Rural 13.10 3.52 2.55 1.69 84.16 24.75 -- -- -- -- 28 Urban -- -- -- -- -- -- -- -- -- -- --
2012-13 Rural 1487.87 385.21 345 180 11160 3614 4752 1140 869 108 29.16 Urban -- -- -- -- 5790 1772 -- -- -- -- 30.60
2013-14 Rural -- -- -- -- -- -- -- -- -- -- --
Urban -- -- -- -- -- -- -- -- -- -- --
Statistical Handbook 2013-14 - 47 - Block Chenani
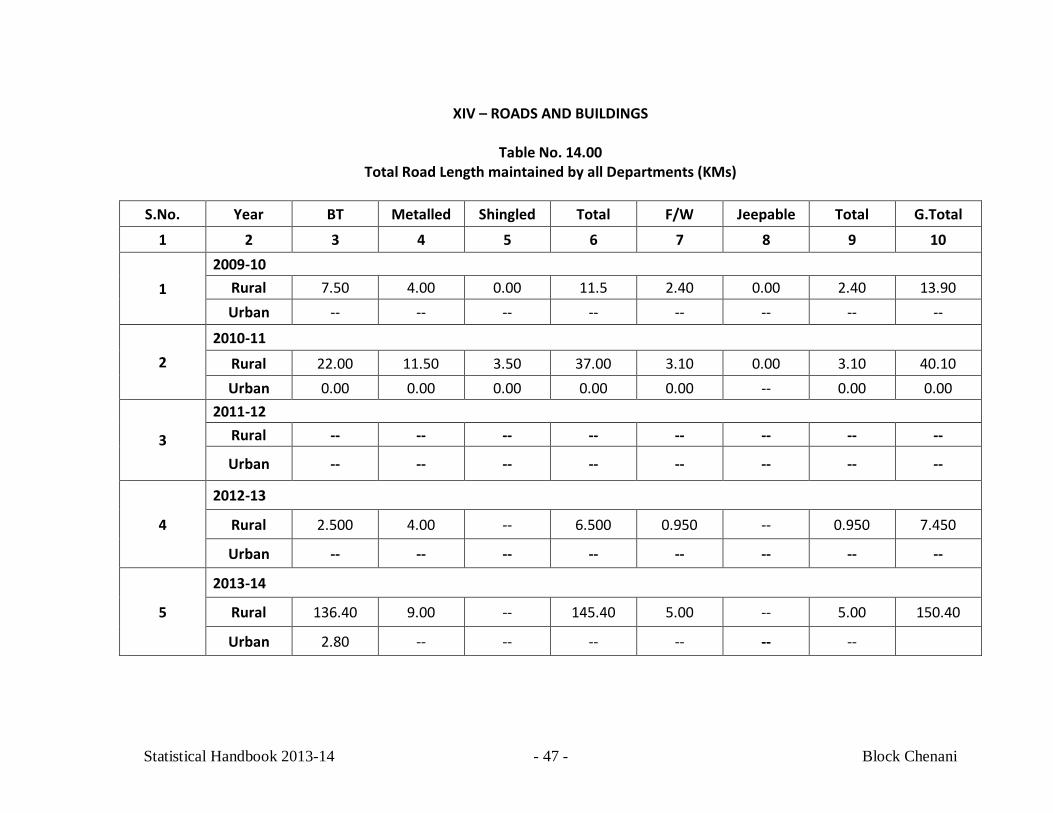
XIV – ROADS AND BUILDINGS
Table No. 14.00
Total Road Length maintained by all Departments (KMs) S.No. Year BT Metalled Shingled Total F/W Jeepable Total G.Total
1 2 3 4 5 6 7 8 9 10
1 2009-10
Rural 7.50 4.00 0.00 11.5 2.40 0.00 2.40 13.90 Urban -- -- -- -- -- -- -- --
2 2010-11
Rural 22.00 11.50 3.50 37.00 3.10 0.00 3.10 40.10 Urban 0.00 0.00 0.00 0.00 0.00 -- 0.00 0.00
3
2011-12 Rural -- -- -- -- -- -- -- --
Urban -- -- -- -- -- -- -- --
4
2012-13
Rural 2.500 4.00 -- 6.500 0.950 -- 0.950 7.450
Urban -- -- -- -- -- -- -- --
5
2013-14
Rural 136.40 9.00 -- 145.40 5.00 -- 5.00 150.40
Urban 2.80 -- -- -- -- -- --
Statistical Handbook 2013-14 - 48 - Block Chenani
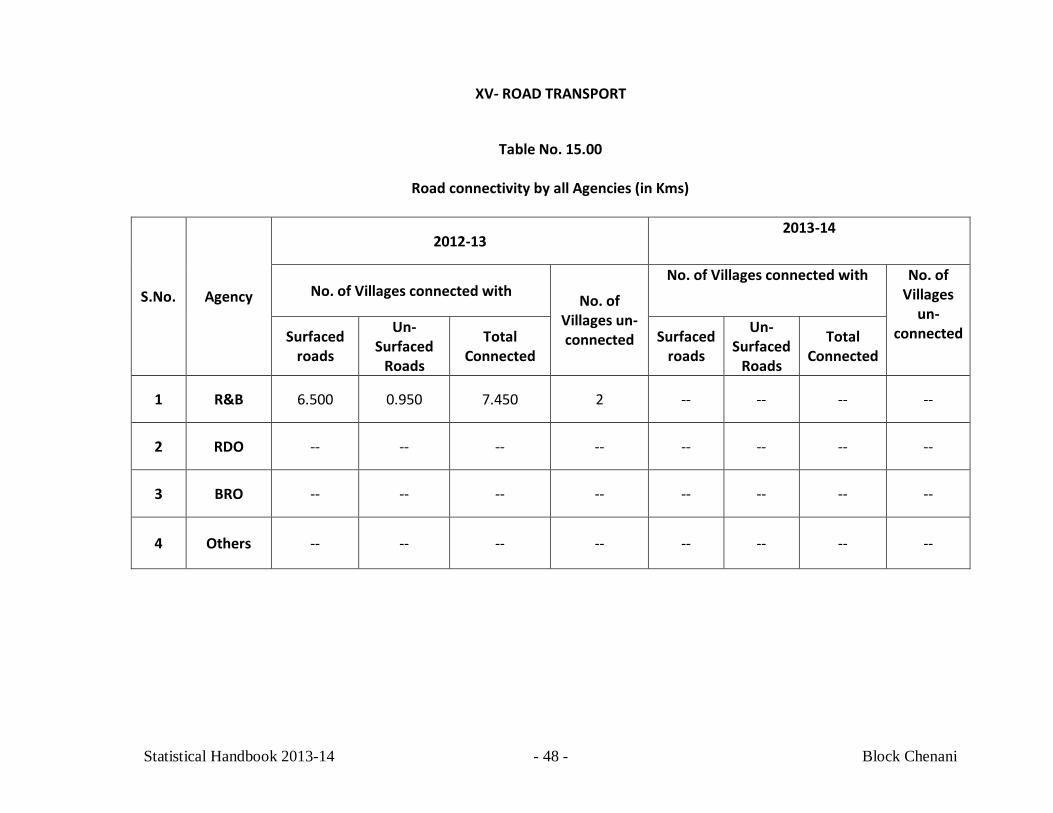
XV- ROAD TRANSPORT
Table No. 15.00
Road connectivity by all Agencies (in Kms)
S.No. Agency
2012-13 2013-14
No. of Villages connected with No. of Villages un-connected
No. of Villages connected with No. of Villages
un-connected Surfaced
roads
Un-Surfaced
Roads
Total Connected
Surfaced roads
Un-Surfaced
Roads
Total Connected
1 R&B 6.500 0.950 7.450 2 -- -- -- --
2 RDO -- -- -- -- -- -- -- --
3 BRO -- -- -- -- -- -- -- --
4 Others -- -- -- -- -- -- -- --
Statistical Handbook 2013-14 - 49 - Block Chenani
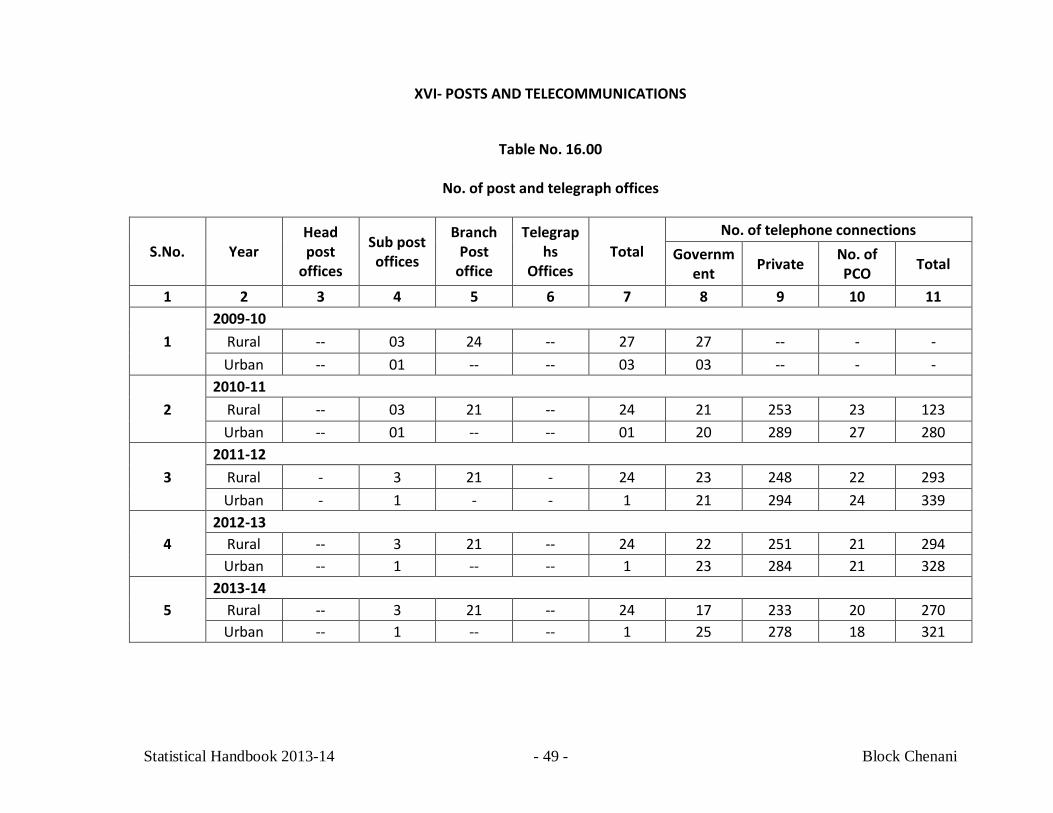
XVI- POSTS AND TELECOMMUNICATIONS
Table No. 16.00
No. of post and telegraph offices
S.No. Year Head post
offices
Sub post offices
Branch Post
office
Telegraphs
Offices Total
No. of telephone connections Governm
ent Private No. of PCO Total
1 2 3 4 5 6 7 8 9 10 11
1 2009-10
Rural -- 03 24 -- 27 27 -- - - Urban -- 01 -- -- 03 03 -- - -
2 2010-11
Rural -- 03 21 -- 24 21 253 23 123 Urban -- 01 -- -- 01 20 289 27 280
3 2011-12
Rural - 3 21 - 24 23 248 22 293 Urban - 1 - - 1 21 294 24 339
4 2012-13
Rural -- 3 21 -- 24 22 251 21 294 Urban -- 1 -- -- 1 23 284 21 328
5 2013-14
Rural -- 3 21 -- 24 17 233 20 270 Urban -- 1 -- -- 1 25 278 18 321
Statistical Handbook 2013-14 - 50 - Block Chenani
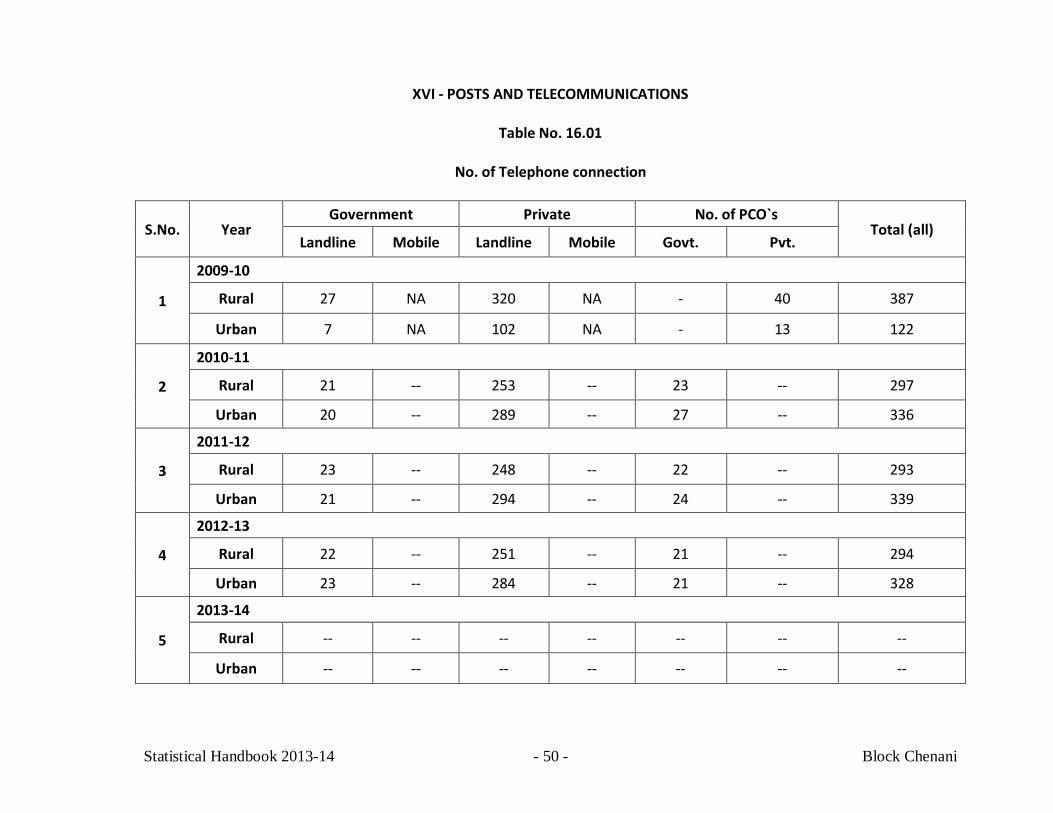
XVI - POSTS AND TELECOMMUNICATIONS
Table No. 16.01
No. of Telephone connection
S.No. Year Government Private No. of PCO`s
Total (all) Landline Mobile Landline Mobile Govt. Pvt.
1
2009-10
Rural 27 NA 320 NA - 40 387
Urban 7 NA 102 NA - 13 122
2
2010-11
Rural 21 -- 253 -- 23 -- 297
Urban 20 -- 289 -- 27 -- 336
3
2011-12
Rural 23 -- 248 -- 22 -- 293
Urban 21 -- 294 -- 24 -- 339
4
2012-13
Rural 22 -- 251 -- 21 -- 294
Urban 23 -- 284 -- 21 -- 328
5
2013-14
Rural -- -- -- -- -- -- --
Urban -- -- -- -- -- -- --
Statistical Handbook 2013-14 - 51 - Block Chenani
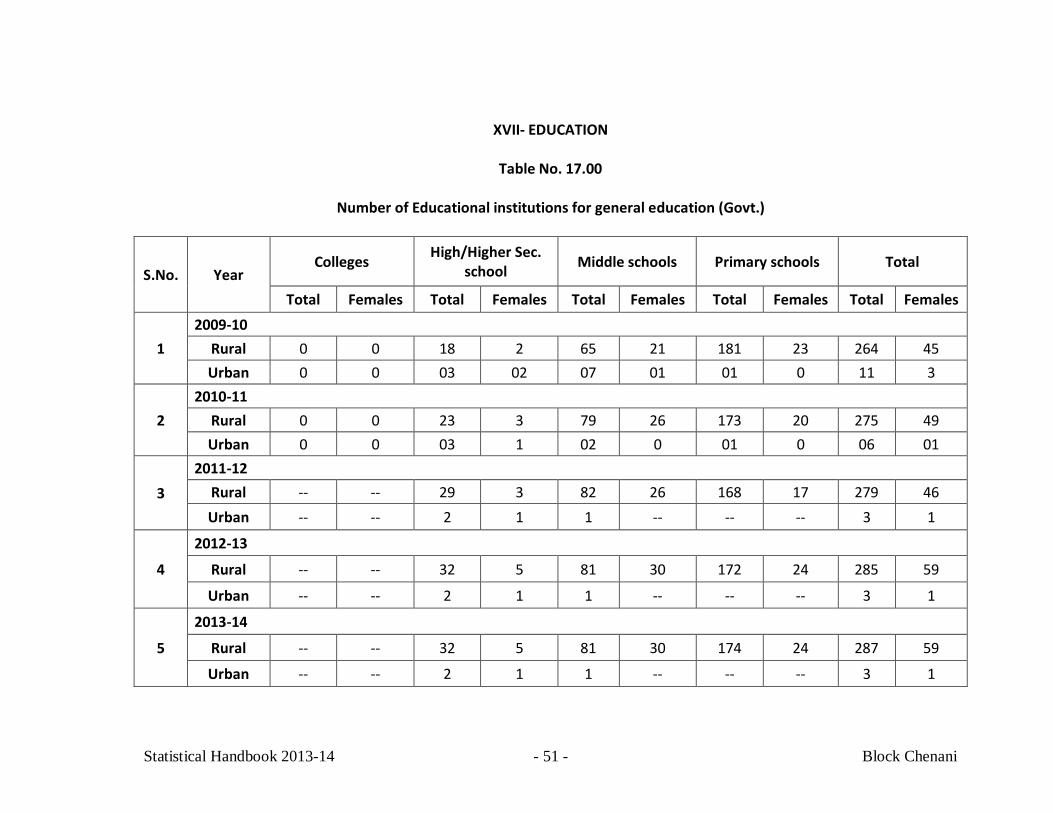
XVII- EDUCATION
Table No. 17.00
Number of Educational institutions for general education (Govt.)
S.No. Year Colleges High/Higher Sec.
school Middle schools Primary schools Total
Total Females Total Females Total Females Total Females Total Females
1 2009-10
Rural 0 0 18 2 65 21 181 23 264 45 Urban 0 0 03 02 07 01 01 0 11 3
2 2010-11
Rural 0 0 23 3 79 26 173 20 275 49 Urban 0 0 03 1 02 0 01 0 06 01
3 2011-12
Rural -- -- 29 3 82 26 168 17 279 46 Urban -- -- 2 1 1 -- -- -- 3 1
4
2012-13
Rural -- -- 32 5 81 30 172 24 285 59
Urban -- -- 2 1 1 -- -- -- 3 1
5
2013-14
Rural -- -- 32 5 81 30 174 24 287 59
Urban -- -- 2 1 1 -- -- -- 3 1
Statistical Handbook 2013-14 - 52 - Block Chenani
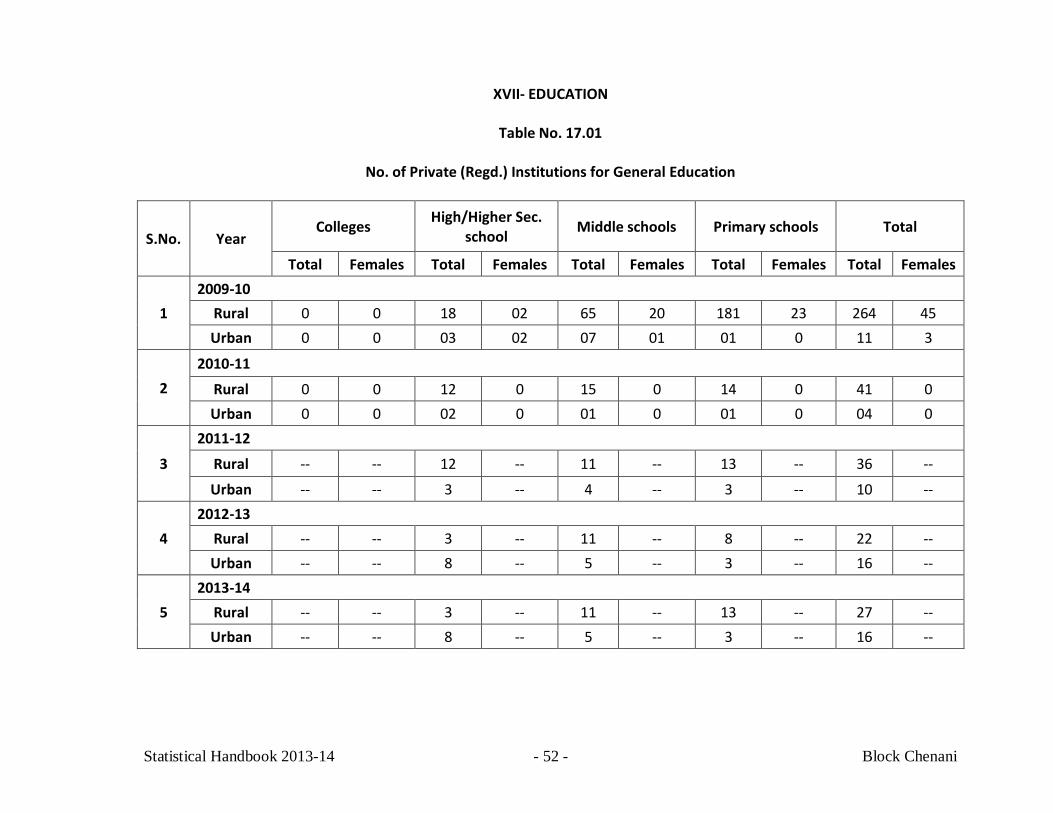
XVII- EDUCATION
Table No. 17.01
No. of Private (Regd.) Institutions for General Education
S.No. Year Colleges High/Higher Sec.
school Middle schools Primary schools Total
Total Females Total Females Total Females Total Females Total Females
1 2009-10
Rural 0 0 18 02 65 20 181 23 264 45 Urban 0 0 03 02 07 01 01 0 11 3
2 2010-11
Rural 0 0 12 0 15 0 14 0 41 0 Urban 0 0 02 0 01 0 01 0 04 0
3
2011-12
Rural -- -- 12 -- 11 -- 13 -- 36 --
Urban -- -- 3 -- 4 -- 3 -- 10 --
4 2012-13
Rural -- -- 3 -- 11 -- 8 -- 22 -- Urban -- -- 8 -- 5 -- 3 -- 16 --
5 2013-14
Rural -- -- 3 -- 11 -- 13 -- 27 -- Urban -- -- 8 -- 5 -- 3 -- 16 --
Statistical Handbook 2013-14 - 53 - Block Chenani
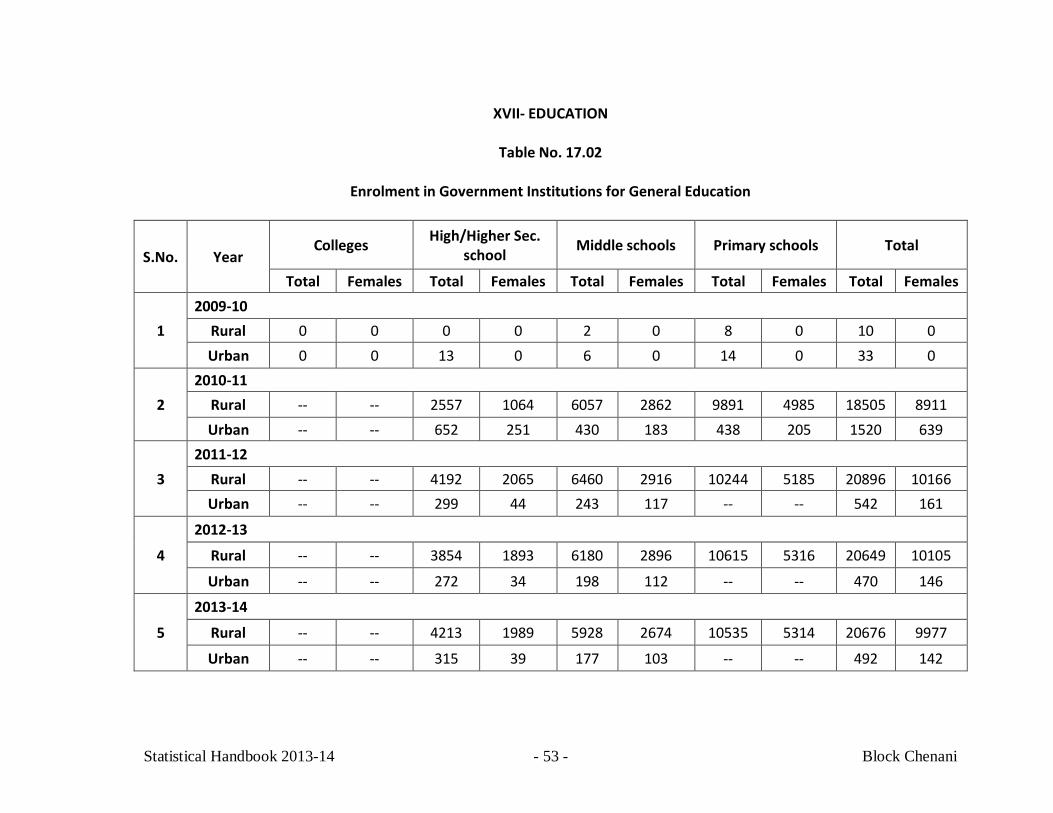
XVII- EDUCATION
Table No. 17.02
Enrolment in Government Institutions for General Education
S.No. Year Colleges High/Higher Sec.
school Middle schools Primary schools Total
Total Females Total Females Total Females Total Females Total Females
1 2009-10
Rural 0 0 0 0 2 0 8 0 10 0 Urban 0 0 13 0 6 0 14 0 33 0
2 2010-11
Rural -- -- 2557 1064 6057 2862 9891 4985 18505 8911 Urban -- -- 652 251 430 183 438 205 1520 639
3 2011-12
Rural -- -- 4192 2065 6460 2916 10244 5185 20896 10166 Urban -- -- 299 44 243 117 -- -- 542 161
4
2012-13
Rural -- -- 3854 1893 6180 2896 10615 5316 20649 10105
Urban -- -- 272 34 198 112 -- -- 470 146
5
2013-14
Rural -- -- 4213 1989 5928 2674 10535 5314 20676 9977
Urban -- -- 315 39 177 103 -- -- 492 142
Statistical Handbook 2013-14 - 54 - Block Chenani
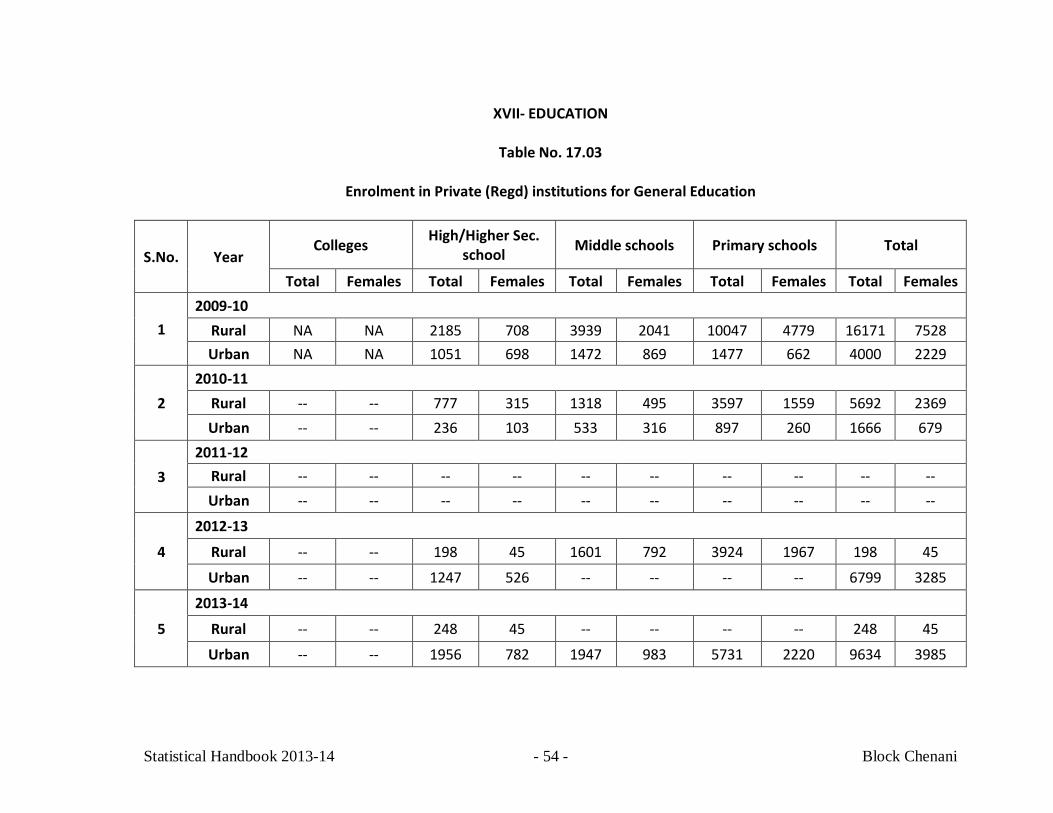
XVII- EDUCATION
Table No. 17.03
Enrolment in Private (Regd) institutions for General Education
S.No. Year Colleges High/Higher Sec.
school Middle schools Primary schools Total
Total Females Total Females Total Females Total Females Total Females
1 2009-10
Rural NA NA 2185 708 3939 2041 10047 4779 16171 7528 Urban NA NA 1051 698 1472 869 1477 662 4000 2229
2 2010-11
Rural -- -- 777 315 1318 495 3597 1559 5692 2369 Urban -- -- 236 103 533 316 897 260 1666 679
3 2011-12
Rural -- -- -- -- -- -- -- -- -- -- Urban -- -- -- -- -- -- -- -- -- --
4
2012-13
Rural -- -- 198 45 1601 792 3924 1967 198 45
Urban -- -- 1247 526 -- -- -- -- 6799 3285
5
2013-14
Rural -- -- 248 45 -- -- -- -- 248 45
Urban -- -- 1956 782 1947 983 5731 2220 9634 3985
Statistical Handbook 2013-14 - 55 - Block Chenani
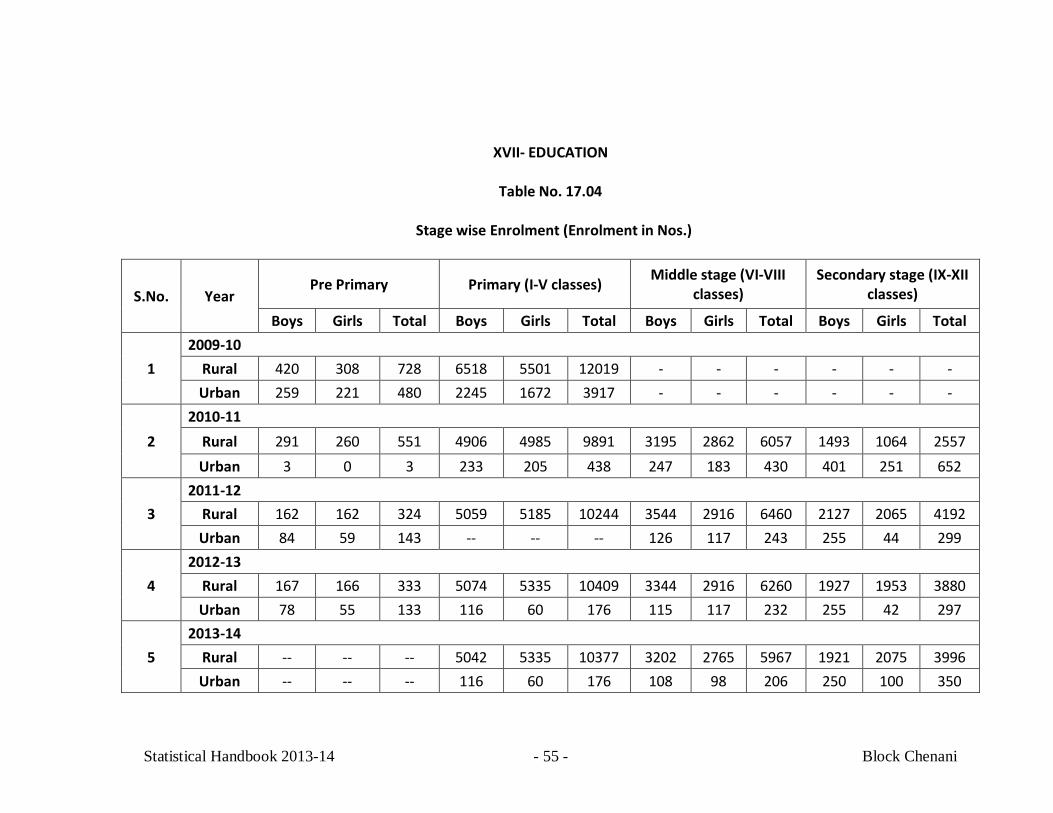
XVII- EDUCATION
Table No. 17.04
Stage wise Enrolment (Enrolment in Nos.)
S.No. Year Pre Primary Primary (I-V classes) Middle stage (VI-VIII
classes) Secondary stage (IX-XII
classes)
Boys Girls Total Boys Girls Total Boys Girls Total Boys Girls Total
1 2009-10
Rural 420 308 728 6518 5501 12019 - - - - - - Urban 259 221 480 2245 1672 3917 - - - - - -
2 2010-11
Rural 291 260 551 4906 4985 9891 3195 2862 6057 1493 1064 2557 Urban 3 0 3 233 205 438 247 183 430 401 251 652
3 2011-12
Rural 162 162 324 5059 5185 10244 3544 2916 6460 2127 2065 4192 Urban 84 59 143 -- -- -- 126 117 243 255 44 299
4 2012-13
Rural 167 166 333 5074 5335 10409 3344 2916 6260 1927 1953 3880 Urban 78 55 133 116 60 176 115 117 232 255 42 297
5 2013-14
Rural -- -- -- 5042 5335 10377 3202 2765 5967 1921 2075 3996 Urban -- -- -- 116 60 176 108 98 206 250 100 350
Statistical Handbook 2013-14 - 56 - Block Chenani
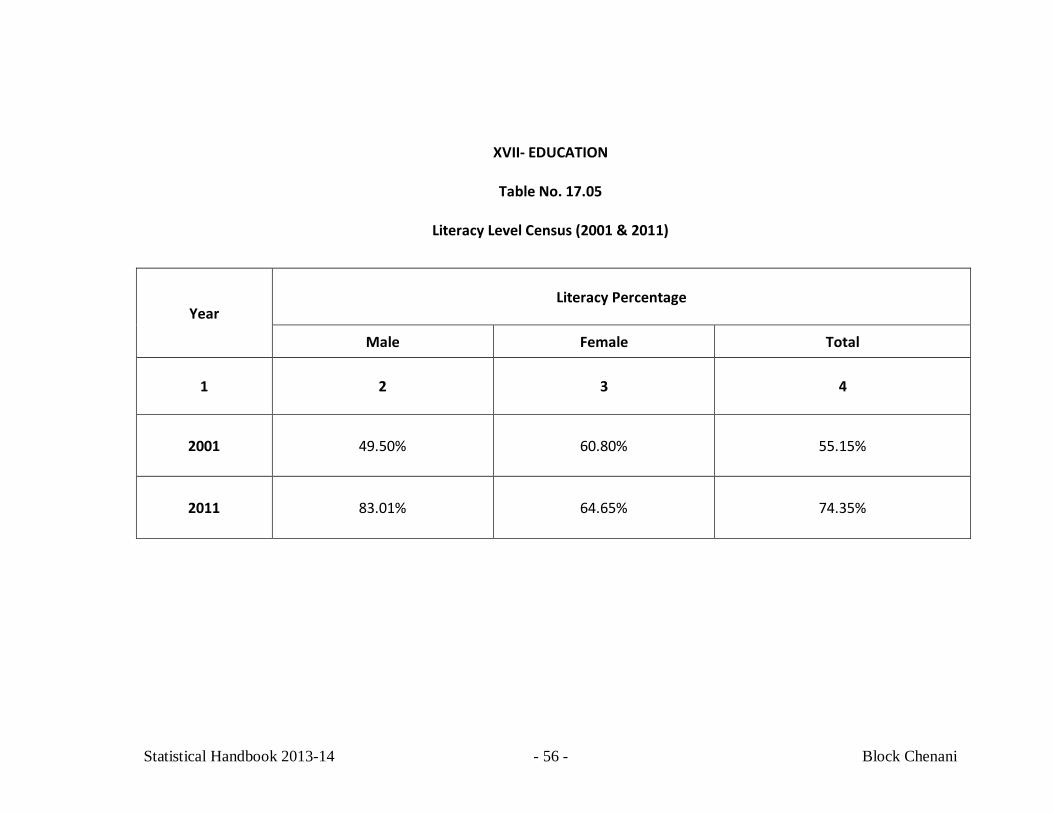
XVII- EDUCATION
Table No. 17.05
Literacy Level Census (2001 & 2011)
Year Literacy Percentage
Male Female Total
1 2 3 4
2001 49.50% 60.80% 55.15%
2011 83.01% 64.65% 74.35%
Statistical Handbook 2013-14 - 57 - Block Chenani
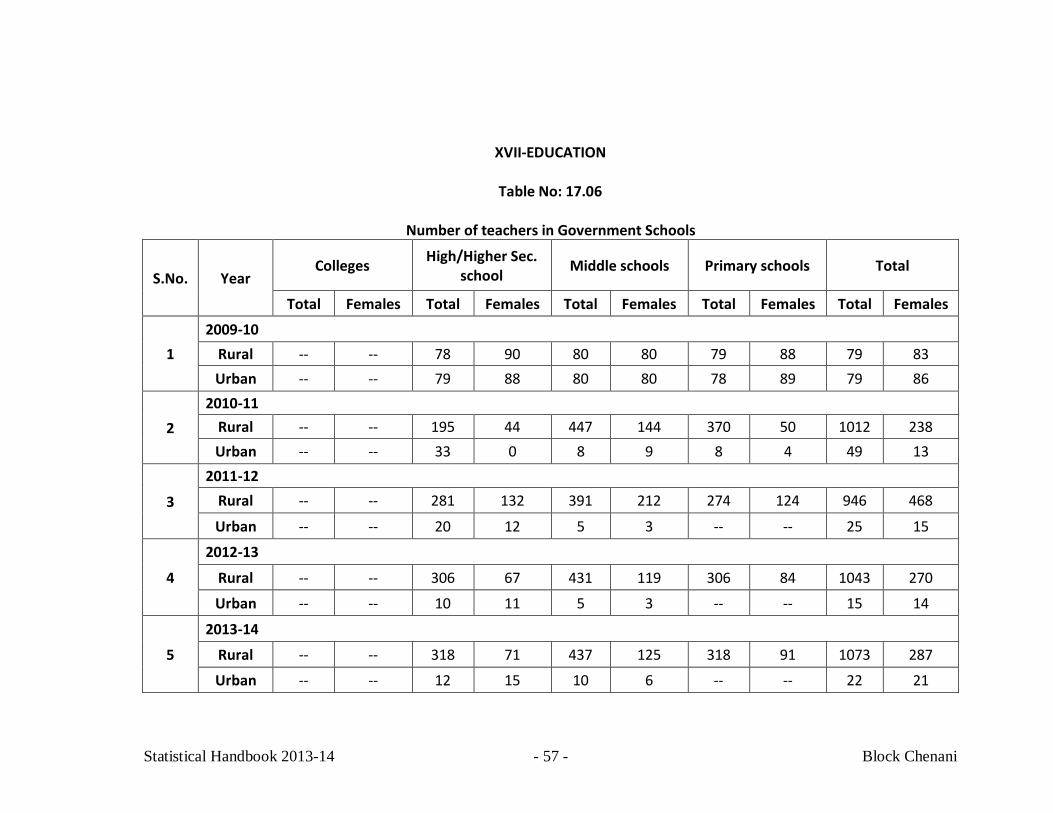
XVII-EDUCATION
Table No: 17.06
Number of teachers in Government Schools
S.No. Year Colleges High/Higher Sec.
school Middle schools Primary schools Total
Total Females Total Females Total Females Total Females Total Females
1 2009-10
Rural -- -- 78 90 80 80 79 88 79 83 Urban -- -- 79 88 80 80 78 89 79 86
2 2010-11
Rural -- -- 195 44 447 144 370 50 1012 238 Urban -- -- 33 0 8 9 8 4 49 13
3
2011-12 Rural -- -- 281 132 391 212 274 124 946 468
Urban -- -- 20 12 5 3 -- -- 25 15
4
2012-13
Rural -- -- 306 67 431 119 306 84 1043 270
Urban -- -- 10 11 5 3 -- -- 15 14
5
2013-14
Rural -- -- 318 71 437 125 318 91 1073 287
Urban -- -- 12 15 10 6 -- -- 22 21
Statistical Handbook 2013-14 - 58 - Block Chenani
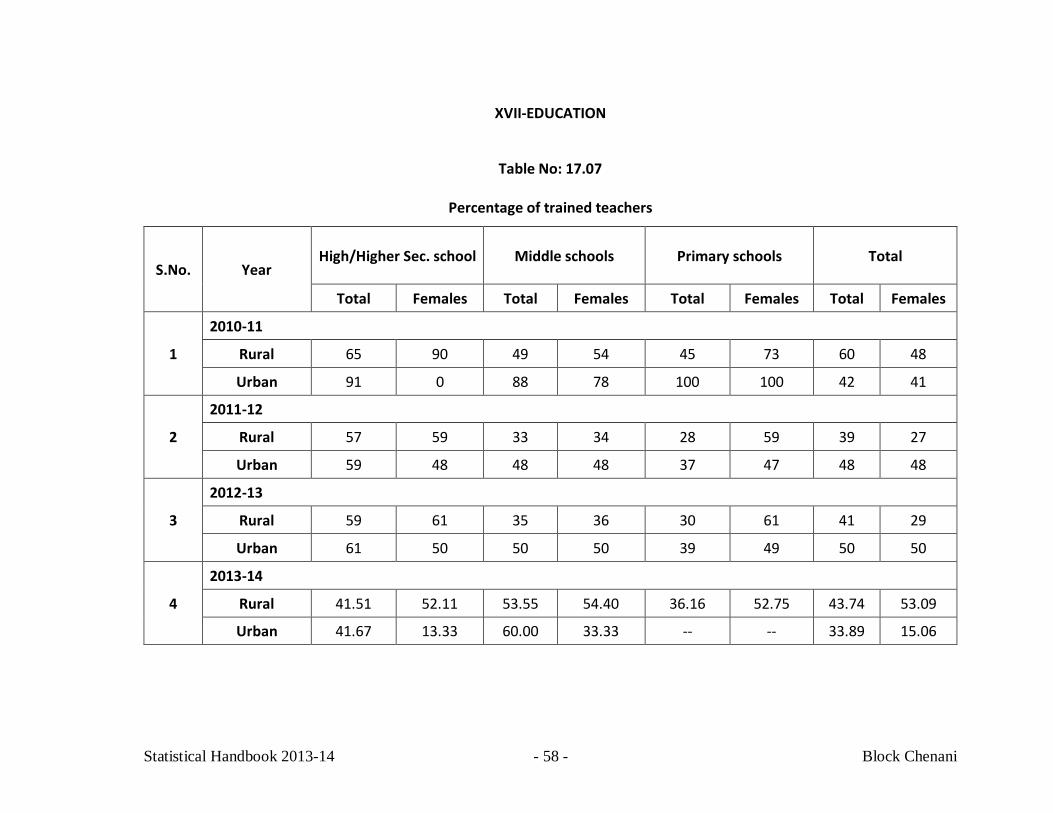
XVII-EDUCATION
Table No: 17.07
Percentage of trained teachers
S.No. Year High/Higher Sec. school Middle schools Primary schools Total
Total Females Total Females Total Females Total Females
1
2010-11
Rural 65 90 49 54 45 73 60 48
Urban 91 0 88 78 100 100 42 41
2
2011-12
Rural 57 59 33 34 28 59 39 27
Urban 59 48 48 48 37 47 48 48
3
2012-13
Rural 59 61 35 36 30 61 41 29
Urban 61 50 50 50 39 49 50 50
4
2013-14
Rural 41.51 52.11 53.55 54.40 36.16 52.75 43.74 53.09
Urban 41.67 13.33 60.00 33.33 -- -- 33.89 15.06
Statistical Handbook 2013-14 - 59 - Block Chenani
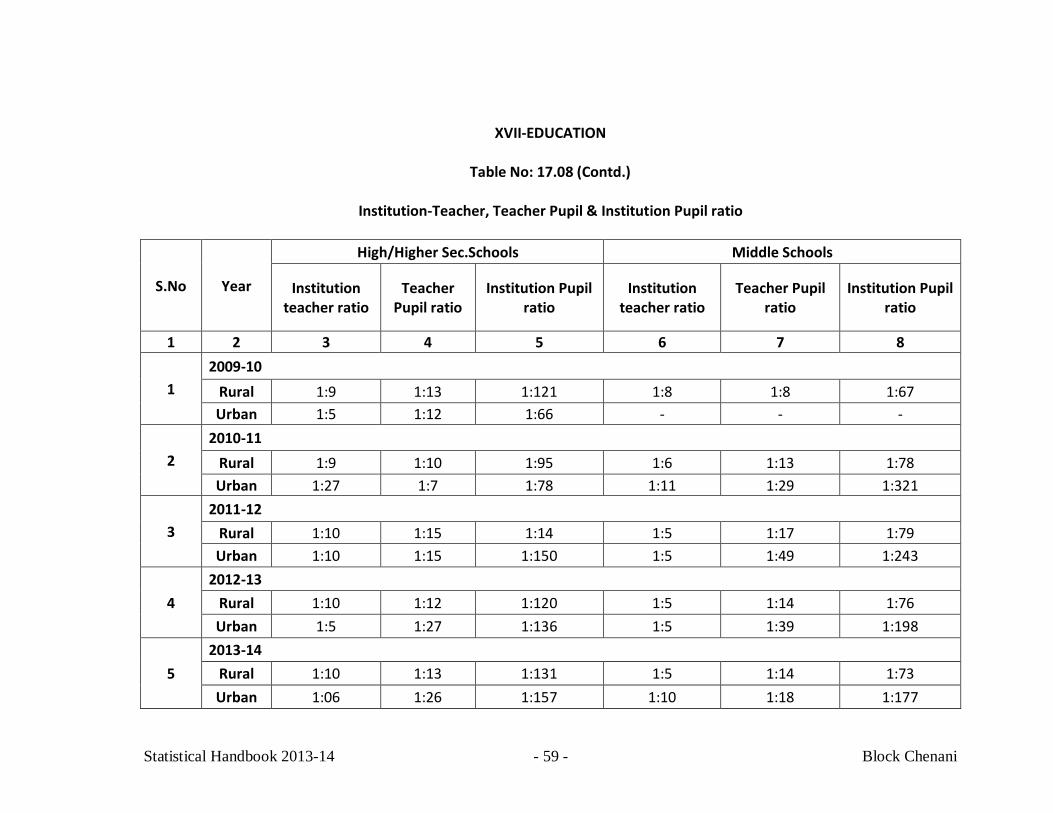
XVII-EDUCATION
Table No: 17.08 (Contd.)
Institution-Teacher, Teacher Pupil & Institution Pupil ratio
S.No Year
High/Higher Sec.Schools Middle Schools
Institution teacher ratio
Teacher Pupil ratio
Institution Pupil ratio
Institution teacher ratio
Teacher Pupil ratio
Institution Pupil ratio
1 2 3 4 5 6 7 8
1 2009-10
Rural 1:9 1:13 1:121 1:8 1:8 1:67 Urban 1:5 1:12 1:66 - - -
2 2010-11
Rural 1:9 1:10 1:95 1:6 1:13 1:78 Urban 1:27 1:7 1:78 1:11 1:29 1:321
3 2011-12
Rural 1:10 1:15 1:14 1:5 1:17 1:79 Urban 1:10 1:15 1:150 1:5 1:49 1:243
4 2012-13
Rural 1:10 1:12 1:120 1:5 1:14 1:76 Urban 1:5 1:27 1:136 1:5 1:39 1:198
5 2013-14
Rural 1:10 1:13 1:131 1:5 1:14 1:73 Urban 1:06 1:26 1:157 1:10 1:18 1:177
Statistical Handbook 2013-14 - 60 - Block Chenani
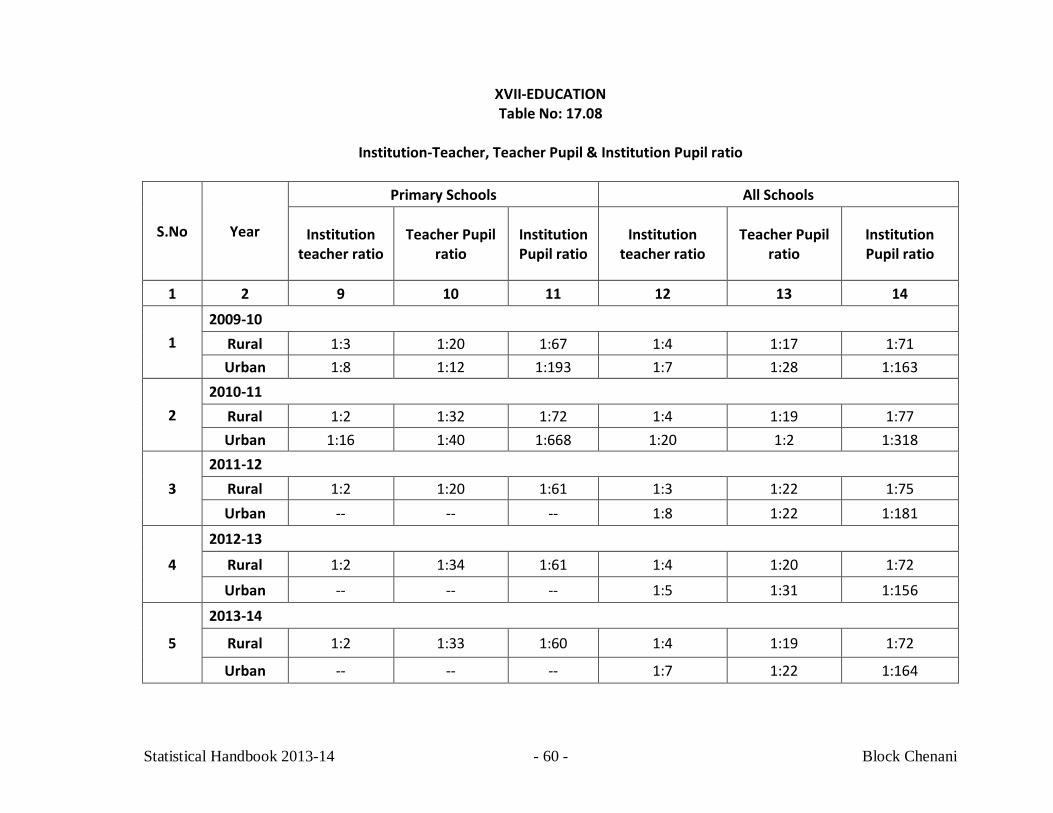
XVII-EDUCATION Table No: 17.08
Institution-Teacher, Teacher Pupil & Institution Pupil ratio
S.No Year
Primary Schools All Schools
Institution teacher ratio
Teacher Pupil ratio
Institution Pupil ratio
Institution teacher ratio
Teacher Pupil ratio
Institution Pupil ratio
1 2 9 10 11 12 13 14
1 2009-10
Rural 1:3 1:20 1:67 1:4 1:17 1:71 Urban 1:8 1:12 1:193 1:7 1:28 1:163
2 2010-11
Rural 1:2 1:32 1:72 1:4 1:19 1:77 Urban 1:16 1:40 1:668 1:20 1:2 1:318
3 2011-12
Rural 1:2 1:20 1:61 1:3 1:22 1:75 Urban -- -- -- 1:8 1:22 1:181
4
2012-13
Rural 1:2 1:34 1:61 1:4 1:20 1:72
Urban -- -- -- 1:5 1:31 1:156
5
2013-14
Rural 1:2 1:33 1:60 1:4 1:19 1:72
Urban -- -- -- 1:7 1:22 1:164
Statistical Handbook 2013-14 - 61 - Block Chenani
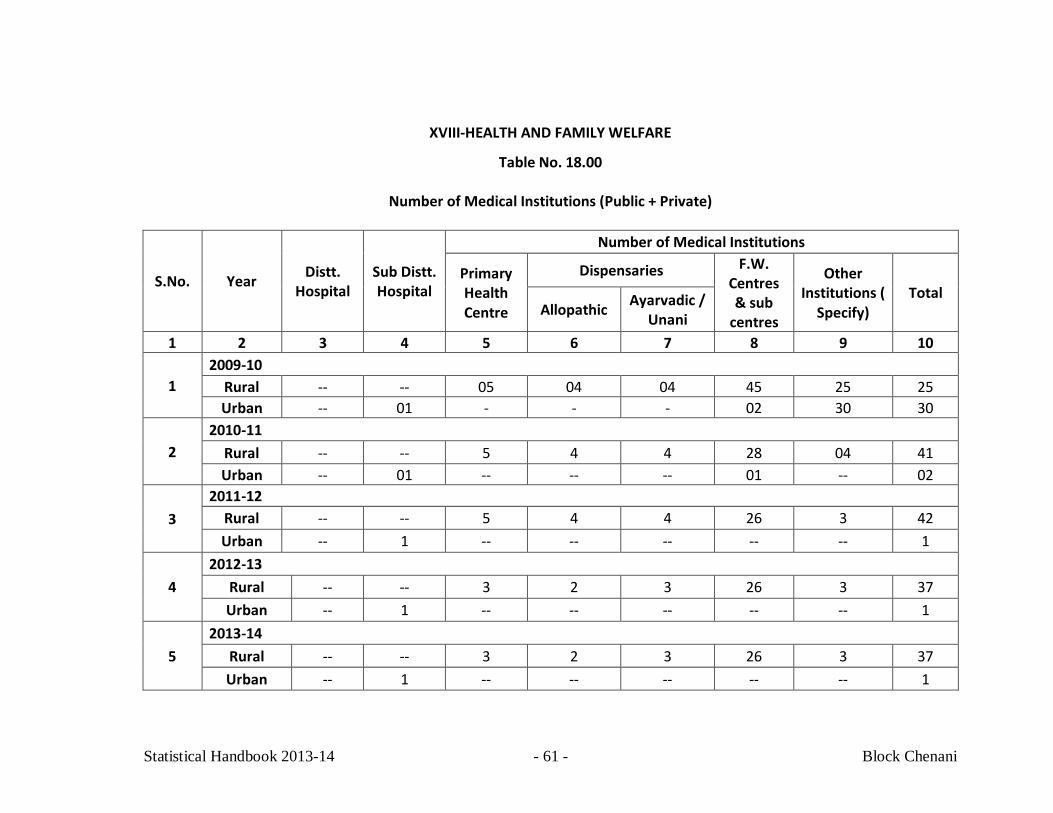
XVIII-HEALTH AND FAMILY WELFARE
Table No. 18.00
Number of Medical Institutions (Public + Private)
S.No. Year Distt. Hospital
Sub Distt. Hospital
Number of Medical Institutions
Primary Health Centre
Dispensaries F.W. Centres & sub
centres
Other Institutions (
Specify) Total
Allopathic Ayarvadic / Unani
1 2 3 4 5 6 7 8 9 10
1 2009-10
Rural -- -- 05 04 04 45 25 25 Urban -- 01 - - - 02 30 30
2 2010-11
Rural -- -- 5 4 4 28 04 41 Urban -- 01 -- -- -- 01 -- 02
3 2011-12
Rural -- -- 5 4 4 26 3 42 Urban -- 1 -- -- -- -- -- 1
4 2012-13
Rural -- -- 3 2 3 26 3 37 Urban -- 1 -- -- -- -- -- 1
5 2013-14
Rural -- -- 3 2 3 26 3 37 Urban -- 1 -- -- -- -- -- 1
Statistical Handbook 2013-14 - 62 - Block Chenani
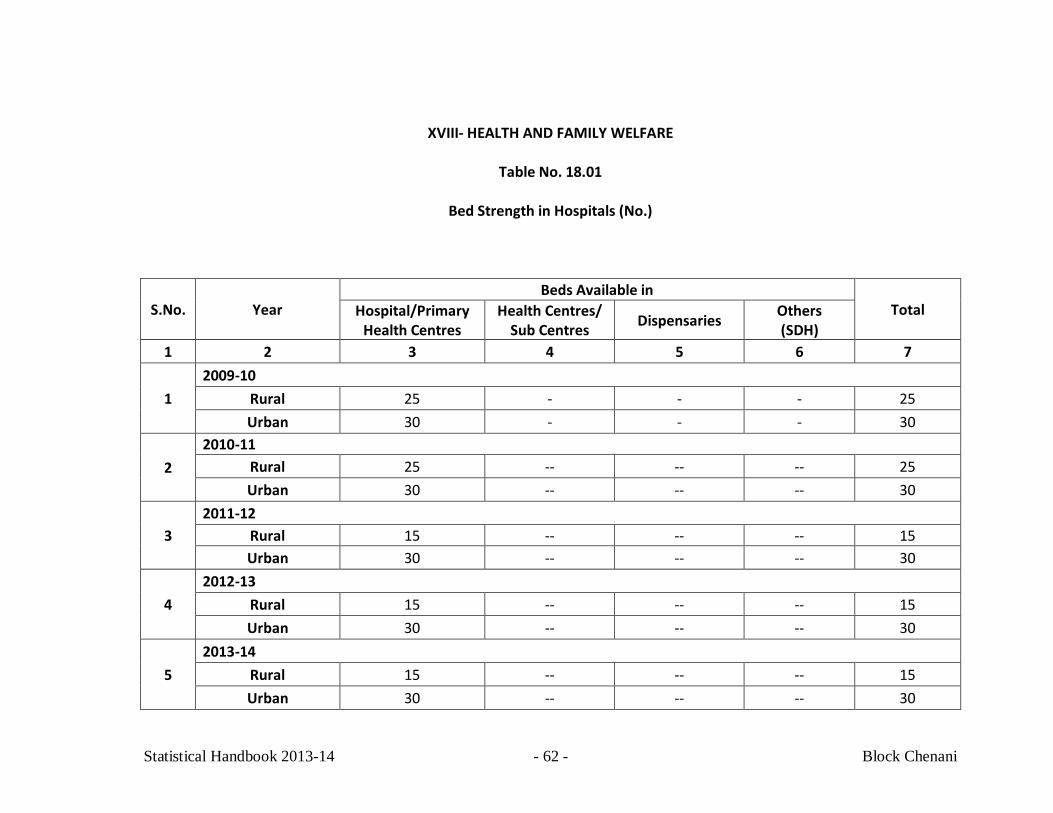
XVIII- HEALTH AND FAMILY WELFARE
Table No. 18.01
Bed Strength in Hospitals (No.)
S.No. Year Beds Available in
Total Hospital/Primary Health Centres
Health Centres/ Sub Centres Dispensaries Others
(SDH) 1 2 3 4 5 6 7
1 2009-10
Rural 25 - - - 25 Urban 30 - - - 30
2 2010-11
Rural 25 -- -- -- 25 Urban 30 -- -- -- 30
3 2011-12
Rural 15 -- -- -- 15 Urban 30 -- -- -- 30
4 2012-13
Rural 15 -- -- -- 15 Urban 30 -- -- -- 30
5 2013-14
Rural 15 -- -- -- 15 Urban 30 -- -- -- 30
Statistical Handbook 2013-14 - 63 - Block Chenani
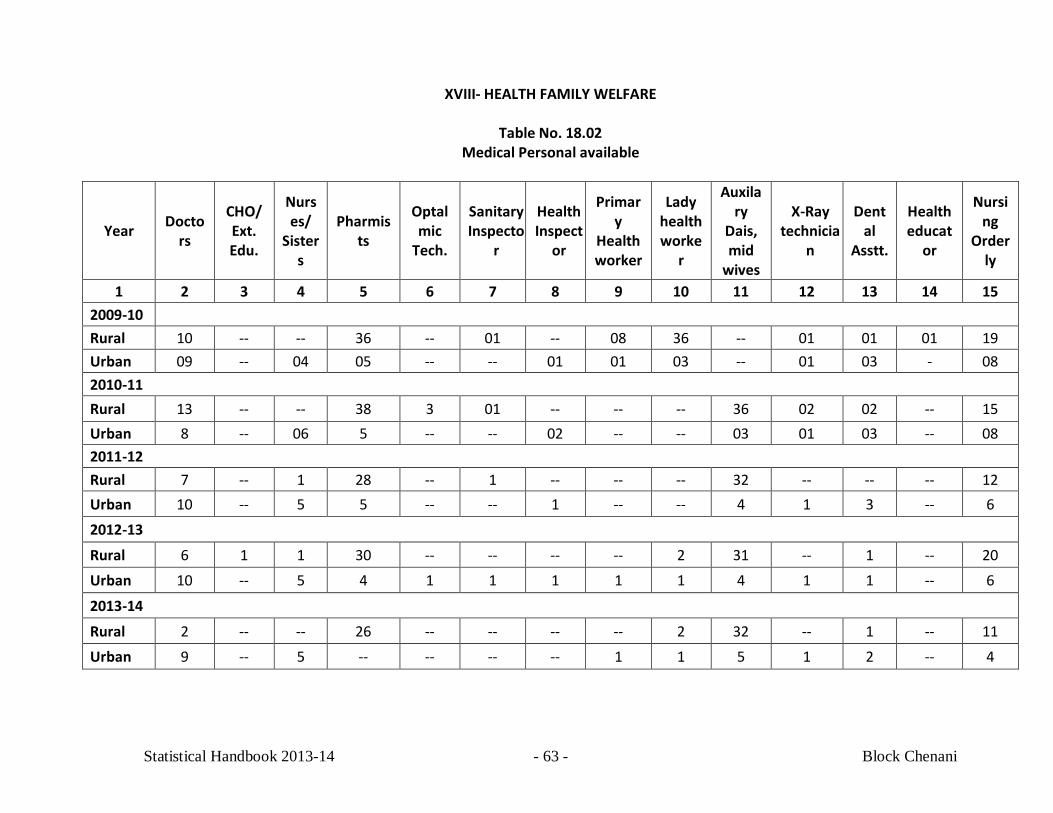
XVIII- HEALTH FAMILY WELFARE
Table No. 18.02 Medical Personal available
Year Doctors
CHO/ Ext. Edu.
Nurses/
Sisters
Pharmists
Optalmic
Tech.
Sanitary Inspecto
r
Health Inspect
or
Primary
Health worker
Lady health worke
r
Auxilary
Dais, mid
wives
X-Ray technicia
n
Dental
Asstt.
Health educat
or
Nursing
Orderly
1 2 3 4 5 6 7 8 9 10 11 12 13 14 15 2009-10 Rural 10 -- -- 36 -- 01 -- 08 36 -- 01 01 01 19 Urban 09 -- 04 05 -- -- 01 01 03 -- 01 03 - 08 2010-11 Rural 13 -- -- 38 3 01 -- -- -- 36 02 02 -- 15 Urban 8 -- 06 5 -- -- 02 -- -- 03 01 03 -- 08 2011-12 Rural 7 -- 1 28 -- 1 -- -- -- 32 -- -- -- 12 Urban 10 -- 5 5 -- -- 1 -- -- 4 1 3 -- 6 2012-13
Rural 6 1 1 30 -- -- -- -- 2 31 -- 1 -- 20 Urban 10 -- 5 4 1 1 1 1 1 4 1 1 -- 6
2013-14
Rural 2 -- -- 26 -- -- -- -- 2 32 -- 1 -- 11 Urban 9 -- 5 -- -- -- -- 1 1 5 1 2 -- 4
Statistical Handbook 2013-14 - 64 - Block Chenani
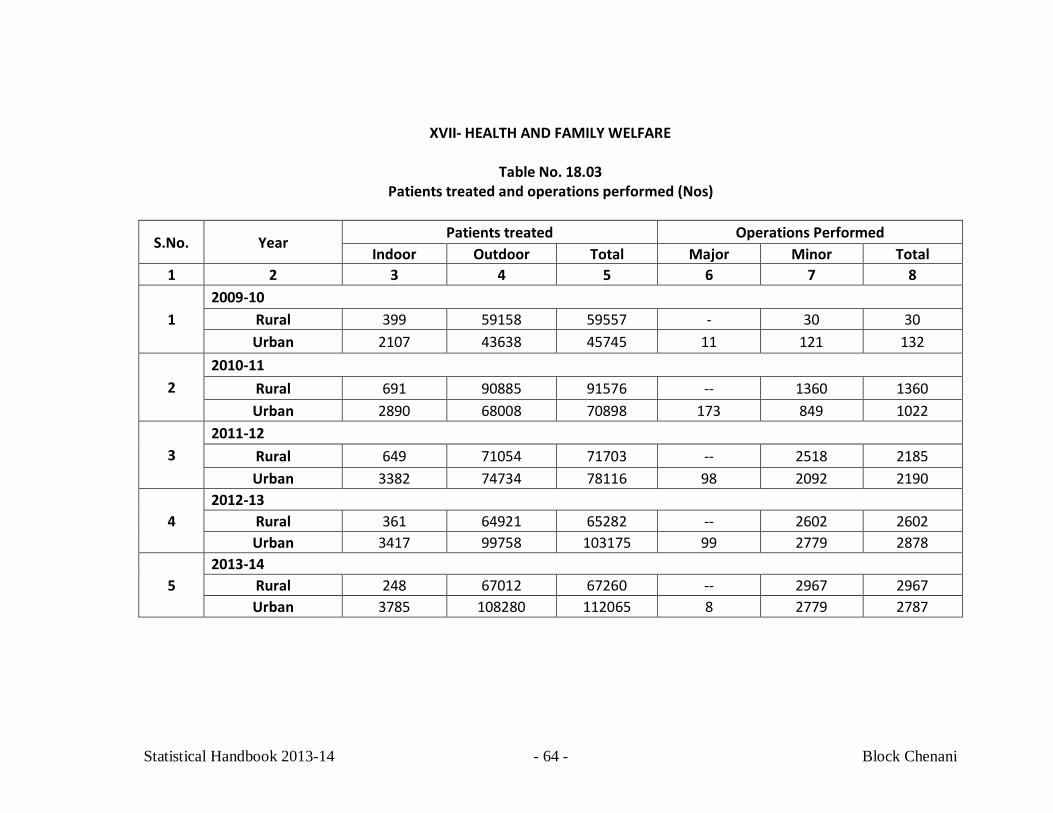
XVII- HEALTH AND FAMILY WELFARE
Table No. 18.03 Patients treated and operations performed (Nos)
S.No. Year Patients treated Operations Performed
Indoor Outdoor Total Major Minor Total 1 2 3 4 5 6 7 8
1 2009-10
Rural 399 59158 59557 - 30 30 Urban 2107 43638 45745 11 121 132
2 2010-11
Rural 691 90885 91576 -- 1360 1360 Urban 2890 68008 70898 173 849 1022
3 2011-12
Rural 649 71054 71703 -- 2518 2185 Urban 3382 74734 78116 98 2092 2190
4 2012-13
Rural 361 64921 65282 -- 2602 2602 Urban 3417 99758 103175 99 2779 2878
5 2013-14
Rural 248 67012 67260 -- 2967 2967 Urban 3785 108280 112065 8 2779 2787
Statistical Handbook 2013-14 - 65 - Block Chenani
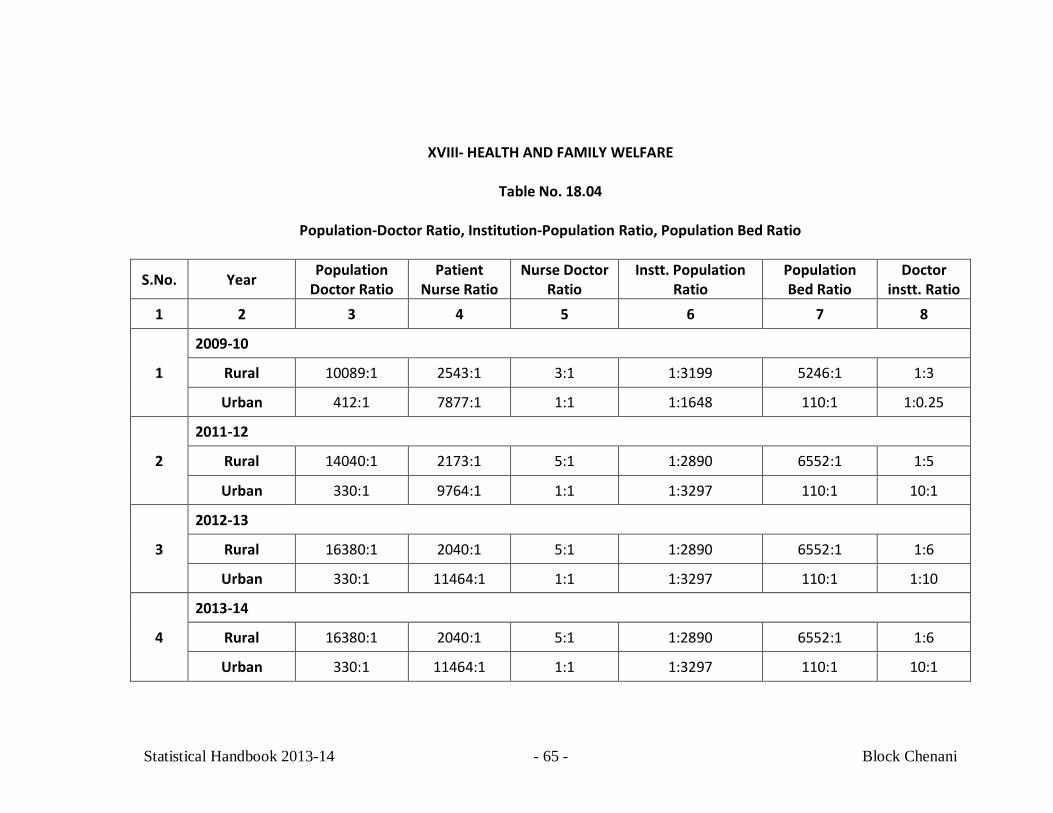
XVIII- HEALTH AND FAMILY WELFARE
Table No. 18.04
Population-Doctor Ratio, Institution-Population Ratio, Population Bed Ratio
S.No. Year Population Doctor Ratio
Patient Nurse Ratio
Nurse Doctor Ratio
Instt. Population Ratio
Population Bed Ratio
Doctor instt. Ratio
1 2 3 4 5 6 7 8
1
2009-10
Rural 10089:1 2543:1 3:1 1:3199 5246:1 1:3
Urban 412:1 7877:1 1:1 1:1648 110:1 1:0.25
2
2011-12
Rural 14040:1 2173:1 5:1 1:2890 6552:1 1:5
Urban 330:1 9764:1 1:1 1:3297 110:1 10:1
3
2012-13
Rural 16380:1 2040:1 5:1 1:2890 6552:1 1:6
Urban 330:1 11464:1 1:1 1:3297 110:1 1:10
4
2013-14
Rural 16380:1 2040:1 5:1 1:2890 6552:1 1:6
Urban 330:1 11464:1 1:1 1:3297 110:1 10:1
Statistical Handbook 2013-14 - 66 - Block Chenani
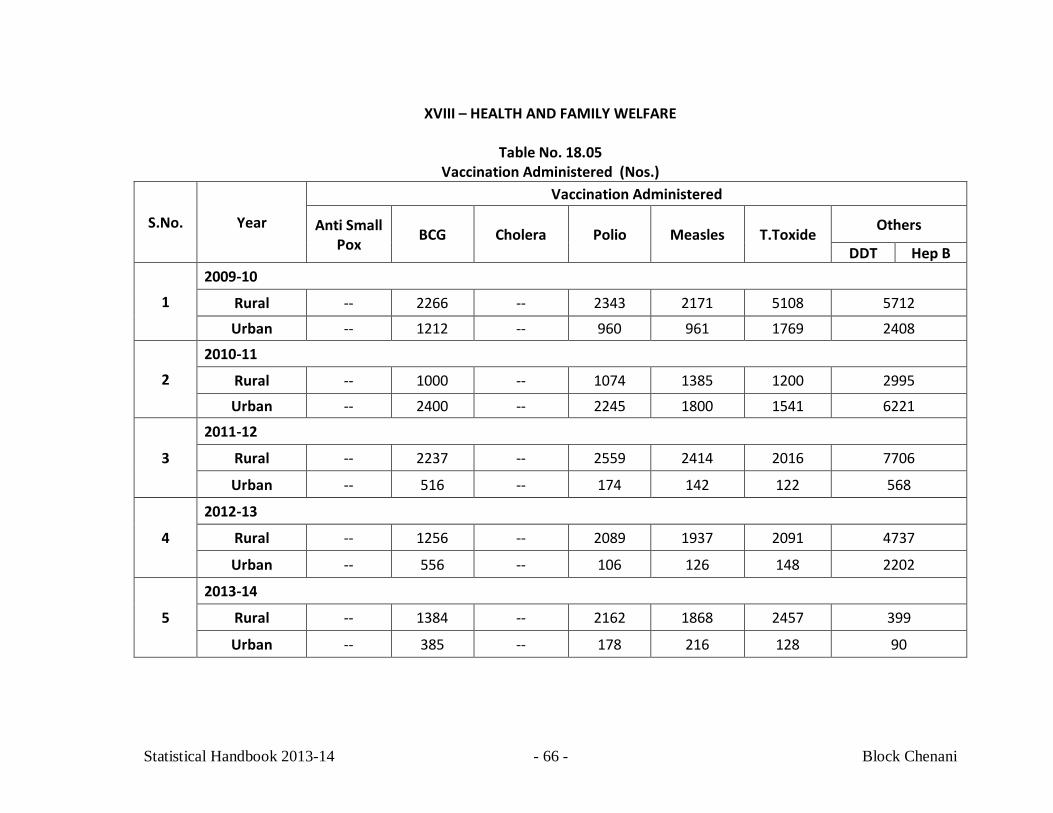
XVIII – HEALTH AND FAMILY WELFARE
Table No. 18.05
Vaccination Administered (Nos.)
S.No. Year
Vaccination Administered
Anti Small Pox BCG Cholera Polio Measles T.Toxide Others
DDT Hep B
1
2009-10
Rural -- 2266 -- 2343 2171 5108 5712
Urban -- 1212 -- 960 961 1769 2408
2
2010-11
Rural -- 1000 -- 1074 1385 1200 2995
Urban -- 2400 -- 2245 1800 1541 6221
3
2011-12
Rural -- 2237 -- 2559 2414 2016 7706
Urban -- 516 -- 174 142 122 568
4
2012-13
Rural -- 1256 -- 2089 1937 2091 4737
Urban -- 556 -- 106 126 148 2202
5
2013-14
Rural -- 1384 -- 2162 1868 2457 399
Urban -- 385 -- 178 216 128 90
Statistical Handbook 2013-14 - 67 - Block Chenani
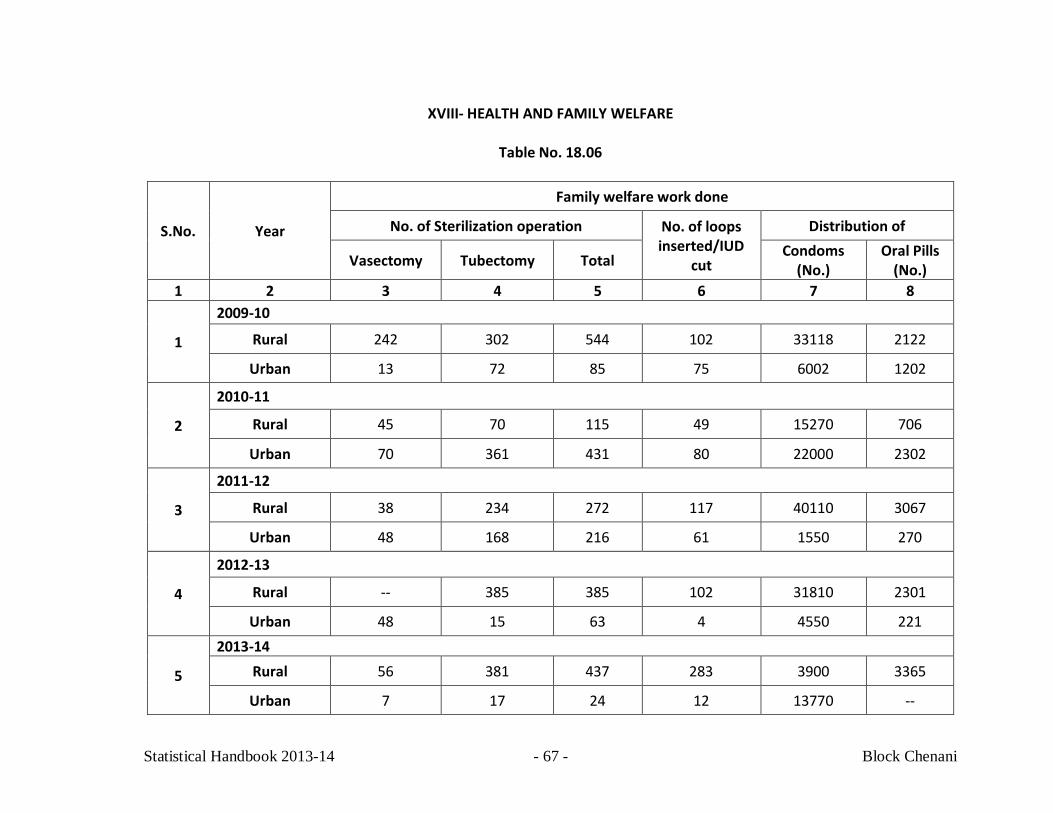
XVIII- HEALTH AND FAMILY WELFARE
Table No. 18.06
S.No. Year
Family welfare work done
No. of Sterilization operation No. of loops inserted/IUD
cut
Distribution of
Vasectomy Tubectomy Total Condoms (No.)
Oral Pills (No.)
1 2 3 4 5 6 7 8
1
2009-10
Rural 242 302 544 102 33118 2122
Urban 13 72 85 75 6002 1202
2
2010-11
Rural 45 70 115 49 15270 706
Urban 70 361 431 80 22000 2302
3
2011-12
Rural 38 234 272 117 40110 3067
Urban 48 168 216 61 1550 270
4
2012-13
Rural -- 385 385 102 31810 2301
Urban 48 15 63 4 4550 221
5
2013-14 Rural 56 381 437 283 3900 3365
Urban 7 17 24 12 13770 --
Statistical Handbook 2013-14 - 68 - Block Chenani
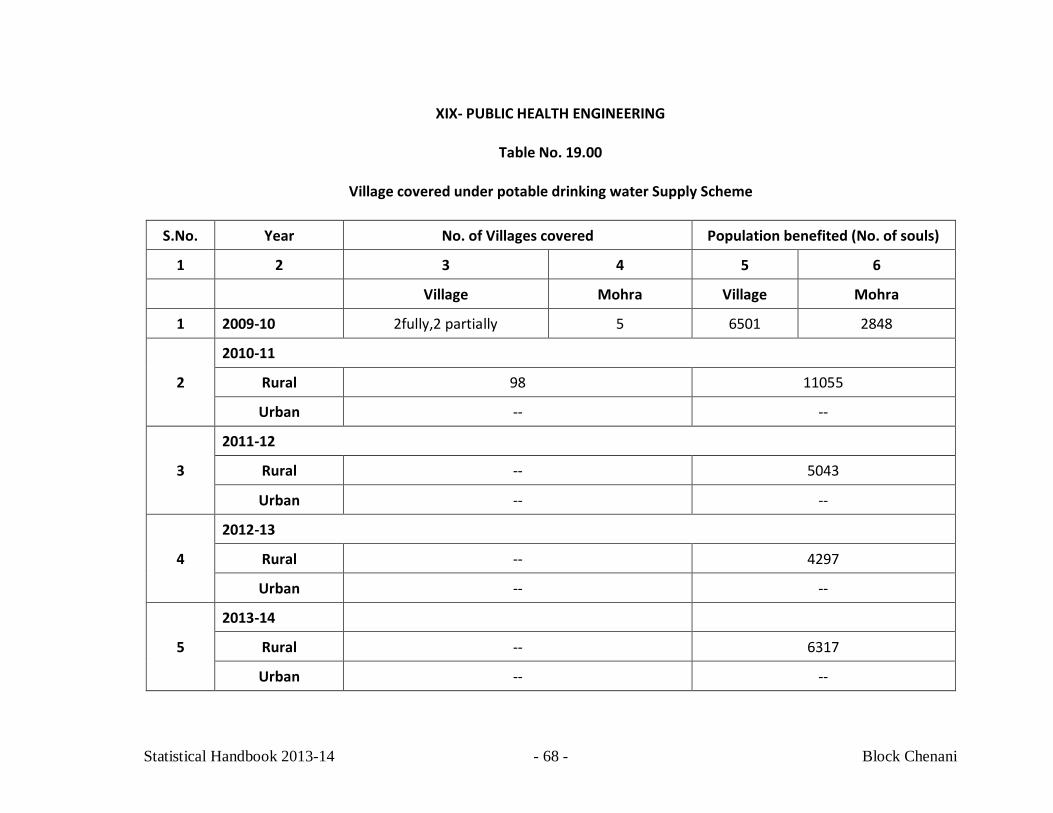
XIX- PUBLIC HEALTH ENGINEERING
Table No. 19.00
Village covered under potable drinking water Supply Scheme
S.No. Year No. of Villages covered Population benefited (No. of souls)
1 2 3 4 5 6
Village Mohra Village Mohra
1 2009-10 2fully,2 partially 5 6501 2848
2
2010-11
Rural 98 11055
Urban -- --
3
2011-12
Rural -- 5043
Urban -- --
4
2012-13
Rural -- 4297
Urban -- --
5
2013-14
Rural -- 6317
Urban -- --
Statistical Handbook 2013-14 - 69 - Block Chenani
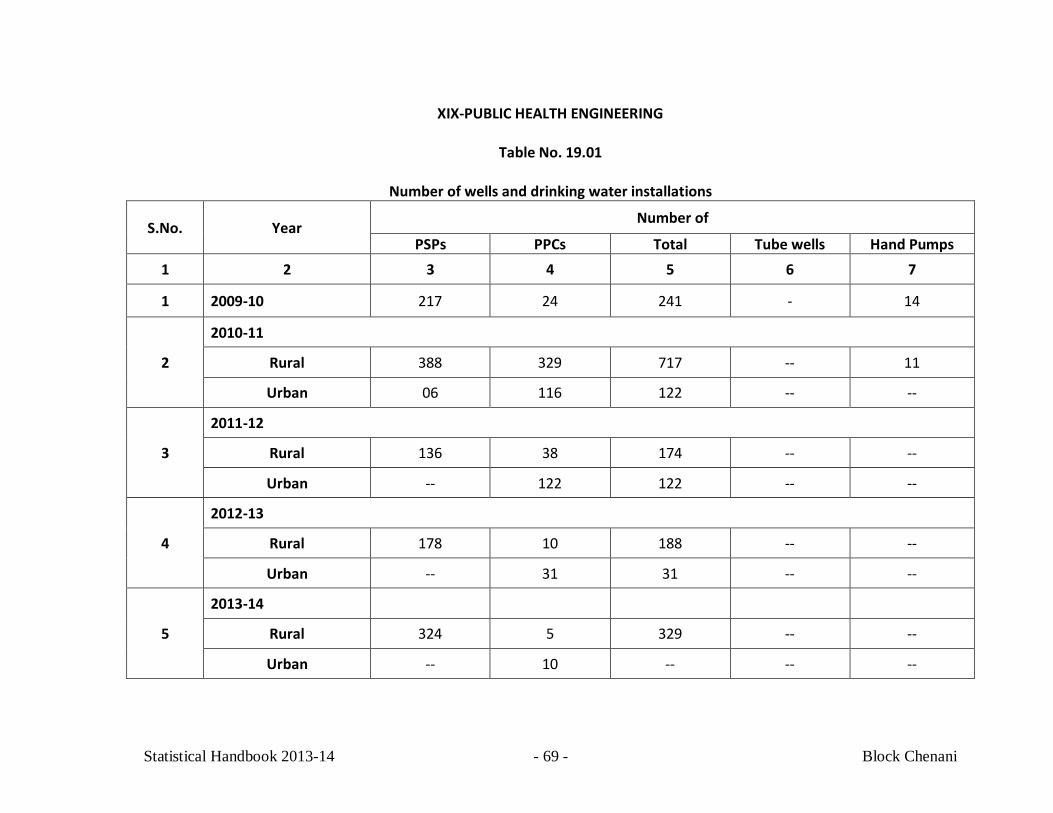
XIX-PUBLIC HEALTH ENGINEERING
Table No. 19.01
Number of wells and drinking water installations
S.No. Year Number of
PSPs PPCs Total Tube wells Hand Pumps 1 2 3 4 5 6 7
1 2009-10 217 24 241 - 14
2
2010-11
Rural 388 329 717 -- 11
Urban 06 116 122 -- --
3
2011-12
Rural 136 38 174 -- --
Urban -- 122 122 -- --
4
2012-13
Rural 178 10 188 -- --
Urban -- 31 31 -- --
5
2013-14
Rural 324 5 329 -- --
Urban -- 10 -- -- --
Statistical Handbook 2013-14 - 70 - Block Chenani
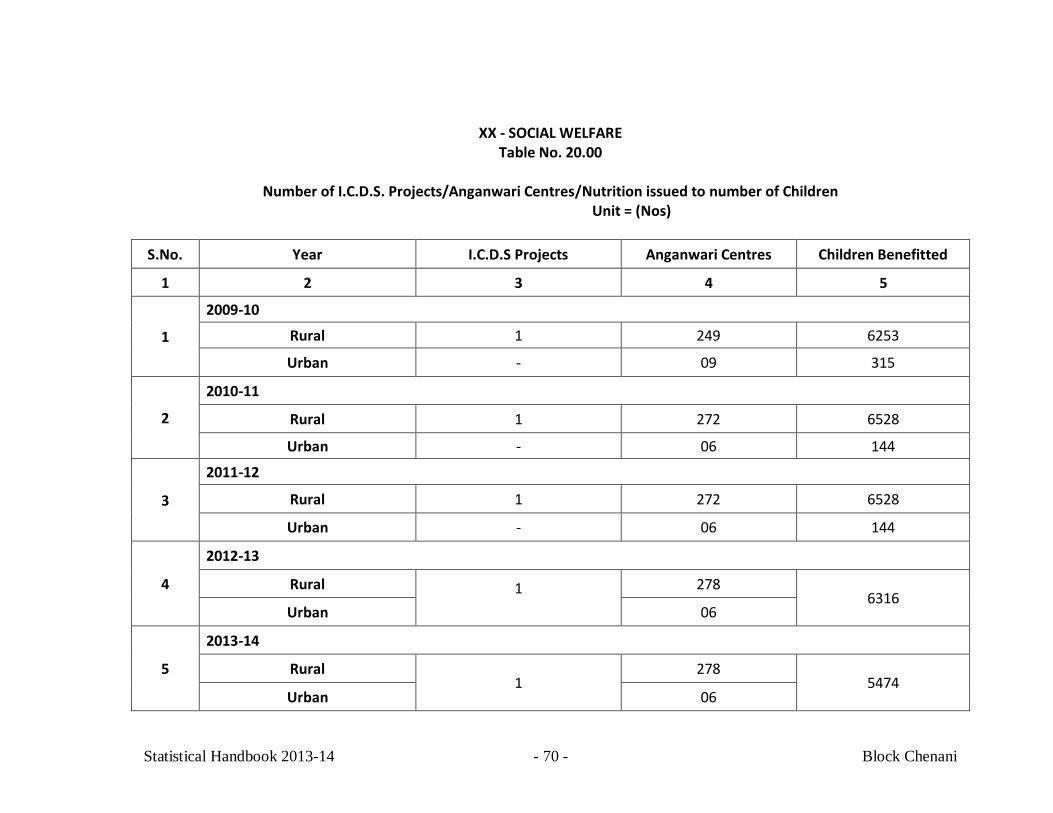
XX - SOCIAL WELFARE Table No. 20.00
Number of I.C.D.S. Projects/Anganwari Centres/Nutrition issued to number of Children
Unit = (Nos)
S.No. Year I.C.D.S Projects Anganwari Centres Children Benefitted
1 2 3 4 5
1
2009-10
Rural 1 249 6253
Urban - 09 315
2
2010-11
Rural 1 272 6528
Urban - 06 144
3
2011-12
Rural 1 272 6528
Urban - 06 144
4
2012-13
Rural 1
278 6316
Urban 06
5
2013-14
Rural 1
278 5474
Urban 06
Statistical Handbook 2013-14 - 71 - Block Chenani
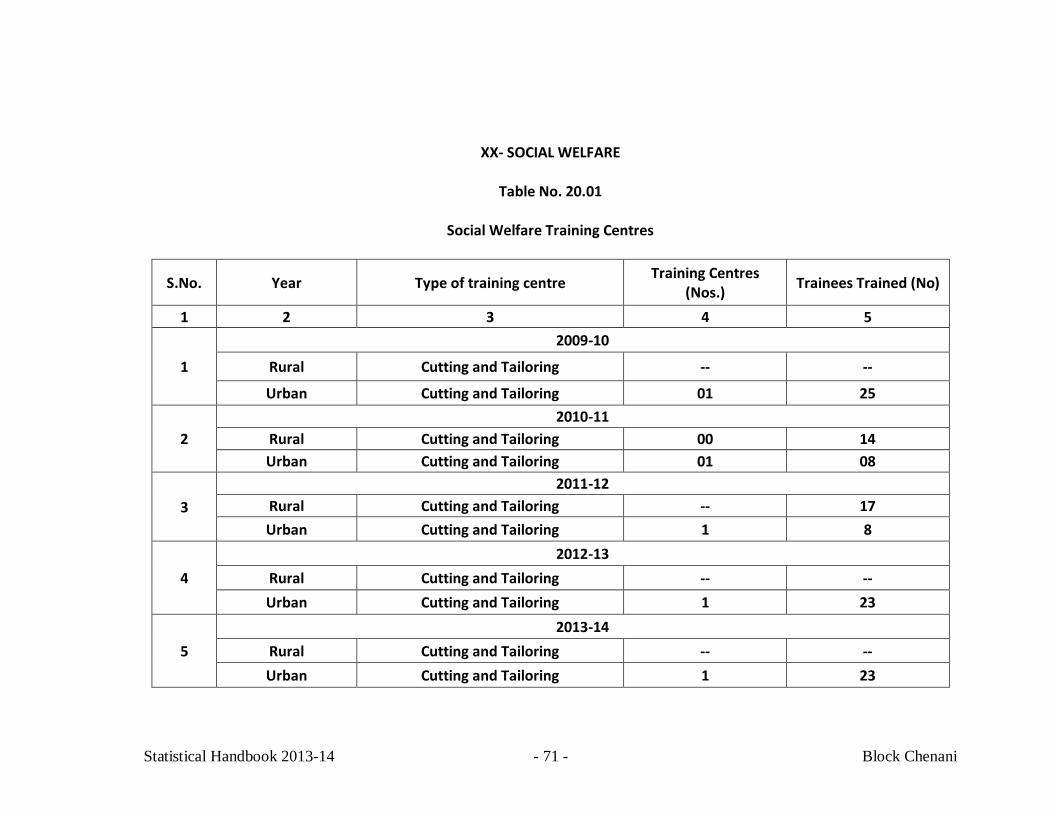
XX- SOCIAL WELFARE
Table No. 20.01
Social Welfare Training Centres
S.No. Year Type of training centre Training Centres (Nos.) Trainees Trained (No)
1 2 3 4 5
1
2009-10
Rural Cutting and Tailoring -- --
Urban Cutting and Tailoring 01 25
2 2010-11
Rural Cutting and Tailoring 00 14 Urban Cutting and Tailoring 01 08
3 2011-12
Rural Cutting and Tailoring -- 17 Urban Cutting and Tailoring 1 8
4 2012-13
Rural Cutting and Tailoring -- -- Urban Cutting and Tailoring 1 23
5 2013-14
Rural Cutting and Tailoring -- -- Urban Cutting and Tailoring 1 23
Statistical Handbook 2013-14 - 72 - Block Chenani
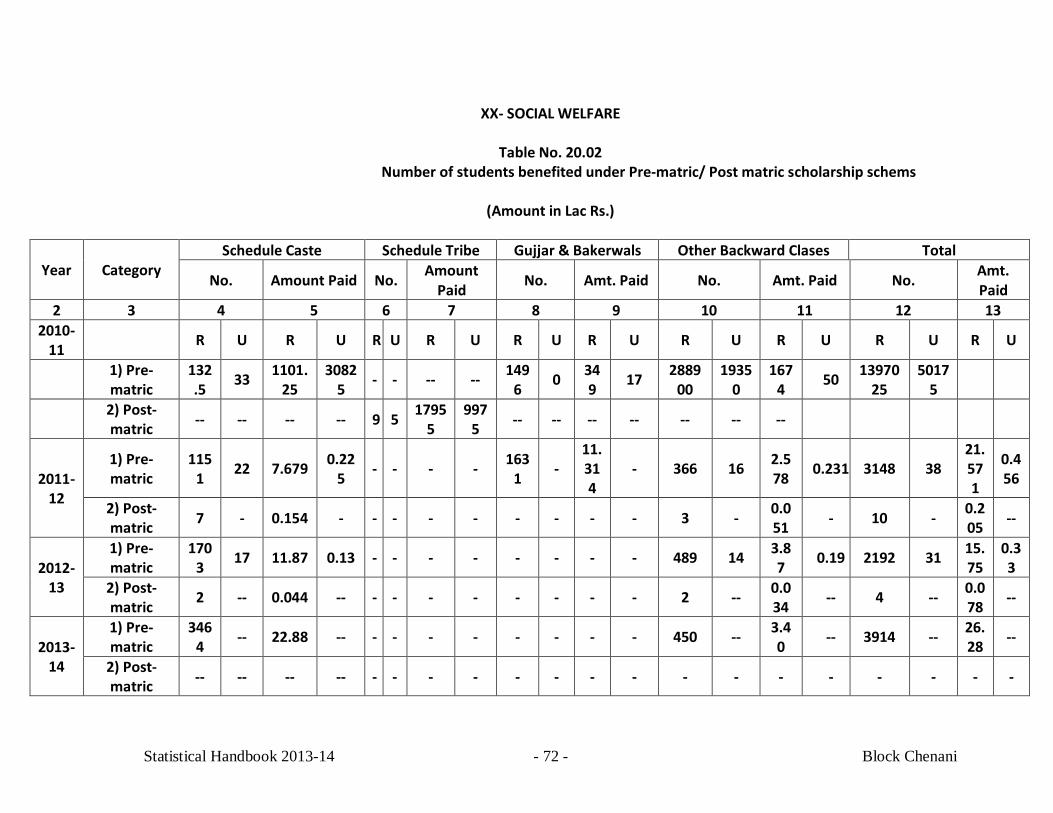
XX- SOCIAL WELFARE
Table No. 20.02
Number of students benefited under Pre-matric/ Post matric scholarship schems
(Amount in Lac Rs.)
Year Category Schedule Caste Schedule Tribe Gujjar & Bakerwals Other Backward Clases Total
No. Amount Paid No. Amount Paid No. Amt. Paid No. Amt. Paid No. Amt.
Paid 2 3 4 5 6 7 8 9 10 11 12 13
2010-11 R U R U R U R U R U R U R U R U R U R U
1) Pre-matric
132.5 33 1101.
25 3082
5 - - -- -- 1496 0 34
9 17 288900
19350
1674 50 13970
25 5017
5
2) Post-matric -- -- -- -- 9 5 1795
5 997
5 -- -- -- -- -- -- --
2011-12
1) Pre-matric
1151 22 7.679 0.22
5 - - - - 1631 -
11.314
- 366 16 2.578 0.231 3148 38
21.571
0.456
2) Post-matric 7 - 0.154 - - - - - - - - - 3 - 0.0
51 - 10 - 0.205 --
2012-13
1) Pre-matric
1703 17 11.87 0.13 - - - - - - - - 489 14 3.8
7 0.19 2192 31 15.75
0.33
2) Post-matric 2 -- 0.044 -- - - - - - - - - 2 -- 0.0
34 -- 4 -- 0.078 --
2013-14
1) Pre-matric
3464 -- 22.88 -- - - - - - - - - 450 -- 3.4
0 -- 3914 -- 26.28 --
2) Post-matric -- -- -- -- - - - - - - - - - - - - - - - -
Statistical Handbook 2013-14 - 73 - Block Chenani
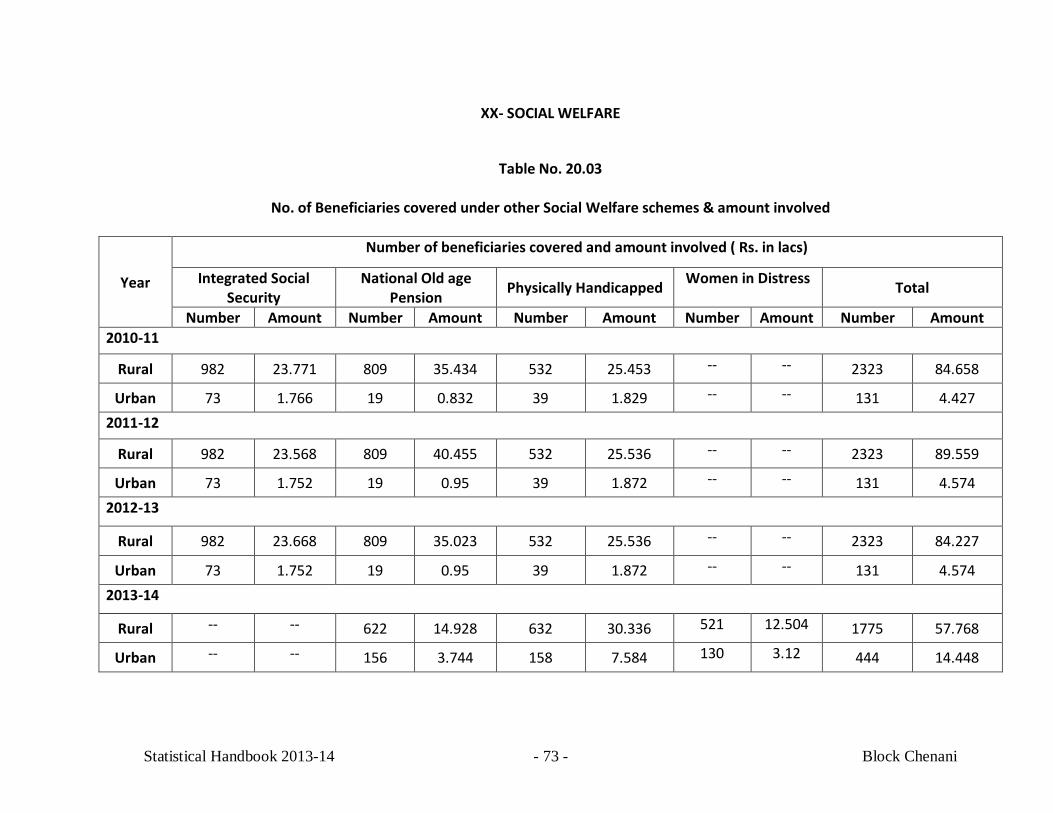
XX- SOCIAL WELFARE
Table No. 20.03
No. of Beneficiaries covered under other Social Welfare schemes & amount involved
Year
Number of beneficiaries covered and amount involved ( Rs. in lacs)
Integrated Social Security
National Old age Pension Physically Handicapped Women in Distress Total
Number Amount Number Amount Number Amount Number Amount Number Amount 2010-11
Rural 982 23.771 809 35.434 532 25.453 -- -- 2323 84.658
Urban 73 1.766 19 0.832 39 1.829 -- -- 131 4.427 2011-12
Rural 982 23.568 809 40.455 532 25.536 -- -- 2323 89.559
Urban 73 1.752 19 0.95 39 1.872 -- -- 131 4.574 2012-13
Rural 982 23.668 809 35.023 532 25.536 -- -- 2323 84.227
Urban 73 1.752 19 0.95 39 1.872 -- -- 131 4.574 2013-14
Rural -- -- 622 14.928 632 30.336 521 12.504 1775 57.768
Urban -- -- 156 3.744 158 7.584 130 3.12 444 14.448
Statistical Handbook 2013-14 - 74 - Block Chenani
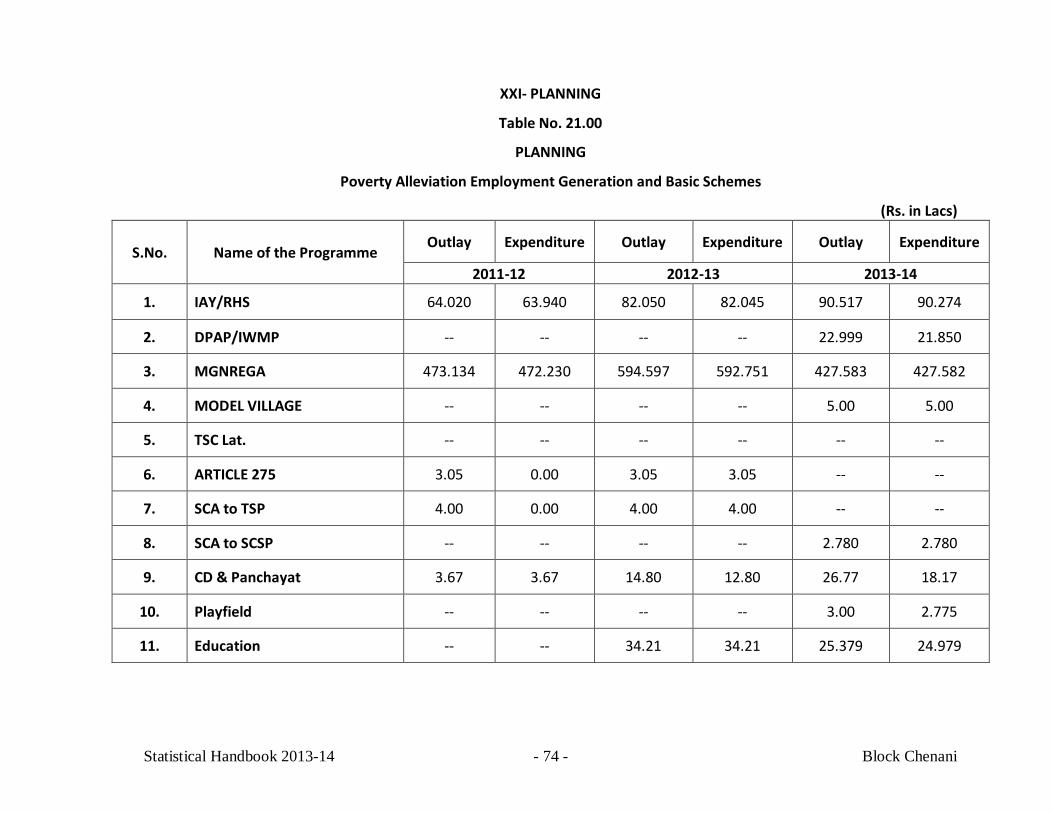
XXI- PLANNING
Table No. 21.00
PLANNING
Poverty Alleviation Employment Generation and Basic Schemes
(Rs. in Lacs)
S.No. Name of the Programme Outlay Expenditure Outlay Expenditure Outlay Expenditure
2011-12 2012-13 2013-14
1. IAY/RHS 64.020 63.940 82.050 82.045 90.517 90.274
2. DPAP/IWMP -- -- -- -- 22.999 21.850
3. MGNREGA 473.134 472.230 594.597 592.751 427.583 427.582
4. MODEL VILLAGE -- -- -- -- 5.00 5.00
5. TSC Lat. -- -- -- -- -- --
6. ARTICLE 275 3.05 0.00 3.05 3.05 -- --
7. SCA to TSP 4.00 0.00 4.00 4.00 -- --
8. SCA to SCSP -- -- -- -- 2.780 2.780
9. CD & Panchayat 3.67 3.67 14.80 12.80 26.77 18.17
10. Playfield -- -- -- -- 3.00 2.775
11. Education -- -- 34.21 34.21 25.379 24.979