Embed Size (px)
Citation preview
Chapter 5
PLANKTONIC MICROALGAE
5.1 Introduction:
Organisms that are adapted to spend part or all of their lives in apparent
suspension in the open water of the sea, of lakes, ponds and rivers are called
planktons. It usually comprises those living organisms that are only accidentally
and temporarily present, imported from adjacent habitats but which neither
grew in this habitat nor are suitably adapted to survive in the truly open water,
apparently independent of shore and bottom (Reynolds, 2006).
Microalgae are the photoautotrophic part of the plankton and the major
primary producers of organic carbon in the pelagic of the seas and of inland
waters (Raymont, 1963, Reynolds, 1984, 2006). Phytoplankton comprises a
diverse, polyphyletic group of single-celled and colonial aquatic photosynthetic
organisms that drift with the currents (Falkowski and Raven, 1997). Even
though the marine phytoplankton constitutes less than 1% of Earth’s
photosynthetic biomass, they contribute more than 45% of our planet’s annual
net primary production (Field et al. 1998). Their evolutionary trajectories have
shaped trophic dynamics and strongly influenced global biogeochemical cycles
(Katz et al., 2004).
These microalgae constitute the major components in the primary
trophic level of most aquatic food webs and it is therefore mandatory to
incorporate this component in any food relation study. Phytoplankton generally
go unnoticed until a 'bloom' occurs, when physical conditions concentrate cells
Chapter 5 Planktonic Microalgae
Microalgal Vegetation in the Selected Mangrove Ecosystems of Kerala 69
to very high levels or increased light and/or nutrient availability allows the
dense growth of a single species resulting in water discolouration and a decline
in ecosystem health may occur. Nutrient and light availability are 'bottom-up'
controls on phytoplankton productivity and biomass. These are responsible for
the process of primary production in water bodies and perform one quarter of
world’s plant photosynthesis as the “Pastures of sea” (Koblentz et al., (1970).
According to Steeman (1975), they contribute about 95% of the total marine
production. They can be used as bioindicators with reference to water quality
and thus serve as a tool for assessing the health of aquatic ecosystems. Their
distribution in the inter-tidal areas of different geographical regions of the world
depends on various environmental factors such as temperature, light, salinity
nutrient and substrate.
In mangroves, the planktonic microalgae make important contributions
to the functioning of the ecosystem, and their contribution to total estuarine
production vary in different regions. Along with the emergent flora and benthic
microalgae, they play a very significant role in the bioproductivity of the
mangrove environment. According to Robertson and Blabber (1992), the
contribution of plankton to the total net production in the mangrove habitats
ranges from 20-50%. In south India, according to Selvam et al. (1992), the
phytoplankton productivity is four times higher in mangrove waters than in the
adjacent marine waters. Besides contributing to the total productivity of the
estuarine mangrove systems, these are also critical in supporting higher trophic
levels because of their higher nutritional quality relative to mangrove detritus.
Phytoplankton distribution and productivity depend on various physico –
chemical factors such as temperature, salinity, dissolved oxygen, pH and
nutrients like nitrite, nitrate, phosphate and silicate. These photosynthetic plants
exist as single motile and non-motile cells or as chains of cells and are
Chapter 5 Planktonic Microalgae
Microalgal Vegetation in the Selected Mangrove Ecosystems of Kerala 70
important ecologically and economically. Their biomass, productivity and size
are closely related to the diversity and abundance of higher trophic levels.
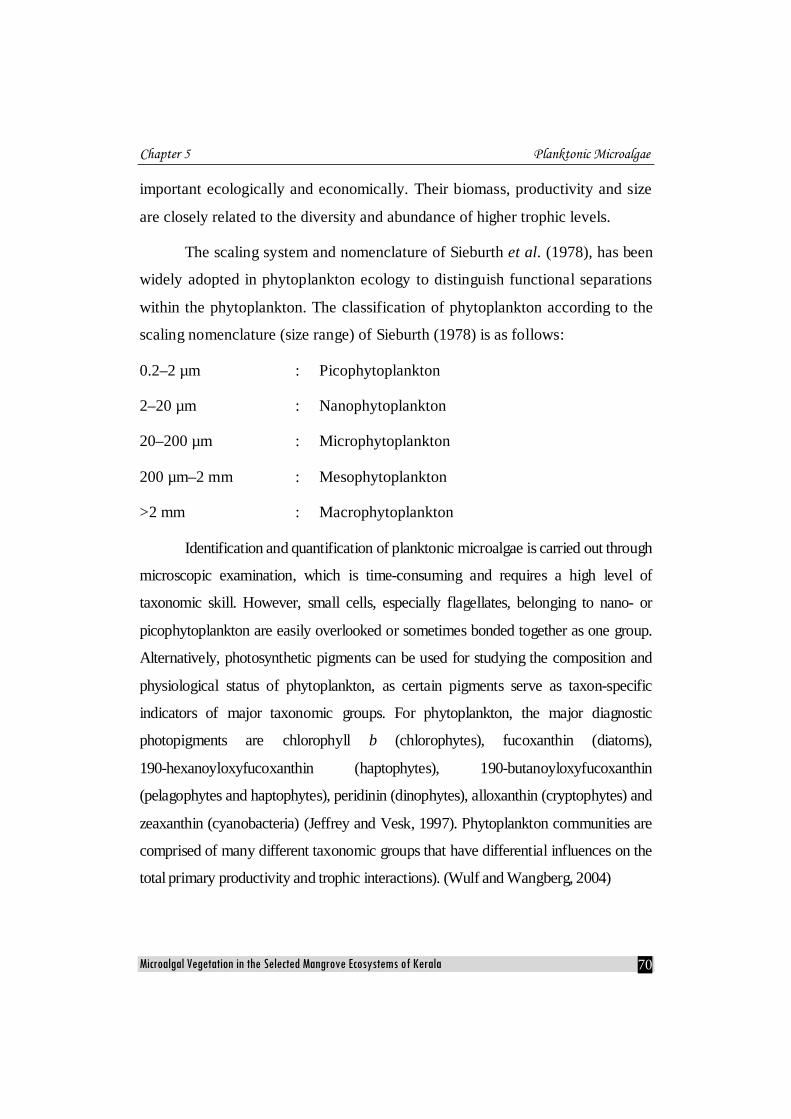
The scaling system and nomenclature of Sieburth et al. (1978), has been
widely adopted in phytoplankton ecology to distinguish functional separations
within the phytoplankton. The classification of phytoplankton according to the
scaling nomenclature (size range) of Sieburth (1978) is as follows:
0.2–2 µm : Picophytoplankton
2–20 µm : Nanophytoplankton
20–200 µm : Microphytoplankton
200 µm–2 mm : Mesophytoplankton
>2 mm : Macrophytoplankton
Identification and quantification of planktonic microalgae is carried out through
microscopic examination, which is time-consuming and requires a high level of
taxonomic skill. However, small cells, especially flagellates, belonging to nano- or
picophytoplankton are easily overlooked or sometimes bonded together as one group.
Alternatively, photosynthetic pigments can be used for studying the composition and
physiological status of phytoplankton, as certain pigments serve as taxon-specific
indicators of major taxonomic groups. For phytoplankton, the major diagnostic
photopigments are chlorophyll b (chlorophytes), fucoxanthin (diatoms),
190-hexanoyloxyfucoxanthin (haptophytes), 190-butanoyloxyfucoxanthin
(pelagophytes and haptophytes), peridinin (dinophytes), alloxanthin (cryptophytes) and
zeaxanthin (cyanobacteria) (Jeffrey and Vesk, 1997). Phytoplankton communities are
comprised of many different taxonomic groups that have differential influences on the
total primary productivity and trophic interactions). (Wulf and Wangberg, 2004)
Chapter 5 Planktonic Microalgae
Microalgal Vegetation in the Selected Mangrove Ecosystems of Kerala 71
Marine phytoplankton includes representatives from several classes.
Among the massive species of planktonic microalgae, most common and
important phytoplankton are diatoms and dinoflagellates in the microplankton
(20–200µm) size range, and coccoid cyanobacteria in the picoplankton (0.2–
2µm) size range. Small nanoflagellates (2–20µm) can play an important role in
tropical and subtropical oceans and in temperate oceans during summer
stratification. Each group of phytoplankton exhibits characteristic colours,
depending on its relative abundance of the major groups of photosynthetic
pigments like green chlorophylls, yellow carotenes, or pink or blue phycobilins.
The relative abundance of phytoplankton groups varies seasonally and
geographically, so representatives of all groups are seldom found in the same
plankton sample. Pigment characteristics along with species composition and
abundance of phytoplankton are among the most informative indicators for
hydrobiological monitoring of aquatic ecosystems (Kirillova et al., 2006).
Phytoplakton studies of mangrove systems at West Bengal, India have revealed
46 species of Bacillariophyceae, Dinophyceae and Cyanophyceae (Santra et al.,
1991). Coscinodiscus, Rhizosolenia, Chaetoceros, Biddulphia, Pleurosigma,
Ceratium and protoperidinium were the dominant genera existing almost year
round. Another important mangrove ecosystem in India which have been
investigated for phytoplankton diversity was Pichavaram and at least 82
phytoplankton species were identified from that station (Kannan and Vasantha,
1992). Dinoflagellate assemblages have been particularly well studied in
Belizean mangrove habitats where a diverse collection of benthic and epiphytic
species exist (Faust, 1993a). Like in any other aquatic ecosystem, the
identification of these microautotrophs requires knowledge about their
classification system as well as skill.
Chapter 5 Planktonic Microalgae
Microalgal Vegetation in the Selected Mangrove Ecosystems of Kerala 72
The names of divisions and classes of algae more often contain a
reference to the colour of the organisms, like, Blue-green algae – Cyanophyta;
Green algae – Chlorophyta; Golden algae – Chrysophyta; Red algae –
Rhodophyta; Brown algae – Phaeophyta. The kinds and combinations of
photosynthetic pigments present together with chemical nature of storage
products and cell wall also play an important role in algal classification. There
are four classes of algae, frequent in the southwest coast of India, which are as
follows.
Class: Cyanophyceae
Class Cyanophyceae, contains about 150 genera and 2000 species, found
in most diverse habitats, in freshwater and in the sea; on damp soil, glaciers,
deserts and can grow over a wide range of temperatures such as hot springs.
The species can also occur as symbionts of protozoa, diatoms and lichen-
forming fungi, and vascular plants.
A considerable proportion of marine phytoplankton includes blue-green
algae, particularly in the picoplankton (0.2-2µ) size range. Coccoid blue-green
algae appear to be everywhere in temperate and tropical parts of the ocean and
even be the main contributors to photosynthetic primary production (Fogg,
1987). They are most abundant in nutrient rich coastal and estuarine waters
where they occur along with diatoms and dinoflagellates. They are also found in
oligotrohic parts of tropical and sub-tropical seas. Trichodesmium sp. can often
form extensive blooms in tropical and sub-tropical oceans and are visible as
orange-brown wind rows on the surface of water. This species is capable of
fixing atmospheric nitrogen and probably the most important biological fixer of
nitrogen in the open ocean.
Chapter 5 Planktonic Microalgae
Microalgal Vegetation in the Selected Mangrove Ecosystems of Kerala 73
Cyanophytes have a capacity to change their colour in relation to the
wavelength of the incident light. Very often characteristic blue or red
colouration is imparted to the marine environment when the bloom of blue
green algae appear consequent to eutrophication. Several species of blue green
algae produce toxins, which may be either neurotoxic or hepatotoxic.
However, this ubiquitous group of algae is more widely distributed in
the fresh water habitats like lakes, ponds and streams than in the marine
environments. Both fresh water and marine cyanobacterial populations form
integral and major components of the microbiota of every mangrove ecosystem.
Class: Chlorophyceae
The class chlorophyceae comprises of diverse forms of algae, which
enjoy a wide distribution in aquatic and terrestrial habitats. This includes about
500 genera and approximately 8000 species (van Den Hoek, et al., 1995). Most
of them are prone to freshwater habitat and many are reported to thrive well in
marine and terrestrial environments. Great range of somatic differentiation
occurs in chlorophyceae. Thallus organisation varies from microscopic
unicellular to multicellular macroscopic forms; may be colonial, coccoid,
palmelloid, sarcinoid, siphonaceous, filamentous, thallose, or pseudo-
parenchymatous.
Aquatic green algae show wide variation in their habit, being distributed
in pelagic and benthic environments. While some benthic species grow attached
to rocks, some others are seen on other plants as epiphytes. Many filamentous
green algae are attached to the substratum during the early stages of
development, but later become free floating, forming mats or balls composed of
many intertwined filaments. On rocky shores, several species are often seen
completely covering the rocks on the upper part of the intertidal zone.
Chapter 5 Planktonic Microalgae
Microalgal Vegetation in the Selected Mangrove Ecosystems of Kerala 74
Green algae are the major primary producers of the freshwater
ecosystems. In estuarine systems like mangroves, they are frequently
distributed during the monsoon periods and provide high biomass and
productivity.
Class: Bacillariophyceae (Diatoms)
The diatoms are one of the most easily recognisable groups of major
eukaryotic algae, because of their unique silicified cell wall, which consists of
two overlapping thecae, each in turn consisting of a valve plus a number of
hoop-like or segmented girdle bands. The word diatom has its origin from one
of the genera coming under this group, ‘Diatoma’. They are unicellular or
colonial; occur in soil, damp rocks, fresh water, brackish water and in the
Ocean. Diatoms are microscopic algae which are found in virtually every
habitat where water is present and are the major component of phytoplankton
community. However, they are also found in the benthic environments of
aquatic ecosystems. They are the key in the biogeochemical cycle of carbon, as
they can account for 40% of the total primary production in the Ocean. One
estimate of total primary production on earth is 1.4x10¹⁴ kg dry mass per year
and Werner (1977) suggested that marine diatoms themselves contribute 20 to
25% of world net primary production and 15-20% by other planktonic algae.
The number of known diatom species is often given as ca. 104 (Hendey,
1964); with a narrower species concept, this would rise to 105. Altogether, the
total number of diatom species worldwide is probably not less than 2x10⁵
(Mann and Droop, 1996). Diatoms would thus be confirmed as the group of
algae showing the highest species diversity.
Majority of diatoms are planktonic, especially coming under the order
Biddulphiales (Centrales) and are generally the most important primary
Chapter 5 Planktonic Microalgae
Microalgal Vegetation in the Selected Mangrove Ecosystems of Kerala 75
producers of marine and freshwater systems. By absorbing CO2 in the
production of organic material during photosynthesis they play decisive role in
the global carbon cycle. The empty siliceous cell wall of dead algae may be
deposited in the sediments of lakes and oceans and be preserved as a valuable
record about past environments and climate changes; as such they are important
fossils for the reconstruction of millions of years of the Earth's history. The
consistent ‘rain’ of dead diatom frustules to the bottom of highly productive
part of the oceans, result in the accumulation of oozes, and these fossil deposits
from the past geological periods are now mined as ‘diatomaceous earth’, which
is used for many industrial usages (Stoermer and Smol, 1999).
Recent phylogenies constructed from nuclear-encoded small-subunit
ribosomal RNAs place the diatoms within the pigmented heterokont algal
lineages (Bhattacharya et al., 1992; Leipe et al., 1994, Medlin et al., 1997b),
most closely related to the new algal class, the Bolidophyceae, which are
picoplanktonic algae with a simplified cellular organization (Guillou et al.
1999).
Classification of diatoms is mainly based on the morphology of the valve,
along with type of sexual reproduction, structure of auxospore envelope and type
of habitat (Agardh, 1824; Kutzing, 1844, 1849; Rabenhorst, 1853; Ralfs, 1864;
Patrick and Reimer, 1966; Simonsen, 1979; Von Stoch, 1982; Round et al.,
1990). Several workers in India have followed the classification of Schutt (1896)
modified by Hustedt (1930) that is broadly based on the symmetry and structure
of the valve. To facilitate the proper identification, organic contents of the
frustule can be removed by acid treatment (Sournia, 1976).
Chapter 5 Planktonic Microalgae
Microalgal Vegetation in the Selected Mangrove Ecosystems of Kerala 76
The class Bacillariophyceae is sub-divided into two orders ie.,
Centrales and Pennales. The latter group is believed to have evolved from the
centric forms owing to their first appearance later in the geological record.
However, according to the rules of ICBN (1999), the name of any taxa
should start with a name of a genus present in those taxa. Hence Centrales
and Pennales are designated as Biddulphiales and Bacillariales respectively.
Like in other aquatic systems, diatoms form the major components of
mangrove microflora either in the form of plankton, or as
microphytobenthos or as epiphytes on the mangrove roots and trunk.
Class: Dinophyceae
Class: Dinophyceae or pyrrhophyceae (Gk. "Pyrrhos" means flame-
coloured) includes a large number of unicellular, eukaryotic and biflagellate
algal species of varying size and shape. This includes 130 genera with about
2000 living and 2000 fossil species (Van den Hoek et al., 1995).
Dinoflagellates are distributed in freshwater, estuaries and seas and are
adapted to pelagic and benthic habitats from arctic to tropical seas. They are
found in numerous habitats; many species are planktonic while several other
species are attached to sediments, sand, corals, macroalgae or to other plants.
Certain species are present as parasites in marine invertebrates and fish. Some
even serve as symbionts, providing organic carbon to their hosts: reef-building
corals, sponges, clams, jellyfish, anemones and squids.
Dinoflagellates exhibit a wide variety in morphology and size ranging
from 0.01 to 2.0 mm. Their cell covering structure known as theca differentiates
them from other algal groups. Cells are either armoured or unarmoured, and the
former have thecae divided into plates composed of cellulose or
polysaccharides. The cell covering of unarmoured species is comprised of a
Chapter 5 Planktonic Microalgae
Microalgal Vegetation in the Selected Mangrove Ecosystems of Kerala 77
membrane complex. The theca may be smooth and simple or laced with spines,
pores and/or grooves and may be variously ornamented.
Dinoflagellates share features common to both plants and animals: they
can swim, many have cell walls, and both photosynthetic and heterotrophic
species are known. Blooms of dinoflagellates impart a discolouration of water,
mostly a reddish-brown color known as "red tide". Red tides can have harmful
effects and certain species of dinoflagellates produce potent toxins. These
toxins are carried up in the food chain, ultimately to humans and can,
sometimes result in permanent neurological damage or even death (Fukuyo,
1981).
Recently there was a comprehensive study on the role of epiphytic and
benthic dinoflagellates and their varied distribution and habitat preference in a
coral reef mangrove ecosystem in Belize, USA by Maria A. Faust (2009). The
study examined the Ciguatera Fish Poisoning dinoflagellates seen on
macrophytes, in sand and floating detritus.
Presence of dinoflgellates has been noted in most of the phytoplankton
studies related with mangrove ecosystems and their distribution and abundance
show seasonal and spatial variations.
Several investigations have been carried out on planktonic microalgae
and its relationships in Indian waters including some works in mangrove
habitats (Venkataraman, 1939; Nair, 1959; Subrahmanyan, 1946, 1958a, 1958b,
1959, 1971; Subrahmanyan and Viswanatha Sharma, 1960, 1965; Gopinathan,
1972, 1975a, 1975b, 1984; Gopinathan, et al., 1974, 1994, 2001; Joseph, 1989;
Joseph and Pillai, 1975; Joseph and Nair, 1975; Joseph and Sreekumar, 1993;
Joseph et al., 1984; Nair et al, 1968, 1975; Krishnamurthy et al., 1974; Mani,
Chapter 5 Planktonic Microalgae
Microalgal Vegetation in the Selected Mangrove Ecosystems of Kerala 78
1992; Chaghtai and Saifulla, 1992; Santhanam et al., 1975; Desikachary et al.,
1987a 1987b, 1988; Gowda et al., 2001).
Available data indicate that the waters along the west coast of India are
more fertile than that along the east coast, mainly due to upwelling and other
favourable factors conducive for phytoplankton growth. It is therefore naturally
expected that the mangroves along the South west coast of India shoe more
species diversity than those along the east coast.
In the present study, the spatial and seasonal distribution of
phytoplankton species and their abundance and diversity with respect to the
hydrological parameters and their contribution to the total productivity were
studied for two years from 2003 from six mangrove stations in Kerala, South
west coast of India.
5.2 Review of Literature
There are several thousand papers published on different aspects of
planktonic microalgae. Publications started to come even during the 1800s.
Some of the important papers referred during this study are listed here.
Kutzing, (1844, 1849), in his Species Algarum, described the diatoms
and contributed several new genera and species to the biological world.
Thwaites, in 1848, have done further observations on the Diatomaceae with
descriptions on new genera and species.
Greville (1857, 1859, 1863), reported several new diatom species from
West Indies and California. Brightwell, (1858, 1859) described some of the rarer or
un-described species of diatoms and made further observations on the genera
Triceratium and Chaetoceros. In 1861, Pritchard, in his detailed study along the
British coasts, mentioned the history of Infusoria including the Desmidaceae and
Chapter 5 Planktonic Microalgae
Microalgal Vegetation in the Selected Mangrove Ecosystems of Kerala 79
Diatomaceae, Ralfs, in 1864, described several new species from marine
diatomaceae found in Hong Kong waters. Lewis, 1861, evaluated some new and
rare species from Diatomaceae along the seabed of United States.
Cleve, (1873, 1878, 1894, 1896), a well reputed diatomologist, recorded
a number of new species from Java sea, West Indian Archipelago, Baffin Bay
and coastal Sweden.
Grunow, (1877, 1880), extensively studied the genus Nitzschia and
invented several new species. Van Heurck, (1885, 1896, 1899), described the
morphology of diatoms and recorded several new species.
Castracane, 1886, reported the scientific results of the voyage of H.M.S.
Challenger during the years 1873-76, especially from the family Diatomaceae.
Viktor Hensen, in 1887, applied quantitative methods to estimate the
distribution, abundance and productivity of the microscopic organisms of the
open oceanic waters. He also envisaged a simple linear relationship between
hydrography, plankton, and fish.
Peragallo, (1891, 1892), prepared a monograph on diatoms and described
the genera such as Pleurosigma and Rhizosolenia. Boyer (1900, 1916), studied the
Biddulphioid diatom forms from North America and Philadelphia. Boyer, (1926-
27), composed a synopsis of the family Diatomaceae, from North American coasts.
Hustedt, (1927, 1930, 1931-32), revised the Kryptogamen flora of
Rabenhorst. Lebour, in 1930, illustrated the planktonic diatoms of Northern Sea.
Allen and Cupp, in 1935, studied the planktonic diatom species from the Java Seas.
Biswas, in 1932, made a casual reference to the distribution of diatoms in the
algal flora of Chilka Lake. In 1949, Botanical Survey of India published a monograph
on common Fresh and Brackish water algal flora of India and Burma by Biswas.
Chapter 5 Planktonic Microalgae
Microalgal Vegetation in the Selected Mangrove Ecosystems of Kerala 80
Cupp (1937), most probably was the pioneer phycologist who made a
comprehensive study on diatoms in the United States. He studied the seasonal
distribution and occurrence of marine diatoms and dinoflagellates from Alaska.
His monograph (1943), Marine plankton diatoms of the west coast of North
America, which has even now, being used as a key text book on diatom
taxonomy worldwide.
In 1939, Venkataraman made a systematic study of south Indian diatoms
and gave an account of both fresh water and estuarine diatoms in and around
Madras, with a quite explicable taxonomic description with hand drawn plates.
Subrahmanyan and his colleagues (1946, 1958a,b, 1959, 1960 & 1965)
gave outstanding contributions in the taxonomic study of phytoplankton in the
Indian inshore seas. Subrahmanyan described over 500 species of phytoplankton
belonging to different groups, representing over 150 genera from both the coasts of
India. In 1946, he described 171 forms of marine planktonic diatoms at Madras,
representing 15 families, 64 genera and 134 species.
The pioneering study on the ecology and seasonal succession of the diatom
flora of the estuarine waters of India was that of Iyengar and Venkataraman, in
1951. They studied the estuarine parts of river Cooum near Madras.
Studies by Andersson et al. (1966) on the succession and growth
limitation of phytoplankton in the Gulf of Bothnia (Baltic Sea) revealed the role
of phosphorous as a regulating factor of phytoplankton growth.
Depending on the hydrographical situation of the mangrove system
(especially on the tidal currents), a part of the litter is exported directly or after
its partial degradation to the neighboring coastal areas (Odum & de la Cruz
1967).
Chapter 5 Planktonic Microalgae
Microalgal Vegetation in the Selected Mangrove Ecosystems of Kerala 81
Nair, et al., in 1968, calculated the potential production of phytoplankton
in terms of carbon for the west coast of India as 46x106 tons and for the east
coast as 15x106 tons.
Lind (1968) gave a description on the distribution of major planktonic
algae in Kenyan waters. He gave an account on the relation between plankton
productivity and rain fall.
Qasim and Gopinathan (1969) studied the tidal cycle and environmental
features of Cochin back water (a tropical estuary) and found that the
environmental features such as pH, dissolved oxygen, nutrients, alkalinity and
chlorophyll are greatly influenced by the tidal rhythms.
In 1972, Gopinathan made a qualitative and quantitative analysis of
phytoplankton in the Cochin estuary and described 120 species.
Qasim (1973) made a comparison between the annual cycle of primary
productivity and the seasonal variation in the environmental features of Cochin
backwaters and revealed that the peaks in production are independent of the
high and low values of solar radiation falling on the surface of water, however,
the changes in salinity are important in favouring phytoplankton productivity.
The peaks in primary production occur during the monsoon months when
salinity in the backwater is low.
Gopinathan (1975a) gave an account of the diatoms present in various
estuarine systems in India, particularly in Cochin backwaters and gave a
description on their occurrence, seasonal fluctuations and distribution.
Vijayalakshmi and Venugopalan (1975) studied the diversity of
phytoplankton species, pigments and succession with a note on primary
production at a tidal zone in the Velar estuary, East coast of India.
Chapter 5 Planktonic Microalgae
Microalgal Vegetation in the Selected Mangrove Ecosystems of Kerala 82
Joseph and Nair (1975) analysed the growth constants, mean generation
time and chlorophyll in relation to cell numbers and 14C uptake in few unialgal
cultures of selected phytoplankters isolated from Cochin estuary.
Nair et al. (1975) studied the primary production in the Vembanad Lake
and observed that the annual gross production ranged from 150-650 gC/m2/day
and the total organic production in the Vembanad Lake was estimated as
100,000 tons of carbon.
In 1975, Joseph and Pillai studied the seasonal and spatial distribution of
phytoplankton in Cochin backwaters.
According to Odom (1975), faunal communities in mangrove ecosystem
have traditionally been considered to be driven by large production of
mangrove litter.
Pant et al. (1980) studied the contribution of phytoplankton
photosynthesis in a mangrove ecosystem and found that there is no apparent
casual relationship between phytoplankton biomass and either benthic animal
populations or edible fish catch.
The contributions of Desikachary and his colleagues, (1986, 1987,
1987a, b, 1988, 1989) to the Indian Phycology are of immense magnitude.
Their Atlases of diatoms are considered as the most valuable and authentic
reference books by diatom taxonomists all over the world.
Due to its refractorial nature the organic material produced by
mangroves, it is not used directly by most herbivores, instead it is channelled to
decomposers (Lee 1990).
In the open water of the upper Golfo de Nicoya, the studies conducted
by Gocke et al. (1990) showed that the oxygen concentration increased strongly
Chapter 5 Planktonic Microalgae
Microalgal Vegetation in the Selected Mangrove Ecosystems of Kerala 83
during the day, since the production of organic material largely exceeded its
consumption in the entire water column.
Selvam et al. (1992) found phytoplankton productivity to be four times
higher in mangrove waters than in adjacent marine waters in south India.
Kannan and Vasantha (1992) studied the species composition and
population density of microphytoplankton in the Pichavaram mangals , south
east coast of India and found that phytoplankton population density exhibited a
wide seasonal fluctuation with minimum during monsoon and the maximum
during summer. They identified 82 species of phytoplankton which included 67
diatoms, 12 dinoflagellates and 3 blue green algae.
In a Study made by Kivi et al. (1993) in the Baltic sea off the south west
coast of Finland on the nutrient limitation and grazing control of phytoplankton
community, Nitrogen was found to be the basic limiting nutrient for
phytoplankton throughout the productive season.
In addition to the production of organic material by the mangrove trees,
a certain production of organic material by planktonic algae also occurs in the
inundated parts of the mangrove swamp. This fraction, however, has received
little attention in past and current research even though it comes to about 55%
(Cebrián & Duarte 1994)
In a review about mangrove out welling, Lee (1995) concluded that in
the past the particulate organic matter export from the mangrove systems may
have been overestimated sometimes, whereas the very important export of
dissolved organic matter has not been taken into account until quite recently.
Newell et al. (1995) studied the relative importance of benthic micro
algae, phytoplankton and mangrove detritus as source of nutrition to coastal
invertebrates from Malasia and have pointed out that the importance of
Chapter 5 Planktonic Microalgae
Microalgal Vegetation in the Selected Mangrove Ecosystems of Kerala 84
phytoplankton and benthic algae may have been underestimated in the detritus
based food web of mangrove ecosystems.
According to Duarte & Cebrián, (1996) the organic material produced by
phytoplankton is directly accessible to higher trophic levels of the marine food
chain and therefore, if phytoplankton organic carbon is produced in the
mangrove system and exported to the adjacent areas, this material is more
important in the carbon fluxes of the receiving systems than one would judge
from its amount.
Loneragan et al. (1997) used multiple stable isotope analysis to
investigate the importance of mangroves, sea grasses and other primary sources
like algae to the food supporting Pineid prawns in the Embley river estuary,
Australia and established that the contribution of mangroves to the food webs of
prawns appears to be confined to a very small spatial area.
While studying the nutrient and phytoplankton dynamics in two
mangrove tidal creeks of the Indus river delta, Pakistan, Harrison et al. (1997),
reported that there was no apparent seasonal cycle in chlorophyll a or primary
productivity. The phytoplankton species observed by them were predominantly
centric diatoms which were presumably kept in suspension by tidal currents.
According to them, since nutrients are rarely limiting, there is an export of
nutrients from the creeks to the coastal area which may stimulate the
phytoplankton productivity.
Córdoba Muñoz (1998) who performed productivity measurements in the
mouth of the main channel of the Estero de Morales and obtained a higher annual
NPP of 439 g C m-2 a-1 (NPP per day ranged between 0.69 and 2.53 g C m-2). She
made the incubations always at high tide.
Chapter 5 Planktonic Microalgae
Microalgal Vegetation in the Selected Mangrove Ecosystems of Kerala 85
While studying the role of fishes in modifying the trophic pattern of
phytoplankton, Komarkova (1998) pointed out that the phytoplankton diversity
depends on a number of factors other than nutrient supply and predation
constitutes a strong top down control on phytoplankton assemblage.
Zimba P.V (1998) developed Nutrient enrichment bioassays to test for
nitrogen (N), phosphorus (P), and silica (Si) limitation of epiphytic biomass in
eutrophic Lake Okeechobee, Florida, USA. Quarterly assays on artificial
(plastic) Hydrilla plants exposed to lake water for 7 days prior to nutrient
addition were evaluated by changes in chlorophyll-a relative to controls.
Epiphytic biomass was measured at 24-h intervals for 72 h. Nitrogen and silica
additions had a stimulatory effect on biomass during all experiments, whereas
phosphorus additions were never stimulatory. These results suggest that silica
should be considered as a limiting nutrient for microalgal communities
dominated by diatoms.
Trott and Alongi (1999) examined the surface water concentration of
dissolved nutrients and phytoplankton biomass (as chlorophyll a.) in relation to
the physic chemical characters in two tropical mangrove creeks of Queensland,
Australia. It was observed that phytoplankton biomass and dissolved nutrient
concentration peaked during summer with no or little significant change
throughout the rest of the year.
In a recent study on some aspects of the carbon cycle in an Indian
estuarine mangrove ecosystem, zooplankton exhibited larger spatial and
seasonal variation in productivity than did the total suspended organic matter
and attributed this to the variability in productivity of phytoplankton (Dehairs et
al., 2000 and Bouillon S. et al., 2000)
Chapter 5 Planktonic Microalgae
Microalgal Vegetation in the Selected Mangrove Ecosystems of Kerala 86
There is a large seasonal and spatial variation in the primary productivity
of estuarine systems and the knowledge of the variations may be crucial in
interpreting the productivity data of higher trophic levels. Monthly rainfall
pattern has a significant role in determining these variations (S. Bouillon &
F.Dehairs, 2000)
After analyzing the ecological aspects of mangrove habitats, G.S.D
Selvaraj (2000) opined that mangroves are one of the most productive
ecosystems of the world and the algal colonies associated with mangrove root
surface and moist intertidal flats and the phytoplankton communities in the
associated bays and lagoons contribute significantly to the primary production
of the ecosystem. According to him 6% of the total organic production in the
mangrove ecosystems is contributed by phytoplankton.
The seasonal variation of planktonic primary productivity was measured
using light and dark bottle method by Klaus Gocke et al. (2001) during one year
in the main channel in the interior part of the mangrove forest of the Estero de
Morales (Estero de Punta Morales), a mangrove system located in the Golfo de
Nicoya at the Pacific coast of Costa Rica. The annual gross primary
productivity (PPg) was 457 and the net primary productivity (PPn) was 278 g C
m–2 a-1. Daily PPg ranged from 0.29 to 3.88 and PPn from 0.12 to 2.76 g C m-2
d-1. The planktonic primary productivity inside the mangrove forest was
completely restricted to the open channels. A simultaneous measurement
demonstrated that PPn of the phytoplankton could not take place under the
canopy of the mangroves. The studies revealed that even when the oxygen
concentration of the water which entered the system in the early morning, was
quite low due to the oxygen consumtion in the gulf at night, it decreased still
more inside the mangrove forest during high tide and the following ebb phase.
Chapter 5 Planktonic Microalgae
Microalgal Vegetation in the Selected Mangrove Ecosystems of Kerala 87
Under the canopy of the mangrove forest, however, the respiration
processes in the water were far greater than the processes, which lead to a
liberation of oxygen, i.e. photosynthesis. The oscillation of the oxygen
concentration in the mouth of the main channel during a tidal cycle shows that
the consumption of organic material within the water column of the mangrove
forest exceeds by far the production. (Klaus Gocke, 2001)
According to Gina Holguin et al.(2001), there is evidence to propose a
close microbe-nutrient-plant relationship that functions as a mechanism to
recycle and conserve nutrients in the mangrove ecosystem. The highly
productive and diverse microbial community living in tropical and subtropical
mangrove ecosystems continuously transforms nutrients from dead mangrove
vegetation into sources of nitrogen, phosphorus, and other nutrients that can be
used by the plants. In turn, plant-root exudates serve as a food source for the
microorganisms living in the ecosystem with other plant material serving
similarly for larger organisms like crabs.
Alongi (2002), in his study on the present and future of the world
mangrove forests remarked that mangroves are the only woody halophytes
dominated ecosystem situated at the confluence of land and sea, they occupy a
harsh environment, being daily subject to tidal changes in temperature, water
and salt-exposure and varying degree of anoxia.
Gopinathan et al. (2005) enumerated the micro algae of selected
mangrove ecosystems in India and described 48 genera of diatoms and two
genera of Cyanophyceae. Acording to them, the true planktons are brought to
the mangroves during high tide.
Micro algal composition, abundance, diversity and biomass of the Qua
Iboe estuary mangrove swamp were studied by Essien et al. (2008) where an
Chapter 5 Planktonic Microalgae
Microalgal Vegetation in the Selected Mangrove Ecosystems of Kerala 88
assemblage of brackish water micro algae belonging to six major taxonomic
classes were encountered. Variations between pelagic and sedimentary habitats
were also analysed during this study.
Nedumaran and Prabu (2009) studied the ecology of phytoplankton from
Pichavaram mangroves, South East coast of India.91 species of phytoplankton
were recorded of which 73 were diatoms. Species such as Coscinodiscus
centralis, Pleurosigma elongatum, Thalassionema nitzschioides, Skeletonema
costatum, Triceratium favus, Odentella sinensis, Navicula longa and Ceratium
furca constituted the bulk of the population density.
Raj Kumar et al. (2009), studied the phytoplankton diversity in
Pichavaram mangrove waters, South –east coast of India and identified 94
species of phytoplankton, among which the diatoms formed the predominant
group. Maximum phytoplankton diversity and density were observed during
summer season which possesses stable hydrographic conditions.
Manna et al. (2010) studied the dynamics of Sundarban estuarine
ecosystem and observed that the phytoplankton community is dominated by
diatoms followed by dinoflagellates and chlorophyceae. They identified a total
of 46 taxa belonging to 6 groups and indicated that dissolved oxygen, nutrients
and turbidity are the limiting factors for the phytoplankton biomass. They also
suggested a threshold salinity level for phytoplankton biomass production and
observed a close microbe-plant-nutrient relationship that functions as a
mechanism to recycle and conserve nutrients in the mangrove ecosystem.
L.T. P Hoa et al. (2010) studied the fatty acid profiles of mangrove
micro algae and their potential use as food and noticed that many of them
possess high content of poly unsaturated fatty acids and other compounds of
potential interest to the food, cosmetic and pharmaceutical industries. They
Chapter 5 Planktonic Microalgae
Microalgal Vegetation in the Selected Mangrove Ecosystems of Kerala 89
successfully identified and purified three such diatoms, Amphiprora alata,
Gyrosigma limosum and Melosira nummuloides based on morphological
properties and 18S rDNA sequence analysis.
Boyce et al. (2011) combined the available ocean transparency
measurements and in situ chlorophyll observations to estimate the time
dependence of phytoplankton biomass at local, regional and global scales since
1899. They observed declines in eight out of ten ocean regions, and estimated a
global rate of decline of ~1% of the global median per year. The analyses
further revealed interannual to decadal phytoplankton fluctuations
superimposed on long-term trends.
5.3 Results 5.3.1 Species Composition and Diversity
The distribution of planktonic microalgae with temporal and spatial variation of the species composition, the impact of the changes in the physico chemical variables on species abundance and composition and variations in pigments were studied for a period of two years from 2003 to 2004. It was found that there is considerable spatial and seasonal variation in cell density and species composition.
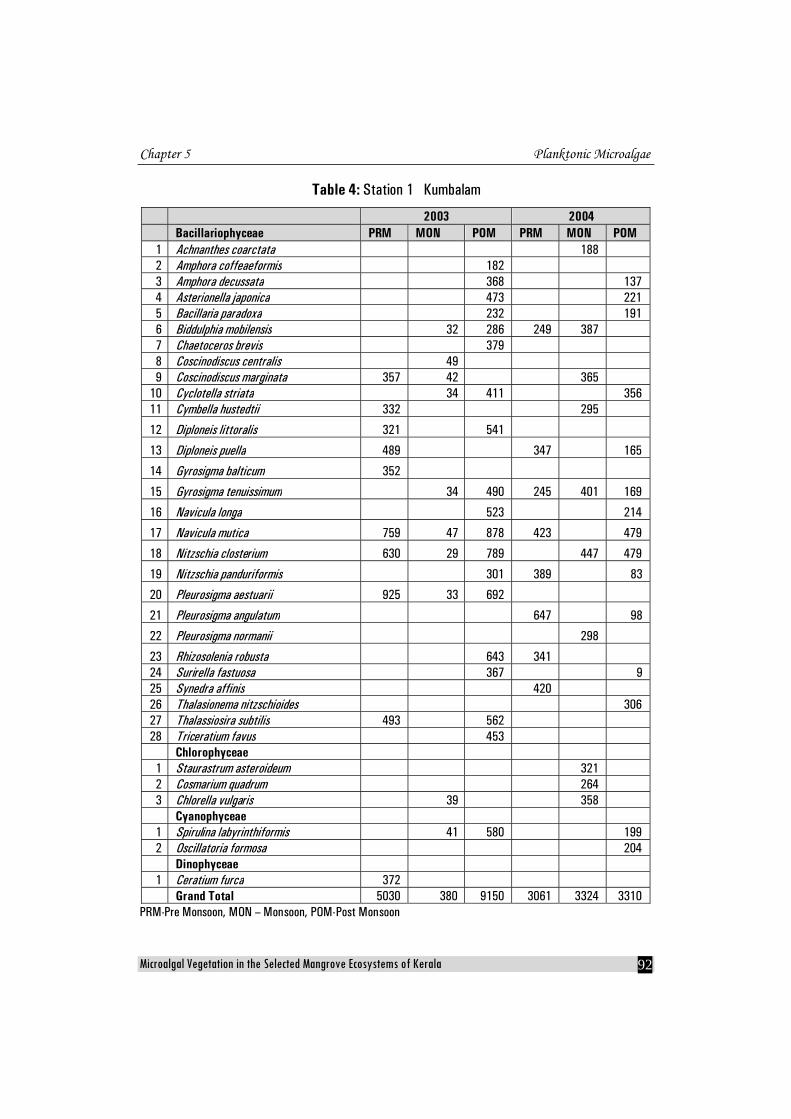
In the first year, at station 1 (Kumbalam), the highest cell density was recorded during post monsoon (9150 cellsL-1) and the lowest of 53 cellsL-1during the pre monsoon (Table). During one of the collections in October, 2003 (post monsoon), the maximum cell density went upto 26134 cellsL-1. Nitzschia closterium, Navicula mutica and Pleurosigma aestuarii were noted during all the seasons. The only dinoflagellate, Ceratium was present in the premonsoon. In the second year the highest and lowest standing crop was recorded during monsoon and the figures were 3828 cellsL-1 and 847 cellsL-1 respectively. Gyrosigma tenuissimum, Cyclotella striata, Navicula mutica, Nitzschia closterium and Pleurosigma angulatum were the dominant species. (Table 4)
Chapter 5 Planktonic Microalgae
Microalgal Vegetation in the Selected Mangrove Ecosystems of Kerala 90
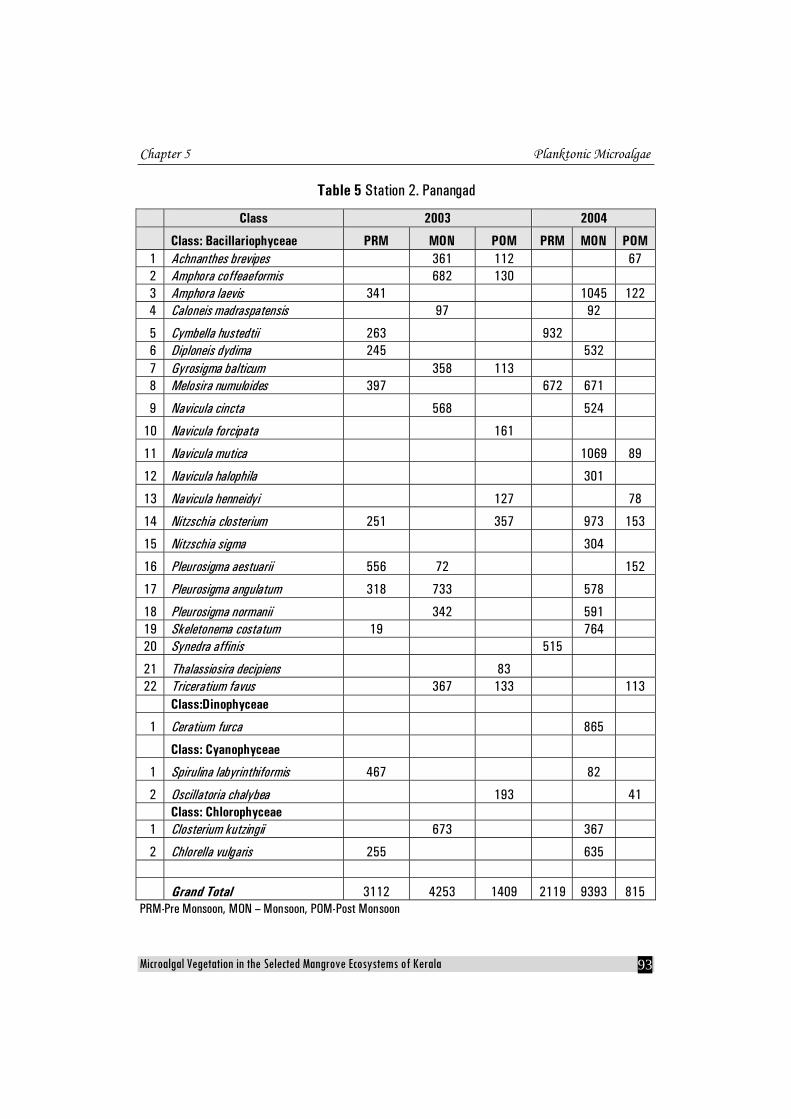
At station 2 (Panangad), in 2003, the highest cell density of 14342 cellsL-1 was recorded during monsoon and the lowest of 534 cellsL-1 during post monsoon. None of the species recorded was present in all three seasons. Amphora coffeaeformis, Pleurosigma aestuarii, Pleurosigma angulatum and Nitzschia closterium were the dominant species identified. Spirulina and Oscillatoria chalybea were present during pre monsoon and post monsoon respectively. In the second year, the highest cell density of 11442 cellsL-1 was recorded during monsoon and the lowest of 815 during post monsoon. Against a total of 22 species present in 2003, there were 23 species in the second year. Amphora laevis, Melosira lumuloides, Nitzschia closterium and Navicula mutica were the common species present. Both the Chlorophycean members- Closteriumkutzingii and Chlorella vulgaris appeared during the monsoon. (Table 5)
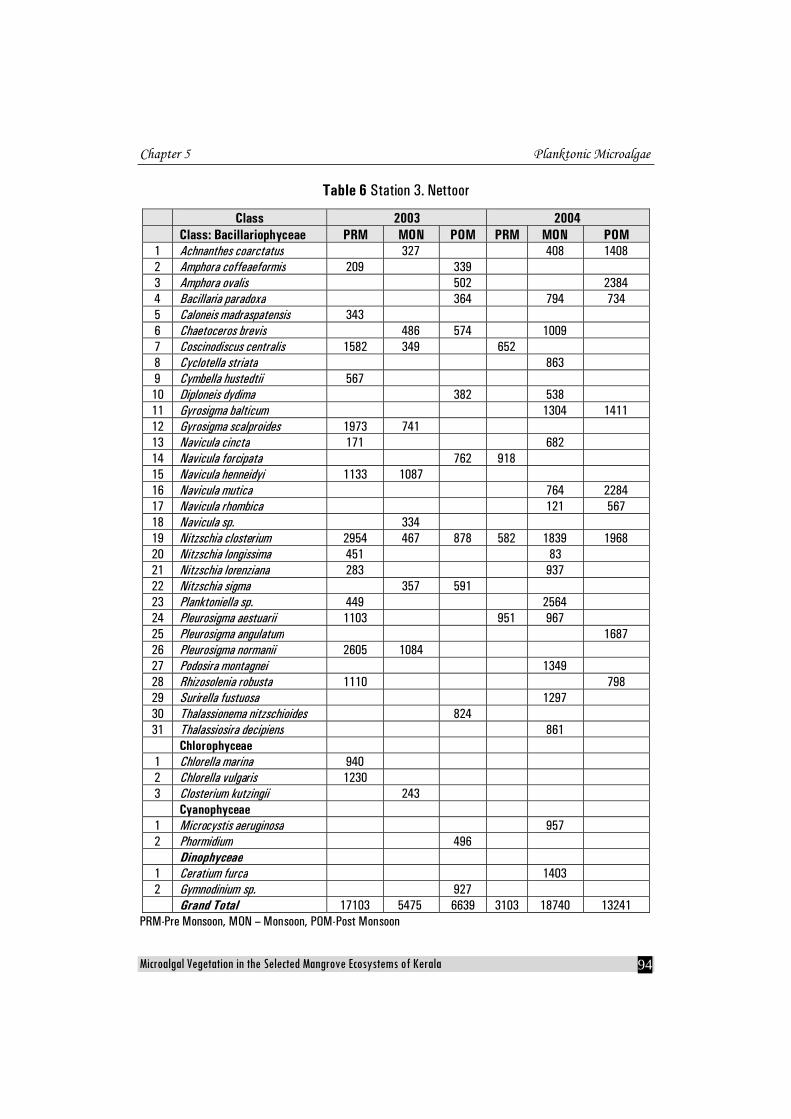
At station 3 (Nettoor), there was a considerable increase in the standing crop when compared to the other stations in all seasons. In the first year the highest cell density was noticed during a collection in pre monsoon and it read 28325 cellsL-1. The lowest value of 2473 cellsL-1 in this station was obtained during post monsoon. The highest species richness was also noted at this station. Coscinodiscus centralis, Gyrosigma scalproides, Navicula henneidyi, Nitzschia closterium and Pleurosigma normanii were the dominant species present. Like in the previous year, there was cell abundance during all seasons in the second year also. While the highest cell density was recorded during monsoon (20942 cellsL-1), the lowest was recorded during pre monsoon (2873 cellsL-1). While the number of cells increased during monsoon and post monsoon in the second year, there was a reduction in cell abundance during the premonsoon. Two Cyanophycean members which were not present in the previous two stations- Phormidium and Microcystis aeruginosa were identified from this station. Altogether, there were 38 sps. of planktonic algae recorded from station 3. (Table 6)
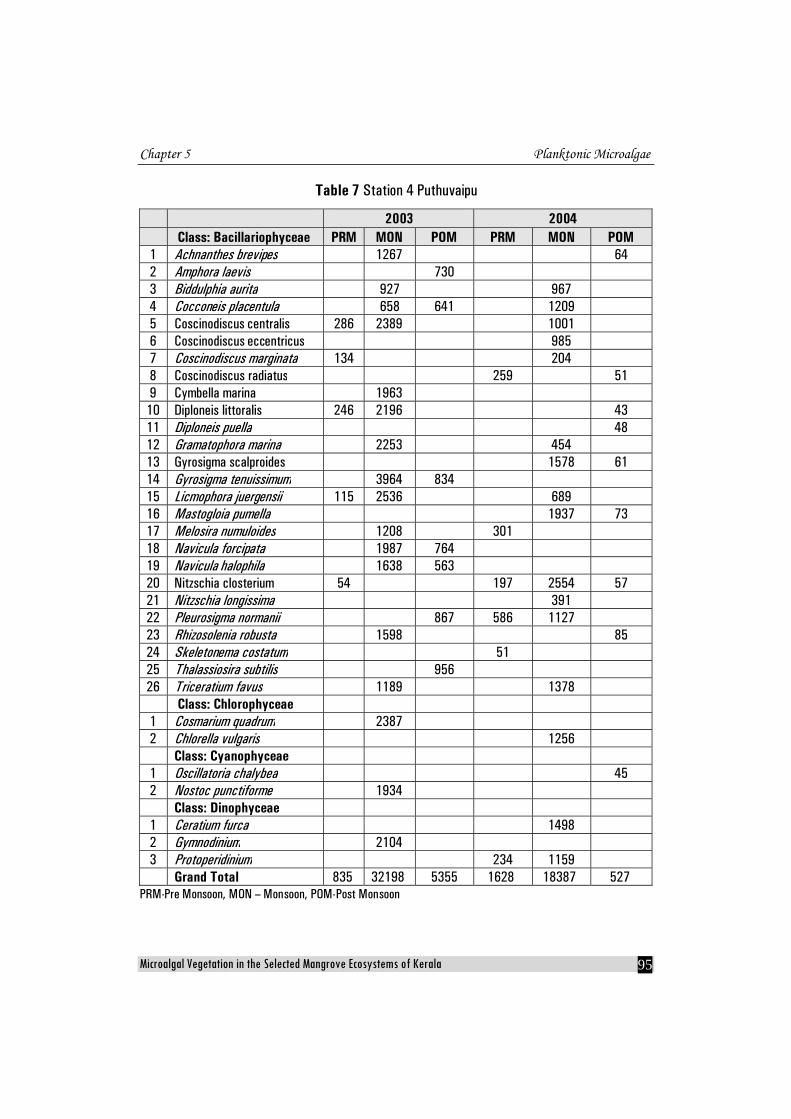
At station 4 (Puthuvaipu), there was a clear seasonal variation in cell density during the first year of this study, with the highest value for monsoon. The average cell density in the station during monsoon was 47762 cellsL-1. The
Chapter 5 Planktonic Microalgae
Microalgal Vegetation in the Selected Mangrove Ecosystems of Kerala 91
lowest value of 364 cellsL-1 was recorded during post monsoon. Cocscinodiscus centralis, Diploneis littoralis, Licmophora juergensii ,Gyrosigma tenuissimum, Navicula halophila and Navicula forcipata were the common species appeared in this year. In the second year, the highest density was recorded during monsoon (31765 cellsL-1) with a seasonal average of 18357 cellsL-1. The lowest value of the year 421 cellsL-1 was recorded during post monsoon. Nitzschia closterium, Gyrosigma scalproides and Mastogloia pumella were the dominant species. For the first time during this study, three dinoflagellates were noted at this station. The total number of species was 33. (Table 7)
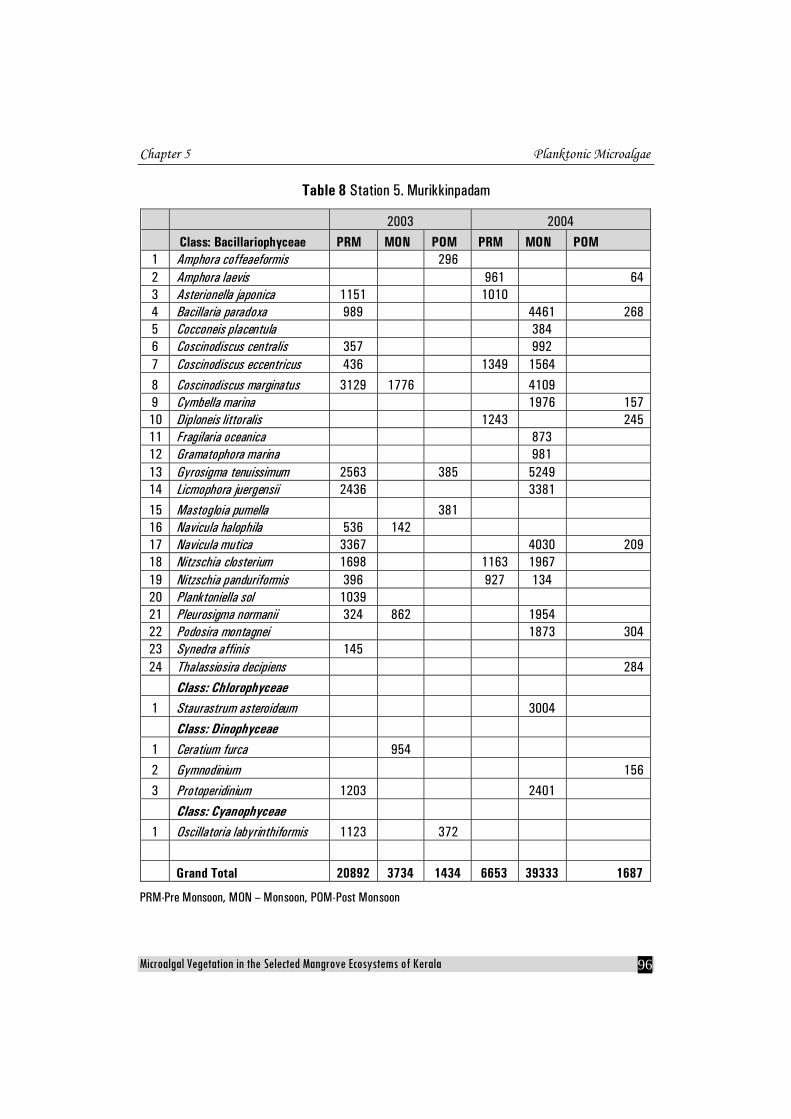
In the first year, at station 5, Murikkinpadam, the trend was different with one of the pre monsoon collections showing the highest cell density of 35894 cellsL-1, the average seasonal cell density being 20892 cellsL-1. The lowest cell density of the station was recorded during post monsoon and the number was 922 cellsL-1. In the second year, however, the monsoon density of cells was very high compared to other seasons and a figure of 67324 cellsL-1 was obtained in one of the collections. The lowest density of 606 cellsL-1 was obtained during post monsoon. A total of 29 species were identified from this station, diatoms leading the table with strength of 24 members. Asterionella japonica, three species of Coscinodiscus marginatus, Bacillaria paradoxa, Licmophora juergensii, Gyrosigma tenuissimum and Navicula mutica were abundant in both the years. (Table 8)
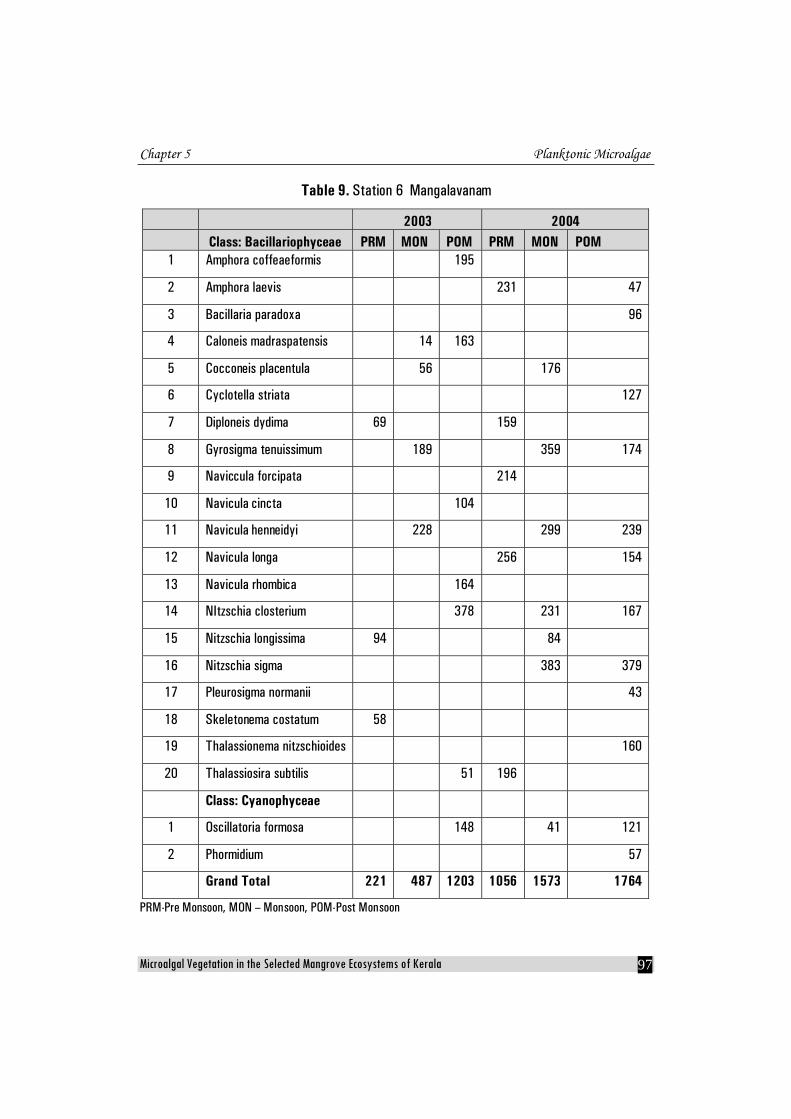
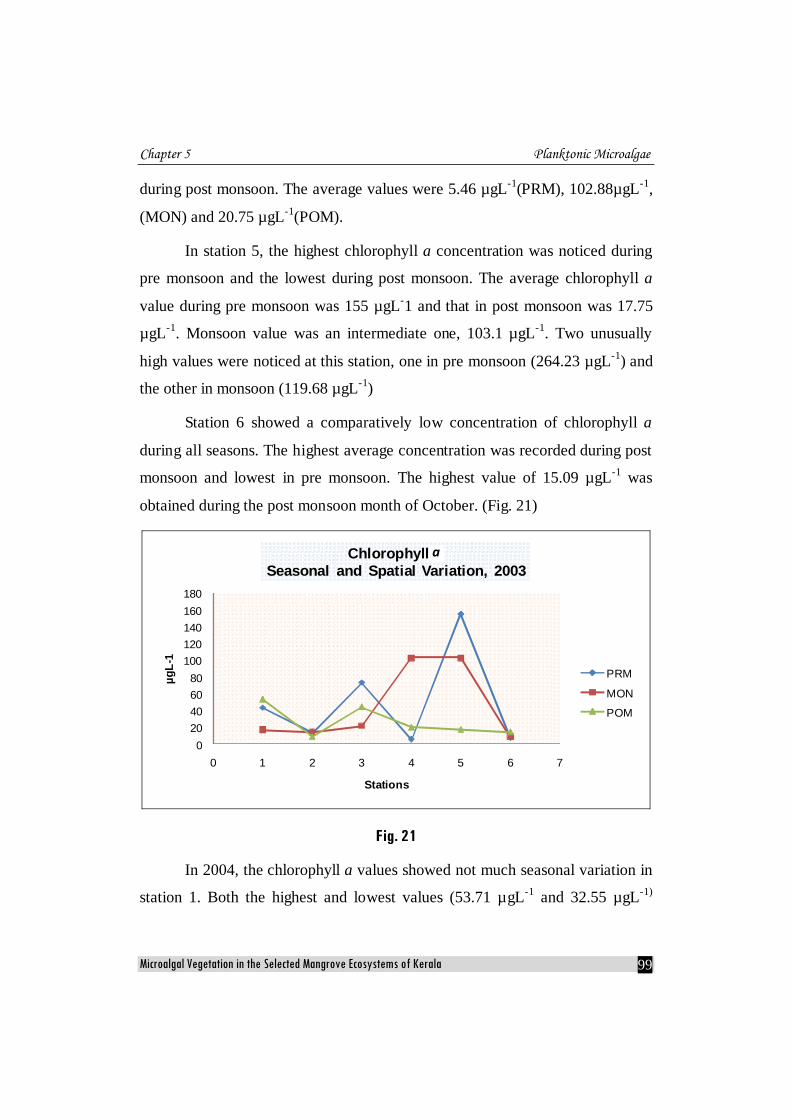
At station 6, Mangalavanam, the cell density was comparatively low during all seasons. While the highest density of 1258 cellsL-1 in the first year was noted during post monsoon, the lowest of 194 cellsL-1was recorded during pre monsoon. In the second year, the highest value of 3532 cellsL-1 was obtained during monsoon and the lowest of 794 cellsL-1 during pre monsoon. The least cell density and species richness were noted at this station. There were only 22 species of planktonic microalgae identified from this station. Nitzschia sigma, Nitzschia closterium, Navicula henneidyi and Gyrosigma tenuissimum were the dominant species. (Table 9)
Chapter 5 Planktonic Microalgae
Microalgal Vegetation in the Selected Mangrove Ecosystems of Kerala 92
Table 4: Station 1 Kumbalam
2003 2004 Bacillariophyceae PRM MON POM PRM MON POM
1 Achnanthes coarctata 188 2 Amphora coffeaeformis 182 3 Amphora decussata 368 137 4 Asterionella japonica 473 221 5 Bacillaria paradoxa 232 191 6 Biddulphia mobilensis 32 286 249 387 7 Chaetoceros brevis 379 8 Coscinodiscus centralis 49 9 Coscinodiscus marginata 357 42 365
10 Cyclotella striata 34 411 356 11 Cymbella hustedtii 332 295
12 Diploneis littoralis 321 541
13 Diploneis puella 489 347 165
14 Gyrosigma balticum 352
15 Gyrosigma tenuissimum 34 490 245 401 169
16 Navicula longa 523 214
17 Navicula mutica 759 47 878 423 479
18 Nitzschia closterium 630 29 789 447 479
19 Nitzschia panduriformis 301 389 83
20 Pleurosigma aestuarii 925 33 692
21 Pleurosigma angulatum 647 98
22 Pleurosigma normanii 298
23 Rhizosolenia robusta 643 341 24 Surirella fastuosa 367 9 25 Synedra affinis 420 26 Thalasionema nitzschioides 306 27 Thalassiosira subtilis 493 562 28 Triceratium favus 453 Chlorophyceae
1 Staurastrum asteroideum 321 2 Cosmarium quadrum 264 3 Chlorella vulgaris 39 358
Cyanophyceae 1 Spirulina labyrinthiformis 41 580 199 2 Oscillatoria formosa 204
Dinophyceae 1 Ceratium furca 372
Grand Total 5030 380 9150 3061 3324 3310 PRM-Pre Monsoon, MON – Monsoon, POM-Post Monsoon
Chapter 5 Planktonic Microalgae
Microalgal Vegetation in the Selected Mangrove Ecosystems of Kerala 93
Table 5 Station 2. Panangad
Class 2003 2004
Class: Bacillariophyceae PRM MON POM PRM MON POM 1 Achnanthes brevipes 361 112 67 2 Amphora coffeaeformis 682 130 3 Amphora laevis 341 1045 122 4 Caloneis madraspatensis 97 92
5 Cymbella hustedtii 263 932 6 Diploneis dydima 245 532 7 Gyrosigma balticum 358 113 8 Melosira numuloides 397 672 671
9 Navicula cincta 568 524
10 Navicula forcipata 161
11 Navicula mutica 1069 89
12 Navicula halophila 301
13 Navicula henneidyi 127 78
14 Nitzschia closterium 251 357 973 153
15 Nitzschia sigma 304
16 Pleurosigma aestuarii 556 72 152
17 Pleurosigma angulatum 318 733 578
18 Pleurosigma normanii 342 591 19 Skeletonema costatum 19 764 20 Synedra affinis 515
21 Thalassiosira decipiens 83 22 Triceratium favus 367 133 113
Class:Dinophyceae
1 Ceratium furca 865
Class: Cyanophyceae
1 Spirulina labyrinthiformis 467 82
2 Oscillatoria chalybea 193 41 Class: Chlorophyceae
1 Closterium kutzingii 673 367
2 Chlorella vulgaris 255 635
Grand Total 3112 4253 1409 2119 9393 815 PRM-Pre Monsoon, MON – Monsoon, POM-Post Monsoon
Chapter 5 Planktonic Microalgae
Microalgal Vegetation in the Selected Mangrove Ecosystems of Kerala 94
Table 6 Station 3. Nettoor
Class 2003 2004 Class: Bacillariophyceae PRM MON POM PRM MON POM
1 Achnanthes coarctatus 327 408 1408 2 Amphora coffeaeformis 209 339 3 Amphora ovalis 502 2384 4 Bacillaria paradoxa 364 794 734 5 Caloneis madraspatensis 343 6 Chaetoceros brevis 486 574 1009 7 Coscinodiscus centralis 1582 349 652 8 Cyclotella striata 863 9 Cymbella hustedtii 567 10 Diploneis dydima 382 538 11 Gyrosigma balticum 1304 1411 12 Gyrosigma scalproides 1973 741 13 Navicula cincta 171 682 14 Navicula forcipata 762 918 15 Navicula henneidyi 1133 1087 16 Navicula mutica 764 2284 17 Navicula rhombica 121 567 18 Navicula sp. 334 19 Nitzschia closterium 2954 467 878 582 1839 1968 20 Nitzschia longissima 451 83 21 Nitzschia lorenziana 283 937 22 Nitzschia sigma 357 591 23 Planktoniella sp. 449 2564 24 Pleurosigma aestuarii 1103 951 967 25 Pleurosigma angulatum 1687 26 Pleurosigma normanii 2605 1084 27 Podosira montagnei 1349 28 Rhizosolenia robusta 1110 798 29 Surirella fustuosa 1297 30 Thalassionema nitzschioides 824 31 Thalassiosira decipiens 861
Chlorophyceae 1 Chlorella marina 940 2 Chlorella vulgaris 1230 3 Closterium kutzingii 243
Cyanophyceae 1 Microcystis aeruginosa 957 2 Phormidium 496
Dinophyceae 1 Ceratium furca 1403 2 Gymnodinium sp. 927
Grand Total 17103 5475 6639 3103 18740 13241 PRM-Pre Monsoon, MON – Monsoon, POM-Post Monsoon
Chapter 5 Planktonic Microalgae
Microalgal Vegetation in the Selected Mangrove Ecosystems of Kerala 95
Table 7 Station 4 Puthuvaipu
2003 2004 Class: Bacillariophyceae PRM MON POM PRM MON POM 1 Achnanthes brevipes 1267 64 2 Amphora laevis 730 3 Biddulphia aurita 927 967 4 Cocconeis placentula 658 641 1209 5 Coscinodiscus centralis 286 2389 1001 6 Coscinodiscus eccentricus 985 7 Coscinodiscus marginata 134 204 8 Coscinodiscus radiatus 259 51 9 Cymbella marina 1963
10 Diploneis littoralis 246 2196 43 11 Diploneis puella 48 12 Gramatophora marina 2253 454 13 Gyrosigma scalproides 1578 61 14 Gyrosigma tenuissimum 3964 834 15 Licmophora juergensii 115 2536 689 16 Mastogloia pumella 1937 73 17 Melosira numuloides 1208 301 18 Navicula forcipata 1987 764 19 Navicula halophila 1638 563 20 Nitzschia closterium 54 197 2554 57 21 Nitzschia longissima 391 22 Pleurosigma normanii 867 586 1127 23 Rhizosolenia robusta 1598 85 24 Skeletonema costatum 51 25 Thalassiosira subtilis 956 26 Triceratium favus 1189 1378
Class: Chlorophyceae 1 Cosmarium quadrum 2387 2 Chlorella vulgaris 1256
Class: Cyanophyceae 1 Oscillatoria chalybea 45 2 Nostoc punctiforme 1934
Class: Dinophyceae 1 Ceratium furca 1498 2 Gymnodinium 2104 3 Protoperidinium 234 1159
Grand Total 835 32198 5355 1628 18387 527 PRM-Pre Monsoon, MON – Monsoon, POM-Post Monsoon
Chapter 5 Planktonic Microalgae
Microalgal Vegetation in the Selected Mangrove Ecosystems of Kerala 96
Table 8 Station 5. Murikkinpadam
2003 2004
Class: Bacillariophyceae PRM MON POM PRM MON POM 1 Amphora coffeaeformis 296 2 Amphora laevis 961 64 3 Asterionella japonica 1151 1010 4 Bacillaria paradoxa 989 4461 268 5 Cocconeis placentula 384 6 Coscinodiscus centralis 357 992 7 Coscinodiscus eccentricus 436 1349 1564
8 Coscinodiscus marginatus 3129 1776 4109 9 Cymbella marina 1976 157 10 Diploneis littoralis 1243 245 11 Fragilaria oceanica 873 12 Gramatophora marina 981 13 Gyrosigma tenuissimum 2563 385 5249 14 Licmophora juergensii 2436 3381
15 Mastogloia pumella 381 16 Navicula halophila 536 142 17 Navicula mutica 3367 4030 209 18 Nitzschia closterium 1698 1163 1967 19 Nitzschia panduriformis 396 927 134 20 Planktoniella sol 1039 21 Pleurosigma normanii 324 862 1954 22 Podosira montagnei 1873 304 23 Synedra affinis 145 24 Thalassiosira decipiens 284
Class: Chlorophyceae
1 Staurastrum asteroideum 3004
Class: Dinophyceae
1 Ceratium furca 954
2 Gymnodinium 156
3 Protoperidinium 1203 2401
Class: Cyanophyceae
1 Oscillatoria labyrinthiformis 1123 372
Grand Total 20892 3734 1434 6653 39333 1687
PRM-Pre Monsoon, MON – Monsoon, POM-Post Monsoon
Chapter 5 Planktonic Microalgae
Microalgal Vegetation in the Selected Mangrove Ecosystems of Kerala 97
Table 9. Station 6 Mangalavanam
2003 2004 Class: Bacillariophyceae PRM MON POM PRM MON POM
1 Amphora coffeaeformis 195
2 Amphora laevis 231 47
3 Bacillaria paradoxa 96
4 Caloneis madraspatensis 14 163
5 Cocconeis placentula 56 176
6 Cyclotella striata 127
7 Diploneis dydima 69 159
8 Gyrosigma tenuissimum 189 359 174
9 Naviccula forcipata 214
10 Navicula cincta 104
11 Navicula henneidyi 228 299 239
12 Navicula longa 256 154
13 Navicula rhombica 164
14 NItzschia closterium 378 231 167
15 Nitzschia longissima 94 84
16 Nitzschia sigma 383 379
17 Pleurosigma normanii 43
18 Skeletonema costatum 58
19 Thalassionema nitzschioides 160
20 Thalassiosira subtilis 51 196
Class: Cyanophyceae
1 Oscillatoria formosa 148 41 121
2 Phormidium 57
Grand Total 221 487 1203 1056 1573 1764
PRM-Pre Monsoon, MON – Monsoon, POM-Post Monsoon
Chapter 5 Planktonic Microalgae
Microalgal Vegetation in the Selected Mangrove Ecosystems of Kerala 98
5.3.2 Pigments:
5.3.2.1 Chlorophyll a:
Chlorophyll a is the most common pigment present in every plant, algae
and cyanophyceae that perform photosynthesis. Chlorophyll a measurements
have historically provided a useful estimate of algal biomass and its spatial and
temporal variability.
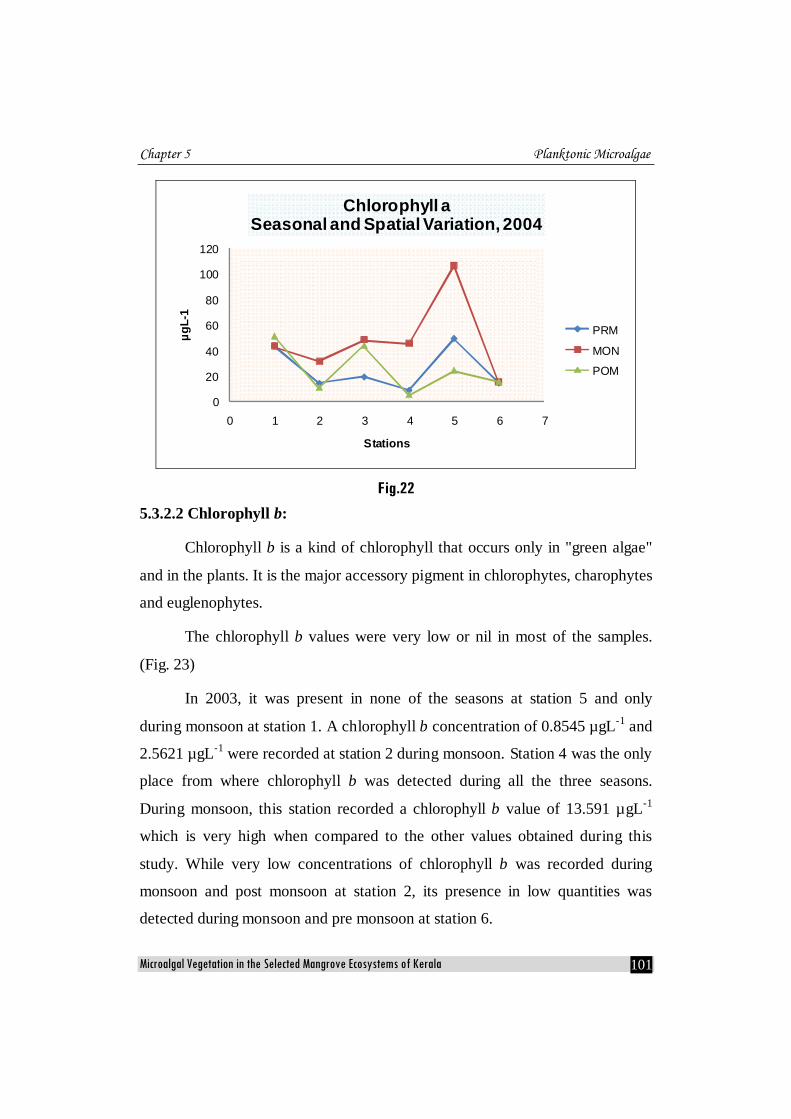
In 2003, Station 1 showed highest average concentration of chlorophyll
a during post monsoon followed by premonsoon. The average monsoon value
was quite low when compared to the other two values. The concentration was
very high (104.44 µgL-1) during one of the post monsoon collections in
October. The lowest chlorophyll a value recorded at this station was 2.74 µgL-1
in premonsoon.
In station 2, the highest average concentration of chlorophyll a (14.17
µgL-1) was recorded during monsoon and the lowest (9.48 µgL-1) during post
monsoon. However, there was not much seasonal variation in the concentration
of chlorophyll a at this station.
In station 3, chlorophyll a concentration showed the highest value during
pre monsoon and the lowest during monsoon. There were two peaks in
chlorophyll a concentration, one during premonsoon month of February and the
other in post monsoon month of December, the values being 100.26 µgL-1 and
82.58 µgL-1 respectively.
In station 4, there was an extreme high value of chlorophyll a during one
of the monsoon collections, 167.64 µgL-1. While the highest average
concentration of chlorophyll a was recorded during monsoon, the value
obtained during pre monsoon was very low. An intermediate value was noticed
Chapter 5 Planktonic Microalgae
Microalgal Vegetation in the Selected Mangrove Ecosystems of Kerala 99
during post monsoon. The average values were 5.46 µgL-1(PRM), 102.88µgL-1,
(MON) and 20.75 µgL-1(POM).
In station 5, the highest chlorophyll a concentration was noticed during
pre monsoon and the lowest during post monsoon. The average chlorophyll a
value during pre monsoon was 155 µgL-1 and that in post monsoon was 17.75
µgL-1. Monsoon value was an intermediate one, 103.1 µgL-1. Two unusually
high values were noticed at this station, one in pre monsoon (264.23 µgL-1) and
the other in monsoon (119.68 µgL-1)
Station 6 showed a comparatively low concentration of chlorophyll a
during all seasons. The highest average concentration was recorded during post
monsoon and lowest in pre monsoon. The highest value of 15.09 µgL-1 was
obtained during the post monsoon month of October. (Fig. 21)
Fig. 21
In 2004, the chlorophyll a values showed not much seasonal variation in
station 1. Both the highest and lowest values (53.71 µgL-1 and 32.55 µgL-1)
020406080
100120140160180
0 1 2 3 4 5 6 7
µgL-
1
Stations
Chlorophyll aSeasonal and Spatial Variation, 2003
PRM
MON
POM
a
Chapter 5 Planktonic Microalgae
Microalgal Vegetation in the Selected Mangrove Ecosystems of Kerala 100
were recorded during monsoon. On taking the average, the post monsoon did
have an edge over the other two stations.
In station 2, the chlorophyll a concentration during monsoon was almost
double when compared to that of the other stations. While the highest value was
31.35 µgL-1 recorded during monsoon, the lowest value was 10.65 µgL-1
recorded during post monsoon.
In station 3, there was not much difference between the chlorophyll a
values of monsoon and post monsoon seasons, which were 48.25 µgL-1 and
43.72 µgL-1 respectively. However, the pre monsoon concentration of
chlorophyll a was much lower, i.e., 18.86 µgL-1.
In Station 4, the monsoon concentration of chlorophyll a was much
higher (45.142 µgL-1) when compared to the pre monsoon (8.55 µgL-1) and post
monsoon (4.82 µgL-1) concentrations.
There was a concentration peak of chlorophyll a in station 5, during
monsoon, the average value being 106.413 µgL-1. The pre monsoon value was
twice as that of post monsoon. While the former was 49.04 µgL-1 the latter was
24.095 µgL-1.
There was not much seasonal variation in the concentration of
chlorophyll a at station 6. The average values from pre monsoon to post
monsoon were 14.105 µgL-1, 14.7589 µgL-1 and 15.643 µgL-1. (Fig.22)
Chapter 5 Planktonic Microalgae
Microalgal Vegetation in the Selected Mangrove Ecosystems of Kerala 101
Fig.22
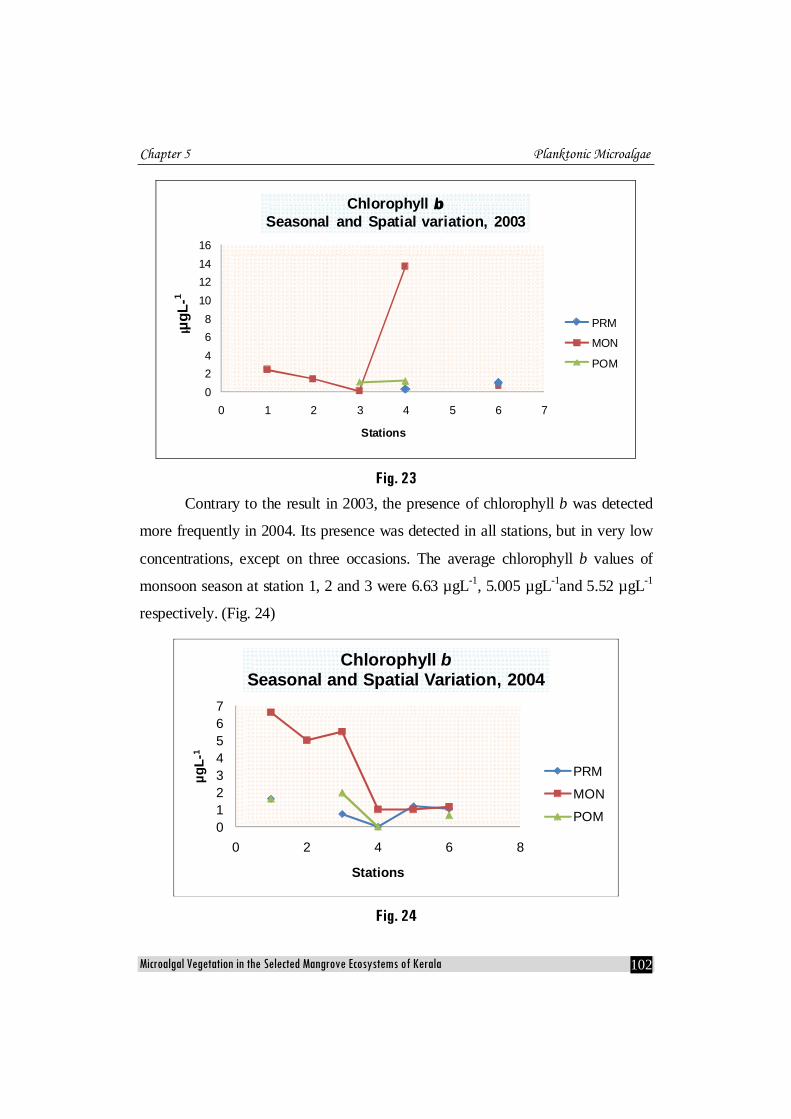
5.3.2.2 Chlorophyll b:
Chlorophyll b is a kind of chlorophyll that occurs only in "green algae"
and in the plants. It is the major accessory pigment in chlorophytes, charophytes
and euglenophytes.
The chlorophyll b values were very low or nil in most of the samples.
(Fig. 23)
In 2003, it was present in none of the seasons at station 5 and only
during monsoon at station 1. A chlorophyll b concentration of 0.8545 µgL-1 and
2.5621 µgL-1 were recorded at station 2 during monsoon. Station 4 was the only
place from where chlorophyll b was detected during all the three seasons.
During monsoon, this station recorded a chlorophyll b value of 13.591 µgL-1
which is very high when compared to the other values obtained during this
study. While very low concentrations of chlorophyll b was recorded during
monsoon and post monsoon at station 2, its presence in low quantities was
detected during monsoon and pre monsoon at station 6.
0
20
40
60
80
100
120
0 1 2 3 4 5 6 7
µgL-
1
Stations
Chlorophyll aSeasonal and Spatial Variation, 2004
PRM
MON
POM
Chapter 5 Planktonic Microalgae
Microalgal Vegetation in the Selected Mangrove Ecosystems of Kerala 102
Fig. 23
Contrary to the result in 2003, the presence of chlorophyll b was detected
more frequently in 2004. Its presence was detected in all stations, but in very low
concentrations, except on three occasions. The average chlorophyll b values of
monsoon season at station 1, 2 and 3 were 6.63 µgL-1, 5.005 µgL-1and 5.52 µgL-1
respectively. (Fig. 24)
Fig. 24
02468
10121416
0 1 2 3 4 5 6 7
µgL-
1
Stations
Chlorophyll bSeasonal and Spatial variation, 2003
PRM
MON
POM
01234567
0 2 4 6 8
µgL-
1
Stations
Chlorophyll bSeasonal and Spatial Variation, 2004
PRM
MON
POM
µgL-
1 b
Chapter 5 Planktonic Microalgae
Microalgal Vegetation in the Selected Mangrove Ecosystems of Kerala 103
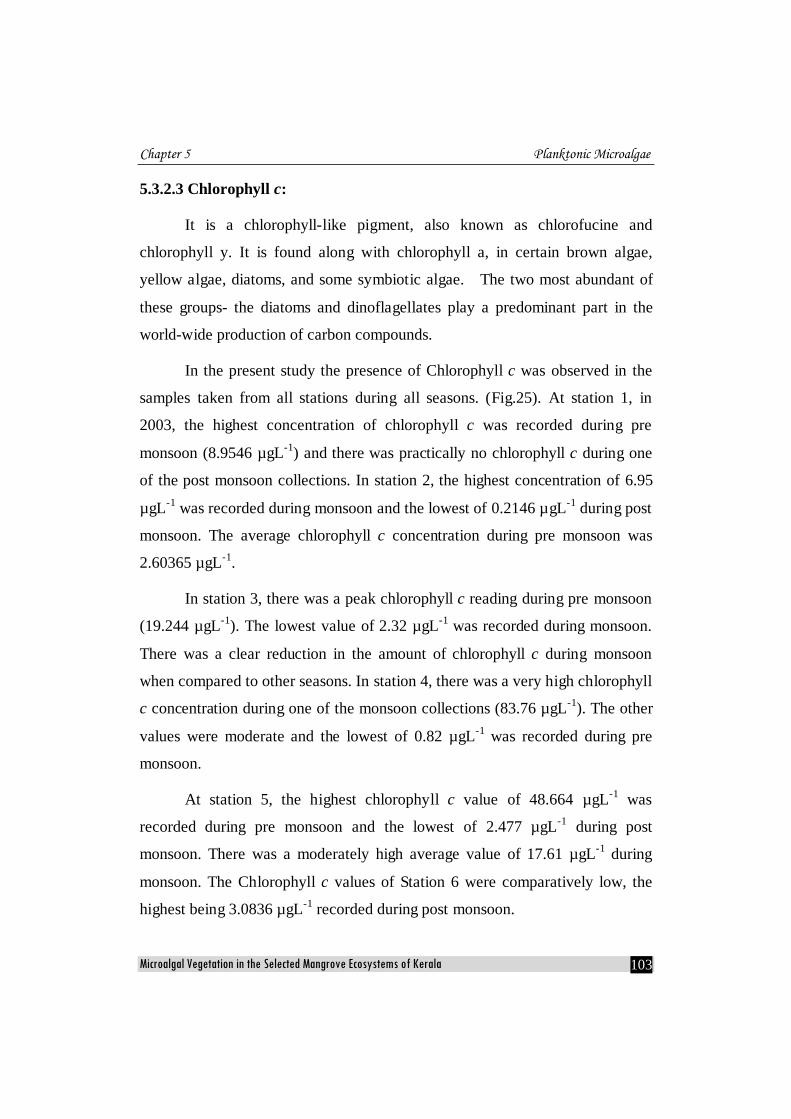
5.3.2.3 Chlorophyll c:
It is a chlorophyll-like pigment, also known as chlorofucine and
chlorophyll y. It is found along with chlorophyll a, in certain brown algae,
yellow algae, diatoms, and some symbiotic algae. The two most abundant of
these groups- the diatoms and dinoflagellates play a predominant part in the
world-wide production of carbon compounds.
In the present study the presence of Chlorophyll c was observed in the
samples taken from all stations during all seasons. (Fig.25). At station 1, in
2003, the highest concentration of chlorophyll c was recorded during pre
monsoon (8.9546 µgL-1) and there was practically no chlorophyll c during one
of the post monsoon collections. In station 2, the highest concentration of 6.95
µgL-1 was recorded during monsoon and the lowest of 0.2146 µgL-1 during post
monsoon. The average chlorophyll c concentration during pre monsoon was
2.60365 µgL-1.
In station 3, there was a peak chlorophyll c reading during pre monsoon
(19.244 µgL-1). The lowest value of 2.32 µgL-1 was recorded during monsoon.
There was a clear reduction in the amount of chlorophyll c during monsoon
when compared to other seasons. In station 4, there was a very high chlorophyll
c concentration during one of the monsoon collections (83.76 µgL-1). The other
values were moderate and the lowest of 0.82 µgL-1 was recorded during pre
monsoon.
At station 5, the highest chlorophyll c value of 48.664 µgL-1 was
recorded during pre monsoon and the lowest of 2.477 µgL-1 during post
monsoon. There was a moderately high average value of 17.61 µgL-1 during
monsoon. The Chlorophyll c values of Station 6 were comparatively low, the
highest being 3.0836 µgL-1 recorded during post monsoon.
Chapter 5 Planktonic Microalgae
Microalgal Vegetation in the Selected Mangrove Ecosystems of Kerala 104
Fig. 25
In 2004, at station 1, there were high chlorophyll c values during
monsoon and post monsoon, the highest being 21.58 µgL-1 recorded during
monsoon. The pre monsoon value of 5.042 µgL-1 was the lowest.
At station 2, the highest chlorophyll c value of 14.854 µgL-1 was
recorded during monsoon and the lowest of 1.18 µgL-1 during pre monsoon.
At station 3 also, the highest value was recorded during monsoon and it
was 15.753 µgL-1. The lowest value was 2.58 µgL-1 recorded during pre
monsoon. At station 4, there was only one value that was considerably high and
it was 10.76 µgL-1 recorded during monsoon. The lowest value was 0.94 µgL-1
recorded during post monsoon.
High chlorophyll c values were recorded during pre monsoon and
monsoon at station 5. The highest was 18. 75 µgL-1 recorded during monsoon
and the lowest was 2.09 µgL-1 measured during post monsoon. Station 6 was
05
10
15202530354045
50
0 1 2 3 4 5 6 7
µgL‐1
Stations
Chlorophyll cSeasonal and Spatial variation, 2003
PRM
MON
POM
µgL-
1
c
Chapter 5 Planktonic Microalgae
Microalgal Vegetation in the Selected Mangrove Ecosystems of Kerala 105
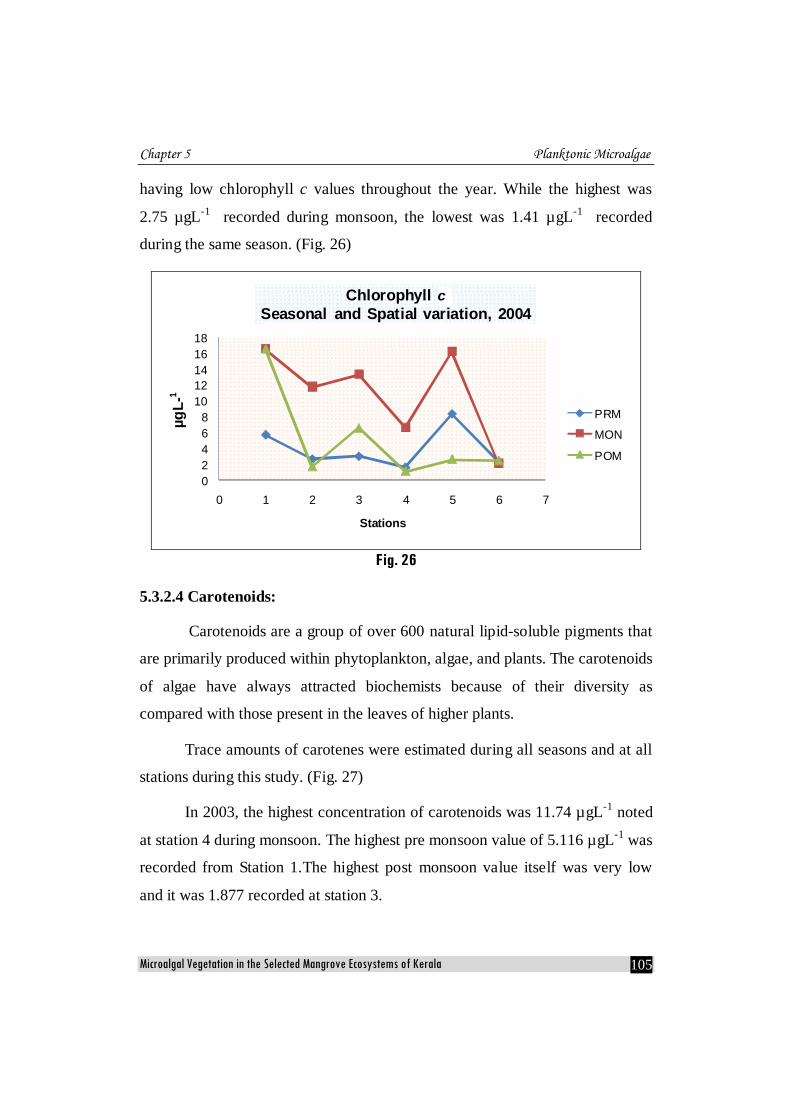
having low chlorophyll c values throughout the year. While the highest was
2.75 µgL-1 recorded during monsoon, the lowest was 1.41 µgL-1 recorded
during the same season. (Fig. 26)
Fig. 26
5.3.2.4 Carotenoids:
Carotenoids are a group of over 600 natural lipid-soluble pigments that
are primarily produced within phytoplankton, algae, and plants. The carotenoids
of algae have always attracted biochemists because of their diversity as
compared with those present in the leaves of higher plants.
Trace amounts of carotenes were estimated during all seasons and at all
stations during this study. (Fig. 27)
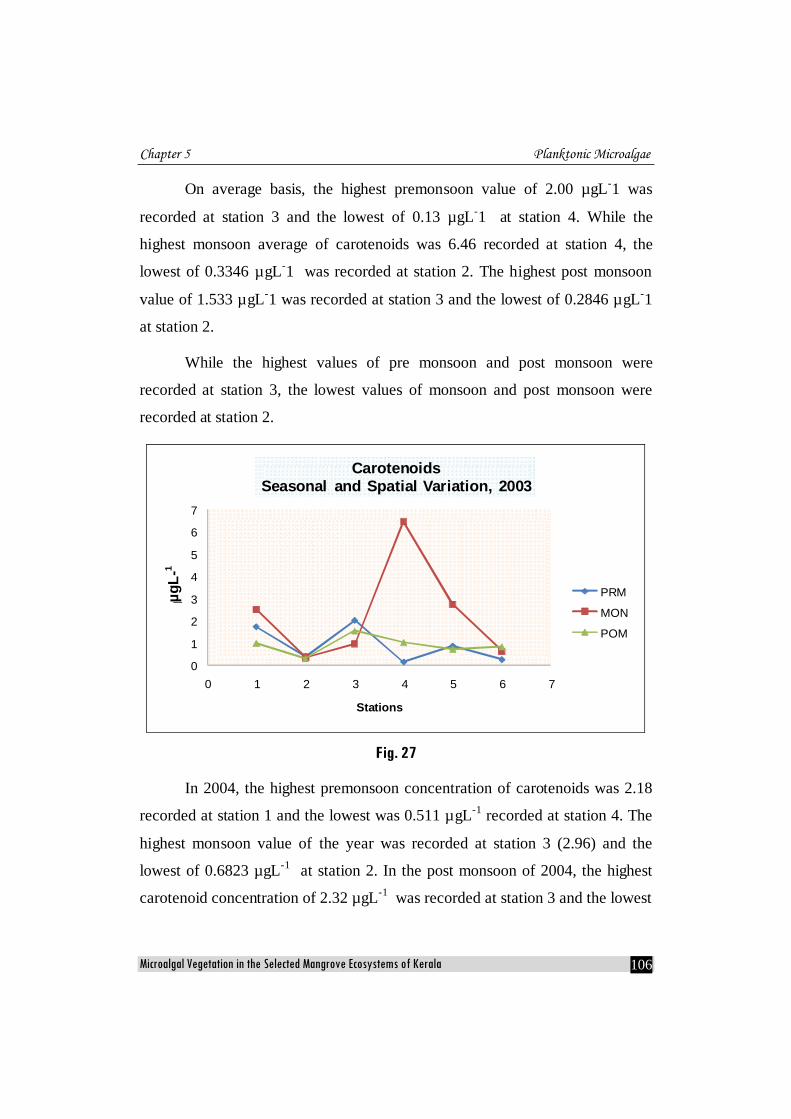
In 2003, the highest concentration of carotenoids was 11.74 µgL-1 noted
at station 4 during monsoon. The highest pre monsoon value of 5.116 µgL-1 was
recorded from Station 1.The highest post monsoon value itself was very low
and it was 1.877 recorded at station 3.
02468
1012141618
0 1 2 3 4 5 6 7
µgL-
1
Stations
Chlorophyll cSeasonal and Spatial variation, 2004
PRM
MON
POM
µgL-
1
c
Chapter 5 Planktonic Microalgae
Microalgal Vegetation in the Selected Mangrove Ecosystems of Kerala 106
On average basis, the highest premonsoon value of 2.00 µgL-1 was
recorded at station 3 and the lowest of 0.13 µgL-1 at station 4. While the
highest monsoon average of carotenoids was 6.46 recorded at station 4, the
lowest of 0.3346 µgL-1 was recorded at station 2. The highest post monsoon
value of 1.533 µgL-1 was recorded at station 3 and the lowest of 0.2846 µgL-1
at station 2.
While the highest values of pre monsoon and post monsoon were
recorded at station 3, the lowest values of monsoon and post monsoon were
recorded at station 2.
Fig. 27
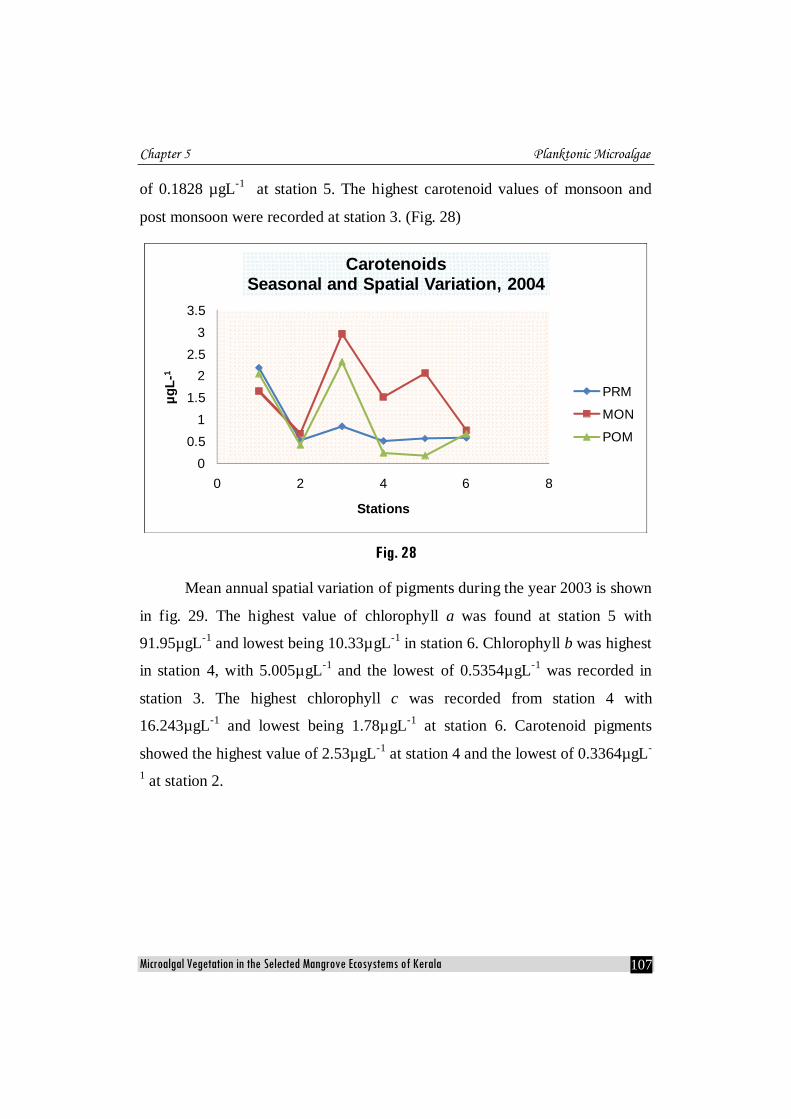
In 2004, the highest premonsoon concentration of carotenoids was 2.18
recorded at station 1 and the lowest was 0.511 µgL-1 recorded at station 4. The
highest monsoon value of the year was recorded at station 3 (2.96) and the
lowest of 0.6823 µgL-1 at station 2. In the post monsoon of 2004, the highest
carotenoid concentration of 2.32 µgL-1 was recorded at station 3 and the lowest
0
1
2
3
4
5
6
7
0 1 2 3 4 5 6 7
µgL-
1
Stations
CarotenoidsSeasonal and Spatial Variation, 2003
PRM
MON
POM
µgL-
1
Chapter 5 Planktonic Microalgae
Microalgal Vegetation in the Selected Mangrove Ecosystems of Kerala 107
of 0.1828 µgL-1 at station 5. The highest carotenoid values of monsoon and
post monsoon were recorded at station 3. (Fig. 28)
Fig. 28
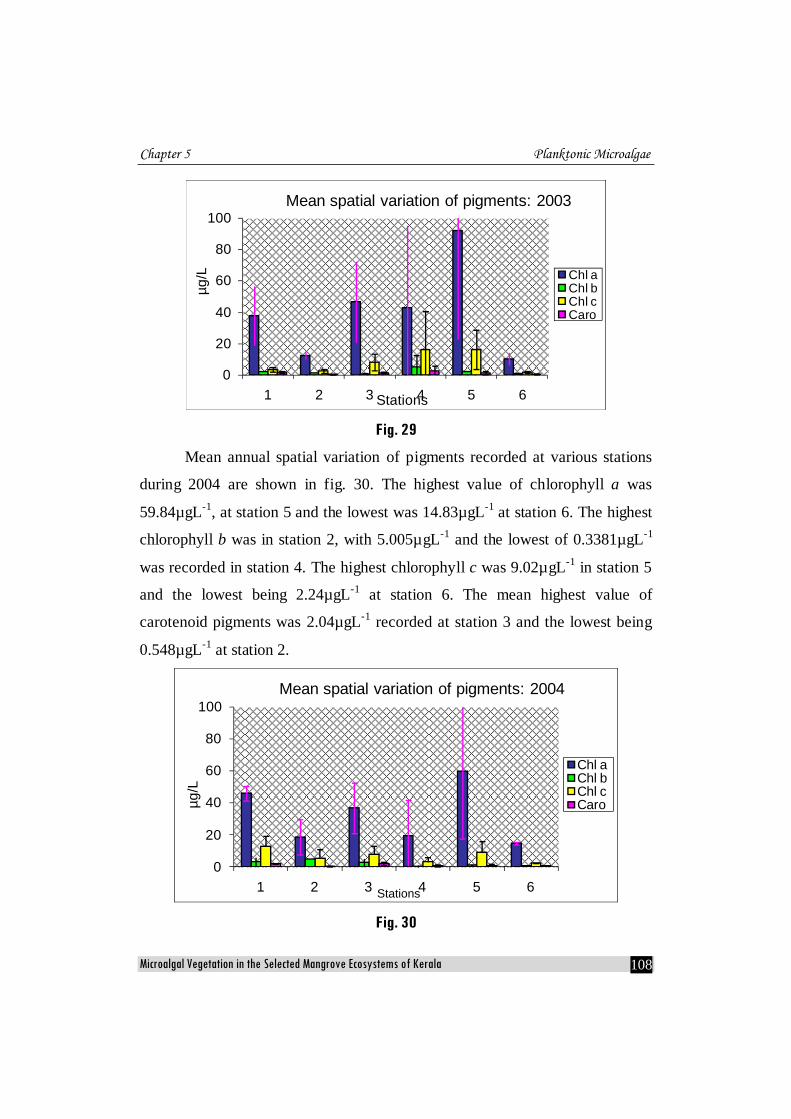
Mean annual spatial variation of pigments during the year 2003 is shown
in fig. 29. The highest value of chlorophyll a was found at station 5 with
91.95µgL-1 and lowest being 10.33µgL-1 in station 6. Chlorophyll b was highest
in station 4, with 5.005µgL-1 and the lowest of 0.5354µgL-1 was recorded in
station 3. The highest chlorophyll c was recorded from station 4 with
16.243µgL-1 and lowest being 1.78µgL-1 at station 6. Carotenoid pigments
showed the highest value of 2.53µgL-1 at station 4 and the lowest of 0.3364µgL-
1 at station 2.
00.5
11.5
22.5
33.5
0 2 4 6 8
µgL-
1
Stations
CarotenoidsSeasonal and Spatial Variation, 2004
PRM
MON
POM
Chapter 5 Planktonic Microalgae
Microalgal Vegetation in the Selected Mangrove Ecosystems of Kerala 108
Fig. 29
Mean annual spatial variation of pigments recorded at various stations
during 2004 are shown in fig. 30. The highest value of chlorophyll a was
59.84µgL-1, at station 5 and the lowest was 14.83µgL-1 at station 6. The highest
chlorophyll b was in station 2, with 5.005µgL-1 and the lowest of 0.3381µgL-1
was recorded in station 4. The highest chlorophyll c was 9.02µgL-1 in station 5
and the lowest being 2.24µgL-1 at station 6. The mean highest value of
carotenoid pigments was 2.04µgL-1 recorded at station 3 and the lowest being
0.548µgL-1 at station 2.
Fig. 30
0
20
40
60
80
100
1 2 3 4 5 6
µg/L
Stations
Mean spatial variation of pigments: 2003
Chl a Chl bChl cCaro
0
20
40
60
80
100
1 2 3 4 5 6
µg/L
Stations
Mean spatial variation of pigments: 2004
Chl a Chl bChl cCaro
Chapter 5 Planktonic Microalgae
Microalgal Vegetation in the Selected Mangrove Ecosystems of Kerala 109
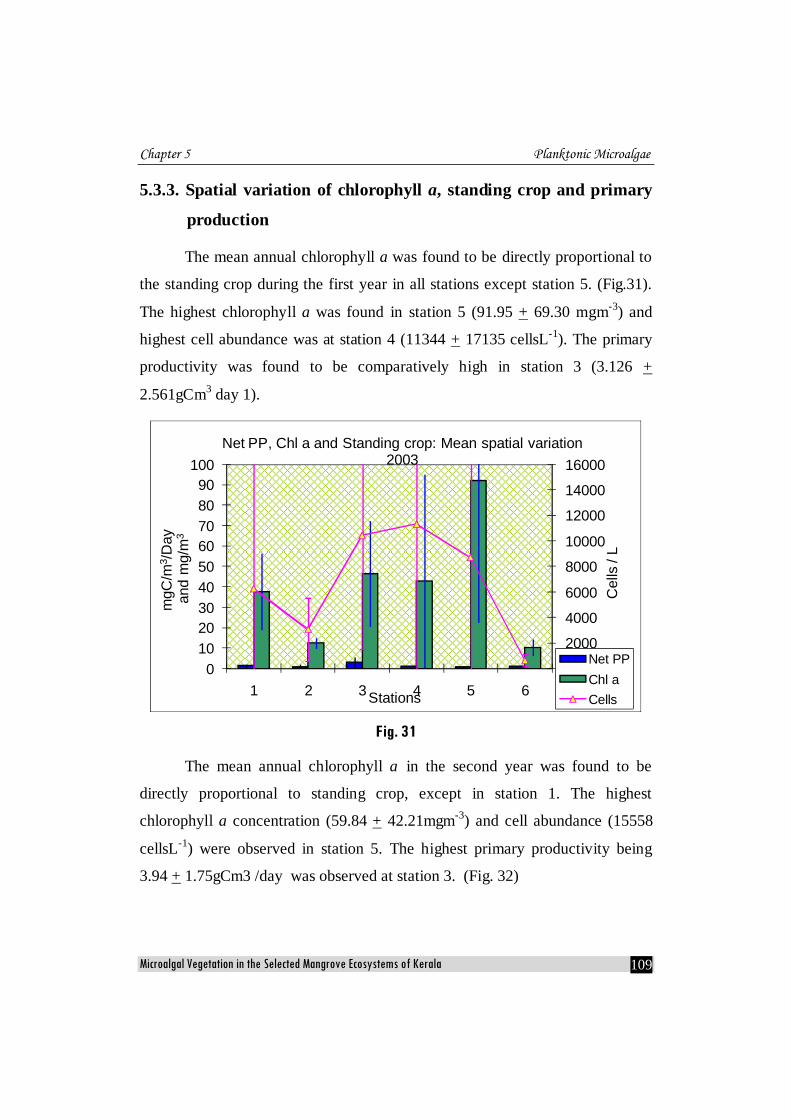
5.3.3. Spatial variation of chlorophyll a, standing crop and primary
production
The mean annual chlorophyll a was found to be directly proportional to
the standing crop during the first year in all stations except station 5. (Fig.31).
The highest chlorophyll a was found in station 5 (91.95 + 69.30 mgm-3) and
highest cell abundance was at station 4 (11344 + 17135 cellsL-1). The primary
productivity was found to be comparatively high in station 3 (3.126 +
2.561gCm3 day 1).
Fig. 31
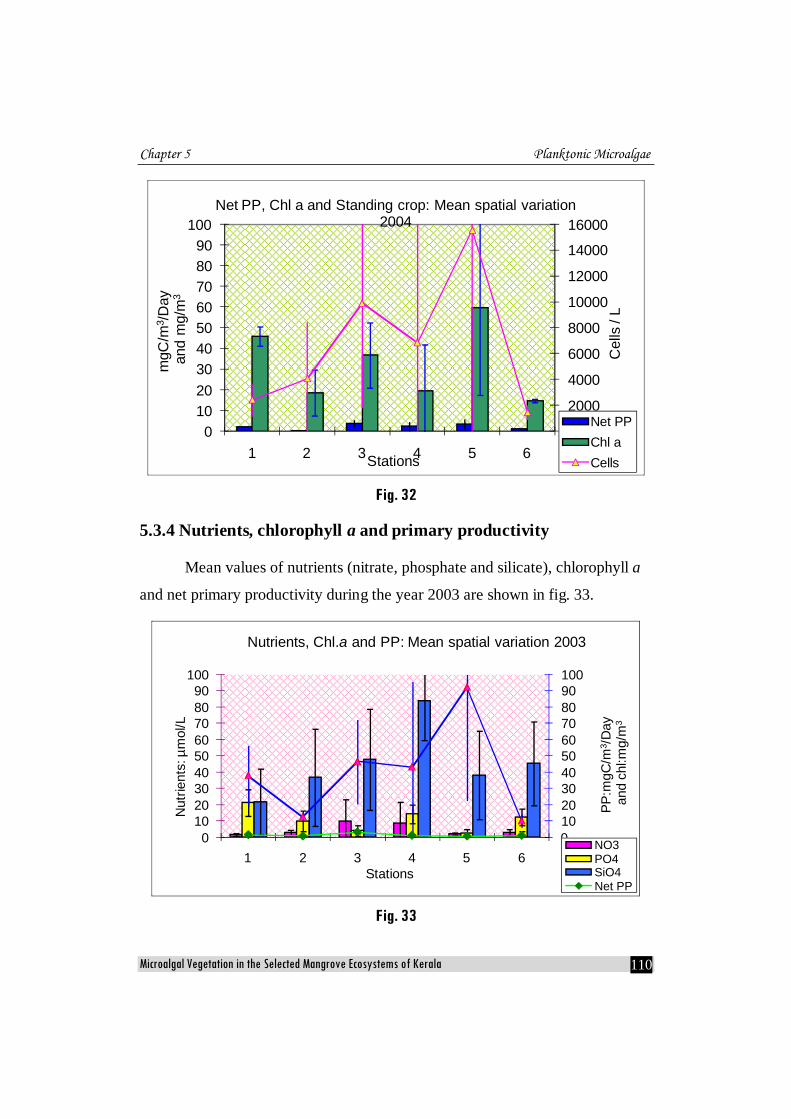
The mean annual chlorophyll a in the second year was found to be
directly proportional to standing crop, except in station 1. The highest
chlorophyll a concentration (59.84 + 42.21mgm-3) and cell abundance (15558
cellsL-1) were observed in station 5. The highest primary productivity being
3.94 + 1.75gCm3 /day was observed at station 3. (Fig. 32)
0
2000
4000
6000
8000
10000
12000
14000
16000
0102030405060708090
100
1 2 3 4 5 6
Cel
ls /
L
mgC
/m3 /D
ayan
d m
g/m
3
Stations
Net PP, Chl a and Standing crop: Mean spatial variation 2003
Net PPChl a Cells
Chapter 5 Planktonic Microalgae
Microalgal Vegetation in the Selected Mangrove Ecosystems of Kerala 110
Fig. 32
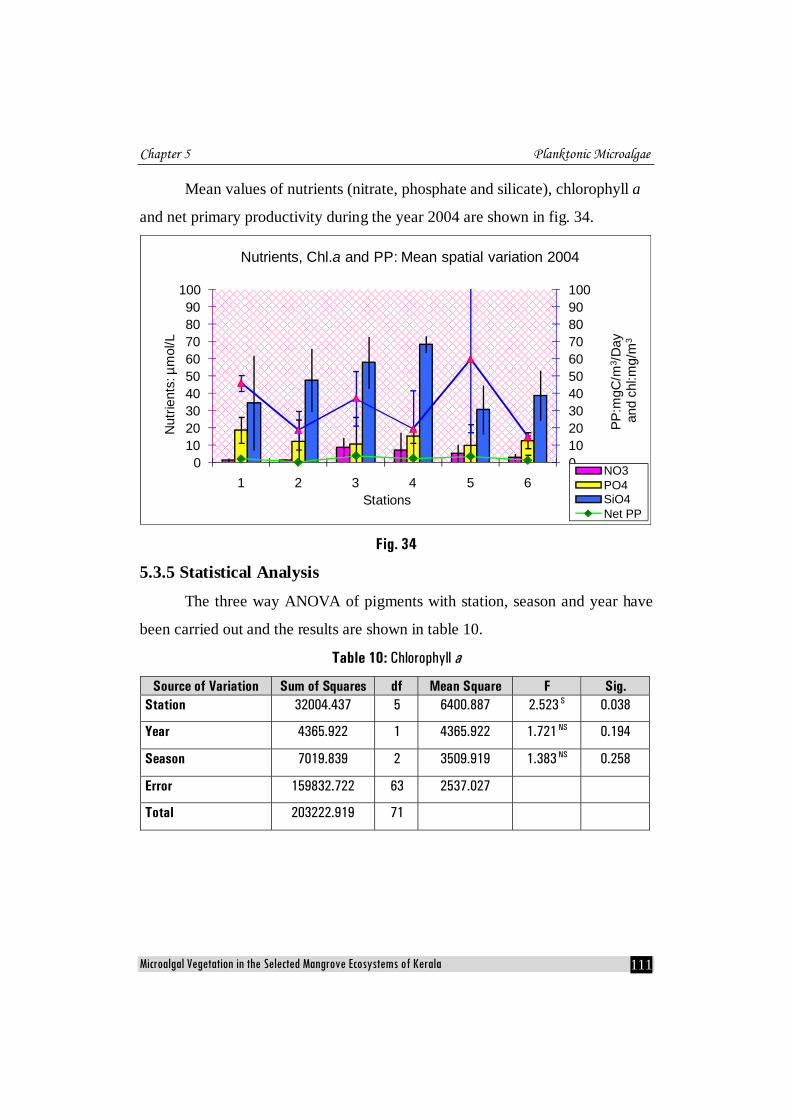
5.3.4 Nutrients, chlorophyll a and primary productivity
Mean values of nutrients (nitrate, phosphate and silicate), chlorophyll a
and net primary productivity during the year 2003 are shown in fig. 33.
Fig. 33
0
2000
4000
6000
8000
10000
12000
14000
16000
0102030405060708090
100
1 2 3 4 5 6
Cel
ls /
L
mgC
/m3 /D
ayan
d m
g/m
3
Stations
Net PP, Chl a and Standing crop: Mean spatial variation 2004
Net PPChl a Cells
0102030405060708090100
0102030405060708090
100
1 2 3 4 5 6
PP:m
gC/m
3 /Day
and
chl:m
g/m
3
Nut
rient
s: µ
mol
/L
Stations
Nutrients, Chl.a and PP: Mean spatial variation 2003
NO3PO4SiO4 Net PP
Chapter 5 Planktonic Microalgae
Microalgal Vegetation in the Selected Mangrove Ecosystems of Kerala 111
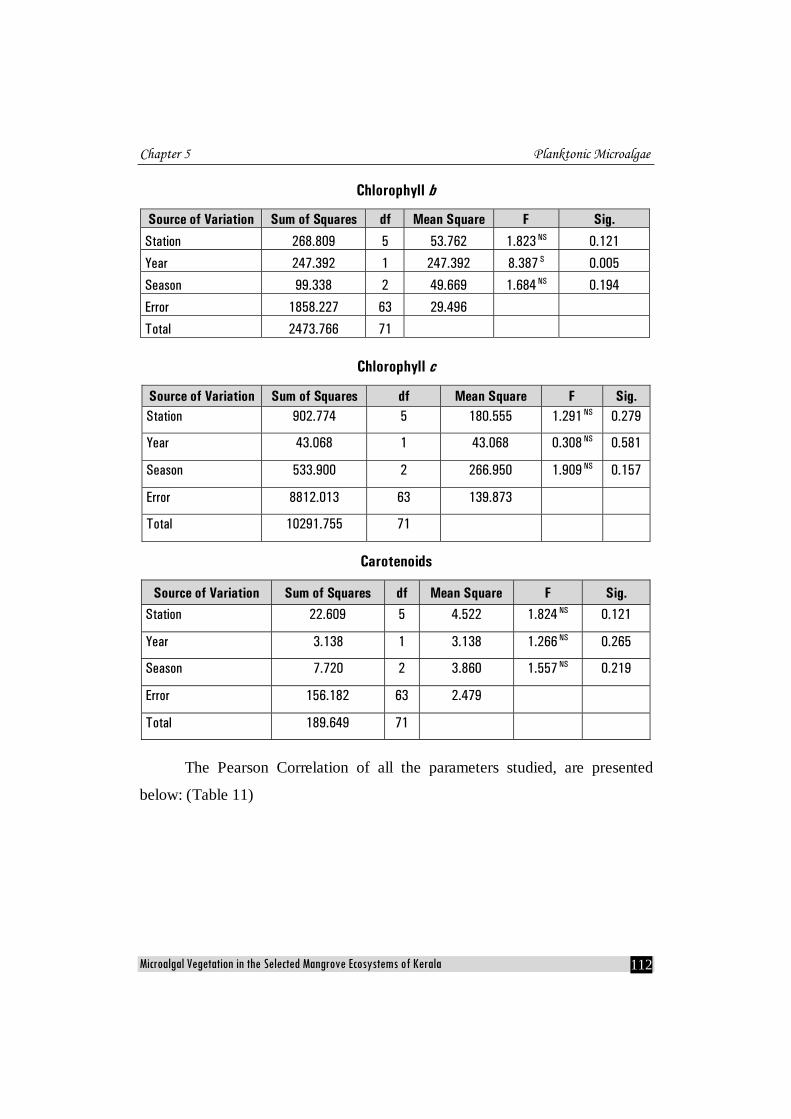
Mean values of nutrients (nitrate, phosphate and silicate), chlorophyll a
and net primary productivity during the year 2004 are shown in fig. 34.
Fig. 34
5.3.5 Statistical Analysis
The three way ANOVA of pigments with station, season and year have
been carried out and the results are shown in table 10.
Table 10: Chlorophyll a
Source of Variation Sum of Squares df Mean Square F Sig. Station 32004.437 5 6400.887 2.523 S 0.038
Year 4365.922 1 4365.922 1.721 NS 0.194
Season 7019.839 2 3509.919 1.383 NS 0.258
Error 159832.722 63 2537.027
Total 203222.919 71
0102030405060708090100
0102030405060708090
100
1 2 3 4 5 6
PP:m
gC/m
3 /Day
and
chl:m
g/m
3
Nut
rient
s: µ
mol
/L
Stations
Nutrients, Chl.a and PP: Mean spatial variation 2004
NO3PO4SiO4 Net PP
Chapter 5 Planktonic Microalgae
Microalgal Vegetation in the Selected Mangrove Ecosystems of Kerala 112
Chlorophyll b
Source of Variation Sum of Squares df Mean Square F Sig.
Station 268.809 5 53.762 1.823 NS 0.121
Year 247.392 1 247.392 8.387 S 0.005
Season 99.338 2 49.669 1.684 NS 0.194
Error 1858.227 63 29.496
Total 2473.766 71
Chlorophyll c
Source of Variation Sum of Squares df Mean Square F Sig. Station 902.774 5 180.555 1.291 NS 0.279
Year 43.068 1 43.068 0.308 NS 0.581
Season 533.900 2 266.950 1.909 NS 0.157
Error 8812.013 63 139.873
Total 10291.755 71
Carotenoids
Source of Variation Sum of Squares df Mean Square F Sig. Station 22.609 5 4.522 1.824 NS 0.121
Year 3.138 1 3.138 1.266 NS 0.265
Season 7.720 2 3.860 1.557 NS 0.219
Error 156.182 63 2.479
Total 189.649 71
The Pearson Correlation of all the parameters studied, are presented
below: (Table 11)
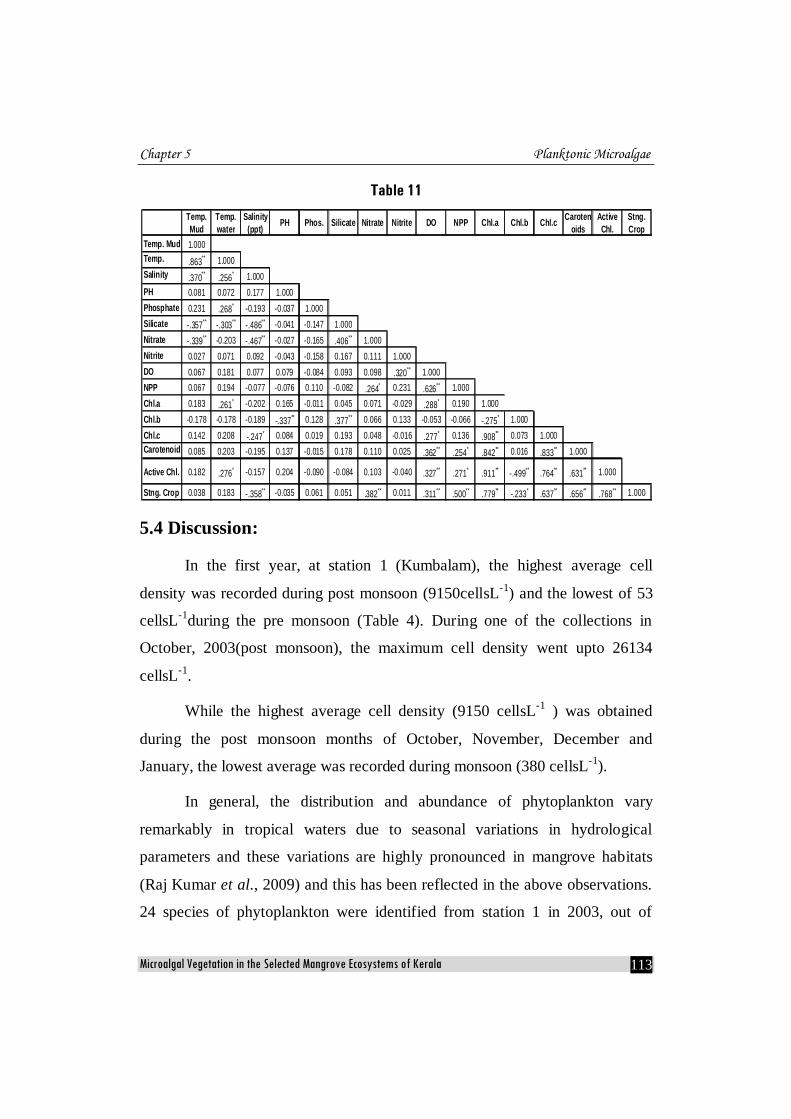
Chapter 5 Planktonic Microalgae
Microalgal Vegetation in the Selected Mangrove Ecosystems of Kerala 113
Table 11
5.4 Discussion:
In the first year, at station 1 (Kumbalam), the highest average cell
density was recorded during post monsoon (9150cellsL-1) and the lowest of 53
cellsL-1during the pre monsoon (Table 4). During one of the collections in
October, 2003(post monsoon), the maximum cell density went upto 26134
cellsL-1.
While the highest average cell density (9150 cellsL-1 ) was obtained
during the post monsoon months of October, November, December and
January, the lowest average was recorded during monsoon (380 cellsL-1).
In general, the distribution and abundance of phytoplankton vary
remarkably in tropical waters due to seasonal variations in hydrological
parameters and these variations are highly pronounced in mangrove habitats
(Raj Kumar et al., 2009) and this has been reflected in the above observations.
24 species of phytoplankton were identified from station 1 in 2003, out of
Temp. Mud
Temp. water
Salinity (ppt) PH Phos. Silicate Nitrate Nitrite DO NPP Chl.a Chl.b Chl.c Caroten
oidsActive
Chl.Stng. Crop
Temp. Mud 1.000Temp. .863** 1.000Salinity .370** .256* 1.000PH 0.081 0.072 0.177 1.000Phosphate 0.231 .268* -0.193 -0.037 1.000Silicate -.357** -.303** -.486** -0.041 -0.147 1.000Nitrate -.339** -0.203 -.467** -0.027 -0.165 .406** 1.000Nitrite 0.027 0.071 0.092 -0.043 -0.158 0.167 0.111 1.000DO 0.067 0.181 0.077 0.079 -0.084 0.093 0.098 .320** 1.000NPP 0.067 0.194 -0.077 -0.076 0.110 -0.082 .264* 0.231 .626** 1.000Chl.a 0.183 .261* -0.202 0.165 -0.011 0.045 0.071 -0.029 .288* 0.190 1.000Chl.b -0.178 -0.178 -0.189 -.337** 0.128 .377** 0.066 0.133 -0.053 -0.066 -.275* 1.000Chl.c 0.142 0.208 -.247* 0.084 0.019 0.193 0.048 -0.016 .277* 0.136 .908** 0.073 1.000Carotenoid 0.085 0.203 -0.195 0.137 -0.015 0.178 0.110 0.025 .362** .254* .842** 0.016 .833** 1.000
Active Chl. 0.182 .276* -0.157 0.204 -0.090 -0.084 0.103 -0.040 .327** .271* .911** -.499** .764** .631** 1.000
Stng. Crop 0.038 0.183 -.358** -0.035 0.061 0.051 .382** 0.011 .311** .500** .779** -.233* .637** .656** .768** 1.000
Chapter 5 Planktonic Microalgae
Microalgal Vegetation in the Selected Mangrove Ecosystems of Kerala 114
which 21 were diatoms. There was one species each from Chlorophyceae,
Dinophyceae and Cyanophyceae.
None of the microalgae except Nitzschia closterium, Pleurosigma
aestuarii and Navicula mutica was present during all three seasons. This
indicates the steno-haline nature of these diatoms.
High population density during post monsoon was due to the
predominance of diatoms – Pleurosigma aestuarii, Nitzschia closterium,
Asterionella japonica, Chaetoceros brevis, and Navicula mutica. The
abundance of these algae during the post monsoon months with an average
temperature of around 290C indicates their thermophilic nature.
A comparatively high salinity, pH, temperature and light penetration
could be the favourable conditions for the growth of these micro algae (Mani
and Krishnamurthy, 1989). It has to be noted that two highest values of cell
density have been received in the year when the salinity levels were high, but
within the threshold limit of 21 ppt. Manna et al. (2010) reports similar results
from Sundarban mangroves.
The low abundance of phytoplankton during monsoon could be due to
the unusual stratification of water column, reduced salinity due to rain fall, high
turbidity, low temperature and low pH. Presence of fresh water algae during
monsoon shows a change in floral composition in accordance with change in
salinity due to the dilution or mixing of fresh water. Generally during the
monsoon, the floral composition will change in accordance with the lowering of
salinity in estuarine conditions (Gopinathan, 1972; Joseph and Pillai 1975; Gao
and Song, 2005). The only dinoflagellate noticed in the year was Ceratium
furca and according to Tailor et al. (2008), Ceratium spp. is the most abundant
dinoflagellate in tropical waters.
Chapter 5 Planktonic Microalgae
Microalgal Vegetation in the Selected Mangrove Ecosystems of Kerala 115
In 2004, the highest and lowest standing crop from station 1 was
recorded during monsoon and the figures were 3828 cellsL-1 and 847 cellsL-1
respectively.
The phytoplankton species encountered at station1 in 2004 was 25.
There were 22 species of diatoms and 3 chlorophyceaen members. No
cyanophyceaen and dinophycean species was encountered during this year. All
the three chlorophycean members were present during the monsoon, indicating
the reduction in salinity that occurred in the system. The highest average cell
abundance was noted during pre monsoon and lowest during post monsoon. In
this station, the highest concentration of standing crop was obtained during
monsoon and this could be due to the high silicate: nitrate ratio as suggested by
Piehler et al., (2004). Here the Si: N ratio was 34:1 which would have favoured
luxuriant growth of diatoms.
Selvaraj et al. (2003) while studying the seasonal variation of
phytoplankton and productivity in the surf zone and back waters at Cochin
observed a trimodal pattern in the cell count with peaks during October (POM),
January (POM) and April- May (PRM). The pattern observed in the present
study during 2003, can be taken as a bimodal one with peaks in October and
April.
At station 2 (Panangad), the highest cell density of 7342 cellsL-1 was
recorded during monsoon and the lowest of 534 cellsL-1 was recorded during
post monsoon in 2003. In 2004, the highest cell density of 11442 cellsL-1 was
recorded during monsoon and the lowest of 815 cellsL-1 during post monsoon.
It is evident that the result was different in station 2 on comparison with
station 1. Nitzschia closterium and Pleurosigma aestuarii were seen in large
numbers during this period. There was a single peak in cell count during each
Chapter 5 Planktonic Microalgae
Microalgal Vegetation in the Selected Mangrove Ecosystems of Kerala 116
year which was in contrast with the bi modal pattern observed in the first
station. Unlike in station 1, the highest individual and average values of cell
density were observed during monsoon. The biomass values represented by
chlorophyll concentration were also high during these peaks. In both the
occasions, salinity was comparatively low and the phytoplankton number was
contributed significantly by chlorophycean and cyanophycean members and by
those diatoms like Nitzschia and Pleurosigma that usually bloom during
monsoon. (Selvaraj et al., 2003).
There were 22 species of phytoplankton identified from station 2 during
2003 which showed distinct seasonal variations. Besides diatoms, there were
two Cyanophycean and two Chlorophycean species encountered in 2003 at this
station. Like in station 1, the diversity of species has increased during the
second year. The non diatom members were two Chlorophyceae, two
Cyanophyceae and one Dinophyceae.
High Si: N ratio appears to be the common factor present during the two
peaks which fell in two different seasons. While it was 0.031 in 2003, 0.176 in
2004. While salinity was as high as 18 ppt during the peak density in 2003, it
was 6.4 in 2004. This change in salinity is reflected in the floral composition.
Another important observation made at this station was the decrease in number
of cells with a high silicate value during one of the monsoon collections in
2003. According to Piehler et al. (2004), if the nutrient ratios go beyond an
optimum, it will adversely affect the distribution of micro algae and this could
be the reason for reduced number of cells with increase in concentration of
silicates.
The presence of Spirulina in station 1 and 2 deserves to be emphasized
due to its high nutritional significance.
Chapter 5 Planktonic Microalgae
Microalgal Vegetation in the Selected Mangrove Ecosystems of Kerala 117
At station 3 (Nettoor), there was a considerable increase in the standing
crop when compared to the other stations in all seasons in both the years.
However, the highest cell density was noticed during a collection in pre
monsoon and it read 28325 cellsL-1. The lowest value of 2473 cellsL-1 in this
station was obtained during post monsoon. While the highest cell density in
2004 was recorded during monsoon (20942 cellsL-1), the lowest was recorded
during pre monsoon (2873 cellsL-1)
The high values of cell density irrespective of the season point to the
favourable conditions that are extended by the station to the plankton growth.
The station was having stable environment with good water quality. The
optimum salinity and high Si: N ratio could be the reasons for high diversity
and density of phytoplankton observed in the study during pre monsoon
(summer). High macroalgal densities during summer were recorded by
Nedumaran and Perumal in 2009 while studying the temporal and spatial
variation in the structure of macroalgal communities associated with mangroves
of Pichavaram. Nedumaran and Prabhu (2009) made similar observations for
microalgae at Pichavaram mangrove waters.
In 2004, the nitrate concentration was exceptionally high and the ratio
between Si and N was high in monsoon. This could be the reason for high cell
number. Even though the cell density was high, the species richness was low,
with only 18 diatoms, during this period. This could be due to low salinity.
Another important observation made at station 3 was that there occurred
a considerable decrease in the standing crop when the salinity value exceeded
21 ppt. This is in agreement with the findings of Manna et al., (2010) in
Sundarban mangroves, which states that a threshold in biomass production of
phytoplankton is reached at salinity level around 21 ppt. Two samples taken at
Chapter 5 Planktonic Microalgae
Microalgal Vegetation in the Selected Mangrove Ecosystems of Kerala 118
a salinity of 20.5 ppt also showed reduction in phytoplankton density and these
are the only occasions when cell count went below a moderate level at station 3.
It can therefore be inferred that salinity acts as a limiting factor of cell density
in station 3.
A total of 38 microalgae were observed in this station out of which 31
were diatoms. In 2003, it was 23 diatoms + 3 Chlorophyceae + 1 Cyanophyceae
+ I dinoflagellate. The class composition during 2004 was 23 diatoms + 1
Cyanophyceae + 1 Dinoflagellate. The Cyanophycean members Phormidium
and Microcystis made their appearance during this study in this station.
Cyanobacteria, a group of photosynthetic prokaryotes, are vital components of
the microbiota which functions as a source of nitrogen in every mangrove
ecosystem (Kathiresan and Bingham, 2001). This is one of the ignored groups
where only a very few studies have been conducted. Their ability to fix
atmospheric nitrogen make them natural candidates for future reforestation and
rehabilitation of destroyed mangroves (Bashan et al., 1998). Nedumaran et al
(2009) have enumerated both Phormidium and Microcystis from Pichavaram
mangroves.
At station 4 (Puthuvaipu), there was clear seasonal variation in cell
density with the highest value during monsoon. The average cell density in the
station during monsoon in 2003 was 47762 cellsL-1. The lowest cell abundance
of 364 cellsL-1 was recorded during post monsoon. During the next year, the
highest density was recorded during monsoon (31765 cellsL-1) with a seasonal
average of 18357 cellsL-1. The lowest value of 421 cellsL-1 was recorded during
post monsoon.
Here, the highest standing crop in both the years was recorded during
monsoon and lowest in post monsoon. The seasonal variation is clearly evident
Chapter 5 Planktonic Microalgae
Microalgal Vegetation in the Selected Mangrove Ecosystems of Kerala 119
and the high standing crop during monsoon could be due to the entry of high
amount of nutrients into the ecosystem. Majority of the phytoplankton, number
wise, were diatoms with good representation from chlorophyceae and
cyanophyceae. There was a high Si: N ratio on both occasions of high standing
crop. Out of the 33 species of planktonic microalgae, 26 were diatoms. Three
dinoflagellates were identified from this station- Ceratium, Protoperidinium
and Gymnodinium. According to Subramaniyan (1971) and Gopinathan (1972),
Protoperidinium are abundant in Indian waters. The appearance of this
flagellate in this station could be due to its closeness with the sea. An
observation similar to that made by Essien et al. (2008) in the Qua Iboe estuary
mangrove swamp of Nigeria, was made from this station. Centric diatoms like
Coscinodiscus centralis, C. eccentricus, C. marginata, Thalassiosira subtilis
and Triceratium favus along with green algae- Chlorella and Cosmarium and
blue green alga- Nostoc punctiforme were encountered at this station during
monsoon. Essien encountered some centric diatoms including the above ones
and some green and blue green algae in greater numbers during the wet season.
The presence of fresh water alga, Cosmarium is an indication of low salinity
(average 4ppt) associated with diluting influence of rain water and flooding.
The presence of Melosira numuloides in the station need special mention since
the centrale isolated from the mangrove forests of Xuanthuy National park has
been found to possess high amounts of poly unsaturated fatty acids (Hoa et al.
2010).
In the first year, at station 5, Murikkinpadam, the trend was different
with one of the pre monsoon collections showing the highest cell density of
35894 cellsL-1, the average seasonal cell density being 20892 cellsL-1. The
lowest cell density of the station was recorded during post monsoon and the
abundance was 922 cellsL-1. In the second year, however, the monsoon density
Chapter 5 Planktonic Microalgae
Microalgal Vegetation in the Selected Mangrove Ecosystems of Kerala 120
of cells was very high compared to other seasons and a figure of 67324 cellsL-1
was obtained in one of the collections. The lowest density of 606 cellsL-1 was
obtained during post monsoon. A total of 29 species were identified from this
station, diatoms leading the table with a strength of 24 members. Asterionella
japonica, three species of Coscinodiscus, Bacillaria paradoxa, Licmophora
juergensii, Gyrosigma tenuissimum and Navicula muticum were abundant in
both the years.
Occurrence of 16 species of planktonic microalgae during the
premonsoon in the first year of this study needs to be highlighted. In a similar
study conducted at the Sundarbans, Manna et al. (2010) observed a decline in
diversity index and phytoplankton biomass during the pre monsoon season. On
analyzing the hydrographic parameters prevailed in the station during that
premonsoon period, it is found that the temperature and salinity were
moderately high and the hydrogen ion concentration was slightly alkaline. This
points to the fact that these microalgae present during the summer (pre
monsoon) were thermophilic and euryhaline - many of them were not present in
the monsoon - in nature. The concentration of nutrients was uniform and no
unusual fluctuations were noticed. This points to the stability of the system and
the uniform utilization of nutrients by the different floral components. High
summer biomass of phytoplankton as noticed here, was earlier reported by
Nedumaran and Prabu (2009) in the Pichavaram mangroves.
The least cell density and species richness were noted at Station 6. There
were only 22 species of planktonic microalgae identified from this station.
Nitzschia sigma, Nitzschia closterium, Navicula henneidyi and Gyrosigma
tenuissimum were the dominant species. Mangalavanam has become a highly
polluted area due to anthropogenic activities and due to the release of industrial
effluents. The acidity to the soil brought by the faecal matter of the permanent
Chapter 5 Planktonic Microalgae
Microalgal Vegetation in the Selected Mangrove Ecosystems of Kerala 121
and migratory bird community adds to its hostility. Excessive abundance of
Navicula (3 species), Nitzschia (3 species) and centrales like Thalasiosira and
Cyclotella striata is an indication of the degree of pollution that threatens even
the existence of this patchy mangrove pocket. Diatoms have been used as
indicators of pollution from very old days and it was Kolkwitz and Marsson
(1908) who pioneered this aspect of diatom study. Munawar (1970) reported
that diatoms like Navicula, Pinnularia and Nitzschia develop profusely in
waters rich in pollution of animal origin and the abundant presence of two of
them in Mangalavanam supports this view. Disappearance of Achnanthes and
presence of Nitzschia had been reported by Schoeman (1976) as an indication
of anaerobic condition while studying diatoms as indicator groups in the
assessment of water quality in a river system in South Africa. The same
observation in the present study confirms the hypoxic condition that prevails in
the Mangalavanam mangroves.
Overall, 72 planktonic microalgae were identified from the six mangrove
ecosystems studied during 2003-2004. They belong to 42 genera and 4 classes,
viz. Bacillariophyceae, Chlorophyceae, Cyanophyceae and Dinophyceae. While
there were 30 genera from Bacillariophyceae, 5 were from Cyanophyceae, 4
from chlorophyceae and 3 from dinophyceae. Bacillariophyceae dominated the
planktonic microalgae in all the mangrove ecosystems studied. Out of the 72
species, 57 were diatoms (79.16%), followed by blue greens with 7 species
(9.72%), green algae with 5 species (6.94%) and Dinophyceae with 3 species
(4.16%). Among the diatoms, Navicula was represented by 8 species, Nitzschia
by 5 species, and Amphora and Coscinodiscus with 4 species each. All these
genera represented by more species are usually encountered in coastal waters
(Van den Hock et al. 1995., Tomas, 1997). Among Dinophyceae, there were
three genera each represented by one species. These were Ceratium furca,
Chapter 5 Planktonic Microalgae
Microalgal Vegetation in the Selected Mangrove Ecosystems of Kerala 122
Gymnodinium and Protoperidinium. Oscillatoria which is reported by
Desikachary (1959) and Thajudin and Subramanyan, (2005) as common species
found in both fresh water and marine habitats in India, was encountered (3
species) during this study. Chlorophycean members appeared in all the stations
during monsoon. Though appeared mainly during monsoon, some blue greens
like Phormidium and Oscillatoria were present during post monsoon also. This
is in contradiction to the findings of Gowda et al. (2001) who reported that blue
green algae are practically nil during monsoon and post monsoon in Netravathy
estuary.
5.4.1 Pigments
5.4.1.1Chlorophyll a:
In 2003, concentration of chlorophyll a showed wide fluctuations, both
seasonally and spatially. The pre monsoon values were quite low and values of
post monsoon were slightly higher than pre monsoon. In the next year, the peak
chlorophyll a concentration was found at station 3, in the monsoon and post
monsoon.
Chlorophyll a values were low at station 1, 3 and 6 and were
comparatively low at station 5 during monsoon in 2003. Even though the
highest chlorophyll a value at station 2 was recorded during monsoon, it also
was a moderate value. This indicates a general trend of low chl.a value in
monsoon. The reduction in chlorophyll values during south west monsoon may
be due to dilution of water due to the entry of fresh water, which causes high
turbidity and low light availability. This view is supported by the observations
made by Raj kumar et al. (2009), Kawabata et al. (1993), Godhantaraman
(2002), and Rajasekhar et al.(2005). However, there were two monsoon peaks
of chlorophyll a, one each at station 4 and 5. Both were not during the peak
Chapter 5 Planktonic Microalgae
Microalgal Vegetation in the Selected Mangrove Ecosystems of Kerala 123
monsoon and hence the turbidity of water was less and the salinity was not too
low. Nutrient rich land run off might also have contributed to the high
chlorophyll a value during monsoon. There were high values of chlorophyll a
during pre and post monsoon at station 3. It was the station that recorded
highest species richness and density. This was a station with optimum salinity
and high SI: N ratios that favour microalgal growth and these could be the
reasons for high chlorophyll a value.
In 2004, there was one peak concentration of chlorophyll a during
monsoon at station 5. Low chlorophyll a values irrespective of the season were
noted at station 6, and this could be due to the high rate of pollution at that
station. Since it is a sheltered station, there was not much seasonal variation
also.
The seasonal average of chlorophyll a values in 2003 were: 49.68 µgL-1
during pre monsoon, 58.51 µgL-1 during monsoon and 26.84 µgL-1 during post
monsoon. In 2004, the values were 24.6 µgL-1, 48.15 µgL-1 and 25.04 µgL-1
respectively.
Raj Kumar et al. (2009) have estimated a chlorophyll a value ranging
between 0.24 µgL-1 - 69.82 µgL-1, 0.20 µgL-1 - 105.60 µgL-1, and 0.20 µgL-1
to 94.80 µgL-1 in three stations of Pichavaram mangroves.
The surf water off Gopalpur, in the Bay of Bengal, chlorophyll a was
found between 3.31 to 99.12µgL-1 (Panigraphy et al., 2006). The concentration
of surface chlorophyll a varied between 0.21 to 30.82µgL-1 off Mangalore, west
coast of India (Lingadhal et al., 2003). The highest chlorophyll a value
observed during the post monsoon off Cape Comorin was 8.28µgL-1
(Gopinathan et al., 2001).
Chapter 5 Planktonic Microalgae
Microalgal Vegetation in the Selected Mangrove Ecosystems of Kerala 124
The highly seasonal nature of monsoon rains and the associated land
runoff and nutrient loading determines the balance of organic to inorganic
loadings which act as major factors controlling community responses of
microalgae (Hopkinson and Vallino 1995).
Another observation made during this study was that there was a trend of
high chlorophyll a values during the post monsoon climatic conditions. Some of
the high chlorophyll a values noted are:
104.44 µgL-1 October, 2003 Station 1
100.26 µgL-1 February, 2003 Station 3
82.58 µgL-1 December, 2003 Station 3
167.64 µgL-1 August, 2003 Station 4
264.2 µgL-1 March, 2003 Station 5
128.8 µgL-1 September, 2004 Station 5
While the first three were in the post monsoon season itself, the other
three were either during the last phase of monsoon or during the first phase
premonsoon. This observation goes in tune with that of Manna et al. (2010).
While studying the dynamics of Sundarban mangrove ecosystem, the authors
observed high chlorophyll a concentrations during the winter months which
correspond to the post monsoon season of this study. As explained by Jones et
al. (1982), this could be due to the eutrophic conditions prevailed during post
monsoon.
Pearson correlation analyses reveal high degree of correlation of
chlorophyll a with chlorophyll c, active chlorophyll and standing crop. The
correlation was significance at 0.01 level. Three way ANOVA with stations,
seasons and year showed significant variation with stations (p value was 0.038
Chapter 5 Planktonic Microalgae
Microalgal Vegetation in the Selected Mangrove Ecosystems of Kerala 125
while the reference value is .05). However, no significant variation was noticed
with season or year. The annual average of chlorophyll a varied from 37.74
µgL-1to 227.69 µgL-1between stations. The seasonal average calculated for the
different seasons in 2003 are 49.68 µgL-1 (PRM), 44.54 µgL-1 (MON) and
26.84 µgL-1 (POM). In 2004, the respective values were 24.63 µgL-1, 48.15
µgL-1, and 25.04 µgL-1. The high chlorophyll a values obtained for monsoon
season may be the result of nutrient rich land run off from the adjacent areas.
5.4.1.2 Chlorophyll b:
It was only in station 4 that chl. b was detected during all three climatic
seasons in 2003. A chl.b value as high as 13.6 µgL-1 was recorded from this
station during monsoon. Even though presence of chlorophyll b is an indicator
of chlorophyceae, no chlorophycean member could not be enumerated in
stations 2 ad 6 even when chlorophyll b was there. A relatively high chlorophyll
b indicates the presence of ultra or nano-planktonic microalgae coming under
the class Chlorophyceae /Euglenophyceae /Prochlorophyceae, (Van den Hoek
et al. 1995) in these stations which could not be counted using a Sedgewick-
Rafter counting cell. Pre and post monsoon concentrations of chlorophyll b
were substantially negligible in all stations. The high abundance of
chlorophyceae during monsoon at station 3 emphasizes the origin of chl.b from
this group of algae.
Another important observation was that the station which recorded high
concentration of chl.b also recorded high values of chlorophyll a. Gopinathan et
al. (2001) while studying the concentrations of chl. a and chl.b in the west coast
of India has noticed that there is a positive correlation between chlorophyll a
and b as noticed in the present study. High values of chlorophyll b observed at
Chapter 5 Planktonic Microalgae
Microalgal Vegetation in the Selected Mangrove Ecosystems of Kerala 126
Calicut and Wadge Bank area of the south west coast and off Goa and Mumbai
coincided with high concentrations of chlorophyll 'a'.
Though chlorophyll b is considered to be an accessory photosynthetic
pigment of chlorophyll a, its concentration is significant for assessing the
fertility of the area.
In 2004, high concentration of chl.b was observed in stations 1, 2, 3
during monsoon and this could be due to the favourable conditions developed in
these stations for the growth of chlorophycean members during monsoon.
Salinity in these stations ranged between 5 and 8 and this low salinity could
have encouraged the growth of green algae like Chlorella, Cosmarium and blue
greens like Oscillatoria. These three stations are located away from sea when
compared to the others and this could be the reason for low salinity.
Chlorophyll b showed negative correlation with temperature, salinity and pH.,
however it was having significant positive correlation with the concentration of
silicates, with the level of correlation at 0.01 level. Three way ANOVA
showed significant variation only with the year, the p value being 0.005.
5.4.1.3 Chlorophyll c:
In station 3 there was a clear reduction in the amount of chlorophyll c
during monsoon in 2003. This could be due to the decreased abundance of
diatoms in low salinity conditions.
There were some high chl.c values in station 4 and 5. These are the
stations nearer to the sea and naturally salinity is comparatively high in these
stations. This might have caused an increase in the number of diatoms. Standing
crop is very high in accordance with the hike in chl.c concentration in these
stations.
Chapter 5 Planktonic Microalgae
Microalgal Vegetation in the Selected Mangrove Ecosystems of Kerala 127
It is evident that chlorophyll c is a major accessory pigment of diatoms
(Hendey, 1964, van den Hoek et al., 1995) and hence it would increase when
the standing crop of diatoms increased and vice versa.
Seasonal variation of chl. c was evident in 2004 also. Its low
concentration always matches with the decreased abundance of diatoms.
Analysis of variance showed no significant variation with station, season or
year. Chlorophyll c showed 0.01 level of correlation with chlorophyll a,
standing crop and dissolved oxygen, which is a sign of diatom abundance in the
standing crop.
5.4.1.4 Carotenoids:
Presences of carotenoids have been recognized at all stations during all
seasons and they exhibited distinct spatial variations. In both the years, its
concentration was comparatively higher in stations 4 and 5. These were the
stations with high diatom abundance which was supported by high salinity.
These are the stations close to the sea.
The major pigment in the carotenoids was fucoxanthin, which is the key
accessory pigment for diatoms. During monsoon, the abundance of diatoms was
comparatively lower except in station 4 and 5 and hence the concentrations of
carotenoids were also found to be lower. No prominent variation was found
during pre and post monsoon.
The seasonal variation of pigment concentration was prominent during
the entire period of study. The Pearson Correlation analyses have shown that
the pigments are having significant positive correlation with each other at 0.01
level. The most significant correlation was shown between chlorophyll a and c
(0.908) and between chlorophyll c and carotenoids (0.833). This also confirms
high diatom abundance. Lingadhal et al., (2003), noticed a positive correlation
Chapter 5 Planktonic Microalgae
Microalgal Vegetation in the Selected Mangrove Ecosystems of Kerala 128
between chlorophyll pigments in the selected light depths off Mangalore, west
coast of India.
Another important correlation was between chlorophyll a and standing
crop. These were highly correlated with a coefficient of 0.779, which is far
above the p value of 0.05.
It can be summarized that when standing crop increases, chlorophyll a
also increases and vice versa. Present investigation is supported by several
studies worldwide (Gu et al., 1995; Balkis, 2003; Huang et al., 2004; Aktan et
al., 2005).
5.4.2 N:P and Si:N ratios and relationships with standing crop and
chlorophyll a.
Predicting phytoplankton dynamics and devising management strategies
in estuarine waters often involves the use of stoichiometric relationships of
inorganic nutrient concentrations (Piehler et al., 2004). The so called Redfield
ratio (Redfield, 1934), 106 C: 16N: 1P (by atoms) has long been used as a
canonical value to predict phytoplankton- nutrient limitation in aquatic
ecosystems (Falkowski, 2000). According to Aktan et al., (2005) the total
nitrogen and total phosphorus availability leads to the minimal N:P ratios under
in the theoretical assimilation ratio of 16:1 for the world’s oceans.
In the present study, the N: P ratios were very low with the highest value
of 2.021 recorded at one of the stations in 2003. Aktan et al, (2005), in their
study conducted in Izmit Bay, Turkey. reported that N:P ratio would vary from
8.2 to 45 depending on ecological conditions and further stated that the
Redfield N:P ratio of 16 is not a biochemical optimum but represents an
average of species-specific N:P ratios. It is also noted that recent research on
Chapter 5 Planktonic Microalgae
Microalgal Vegetation in the Selected Mangrove Ecosystems of Kerala 129
algal physiology elucidate that the structural N: P ratio is species specific
(Klausmeler et al., 2004).
Another important aspect of nutrient relation was Si:N ratio which if less
than 1 will limit the growth of diatoms according to Piehler et al. (2004). The
coastal and estuarine waters along the southwest India prevails a comparatively
higher Si: N ratio during 2005-08 which promoted the abundance of diatoms
species (Sanilkumar, 2009, Sanilkumar et al., 2009) In the present study, this
ratio was always higher ranging from 4.71 to 16.86 in 2003 and 5.54 to 30.55 in
2004 and favoured the growth of diatoms.
5.4.3 Primary Productivity:
Mangrove areas are among the most productive ecosystems of the world.
The average rate of production of organic material according to Kathiresan
(1995) is 29g/m2/day and the annual litter fall normally ranges from 10000 to
14000 Kg. dry weight per hectare.
This is in agreement with the findings of Klaus Gocke et al. (2001) while
studying the planktonic primary production in a tidally influenced mangrove forest
on the pacific coast of Costa Rica. Here, the NPP was significantly high during dry
seasons than during the peak of monsoon. The annual NPP was 278 gC/m2.
According to Rajagopalan et al. (1986), the productivity values of
mangroves of Cochin back waters ranged from 0.37 to 1.37 g.C./m3/d with an
annual average production rate of 0.66 g.C./m3/d while the highest values
reached upto 2.15 g.C./m3/d.
As per the studies conducted by Selvaraj (2000), the seasonal average
primary productivity values in the waters of Godavari mangrove ecosystem
around Kakinada (Andhra Pradesh) ranged from 0.25 to 0.75 g. C/m3/d with the
mean value of less than 0.5 gC/m3/d although the highest value at some areas
Chapter 5 Planktonic Microalgae
Microalgal Vegetation in the Selected Mangrove Ecosystems of Kerala 130
reached upto 2.5 gC/m3/d; In the Pichavaram mangrove waters (Tamil Nadu),
the seasonal averages ranged from 0.36 to 3.3 g.C/m3/d with the mean value of
1.67 gC/m3/d while the highest value reached upto 5.3 gC/m3/d; And In the
Dharmadam estuarine waters associated to the mangroves (Kerala State), the
seasonal average values ranged from 0.24 to 1.14 gC/m3/d with the mean
production rate of 0.63 gC/m3/d and the highest value reaching upto 2.07
gC/m3/d in summer months.
For Pichavaram mangroves on the east coast, Krishnamurthy and
Sundararaj (1973) have given an average primary production rate of 7.5
gmC/m3/day, indicating high production in the ecosystem.
Regarding the primary productivity of the mangrove associated waters,
Gopinathan and Rajagopalan (1983) have reviewed the productivity potential of
the Andaman-Nicobar mangrove zones. According to them, the values ranged
from 0.2 to 0.8 g. C/m2/day in the Northern Andamans, slightly higher values of
0.5 to 1.0 gC/ m2/day in the shallow mud flats and mangrove zone of Car-
Nicobar and very high production rate of 2.0 to 3.6 gC/m2/day recorded in and
around the mangroves of Port Blair.
While studying the nutrient and phytoplankton dynamics in two
mangrove tidal creeks of the Indus river delta, Pakistan, Harrison et al.(1997)
reported a primary productivity that ranged from 0.15 to 1 gm carbon /m2/ day
in Isaro creek. These authors also reported low productivity during monsoon.
As such different values have been presented by different authors for the
primary productivity of mangrove associated waters in different areas. It is
interesting to note that entirely different values have been presented by different
authors for the same area and this might be due to the different methods
adopted for the same study.
Chapter 5 Planktonic Microalgae
Microalgal Vegetation in the Selected Mangrove Ecosystems of Kerala 131
In the present study, the monthly net primary productivity of the selected
stations showed a high degree of scattering. In 2003, the seasonal average of
productivity was low during monsoon when compared to the other two seasons.
The average seasonal productivity values for the year were 2.193 gC/m3/day
(pre monsoon), 0.9206 gC/m3/day (monsoon) and 1.112 gC/m3/day (post
monsoon). The unusual hike in chlorophyll values, especially during monsoon
(e.g. August, 2003) was not proportionately reflected in the primary
productivity values. This may be due to the origin of chlorophyll from detritus
and from partly dead cells in suspension, resulting from sudden changes in the
hydrographic components. Primary productivity in mangrove ecosystems of
Cochin back waters, in terms of the total number of cells showed strong
seasonal trends even though generalizations are not possible due to spatial
differences. The mean spatial values of primary productivity in 2003 ranged
from 3.126 + 2.56 gC/m3/day recorded at station 3 to 0.7576 + 0.2180
gC/m3/day recorded at station 5. The mean planktonic primary productivity
value for the entire mangrove stations studied can be arrived at 1.4088 + 0.870
gm C/m3/day or 514.212+ 317.55 gm C/m3/year. In the second year the mean
productivity values for the different stations ranged from 3.9426 + 1.75 gm
C/m3/day recorded for station 3 to 0.21 + 0.095 gm C/m3/day recorded for
station 2. The mean planktonic primary productivity value for the entire
mangrove stations studied becomes 2.2576 + 1.358 gC/m3/day or 824.024 +
495.67 gC/m3/year.
This clearly shows the significance of plankton productivity in the
mangrove ecosystem which has usually been neglected. Any productivity
estimate of mangrove ecosystem should therefore invariably include the
contribution of planktonic algae present in the system.