Embed Size (px)
Citation preview

Planet Data - North Pole
Case studies related to Norwegian Open Data
1Dumitru Roman, 2David Norheim, 3Magnus Stuhr
1SINTEF, 2Computas AS, 3University of Bergen [email protected], [email protected], [email protected]
1

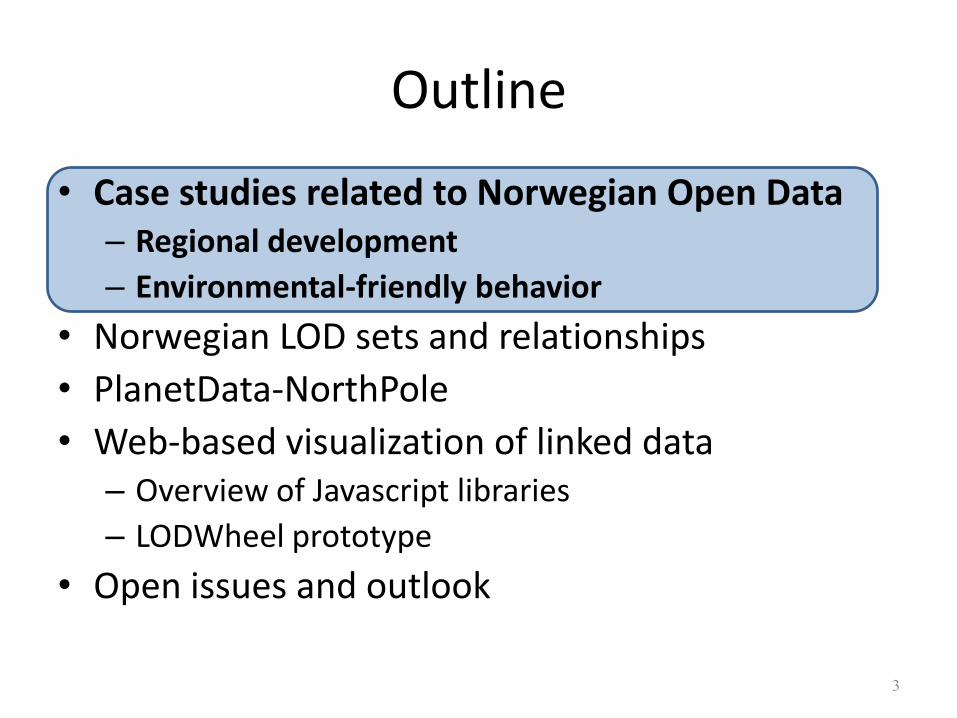
Outline
• Case studies related to Norwegian Open Data – Regional development
– Environmental-friendly behavior
• Norwegian LOD sets and relationships
• PlanetData-NorthPole
• Web-based visualization of linked data – Overview of Javascript libraries
– LODWheel prototype
• Open issues and outlook
2
Outline
• Case studies related to Norwegian Open Data – Regional development
– Environmental-friendly behavior
• Norwegian LOD sets and relationships
• PlanetData-NorthPole
• Web-based visualization of linked data – Overview of Javascript libraries
– LODWheel prototype
• Open issues and outlook
3
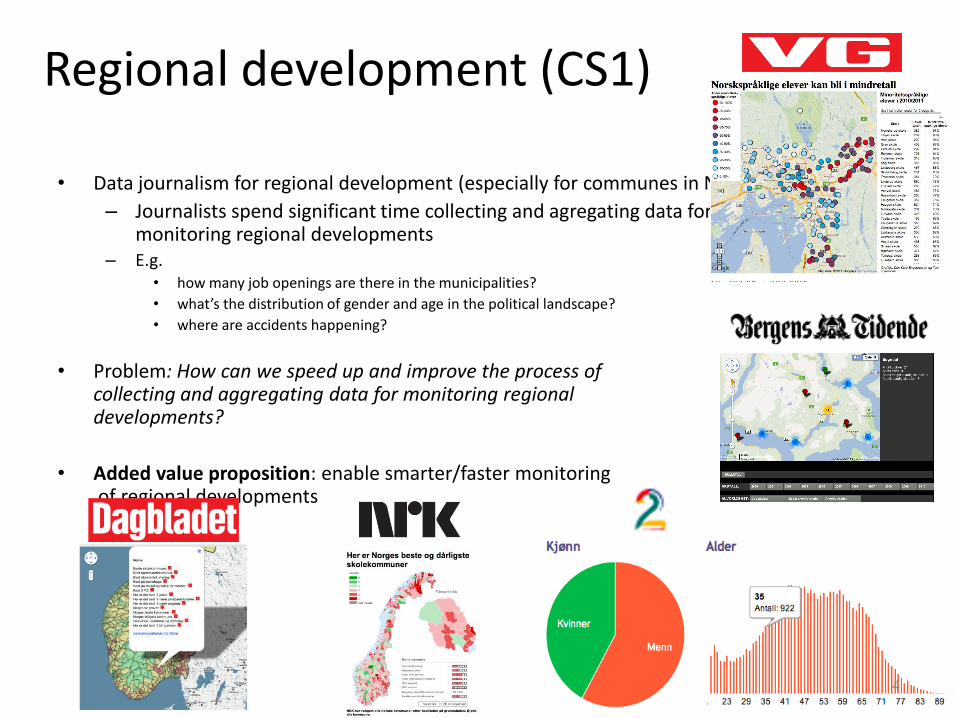
• Data journalism for regional development (especially for communes in Norway)
– Journalists spend significant time collecting and agregating data for analysing trends and monitoring regional developments
– E.g. • how many job openings are there in the municipalities?
• what’s the distribution of gender and age in the political landscape?
• where are accidents happening?
• Problem: How can we speed up and improve the process of collecting and aggregating data for monitoring regional developments?
• Added value proposition: enable smarter/faster monitoring of regional developments
Regional development (CS1)
4

”The death roads”

http://www.dagbladet.no/kommuneborsen/
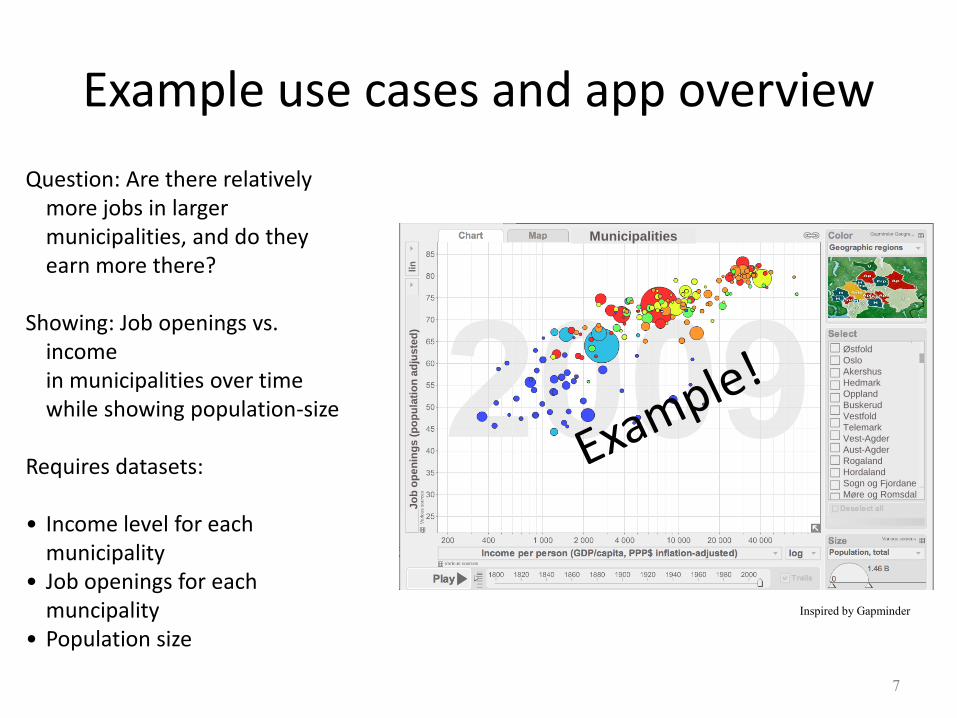
Example use cases and app overview
7
Østfold
Oslo
Akershus
Hedmark
Oppland
Buskerud
Vestfold
Telemark
Vest-Agder
Aust-Agder
Rogaland
Hordaland
Sogn og Fjordane
Møre og Romsdal
Jo
b o
pe
nin
gs
(p
op
ula
tio
n a
dju
ste
d)
Municipalities
Inspired by Gapminder
Question: Are there relatively more jobs in larger municipalities, and do they earn more there?
Showing: Job openings vs.
income in municipalities over time while showing population-size
Requires datasets: • Income level for each
municipality • Job openings for each
muncipality • Population size
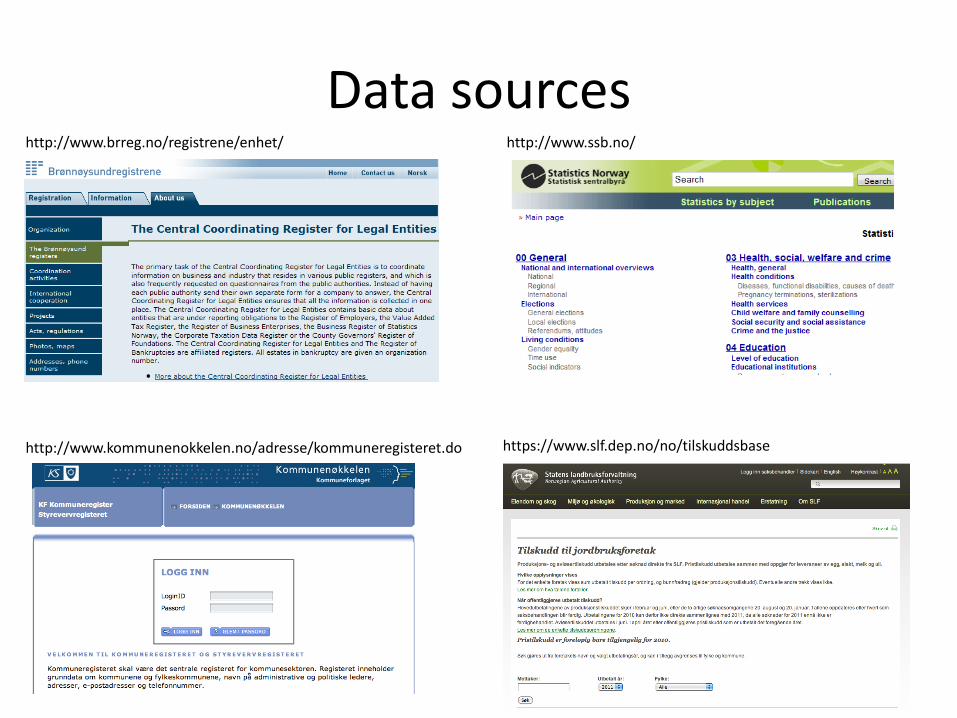
Data sources http://www.brreg.no/registrene/enhet/ http://www.ssb.no/
8
http://www.kommunenokkelen.no/adresse/kommuneregisteret.do https://www.slf.dep.no/no/tilskuddsbase

Environmental-friendly behavior (CS2)
• Get from location A to location B in a town/region (focus on Oslo or Bergen)
• Typically different options – Public transportation (bus/tram/metro/train)
– Privat car, sharing car, electric car, taxi
– Cycling, walking
• Sometimes constraints on trip – Time
– Aviod bad weather, polluted zones
• Problem: Faced with different options for a trip, which are the most envionmental-friendly options given the constraints? – Environmental parameters: CO2 emissions, energy efficiency
• Added value proposition: enable smarter/faster environmental-freindly decision making for local trips when options are available
9
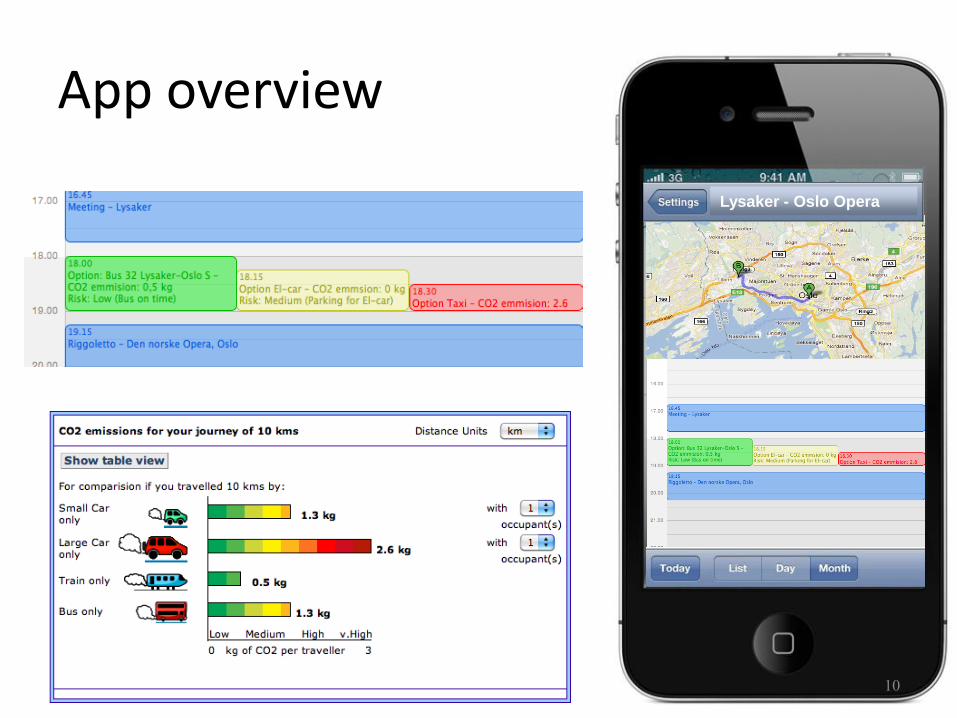
App overview
10
Lysaker - Oslo Opera
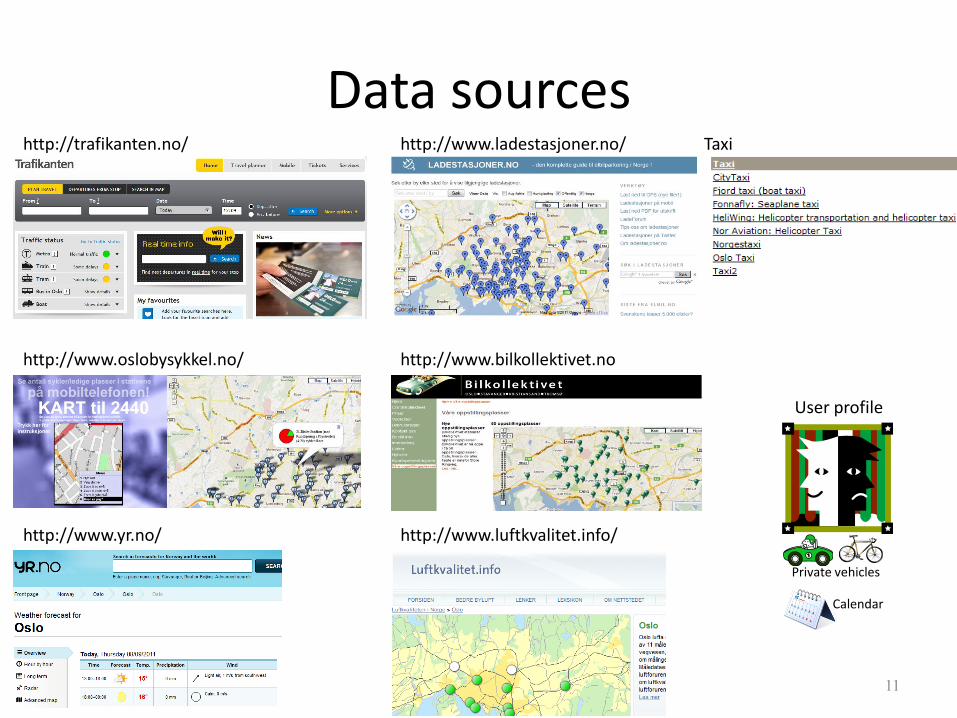
Data sources
http://www.oslobysykkel.no/
http://trafikanten.no/ http://www.ladestasjoner.no/
http://www.bilkollektivet.no
Taxi
http://www.yr.no/ http://www.luftkvalitet.info/
User profile
Private vehicles
Calendar
11
Outline
• Case studies related to Norwegian Open Data – Regional development
– Environmental-friendly behavior
• Norwegian LOD sets and relationships
• PlanetData-NorthPole
• Web-based visualization of linked data – Overview of Javascript libraries
– LODWheel prototype
• Open issues and outlook
12
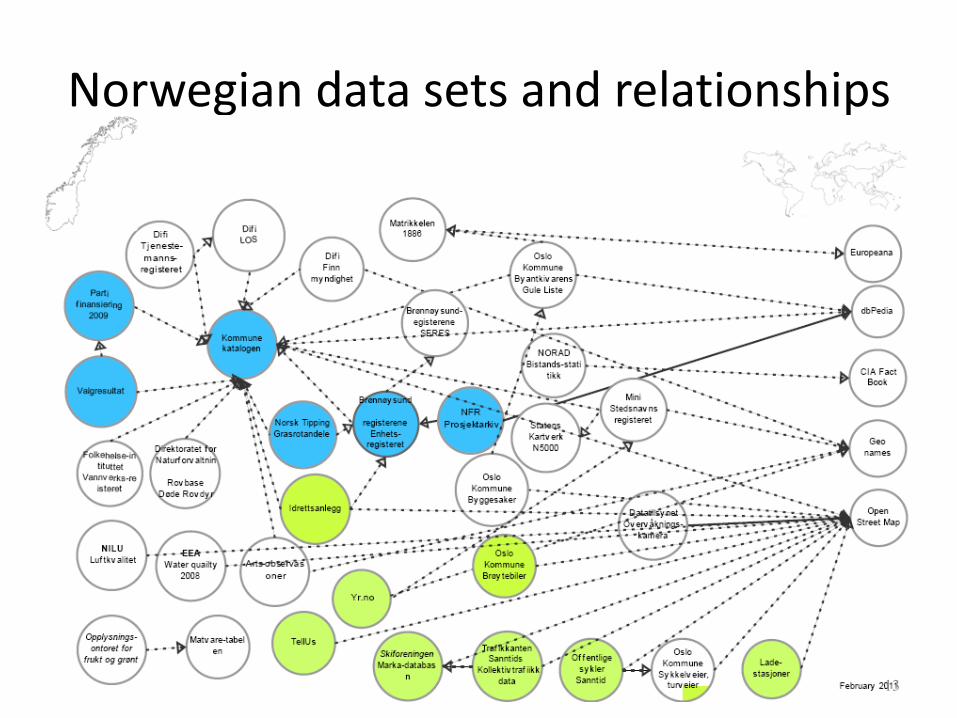
Norwegian data sets and relationships
13

Relevant Norwegian data sets for the proposed case studies
Name Owner Format Hosting Estimated # of
triples
Quality
(stars)
Case study
applicability
Enhetregisteret Brønnnøysundregisterene Restful RDF
Web service
Brønnøysundregisterene > 4.500.000 5 Case study #1
Kommunekatalogen KS XML Univ of Oslo / Semicolon II Ca 2.000 3 Case study #1
NFR prosjektarkiv Norwegian Research
Council
RDF Computas/ Sesam4 Ca 200.000 5 Case study #1
Valgresultat 2005 Government RDF Computas/ Semicolon II Ca 100.000 4 Case study #1
Partifinansiering 2009 Government RDF Computas/ Semicolon II Ca 100.000 4 Case study #1
Grasrotandelen Norsk Tipping RDF Computas/ Semicolon II Ca 70.000 4 Case study #1
Trafikkanten sanntid Oslo Kommune XML, JSON Oslo Kommune or Computas Ca 50.000 3 Case study #2
Yr.no Met. Inst. XML Univ of Oslo / Semicolon II Ca 700.000.000 3 Case study #2
Markadatabasen sanntid Skiforeningen XML Oslo Kommune or Computas Ca 100.000 3 Case study #2
Offentlige sykler sanntid ClearChannel XML Oslo Kommune or Computas Ca 10.000 3 Case study #2
Sykkelveier, turveier Oslo Kommune XML Oslo Kommune or Computas Ca 10.000 3 Case study #2
Ladestasjoner (Sanntid) Ladestasjoner.no RDF Computas/ Semicolon II Ca 1.100 3 Case study #2
Brøytebiler Sanntid Oslo Kommune XML Oslo Kommune or Computas Ca 10.000 3 Case study #2
Tellus Tellus RDF Computas/Sesam4 Ca 600.000 3 Case study #2
Idrettsanlegg Ministry of Culture RDF Computas/Sesam4 Ca 1.000.000 3 Case study #2 14

Outline
• Case studies related to Norwegian Open Data – Regional development
– Environmental-friendly behavior
• Norwegian LOD sets and relationships
• PlanetData-NorthPole
• Web-based visualization of linked data – Overview of Javascript libraries
– LODWheel prototype
• Open issues and outlook
15
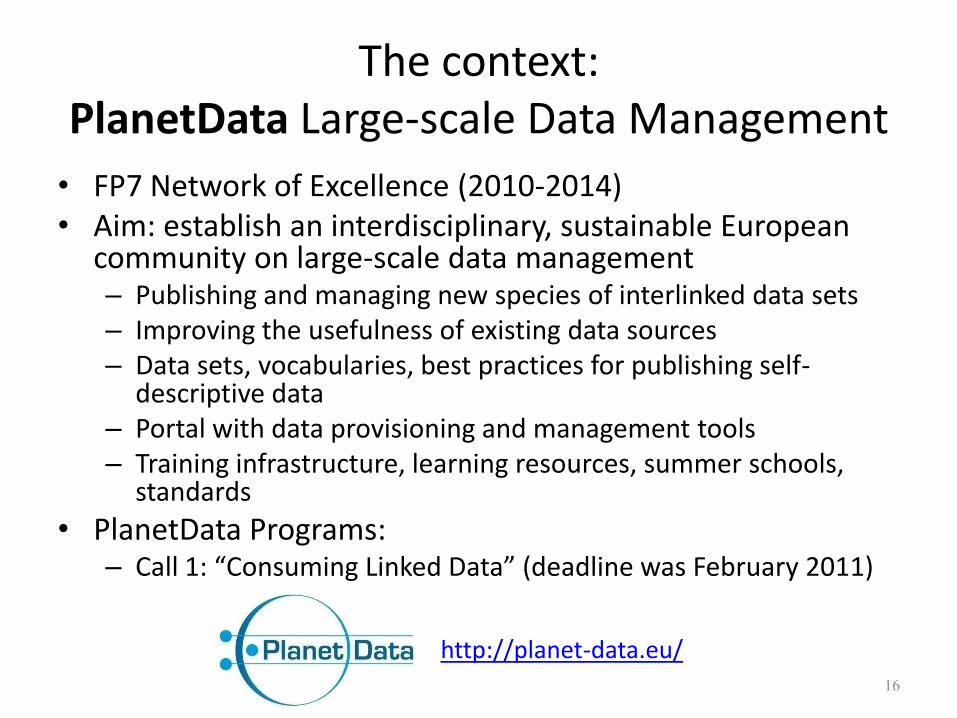
The context: PlanetData Large-scale Data Management
• FP7 Network of Excellence (2010-2014) • Aim: establish an interdisciplinary, sustainable European
community on large-scale data management – Publishing and managing new species of interlinked data sets – Improving the usefulness of existing data sources – Data sets, vocabularies, best practices for publishing self-
descriptive data – Portal with data provisioning and management tools – Training infrastructure, learning resources, summer schools,
standards
• PlanetData Programs: – Call 1: “Consuming Linked Data” (deadline was February 2011)
http://planet-data.eu/
16

PlanetData-NorthPole Consuming and Improving Norwegian Linked Open Data for Regional
Development and Environmental Friendly Behavior
The objectives of PlanetData-NorthPole are:
1.To specify and implement two case studies for demonstrating the use and benefits of LOD in regional development and environmental friendly behaviour, with a particular localization on Norway; 2.To improve the existing Norwegian LOD and extend it with new data sets to support the proposed case studies;
3.To provide guidelines for other countries in the use of LOD for regional development and environmental friendly behaviour applications.
Task 1.1: Case studies requirements specification
Task 1.2: Prototypes design and development
Task 1.4: Guidelines, Dissemination, and Exploitation
Task 2.1: Linking and quality assurance of
existing Norwegian LOD
Task 2.2: Extending and linking the Norwegian
LOD with new data sets
• Participants:
– Computas AS
– SINTEF
• Duration: 6 months
• Oct 2011 – March 2012
• Budget: approx 120K Euro Task 1.3: Validation and experimentation
17
Outline
• Case studies related to Norwegian Open Data – Regional development
– Environmental-friendly behavior
• Norwegian LOD sets and relationships
• PlanetData-NorthPole
• Web-based visualization of linked data – Overview of Javascript libraries
– LODWheel prototype
• Open issues and outlook
18

Web-based visualization of RDF data
• Aim: graph- and chart-based Web visualization techniques for RDF to support PlanetData-NorthPole case studies
• Contributions:
– Evaluation of state-of-the-art libraries/tools for Javascript-based visualization
– Development of LODWheel - a prototype for visualizing RDF data in graphs and charts
19

Relevant Javascript libraries/tools GapMinder AnyChart Cytoscape Web
d3 JIT JQPlot
20
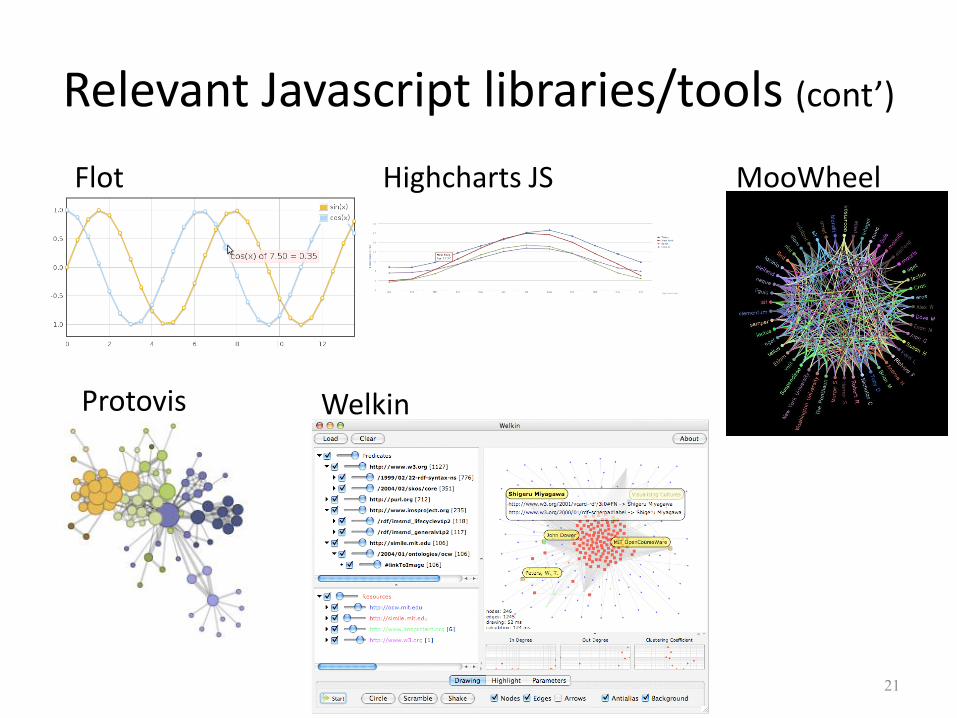
Relevant Javascript libraries/tools (cont’)
Protovis Welkin
Flot Highcharts JS MooWheel
21

Evaluation criteria
Usability Data Quality
Click on elements JSON compatible Layout
Hover on elements JSON from file Space efficiency
Drag nodes * JSON simplicity Performance
Different colors Update via AJAX
Text on nodes *
Text on edges *
Pointers between data *
Legend
* = exclusive for the graph-visualization libraries.
22

Evaluation summary Library Strengths (+) Weaknesses (-) Overall score
Ajax Mgraph - Space efficient
- Great hovering
- Cannot click on elements 31
amCharts - Simple JSON format
- Great performance
- Cannot read JSON from external file 90
Arbor - Space efficient
- Arrows/pointers
- Not JSON compatible
- Not optimal layout
72
d3 - Space efficient
- Nice layout
- Not optimal performance on larger data sets
- Nodes are not clickable
57
Dracula Graph
Library
- Different colors on nodes
- Text on nodes
- Layout is not optimal for visualizing large data
sets
- Space inefficient
43
Flot - Great performance
- Very simple JSON format
- Not optimal functionality for clicking on nodes 72
Google Chart Tools - Great performance
- Space efficient
- JSON incompatible 56
Highcharts JS - Great performance
- Simple JSON format
- Cannot read JSON from external file 77
JIT - Great performance
- Simple JSON format
- Space inefficient
- No arrows/pointing
84
23

Evaluation summary (cont’)
Library Strengths (+) Weaknesses (-) Overall score
JQPlot - Great performance
- Simple JSON format
No major weaknesses. 86
JS Charts - Space efficient
- Simple JSON format
- Bad performance
- Cannot click on elements
53
JSViz - Different colors on nodes - Performance and layout
- JSON incompatible
15
MooWheel - Great performance
- Simple JSON format
- Pointing between nodes
No major weaknesses. 106
PlotKit No major strengths. - Not optimal performance
- JSON incompatible
- Cannot click on elements
11
Protovis - Different colors on nodes
- Can drag elements
- No arrows/pointing
- Not optimal functionality for clicking on
nodes
62
24

LODWheel
• Visualize Linked Open Data in graphs and charts
• Prototype based on MooWheel and JQPlot
Demo at http://opendata.computas.no:7001/lodwheel/moowheel/ 25
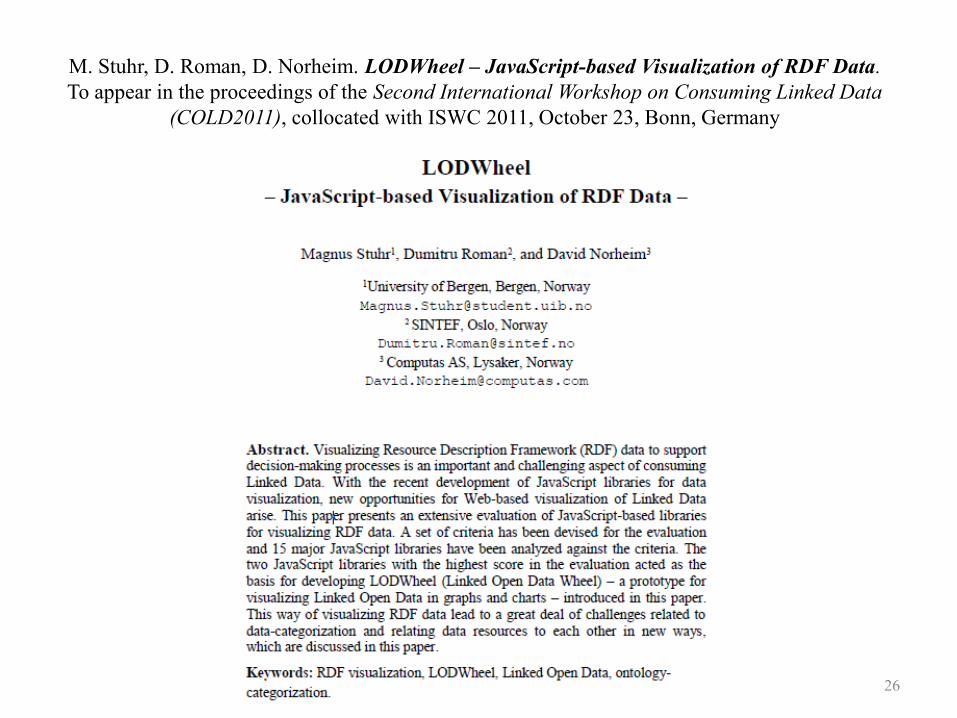
M. Stuhr, D. Roman, D. Norheim. LODWheel – JavaScript-based Visualization of RDF Data.
To appear in the proceedings of the Second International Workshop on Consuming Linked Data
(COLD2011), collocated with ISWC 2011, October 23, Bonn, Germany
26
Outline
• Case studies related to Norwegian Open Data – Regional development
– Environmental-friendly behavior
• Norwegian LOD sets and relationships
• PlanetData-NorthPole
• Web-based visualization of linked data – Overview of Javascript libraries
– LODWheel prototype
• Open issues and outlook
27
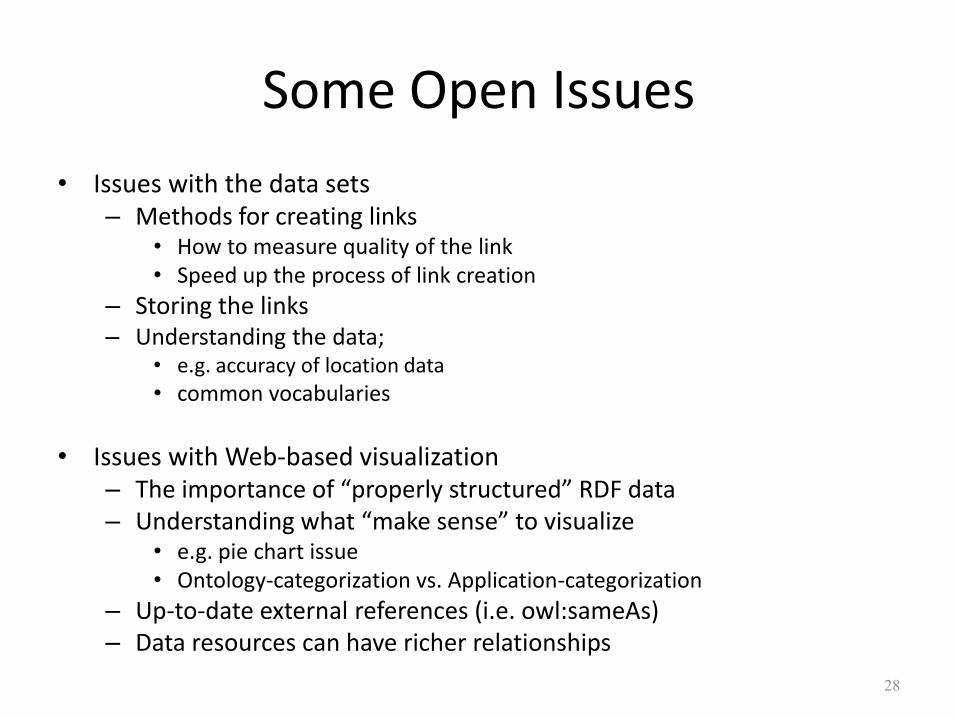
Some Open Issues
• Issues with the data sets – Methods for creating links
• How to measure quality of the link • Speed up the process of link creation
– Storing the links – Understanding the data;
• e.g. accuracy of location data
• common vocabularies
• Issues with Web-based visualization
– The importance of “properly structured” RDF data – Understanding what “make sense” to visualize
• e.g. pie chart issue • Ontology-categorization vs. Application-categorization
– Up-to-date external references (i.e. owl:sameAs) – Data resources can have richer relationships
28
THANK YOU! Q&A
29