Embed Size (px)
Citation preview

>
Planar Solid Oxide Fuel Cells Modules with Radiant Air Preheating
Presented at the 6th Annual SECA Workshop and Core Technology Review Meeting
Kevin Krist, Gas Technology Institute
April 20, 2005

California Energy Commission (CEC), Public Interest Energy Research (PIER) Program

Project Goals
> Construction and testing of 3 sub-scale, core modules that demonstrate:– Improved (radiant) heat transfer– High-efficiency/high-power-density performance as
close to 650oC as possible – Up to 2000 hrs of operation with minimal voltage
degradation> A conceptual design of a 10-kW plant based on
testing of the sub-scale module

Variation in Available Stack Heat with Electrical Efficiency
0.0
0.5
1.0
1.5
2.0
2.5
0.3 0.4 0.5 0.6 0.7
Cell Efficiency
kWh
Hea
t Rem
oved
/kW
h El
ectr
icity
Gen
erat
ed
Total Waste Heat Generation in Stack
Heat Removal After in-Situ Reforming
Heat of Reforming
Heat Removal by Cathode Air at 2 x
Stoich.
Heat Removal Through Interconnect

Radiant Heat Transfer to Air Pre-heater Panels> Heat transfer outside the
cathode compartment> Conduct heat to cell edge> Radiate to panel (RAP)> Convect to air in RAPs
> Post burner is remote to power module
> Reduces:> Airflow> Pressure drop > HX size and cost> Blower size and cost> Blower parasitic power
Stack
RAP
Pre-Reformer
PostBurner
1
2
3 4
5
6
7 8
NG
air

Stack/RAP Approach Offers Multiple Benefits for Cell/Stack Operation
> Higher power density operation– Due to faster heat removal and/or thinner airflow
channels> More flexible operation
– By maintaining stable, low airflow and hot-zone temperature during load changes
– By compensating for internal reforming heat-transfer effects at low and high power density
> More uniform in-plane and/or axial temperature distribution
> Reduced pressure drop in the cells– Improved seal durability

Stack/RAP Approach May Facilitate Compactness, Modularization, and Scale-Up
> Stack and air pre-heater are modularized
> Module arrays have particular advantages: – Fewer pre-heater panels– Better thermal management
(stacks “share” heat)– Fewer pre-heater manifolds
> “Active” insulation– Assists thermal self-
sustainability in small systems
– Improves compactness

Technologix Model• Oriented towards configuration design• ~102 - 103 times faster than CFD• Performs reliably
SOFC Stack Model
(2-D/3-D)
Thermal + Transport Database (1,500
species)
Thermodynamic Process Module
Thermal Radiation Gas Pre-heating
Panel (CEC)Nonlinear
OptimizationModule Risk Analysis
And Sensitivity
Module
SOFC Stack/ProcessConfiguration
Design

RAP Model Validation
0
100
200
300
400
500
600
700
800
900
0 0.2 0.4 0.6 0.8 1
Stack W- 1 W- 2 W- 3 W- 4 W-5 Air W-4.5 EXP Distance, dim
STACK
INSULATION
RAP
Distance, dim
Tem
pera
ture
, C
Measurements

RAP Panel Design
Oxidant Inlet to RAP
RAP panel #2
RAP inlet manifold
RAP panel wall #2
RAP panel wall #1
Gap between stack& RAP panel
Stack
Oxidant Outlet from RAP
RAP outlet manifold(internally manifolded stack)
RAP outlet manifold(externally manifolded stack)
Gap between RAP panel walls
A
B

First CEC Stack/RAP Module Design
RAP Panel #2RAP Panel #1
> Internally manifolded, cross-flow stack
> Stack-generated heat radiates to two air pre-heater panels– Panels are opposite the
fuel inlet and outlet sides of the stack
> Panel airflow:– Perpendicular to the
stacking direction– Counter to airflow in
the cells

Stack/Air Pre-heater OperationConfiguration: Two integrated air pre-heaters with airflow horizontal and counter to flow in stack. Stack thermal management: 40% IR + 37% RAD + 23% AIR
400
500
600
700
800
900
0 50 100 150 200 250
Air Pre-heater Inlet Temperature, C
Tem
pera
ture
, C
Air Temperature (Pre-heater Outlet) Air Temperature (Stack Inlet)Air Temperature (Stack Outlet) Stack Temperature (Minimum)Stack Temperature (Average) Stack Temperature (Maximum)
217 C
572 C798 C Stack
Preheater
800 C
217 C
TMAX -TMIN~ 65C

-
5.0
10.0
15.0
20.0
25.0
0 50 100 150 200
Number of cells
Hea
t Los
s, W
/cel
lKaowool-S Microtherm Super-G
Heat Loss per Cell Vs Increasing Cell # (Stack Size)
4” thick insulation, 7 cpi
0
100
200
300
400
500
600
0 5 10 15 20 25
Number of 1" Insulation Layers
Hea
t Los
s fr
om th
e St
ack
Mod
ule,
W
0
25
50
75
100
125
150
Out
side
Wal
l Tem
pera
ture
, C
Microtherm Super-G
0
100
200
300
400
500
600
0 5 10 15 20 25
Number of 1" Insulation Layers
Hea
t Los
s fr
om th
e St
ack
Mod
ule,
W
0
25
50
75
100
125
150
Out
side
Wal
l Tem
pera
ture
, C
Microtherm Super-G

RAP Performance with Heat Loss to the Surroundings
2-panel design, 7 cpi
400.0
500.0
600.0
700.0
800.0
0 50 100 150 200 250 300 350
RAP Air Inlet Temperature, C
RA
P A
ir O
utle
t Tem
pera
ture
, C
Base RAP Enhanced RAP Post-burner Design Point
Enhanced design: steel wool inserted between RAP walls

First Module Development> U-Utah cell development> MSRI tested multiple 5, 10,
20, 25, and 40-cell stacks on H2, simulated reformate, and CH4/steam at 650-800oC
> GTI designed the RAPs and plenum

GTI Stack Testing Facility
> Designed for individual, un-insulated stacks at a constant, uniform temperature– Location of the furnace
heating elements affected the results
> Diagnostic capabilities– Blended gases simulate
different fuels– GC for seal efficiency and
blending accuracy – Individual cell voltages– Stack internal resistance
measurement capability

First Sub-Scale Module Test
> 40-cell, 100-cm2 stack– Measurements were made with modified seals on 50/50 H2/N2 at
~750oC and constant flow and without insulation
> Power output: 550W– 1.2 kW peak power measured in Salt Lake City
> Obtained I-V curves– Power density ~100 mW/cm2
> Demonstrated RAP concept– ~105oC air temperature rise with only ~120 delta T between
stack and RAP
> Operated unit ~3-4 weeks through ~5 thermal cycles

Second Module Design
> Stack/RAP module is – Thermally isolated from
surroundings> Avoids interference
from a secondary heat source
– Thermally self-sustained
> Inlet temperature to the RAPs is adequately controlled
> External hydraulic compression removes minimal heat

Stack/RAP Test Module Design (from Above)
1200 WHeating
Elements
RAPS
Transporter Compression
Plates
Fuel Inlet
40-Cell Stack
Ports for Pressure Tap and
Thermocouple (x4)RAPS Bypass
Air Inlet
RAP Outlet T.C.
Ports
Air Inlets to RAPS
Air PreheaterT.C. Ports
RAP InletT.C. Ports

Stack/RAP Test Module Design (from Below)
4 x 250WHeating
Cartridges
Plenum Thermocouples
Gas Plenum
Fuel Outlet
Air Outlet
Plenum Pressure Transducers
RAP Surface Thermocouples

MSRI/GTI Stack/RAP Test Module

715 W
Open Circuit
750 W
1hr at 1000W
Post 1kw Power Curve
500 W
340 W
250 W
Variable Power Output of RAPs Power Module


Temperature Rise in Fuel Outlet RAP: 340oC Temperature
Rise in Fuel Inlet RAP: 408oC

Third Power Module
Aurora hot power modulewithout RadHEX
Aurora hot power modulewith RadHEX
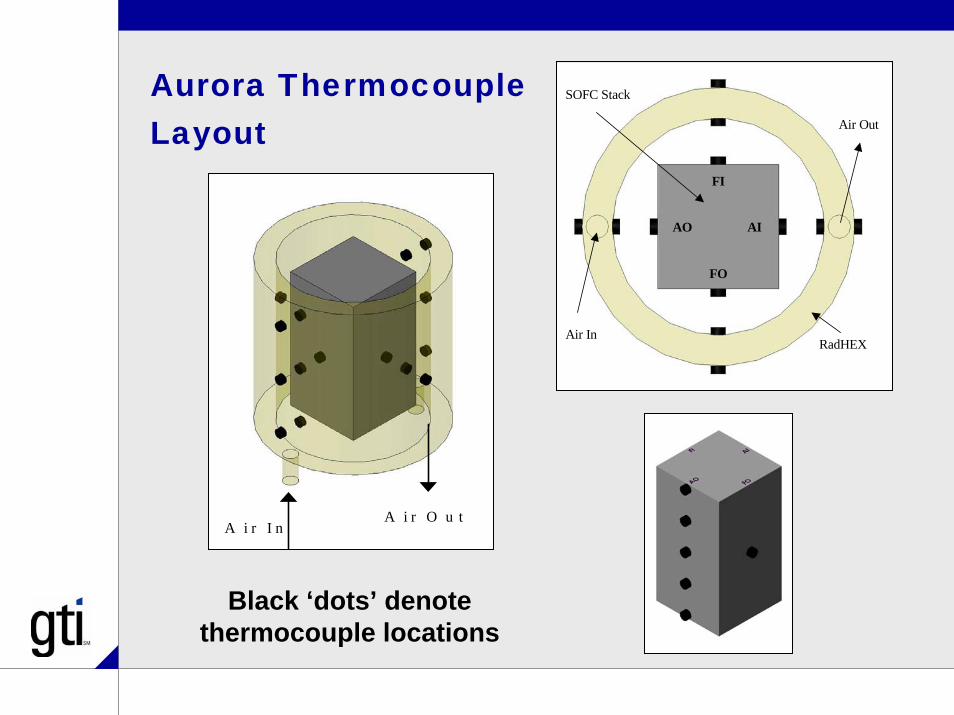
Aurora Thermocouple Layout
Air In
Air Out
FI
AO AI
FO
SOFC Stack
RadHEX
Black ‘dots’ denotethermocouple locations
A i r I n A i r O u t

Hot Zone Thermal Analysis• Temperature mapped as if RadHEX was cut vertically along the air
inlet side and rolled out into a flat panel• Gives 11 measurements for each RadHEX surface (the 3
measurements at the edges are redundant)
AIR IN AIR OUT

Hot Zone Thermal Profile -OCV
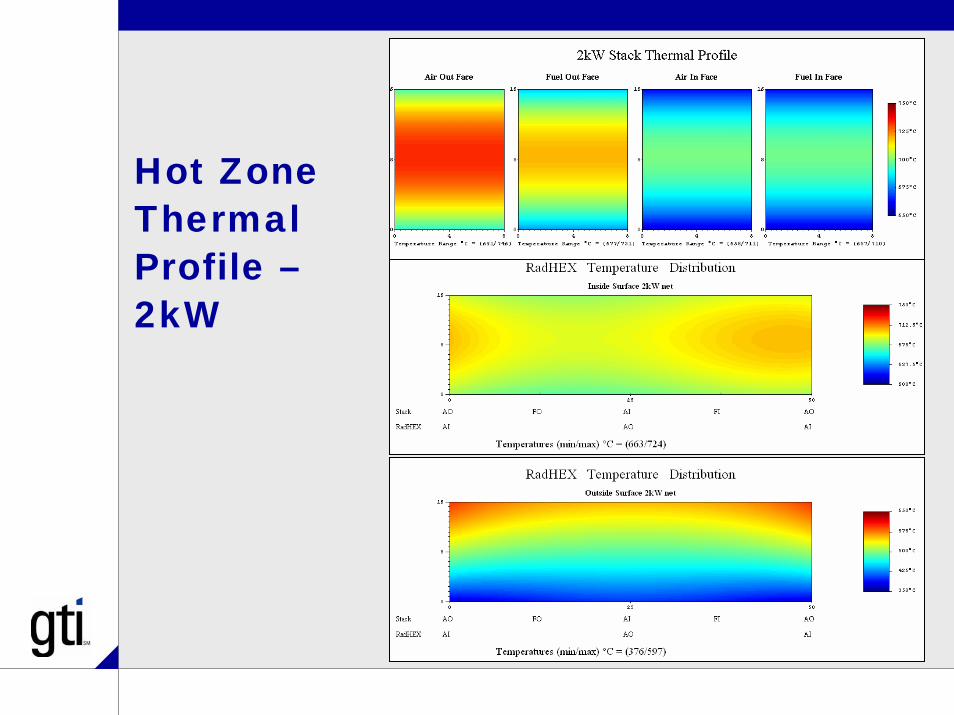
Hot Zone Thermal Profile –2kW

Module Electrochemical Performance ComparisonParameter Project Goal GTI/MSRI Test MSRI/GTI Test VPS Test
Stack design
NA 40 cells92-cm2 areaInternal manifoldedcell borders
40 cells92-cm2 areaInternal manifoldedcell borders
84 cells121-cm2
Internal manifoldedpicture frame
Fuel H2, simulated reformed natural gas, and CH4/steam (DIR)
50% H2/ 50% N2 OCV: 55%H2/45% N21 kW: 80%H2/20%N2
Residential natural gas***
Module output
1-3 kW 550 W 1.0 kW ~2.8 kW DC2 kW net AC
Stack T at full load
As close to 650oC as possible
~759oC ~786oC ~719oCCath Out T = 730oC
OCV Theoretical V for VPS fuel: 78.12V
43.28 V(1.082 V/cell)
41.62 V(1.0405 V/cell)
79.67 V (0.9485 V/cell)
Gas utilizations
Not specified* 26.7% Uf26.7% Uo
27% Uf45% Uo
50% Uf40% Uo
Power density under full load
0.4 W/cm2 at 0.8V/cell**
0.11 W/cm2 at0.42 V/cell0.26 A/cm2
16.7 V at 24A
0.27 W/cm2 at0.59 V/cll0.46 A/cm2
23.7 V at 42.2 A
0.27 W/cm2**** at0.79 V/cell0.35 A/cm2
66 V at 42 A * 40-60% Uf and 40-50% Uo targeted to approach commercial operation** Depends on stack size, gas utilization, cell dimensions and fuel, which were not specified*** 75% reformed externally and 25% on-cell reforming****0.34W/cm2 upper limit

Module Endurance and Efficiency Comparison
Parameter Project Goal GTI/MSRI Test MSRI/GTI Test VPS Test
Endurance Two 500-hr tests and one 2000-hr test
Operated intermittently for ~3 weeks
~500 hrs at part load
8,000-hr test underway.Will pass 2000 hours on 4/25/05*
Voltage degradation
<0.6%/1000 hrs during 2000 hours
Unplanned power outages interfered with V degradation measurements.
500 test completedV degradation tbd
~1-2%/1000 hr at 30A~5%/1000 hr at 40A **
Power cycling
Not specified. ~5 unplanned power outages
Apparent good power cycling
Apparent good power cycling for system
Electric efficiency
Projected 50% for a 10-kW system
Modeled by Nexant Modeled by Nexant
~35% measured. 45-50% path identified
*In non-CEC work, single-cell stack has operated >25,000 hrs and 20-cell stack has operated >8,000 hrs**V degradation for a complete system can be higher than for a hot module only test

Module Thermal Performance Comparison
Parameter Project Goal GTI/MSRI Test MSRI/GTI Test VPS Test
Radiant air preheaterdesign
Model and design
2 RAP panels adjacent to the fuel inlet and outlet, respectivelyRAP airflow perpendicular to the stacking direction
2 RAP panels adjacent to the fuel inlet and outlet, respectivelyRAP airflow perpendicular to the stacking direction
Annular RadHexRadHexairflow is proprietary
Thermally self-sustained
Yes No Essentially at 1.0 kW Yes, >0.98 kW
RAP air temperature rise*
>300-400oC at 40-50% Uo and full load**
~101oC(due to high RAP inlet T)300 – 400oC in out-of-stack tests
~374oC ~440oC
In-plane stack delta T*
Not specifiedShould be <100oC
Modeled to be <100oC Modeled to be <100oC ~36oC T/Cs on stack face
Axial stack delta T*
Not specifiedShould be <100oC
~163oCT/Cs at center of cell
~175oC T/Cs at center of cell
~55oCT/Cs on stack face
* Values at full load** Needed for high electric efficiency
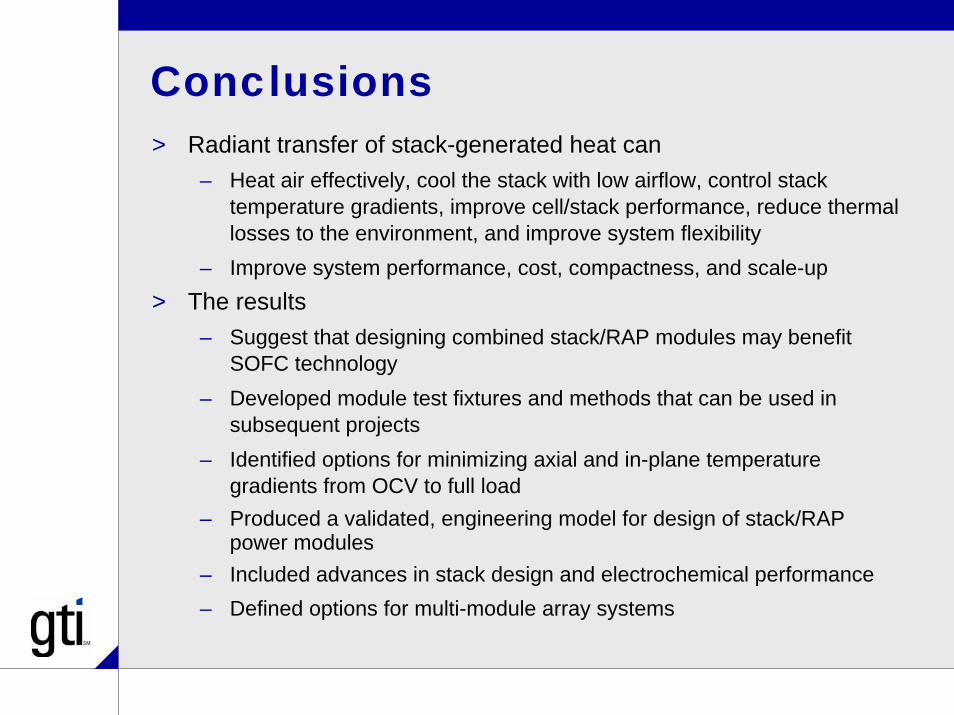
Conclusions> Radiant transfer of stack-generated heat can
– Heat air effectively, cool the stack with low airflow, control stack temperature gradients, improve cell/stack performance, reduce thermal losses to the environment, and improve system flexibility
– Improve system performance, cost, compactness, and scale-up> The results
– Suggest that designing combined stack/RAP modules may benefit SOFC technology
– Developed module test fixtures and methods that can be used in subsequent projects
– Identified options for minimizing axial and in-plane temperature gradients from OCV to full load
– Produced a validated, engineering model for design of stack/RAP power modules
– Included advances in stack design and electrochemical performance– Defined options for multi-module array systems

Conclusions (continued)> The results also
– Were at or near the CEC project goals– Are providing input to the design of SOFC power generators in the
FCE/VPS SECA program
> Acknowledgements– Financial support provided by the Public Interest Energy
Research (PIER) Program of the California Energy Commission, Contract 500-02-029, Arthur J. Soinski, Contract Manager
– Technologix, Dr. John Jewulski– Materials and Systems Research, Inc. (MSRI), Dr. Tad
Armstrong – Versa Power Systems, Scott Sherman, P. Eng.– Other participants