Embed Size (px)
Citation preview


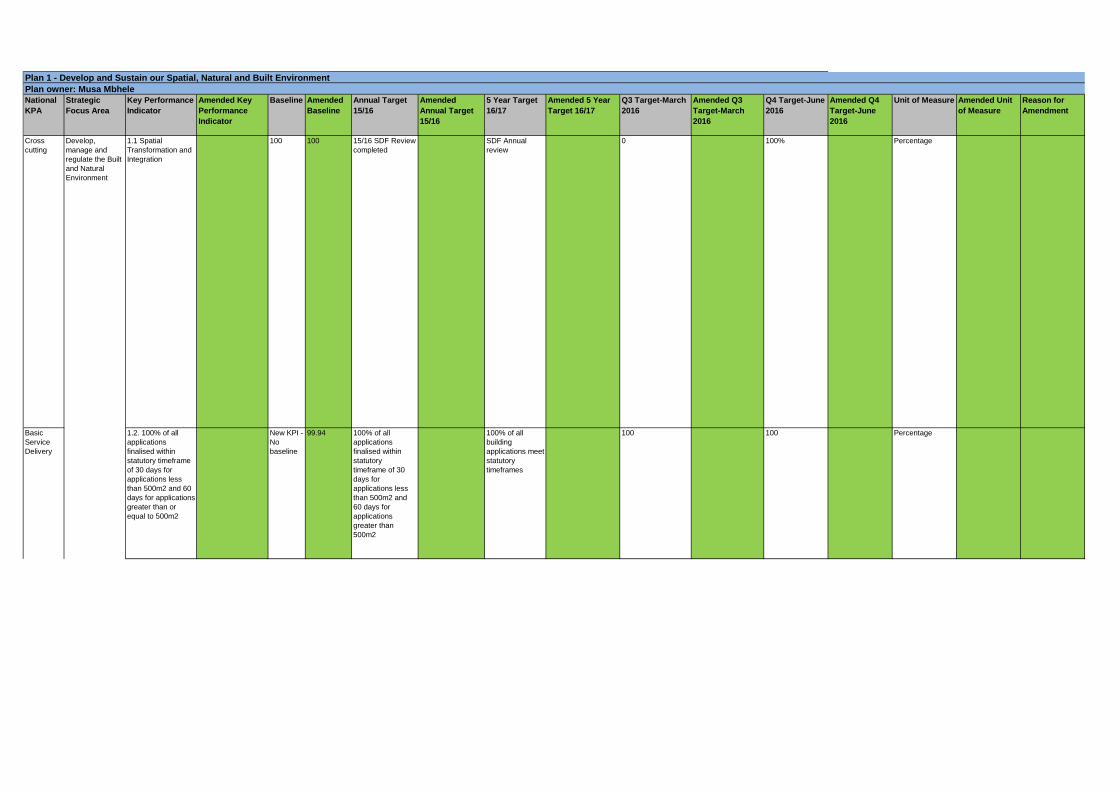
Plan owner: Musa Mbhele
National
KPA
Strategic
Focus Area
Key Performance
Indicator
Amended Key
Performance
Indicator
Baseline Amended
Baseline
Annual Target
15/16
Amended
Annual Target
15/16
5 Year Target
16/17
Amended 5 Year
Target 16/17
Q3 Target-March
2016
Amended Q3
Target-March
2016
Q4 Target-June
2016
Amended Q4
Target-June
2016
Unit of Measure Amended Unit
of Measure
Reason for
Amendment
Cross
cutting
1.1 Spatial
Transformation and
Integration
100 100 15/16 SDF Review
completed
SDF Annual
review
0 100% Percentage
1.2. 100% of all
applications
finalised within
statutory timeframe
of 30 days for
applications less
than 500m2 and 60
days for applications
greater than or
equal to 500m2
New KPI -
No
baseline
99.94 100% of all
applications
finalised within
statutory
timeframe of 30
days for
applications less
than 500m2 and
60 days for
applications
greater than
500m2
100% of all
building
applications meet
statutory
timeframes
100 100 Percentage
Plan 1 - Develop and Sustain our Spatial, Natural and Built Environment
Develop,
manage and
regulate the Built
and Natural
Environment
Basic
Service
Delivery
National
KPA
Strategic
Focus Area
Key Performance
Indicator
Amended Key
Performance
Indicator
Baseline Amended
Baseline
Annual Target
15/16
Amended
Annual Target
15/16
5 Year Target
16/17
Amended 5 Year
Target 16/17
Q3 Target-March
2016
Amended Q3
Target-March
2016
Q4 Target-June
2016
Amended Q4
Target-June
2016
Unit of Measure Amended Unit
of Measure
Reason for
Amendment
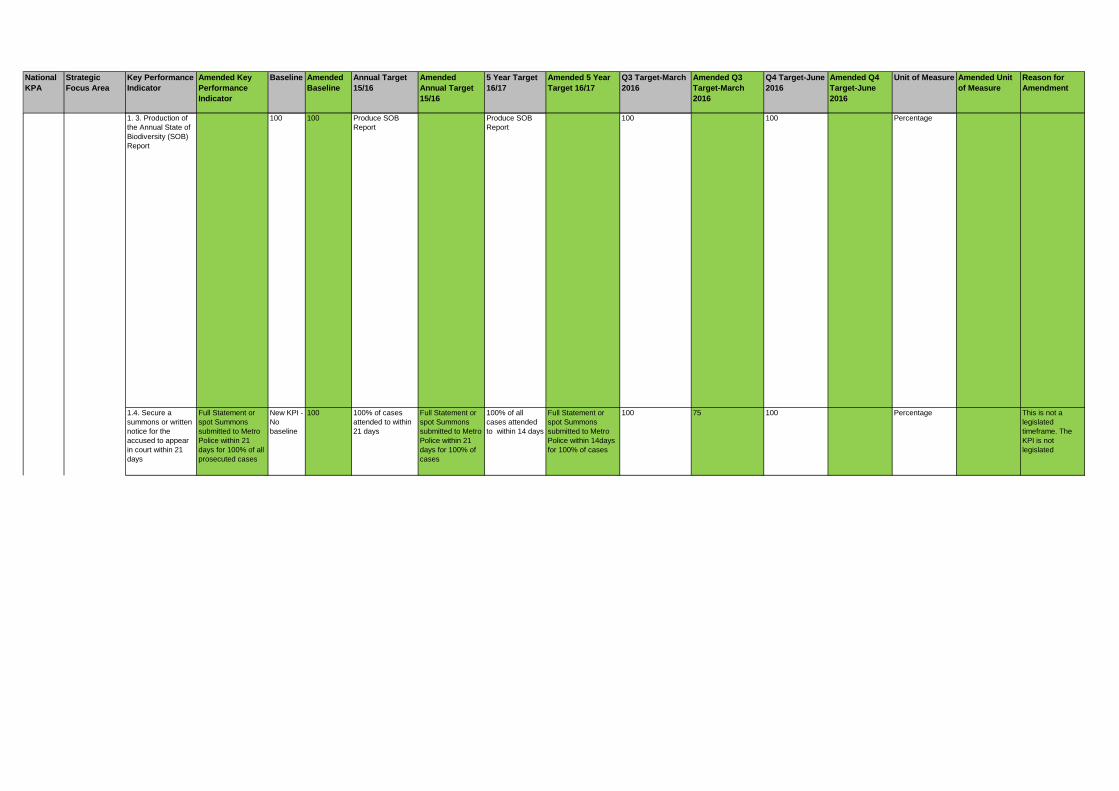
1. 3. Production of
the Annual State of
Biodiversity (SOB)
Report
100 100 Produce SOB
Report
Produce SOB
Report
100 100 Percentage
1.4. Secure a
summons or written
notice for the
accused to appear
in court within 21
days
Full Statement or
spot Summons
submitted to Metro
Police within 21
days for 100% of all
prosecuted cases
New KPI -
No
baseline
100 100% of cases
attended to within
21 days
Full Statement or
spot Summons
submitted to Metro
Police within 21
days for 100% of
cases
100% of all
cases attended
to within 14 days
Full Statement or
spot Summons
submitted to Metro
Police within 14days
for 100% of cases
100 75 100 Percentage This is not a
legislated
timeframe. The
KPI is not
legislated
Develop,
manage and
regulate the Built
and Natural
Environment
Basic
Service
Delivery

National
KPA
Strategic
Focus Area
Key Performance
Indicator
Amended Key
Performance
Indicator
Baseline Amended
Baseline
Annual Target
15/16
Amended
Annual Target
15/16
5 Year Target
16/17
Amended 5 Year
Target 16/17
Q3 Target-March
2016
Amended Q3
Target-March
2016
Q4 Target-June
2016
Amended Q4
Target-June
2016
Unit of Measure Amended Unit
of Measure
Reason for
Amendment
1.5. Identify and
Facilitate
advertising
opportunities on
Council owned
land/Assets
95 75 Two Advertising
Tenders Published
represented as
25% x4 = 100%
3 Advertising
contracts
awarded
75 100 Percentage
1.6 100% of all
applications for a
Certificate of
Occupancy
processed in terms
of Section 14 of the
NBRs.
99.6 100 100 % of all
applications for a
Certificate of
Occupancy
processed within a
period of 14 days
in terms of
applicable
legislation.
100 100 100 Percentage
1.7 Compliance with
the Integrated
Coastal
Management Act
2009- Municipal
Coastal
Management
Programme
This KPI has been
moved to Plan 3.
80 This KPI has
been moved
to Plan 3.
Municipal Coastal
programme lodged
with MEC for
approval. A single
document for
municipal
committee
approval
This KPI has been
moved to Plan 3.
100 This KPI has been
moved to Plan 3.
100 This KPI has been
moved to Plan 3.
100 This KPI has been
moved to Plan 3.
Percentage This KPI has been
moved to Plan 3.
This KPI has been
moved to Plan 3.
Climate
Protection
Planning
1.8 Implement a
Municipal Climate
Protection
Programme
100 100 Develop the
Durban Climate
Change Strategy
Implementation
Plan
Development of
a strategic
implementation
plan for the
adaptation
component of the
Durban Climate
Change Strategy.
82.5 100 Percentage
Develop,
manage and
regulate the Built
and Natural
Environment
Basic
Service
Delivery

National KPA Strategic
Focus Area
Key Performance Indicator Amended Key
Performance
Indicator
Baseline
as at 30
June
2015
Amended
Baseline
Annual
Target
2015/2016
Amended
Annual
Target
5 Year
Target
16/17
Amended
Five Year
Target
Q3
Target
Amended
Target Q3
Value
Q4
Target
Amende
d Target
Q4
Value
Unit
of
Meas
ureme
nt
Amen
ded
Unit of
Measu
re
Reason for
Amendment
2.1. Provide Economic
Intelligence and a Strategic
Economic Framework as
outlined in the SDBIP 2015/16
100% 100%
Achieveme
nt of
SDBIP
Targets
during
2015/16
An efficient
and user-
friendly
economic
database
for the
Municipality
and public
12.33 19.67 100 Perce
ntage
2.2.Best Practice City
Commission and
implementation of the
recommendations thereof as
outlined in the projects in the
SDBIP 2015/16
55% 50 62.5%
Achieveme
nt of
SDBIP
target
during
2015/16
Completion
of 100% of
the projects
as outlined
in the
SDBIP
50 62.5 Perce
ntage
Enterprise and
Sector
Development
2.3. Support, market and
promote the local film and
digital media industry via the
projects as outlined in the
SDBIP for 2015/16
100% 100%
Achieveme
nt of
SDBIP
Targets
during
2015/16
Completion
of 100% of
the projects
as outlined
in the
SDBIP
70.83 100 Perce
ntage
Providing
Economic
Leadership and
Intelligence
2.4. The number of jobs
created through the
municipality's local economic
development initiatives
including capital projects
17270 18890 15095 81916 11322 15095 Numb
er
Plan 2: Developing a Prosperous, Diverse Economy and Employment Creation
Plan owner: Musa Mbhele
Local
Economic
Development
(LED)
Providing
Economic
Leadership and
Intelligence

National KPA Strategic
Focus Area
Key Performance Indicator Amended Key
Performance
Indicator
Baseline
as at 30
June
2015
Amended
Baseline
Annual
Target
2015/2016
Amended
Annual
Target
5 Year
Target
16/17
Amended
Five Year
Target
Q3
Target
Amended
Target Q3
Value
Q4
Target
Amende
d Target
Q4
Value
Unit
of
Meas
ureme
nt
Amen
ded
Unit of
Measu
re
Reason for
Amendment
Facilitating
Private Sector
Investment and
Partnerships
2.5 Facilitate Private Sector
Investment Development
Partnerships through a set of
projects as outlined in the
SDBIP for 2015/16
100% 88.5 100%
Achieveme
nt of
SDBIP
Targets
during
2015/16
100% of
the Projects
outlined in
the SDBIP
75 100 Perce
ntage
Leverage,
Influence and
Facilitate Key
Infrastructure
Developments
and Maximise
the Local
Benefit
2.6. Implementation of
Investment Promotion and
Facilitation projects as detailed
in the SDBIP for 2015/16
Deleted 95% 90%
Achieveme
nt of
SDBIP
Targets
during
2015/16
100%
Achieveme
nt of the
Projects
outlined in
the SDBIP
0 90 Perce
ntage
Should have
been deleted
in the IDP-
Corrections
of an error
Enterprise and
Sector
Development
2.7. Facilitating Nodal
Development through the
implementation of specific
capital projects in the
eThekwini Municipal region
72.29% 62 100%
Achieveme
nt of
SDBIP
Targets
during
2015/16
Completion
of 100% of
the projects
as outlined
in the
SDBIP
63.33 5750% 100 Perce
ntage
Local
Economic
Development
(LED)

National KPA Strategic
Focus Area
Key Performance Indicator Amended Key
Performance
Indicator
Baseline
as at 30
June
2015
Amended
Baseline
Annual
Target
2015/2016
Amended
Annual
Target
5 Year
Target
16/17
Amended
Five Year
Target
Q3
Target
Amended
Target Q3
Value
Q4
Target
Amende
d Target
Q4
Value
Unit
of
Meas
ureme
nt
Amen
ded
Unit of
Measu
re
Reason for
Amendment
Facilitating
Development in
Priority Nodes
and Corridors
2.8.Implement a set of key
Strategic Projects for 2013 and
Beyond in the eThekwini
Municipal region as outlined in
the SDBIP for 2015/16
58.33% 72.5%
Achieveme
nt of
SDBIP
Targets
during
2015/16
80%
Achievement
of SDBIP
Targets
during
2015/16
Realisation
of
sustainable
benefits
from
Strategic
Projects in
selected
areas in the
City
52.5 50 72.5 80 Perce
ntage
2.9. Facilitating Industry Skills
and Economic inclusion as is
outlined through the projects in
the SDBIP for 2015/16
100% 100%
Achieveme
nt of
SDBIP
Targets
during
2015/16
An
increased
number of
SMMEs
capacitated
and
exposed to
various
markets in
the local
and
national
economy
77.59 100 Perce
ntage
2.10. Managing the Informal
Economy by providing an
enabling platform for the local
informal sector by
implementing a set of
operational and management
initiatives as outlined in the
SDBIP for 2015/16
100% 100%
Achieveme
nt of
Project as
per the
SDBIP
Target
during
2015/16
77.5%
Achievement
of Project as
per the
SDBIP
Target during
2015/16
An efficient,
enabling
platform for
the
Informal
Economy to
function in
the
municipal
region
75 60 100 77.5 Perce
ntage
Local
Economic
Development
(LED)
Facilitating
Sustainable
Livelihoods

National KPA Strategic
Focus Area
Key Performance Indicator Amended Key
Performance
Indicator
Baseline
as at 30
June
2015
Amended
Baseline
Annual
Target
2015/2016
Amended
Annual
Target
5 Year
Target
16/17
Amended
Five Year
Target
Q3
Target
Amended
Target Q3
Value
Q4
Target
Amende
d Target
Q4
Value
Unit
of
Meas
ureme
nt
Amen
ded
Unit of
Measu
re
Reason for
Amendment
2.11. Support the Tourism
Sector through the creation of
global awareness, partnership-
building and an increase of
spending and visitor numbers
in the eThekwini Municipal
region, as outlined in the
SDBIP for 2015/16
100% 100%
Achieveme
nt of
SDBIP
Targets
during
2015/16
100%
Achieveme
nt of
identified
projects in
the tourism
and related
sectors as
outlined in
the SDBIP
75 100 Perce
ntage
2.12. Managing the Bulk Fresh
Produce Market by providing
an enabling platform for
businesses in the Fresh
Produce sector as outlined in
the SDBIP for 2015/16
100% 91.04 100%
Achieveme
nt of
SDBIP
Targets
during
2015/16
An efficient,
enabling
platform for
businesses
in the Fresh
Produce
industry
72.5 70.84 100 Perce
ntage
Local
Economic
Development
(LED)
Facilitating
Sustainable
Livelihoods

National KPA Strategic
Focus Area
Key Performance Indicator Amended Key
Performance
Indicator
Baseline
as at 30
June
2015
Amended
Baseline
Annual
Target
2015/2016
Amended
Annual
Target
5 Year
Target
16/17
Amended
Five Year
Target
Q3
Target
Amended
Target Q3
Value
Q4
Target
Amende
d Target
Q4
Value
Unit
of
Meas
ureme
nt
Amen
ded
Unit of
Measu
re
Reason for
Amendment
2.13. Trade and Sector
Development through sectors
that promote economic growth
and create jobs through
providing support for prioritized
sectors in the eThekwini
Municipal region
100% 97.73 100%
Achieveme
nt of
SDBIP
Targets
during
2015/16
Industrial
Developme
nt
Programme
to achieve
a
synergistic
relationship
between
local
economic
developme
nt and the
identified
sectors
75 100 Perce
ntage
2.14. The number of work
opportunities (i.e. 230 person
days - FTES) created through
the municipal capital and
operating budget per line dept.
this year.
6200 6510 6200 Completion
of 100% of
the projects
as outlined
in the
SDBIP
3720 6200 Numb
er
Local
Economic
Development
(LED)
Enterprise and
Sector
Development

National Key
Performance
Area
Strategic Focus
Area
Key Performance Indicator Amended
Key
Performanc
e Indicator
Baseline as at
30 June 2014Amended
Baseline as at
30 June 2014
Annual
Target 15/16Amended
Annual Target
15/16
5 Year Target
16/17Amended
5 Year
Target
16/17
Q3 Target -
March 2016Amended Q3
Target -
March 2016
Q4 Target -
June 2016Amende
d Q4
Target -
June
2016
Amended Unit
of MeasureAmended
Unit of
Measure
Reason for Amendment
3. 1. The percentage of
households with access
to a basic level of
electricity
69.07 72.44 70.78
(669 515)
73.5
(698,000)"71.41 76.5 70.41 72.9 70.78 73.5 % Baseline Amended,Previous targets met in
Quarter 1. New targets set.
3. 2. The percentage of
households with access
to a basic level of Solid
Waste Removal.
100.00 100 100 100.00 100 100 % Baseline Amended
3.3. The percentage of
households with access
to AT LEAST a basic
level of Water
92.44 92.86 92.86 92.93 92.84 92.86 % Baseline Amended
3.4. The percentage of
households with access
to AT LEAST a basic
level of Sanitation
76.92 83.17 84.2 85.91 83.77 84.2 % Baseline Amended
3.5. The percentage of
estimated indigent
households collecting
free basic services:
Electricity
17.11 18.13 19.39 20.91 19.3 19.39 % Baseline Amended
Plan 3 - Creating a Quality Living Environment 15/16 IDP Drafts
Plan Owner - Sibusiso Sithole
Basic Service
Delivery
Me
et
infr
astr
uctu
re a
nd
ho
use
ho
ld s
erv
ice
ne
ed
s a
nd
ba
cklo
gs

National Key
Performance
Area
Strategic Focus
Area
Key Performance Indicator Amended
Key
Performanc
e Indicator
Baseline as at
30 June 2014Amended
Baseline as at
30 June 2014
Annual
Target 15/16Amended
Annual Target
15/16
5 Year Target
16/17Amended
5 Year
Target
16/17
Q3 Target -
March 2016Amended Q3
Target -
March 2016
Q4 Target -
June 2016Amende
d Q4
Target -
June
2016
Amended Unit
of MeasureAmended
Unit of
Measure
Reason for Amendment
3. 6. The percentage of
estimated indigent
households provided
with free basic services:
Sanitation
54.31 64.33 65.99 68.74 65.3 65.99 % Baseline Amended
3. 7. The percentage of
estimated indigent
households with
access to a free basic
services: Water
87.75 8841% 88.4 88.52 88.37 88.4 % Baseline Amended
3. 8. 100% of estimated
indigent households
with access to a refuse
removal service once a
week
100.00 100 100 100.00 100 100 % Baseline Amended
3. 9. The number of
consumer units
provided with access to
AT LEAST a FREE
basic level of
SANITATION by means
of a UD toilet, an
existing VIP or, for
informal settlements, by
means of a
toilet/ablution block
within 200m
35977.00 1429 13000 65000 12150 13000 Number Baseline Amended
Basic Service
Delivery
Me
et
infr
astr
uctu
re a
nd
ho
use
ho
ld s
erv
ice
ne
ed
s a
nd
ba
cklo
gs

National Key
Performance
Area
Strategic Focus
Area
Key Performance Indicator Amended
Key
Performanc
e Indicator
Baseline as at
30 June 2014Amended
Baseline as at
30 June 2014
Annual
Target 15/16Amended
Annual Target
15/16
5 Year Target
16/17Amended
5 Year
Target
16/17
Q3 Target -
March 2016Amended Q3
Target -
March 2016
Q4 Target -
June 2016Amende
d Q4
Target -
June
2016
Amended Unit
of MeasureAmended
Unit of
Measure
Reason for Amendment
3. 10. The number of
consumer units
provided with access to
AT LEAST a FREE
basic level of potable
WATER either by
means of an indiv hh
yard supply (ground
tank or metered flow
limiter connected to a
yard tap) or, for informal
settlements, by a
standpipe within 200m
2060 22301 800 4000 600 800 Number Baseline Amended
3.11 The Cumulative
number of consumer
units collecting FREE
BASIC ELECTRICITY
85698 1282732 1372210 1479150 1024146 1372210 Number Baseline Amended
3.12. The number of
connections energised
and captured on Ellipse,
for provision of prepaid
electricity to consumer
units
9986 808 13250 40000 10000 13250 Number Baseline Amended
3.13. The number of
connections energised
and captured on Ellipse,
for provision of
conventional electricity
to consumer units
1069 13 342 750 5000 500 750 Number Baseline Amended
Basic Service
Delivery
Me
et
infr
astr
uctu
re a
nd
ho
use
ho
ld s
erv
ice
ne
ed
s a
nd
ba
cklo
gs
National Key
Performance
Area
Strategic Focus
Area
Key Performance Indicator Amended
Key
Performanc
e Indicator
Baseline as at
30 June 2014Amended
Baseline as at
30 June 2014
Annual
Target 15/16Amended
Annual Target
15/16
5 Year Target
16/17Amended
5 Year
Target
16/17
Q3 Target -
March 2016Amended Q3
Target -
March 2016
Q4 Target -
June 2016Amende
d Q4
Target -
June
2016
Amended Unit
of MeasureAmended
Unit of
Measure
Reason for Amendment
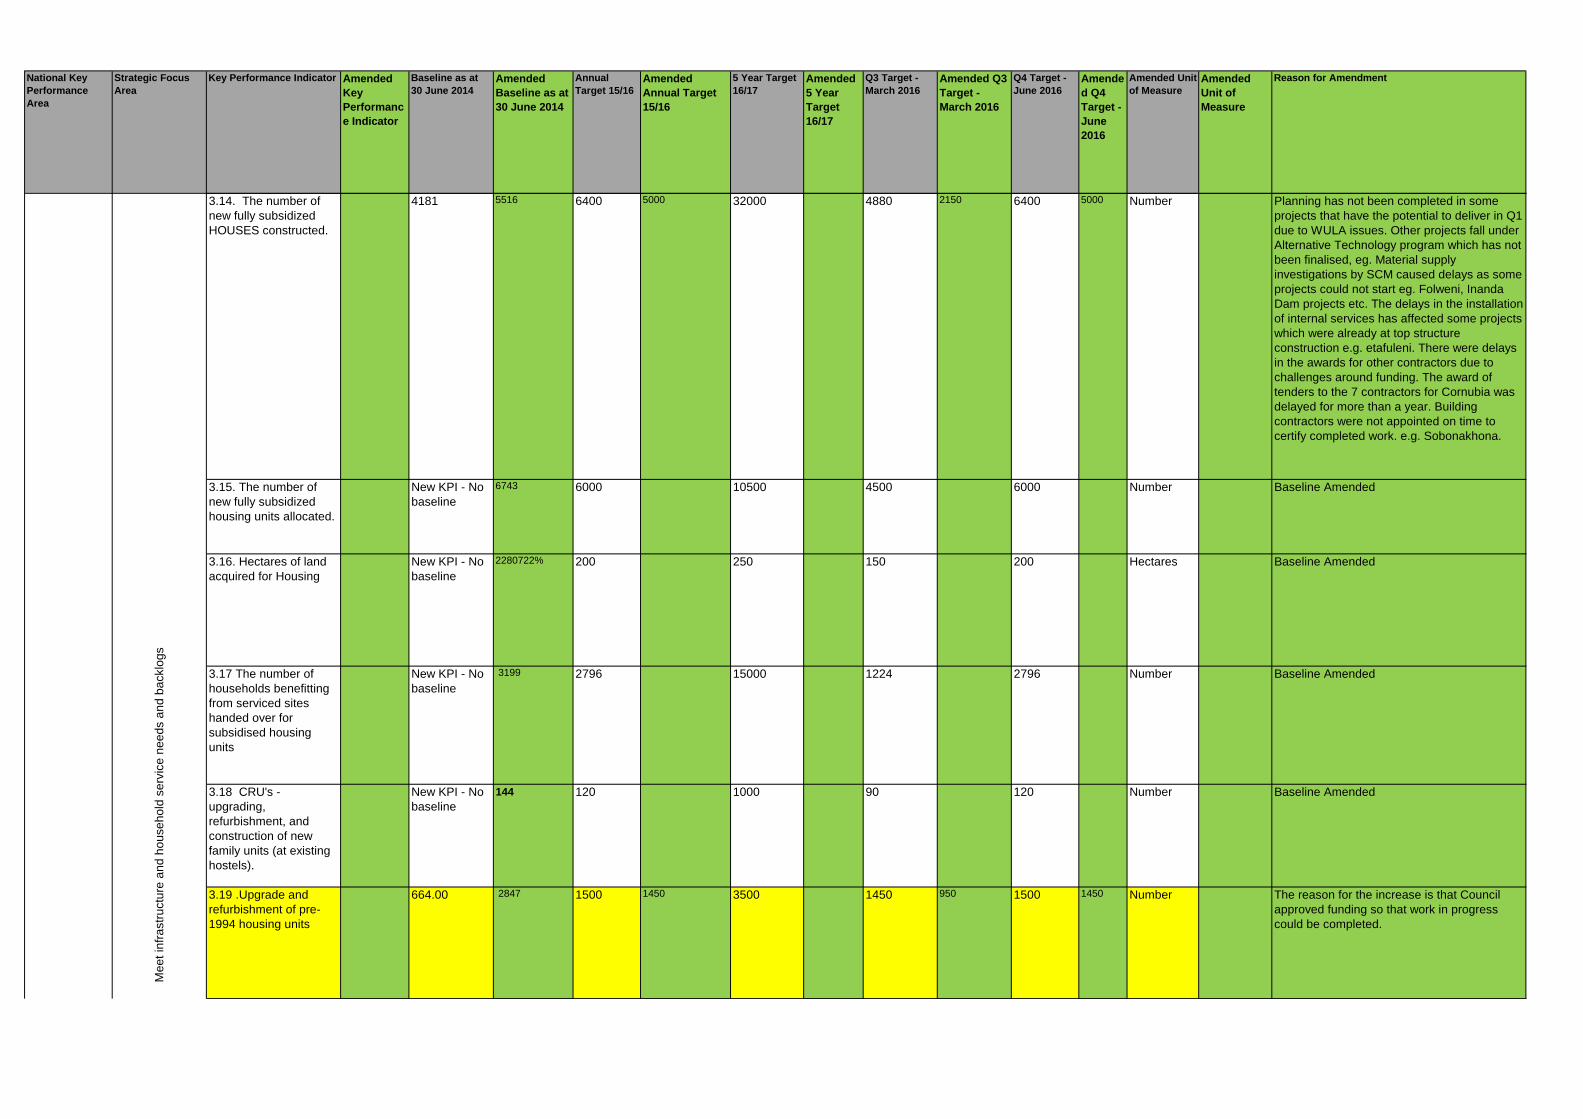
3.14. The number of
new fully subsidized
HOUSES constructed.
4181 5516 6400 5000 32000 4880 2150 6400 5000 Number Planning has not been completed in some
projects that have the potential to deliver in Q1
due to WULA issues. Other projects fall under
Alternative Technology program which has not
been finalised, eg. Material supply
investigations by SCM caused delays as some
projects could not start eg. Folweni, Inanda
Dam projects etc. The delays in the installation
of internal services has affected some projects
which were already at top structure
construction e.g. etafuleni. There were delays
in the awards for other contractors due to
challenges around funding. The award of
tenders to the 7 contractors for Cornubia was
delayed for more than a year. Building
contractors were not appointed on time to
certify completed work. e.g. Sobonakhona.
3.15. The number of
new fully subsidized
housing units allocated.
New KPI - No
baseline
6743 6000 10500 4500 6000 Number Baseline Amended
3.16. Hectares of land
acquired for Housing
New KPI - No
baseline
2280722% 200 250 150 200 Hectares Baseline Amended
3.17 The number of
households benefitting
from serviced sites
handed over for
subsidised housing
units
New KPI - No
baseline
3199 2796 15000 1224 2796 Number Baseline Amended
3.18 CRU's -
upgrading,
refurbishment, and
construction of new
family units (at existing
hostels).
New KPI - No
baseline
144 120 1000 90 120 Number Baseline Amended
3.19 .Upgrade and
refurbishment of pre-
1994 housing units
664.00 2847 1500 1450 3500 1450 950 1500 1450 Number The reason for the increase is that Council
approved funding so that work in progress
could be completed.
Basic Service
Delivery
Me
et
infr
astr
uctu
re a
nd
ho
use
ho
ld s
erv
ice
ne
ed
s a
nd
ba
cklo
gs

National Key
Performance
Area
Strategic Focus
Area
Key Performance Indicator Amended
Key
Performanc
e Indicator
Baseline as at
30 June 2014Amended
Baseline as at
30 June 2014
Annual
Target 15/16Amended
Annual Target
15/16
5 Year Target
16/17Amended
5 Year
Target
16/17
Q3 Target -
March 2016Amended Q3
Target -
March 2016
Q4 Target -
June 2016Amende
d Q4
Target -
June
2016
Amended Unit
of MeasureAmended
Unit of
Measure
Reason for Amendment
3.20. Sale of rental and
pre-1994 stock.
558 542 600 240 2400 600 180 600 240 Number Outstanding land legal issues still need to be
resolved. Non availability of R293 short term
contract temp staff. Unwillingness of tenants
to take transfer for the fear of taking
responsibility for their properties e.g. payment
of levies and the consequences for non
payment. Civic Organisation misleading
tenants by raising maintenance and upgrade
issues. Land ownerships in the name of
Ingonyama Trust and some portions of land
are owned by private owners. Illegal
occupants don’t qualify to be regularized in
terms of the existing Regularization of Illegal
Policy, Dispute cases still to be resolved. Fear
of collapsing bodies corporate. No township
registers to deal with transfers and double
registrations. Sales campaign conducted to
3000 tenants with a response of 538 is an
indication that some tenants are reluctant to
become owners because of the dependency
on Council for low rental and lack of
responsibility to take ownership and pay
levies. 2000 tenants in Chatsworth are still
raising the upgrade issues which have long
been attended to. This Project is unfunded
through the HSDG at this stage.
3.21. Undertake
projects to develop an
integrated asset
managemet plan
75 61.07 100%
Implementa
tion of Plan
100 0 62.4 % Baseline Amended
3.22. Built Environment
Performance Plan
100 100 100 100 80 100 % Baseline Amended
3.23. WASTE
RECYCLED as a % of
total waste disposed at
municipal land fill sites.
7.9 8.1 10 20 13 10 10 % The conversion of Garden Waste Recycling
program proposal is not yet adopted by the
Council. The Unit anticipated to receive an
average of two hundred thousand tons to four
hundred thousand tons from the program.
Hence the target is reduced.
Basic Service
Delivery
Me
et
infr
astr
uctu
re a
nd
ho
use
ho
ld s
erv
ice
ne
ed
s a
nd
ba
cklo
gs

National Key
Performance
Area
Strategic Focus
Area
Key Performance Indicator Amended
Key
Performanc
e Indicator
Baseline as at
30 June 2014Amended
Baseline as at
30 June 2014
Annual
Target 15/16Amended
Annual Target
15/16
5 Year Target
16/17Amended
5 Year
Target
16/17
Q3 Target -
March 2016Amended Q3
Target -
March 2016
Q4 Target -
June 2016Amende
d Q4
Target -
June
2016
Amended Unit
of MeasureAmended
Unit of
Measure
Reason for Amendment
3.24. The number of
properties below the
eThekwini defined level
of service provided with
STORMWATER
solutions.
475.00 613 440 1320 260 440 Number Baseline Amended and KPI owner
3.25. The number of km
of SIDEWALK
constructed.
51.20 83.6 22 25 12 22 KM Baseline Amended
3.26. The km of
unsurfaced ROAD
converted to surfaced.
7.1 20.25 16 55.3 10 16 KM Baseline Amended
3.27. Electricity losses
(technical and non-
technical) as a % of
electricity purchases.
5.85 7.7 6% 6 6 6 % Baseline Amended
Basic Service
Delivery
Me
et
infr
astr
uctu
re a
nd
ho
use
ho
ld s
erv
ice
ne
ed
s a
nd
ba
cklo
gs
National Key
Performance
Area
Strategic Focus
Area
Key Performance Indicator Amended
Key
Performanc
e Indicator
Baseline as at
30 June 2014Amended
Baseline as at
30 June 2014
Annual
Target 15/16Amended
Annual Target
15/16
5 Year Target
16/17Amended
5 Year
Target
16/17
Q3 Target -
March 2016Amended Q3
Target -
March 2016
Q4 Target -
June 2016Amende
d Q4
Target -
June
2016
Amended Unit
of MeasureAmended
Unit of
Measure
Reason for Amendment
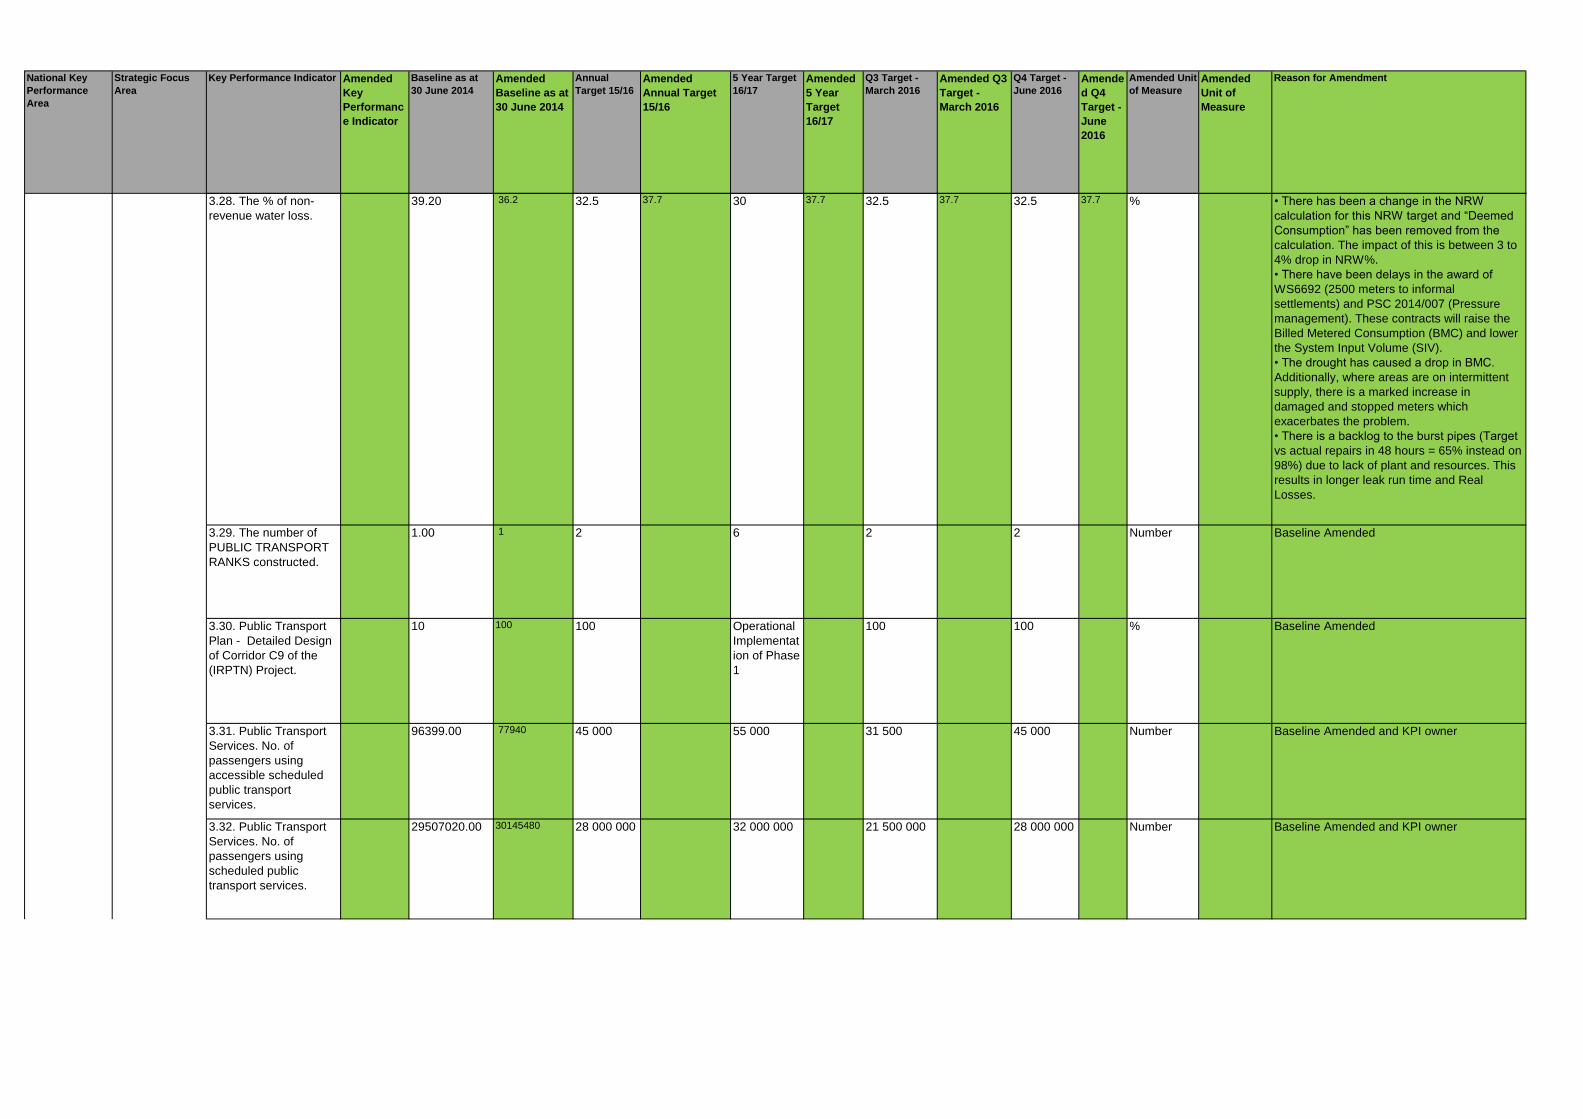
3.28. The % of non-
revenue water loss.
39.20 36.2 32.5 37.7 30 37.7 32.5 37.7 32.5 37.7 % • There has been a change in the NRW
calculation for this NRW target and “Deemed
Consumption” has been removed from the
calculation. The impact of this is between 3 to
4% drop in NRW%.
• There have been delays in the award of
WS6692 (2500 meters to informal
settlements) and PSC 2014/007 (Pressure
management). These contracts will raise the
Billed Metered Consumption (BMC) and lower
the System Input Volume (SIV).
• The drought has caused a drop in BMC.
Additionally, where areas are on intermittent
supply, there is a marked increase in
damaged and stopped meters which
exacerbates the problem.
• There is a backlog to the burst pipes (Target
vs actual repairs in 48 hours = 65% instead on
98%) due to lack of plant and resources. This
results in longer leak run time and Real
Losses.
3.29. The number of
PUBLIC TRANSPORT
RANKS constructed.
1.00 1 2 6 2 2 Number Baseline Amended
3.30. Public Transport
Plan - Detailed Design
of Corridor C9 of the
(IRPTN) Project.
10 100 100 Operational
Implementat
ion of Phase
1
100 100 % Baseline Amended
3.31. Public Transport
Services. No. of
passengers using
accessible scheduled
public transport
services.
96399.00 77940 45 000 55 000 31 500 45 000 Number Baseline Amended and KPI owner
3.32. Public Transport
Services. No. of
passengers using
scheduled public
transport services.
29507020.00 30145480 28 000 000 32 000 000 21 500 000 28 000 000 Number Baseline Amended and KPI owner
Basic Service
Delivery
Me
et
infr
astr
uctu
re a
nd
ho
use
ho
ld s
erv
ice
ne
ed
s a
nd
ba
cklo
gs

National Key
Performance
Area
Strategic Focus
Area
Key Performance Indicator Amended
Key
Performanc
e Indicator
Baseline as at
30 June 2014Amended
Baseline as at
30 June 2014
Annual
Target 15/16Amended
Annual Target
15/16
5 Year Target
16/17Amended
5 Year
Target
16/17
Q3 Target -
March 2016Amended Q3
Target -
March 2016
Q4 Target -
June 2016Amende
d Q4
Target -
June
2016
Amended Unit
of MeasureAmended
Unit of
Measure
Reason for Amendment
3.33. Implement an
effective public
transport plan for the
Municipality
New KPI- No
baseline
40.46 100%
Implementa
tion of Plan
100%
Implementat
ion of Plan
71.43 79.23 % Baseline Amended
3.34. Improve Road
Safety
New KPI - No
baseline
100 100%
completion
of related
SDBIP
projects
Completion
of all linked
projects
49 4500% 60 4600% Number Q3 and Annual Target amended. 4 Projects
previous financial year Projects ward funding
allocated
Develop,
manage and
regulate the
Built and Natural
Environment
3.35
Compliance
with the
Integrated
Coastal
Management
Act 2009-
Municipal
Coastal
Management
Programme
80 Municipal Coastal
programme lodged
with MEC for
approval. A single
document for
municipal
committee
approval
100 100 100 Percentage KPI moved from Plan 1
Basic Service
Delivery
Me
et
infr
astr
uctu
re a
nd
ho
use
ho
ld s
erv
ice
ne
ed
s a
nd
ba
cklo
gs

National Key
Performance Area
Strategic
Focus Area
Key Performance
Indicator
Amended Key
Performance
Indicator
Baseline as at 30
June 2013
Amended
Baseline
Annual Target
15/16
Amended
Annual Target
5 Year Target
16/17
Amended 5 year
Target
Q3 Target -
March 2016
Amended Q3
Target
Q4 Target -
June 2016
Amended Q4
Target
Unit of
Measure
Amended Unit
of Measure
Reason for
Amendment
Basic Service
Delivery
Promote the
Safety of
Citizens
4.1. Compliance with
SAPS Amendment Act
1998 with regard to
mandated functions of
Crime Prevention,
Traffic Management
and Bylaw
Enforcement
90.18 100 100%
implementation
of 3 Projects
identified in the
SDBIP
100%
implementation of
projects in the
SDBIP
80% 100% %
Basic Service
Delivery
Promote the
Safety of
Citizens
4.2. No of projects
implemented in relation
to the Social,
Situational, Crime
Prevention strategies
and urban safety
management of the
built environment
throughout the EMA
339 New Unit of
Measure - No
Baseline
100 100% 71.83% 81.29% 100% %
Basic Service
Delivery
Promote the
Safety of
Citizens
4.3. Implementation of
5 projects in relation to
promoting safety of
communities within the
EMA in support of
emergency and
essential services
New KPI - No
baseline
Implementation
of 4 projects
within the SDBIP
Implementation
of 5 projects
within the SDBIP
100%
Implementation of
the SDBIP
77% 100% %
Basic Service
Delivery
Promote the
Safety of
Citizens
4.4.a) Loss of life from
fire and other
emergencies per
100000 population
served
1.92 1.5 1.04 1 0 1.04 Number
Basic Service
Delivery
Promote the
Safety of
Citizens
4.4.b) Value of property
destroyed by fire per
R1000 of rateable
value
0.93 1.34 0.95 0.85 0 0.95 Rand
Plan 4 - Fostering a Socially Equitable Environment
Plan owner: Musa Gumede

National Key
Performance Area
Strategic
Focus Area
Key Performance
Indicator
Amended Key
Performance
Indicator
Baseline as at 30
June 2013
Amended
Baseline
Annual Target
15/16
Amended
Annual Target
5 Year Target
16/17
Amended 5 year
Target
Q3 Target -
March 2016
Amended Q3
Target
Q4 Target -
June 2016
Amended Q4
Target
Unit of
Measure
Amended Unit
of Measure
Reason for
Amendment
Basic Service
Delivery
Promote the
Safety of
Citizens
4.4.c) 100%
implementation of the
SDBIP Projects with
regards to reducing the
incidence and severity
of fire and other
emergencies
New KPI - No
baseline
77.22 100% 89.55% 100% 71.8 64.11 100 89.55 %
Basic Service
Delivery
Promote the
Safety of
Citizens
4.5. Ensure the safety
and security of
municipal councillors,
officials and municipal
assets
75 99.48 75 %
Implementation
of Projects linked
to the SDBIP
75 %
Implementation of
Projects linked to
the SDBIP
66.7% 75% %
Basic Service
Delivery
Promote the
Health of
Citizens
4.6. Number of clinics
reaching the ideal clinic
status
New KPI - No
baseline
10 5 20 0 10 5 Number The National
Department of
Health ideal clinic
requirements have
been revised and
includes compulsory
elements which
municipal clinics do
not have i.e.
alternative water and
electricity sources in
times of water
restrictions and load
shedding. Disabled
ramps and hand rails
are also compulsory.
The current funding Basic Service
Delivery
Promote the
Health of
Citizens
4.7. Enhance
Enviromental Health
Services
New KPI - No
baseline
432 432 324 432 Number
Basic Service
Delivery
Promote the
Health of
Citizens
4.8. Strengthen
disease survilliance
and vector control
services
New KPI - No
baseline
1 1 0 1 Number

Key Performance
Indicator
Amended Key
Performance Indicator
Baseline as at
30 June 2015
Amended
Baseline
Annual Target 15/16 Amended Annual
Target
5 Year Target
16/17
Amended 5
year Target
Q3 Target
as at-
March 2016
Amended Q3
Target
Q4 Target as
at- June
2016
Amended Q4
Target
Unit of Measure Amended
Unit of
Measure
Reason for
Amendment
5. 1. % implementation
of the Work Place Skills
Plan
65 93 75 100 0 75 %
5.2. Compilation and
submission of the
Workplace Skills Plan by
30 April
100 No baseline,
new unit of
measure
100 100 80 100 %
5. 3. The percentage of a
Municipality's budget
actual spent on
implementing its
workplace skills plan
1.3 1.62 1% of payroll 1% of payroll 0 1 %
5.4 Implement the
Sucession Planning and
Talent Management
Framework
Provide Talent
Management and
Succession Planning
guidelines and
recommendations
100% 100 100% 100% 73.33% 100% % Line
management is
responsible for
implementing
TM with the
guidance and
assistance of the
TM department.
5. 5. Number of activities
established to promote
the city as a centre for
learning
26 31 26 130 18 26 Number
Plan 5: Creating a Platform for Growth, Empowerment and Skills Development
Plan Owner: Dumisile Nene

Key Performance
Indicator
Amended Key
Performance Indicator
Baseline as at
30 June 2015
Amended
Baseline
Annual Target 15/16 Amended Annual
Target
5 Year Target
16/17
Amended 5
year Target
Q3 Target
as at-
March 2016
Amended Q3
Target
Q4 Target as
at- June
2016
Amended Q4
Target
Unit of Measure Amended
Unit of
Measure
Reason for
Amendment
5.6 Create an integrated
HR System to provide
for accurate and timeous
remuneration of
employees and enable
management to
effectively manage their
employees.
New KPI No
Baseline
91 100 100 78.75 100 %
5.7 Provide accurate,
valid and reliable human
capital metrics, analysis
and recommendations.
New KPI No
Baseline
100 100 100 75 70 100 %
5.8. The number of
people from employment
equity target groups
employed in the
three highest levels of
management in
compliance with a
municipality’s approved
employment equity plan:
PWD
50 64 64 223 64 319 64 319 64 319 Number
5.9. The number of
people from employment
equity target groups
employed in the
three highest levels of
management in
compliance with a
municipality’s approved
employment equity plan:
FEMALE TOP
21 29 Female Top= 28 Female Top= 37 30 37 26 37 28 37 Number

Key Performance
Indicator
Amended Key
Performance Indicator
Baseline as at
30 June 2015
Amended
Baseline
Annual Target 15/16 Amended Annual
Target
5 Year Target
16/17
Amended 5
year Target
Q3 Target
as at-
March 2016
Amended Q3
Target
Q4 Target as
at- June
2016
Amended Q4
Target
Unit of Measure Amended
Unit of
Measure
Reason for
Amendment
5.10. The number of
people from employment
equity target groups
employed in the
three highest levels of
management in
compliance with a
municipality’s approved
employment equity plan:
FEMALE SENIOR
36 106 Female Senior= 92 Female Senior=
132
100 132 90 132 92 132 Number
5.11. The number of
people from employment
equity target groups
employed in the
three highest levels of
management in
compliance with a
municipality’s approved
employment equity plan:
FEMALE MIDDLE
260 297 Female Middle= 275 Female Middle=
375
275 375 275 375 275 375 Number
5.12.Addressing the low
level of youth and adult
language and numeracy
skills
100 No baseline, new
unit of measure100% achievement of
SDBIP targets
Increase in youth
and adult literacy
8 12 Number

Key Performance
Indicator
Amended Key
Performance Indicator
Baseline as at
30 June 2015
Amended
Baseline
Annual Target 15/16 Amended Annual
Target
5 Year Target
16/17
Amended 5
year Target
Q3 Target
as at-
March 2016
Amended Q3
Target
Q4 Target as
at- June
2016
Amended Q4
Target
Unit of Measure Amended
Unit of
Measure
Reason for
Amendment
5.13. Encouraging and
supporting cooperatives,
small enterprises, worker
initiated, NGO and
community training
initiatives
100 No baseline, new
unit of measure5 Programmes 5 Programmes 5 5 Number
5.14. Increasing public
sector capacity for
improved service
delivery and supporting
the building of a
developmental state
87.5 No baseline, new
unit of measure3 Training
Programmes for
councillors developed
100%
achievement of
SDBIP targets
100% 100% Percentage
5.15. Building career and
vocational guidance
100 No baseline,
new unit of
measure
1 exhibition, 1 financial
aid assistance and 4
community based
career expose
100%
achievement of
SDBIP targets
3 6 Number = 1
exhibition, 1
financial aid
assistance and 4
community
based career
expose
5.16 Provide
Performance
Management training for
new staff in Task Grade
5 and above within 2
months of their
commencement
Conduct Performance
mangement training
sessions every quarter
New KPI No
Baseline
No baseline,
new unit of
measure
100 72 100 72 100 54 100% 72 Percentage Number Performance
Management
Training is
conducted on an
ongoing basis
for all new staff
however we
cannot control
when staff
attend these
sessions
5.17. Interventions
introduced to improve
productivity, efficiency
and effectiveness within
the municipality
102 82 66 interventions 80 Interventions 80 90 45 53 66 80 Number Number Targets
increased as
projects were
refined to be
more specific
and due to the
printer audit
moving faster
than anticipated
(Moved from
plan 7)
15/16 IDP Drafts
National Key
Performance
Area
Strategic
Focus Area
Key
Performance
Indicator
Amended Key
Performance
Indicator
Baseline as at
30 June 2014
Amended
Baseline
Annual Target
15/16
Amended
Annual Target
5 Year Target
16/17Amended
5 Year
Target
Q3
Target - Amended
Q3
Target
Q4
Target Amended
Q4
Target
Unit of
Measure
Amended
Unit of
Measure
Reason for Amendment
Local
Economic
Development
(LED)
Access and
Inclusivity
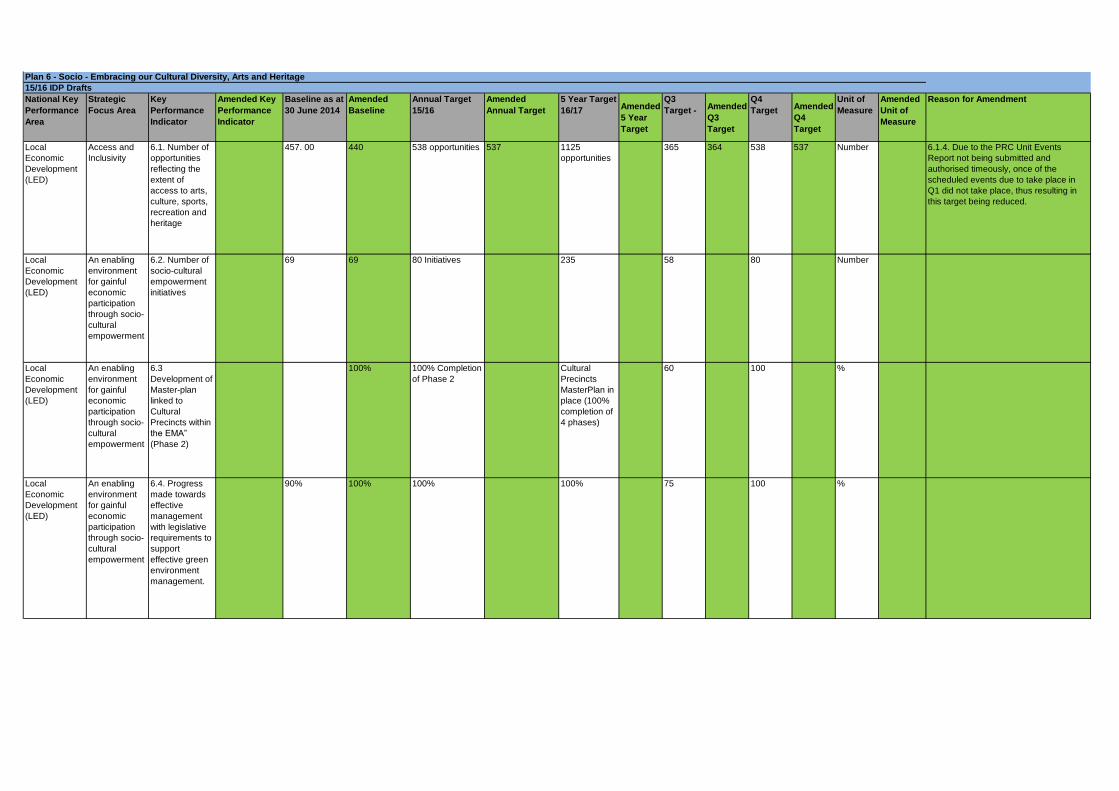
6.1. Number of
opportunities
reflecting the
extent of
access to arts,
culture, sports,
recreation and
heritage
457. 00 440 538 opportunities 537 1125
opportunities
365 364 538 537 Number 6.1.4. Due to the PRC Unit Events
Report not being submitted and
authorised timeously, once of the
scheduled events due to take place in
Q1 did not take place, thus resulting in
this target being reduced.
Local
Economic
Development
(LED)
An enabling
environment
for gainful
economic
participation
through socio-
cultural
empowerment
6.2. Number of
socio-cultural
empowerment
initiatives
69 69 80 Initiatives 235 58 80 Number
Local
Economic
Development
(LED)
An enabling
environment
for gainful
economic
participation
through socio-
cultural
empowerment
6.3
Development of
Master-plan
linked to
Cultural
Precincts within
the EMA”
(Phase 2)
100% 100% Completion
of Phase 2
Cultural
Precincts
MasterPlan in
place (100%
completion of
4 phases)
60 100 %
Local
Economic
Development
(LED)
An enabling
environment
for gainful
economic
participation
through socio-
cultural
empowerment
6.4. Progress
made towards
effective
management
with legislative
requirements to
support
effective green
environment
management.
90% 100% 100% 100% 75 100 %
Plan 6 - Socio - Embracing our Cultural Diversity, Arts and Heritage

National Key
Performance
Area
Strategic
Focus Area
Key
Performance
Indicator
Amended Key
Performance
Indicator
Baseline as at
30 June 2014
Amended
Baseline
Annual Target
15/16
Amended
Annual Target
5 Year Target
16/17Amended
5 Year
Target
Q3
Target - Amended
Q3
Target
Q4
Target Amended
Q4
Target
Unit of
Measure
Amended
Unit of
Measure
Reason for Amendment
Local
Economic
Development
(LED)
An enabling
environment
for gainful
economic
participation
through socio-
cultural
empowerment
6.5.
Implementation
of Sporting
opportunities
65 New Unit of
Measure - No
baseline
100% 100% (325) 81 100 %
Local
Economic
Development
(LED)
An enabling
environment
for gainful
economic
participation
through socio-
cultural
empowerment
6.6.
Implementation
of Cultural and
Natural
Heritage project
for
infrastructure
development.
100 100% 90% 100% 74 67 100 90 % There is a hold-up with the eThekwini Art
Prize Project at the moment due to
commissioned artists encountering
challenges in coming up with a suitable
version of the piece they intend
constructing on site. No progress can be
achieved unless aesthetic and structural
engineering requirements have been met
as per competition rules and
requirements put forward by the Panel of
Judges This project is now 40%
complete, that is, the latest version of the
drawings by commissioned artists will be
submitted to QS for comment and, in
2016/17 Financial Year, the construction
of the piece on site will commence as per
existing plan.
Local
Economic
Development
(LED)
An enabling
environment
for gainful
economic
participation
through socio-
cultural
empowerment
6.7Execution of
Heritage
programmes
33 43 44 Programmes 195
Programmes
43 44 Number
Local
Economic
Development
(LED)
An enabling
environment
for gainful
economic
participation
through socio-
cultural
empowerment
6.8.
Preservation
and
Management of
Heritage Assets
0 New KPI - No
Baseline
6 mechanisms 10 3 6 Number

National KPA Strategic Focus
Area
Key Performance
Indicator
Baseline Amended
Baseline
Annual
Target 15/16
Amended
Annual
Target 15/16
5 Year Target
16/17
Amended 5 Year
Target 16/17
Q3 Target -
Mar 2016
Amended Q3
Target - Mar
2016
Q4 Target -
Jun 2016
Amended Q4
Target - Mar
2016
Unit of
Measure
Amended
Unit of
Measure
Reasons for
Amendments
7.1. Number of
international
agreements and
projects, events and
protocol projects and
intergovernmental
agreements and
projects that enhance
Municipal service
delivery.
186 138 90 435 67 52 90 70 Number Project targets
change to align
with Scorecard
7.2 Customer
satisfaction based on
mystery shopper
programme
New KPI - no baseline New KPI - no
baseline
Average
annual score
of 85%
90% 0% 85% %
7.3 Integrated
services meeting the
needs of the
communities in the
one stop shops
New KPI - no baseline
New KPI – no
baseline
Maintain 32
one stop
centres
Maintain 32 one
stop centres
7.4. Number of
interventions to
encourage effective
public participation in
Council activities
877 18 686 2551 17662 997 17662 Number
7.5. No. of
communication tools
maintained and
developed in line with
the Adopted
Communication
Strategy and Policy in
order to provide
facilities for the
Municipality to
communicate
internally and
externally
9 10 10
communicatio
n tools
maintained
and
development
of 10 tool
12
communication
tools maintained
9 10 Number
Plan 7 - Good Governance and Responsive Local Government
Plan Owner: Sipho Cele
Good Governance
and public
participation
Ensure accessibility
and promote
governance
National KPA Strategic Focus
Area
Key Performance
Indicator
Baseline Amended
Baseline
Annual
Target 15/16
Amended
Annual
Target 15/16
5 Year Target
16/17
Amended 5 Year
Target 16/17
Q3 Target -
Mar 2016
Amended Q3
Target - Mar
2016
Q4 Target -
Jun 2016
Amended Q4
Target - Mar
2016
Unit of
Measure
Amended
Unit of
Measure
Reasons for
Amendments
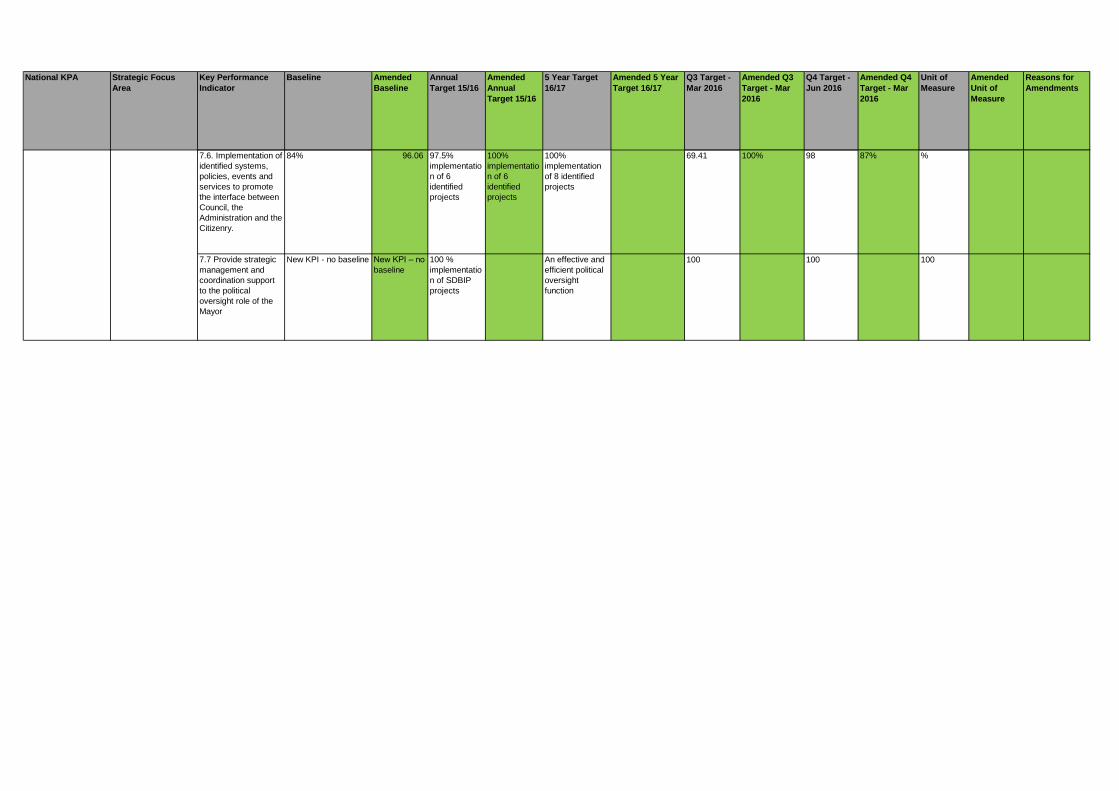
7.6. Implementation of
identified systems,
policies, events and
services to promote
the interface between
Council, the
Administration and the
Citizenry.
84% 96.06 97.5%
implementatio
n of 6
identified
projects
100%
implementatio
n of 6
identified
projects
100%
implementation
of 8 identified
projects
69.41 100% 98 87% %
7.7 Provide strategic
management and
coordination support
to the political
oversight role of the
Mayor
New KPI - no baseline New KPI – no
baseline
100 %
implementatio
n of SDBIP
projects
An effective and
efficient political
oversight
function
100 100 100
Good Governance
and public
participation
Ensure accessibility
and promote
governance

National KPA Strategic
Focus Area
Key
Performance
Indicator
Amended KPI Baseline Amended
Baseline
Annual
Target
15/15/16
Amended
Annual Target
15/16
5 Year
Target
16/17
Amende
d 5 Year
Target
16/17
Q3
Target -
Mar
2016
Amended
Q3 Target
- Mar
2016
Q4 Target -
Jun 2016
Amended
Q4 Target -
Mar 2016
Unit of
Measure
Amended
Unit of
Measure
Reasons for
Amendments
Good Governance
and Public
Participation
7.8 Percentage
implementation of
the anti-
corruption and
human rights
programme
New KPI -
no baseline
71.5 100% 100% 100 100 %
7.9 Develop &
faciliate
implementation of
ERM systems in
the municipality.
87 New KPI –
no baseline
109 100% 68 67 109 90 Number KPI owner name
changed
7.10 Percentage
of audit projects
undertaken as
per approved
audit plan to
determine the
adequacy of
internal controls
designed to
mitigate against
identified risks
108% 90 90% 100% 70% 60% 90% Percentage Determining the
percentage of audits
finalised,
(completed/finalised
audits is defined as an
audit with a signed
report and or a draft
report issued to
management for
comment for at least 7
days at reporting date
plus special
request/adhoc audits
with final report and or
draft report as defined
above, and or if it is
reported in the Audit
Committee
report/agenda plus audit
log for the period and for
investigation reports -
draft report issued to
city manager)
Plan 7 - Good Governance and Responsive Local Government
Plan owner: Sibusiso Sithole
Create an
efficient,
effective and
accountable
administratio
n
National KPA Strategic
Focus Area
Key
Performance
Indicator
Amended KPI Baseline Amended
Baseline
Annual
Target
15/15/16
Amended
Annual Target
15/16
5 Year
Target
16/17
Amende
d 5 Year
Target
16/17
Q3
Target -
Mar
2016
Amended
Q3 Target
- Mar
2016
Q4 Target -
Jun 2016
Amended
Q4 Target -
Mar 2016
Unit of
Measure
Amended
Unit of
Measure
Reasons for
Amendments
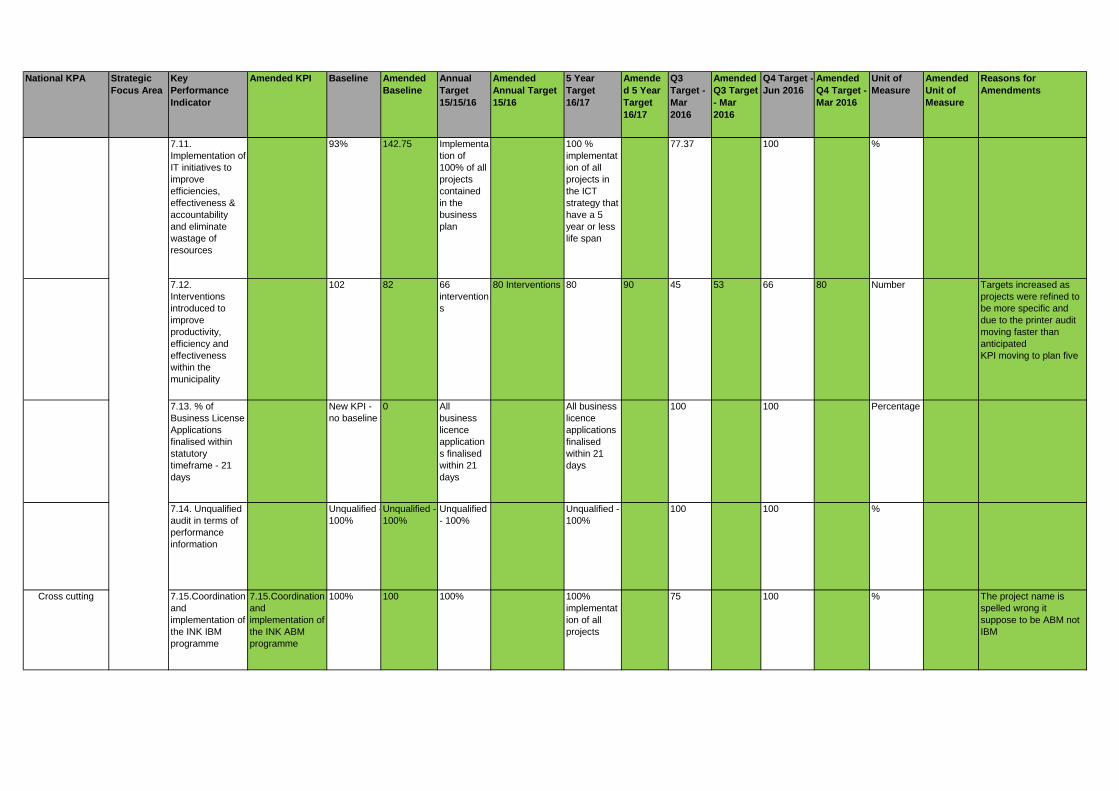
7.11.
Implementation of
IT initiatives to
improve
efficiencies,
effectiveness &
accountability
and eliminate
wastage of
resources
93% 142.75 Implementa
tion of
100% of all
projects
contained
in the
business
plan
100 %
implementat
ion of all
projects in
the ICT
strategy that
have a 5
year or less
life span
77.37 100 %
7.12.
Interventions
introduced to
improve
productivity,
efficiency and
effectiveness
within the
municipality
102 82 66
intervention
s
80 Interventions 80 90 45 53 66 80 Number Targets increased as
projects were refined to
be more specific and
due to the printer audit
moving faster than
anticipated
KPI moving to plan five
7.13. % of
Business License
Applications
finalised within
statutory
timeframe - 21
days
New KPI -
no baseline
0 All
business
licence
application
s finalised
within 21
days
All business
licence
applications
finalised
within 21
days
100 100 Percentage
7.14. Unqualified
audit in terms of
performance
information
Unqualified -
100%
Unqualified -
100%
Unqualified
- 100%
Unqualified -
100%
100 100 %
Cross cutting 7.15.Coordination
and
implementation of
the INK IBM
programme
7.15.Coordination
and
implementation of
the INK ABM
programme
100% 100 100% 100%
implementat
ion of all
projects
75 100 % The project name is
spelled wrong it
suppose to be ABM not
IBM
Create an
efficient,
effective and
accountable
administratio
n

Nationa
l Key
Perform
ance
Area
Strategic
Focus Area
Key Performance
Indicator
Amended Key
Performance
Indicator
Baselin
e
Amende
d
Baselin
e
Annual
Target
Amended Annual
Target
Five Year
Target
Amende
d Five
Year
Target
Unit of
Measur
e
Amende
d Unit
of
Measur
e
Q3
Target -
Mar
2016
Amende
d Q 3
Target
Q4
Target -
Jun
2016
Amended
Q 4 Target
Reason for
Amendment
8.1. The percentage of
the municipality’s
capital budget actually
spent on capital
projects in terms of the
municipality’s
integrated development
plan including housing
top structure
expenditure.
89.00 92.16 90 100 Percent
age
55 90
8.2. Issue 1
Supplementary Roll per
year.
5.00
Supple
mentary
Rolls
3
Supple
mentary
Rolls
1
Supplement
ary Roll
1
Suppleme
ntary Roll
Number 0 1
Grow and
Diversify
our
Revenues
8.3. Develop and
implement a new Billing
System
New KPI-
No
baseline
80.75 100% Full
implement
ation of
the
system
Percent
age
100 100
8. 4. Outstanding
Service Debtors to
Revenue
25.61 27.61 38% 38% Percent
age
0% 38%
8.5. Debt Coverage
Ratio (No. of times)
11.10 12.22 11 15 Number
of Times
11 11
8.6. Cost Coverage
Ratio (No. of Times)
4.70 3.98 2 2 Number
of Times
2 2
8.7. Gearing Ratio
(Debt to Total Income
including grant income)
39.00 35 45 40 Percent
age
45 45
Plan 8: Financially Accountable and Sustainable City
Plan Owner: Krish Kumar
Municip
al
Financia
l
Viability
and
Manage
ment
Strategic &
Sustainable
budgeting
Sound
Financial
Manageme
nt &
Reporting

Nationa
l Key
Perform
ance
Area
Strategic
Focus Area
Key Performance
Indicator
Amended Key
Performance
Indicator
Baselin
e
Amende
d
Baselin
e
Annual
Target
Amended Annual
Target
Five Year
Target
Amende
d Five
Year
Target
Unit of
Measur
e
Amende
d Unit
of
Measur
e
Q3
Target -
Mar
2016
Amende
d Q 3
Target
Q4
Target -
Jun
2016
Amended
Q 4 Target
Reason for
Amendment
8.8. Report from
Auditor General
100 Unqualif
ied audit
report
Unqualified
audit report
Unqualifie
d audit
report
Percent
age
0 100
8.9. Aligning SCM
Processes to ISO
9001: Gap analysis;
assessment &
verification report; and
publicity to be done
Aligning SCM process
to ISO 9001: 1. 1.
Appointment of a
quality management
consultant by 30 June
2016.( To review the
exiting Quality
Management System
within the eThekwini
Municipality through
document control,
management
responsibility, resource
management, service
performance &
measurement, and
analysis & reporting)
45.00 85 1.
Complete
plan; 2.
Undertake
workshops;
3. Review
results; 4.
Implement
recommend
ations; 5.
Produce
final report;
and 6.
Publicity
Appointment of a
quality
management
consultant by 30
June 2016.
100 Percent
age
50 75 100 The complexity of
project requires
certain expertise
that is not
available within
SCM( to prepare
system and the
training of oficials)
8.10. Maintain an
overall payment rate of
Cash over Monthly
billing at 95%
104.84 103.04 95 95 Percent
age
95 95
8.11. Monitoring and
reporting on
organisational
procurement plans for
top 150 Capital Budget
line items
100.00 100 100% 100% Percent
age
80 100
8.12. Percentage
implementation of
procurement plan and
monitoring thereof for
SCM managed
contracts
100.00 100 100% 100% Percent
age
80 100
Municip
al
Financia
l
Viability
and
Manage
ment
Sound
Financial
Manageme
nt &
Reporting

Nationa
l Key
Perform
ance
Area
Strategic
Focus Area
Key Performance
Indicator
Amended Key
Performance
Indicator
Baselin
e
Amende
d
Baselin
e
Annual
Target
Amended Annual
Target
Five Year
Target
Amende
d Five
Year
Target
Unit of
Measur
e
Amende
d Unit
of
Measur
e
Q3
Target -
Mar
2016
Amende
d Q 3
Target
Q4
Target -
Jun
2016
Amended
Q 4 Target
Reason for
Amendment
8.13. Implementation
of a Web-enabled
Procurement System
(JDE SSS) for services -
Pilot Plan at
Architecture:
Preliminary planning;
implementation
methodology and
strategy; policy and
SOP development
Implementation of JDE
upgrade by June 2016.
New KPI-
No
baseline
100 Production
of roll plan
for
Architecture
.
(1)
Documentation of
business process
and specifications.
(2) Implementation
of SSS-Supplier
Self Services (3)
Implementation of
JDE E-One
upgrade
100 Percent
age
75 100 The current SSS will
now be replaced by
an Enterprise One
version of SSS,
which will replicate
current business
processes of the
existing SSS as well
as improve where it
is in
scope.(therefore no
progress would be
made till E1 update
is complete)
Durban
Energy
Office
8.14. Implementation of
the Durban Energy
Office programmes
100.00 100 100%
implementa
tion of
programme
s
100% Percent
age
75 100
8.15. Optimal
availability of fleet
vehicles (excluding
buses)
95.00 94 90.00 90.00 Percent
age
90 90
8.16. Optimal
availability of bus fleet
95.00 95 90.00 90.00 Percent
age
90 90
Municip
al
Financia
l
Viability
and
Manage
ment
Sound
Financial
Manageme
nt &
Reporting
Value-for-
money
expenditure

Key Performance Indicator Amended Key
Performance Indicator
Key Performance
Indicator Description
Amended Key
Performance Indicator
Description
Baseline as at
30 June 2014
Amended
Baseline
Annual
Target 2015
/ 2016
Amended
Annual
Target
2015/2016
Five Year
Target
Amended 5
Year Target
Unit of
Measure
Amended
Unit of
Measure
Q3
Target
Mar
2016
Amended
Q3 Target
Mar 2016
Q4
Target
June
2016
Amended
Q4 Target
June 2016
Reason for
Amendment
21.1. Economic Impact -
Contribution to GDP calculated
by independent research
organisation compared to
budgeted target
Due to a sluggish global
and local economy, we
expect our contribution to
GDP to be lower than in
the prior year. In addition,
the impact of Ebola and
limited direct international
flights into Durban creates
uncertainty on our
revenue for 2015.
We are anticipating an
increase in revenue
and hence an increase
in GDP contribution for
the current year
3.12 4.6 2.8 3.5 2.9 5 Rand
Billions
0 2.8 3.5
21.2. International delegate
days-Number of international
delegates days as calculated in
independent economic impact
assessment compared to
budgeted target
Total delegate days-
Number of national
and international
delegate days as
calculated in
independent economic
impact assessment
compared to budgeted
target
Due to global factors,we
expect a decline in
international delegates
and the time they spend
in the country which in
turn impacts on
international delegate
days.This result is
calculated by an
independent company at
the end of each fiscal thus
can only be monitored on
an annual basis.
Due to global factors
such as economic
downturn and
terrorism attacks
affecting world travel,
we expect fewer
delegate days in the
current fiscal.
New KPI- No
Baseline
New KPI-
No Baseline
400000 1250000 400000 1550000 Days 0 400000 1250000
21.3. Jobs created-Number of
direct and indirect jobs created
compared to budgeted target
Jobs created is directly
linked to Economic impact
and delegate days. We
expect lower economic
impact and hence a drop
in jobs created. This
result is calculated by an
independent company at
the end of each fiscal thus
can only be monitored on
an annual basis.
We expect an increase
in jobs created due to
the International Aids
Conference to be held
this fiscal which
requires a large
amount of labour.
7773 10874 7300 8500 7350 9500 Jobs 0 7300 8500
21.4. Human Capital
Development-Achieve Training
Days as per Training Plan
Schedule
Human Capital
Development-
Percentage of the
training budget that
has been spent
151 157.43 80% 100% 90% Percentage 65 60 80
Plan 21: ICC
Plan Owner: Musa Mbhele

Key Performance Indicator Amended Key
Performance Indicator
Key Performance
Indicator Description
Amended Key
Performance Indicator
Description
Baseline as at
30 June 2014
Amended
Baseline
Annual
Target 2015
/ 2016
Amended
Annual
Target
2015/2016
Five Year
Target
Amended 5
Year Target
Unit of
Measure
Amended
Unit of
Measure
Q3
Target
Mar
2016
Amended
Q3 Target
Mar 2016
Q4
Target
June
2016
Amended
Q4 Target
June 2016
Reason for
Amendment
21.5. B-BBEE Level certification 4 2 4 3 Level No 0 4
21.6. Graduate Programme-
Total number of graduates
engaged in financial year
Graduates & Student
Programme-Total
number of graduates &
students trained at ICC
in financial year
Graduates & Students are
recruited for a 12 month
period
13 New KPI-
No Baseline
14 20 14 25 Number 0 14 20
21.7. Student Programme-
Total number of students
engaged in financial year
DELETE Graduates & Students are
recruited for a 12 month
period
DELETE 11 DELETE 12 DELETE 12 DELETE Number DELETE 0 DELETE 12 DELETE DELETE
21.8. Staff Performance-
Percentage of staff performing
at 3 and upwards
68 89 75 70 80 75 Percentage 0 75 70
21.9. Revenue-Actual revenue
generated
152.7 157.8 155.80 168.9 176.41 180 Rand
Millions
114 124 155.8 168.9
21.10. Operating Expenditure-
Actual operating expenditure
(excl. cost of sales, rates &
depreciation) as a percentage
of Revenue (excl.
recoverables)
Operating Expenditure is
expected to increase due
to the filling of staff
vacancies and the
implementation of repairs
and maintenance that has
been deferred over the
past few years.
59 62.34 65 65 68 Percentage 65 65 Operating
Expenditure is
expected to
increase due to
the filling of
staff vacancies
and the
implementation
of repairs and
maintenance
that has been
deferred over
the past few
years.
21.11. Capital expenditure
budget-Percentage of the
capital expenditure budget that
has been spent.
9.8 39.11 100 80 100 85 Percentage 80 60 100 80
21.12. Unqualified Audit-
Achieve Unqualified Audit from
the AG
Yes Yes Yes Yes Yes/No Yes Yes

Key Performance Indicator Amended Key
Performance Indicator
Key Performance
Indicator Description
Amended Key
Performance Indicator
Description
Baseline as at
30 June 2014
Amended
Baseline
Annual
Target 2015
/ 2016
Amended
Annual
Target
2015/2016
Five Year
Target
Amended 5
Year Target
Unit of
Measure
Amended
Unit of
Measure
Q3
Target
Mar
2016
Amended
Q3 Target
Mar 2016
Q4
Target
June
2016
Amended
Q4 Target
June 2016
Reason for
Amendment
21.13. Media Coverage-Rand
value Rm of effective media
coverage achieved
26.8 33 24 26 Rand
Millions
18 24
21.14. Service excellence-
Weighted average percentage
rating achieved for customer
satisfaction
88.2 93.9 88 90 Percentage 88 88
21.15. ISO 9001-ISO
certification retained
Certifications are audited
on an annual basis where
certification is valid for 12
months from
recertification date.
Yes Yes Yes Yes Yes/No No Yes
21.16. TGCSA 5-Star Grading
(Tourism Star Grading
Maintained)
Certifications are audited
on an annual basis where
certification is valid for 12
months from
recertification date.
5 5 5 5 Number 0 5
21.17. National delegate days-
Number of national delegates
days as calculated in
independent economic impact
assessment compared to
budgeted target
DELETE The local economy is
currently under severe
strain with Corporates and
Government reducing
spending. As a result, we
expect a drop in national
delegate days.
This result is calculated by
an independent company
at the end of each fiscal
thus can only be
monitored on an annual
basis.
DELETE New KPI - No
Baseline.
DELETE 600000 DELETE 620000 DELETE Days DELETE 0 DELETE 600000 DELETE DELETE
21.18. B-BBEE Procurement-
Procurement from Level 1 - 5
suppliers / service providers
New KPI - No
Baseline.
86 75 75 Percentage 75 75
21.19. Employment equity-%
of Top Management & Senior
Management Black:%
New KPI - No
Baseline.
71.42 60 60 Percentage 60 60
21.20. Employment equity-%
of Top Management & Senior
Management Female:%
New KPI - No
Baseline.
57.14 50 50 Percentage 50 50

Key Performance Indicator Amended Key
Performance Indicator
Key Performance
Indicator Description
Amended Key
Performance Indicator
Description
Baseline as at
30 June 2014
Amended
Baseline
Annual
Target 2015
/ 2016
Amended
Annual
Target
2015/2016
Five Year
Target
Amended 5
Year Target
Unit of
Measure
Amended
Unit of
Measure
Q3
Target
Mar
2016
Amended
Q3 Target
Mar 2016
Q4
Target
June
2016
Amended
Q4 Target
June 2016
Reason for
Amendment
21.21. Employment equity-%
of Total Staff Compliment
Disabled: %
New KPI - No
Baseline.
0 2 2 3 Percentage 2 1 2
21.22. Gross Margin - Gross
margin as a percentage of
revenue
New KPI - No
Baseline.
72 70 68 70 68 Percentage 0 70 68
21.23. Utility Consumption-
Reduction in percentage usage
of electricity
New KPI - No
Baseline.
5 5 1 2 Percentage 0 5
21.24. Occupancy-Total net m²
sold against total net m²
available within main halls and
meeting rooms across the
complex
New KPI - No
Baseline.
43.2 50 40 55 Percentage 0 50 40
21.25. Risk Management-Risk
management and mitigation. %
Tasks completed on due date
as listed on the Task Risk
Register
New KPI - No
Baseline.
63 100 80 100 90 Percentage 100 80 100 80
21.26. Planned Maintenance-
Complete tasks as per the
annual maintenance plan
New KPI - No
Baseline.
100 100 80 100 90 Percentage 0 100 80
21.27. ISO 14001-ISO
certification retained
Certifications are audited
on an annual basis where
certification is valid for 12
months from
recertification date.
New KPI - No
Baseline.
Yes Yes Yes Yes/No No Yes
21.28. ISO 22000-ISO
certification retained
Certifications are audited
on an annual basis where
certification is valid for 12
months from
recertification date.
New KPI - No
Baseline.
Yes Yes Yes Yes/No No Yes
21.29. HACCP-HACCP
certification retained
Certifications are audited
on an annual basis where
certification is valid for 12
months from
recertification date.
New KPI - No
Baseline.
Yes Yes Yes Yes/No No Yes
21.30. AIPC Certification-AIPC
Gold Quality Status
Certifications are audited
on an annual basis where
certification is valid for 12
months from
recertification date.
New KPI - No
Baseline.
Yes Yes Yes Yes/No No Yes

Plan Owner: Musa Mbhele
Key Performance
Indicator
Amended Key
Performance Indicator
Baseline as at
30 June 2014
Amended
Baseline
Annual Target
2015 / 2016
Amended
Annual Target
2015/2016
Five Year
Target
Amended Five
Year Target
Unit of
Measure
Amended
Unit of
Measure
Q3 Target
Mar 2016
Amended
Q3 Target
Mar 2016
Q4
Target
June
2016
Amended
Q4 Target
June 2016
Reason for Amendment
22.1. Supply an appropriate
quality of water to maintain
a world-class oceanarium,
subject to port operations
and sand pumping
schedules
Water quality
managed well on
100% days
New KPI - No
Baseline.
Coliform counts
below 51
CFU/100ml
Water quality
(Ammonia
levels) of
incoming
water below
0.3mg/l
Coliform counts
below 51
CFU/100ml
Water quality
(Ammonia
levels) of
incoming
water below
0.3mg/l
Number 50 <0.3mg/l 50 <0.3mg/l The coliform counts may
not affect aquatic
organisms but ammonia
levels above 0.3mg/l will
cause harm and can be
managed through
biofiltration and
recirculation
22.2. Ensure functional life
support system
components through
scheduled maintenance
New KPI- No
baseline
100 At least 80% of
scheduled
maintenance
undertaken as per
the maintenance
schedule
100%
preventative
maintenance
undertaken as
per the
maintenance
schedule.
At least 80% of
scheduled
maintenance
undertaken as
per the
maintenance
schedule
100%
preventative
maintenance
undertaken
as per the
maintenance
schedule.
Percentage 80 100 80 100 To ensure conservation
of assets.
22.3. Maintain a functional
water intake and
reticulation system,
providing an appropriate
volume of water to
maintain a world-class
oceanarium, subject to port
operations and sand
pumping schedules
New KPI- No
baseline
97 Monitor well points
system to extract
minimum of 4.4
million litres/day
on 96% of days
Monitor well
points system to
extract minimum
of 4.4 million
litres/day on
96% of days
Percentage 96 96
22.4. Increase procurement
from disadvantaged
businesses (level 1 to 5)
Achieved 93% for
the period ending
June 2014
Achieved
89% for the
period ending
June 2015
To procure 85% of
all goods &
services from
historically
disadvantaged
businesses (level 1
to 5)
To procure 85%
of all goods &
services from
historically
disadvantaged
businesses (level
1 to 5)
Percentage 85 85
22.5. Manage actual
occupancy of lettable space
against available
Achieved 99.60%
occupancy
Achieved
99%
occupancy
To achieve 95% of
occupancy of
lettable space in
the Village Walk
To achieve 95%
of occupancy of
lettable space in
the Village Walk
Percentage 95 95
Plan 22: uShaka

Key Performance
Indicator
Amended Key
Performance Indicator
Baseline as at
30 June 2014
Amended
Baseline
Annual Target
2015 / 2016
Amended
Annual Target
2015/2016
Five Year
Target
Amended Five
Year Target
Unit of
Measure
Amended
Unit of
Measure
Q3 Target
Mar 2016
Amended
Q3 Target
Mar 2016
Q4
Target
June
2016
Amended
Q4 Target
June 2016
Reason for Amendment
22.6. Survey guests and
obtain 95% "overall park
experience" positive guest
satisfaction.
Achieved overall
95% park
experience
satisfaction from
the surveyed
guests
Achieved
overall 95%
park
experience
satisfaction
from the
surveyed
guests
To survey 500
guests per month
to achieve 95% of
"overall park
experience"
satisfaction from
the surveyed
guests.
To survey 500
guests per month
to achieve 95%
of "overall park
experience"
satisfaction from
the surveyed
guests.
Percentage 95 95
22.7. Not exceed 10 lost
time injuries
New KPI- No
baseline
11 To not exceed 10
lost time injuries
To not exceed 10
lost time injuries
Number 10 0 10 The target is annual,
therefore there should
be no quarterly targets
22.8. Achieve a Clean audit
opinion for prior financial
year.
Achieved Achieved To achieve a clean
audit opinion for
prior financial year
To achieve a
clean audit
opinion for prior
financial year
Yes/No Yes 0 Yes This is an annual target
and measure is Yes/No
22.9. Compilation of
effective Employment
Equity plans and reports for
Top Management
New KPI- No
baseline
86% To achieve 71% of
the designated
group at Top
Management level
To achieve 71%
of the designated
group at Top
Management
level
Percentage 71 71
22.10. Compilation of
effective Employment
Equity plans and reports for
Senior Management
New KPI- No
baseline
64% To achieve 76%
of the designated
group at Senior
Management level
To achieve 76%
of the designated
group at Senior
Management
level
Percentage 76 76
22.11. Compilation of
effective Employment
Equity plans and reports for
Middle management
New KPI- No
baseline
95% To achieve 87% of
the designated
group at Middle
Management level
To achieve 87%
of the designated
group at Middle
Management
level
Percentage 87 87
22.12. Retention of key
DMTP technical personnel
69% of retention
achieved
89% of
retention
achieved
To achieve 80%
retention of key
critical posts
identified
To achieve 80%
retention of key
critical posts
identified
Percentage 80 80
22.13. Retain key SAAMBR
technical personnel
100% retention 100%
retention
To achieve 80%
retention of key
critical posts
identified
To achieve
90% retention
of key critical
posts
identified.
To achieve 80%
retention of key
critical posts
identified
To achieve
90%
retention of
key critical
posts
identified.
Percentage 80 90 80 90 Target has been
amended to be in line
with baseline and
current achievement.

Key Performance
Indicator
Amended Key
Performance Indicator
Baseline as at
30 June 2014
Amended
Baseline
Annual Target
2015 / 2016
Amended
Annual Target
2015/2016
Five Year
Target
Amended Five
Year Target
Unit of
Measure
Amended
Unit of
Measure
Q3 Target
Mar 2016
Amended
Q3 Target
Mar 2016
Q4
Target
June
2016
Amended
Q4 Target
June 2016
Reason for Amendment
22.14. Achievement of
budgeted admissions.
Achieved 87% of
adjusted
budgeted
admissions
Achieved
92% of
adjusted
budgeted
admissions
Achievement of
adjusted budgeted
admissions
Achievement of
adjusted
budgeted
admissions
Percentage 100 100 No amendment to
target, however a
tolerance level of
between 95% and
100% has been agreed
upon.
22.15. Achievement of
Budgeted Ticketing
Revenue.
New KPI- No
baseline
Achieved
94% of
adjusted
budgeted
revenues-
Ticketing
Achievement of
adjusted ticketing
budgeted
revenues
Achievement of
adjusted ticketing
budgeted
revenues
Percentage 100 100 No amendment to
target, however a
tolerance level of
between 95% and
100% has been agreed
upon.
22.16. Hold 4 anchor
events
New KPI- No
baseline
2 To hold four
anchor events
To hold four
anchor events
Number 3 4 Kindly consider updating
the Q3 and Q4 targets,
as the Q2 target of 2 has
already been achieved in
Q1.
22.17. Achievement of
Budgeted Food and
Beverage Revenue.
Achieved 100% of
adjusted budget
YTD
Achieved
83% of
adjusted
budget YTD
To achieve 100%
of adjusted
budgeted
revenues for Food
& Beverage
Income
To achieve 100%
of adjusted
budgeted
revenues for
Food & Beverage
Income
Percentage 100 100 No amendment to
target, however a
tolerance level of
between 95% and
100% has been agreed
upon.
22.18. Achievement of
Budgeted Merchandising
Revenue.
Achieved 98% of
adjusted budget
YTD
Achieved
88% of
adjusted
budget YTD
To achieve 100%
of adjusted
budgeted
revenues for
Merchandising
Income
To achieve 100%
of adjusted
budgeted
revenues for
Merchandising
Income
Percentage 100 100 No amendment to
target, however a
tolerance level of
between 95% and
100% has been agreed
upon.
22.19. Achievement of
Budgeted Rental Income.
Achieved 111% of
adjusted budget.
Achieved
103% of
adjusted
budget.
To achieve 100%
of adjusted
budgeted
revenues for
Rental Income
To achieve 100%
of adjusted
budgeted
revenues for
Rental Income
Percentage 100 100
22.20. Ensure that schools
footfall as per adjusted
budget is achieved
112 827 learners 150330
learners
112827 As per financial
budget
Number 95446 112827

Key Performance
Indicator
Amended Key
Performance Indicator
Baseline as at
30 June 2014
Amended
Baseline
Annual Target
2015 / 2016
Amended
Annual Target
2015/2016
Five Year
Target
Amended Five
Year Target
Unit of
Measure
Amended
Unit of
Measure
Q3 Target
Mar 2016
Amended
Q3 Target
Mar 2016
Q4
Target
June
2016
Amended
Q4 Target
June 2016
Reason for Amendment
22.21. Manage F&B debtors
& sponsorship debtors days
against targeted debtors
days
75% of functions
debtors within 30
days
New KPI - No
Baseline.
To ensure that all
F&B and
sponsorship
debtors are
collected within 30
days
To ensure that
all F & B
debtors are
collected
within 30
days.
To ensure that all
F&B and
sponsorship
debtors are
collected within
30 days
To ensure
that all F & B
debtors are
collected
within 30
days.
Percentage 100 100 F&B debtors have to be
collected within 30 days
as part of compliance
requirements but
Sponsorship debtors can
only be subject to terms
and conditions in the
sponsorship contract.
22.22. Provide large
aquarium exhibits, which
are optimally stocked with
attractive and educationally
stimulating organisms
All 6 large
exhibits stocked
and opened to
the public 100%
of the time
All 7 large
exhibits
stocked and
opened to the
public 100%
of the time
Ensure that, at
any one time in
the year, 5 large
exhibits are open
Ensure that, at
any one time in
the year, 5 large
exhibits are open
Number 5 5
22.23. Provide small
aquarium exhibits, which
are optimally stocked with
attractive and educationally
stimulating organisms
45 small exhibits
optimally stocked
and open to
public 100% of
the time
43 small
exhibits
optimally
stocked and
open to public
100% of the
time
Ensure that, at
any one time in
the year, 35 small
exhibits are open
Ensure that, at
any one time in
the year, 35
small exhibits are
open
Number 35 35
22.24. Provide at least one
new aquarium exhibit each
year, optimally stocked with
attractive and educationally
stimulating organisms
1 new exhibit
opened - glass
shrimp
1 new exhibit
opened - sea
horse exhibit
To develop at
least one new
exhibit each year
To develop at
least one new
exhibit each year
Number 0 1
22.25. Deliver conservation
orientated, entertaining and
educational dolphin shows
to guests
242 803 To do 760 dolphin
presentations a
year except when
pool down for
maintenance
To do 760
dolphin
presentations a
year except when
pool down for
maintenance
Number 570 590 760 Quarterly targets
modified to better reflect
seasonal differences in
visitor numbers and
therefore extra number
of shows provided.

Key Performance
Indicator
Amended Key
Performance Indicator
Baseline as at
30 June 2014
Amended
Baseline
Annual Target
2015 / 2016
Amended
Annual Target
2015/2016
Five Year
Target
Amended Five
Year Target
Unit of
Measure
Amended
Unit of
Measure
Q3 Target
Mar 2016
Amended
Q3 Target
Mar 2016
Q4
Target
June
2016
Amended
Q4 Target
June 2016
Reason for Amendment
22.26. Offer penguin feed
presentations to guests
126 1095 To do 760 penguin
presentations a
year except when
pool down for
maintenance
To do 760
penguin
presentations a
year except when
pool down for
maintenance
Number 570 760
22.27. Present entertaining
and educational seal shows
to guests
212 772 To do 760 seal
presentations a
year except when
pool down for
maintenance
To do 760 seal
presentations a
year except when
pool down for
maintenance
Number 570 568 760 Quarterly targets
modified to better reflect
seasonal differences in
visitor numbers and
therefore extra number
of shows provided.
22.28. Manage rental
debtors days against
targeted debtors days
New KPI - No
Baseline.
100% To ensure that all
retail debtors are
collected within 30
days(except those
that have followed
the legal route)
To ensure that all
retail debtors are
collected within
30 days (except
those that have
followed the legal
route)
Percentage 100 100
22.29. Maintain recognition
as a centre of excellence in
marine conservation,
education and live animal
displays
New KPI - No
Baseline.
100% 100% compliance
to PAAZA
accreditation
requirement
100% compliance
to PAAZA
accreditation
requirements
Percentage Yes/No 100 Yes 100 Yes Percentage is not
reflective of the process.
The certification process
results in presence or
absence of PAAZA
accreditation, therefore
the target can only be
yes (present) or no
(absent).
22.30. Achievement of
budgeted footfall.
New KPI - No
Baseline.
New KPI - No
Baseline.
Achievement of
budgeted footfalls.
Achievement of
budgeted
footfalls.
Percentage 100 100 No amendment to
target, however a
tolerance level of
between 95% and
100% has been agreed
upon.
22.31. Achieve budgeted
Earnings Before Interest,
Tax, Depreciation and
Amortisation (EBITDA) to
Revenue ratio.
New KPI - No
Baseline.
New KPI - No
Baseline.
To achieve annual
EBITDA to
Revenue ratio of
4.67%
To achieve
budgeted
EBIDTA
To achieve
EBITDA to
Revenue ratio of
5.95%
To achieve
budgeted
EBIDTA
Percentage Number 4.67 7,6m 4.67 -1,5m Target has been
amended to be in line
with the adjusted
budget.

Key Performance
Indicator
Amended Key
Performance Indicator
Baseline as at
30 June 2014
Amended
Baseline
Annual Target
2015 / 2016
Amended
Annual Target
2015/2016
Five Year
Target
Amended Five
Year Target
Unit of
Measure
Amended
Unit of
Measure
Q3 Target
Mar 2016
Amended
Q3 Target
Mar 2016
Q4
Target
June
2016
Amended
Q4 Target
June 2016
Reason for Amendment
22.32. Manage creditor
payment days against
legislated payment days.
New KPI - No
Baseline.
New KPI - No
Baseline.
To ensure that all
creditors are paid
within 30 days of
receipt of a valid
invoice.
To ensure that all
creditors are paid
within 30 days of
receipt of a valid
invoice.
Percentage 100 100
Manage creditor
payment days against
legislated payment
days.
New KPI - No
Baseline.
To ensure that
all
sponsorship
debtors are
collected
according to
the terms of
each
sponsorship
contract
To ensure
that all
sponsorship
debtors are
collected
according to
the terms of
each
sponsorship
contract
Percentage 100 100 New KPI. This was
previously included in
KPI 22.21

National Key
Performance
Area
Strategic
Focus Area
(Objective)
Key Performance Indicator Amended Key Performance
Indicator
Baseline
as at 30
June 2015
Amended
Baseline
Unit Of
Measure
Amended Unit
of Measure
Annual
Target
2015/2016
Amended
Annual Target
5 year target Amended
Five Year
Target
Quarter 3 Amended
Target 3
Value
Quarter 4 Amended
Target 4
Value
Reason for Amendment
Jobs - Creating
job
opportunities
23.1. Number of job
opportunities created
5000 8898 Number 5000 5500 0.00 5000.00
Retail Space -
Increase
occupancy
23.2 To maximise occupancy
percentage of all lettable
space
75% 76.6 Percentage 75% 100% 75% 75%
Event venues 23.3 To increase the number
of events booked at the
stadium and its precinct
New KPI - No
Baseline.
Number 103 1885 103 103 New KPI added
Occupational
Health and
Safety
Standards
23.4 To obtain a Disabling
Injury Frequency Rate (DIFR)
score of lower than 6.0
<6 0 Number <6 <5 <6 <6
Customer
satisfaction
23.5 To survey 100 guests
per month to achieve total
customer satisfaction.
1200 1233 surveys /
92% customer
satisfaction
Number 1200 1500 900 1200
23.6. Ensure the
implementation of audit
recommendation at MMS
Deleted 100% Percentage 100% 100% 100% 100% Monitored separately through audit
logs
23.7. % Training achieved
against the Planned Training
as per annual Work Skills
Plan
23.7 To conduct a total
number of 10 trainings per
annum as per 2015'16 WSP
training plan
100 New Unit of
Measure- No
Baseline.
Percentage Number 1 10 100% 50 70% 7 100% 10 Ammended wording to align with WSP
requirements
Moses Mabhida Stadium - 15/16
Plan Owner: Musa Mbhele
LOCAL
ECONOMIC
DEVELOPME
NT
GOVERNAN
CE
Create an
efficient,
effective and
accountable
administration
TRANSFOR
MATION AND
ORGANISATI
ONAL
DEVELOPME
NT
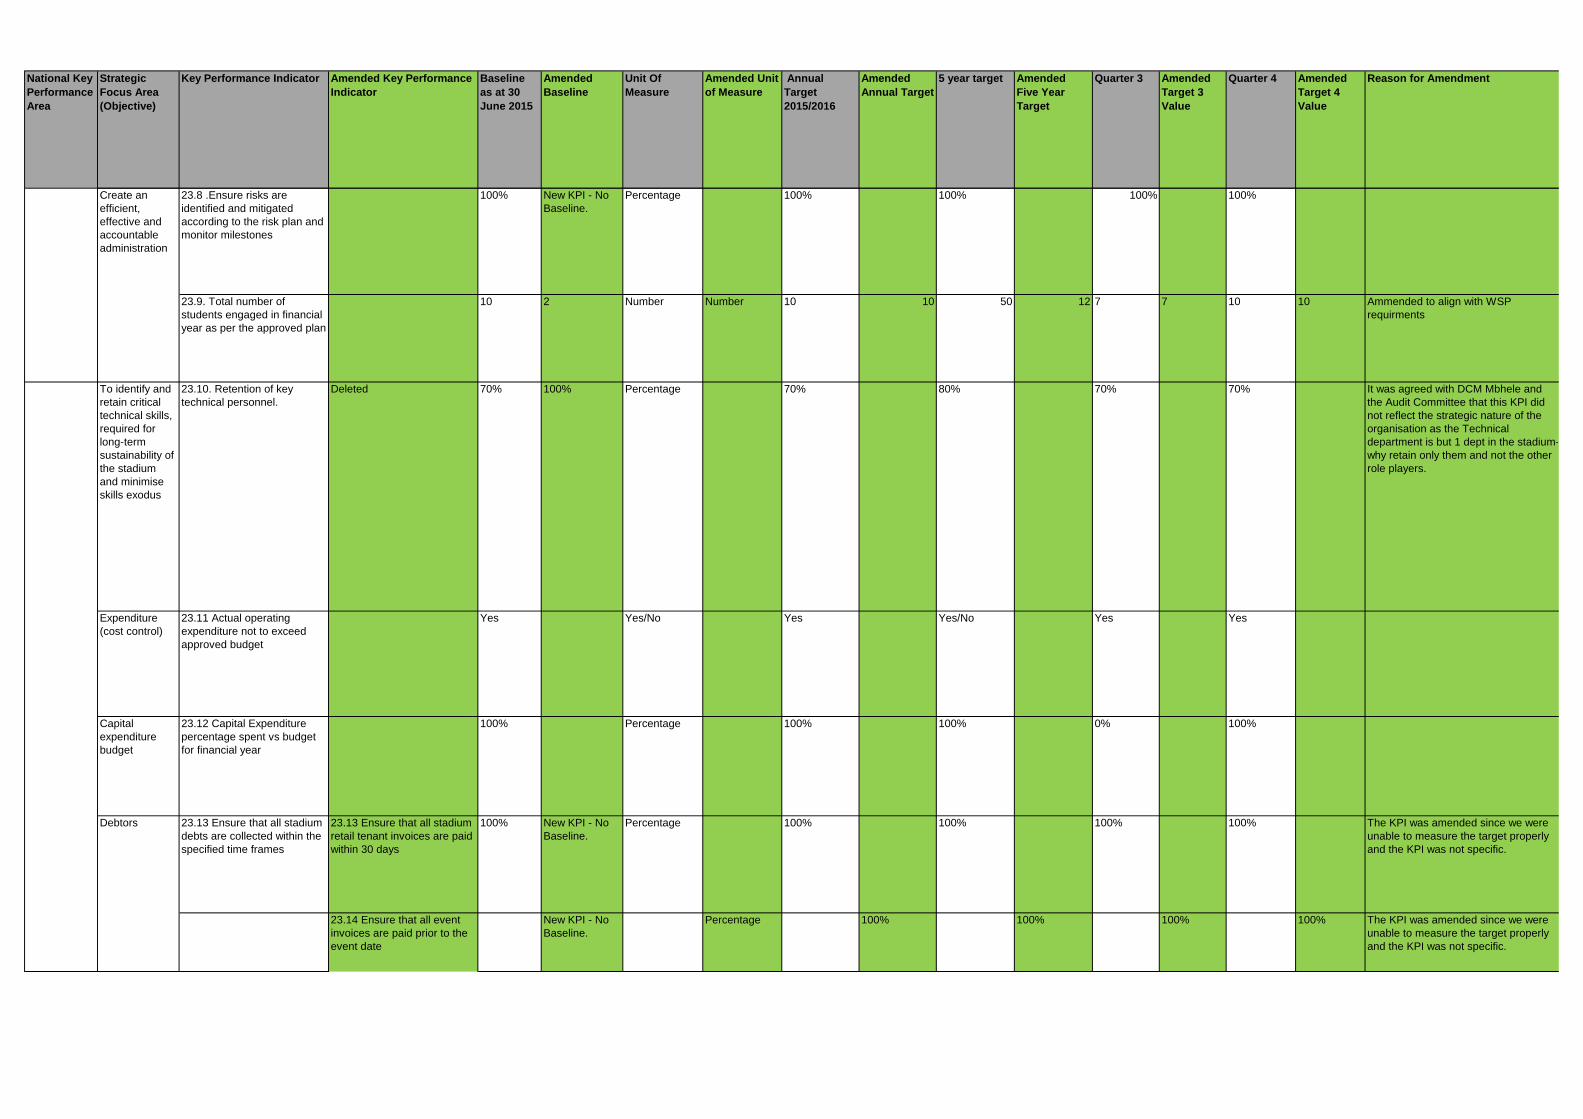
National Key
Performance
Area
Strategic
Focus Area
(Objective)
Key Performance Indicator Amended Key Performance
Indicator
Baseline
as at 30
June 2015
Amended
Baseline
Unit Of
Measure
Amended Unit
of Measure
Annual
Target
2015/2016
Amended
Annual Target
5 year target Amended
Five Year
Target
Quarter 3 Amended
Target 3
Value
Quarter 4 Amended
Target 4
Value
Reason for Amendment
23.8 .Ensure risks are
identified and mitigated
according to the risk plan and
monitor milestones
100% New KPI - No
Baseline.
Percentage 100% 100% 100% 100%
23.9. Total number of
students engaged in financial
year as per the approved plan
10 2 Number Number 10 10 50 12 7 7 10 10 Ammended to align with WSP
requirments
To identify and
retain critical
technical skills,
required for
long-term
sustainability of
the stadium
and minimise
skills exodus
23.10. Retention of key
technical personnel.
Deleted 70% 100% Percentage 70% 80% 70% 70% It was agreed with DCM Mbhele and
the Audit Committee that this KPI did
not reflect the strategic nature of the
organisation as the Technical
department is but 1 dept in the stadium-
why retain only them and not the other
role players.
Expenditure
(cost control)
23.11 Actual operating
expenditure not to exceed
approved budget
Yes Yes/No Yes Yes/No Yes Yes
Capital
expenditure
budget
23.12 Capital Expenditure
percentage spent vs budget
for financial year
100% Percentage 100% 100% 0% 100%
23.13 Ensure that all stadium
debts are collected within the
specified time frames
23.13 Ensure that all stadium
retail tenant invoices are paid
within 30 days
100% New KPI - No
Baseline.
Percentage 100% 100% 100% 100% The KPI was amended since we were
unable to measure the target properly
and the KPI was not specific.
23.14 Ensure that all event
invoices are paid prior to the
event date
New KPI - No
Baseline.
Percentage 100% 100% 100% 100% The KPI was amended since we were
unable to measure the target properly
and the KPI was not specific.
TRANSFOR
MATION AND
ORGANISATI
ONAL
DEVELOPME
NT
Create an
efficient,
effective and
accountable
administration
Debtors