Embed Size (px)
Citation preview
Plan Explanations that Exploit a Cognitive Spatial Model
Raj KorpanThe Graduate Center
City University of New [email protected]
Susan L. EpsteinThe Graduate Center and Hunter College
City University of New [email protected]
AbstractIdeally, people who navigate together in a com-plex indoor space share a mental model thatfacilitates explanation. This paper reports ona robot control system whose cognitive worldmodel is based on spatial affordances that gen-eralize over its perceptual data. Given a target,the control system formulates multiple plans,each with a model-relevant metric, and selectsamong them. As a result, it can provide read-ily understandable natural language about therobot’s intentions and confidence, and gener-ate diverse, contrastive explanations that ref-erence the acquired spatial model. Empiricalresults in large, complex environments demon-strate the robot’s ability to provide human-friendly explanations in natural language.
1 Introduction
Inspired by recent recommendations for spoken lan-guage interaction with robots (Marge et al., 2020),this paper introduces WHY, an approach to commu-nicate a robot’s planning rationales, intentions, andconfidence in human-friendly spatial language. Ourthesis is that a plan based on spatial representationsacquired from travel experience can ground its ob-jectives and support explainable path planning. Theprincipal results of this paper are empirical demon-strations of WHY’s ability to explain and contrastplans in readily-understandable natural language.
Given sensor data and a metric map (e.g., a floorplan), the task of our autonomous robot naviga-tor is to travel to target locations in a large, com-plex, human-centric, indoor space (henceforward,world). The robot’s control system integrates ac-quired spatial knowledge into a cognitively-basedarchitecture that combines planning with reactivity,heuristics, and situational reasoning. Given a tar-get, the control system creates a plan, a sequenceof intermediate locations (waypoints) to reach it.This plan is expected to balance multiple objectives,combine continuous and discrete spatial represen-tations, and encourage a human’s trust.
Traditional navigation planners use a cost graph(also known as a costmap) where each node is apoint in unobstructed space and each edge connectsa pair of nodes with a weight for the cost to movebetween them. A popular cost graph is based on anoccupancy grid, uniform square cells superimposedon a two-dimensional metric map. Each edge in thegraph represents two adjacent unobstructed cells,labeled with the Euclidean distance between theircenters. In a fine-grained grid, however, optimalplanners (e.g., A* (Hart et al., 1968)) hug obstaclesso tightly that their plans require tight maneuversto reach some waypoints and may fail as actuatorand sensor errors accumulate near them.
To bias plans toward its particular objective (aspatial representation or commonsense rationale), aplanner modifies the weights in its own copy of theoccupancy-grid graph. The fixed underlying graphstructure allows our approach to evaluate a planwithin any such modified graph. Voting then selectsthe plan that best satisfies all the objectives. Thisapproach facilitates contrastive natural-languageexplanations of the chosen plan with respect to eachobjective. The control system reports on its beliefs,intentions, and confidence with spatial language.For example, “Although there may be another waythat is somewhat shorter, I think my way is a lotbetter at going through open areas.”
The next sections provide related work and de-scribe the acquired spatial model. Subsequent sec-tions cover the modified graphs, vote-based plan-ning, and how WHY explains plans. The last sec-tions describe empirical results and future work.
2 Related work
A spatial representation of its world is essential to arobot control system that navigates efficiently andexplains its behavior clearly. Grounded commu-nication between a robot and a person, however,requires a shared spatial representation. This sec-tion first describes work on human cognitive maps
that inspired our control system’s spatial model. Itthen details approaches that describe and explainthe robot’s behavior.
A cognitive map is a compact, mental spatialrepresentation of a world, built by a person asshe moves through that world (Golledge, 1999).To reduce her cognitive load, a person reasonsfrom a cognitive map that incorporates landmarks,route knowledge, and survey knowledge (Tversky,1993). Landmarks represent locations in the map,routes represent lines that connect them, and surveyknowledge captures spatial relations. Although ithas been suggested that cognitive maps use met-ric distances and angles (Gallistel, 1990), more re-cent work indicates that cognitive maps have a non-metric, qualitative topological structure (Foo et al.,2005). Other recent work suggests that people usea cognitive graph with labeled metric informationthat captures connectivity and patterns (Chrastiland Warren, 2014; Warren et al., 2017).
An affordance is a characteristic of the worldthat enables the execution of some action (Gibson,1977). Affordance-based theories of spatial cogni-tion posit a tight relationship between the specificdynamics of a world and the decisions made by anindividual there (Fajen and Phillips, 2013). Here,a spatial affordance is an abstract representationof the world that facilitates navigation. This pa-per introduces path planning in cost graphs basedon acquired spatial affordances. People general-ize structured representations across domains onsimilar tasks (Pouncy et al., 2021) much the waythe spatial model described here generalizes affor-dances for use in different worlds.
A control system can learn and use a cognitivemap of its world for robot navigation. For example,the Spatial Semantic Hierarchy (SSH) modeled acognitive map with hierarchical metric and topo-logical representations (Kuipers, 2000). AlthoughSSH’s cognitive map bears some similarity to theone used here, it did not explain plans. Other ap-proaches used semantics to create a meaningfully-labeled metric map (Kostavelis and Gasteratos,2015). While these maps provide a qualitative con-text in which to ground a controller’s language,they do not necessarily align with human cognitivemaps. Moreover, control systems often use seman-tic maps for communication but another represen-tation for reasoning and decision-making. Instead,this paper shows how a single, affordance-basedrepresentation supports all of those processes.
Indoors, an autonomous robot may interact withpeople as it navigates to its target. A human collab-orator is more likely to accept, trust, and understanda robot that can explain its behavior (Rosenfeld andRichardson, 2019). Rather than describe an eventor summarize its causes, an explanation comparescounterfactual cases, includes causes selectively,and recognizes people as social beings with be-liefs and intentions (Miller, 2019). A contrastiveexplanation compares the reason for a decision toanother plausible rationale (Hoffmann and Maga-zzeni, 2019). Human subjects generally prefer suchexplanations that focus on the difference betweenthe robot’s planned route and their own (e.g., “myroute is shorter, but overlaps more and producesless reward”) (Perelman et al., 2020).
Detailed technical logs of a robot’s experi-ence were originally available only to trained re-searchers (Landsiedel et al., 2017; Scalise et al.,2017). Recent work, however, has generated natu-ral language descriptions of a robot’s travelled pathfrom them. These focus on abstraction, specificity,and locality (Rosenthal et al., 2016; Perera et al.,2016) or on sentence correctness, completeness,and conciseness (Barrett et al., 2017). All, how-ever, required a labeled dataset or a semantic map.Other recent work partitions a plan into actions anduses language templates to generate descriptions ofeach action in the context of a collaborating robotteam (Singh et al., 2021). WHY focuses on expla-nations for the reasons behind the robot’s decisionsrather than descriptions of the robot’s behavior.
To produce explanations, others have selectedpotentially suboptimal plans (Fox et al., 2017;Chakraborti et al., 2019) or readily understandablebehaviors (Huang et al., 2019), or relied on classi-cal planning (Magnaguagno et al., 2017; Grea et al.,2018; Krarup et al., 2019) or on logic (Seegebarthet al., 2012; Nguyen et al., 2020). None of thatwork, however, explains in natural language. Theapproach closest to the one presented here providescontrastive explanations for multi-objective pathplanning in natural language as a Markov decisionprocess (Sukkerd et al., 2020), but considers fewerobjectives, requires a hand-labeled map, and hasbeen evaluated only in much smaller worlds.
3 Spatial affordances
The context of this work is SemaFORR, acognitively-based control system for autonomousindoor navigation (Epstein et al., 2015; Epstein and

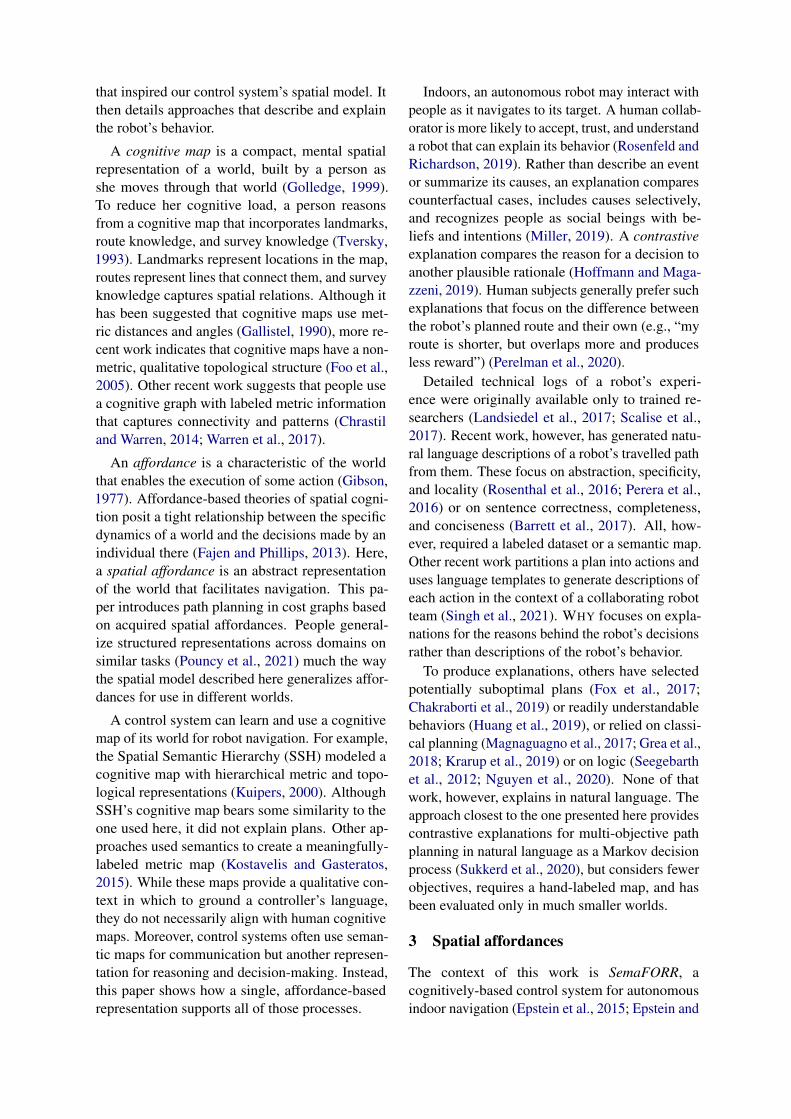
(a) Regions with doors andexits
(b) A dotted path and its de-rived solid trail
(c) Trails and conveyors (d) Diagonal hallways
Figure 1: Affordances in a simple artificial world
Korpan, 2019). At decision point d = 〈x, y, θ, V 〉,SemaFORR records the robot’s location (x, y), itsorientation θ, and its view V , the data from its on-board range finder. After each target, SemaFORRidentifies spatial affordances for its acquired modelof freespace, the unobstructed areas in a world. Themodel can be used alone or with a metric map.
At decision point d, SemaFORR learns a region,a circle in freespace with center at (x, y) and radiusequal to the minimum distance reported by V . Ac-cumulated contradictory or overlapping regions areresolved after each target. An exit represents accessto freespace, a point where the robot’s path oncecrossed the region’s perimeter. A door is an arc ona region’s perimeter, a continuous generalizationof finitely many, relatively close exits between itsendpoints. Figure 1(a) shows acquired regions withexits and doors (drawn for clarity as secants to theirrespective arcs). Although regions approximatewhat appear to be rooms in the figure, they recordonly freespace, not walls.
A trail is a refined version of the robot’s pathtoward its target. The algorithm that creates trailsheuristically smooths the robot’s paths and elim-inates digressions. The remaining (usually farfewer) decision points are trail markers. As inFigure 1(b), the sequence of line segments definedby consecutive trail markers is typically more di-rect than the original path, but rarely optimal. Aconveyor is a freespace cell in a 2× 2m grid super-
Table 1: SemaFORR’s planners and their objectives
Planner ObjectiveFASTP Minimize distance traveledSAFEP Avoid obstaclesEXPLOREP Avoid pathsNOVELP Avoid spatial modelCONVEYP Exploit conveyorsHALLWAYP Exploit hallwaysREGIONP Exploit regions, doors, exitsTRAILP Exploit trail markers
imposed on the world’s footprint. Conveyors tallyhow often trails pass through them. Higher-countcells represent locations that frequently supporttravel. They appear darker in Figure 1(c).
A hallway represents well-travelled routes insome angular direction (vertical, horizontal, majordiagonal, or minor diagonal). A hallway general-izes line segments between consecutive decisionpoints to find relatively straight, narrow, continuousfreespace with both length and width. Figure 1(d)shows some acquired minor-diagonal hallways.
4 Modified cost graphs
Planning for navigation requires a graphical repre-sentation of the world’s freespace. To produces anoptimal plan, A* searches a cost graph G based onan occupancy grid with edge weights for Euclideandistance. SemaFORR constructs a set of graphs;each begins with G but modifies its edge weightsto align with a particular objective. This biasessearch toward that objective but still considers planlength. In practice, an occupancy grid should besufficiently fine to represent obstacles accurately.
Table 1 lists SemaFORR’s planners and theirobjectives. Given a target, each planner formu-lates its own plan to reach it, one biased toward itsown objective. Two planners focus on common-sense: FASTP searches the original G, but SAFEPincreases G’s edge weights based on an edge’sproximity to obstacles. Two others focus on ex-ploration to acquire more knowledge about theirworld. EXPLOREP creates a grid that tallies howfrequently the robot’s path history passes througheach cell, and uses those values to increase edgeweights where it has already traveled. Becausethe acquired spatial model summarizes experiencemore compactly than a path, NOVELP explores ar-eas not covered by the model. It increases a weightif the edge overlaps an acquired affordance.
Four planners exploit a particular kind of spatialaffordance with changes to edge weights. (Valuesbased on preliminary testing bias plans to pursuebut not overemphasize affordances.) REGIONP’scost graph modifies each edge’s weight w basedon the location of its endpoints. If both lie in thesame region, w goes unchanged; if neither lies ina region w becomes 10w. Otherwise, for the oneendpoint v not in a region, w becomes 1.5w if vis within 0.5m of a door and an exit, 1.75w if v iswithin 0.5m of a door or an exit, and otherwise 2w.This biases plans to pass through regions becauseit increases edge costs outside them.
HALLWAYP and TRAILP modify their weightssimilarly, with respective conditions “lie in onehallway” and “lie within 0.5m of a trail marker.”If both endpoints of an edge meet the condition,w goes unchanged; if neither does, w becomes10w. Otherwise, when just one endpoint meetsthe condition, w becomes 1.5w. To bias plans to-ward high-count conveyors, CONVEYP considersthe counters c1 and c2 for the cells where the end-points of an edge with weight w lies. If both arenon-zero, w becomes w + 2/(c1 + c2); otherwise,w becomes 10w.
Because SemaFORR’s spatial model focuses onfreespace, these modified cost graphs allow a robotcontrol system to encourage travel there but alsoincorporate the metric cost graph where the modellacks knowledge. The region-based cost graph, forexample, imposes relatively lower costs only fordoors and exits that the robot has successfully ex-ploited earlier, and thus prioritizes them. Becauseweights only increase, Euclidean distance remainsan admissible heuristic for A*, that is, it never over-estimates the actual cost to the target’s location.
5 Voting among planners
To choose paths, people use many different objec-tives that reflect their motivation (Golledge, 1999).A cognitively-based robot navigator should alsoincorporate and balance a variety of path-selectionheuristics. SemaFORR’s planners can be used to-gether because they originate from the same costgraph. This section explains Algorithm 1, pseu-docode for how voting balances the planners’ ob-jectives to select a plan.
SemaFORR constructs multiple plans that op-timize a single objective and then uses voting toselect the plan that maximally satisfies the mostobjectives. First, each planner j constructs an op-
Algorithm 1: Voting-based planningInput: planners J , spatial model M , basiccost graph G
for each planner j ∈ J doSet j’s cost graph Gj to a copy of GModify Gj’s weights based on j and MWith A*, find optimal plan Pj in Gj
for each planner j ∈ J dofor each planner i ∈ J do
Cij ← cost of plan Pi in GjNormalize plan scores Cij in [0,10]
for each plan Pi doScorei ←
∑Jj=1Cij
best← argmini Scoreireturn Pbest
timal plan Pj for its objective as a sequence ofwaypoints in its modified cost graph Gj . This guar-antees that each submitted plan is optimal for atleast one objective.
Next, each planner’s objective is used to evaluateevery plan. All the cost graphs have the same nodesand edges, so to evaluate planner i’s plan Pi fromthe perspective of planner j, SemaFORR simplysums the edge weights in Gj for the sequence ofedges specified by Pi. The resultant scores Cij arethen normalized in [0, 10] for each j. SemaFORRseeks to minimize its objectives. Thus a Cij valuenear 0 indicates that plan Pi closely conforms toobjective j, while a score near 10 indicates that planPi conflicts with objective j. Voting selects the planwith the lowest total score across all objectives andbreaks ties at random.
6 Contrastive explanations
SemaFORR uses WHY to explain its long-rangeperspective in natural language. WHY exploits dif-ferences among planners’ objectives to produceclear, concise, contrastive explanations for a planquickly. WHY assumes that the robot’s human com-panion seeks a shortest-length plan, and comparesthat to SemaFORR’s plan. Although we assumehere that a goal-directed human navigator wouldseek to minimize travel distance, another objective,including those in Table 1, could label the founda-tional cost graph G instead.
Throughout this section,N represents a functionthat translates its argument (a planner or a metricvalue) into natural language. Given a real-valued
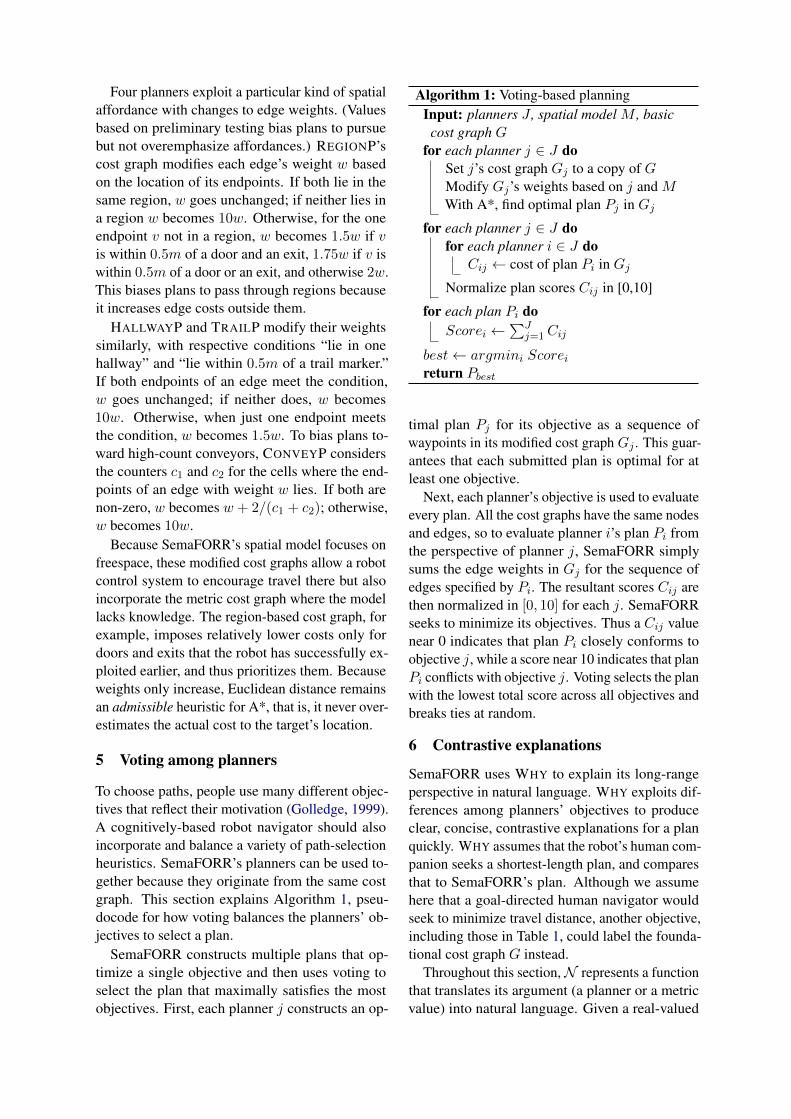
Figure 2: WHY compares FASTP’s (red) plan toTRAILP’s (blue) one biased by SemaFORR’s (green)trails. It explains, “Although there may be another waythat is a lot shorter, I think my way is a lot better atfollowing ways we’ve gone before.”
metric m for some aspect (e.g., confidence or en-thusiasm) of the decision process,M(m) bins m’svalue into an ordered partition of m’s range andN (M(m)) translates that bin to a natural languagephrase. For example, m could measure the desireto select one plan over the others, and the valuepartition could distinguish a strong preference forthat plan from a weak one. Thus, if m ∈ (0,+∞)were partitioned as {(0, 5), [5,+∞)}, N (m < 5)could be “a little” and N (m ≥ 5) “a lot.” Thisallows WHY to hedge in its responses, much theway people explain their reasoning when they areuncertain (Markkanen and Schroder, 1997).
6.1 Why does your plan go this way?Human and robot plans to reach the same targetmay differ because they lack a common objective.WHY’s response to this question presumes that ahuman plans from one perspective, objective βH ,while the robot plans from another perspective, ob-jective βR. Explanations for a plan assume a hu-man has an alternative objective. Henceforward,βH is “take the shortest path.”
WHY models the human questioner with βH toproduce plan PH , a prediction of the human’s im-plicit plan. Algorithm 2 is pseudocode for WHY’splan-explanation procedure. WHY takes as inputthe robot’s plan PR and objective βR, and the alter-native plan PH and objective βH it attributes to thehuman questioner. βH(P ) measures plan lengthand βR(P ) measures plan cost in PR’s graph. Inthe running example shown in Figure 2, WHY ex-
Algorithm 2: Explanation procedureInput: planning objectives βR and βH ,plans PR and PH
Output: explanationDR = βR(PR)− βR(PH)DH = βH(PR)− βH(PH)switch mode(DR, DH ) do
case DR = DH = 0 doexplanation← sentence based ontemplate for equivalent plans
case DR < 0 and DH > 0 doexplanation← sentence for βR, βH
case DR < 0 and DH = 0 doexplanation← sentence for βR
return explanation
plains SemaFORR’s preference for its plan PRfrom TRAILP where βR is TRAILP’s objective(“exploit trail markers”). WHY translates βH andβR with Table 2 as “short” and “follows wayswe’ve gone before,” respectively.
If voting selected the plan constructed by FASTP(i.e., the shortest-length plan), then Why respondswith “I decided to go this way because I agree thatwe should take the shortest route.” Otherwise, tocompare PR with PH , WHY calculates their differ-ence from two perspectives: DH from the human’sperspective (e.g., length), and DR from the robot’sperspective (e.g., proximity to trails). WHY placesthese differences in user-specified bins that repre-sent a human perspective on the objectives. Table3 provides language for these differences.
The relative size of the differences determinesan applicable template. If both DH and DR, asdefined in Algorithm 2, are 0, then the plans equallyaddress the two objectives, and WHY explains “Idecided to go this way because I think it’s just asN (βH) and equally N (βR).” Otherwise, the plansdiffer with respect to one or both objectives. If DRis negative (e.g., PR is more aligned with trails),then WHY instantiates this template:1: Although there may be another way that isN (M(DH)) N ∗(βH),2: I think my way is N (M(DR)) N ∗(βR).where N ∗(β) is a comparator for β (e.g., “shorter”or “better at following ways we’ve gone before”).For example, “Although there may be another waythat is somewhat shorter, I think my way is a lotbetter at following ways we’ve gone before.” WHY
omits line 1 in the template ifDH = 0. Other cases,
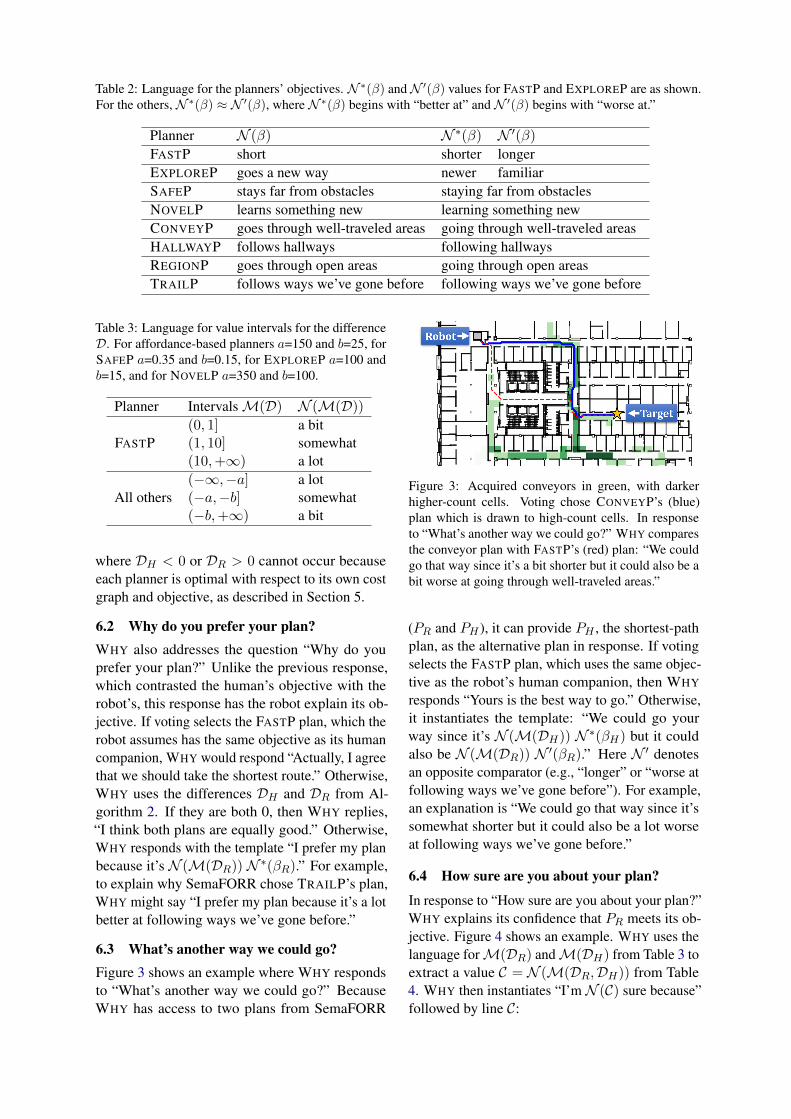
Table 2: Language for the planners’ objectives. N ∗(β) andN ′(β) values for FASTP and EXPLOREP are as shown.For the others, N ∗(β) ≈ N ′(β), where N ∗(β) begins with “better at” and N ′(β) begins with “worse at.”
Planner N (β) N ∗(β) N ′(β)FASTP short shorter longerEXPLOREP goes a new way newer familiarSAFEP stays far from obstacles staying far from obstaclesNOVELP learns something new learning something newCONVEYP goes through well-traveled areas going through well-traveled areasHALLWAYP follows hallways following hallwaysREGIONP goes through open areas going through open areasTRAILP follows ways we’ve gone before following ways we’ve gone before
Table 3: Language for value intervals for the differenceD. For affordance-based planners a=150 and b=25, forSAFEP a=0.35 and b=0.15, for EXPLOREP a=100 andb=15, and for NOVELP a=350 and b=100.
Planner IntervalsM(D) N (M(D))(0, 1] a bit
FASTP (1, 10] somewhat(10,+∞) a lot(−∞,−a] a lot
All others (−a,−b] somewhat(−b,+∞) a bit
where DH < 0 or DR > 0 cannot occur becauseeach planner is optimal with respect to its own costgraph and objective, as described in Section 5.
6.2 Why do you prefer your plan?WHY also addresses the question “Why do youprefer your plan?” Unlike the previous response,which contrasted the human’s objective with therobot’s, this response has the robot explain its ob-jective. If voting selects the FASTP plan, which therobot assumes has the same objective as its humancompanion, WHY would respond “Actually, I agreethat we should take the shortest route.” Otherwise,WHY uses the differences DH and DR from Al-gorithm 2. If they are both 0, then WHY replies,“I think both plans are equally good.” Otherwise,WHY responds with the template “I prefer my planbecause it’s N (M(DR)) N ∗(βR).” For example,to explain why SemaFORR chose TRAILP’s plan,WHY might say “I prefer my plan because it’s a lotbetter at following ways we’ve gone before.”
6.3 What’s another way we could go?Figure 3 shows an example where WHY respondsto “What’s another way we could go?” BecauseWHY has access to two plans from SemaFORR
Figure 3: Acquired conveyors in green, with darkerhigher-count cells. Voting chose CONVEYP’s (blue)plan which is drawn to high-count cells. In responseto “What’s another way we could go?” WHY comparesthe conveyor plan with FASTP’s (red) plan: “We couldgo that way since it’s a bit shorter but it could also be abit worse at going through well-traveled areas.”
(PR and PH ), it can provide PH , the shortest-pathplan, as the alternative plan in response. If votingselects the FASTP plan, which uses the same objec-tive as the robot’s human companion, then WHY
responds “Yours is the best way to go.” Otherwise,it instantiates the template: “We could go yourway since it’s N (M(DH)) N ∗(βH) but it couldalso be N (M(DR)) N ′(βR).” Here N ′ denotesan opposite comparator (e.g., “longer” or “worse atfollowing ways we’ve gone before”). For example,an explanation is “We could go that way since it’ssomewhat shorter but it could also be a lot worseat following ways we’ve gone before.”
6.4 How sure are you about your plan?
In response to “How sure are you about your plan?”WHY explains its confidence that PR meets its ob-jective. Figure 4 shows an example. WHY uses thelanguage forM(DR) andM(DH) from Table 3 toextract a value C = N (M(DR,DH)) from Table4. WHY then instantiates “I’m N (C) sure because”followed by line C:
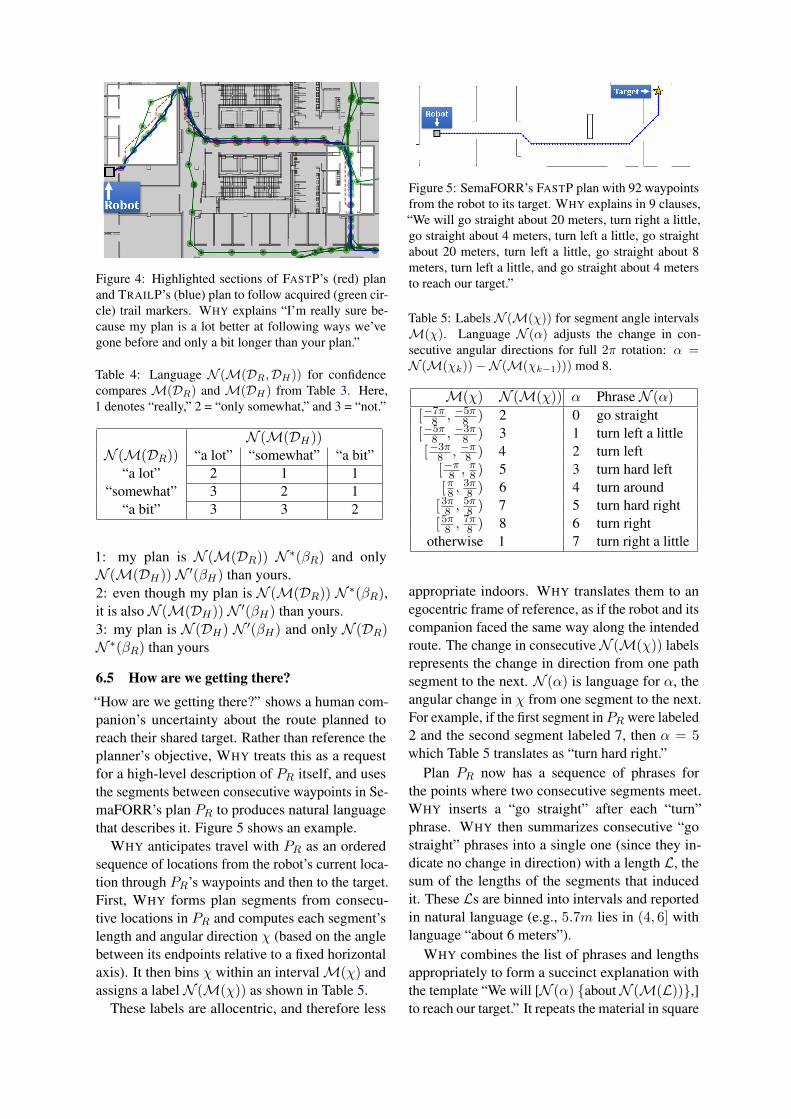
Figure 4: Highlighted sections of FASTP’s (red) planand TRAILP’s (blue) plan to follow acquired (green cir-cle) trail markers. WHY explains “I’m really sure be-cause my plan is a lot better at following ways we’vegone before and only a bit longer than your plan.”
Table 4: Language N (M(DR,DH)) for confidencecompares M(DR) and M(DH) from Table 3. Here,1 denotes “really,” 2 = “only somewhat,” and 3 = “not.”
N (M(DH))N (M(DR)) “a lot” “somewhat” “a bit”
“a lot” 2 1 1“somewhat” 3 2 1
“a bit” 3 3 2
1: my plan is N (M(DR)) N ∗(βR) and onlyN (M(DH)) N ′(βH) than yours.2: even though my plan is N (M(DR)) N ∗(βR),it is also N (M(DH)) N ′(βH) than yours.3: my plan is N (DH) N ′(βH) and only N (DR)N ∗(βR) than yours
6.5 How are we getting there?
“How are we getting there?” shows a human com-panion’s uncertainty about the route planned toreach their shared target. Rather than reference theplanner’s objective, WHY treats this as a requestfor a high-level description of PR itself, and usesthe segments between consecutive waypoints in Se-maFORR’s plan PR to produces natural languagethat describes it. Figure 5 shows an example.
WHY anticipates travel with PR as an orderedsequence of locations from the robot’s current loca-tion through PR’s waypoints and then to the target.First, WHY forms plan segments from consecu-tive locations in PR and computes each segment’slength and angular direction χ (based on the anglebetween its endpoints relative to a fixed horizontalaxis). It then bins χ within an intervalM(χ) andassigns a label N (M(χ)) as shown in Table 5.
These labels are allocentric, and therefore less
Figure 5: SemaFORR’s FASTP plan with 92 waypointsfrom the robot to its target. WHY explains in 9 clauses,“We will go straight about 20 meters, turn right a little,go straight about 4 meters, turn left a little, go straightabout 20 meters, turn left a little, go straight about 8meters, turn left a little, and go straight about 4 metersto reach our target.”
Table 5: Labels N (M(χ)) for segment angle intervalsM(χ). Language N (α) adjusts the change in con-secutive angular directions for full 2π rotation: α =N (M(χk))−N (M(χk−1))) mod 8.
M(χ) N (M(χ)) α Phrase N (α)
[−7π8 , −5π8 ) 2 0 go straight[−5π8 , −3π8 ) 3 1 turn left a little[−3π8 , −π8 ) 4 2 turn left[−π8 ,
π8 ) 5 3 turn hard left
[π8 ,3π8 ) 6 4 turn around
[3π8 ,5π8 ) 7 5 turn hard right
[5π8 ,7π8 ) 8 6 turn right
otherwise 1 7 turn right a little
appropriate indoors. WHY translates them to anegocentric frame of reference, as if the robot and itscompanion faced the same way along the intendedroute. The change in consecutiveN (M(χ)) labelsrepresents the change in direction from one pathsegment to the next. N (α) is language for α, theangular change in χ from one segment to the next.For example, if the first segment in PR were labeled2 and the second segment labeled 7, then α = 5which Table 5 translates as “turn hard right.”
Plan PR now has a sequence of phrases forthe points where two consecutive segments meet.WHY inserts a “go straight” after each “turn”phrase. WHY then summarizes consecutive “gostraight” phrases into a single one (since they in-dicate no change in direction) with a length L, thesum of the lengths of the segments that inducedit. These Ls are binned into intervals and reportedin natural language (e.g., 5.7m lies in (4, 6] withlanguage “about 6 meters”).
WHY combines the list of phrases and lengthsappropriately to form a succinct explanation withthe template “We will [N (α) {aboutN (M(L))},]to reach our target.” It repeats the material in square
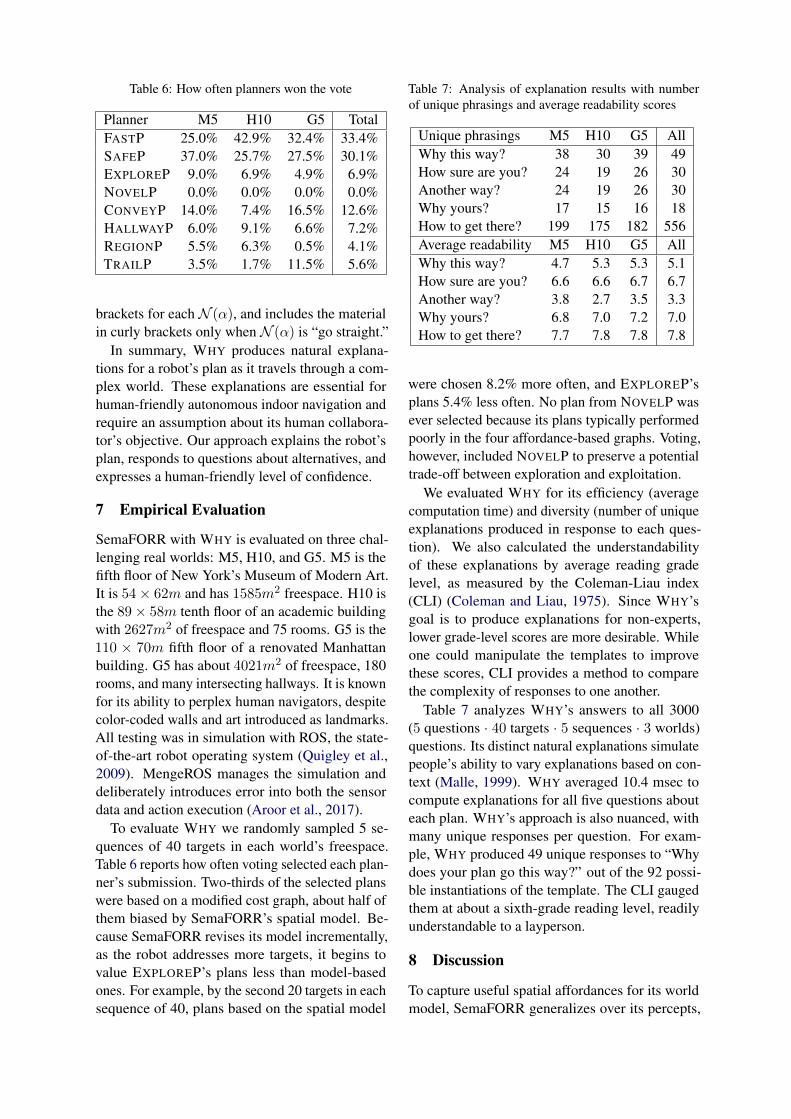
Table 6: How often planners won the vote
Planner M5 H10 G5 TotalFASTP 25.0% 42.9% 32.4% 33.4%SAFEP 37.0% 25.7% 27.5% 30.1%EXPLOREP 9.0% 6.9% 4.9% 6.9%NOVELP 0.0% 0.0% 0.0% 0.0%CONVEYP 14.0% 7.4% 16.5% 12.6%HALLWAYP 6.0% 9.1% 6.6% 7.2%REGIONP 5.5% 6.3% 0.5% 4.1%TRAILP 3.5% 1.7% 11.5% 5.6%
brackets for each N (α), and includes the materialin curly brackets only when N (α) is “go straight.”
In summary, WHY produces natural explana-tions for a robot’s plan as it travels through a com-plex world. These explanations are essential forhuman-friendly autonomous indoor navigation andrequire an assumption about its human collabora-tor’s objective. Our approach explains the robot’splan, responds to questions about alternatives, andexpresses a human-friendly level of confidence.
7 Empirical Evaluation
SemaFORR with WHY is evaluated on three chal-lenging real worlds: M5, H10, and G5. M5 is thefifth floor of New York’s Museum of Modern Art.It is 54× 62m and has 1585m2 freespace. H10 isthe 89× 58m tenth floor of an academic buildingwith 2627m2 of freespace and 75 rooms. G5 is the110 × 70m fifth floor of a renovated Manhattanbuilding. G5 has about 4021m2 of freespace, 180rooms, and many intersecting hallways. It is knownfor its ability to perplex human navigators, despitecolor-coded walls and art introduced as landmarks.All testing was in simulation with ROS, the state-of-the-art robot operating system (Quigley et al.,2009). MengeROS manages the simulation anddeliberately introduces error into both the sensordata and action execution (Aroor et al., 2017).
To evaluate WHY we randomly sampled 5 se-quences of 40 targets in each world’s freespace.Table 6 reports how often voting selected each plan-ner’s submission. Two-thirds of the selected planswere based on a modified cost graph, about half ofthem biased by SemaFORR’s spatial model. Be-cause SemaFORR revises its model incrementally,as the robot addresses more targets, it begins tovalue EXPLOREP’s plans less than model-basedones. For example, by the second 20 targets in eachsequence of 40, plans based on the spatial model
Table 7: Analysis of explanation results with numberof unique phrasings and average readability scores
Unique phrasings M5 H10 G5 AllWhy this way? 38 30 39 49How sure are you? 24 19 26 30Another way? 24 19 26 30Why yours? 17 15 16 18How to get there? 199 175 182 556Average readability M5 H10 G5 AllWhy this way? 4.7 5.3 5.3 5.1How sure are you? 6.6 6.6 6.7 6.7Another way? 3.8 2.7 3.5 3.3Why yours? 6.8 7.0 7.2 7.0How to get there? 7.7 7.8 7.8 7.8
were chosen 8.2% more often, and EXPLOREP’splans 5.4% less often. No plan from NOVELP wasever selected because its plans typically performedpoorly in the four affordance-based graphs. Voting,however, included NOVELP to preserve a potentialtrade-off between exploration and exploitation.
We evaluated WHY for its efficiency (averagecomputation time) and diversity (number of uniqueexplanations produced in response to each ques-tion). We also calculated the understandabilityof these explanations by average reading gradelevel, as measured by the Coleman-Liau index(CLI) (Coleman and Liau, 1975). Since WHY’sgoal is to produce explanations for non-experts,lower grade-level scores are more desirable. Whileone could manipulate the templates to improvethese scores, CLI provides a method to comparethe complexity of responses to one another.
Table 7 analyzes WHY’s answers to all 3000(5 questions · 40 targets · 5 sequences · 3 worlds)questions. Its distinct natural explanations simulatepeople’s ability to vary explanations based on con-text (Malle, 1999). WHY averaged 10.4 msec tocompute explanations for all five questions abouteach plan. WHY’s approach is also nuanced, withmany unique responses per question. For exam-ple, WHY produced 49 unique responses to “Whydoes your plan go this way?” out of the 92 possi-ble instantiations of the template. The CLI gaugedthem at about a sixth-grade reading level, readilyunderstandable to a layperson.
8 Discussion
To capture useful spatial affordances for its worldmodel, SemaFORR generalizes over its percepts,
the 660 distances to the nearest obstacle that itsrange finder reports 15 times per second. Each ofSemaFORR’s planners generates paths in a graphbiased by edge weights that represent that planner’sobjective but share an underlying structure that fa-cilitates plan comparison. Voting guarantees thatany selected plan will be optimal with respect toat least one objective, and makes it likely that theplan will also perform well with respect to the oth-ers. This also facilitates contrastive explanationsin natural spatial language for the robot’s planningobjectives, alternative paths, and confidence.
How a robot control system represents knowl-edge is integral to natural communication betweenrobots and people, especially in a spatial context.Misunderstandings between a robot and a humanoften arise from a discrepancy between their spa-tial mental models. This prompts questions aboutthe robot’s underlying decision-making and rea-soning mechanisms. WHY’s explanations relyon SemaFORR’s cognitive underpinnings. Lan-guage about the spatial model is readily under-stood because SemaFORR interprets its perceptsmuch the way people do. SemaFORR’s freespaceaffordances were inspired by sketches after hu-man subjects had actively explored complex virtualworlds (Chrastil and Warren, 2013). The planners’objectives are also analogous to processes empir-ically identified in people (Holscher et al., 2009).The results here demonstrate that natural languagecommunication with robots benefits substantiallywhen a robot’s control system and a human havesimilar cognitively-based spatial representations.
WHY’s templates flexibly and quickly producemany different explanations in natural language.The templates focus language generation on Se-maFORR’s computational rationale rather than onlinguistic structure and grammar. They also fa-cilitate the introduction of new planners withoutthe need to retrain a language generator for a newplanning objective. For example, an objective thatrelied on landmarks could modify the cost graphto reduce costs near them, so that WHY might ex-plain “I think my way is a lot better at followinglandmarks.” Although WHY assumes the human’sobjective is the shortest path, it can easily substi-tute any objective representable in a cost graphwith an admissible heuristic. SemaFORR couldalso incorporate a planning objective learned fromexternal demonstration (e.g., inverse reinforcementlearning) if that objective were representable as
increments to the cost graph’s weights.Whenever SemaFORR selects FASTP’s plan
here, it assumes that it shares the human’s objective.Any questions about the robot’s plan necessarilychallenge that assumption. Presumably, the personasks because they do not recognize their objectivethere. WHY responds by agreement that the per-son’s plan is the correct way to go (e.g., “Actually,I agree that we should take the shortest route.”),even though the question should not have arisen.Another way to address this would be to offer analternative plan when FASTP is selected.
Our current work examines how well human sub-jects understand and feel comfortable with WHY.Although SemaFORR’s parameters for intervals(e.g., in Table 3) were chosen for G5 and alsoworked well in other worlds, humans subject evalu-ation will allow us to confirm or reassess thesevalues. Human-subject studies could also helprefine WHY’s explanations and incorporate psy-chophysics and proxemics.
Future work could extend WHY for dialogue(e.g., to clarify confusion or guide navigation (Ro-man et al., 2020)). This could incorporate naturallanguage generation with deep learning and facil-itate queries to the person. WHY presumes thatquestions arise from a difference between the hu-man’s and the robot’s objectives, but they couldalso stem from a violation of the shared targetassumption. A broader system for human-robotcollaboration would seek the cause of such a mis-match, use plan explanations to resolve it, and thenallow the robot to adjust its responses based onfeedback from its human partner. For example,given a plan P from a person or an unspecifiedheuristic planner, WHY could use the individualobjectives in its repertoire to tease apart and thencharacterize how P weighted its objectives (e.g.,“So distance is more important than travel time?”).
Meanwhile, SemaFORR’s cognitively-basedspatial model supports important path planningobjectives and human-friendly explanations of itsbehavior, intentions, and confidence. Empirical re-sults in three large, complex, realistic worlds showthat our approach produces diverse, understandablecontrastive explanations in natural language.
Acknowledgments
This work was supported in part by The NationalScience Foundation under CNS-1625843. The au-thors thank Anoop Aroor for MengeROS.
ReferencesAnoop Aroor, Susan L Epstein, and Raj Korpan.
2017. MengeROS: A Crowd Simulation Tool forAutonomous Robot Navigation. In Proceedings ofAAAI Fall Symposium on Artificial Intelligence forHuman-Robot Interaction, pages 123–125. AAAI.
Daniel Paul Barrett, Scott Alan Bronikowski, HaonanYu, and Jeffrey Mark Siskind. 2017. Driving Underthe Influence (of Language). IEEE Transactions onNeural Networks and Learning Systems, pages 1–16.
Tathagata Chakraborti, Sarath Sreedharan, SachinGrover, and Subbarao Kambhampati. 2019. Planexplanations as model reconciliation–an empiricalstudy. In 2019 14th ACM/IEEE International Con-ference on Human-Robot Interaction (HRI), pages258–266. IEEE.
Elizabeth R Chrastil and William H Warren. 2013. Ac-tive and passive spatial learning in human naviga-tion: Acquisition of survey knowledge. Journalof experimental psychology: learning, memory, andcognition, 39(5):1520.
Elizabeth R Chrastil and William H Warren. 2014.From cognitive maps to cognitive graphs. PloS one,9(11):e112544.
Meri Coleman and Ta Lin Liau. 1975. A ComputerReadability Formula Designed for Machine Scoring.Journal of Applied Psychology, 60(2):283–284.
Susan L Epstein, Anoop Aroor, Matthew Evanusa, Eliz-abeth I Sklar, and Simon Parsons. 2015. Learningspatial models for navigation. In International Con-ference on Spatial Information Theory, pages 403–425. Springer.
Susan L. Epstein and Raj Korpan. 2019. Planning andexplanations with a learned spatial model. In Inter-national Conference on Spatial Information Theory,volume 142 of LIPICS, pages 22:1–22:20. SchlossDagstuhl.
Brett R Fajen and Flip Phillips. 2013. Spatial percep-tion and action. In Handbook of spatial cognition.American Psychological Association.
Patrick Foo, William H Warren, Andrew Duchon, andMichael J Tarr. 2005. Do humans integrate routesinto a cognitive map? map- versus landmark-basednavigation of novel shortcuts. Journal of Experimen-tal Psychology: Learning, Memory, and Cognition,31(2):195–215.
Maria Fox, Derek Long, and Daniele Magazzeni. 2017.Explainable planning. In IJCAI-17 Workshop on Ex-plainable AI (XAI), page 24.
Charles R Gallistel. 1990. The organization of learn-ing. The MIT Press.
James J Gibson. 1977. The theory of affordances. Per-ceiving, Acting, and Knowing: Toward an Ecologi-cal Psychology, pages 67–82.
Reginald G Golledge. 1999. Human wayfinding andcognitive maps. Wayfinding behavior: Cognitivemapping and other spatial processes, pages 5–45.
Antoine Grea, Laetitia Matignon, and Samir Aknine.2018. How explainable plans can make planningfaster. In Workshop on Explainable Artificial Intelli-gence, pages 58–64.
P. E. Hart, N. J. Nilsson, and B. Raphael. 1968. Aformal basis for the heuristic determination of mini-mum cost paths. IEEE Transactions on Systems Sci-ence and Cybernetics, 4(2):100–107.
Jorg Hoffmann and Daniele Magazzeni. 2019. Explain-able AI planning (XAIP): overview and the case ofcontrastive explanation. Reasoning Web. Explain-able Artificial Intelligence, pages 277–282.
Christoph Holscher, Simon J Buchner, TobiasMeilinger, and Gerhard Strube. 2009. Adaptivity ofwayfinding strategies in a multi-building ensemble:The effects of spatial structure, task requirements,and metric information. Journal of EnvironmentalPsychology, 29(2):208–219.
Sandy H Huang, David Held, Pieter Abbeel, andAnca D Dragan. 2019. Enabling robots to com-municate their objectives. Autonomous Robots,43(2):309–326.
Ioannis Kostavelis and Antonios Gasteratos. 2015. Se-mantic mapping for mobile robotics tasks: A survey.Robotics and Autonomous Systems, 66:86–103.
Benjamin Krarup, Michael Cashmore, Daniele Mag-azzeni, and Tim Miller. 2019. Model-based con-trastive explanations for explainable planning. InICAPS 2019 Workshop on Explainable AI Planning(XAIP).
Benjamin Kuipers. 2000. The spatial semantic hierar-chy. Artificial intelligence, 119(1-2):191–233.
Christian Landsiedel, Verena Rieser, Matthew Walter,and Dirk Wollherr. 2017. A Review of Spatial Rea-soning and Interaction for Real-World Robotics. Ad-vanced Robotics, 31(5):222–242.
Maurıcio Cecılio Magnaguagno, Ramon Fraga Pereira,Martin Duarte More, and Felipe Rech Meneguzzi.2017. Web planner: A tool to develop classicalplanning domains and visualize heuristic state-spacesearch. In 2017 Workshop on User Interfaces andScheduling and Planning.
Bertram F Malle. 1999. How People Explain Behavior:A New Theoretical Framework. Personality and So-cial Psychology Review, 3(1):23–48.
Matthew Marge, Carol Espy-Wilson, and Nigel Ward.2020. Spoken language interaction with robots: Re-search issues and recommendations. Report fromthe NSF Future Directions Workshop.

Raija Markkanen and Hartmut Schroder. 1997. Hedg-ing and Discourse: Approaches to the Analysis ofa Pragmatic Phenomenon in Academic Texts, vol-ume 24. Walter de Gruyter.
Tim Miller. 2019. Explanation in artificial intelligence:Insights from the social sciences. Artificial intelli-gence, 267:1–38.
Van Nguyen, Stylianos Loukas Vasileiou, Tran CaoSon, and William Yeoh. 2020. Explainable plan-ning using answer set programming. In Proceed-ings of the International Conference on Principlesof Knowledge Representation and Reasoning, vol-ume 17, pages 662–666.
Brandon S Perelman, Arthur W Evans III, and Kristin ESchaefer. 2020. Where do you think you’re going?characterizing spatial mental models from plannedroutes. ACM Transactions on Human-Robot Inter-action (THRI), 9(4):1–55.
Vittorio Perera, Sai P Selveraj, Stephanie Rosenthal,and Manuela Veloso. 2016. Dynamic Generationand Refinement of Robot Verbalization. In 25thIEEE International Symposium on Robot and Hu-man Interactive Communication (RO-MAN), pages212–218. IEEE.
Thomas Pouncy, Pedro Tsividis, and Samuel J Gersh-man. 2021. What is the model in model-based plan-ning? Cognitive Science, 45(1):e12928.
Morgan Quigley, Ken Conley, Brian P. Gerkey, JoshFaust, Tully Foote, Jeremy Leibs, Rob Wheeler, andAndrew Y. Ng. 2009. ROS: an open-source RobotOperating System. In ICRA Workshop on OpenSource Software.
Homero Roman Roman, Yonatan Bisk, Jesse Thoma-son, Asli Celikyilmaz, and Jianfeng Gao. 2020.Rmm: A recursive mental model for dialog navi-gation. In Proceedings of the 2020 Conference onEmpirical Methods in Natural Language Processing:Findings, pages 1732–1745.
Avi Rosenfeld and Ariella Richardson. 2019. Ex-plainability in human–agent systems. AutonomousAgents and Multi-Agent Systems, 33(6):673–705.
Stephanie Rosenthal, Sai P Selvaraj, and ManuelaVeloso. 2016. Verbalization: Narration of Au-tonomous Mobile Robot Experience. In Proceed-ings of the International Joint Conference on Arti-ficial Intelligence, volume 16, pages 862–868.
Rosario Scalise, Stephanie Rosenthal, and SiddharthaSrinivasa. 2017. Natural Language Explanations inHuman-Collaborative Systems. In Proceedings ofthe 2017 ACM/IEEE International Conference onHuman-Robot Interaction, pages 377–378. ACM.
Bastian Seegebarth, Felix Muller, Bernd Schattenberg,and Susanne Biundo. 2012. Making hybrid plansmore clear to human users-a formal approach forgenerating sound explanations. In Proceedings of
the International Conference on Automated Plan-ning and Scheduling, volume 22.
Avinash Kumar Singh, Neha Baranwal, Kai-FlorianRichter, Thomas Hellstrom, and Suna Bensch. 2021.Verbal explanations by collaborating robot teams.Paladyn, Journal of Behavioral Robotics, 12(1):47–57.
Roykrong Sukkerd, Reid Simmons, and David Garlan.2020. Tradeoff-focused contrastive explanation forMDP planning. In 2020 29th IEEE InternationalConference on Robot and Human Interactive Com-munication, pages 1041–1048. IEEE.
Barbara Tversky. 1993. Cognitive maps, cognitive col-lages, and spatial mental models. In European Con-ference on Spatial Information Theory, pages 14–24.Springer.
William H Warren, Daniel B Rothman, Benjamin HSchnapp, and Jonathan D Ericson. 2017. Worm-holes in virtual space: From cognitive maps to cog-nitive graphs. Cognition, 166:152–163.