Embed Size (px)
Citation preview
PlacerCountyAirPollutionControlDistrict
CaliforniaEnvironmentalQualityActThresholdsofSignificanceJustificationReport
Placer County Air Pollution Control District 110 Maple Street Auburn, CA 95603 October 2016
LIST OF ACRONYMS
AB Assembly Bill
APS Alternative Planning Strategy
ARB California Air Resources Board
BACT Best Available Control Technology
BAU Business as Usual
CalEEMod California Emissions Estimator Model
CAP Climate Action Plan
CEQA California Environmental Quality Act
CO2e Carbon Dioxide equivalent
EIR Environmental Impact Report
GHG Greenhouse Gas
GHGRP Greenhouse Gas Reduction Plan
LCFS Low Carbon Fuel Standard
MT Metric Tons
NOx Oxides of Nitrogen
NSR New Source Review
ROG Reactive Organic Gases
SB Senate Bill
SP Service Population (Residents + Employees)
PM10 Particulate Matter smaller than 10 microns
USEPA United States Environmental Protection Agency
E‐1 | P a g e
ExecutiveSummaryThresholds of Significance are used to determine the level of significance for air quality impacts from any given
land use project. CEQA encourages each public agency to develop and publish thresholds of significance that the
agency uses in the determination of the significance of environmental effects.
Since the early 2000s, when the Placer County Air Pollution Control District (District) first established its
recommended CEQA thresholds of significance for air quality, there have been tremendous changes that affect
the quality and management of the air resources in Placer County. For example, ambient air quality standards
for criteria pollutants, at both the state and federal levels, have become increasingly more stringent.
Additionally, with the enactment of SB 97, California’s lawmakers expressly recognized the need to analyze
greenhouse gas emissions as a part of the CEQA process. As part of the mandates in SB 97, the Office of Planning
and Research (OPR) amended the CEQA Guidelines to include the analysis and mitigation of greenhouse gas
(GHG) emissions, which became effective on March 18, 2010.
For the reasons stated above, and to further the goals of District objectives, the District has undertaken an effort
to review all of its currently‐recommended CEQA thresholds for criteria pollutants, revise them as appropriate,
and develop new thresholds for GHG where appropriate. The overall goal of this effort is to develop CEQA
significance criteria that ensure new development mitigate its contribution of significant air quality impacts in an
effort to assist the region in attaining the air quality standards and to not interfere with State efforts to reduce
greenhouse gas emissions, as they relate to land use development.
This document has been prepared to provide the necessary substantial evidence in support of the thresholds of
significance that the District developed. The proposed CEQA thresholds of significance will be submitted to the
District’s Governing Board for adoption in October 2016. Once the proposed CEQA thresholds are adopted, the
District’s CEQA Air Quality Handbook will be updated to include these thresholds. The District will then
recommend lead agencies within Placer County use the adopted thresholds of significance when considering the
significance of criteria pollutants and GHG impacts of new projects subject to CEQA.
CriteriaPollutantThresholds Staff recommends that the Board of Directors adopt the following significance thresholds for criteria pollutants:
1) Construction Threshold of 82 pounds per day for Reactive Organic Gases (ROG), Oxides of Nitrogen
(NOx), and particulate matter smaller than 10 microns (PM10),
2) Operational Threshold of 55 pounds per day for ROG, NOx and 82 pounds per day for PM10, and
3) Cumulative Threshold of 55 pounds per day for ROG, NOx and 82 pounds per day for PM10.
Table E‐1 Criteria Pollutant Thresholds
ConstructionPhase
OperationalPhaseProject‐Level
OperationalPhaseCumulative‐Level
ROG NOx PM10 ROG NOx PM10 ROG NOx PM10 (lbs/day) (lbs/day) (lbs/day) (lbs/day) (lbs/day) (lbs/day) (lbs/day) (lbs/day) (lbs/day)
Proposed 82 82 82 55 55 82 55 55 82
Current 82 82 82 82 82 82 10 10 N/A
E‐2 | P a g e
The daily maximum emission thresholds represent an emission level below which the project’s contribution to
criteria pollutant emissions would be deemed less than significant. This level of emissions is equivalent to a
project size of approximately 617 single‐family dwelling units, or a 249,100 square feet commercial building.
GreenhouseGasThresholdsIn addition, Staff will also recommend that the Board of Directors adopt the following significance thresholds for
GHG:
1) Bright‐line Threshold of 10,000 metric tons of CO2e per year for the construction and operational
phases of land use projects as well as the stationary source projects
2) Efficiency Matrix for the operational phase of land use development projects when emissions exceed
the De Minimis Level, and
3) De Minimis Level for the operational phases of 1,100 metric tons of CO2e per year.
Table E‐2 GHG Thresholds
Bright‐lineThreshold10,000MTCO2e/yr
EfficiencyMatrix
Residential Non‐residential
Urban Rural Urban Rural
(MT CO2e/capita) (MT CO2e/1,000sf)
4.5 5.5 26.5 27.3
DeMinimisLevel1,100MTCO2e/yr
GHG emissions from projects that exceed 10,000 MT CO2e/yr would be deemed to have a cumulatively
considerable contribution to global climate change. For a land use project, this level of emissions is equivalent to
a project size of approximately 646 single‐family dwelling units, or a 323,955 square feet commercial building.
The De Minimis Level for the operational phases of 1,100 MT CO2e/yr represents an emissions level which can
be considered as less than cumulatively considerable and be excluded from the further GHG impact analysis.
This level of emissions is equivalent to a project size of approximately 71 single‐family units, or a 35,635 square
feet commercial building.
Projects with GHG emissions which exceed the De Minimis Level of 1,100 MT CO2e/yr, but less than 10,000 MT
CO2e/yr can still be found less than cumulatively considerable when the result of project related efficiency
analysis would meet one of conditions in the efficiency matrix for the applicable land use setting and land use
type provided.
1 | P a g e
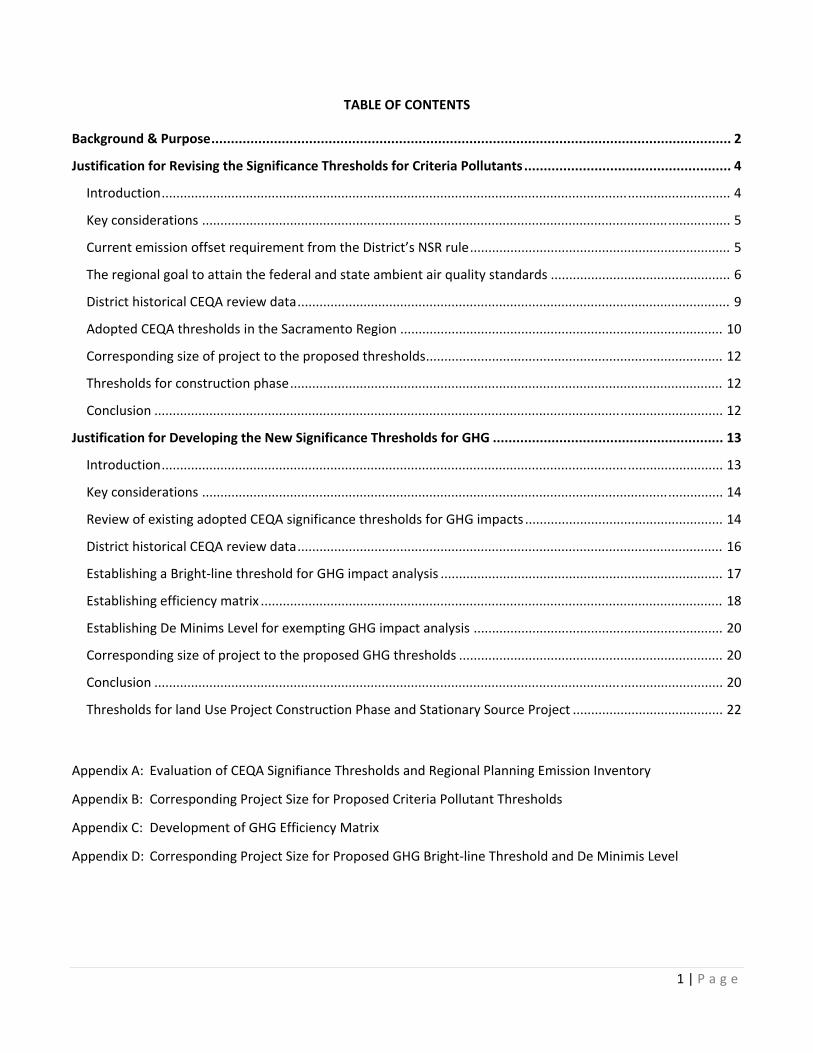
TABLE OF CONTENTS
Background & Purpose ..................................................................................................................................... 2
Justification for Revising the Significance Thresholds for Criteria Pollutants ..................................................... 4
Introduction ........................................................................................................................................................... 4
Key considerations ................................................................................................................................................ 5
Current emission offset requirement from the District’s NSR rule ....................................................................... 5
The regional goal to attain the federal and state ambient air quality standards ................................................. 6
District historical CEQA review data ...................................................................................................................... 9
Adopted CEQA thresholds in the Sacramento Region ........................................................................................ 10
Corresponding size of project to the proposed thresholds ................................................................................. 12
Thresholds for construction phase ...................................................................................................................... 12
Conclusion ........................................................................................................................................................... 12
Justification for Developing the New Significance Thresholds for GHG ........................................................... 13
Introduction ......................................................................................................................................................... 13
Key considerations .............................................................................................................................................. 14
Review of existing adopted CEQA significance thresholds for GHG impacts ...................................................... 14
District historical CEQA review data .................................................................................................................... 16
Establishing a Bright‐line threshold for GHG impact analysis ............................................................................. 17
Establishing efficiency matrix .............................................................................................................................. 18
Establishing De Minims Level for exempting GHG impact analysis .................................................................... 20
Corresponding size of project to the proposed GHG thresholds ........................................................................ 20
Conclusion ........................................................................................................................................................... 20
Thresholds for land Use Project Construction Phase and Stationary Source Project ......................................... 22
Appendix A: Evaluation of CEQA Signifiance Thresholds and Regional Planning Emission Inventory
Appendix B: Corresponding Project Size for Proposed Criteria Pollutant Thresholds
Appendix C: Development of GHG Efficiency Matrix
Appendix D: Corresponding Project Size for Proposed GHG Bright‐line Threshold and De Minimis Level
2 | P a g e
Background&PurposeThe California Legislature enacted California Environmental Quality Act (CEQA) in 1970. CEQA requires that public
agencies consider the potential adverse environmental impacts of any project that a public agency proposes to
carry out, fund or approve. Under CEQA, the lead agency shall prepare an environmental document assessing
the projects’ potential impacts. An Environmental Impact Report (EIR) will be prepared whenever it can be fairly
argued (the “fair argument” standard), based on substantial evidence1, that a project may have a significant
effect on the environment, even if there is substantial evidence to the contrary (CEQA Guidelines § 15064).
CEQA requires that the lead agency review not only a project’s direct effects on the environment, but also the
cumulative impacts of a project and other projects causing related impacts. When the incremental effect of a
project is cumulatively considerable, the lead agency must discuss the cumulative impacts in an EIR2.
While CEQA requires agencies to analyze and mitigate potentially significant project impacts, neither CEQA3 nor
its implementing guidelines4 establish specific significance thresholds. The State’s CEQA Guidelines do
encourage public agencies to adopt significance thresholds5, which are defined as an identifiable quantitative,
qualitative or performance level established to measure an environmental effect6. If a project cannot meet the
performance level, the impact will normally be determined to be “significant” by the agency; conversely, if a
project can meet the performance level, the impact normally will be determined to be “less than significant”.
As a local public agency with primary responsibility for overseeing air pollution sources in Placer County, the
Placer County Air Pollution Control District (District) takes an active part in the inter‐governmental review
process under CEQA. In most cases, the District acts as a commenting agency that reviews and comments on the
air quality assessment in environmental documents for land use projects distributed by lead agencies. As part of
the effort to accomplish the air district’s duties under CEQA, the District conducts a CEQA project review
program and provides recommendations to lead agencies based on modeling techniques and recommended
thresholds of significance. In doing so, the District determines air quality related impacts resulting from a land
use project, including the recommendation of feasible mitigation measures to reduce potentially significant
impacts.
Historically, the District has applied the concept of the District’s new source review (NSR) rule requirement to
recommend significance thresholds for criteria pollutants under the CEQA review program. The existing
recommended significance thresholds for criteria pollutants were established in 2001 based on the previous NSR
rule adopted in 1994. Since that time, the federal and state ambient air quality standards have been changed
several times. District staff believes it is necessary to reassess the existing significance thresholds for criteria
pollutants that are used to determine the potential air quality impacts from land use development.
1 As defined in the California Public Resources code (§21080(c)), “Substantial evidence” includes facts, reasonable assumptions, predicted upon facts, or an expert opinion supported by facts, but does not include argument, speculation, unsubstantiated opinion or narrative, evidence that is clearly inaccurate, erroneous, or evidence of social or economic impacts that do not contribute to, or are not caused by, physical impacts on the environment.; see also CEQA Guidelines §15384. 2 California Code of Regulations, Title 14, Chapter 3, Section 15064 3 California Public Resources Code, Division 13 4 California Code of Regulations, Title 14, Chapter 3 5 California Code of Regulations, Title 14, Chapter 3, Section 15064.7 6 California Code of Regulations, Title 14, Chapter 3, Section 15064.7
3 | P a g e
Additionally, the District has not formally established recommended CEQA thresholds for greenhouse gas (GHG)
emissions. The District has historically worked with local jurisdictions and CEQA practitioners on selecting the
appropriate thresholds for each jurisdiction. Due to recent court case findings regarding CEQA related GHG
impact analyses, District staff has concluded it would be sensible to establish GHG significance thresholds to
recommend to the local jurisdictions for use in analyzing and mitigating GHG impacts for projects within Placer
County.
Although CEQA does not require that commenting agencies adopt significance thresholds for their CEQA review
processes, the District recognizes that thresholds with well‐defined justification will assist the local jurisdictions
with their obligation to analyze and make significance determinations regarding criteria pollutants and GHG
emission impacts from land use projects. Therefore, the District developed GHG thresholds in concert with the
reassessment of criteria pollutant thresholds. The District believes the assessment of all significance thresholds
will meet the best interests of the local jurisdictions in evaluating criteria pollutants and GHG impacts under
CEQA.
This report provides the evidence in support of the proposed CEQA thresholds of significance developed by the
District. If the proposed thresholds are adopted by the District’s Governing Board, the District will recommend
that lead agencies within Placer County use the proposed thresholds of significance in this report when
determining the significance of criteria pollutants and GHG impacts of new projects subject to CEQA.
4 | P a g e
JustificationforRevisingtheSignificanceThresholdsforCriteriaPollutants
Introduction The District’s framework for revising the criteria pollutant thresholds for land development projects is based on
comprehensive policy and regulatory analysis, as well as considerable technical evaluation of development
trends in Placer County.
Placer County is located within the Sacramento Federal Ozone Nonattainment Area (SFONA) ‐‐ an area with air
quality which does not currently meet the federal ozone standard. The ozone standard was established by the
United States Environmental Protection Agency (USEPA) to help achieve one of the primary federal Clean Air Act
goals – to “protect and enhance the quality of the nation’s air resources so as to promote the public health and
welfare and the productive capacity of its population.” Currently, the SFONA ranks as the sixth worst area in the
nation for ozone air pollution7.
The New Source Review (NSR) program8, established by the U.S. Congress as part of the 1977 Clean Air Act
Amendments, requires nonattainment areas to permit and control emissions from stationary sources. It is the
regulatory foundation requiring local air districts to establish NSR rules. Emission offset requirements specified
within the local air district’s NSR rules are set consistent with the nonattainment classification of the federal and
state ozone ambient air quality standards, pursuant to the California Health and Safety Code.
It is the District’s position that any “nonattainment designation” is a significant environmental issue for air
quality impacts because all sources in the area, including direct and indirect sources, contribute emissions that
result in air quality deterioration. Therefore, the nonattainment status should be addressed within
environmental documents and can be used within the CEQA process as a basis to establish thresholds of
significance. The question to evaluate air quality impacts in the CEQA Guideline’s “Environmental Checklist
Form”9 affirms this position.
Furthermore, the District has concluded that there is a direct nexus between direct emissions from stationary
sources and indirect emissions associated with land use sources, where the emissions from a stationary source
are no different than the emissions from land use projects. It is indistinguishable if the pollution is emitted by a
stationary facility, or vehicle activities resulting from a land use project. The impacts from either one or both
sources will influence the region’s ability to attain health‐based air quality standards. If the emissions from
stationary sources need to be addressed and mitigated as required by regulations, the emissions from land use
related sources also need to be addressed and mitigated using the same criteria. The District believes that using
the emission offset requirement for stationary sources is appropriate to establish the basis for significant criteria
in order to evaluate a land use project’s related air quality impacts. It is common practice for air districts to
establish their recommended significance thresholds for criteria pollutants consistent with the NSR emission
offset thresholds.
7 American Lung Association, the State of the Air 2016, “Most Polluted Cities: Ozone”. http://www.lung.org/our‐initiatives/healthy‐air/sota/city‐rankings/most‐polluted‐cities.html. Accessed 08‐15‐16 8 EPA NSR Program website, http://www.epa.gov/NSR/ 9 CEQA Guideline Appendix G “Environmental Checklist Form”, Section III‐Air Quality question (c). http://ceres.ca.gov/ceqa/guidelines/pdf/appendix_g‐3.pdf
5 | P a g e
Although not formally adopted, the District established the significance thresholds of 82 pounds per day
(lbs/day) based on the previous NSR’s emission offset requirement in 2001, pursuant to the Health and Safety
Code, for Reactive Organic Gases (ROG), Oxides of Nitrogen (NOx), and particulate matter smaller than 10
microns (PM10). In addition, the District has also historically applied a threshold of 10 lbs/day to recommend
mitigation measures for the projects, consistent with the Best Available Control Technology (BACT) requirement
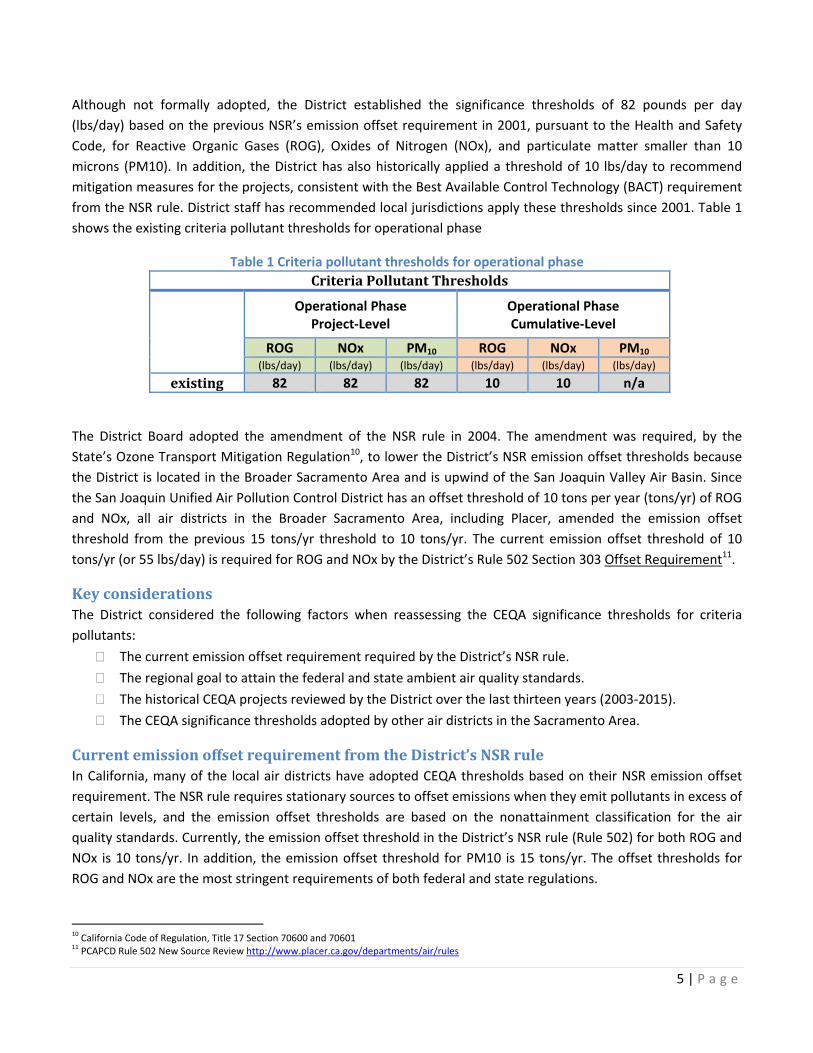
from the NSR rule. District staff has recommended local jurisdictions apply these thresholds since 2001. Table 1
shows the existing criteria pollutant thresholds for operational phase
Table 1 Criteria pollutant thresholds for operational phase
CriteriaPollutantThresholds
Operational Phase Project‐Level
Operational Phase Cumulative‐Level
ROG NOx PM10 ROG NOx PM10 (lbs/day) (lbs/day) (lbs/day) (lbs/day) (lbs/day) (lbs/day)
existing 82 82 82 10 10 n/a
The District Board adopted the amendment of the NSR rule in 2004. The amendment was required, by the
State’s Ozone Transport Mitigation Regulation10, to lower the District’s NSR emission offset thresholds because
the District is located in the Broader Sacramento Area and is upwind of the San Joaquin Valley Air Basin. Since
the San Joaquin Unified Air Pollution Control District has an offset threshold of 10 tons per year (tons/yr) of ROG
and NOx, all air districts in the Broader Sacramento Area, including Placer, amended the emission offset
threshold from the previous 15 tons/yr threshold to 10 tons/yr. The current emission offset threshold of 10
tons/yr (or 55 lbs/day) is required for ROG and NOx by the District’s Rule 502 Section 303 Offset Requirement11.
KeyconsiderationsThe District considered the following factors when reassessing the CEQA significance thresholds for criteria
pollutants:
The current emission offset requirement required by the District’s NSR rule.
The regional goal to attain the federal and state ambient air quality standards.
The historical CEQA projects reviewed by the District over the last thirteen years (2003‐2015).
The CEQA significance thresholds adopted by other air districts in the Sacramento Area.
CurrentemissionoffsetrequirementfromtheDistrict’sNSRruleIn California, many of the local air districts have adopted CEQA thresholds based on their NSR emission offset
requirement. The NSR rule requires stationary sources to offset emissions when they emit pollutants in excess of
certain levels, and the emission offset thresholds are based on the nonattainment classification for the air
quality standards. Currently, the emission offset threshold in the District’s NSR rule (Rule 502) for both ROG and
NOx is 10 tons/yr. In addition, the emission offset threshold for PM10 is 15 tons/yr. The offset thresholds for
ROG and NOx are the most stringent requirements of both federal and state regulations.
10 California Code of Regulation, Title 17 Section 70600 and 70601
11 PCAPCD Rule 502 New Source Review http://www.placer.ca.gov/departments/air/rules
6 | P a g e
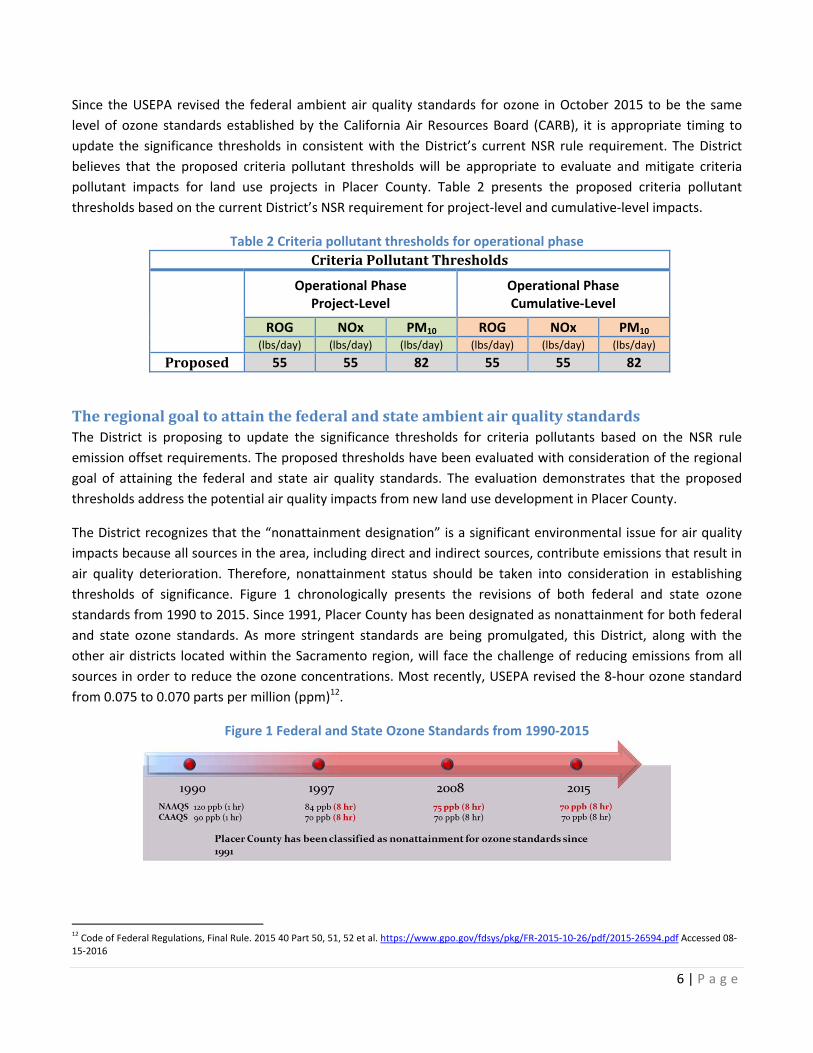
Since the USEPA revised the federal ambient air quality standards for ozone in October 2015 to be the same
level of ozone standards established by the California Air Resources Board (CARB), it is appropriate timing to
update the significance thresholds in consistent with the District’s current NSR rule requirement. The District
believes that the proposed criteria pollutant thresholds will be appropriate to evaluate and mitigate criteria
pollutant impacts for land use projects in Placer County. Table 2 presents the proposed criteria pollutant
thresholds based on the current District’s NSR requirement for project‐level and cumulative‐level impacts.
Table 2 Criteria pollutant thresholds for operational phase
CriteriaPollutantThresholds
Operational Phase Project‐Level
Operational Phase Cumulative‐Level
ROG NOx PM10 ROG NOx PM10 (lbs/day) (lbs/day) (lbs/day) (lbs/day) (lbs/day) (lbs/day)
Proposed 55 55 82 55 55 82
TheregionalgoaltoattainthefederalandstateambientairqualitystandardsThe District is proposing to update the significance thresholds for criteria pollutants based on the NSR rule
emission offset requirements. The proposed thresholds have been evaluated with consideration of the regional
goal of attaining the federal and state air quality standards. The evaluation demonstrates that the proposed
thresholds address the potential air quality impacts from new land use development in Placer County.
The District recognizes that the “nonattainment designation” is a significant environmental issue for air quality
impacts because all sources in the area, including direct and indirect sources, contribute emissions that result in
air quality deterioration. Therefore, nonattainment status should be taken into consideration in establishing
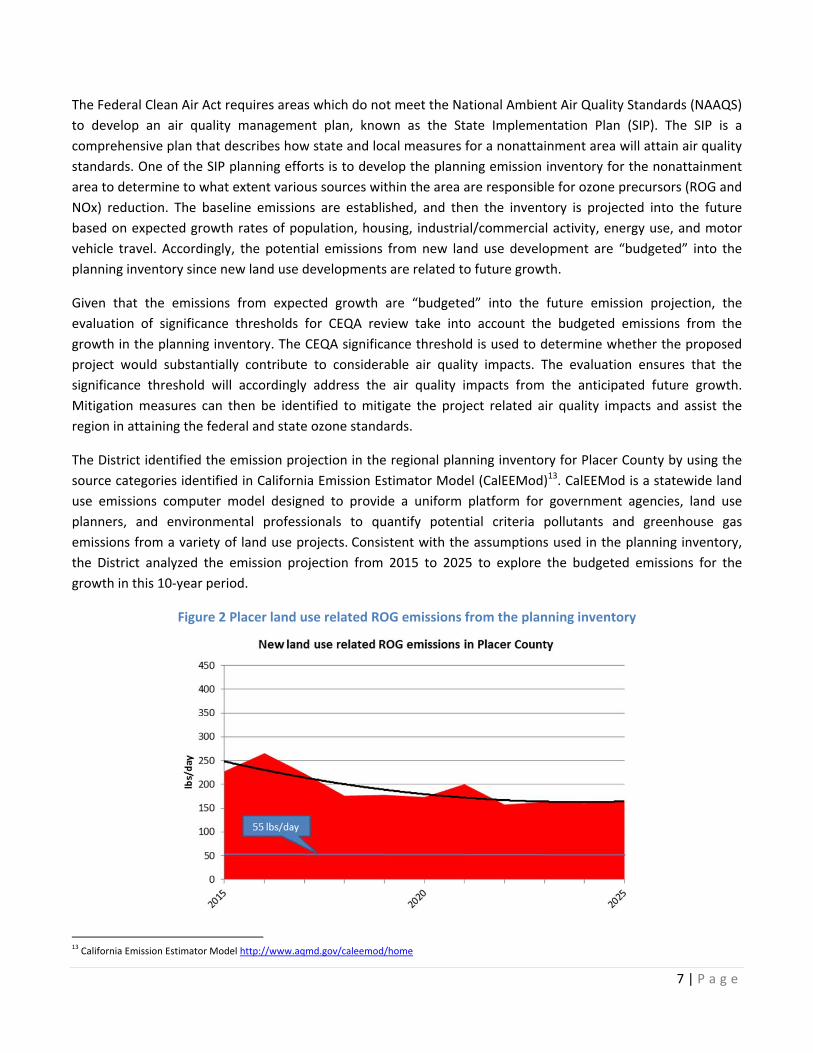
thresholds of significance. Figure 1 chronologically presents the revisions of both federal and state ozone
standards from 1990 to 2015. Since 1991, Placer County has been designated as nonattainment for both federal
and state ozone standards. As more stringent standards are being promulgated, this District, along with the
other air districts located within the Sacramento region, will face the challenge of reducing emissions from all
sources in order to reduce the ozone concentrations. Most recently, USEPA revised the 8‐hour ozone standard
from 0.075 to 0.070 parts per million (ppm)12.
Figure 1 Federal and State Ozone Standards from 1990‐2015
12 Code of Federal Regulations, Final Rule. 2015 40 Part 50, 51, 52 et al. https://www.gpo.gov/fdsys/pkg/FR‐2015‐10‐26/pdf/2015‐26594.pdf Accessed 08‐
15‐2016
7 | P a g e
The Federal Clean Air Act requires areas which do not meet the National Ambient Air Quality Standards (NAAQS)
to develop an air quality management plan, known as the State Implementation Plan (SIP). The SIP is a
comprehensive plan that describes how state and local measures for a nonattainment area will attain air quality
standards. One of the SIP planning efforts is to develop the planning emission inventory for the nonattainment
area to determine to what extent various sources within the area are responsible for ozone precursors (ROG and
NOx) reduction. The baseline emissions are established, and then the inventory is projected into the future
based on expected growth rates of population, housing, industrial/commercial activity, energy use, and motor
vehicle travel. Accordingly, the potential emissions from new land use development are “budgeted” into the
planning inventory since new land use developments are related to future growth.
Given that the emissions from expected growth are “budgeted” into the future emission projection, the
evaluation of significance thresholds for CEQA review take into account the budgeted emissions from the
growth in the planning inventory. The CEQA significance threshold is used to determine whether the proposed
project would substantially contribute to considerable air quality impacts. The evaluation ensures that the
significance threshold will accordingly address the air quality impacts from the anticipated future growth.
Mitigation measures can then be identified to mitigate the project related air quality impacts and assist the
region in attaining the federal and state ozone standards.
The District identified the emission projection in the regional planning inventory for Placer County by using the
source categories identified in California Emission Estimator Model (CalEEMod)13. CalEEMod is a statewide land
use emissions computer model designed to provide a uniform platform for government agencies, land use
planners, and environmental professionals to quantify potential criteria pollutants and greenhouse gas
emissions from a variety of land use projects. Consistent with the assumptions used in the planning inventory,
the District analyzed the emission projection from 2015 to 2025 to explore the budgeted emissions for the
growth in this 10‐year period.
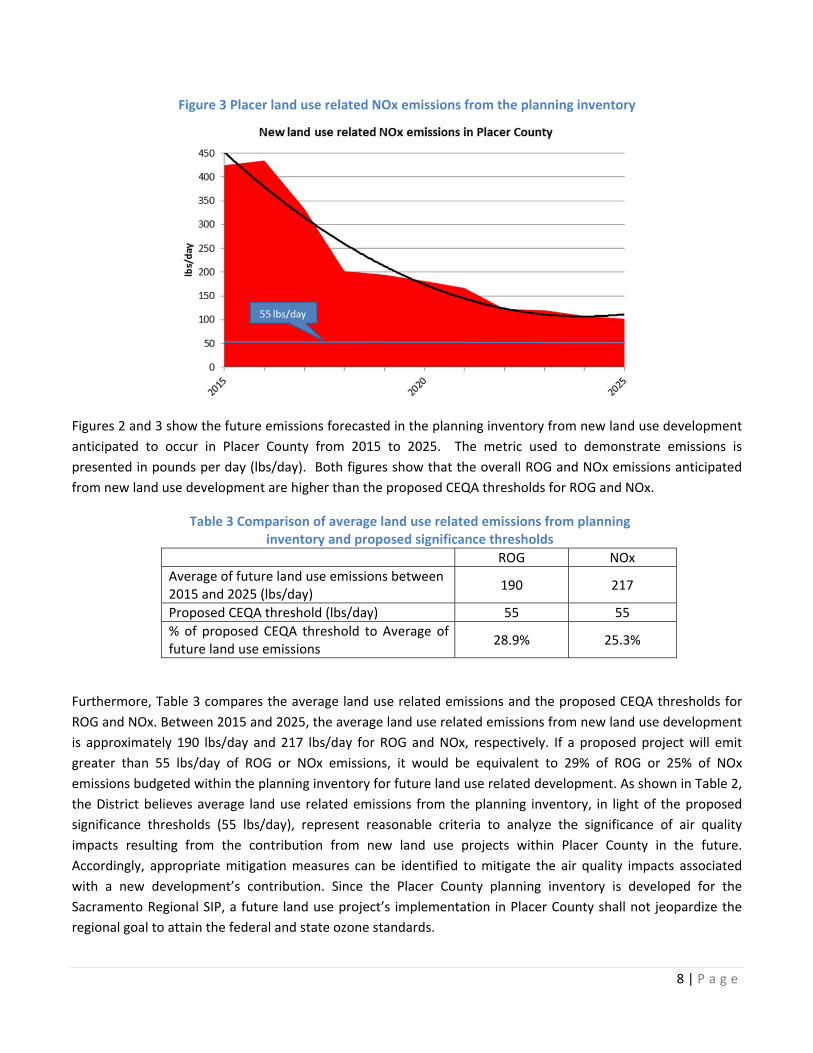
Figure 2 Placer land use related ROG emissions from the planning inventory
13 California Emission Estimator Model http://www.aqmd.gov/caleemod/home
8 | P a g e
Figure 3 Placer land use related NOx emissions from the planning inventory
Figures 2 and 3 show the future emissions forecasted in the planning inventory from new land use development
anticipated to occur in Placer County from 2015 to 2025. The metric used to demonstrate emissions is
presented in pounds per day (lbs/day). Both figures show that the overall ROG and NOx emissions anticipated
from new land use development are higher than the proposed CEQA thresholds for ROG and NOx.
Table 3 Comparison of average land use related emissions from planning inventory and proposed significance thresholds
ROG NOx
Average of future land use emissions between 2015 and 2025 (lbs/day)
190 217
Proposed CEQA threshold (lbs/day) 55 55
% of proposed CEQA threshold to Average of future land use emissions
28.9% 25.3%
Furthermore, Table 3 compares the average land use related emissions and the proposed CEQA thresholds for
ROG and NOx. Between 2015 and 2025, the average land use related emissions from new land use development
is approximately 190 lbs/day and 217 lbs/day for ROG and NOx, respectively. If a proposed project will emit
greater than 55 lbs/day of ROG or NOx emissions, it would be equivalent to 29% of ROG or 25% of NOx
emissions budgeted within the planning inventory for future land use related development. As shown in Table 2,
the District believes average land use related emissions from the planning inventory, in light of the proposed
significance thresholds (55 lbs/day), represent reasonable criteria to analyze the significance of air quality
impacts resulting from the contribution from new land use projects within Placer County in the future.
Accordingly, appropriate mitigation measures can be identified to mitigate the air quality impacts associated
with a new development’s contribution. Since the Placer County planning inventory is developed for the
Sacramento Regional SIP, a future land use project’s implementation in Placer County shall not jeopardize the
regional goal to attain the federal and state ozone standards.
9 | P a g e
The detailed analysis for the projected emissions in the planning inventory and the list of land use related source
categories are presented in Appendix A.
DistricthistoricalCEQAreviewdataAnother factor used to evaluate the proposed thresholds was a review of the historical data from the District’s
CEQA review program. The purpose of this review is to identify whether the proposed thresholds would trigger
land use projects with substantially significant emission contributions to be considered “potentially significant”,
thus requiring implementation of mitigation measures
According to the District’s historical data, 688 projects have been sent to the District from local jurisdictions in
Placer County for CEQA review in the past thirteen (13) year period (2003‐2015). District Staff used CalEEMod to
estimate the potential emissions that would occur from buildout of the projects with a built out year of 2020,
and ranked each project by its associated ROG and NOx emissions. Note that the projects analyzed did not
include any development that was either determined by lead agencies to be categorically or statutorily exempt
from CEQA, or development that was not considered to be a “project” as defined by CEQA.
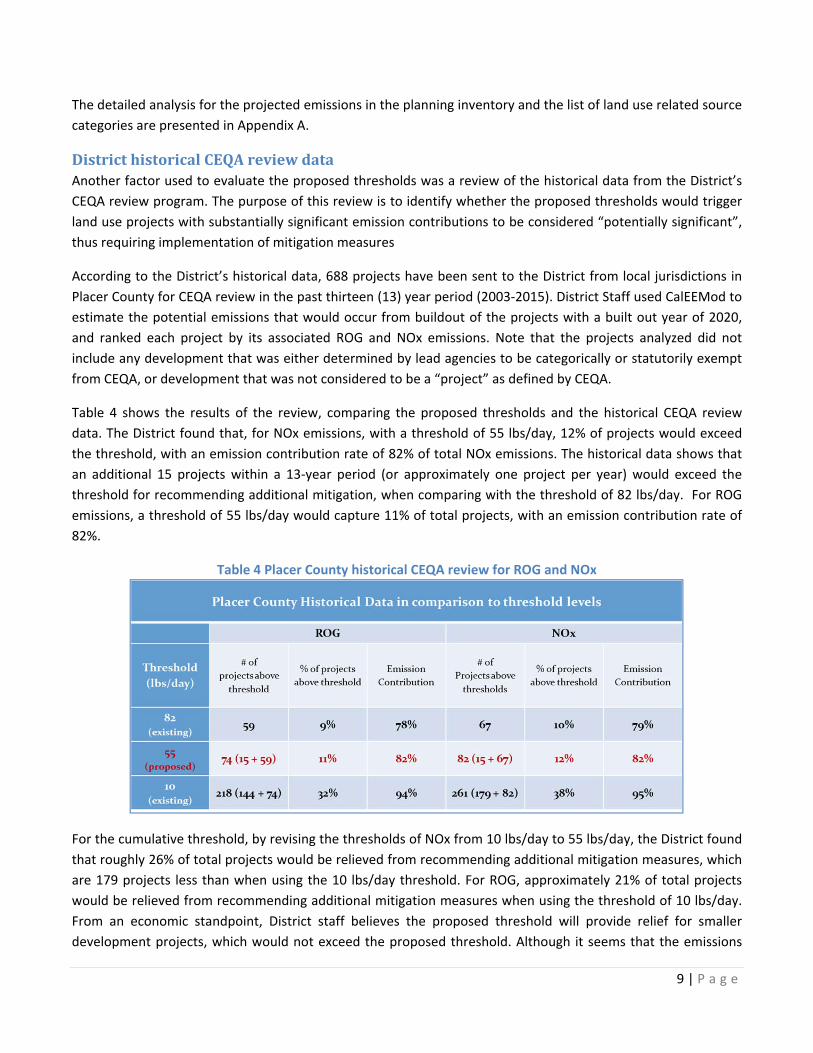
Table 4 shows the results of the review, comparing the proposed thresholds and the historical CEQA review
data. The District found that, for NOx emissions, with a threshold of 55 lbs/day, 12% of projects would exceed
the threshold, with an emission contribution rate of 82% of total NOx emissions. The historical data shows that
an additional 15 projects within a 13‐year period (or approximately one project per year) would exceed the
threshold for recommending additional mitigation, when comparing with the threshold of 82 lbs/day. For ROG
emissions, a threshold of 55 lbs/day would capture 11% of total projects, with an emission contribution rate of
82%.
Table 4 Placer County historical CEQA review for ROG and NOx
For the cumulative threshold, by revising the thresholds of NOx from 10 lbs/day to 55 lbs/day, the District found
that roughly 26% of total projects would be relieved from recommending additional mitigation measures, which
are 179 projects less than when using the 10 lbs/day threshold. For ROG, approximately 21% of total projects
would be relieved from recommending additional mitigation measures when using the threshold of 10 lbs/day.
From an economic standpoint, District staff believes the proposed threshold will provide relief for smaller
development projects, which would not exceed the proposed threshold. Although it seems that the emissions
10 | P a g e
captured could be lost by updating the cumulative threshold from 10 lbs/day to 55 lbs/day, in review of the
planning inventory and budgeted emissions for projected growth, the District does not foresee that the loss in
mitigated emissions would jeopardize the region’s attainment of federal and state standards.
Accordingly, the District’s historical CEQA review data shows that the proposed thresholds do not cause a
significant effect on land use projects in the past thirteen years and would still capture substantial emissions
from new land use projects for mitigation. It can be expected that if the proposed thresholds are adopted and
used for future project reviews, the results will be similar to those of the historical data review.
AdoptedCEQAthresholdsintheSacramentoRegionIn addition to evaluating the proposed thresholds by the ROG and NOx planning inventory in Placer County and
the historical CEQA review data for the past thirteen years, another important consideration is ensuring that the
proposed thresholds are as consistent as possible with those of adjacent air districts in the Sacramento area, so
as not to put the County at a disadvantage when local jurisdictions seek to attract important economic
development projects.
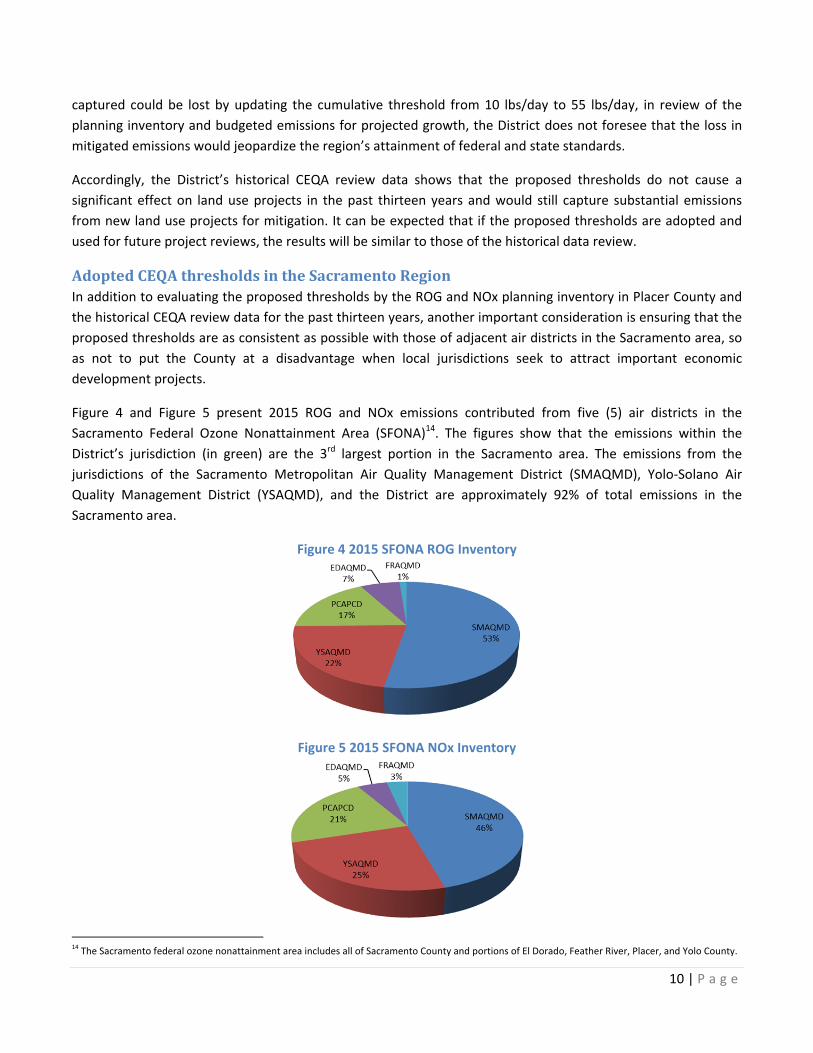
Figure 4 and Figure 5 present 2015 ROG and NOx emissions contributed from five (5) air districts in the
Sacramento Federal Ozone Nonattainment Area (SFONA)14. The figures show that the emissions within the
District’s jurisdiction (in green) are the 3rd largest portion in the Sacramento area. The emissions from the
jurisdictions of the Sacramento Metropolitan Air Quality Management District (SMAQMD), Yolo‐Solano Air
Quality Management District (YSAQMD), and the District are approximately 92% of total emissions in the
Sacramento area.
Figure 4 2015 SFONA ROG Inventory
Figure 5 2015 SFONA NOx Inventory
14 The Sacramento federal ozone nonattainment area includes all of Sacramento County and portions of El Dorado, Feather River, Placer, and Yolo County.

11 | P a g e
Although these five air districts are located within the same nonattainment area, the District recognizes there is
no regional consistency by each air district in the Sacramento area in the establishment of significance
thresholds. Table 5 summarizes the District’s proposed thresholds, as well as the current CEQA thresholds
adopted by each air district in the Sacramento area.
Table 5 CEQA thresholds for operational phase in the Sacramento Region
YSAQMD currently has the most recently updated significance thresholds for ROG and NOx, which are based on
the current NSR requirements, at 55 lbs/day. Feather River AQMD (FRAQMD) has the most stringent thresholds
(25 lbs/day) of all the air districts. El Dorado County AQMD (EDAQMD) has thresholds of 82 lbs/day based on its
NSR rule adopted in 2002, and they have not been updated in light of newer, more stringent standards and
emission offset requirements.
The SMAQMD thresholds of 65 lbs/day were developed based on the SIP commitments in the 1994 Sacramento
Area Regional Ozone Attainment Plan for achieving the previous federal 1‐hour ozone standard15. Although it
seems that the SMAQMD thresholds are more lenient than the District’s proposed thresholds, there is additional
mitigation required by the SMAQMD for projects exceeding its operational thresholds of 65 lbs/day. The
SMAQMD requires the project component to develop an air quality mitigation plan for ROG and NOx
demonstrating a 15% emission reduction for projects considered in the SIP, and 35% for projects not considered
in the SIP16. The additional mitigation required (either 15% or 35%) by the SMAQMD will result in additional
costs to project implementation, compared with the YSAQMD and the District, which do not require the
minimum percentage of mitigation. In considering this, District staff believes that the District’s proposed CEQA
thresholds will be as consistent as possible with SMAQMD and YSAQMD. Applying the District’s proposed
15 SMAQMD has revised its CEQA thresholds for particulate matters based on the NSR requirement and will consider revising the other thresholds at a later
date. http://www.airquality.org/bod/2015/MayAgendaItem15‐ProposedCEQAThresholdsofSignificanceforPMEmissionsBd.Ltr.pdf 16 SMAQMD CEQA Mitigation http://www.airquality.org/ceqa/mitigation.shtml
12 | P a g e
thresholds should not cause adversity to the local jurisdictions in Placer County for land use development
competition.
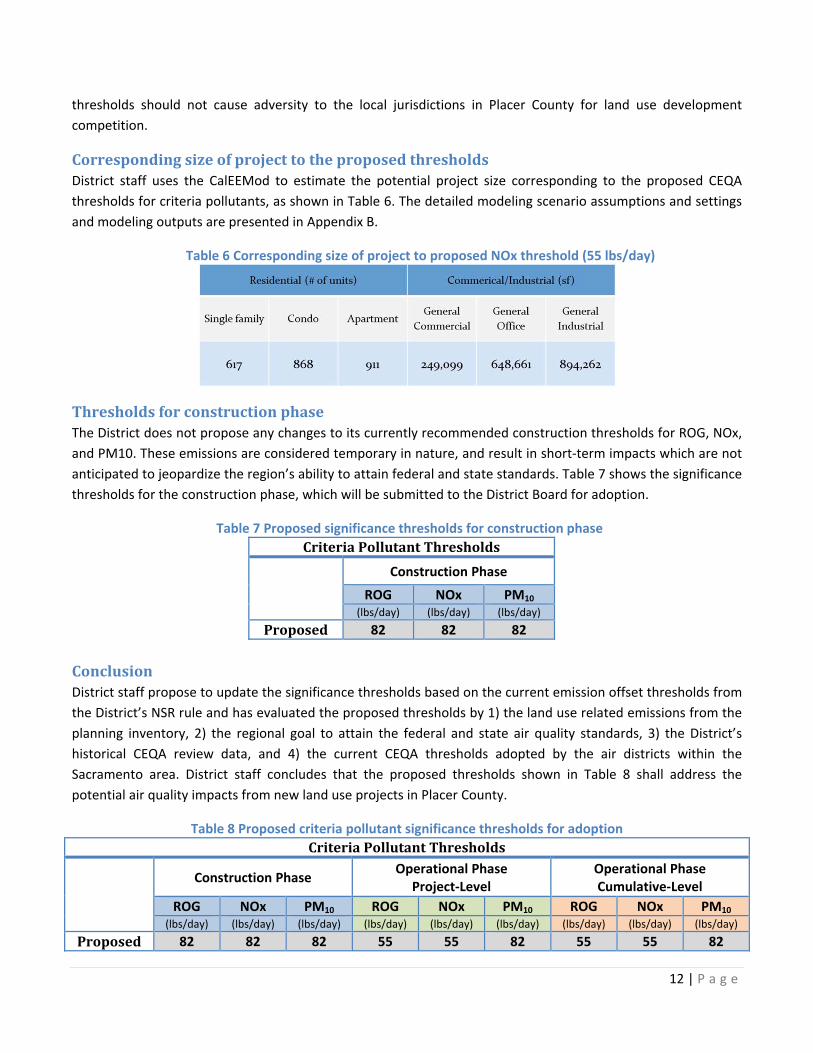
CorrespondingsizeofprojecttotheproposedthresholdsDistrict staff uses the CalEEMod to estimate the potential project size corresponding to the proposed CEQA
thresholds for criteria pollutants, as shown in Table 6. The detailed modeling scenario assumptions and settings
and modeling outputs are presented in Appendix B.
Table 6 Corresponding size of project to proposed NOx threshold (55 lbs/day)
ThresholdsforconstructionphaseThe District does not propose any changes to its currently recommended construction thresholds for ROG, NOx,
and PM10. These emissions are considered temporary in nature, and result in short‐term impacts which are not
anticipated to jeopardize the region’s ability to attain federal and state standards. Table 7 shows the significance
thresholds for the construction phase, which will be submitted to the District Board for adoption.
Table 7 Proposed significance thresholds for construction phase
CriteriaPollutantThresholds
Construction Phase
ROG NOx PM10 (lbs/day) (lbs/day) (lbs/day)
Proposed 82 82 82
ConclusionDistrict staff propose to update the significance thresholds based on the current emission offset thresholds from
the District’s NSR rule and has evaluated the proposed thresholds by 1) the land use related emissions from the
planning inventory, 2) the regional goal to attain the federal and state air quality standards, 3) the District’s
historical CEQA review data, and 4) the current CEQA thresholds adopted by the air districts within the
Sacramento area. District staff concludes that the proposed thresholds shown in Table 8 shall address the
potential air quality impacts from new land use projects in Placer County.
Table 8 Proposed criteria pollutant significance thresholds for adoption
CriteriaPollutantThresholds
Construction Phase
Operational Phase Project‐Level
Operational Phase Cumulative‐Level
ROG NOx PM10 ROG NOx PM10 ROG NOx PM10 (lbs/day) (lbs/day) (lbs/day) (lbs/day) (lbs/day) (lbs/day) (lbs/day) (lbs/day) (lbs/day)
Proposed 82 82 82 55 55 82 55 55 82
13 | P a g e
JustificationforDevelopingtheNewSignificanceThresholdsforGHG
IntroductionThe District’s framework for developing a GHG threshold for land development projects is based on
comprehensive policy and regulatory analysis, as well as considerable technical evaluation of development
trends in Placer County.
On June 1, 2005, Governor Arnold Schwarzenegger issued Executive Order S‐3‐0517. Although it was not included
in state law, Executive Order S‐3‐05 set an ultimate goal for California to reduce GHG emissions to 80 percent
below 1990 levels by 2050.
The California Global Warming Solutions Act (AB32) signed into law in September 2006, required statewide GHG
emissions to be reduced to 1990 levels by 202018. AB32 established regulatory, reporting, and market
mechanisms to achieve this goal and provides guidance to help attain quantifiable reductions in emissions
efficiently, without limiting population and economic growth. CARB is the state agency primarily responsible for
implementing AB32. In order to implement AB32, CARB adopted a Scoping Plan in 200819 that outlined actions
necessary to reduce statewide GHG emissions. The Scoping Plan estimated that California would need to reduce
emissions by 29 percent from a “business as usual” (BAU) scenario to achieve AB32 emission reduction goals.
With the enactment of Senate Bill (SB) 97, California’s lawmakers identified the need to analyze greenhouse gas
emissions as a part of the CEQA process. As part of the mandates in SB 97, the Office of Planning and Research
(OPR) amended the CEQA Guidelines to include the analysis and mitigation of greenhouse gas (GHG) emissions,
which became effective on March 18, 201020. Even in the absence of adopted CEQA thresholds for GHG
emissions, lead agencies are required to analyze the GHG emissions of proposed projects and must reach a
conclusion regarding the significance of those emissions.
Senate Bill (SB) 32 was signed by Governor on September 8, 2016, to establish a California GHG reduction target
of 40 percent below 1990 levels by 203021. California is on track to meet or exceed the current target of reducing
greenhouse gas emissions to 1990 levels by 2020, as established in the California Global Warming Solutions Act
of 2006 (AB 32). California's new emission reduction target of 40 percent below 1990 levels by 2030 will make it
possible to reach the ultimate goal of reducing emissions 80 percent under 1990 levels by 2050.
The District has not previously established thresholds for GHG impacts, but has historically recommended a
determination of significance to be disclosed and be based on the Project’s potential to interfere with statewide
GHG reduction goals established by regulatory requirements. In general, local jurisdictions apply the statewide
emission reduction goals as identified by the CARB Scoping Plan to address the GHG impacts from new land use
projects. However, a recent court case22 raises concerns as to whether consistency with AB32’s statewide
17 California Executive Order S‐3‐05, (June 2005) https://www.gov.ca.gov/news.php?id=1861
18 California Assembly Bill No. 32, http://www.leginfo.ca.gov/pub/05‐06/bill/asm/ab_0001‐0050/ab_32_bill_20060927_chaptered.pdf.
19 AB32 required CARB to adopt a Scoping Plan to describe the approach that California will take to reduce statewide GHG emissions to 1990 levels by
2020. http://www.arb.ca.gov/cc/scopingplan/document/adopted_scoping_plan.pdf 20 https://www.opr.ca.gov/s_ceqaandclimatechange.php
21 California Senate Bill No. 32, https://leginfo.legislature.ca.gov/faces/billNavClient.xhtml?bill_id=201520160SB32
22 Center for Biological Diversity v. California Department of Fish and Wildlife. http://www.courts.ca.gov/documents/7‐s217763‐rpi‐newhall‐land‐farming‐
co‐answer‐brief‐merits‐100914.pdf

14 | P a g e
emission reduction goals is an appropriate significance threshold for determining GHG impacts from a local land
use development project.
The District believes it is imperative to establish GHG significance thresholds which facilitate a uniform process
for land use projects located in Placer County, while assisting the local jurisdictions with analyzing and
identifying potentially significant GHG impacts from land use projects. The District’s proposal is to develop new
GHG thresholds based on Placer County’s special conditions, to assist the State with achieving its GHG reduction
goals, by identifying its share of the GHG reductions outlined in regulatory policies and state requirements.
KeyconsiderationsThe District considered the following factors when developing the CEQA thresholds for GHG emission impacts:
The GHG significant thresholds adopted by other air districts.
The historical CEQA projects reviewed by the District over the last thirteen years (2003‐2015).
The applicable statewide regulatory requirements by 2030.
The special geographic features in Placer County.
The District’s approach to developing significance thresholds for GHG emissions is to identify the emissions level
for which a project would be expected to substantially contribute a mass amount of emissions and would
conflict with existing statewide GHG emission reduction goal adopted by California legislation. The District has
developed a 3‐step process for determining significance which includes 1) a bright‐line threshold, 2) a De
Minimis level, and 3) an efficiency matrix for projects that fall between the Bright‐line and the De Minimis level.
ReviewofexistingadoptedCEQAsignificancethresholdsforGHGimpactsDistrict staff reviewed the existing GHG thresholds adopted by the other air districts in California to explore their
foundations and to develop Placer County thresholds which are supported by substantial evidence. The review
included the data availability, methodologies for establishing the thresholds, and feasibility of thresholds for
Placer County.
SMAQMD ‐ Sacramento Air Quality Management District (2014)
CONSTRUCTION
1) Bright‐Line Thresholds: Construction phase of project – 1,100 metric tons (MT) of Carbon Dioxide
Equivalent per year (CO2e/yr);
Although not adopted, the SMAQMD does recognize amortizing construction emissions into the
operational years.
OPERATIONAL
2) Consistency with a qualified climate action plan or greenhouse gas reduction plan that meets the
requirements of CEQA Guidelines section 15183.5 (b);
3) Bright‐Line Thresholds: Operational phase of a land development project – 1,100 MT CO2e/yr;
STATIONARY
4) Stationary Source threshold: 10,000 MT CO2e/yr (based on 90% capture rate for stationary source
emissions);
5) Consistency with the ARB Scoping Plan: Demonstrate 21.7% reduction from BAU scenario, consistent with
AB32 goals.
15 | P a g e
SLO APCD‐ San Luis Obispo Air Pollution Control District (2012)
CONSTRUCTION
1) Amortized into the operational emissions.
OPERATIONAL
2) Qualitative Reduction Strategies (e.g., Climate Action Plans): a qualitative threshold that is consistent with
AB32 Scoping Plan measures and goals;
3) Bright‐Line Threshold: 1,150 MT CO2e/yr
4) Efficiency‐Based Threshold: 4.9 MT CO2e/SP(Service Population)/yr based on the statewide GHG emission
inventory
a) per capita basis (residential only projects); or
b) “Service population” basis (the sum of the number of jobs and the number of residents provided by a
mixed‐use project).
STATIONARY
5) Stationary Source threshold: 10,000 MT CO2e/yr (based on 90% capture rate for stationary source
emissions).
BAAQMD ‐ Bay Area Air Quality Management District (2010)
CONSTRUCTION
1) Construction emissions were not included in the BAAQMD’s GHG thresholds development process.
OPERATIONAL
2) Consistency with a qualified Climate Action Plan
3) Bright‐line threshold of 1,100 MT CO2e/yr
4) Efficiency‐Based Threshold:
a) Residential projects: 6.7 MT CO2e/capita/yr
b) Mixed use projects: 4.6 MT CO2e/service populations (project jobs + project residents)/yr.
5) For tiering, projects consistent with a SB 375 Sustainable Communities Strategy or Alternative
Planning Strategy would be considered less than significant for transportation‐related GHG
emissions, but not necessarily for other GHG emissions. Review against the bright‐line threshold for non‐
transportation related emissions would still be required.
STATIONARY
6) Stationary Source threshold: 10,000 MT CO2e/yr (based on 95% capture rate for stationary source
emissions).
The above air districts are the only three (3) air districts that have adopted CEQA GHG significance thresholds for
both land use projects and stationary source projects. Table 9 summarizes the current GHG thresholds adopted
by those three air districts in California. In addition to three air districts in Table 9, there are six (6) other air
districts which only adopted the significance thresholds for stationary source projects23.
23 Six air districts adopted GHG thresholds for stationary source project: East Kern County APCD (25,000 MTCO2e/yr); Monterey Bay Unified AQMD (10,000
MTCO2e/yr); Santa Barbara APCD (10,000 MTCO2e/yr); Mojave Desert AQMD (100,000 MTCO2e/yr); Antelope Valley AQMD (100,000 MTCO2e/yr); and San Joaquin Valley APCD (29% below BAU).
16 | P a g e
Table 9 Current GHG Thresholds adopted by air districts in California
The State set up the goal to reduce GHG emissions without limiting population and economic growth. The
District’s concept is to look for a reasonable threshold which would capture larger–scale projects with significant
GHG emission contributions which should implement mitigation. Since several air districts have adopted Bright‐
line GHG thresholds, District staff looked into applying one of these existing thresholds to Placer County. To
evaluate the potential impact to the land use projects in Placer County, staff reviewed the District’s historical
CEQA review data by selecting 1) 10,000 MT CO2e/yr, 2) 1,100 MT CO2e/yr; and 3) the 90 percent of emissions
capture that is one of the methodologies suggested by California Air Pollution Control Officer Association
(CAPCOA) to establish a quantitative threshold24.
DistricthistoricalCEQAreviewdataThe purpose of evaluating the District’s historical CEQA review data is to identify whether the selected
thresholds would trigger land use projects with substantially significant GHG emission contributions to be
considered “potentially significant”, thus requiring implementation of mitigation measures.
There were 688 projects sent to the District for CEQA review in the past thirteen (13) year period (2003‐2015).
District Staff used CalEEMod to estimate the potential GHG emissions from all projects that would have been
approved and built out as of 2020, and ranked each project by its associated GHG emissions. Note that these
projects don’t include any development that was either determined by lead agencies to be exempt from CEQA,
or development that was not considered to be a “project” as defined by CEQA. The District looked to this data to
determine how the selected thresholds would impact land use project review in Placer County.
Table 10 shows the result of review when applying selected thresholds to the historical CEQA review data. The
District found that with a threshold of 10,000 MT CO2e/yr, 11% of projects would exceed this threshold, and
those projects contribute approximately 82% of total GHG emissions of the 688 projects built‐out. If applying the
24 California Air Pollution Control Officer Association CEQA & Climate Change http://www.capcoa.org/wp‐content/uploads/2012/03/CAPCOA‐White‐
Paper.pdf
17 | P a g e
threshold of a 90% emission capture rate, the threshold would be at 4,000 MT CO2e/yr, and about 19% of
projects would exceed this threshold. When applying the threshold of 1,100 MT CO2e/yr, the result shows about
47% of projects with emissions above 1,100 MT CO2e/yr, and these projects contribute 97% of total GHG
emissions from the 688 projects.
Table 10 Current GHG Thresholds adopted by air districts in California
EstablishingaBright‐linethresholdforGHGimpactanalysisAs discussed in the criteria pollutant threshold justification, there is a direct nexus between direct emissions
from stationary sources and indirect emissions associated with land use sources. GHG emissions, once emitted,
are indistinguishable as to the source – “air pollution is air pollution” – and have the same detrimental effect on
climate change regardless of the source. According to this concept, the District proposes 10,000 MT CO2e/yr as
a Bright‐line threshold in Placer County for all projects (including stationary source projects) subject to CEQA,
since this threshold has been used by CARB as a regulatory requirement25 and was adopted by several air
districts as a CEQA significance threshold for stationary sources. Table 10 demonstrates that 10,000 MT CO2e/yr
can be used to determine if a project would be considered a substantially large enough of a contribution to
cumulative impacts and therefore significant in Placer County. A project which exceeds this proposed Bright‐line
threshold should identify mitigation to lessen the emissions for its cumulative impact.
Table 10 also presents two lower thresholds which would capture more emissions resulting from land use
projects. However, the lower thresholds may expose smaller projects to unnecessary requirements. Table 11
presents the comparison of the proposed NOx threshold and GHG thresholds because both pollutants are from
combustion sources. The table shows that a GHG threshold of 4,000, or 1,100 MT CO2e/yr, will result in more
projects with potentially significant conclusions, compared to the proposed NOx threshold of 55 lbs/day. The
District believes that the proposed Bright‐line threshold should focus on larger projects with the most significant
GHG emissions and not expose smaller projects to unnecessary requirements. The threshold of 10,000 MT
CO2e/yr would meet this objective, as it would trigger 11% of projects with potentially significant conclusions,
and would capture 82% of emissions, which is the same as the emission capture rate for the proposed NOx
threshold. The District concludes the threshold of 10,000 MT CO2e/yr should be applicable to address the
potential GHG impacts from a land use project and to identify appropriate mitigation to lessen GHG emissions
for its cumulative impact.
25 CARB Mandatory Greenhouse Gas Emissions Report Regulation http://www.arb.ca.gov/regact/2016/ghg2016/ghgatta.pdf
18 | P a g e
Table 11 Project & Emission Impact for proposed NOx and GHG Thresholds
EstablishingefficiencymatrixThe District believes that each land use project should be responsible for its related GHG emissions. According to
Table 10, there are 89% of projects with emissions below 10,000 MT CO2e/yr. If the District only applies the
threshold of 10,000 MT CO2e/yr, it could penalize highly‐efficient projects merely for being larger and allow very
inefficient projects to pass through without mitigation merely for being smaller. Therefore, the District also
proposes an efficiency matrix for projects which have emissions equal to or below 10,000 MT CO2e/yr. The
proposed efficiency matrix contains the set of efficiency conditions that smaller projects must meet, based on
the type of land categories (residential or non‐residential), as well as Placer County’s special land use setting
(urban or rural area).
The current GHG efficiency thresholds adopted by the other air districts or lead agencies are either on a per
capita basis or a “service population” basis (the sum of the number of jobs and the number of residents
provided by a mixed‐use project). This methodology identifies land use related GHG emissions in a state or
region inventory, divided by the projected statewide or regional population and employees at the target year.
However, there is no available land use related GHG emission estimation for Placer County, and no suitable
employment information for Placer County to estimate how many jobs would be offered by the proposed land
use projects (e.g., shopping center, office building, or industrial warehouse). The District’s proposed efficiency
matrix includes a “per capita” metric which is consistent with the methodology used by other air districts, and
also provides an additional metric, based on available data today, for non‐residential land use projects within
Placer County.
District staff utilized CalEEMod as the tool to develop the efficiency matrix. As previously stated, CalEEMod is a
statewide land use emissions computer model used by government agencies, land use planners, and
environmental professionals to quantify potential GHG emissions from a variety of land use projects. The model
quantifies land use related GHG emissions from mobile sources, energy use, solid waste disposal, vegetation
planting and/or removal, and water use. The model is developed in collaboration with various data including
emission factors, trip lengths, utility usage, meteorology, source inventory, and special land use setting (urban or
rural) provided by the various public agencies to account for local special requirements and conditions in Placer
County. Therefore, the emission estimation from CalEEMod would be considered as representable information
for projects within Placer County.
19 | P a g e
District staff used the year 2030 as the target year of the efficiency matrix for Placer County. The year 2030 has
been selected in consideration of SB32 and the Clean Energy and Pollution Reduction Act (SB350)26. SB350 was
signed into law in October 2015, establishing new clean energy, clean air and GHG reduction goals for 2030 and
beyond. SB32, which was signed into law in September 2016, expands the statewide GHG reduction targets to
40 percent below the 1990 levels by 2030. These legislative actions set 2030 as the mid‐term target year, while
continuing to pursue California’s long‐term climate goal by 2050. At this time, District staff selected 2030 as the
scenario to develop the efficiency conditions for new land use projects within Placer County. District staff will
reassess and make necessary modifications for efficiency metrics when the state scopes the detailed scheme for
the 2030 target.
Under the 2030 scenario, District staff identified four different efficiency conditions for each of the location
settings (i.e., urban and rural), as well as new land use types (residential and nonresidential) in Placer County.
The modeling analysis assumes energy efficiency resulting from 50% renewable electricity procurement
achievement in 2030 (SB350); compliance with latest Title 24 energy efficiency standard (2016 standards)27; and
mobile source emissions in 2030 affected by statewide regulations such as clean car standards (AB1493)28 and
low carbon fuel standard (LCFS)29. The efficiency conditions for residential projects are presented as MT CO2e
per capita based on the default household size of 2.83 in CalEEMod. The household size can be overwritten in
the model for land use projects located within a jurisdiction with a value different from the default setting. For
non‐residential projects, the efficiency conditions are presented as MT CO2e per 1,000 square feet (sf).
The proposed efficiency matrix were identified by selecting single family residential and general commercial
usage for the residential and non‐residential land use types, as well as urban and rural location settings in 2030.
The lead agency will decide which project location settings (urban or rural) would be appropriate for the
proposed project description. For a mixing‐use type project, District staff suggests the lead agency can decide
which land use types (residential or non‐residential) would be more suitable for the proposed mixing‐use
designs. District staff presumes the proposed efficiency matrix would assist to promote projects which consider
higher density and mixing‐use designs, since townhouses or apartments would have better efficiency results
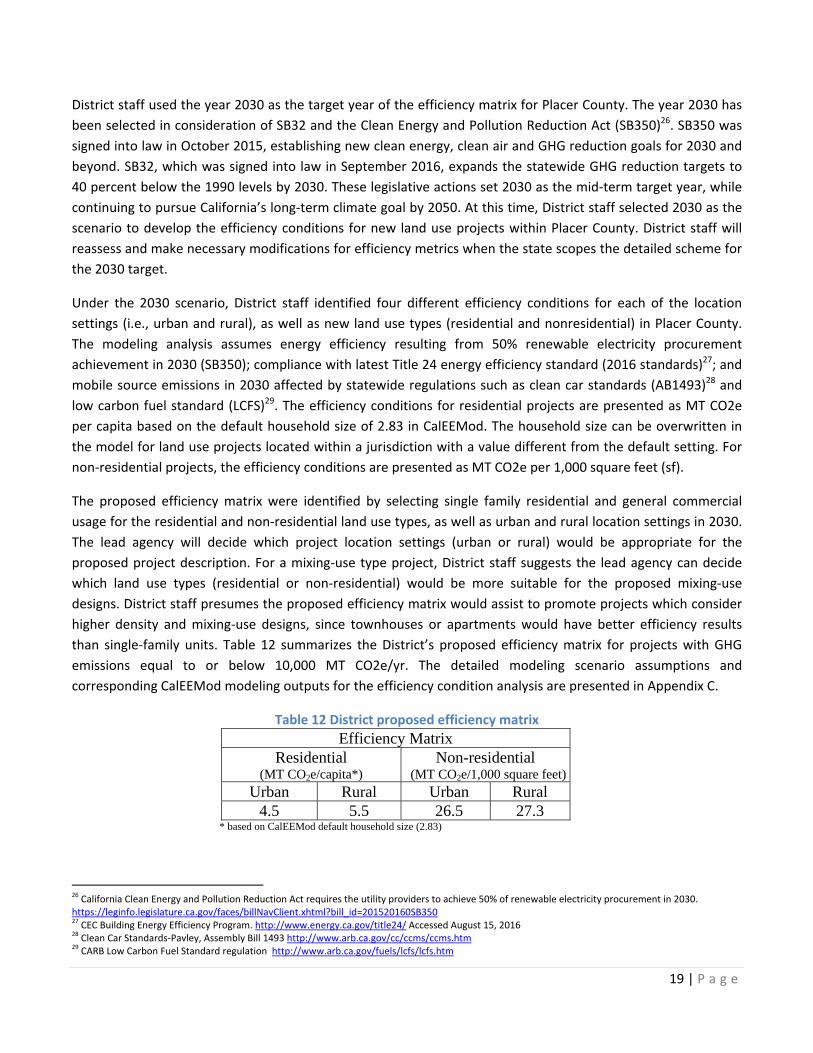
than single‐family units. Table 12 summarizes the District’s proposed efficiency matrix for projects with GHG
emissions equal to or below 10,000 MT CO2e/yr. The detailed modeling scenario assumptions and
corresponding CalEEMod modeling outputs for the efficiency condition analysis are presented in Appendix C.
Table 12 District proposed efficiency matrix
Efficiency Matrix Residential
(MT CO2e/capita*)Non-residential
(MT CO2e/1,000 square feet)Urban Rural Urban Rural
4.5 5.5 26.5 27.3 * based on CalEEMod default household size (2.83)
26 California Clean Energy and Pollution Reduction Act requires the utility providers to achieve 50% of renewable electricity procurement in 2030.
https://leginfo.legislature.ca.gov/faces/billNavClient.xhtml?bill_id=201520160SB350 27 CEC Building Energy Efficiency Program. http://www.energy.ca.gov/title24/ Accessed August 15, 2016
28 Clean Car Standards‐Pavley, Assembly Bill 1493 http://www.arb.ca.gov/cc/ccms/ccms.htm
29 CARB Low Carbon Fuel Standard regulation http://www.arb.ca.gov/fuels/lcfs/lcfs.htm
20 | P a g e
EstablishingDeMinimsLevelforexemptingGHGimpactanalysisPlacer County has special geographical features with a lot of rural areas. A smaller project such as minor land
division could be proposed in these rural areas and are subject to CEQA review. Because of the project size, it
may have fewer options to mitigate its own GHG emissions. The District proposes to identify a “De Minimis”
level which will relieve very small projects with a potentially significant conclusion, and therefore require
implementing mitigation measures. In Table 10, staff found that more than 50% of the projects with GHG
emissions less than 1,100 MT CO2e/yr and these projects would contribute only 3% of the total GHG emissions
from projects reviewed over the thirteen year period. In light of this result, the District identifies that projects
emitting less than 1,100 MT CO2e per year in Placer County would be expected to have a “De Minimis”30 impact
because they contribute a relatively small fraction of the cumulative GHG emissions in Placer County. These
smaller projects will still be required to reduce their GHG emissions through the state and local regulations
compliance such as building codes and energy efficiency standards.
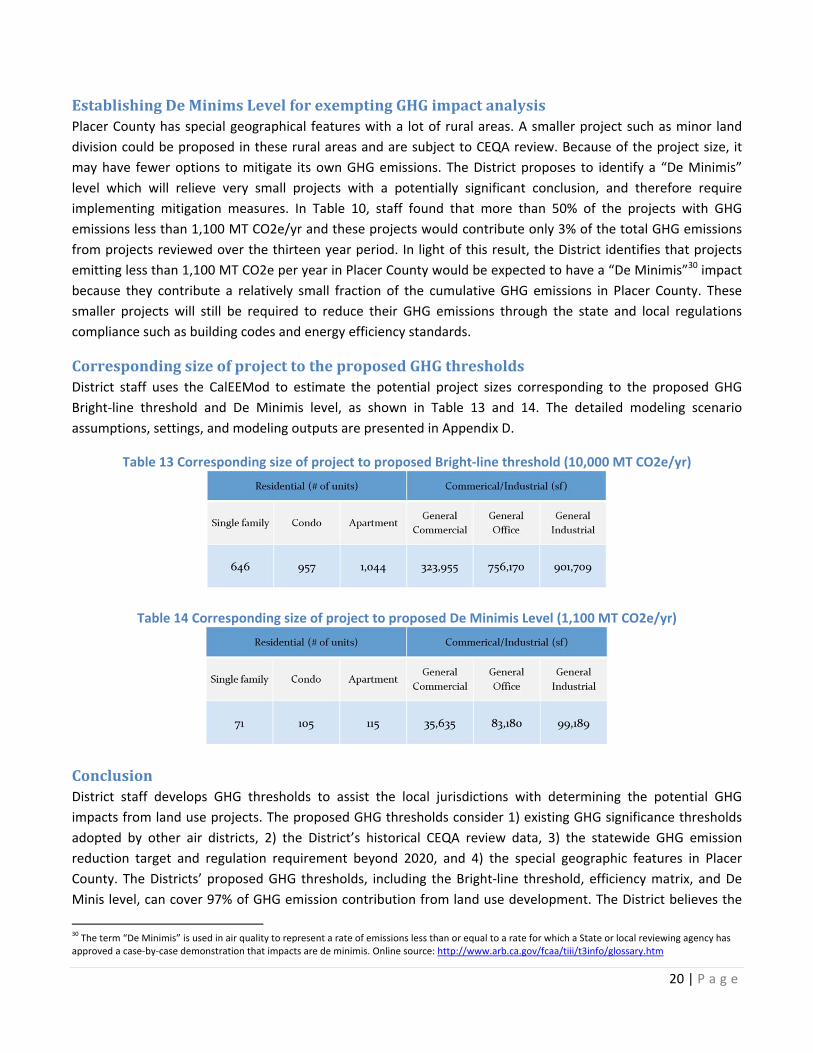
CorrespondingsizeofprojecttotheproposedGHGthresholdsDistrict staff uses the CalEEMod to estimate the potential project sizes corresponding to the proposed GHG
Bright‐line threshold and De Minimis level, as shown in Table 13 and 14. The detailed modeling scenario
assumptions, settings, and modeling outputs are presented in Appendix D.
Table 13 Corresponding size of project to proposed Bright‐line threshold (10,000 MT CO2e/yr)
Table 14 Corresponding size of project to proposed De Minimis Level (1,100 MT CO2e/yr)
ConclusionDistrict staff develops GHG thresholds to assist the local jurisdictions with determining the potential GHG
impacts from land use projects. The proposed GHG thresholds consider 1) existing GHG significance thresholds
adopted by other air districts, 2) the District’s historical CEQA review data, 3) the statewide GHG emission
reduction target and regulation requirement beyond 2020, and 4) the special geographic features in Placer
County. The Districts’ proposed GHG thresholds, including the Bright‐line threshold, efficiency matrix, and De
Minis level, can cover 97% of GHG emission contribution from land use development. The District believes the
30 The term “De Minimis” is used in air quality to represent a rate of emissions less than or equal to a rate for which a State or local reviewing agency has
approved a case‐by‐case demonstration that impacts are de minimis. Online source: http://www.arb.ca.gov/fcaa/tiii/t3info/glossary.htm
21 | P a g e
proposed GHG significance thresholds should present a balance between the growths based on Placer County’s
special conditions and assumed responsibility for its share of the GHG reductions under CEQA to assist California
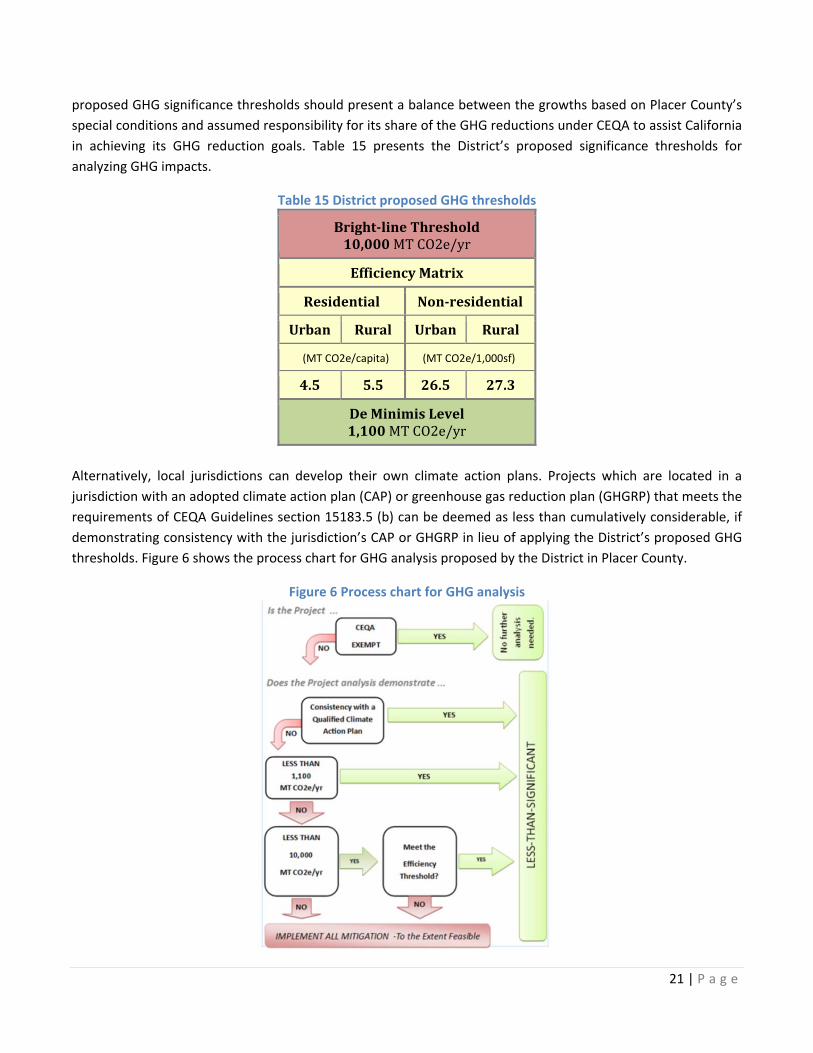
in achieving its GHG reduction goals. Table 15 presents the District’s proposed significance thresholds for
analyzing GHG impacts.
Table 15 District proposed GHG thresholds
Bright‐lineThreshold10,000MTCO2e/yr
EfficiencyMatrix
Residential Non‐residential
Urban Rural Urban Rural
(MT CO2e/capita) (MT CO2e/1,000sf)
4.5 5.5 26.5 27.3
DeMinimisLevel1,100MTCO2e/yr
Alternatively, local jurisdictions can develop their own climate action plans. Projects which are located in a
jurisdiction with an adopted climate action plan (CAP) or greenhouse gas reduction plan (GHGRP) that meets the
requirements of CEQA Guidelines section 15183.5 (b) can be deemed as less than cumulatively considerable, if
demonstrating consistency with the jurisdiction’s CAP or GHGRP in lieu of applying the District’s proposed GHG
thresholds. Figure 6 shows the process chart for GHG analysis proposed by the District in Placer County.
Figure 6 Process chart for GHG analysis
22 | P a g e
ThresholdsforlandUseProjectConstructionPhaseandStationarySourceProjectThe District also proposes using the Bright‐line threshold of 10,000 MT CO2e/yr for determining the level of
significance for the land use construction phase and the stationary source project’s operational phase. GHG
emissions from the construction phase are considered temporary in nature, and would result in short‐term
impacts. In addition, using 10,000 MT CO2e/yr as the threshold for stationary source projects is consistent with
other adopted thresholds throughout California, and it is consistent with the CARB mandatory reporting level for
stationary sources.