Embed Size (px)
Citation preview

University of Calgary
PRISM: University of Calgary's Digital Repository
Graduate Studies Legacy Theses
2005
Placental cell lineage tracing using cre recombinase
transgenic mice
Fortier, Amanda Lea
Fortier, A. L. (2005). Placental cell lineage tracing using cre recombinase transgenic mice
(Unpublished master's thesis). University of Calgary, Calgary, AB. doi:10.11575/PRISM/21660
http://hdl.handle.net/1880/44808
master thesis
University of Calgary graduate students retain copyright ownership and moral rights for their
thesis. You may use this material in any way that is permitted by the Copyright Act or through
licensing that has been assigned to the document. For uses that are not allowable under
copyright legislation or licensing, you are required to seek permission.
Downloaded from PRISM: https://prism.ucalgary.ca

UNIVERSITY OF CALGARY
PLACENTAL CELL LINEAGE TRACING USING CRE RECOMBINASE
TRANSGENIC MICE
by
Amanda Lea Fortier
A THESIS
SUBMITTED TO THE FACULTY OF GRADUATE STUDIES
IN PARTIAL FULFILLMENT OF THE REQUIREMENTS FOR THE
DEGREE OF MASTER OF SCIENCE
DEPARTMENT OF BIOCHEMISTRY AND MOLECULAR BIOLOGY
FACULTY OF MEDICINE
GRADUATE PROGRAM IN BIOCHEMISTRY AND MOLECULAR BIOLOGY
CALGARY, ALBERTA
JANUARY, 2005
© Amanda Lea Fortier 2005

The author of this thesis has granted the University of Calgary a non-exclusive license to reproduce and distribute copies of this thesis to users of the University of Calgary Archives.
Copyright remains with the author.
Theses and dissertations available in the University of Calgary Institutional Repository are solely for the purpose of private study and research. They may not be copied or reproduced, except as permitted by copyright laws, without written authority of the copyright owner. Any commercial use or publication is strictly prohibited.
The original Partial Copyright License attesting to these terms and signed by the author of this thesis may be found in the original print version of the thesis, held by the University of Calgary Archives.
The thesis approval page signed by the examining committee may also be found in the original print version of the thesis held in the University of Calgary Archives.
Please contact the University of Calgary Archives for further information, E-mail: [email protected]: (403) 220-7271 Website: http://www.ucalgary.ca/archives/

PLACENTAL CELL LINEAGE TRACING USING CRE RECOMBINASE
TRANSGENIC MICE
Master of Science 2004
Department of Biochemistry and Biology, University of Calgary
ABSTRACT
The placenta is essential for the proper growth and development of the fetus. Cell
lineage relationships in the placenta have not been studied in vivo, largely because cell
lineage tracing methods were not easily adapted to study this organ. The use of site
specific recombinases in vivo has provided feasible methods for the study of tissues that
were previously unavailable for direct cell lineage studies, including the placenta. We
have exploited the heritability of Cre recombinase mediated genetic changes to study the
fate of cells in the placenta. We have generated mice in which Cre recombinase is under
the control of the Tpbpa promoter, and examined the fate of cells expressing the
transgene in vivo. Tpbpa-expressing cells were found to contribute to the secondary
trophoblast giant cell lineage, and to be the predominant cell type associated with
maternal spiral arteries and large maternal blood spaces within the labyrinth layer.
iii

ACKNOWLEDGEMENTS
First, I would like to thank my supervisor, Jay Cross, for all the time and effort he
has spent helping me to develop critical thinking skills. Jay has been encouraging
through the difficult times. He has always tried to get me to see things in a different way,
and to approach things from a different angle, an invaluable lesson for the future.
I would like to thank all of the members of the Cross lab that I have had the
pleasure of working with over the past few years. In particular, I want to thank Erica
Watson, Colleen Geary-Joo and Maja Starovic, who have all taught me invaluable
lessons in both science and in life. The wonderful postdocs who have passed through the
lab (Hideyuki Yamamoto, Myriam Hemberger, David Simmons, David Natale, Micheal
Hesse and Haruo Nakano) have been a constant source of so many things – knowledge,
assistance and encouragement. Of course, no mention of the Cross lab would be
complete without Fran Allen, Martha Hughes, Lin Su, and Xiang Zhao who are the
mainstays of the lab, and always willing to help whenever they are needed.
I would like to thank all the many ultimate players I have had the joy and
happiness to play with here in Calgary, for making my life so much more fun!
Finally, and most importantly I want to thank my family and friends. My parents
and siblings have been so patient in my pursuit of higher learning; despite how far from
home it is taking me. Jeremy Hebert, you have been my source of strength – I love you
and your family. Although our time together is short, our friendship is forever.
iv

TABLE OF CONTENTS
Approval page……………………………………………………………..…..…….ii
Abstract……………………………………………………………………………
Acknowledgements…………………………………………………………….……iv
..iii
Table of Contents……………………………………………………………….…....v
List of Figures……………………………………………………………………...viii
List of Tables…………………………………………………………………….......ix
List of Abbreviations……………………………………………………………..…..x
CHAPTER ONE: INTRODUCTION
1.1 General Introduction………………………………………….………2
1.2 Placental Development……………………………………….………3
1.2.1 Early Development of the Trophoblast Lineage…………….…3
1.2.2 Cell Types in the Mature Placenta………………………….….3
1.1.2.1 Labyrinth………………………………………….....6
1.1.2.2 Spongiotrophoblast and Glycogen Trophoblast……..6
1.1.2.3 Trophoblast Giant Cells……………………………...8
1.2.3 Trophoblast Stem Cells …………………………………….….9
1.3 Placental Vascularization………………………………………….…… 9
1.3.1 Maternal Vascular System……………………….……12
1.3.2 Fetal Vascular System………………………….…….13
1.4 Site-Specific Recombinases…………………………………….…..13
1.4.1 Cre-loxP System……………………………………………...14
1.4.2 Other Site-Specific Recombinases…………………………....17
1.4.3 Conditional Genome Alteration in the Mouse………………..19
1.4.4 Cre Reporter Mice………………………………………….…19
1.4.4.1 Single Reporter Systems………………………….…20
1.4.4.2 Double Reporter Systems…………………………..20
1.5 Cell Lineage Tracing in the Mouse………………………………....20
v

1.5.1 Inert Compounds, Enzymes, Dyes and Fluorescent Markers..20
1.5.2 Passive Endogenous Genetic Markers……………………….23
1.5.3 Active Endogenous Genetic Markers………………………...25
1.6 Promoters Useful in the Creation of Trophoblast Cell-Type……….26
Specific Cre mice
1.6.1 Genes Expressed Throughout the Trophoblast Lineage………26
1.6.1.1 Keratin-18 (K18)…………………………………...26
1.6.1.2 Adenosine Deaminase (ADA)………………………28
1.6.2 Labyrinth Specific Promoters………………………………...29
1.6.2.1 Tissue Non-Specific Alkaline Phosphatase (TNAP).29
1.6.2.2 Aromatase (CYP19)…..……………………………30
1.6.3 Spongiotrophoblast/Glycogen Trophoblast Specific…………31
Promoters
1.6.3.1 Trophoblast-specific Protein-α (Tpbpα)…………...31
1.6.4 Trophoblast Giant Cell Specific Promoters…………………..33
1.6.4.1 Renin-1 (Ren-1)…………………………………….33
1.6.4.2 Placental Lactogen I(PLI) and Placental …………..35
Lactogen II(PLII)
1.7 Conclusion……………………………………………………...36
CHAPTER TWO: PLACENTAL CELL LINEAGE TRACING USING CRE
RECOMBINASE TRANSGENIC MICE
2.1 Introduction…………………………………………………38
2.2 Material and Methods ………………………………………40
2.3 Results ………………………………………………………46
2.4 Discussion…………………………………………………..68
CHAPTER THREE: FUTURE DIRECTIONS
3.1 Future Direction 1: Cell Lineage Tracing at Earlier ……….80
vi

Developmental Stages
3.2 Future Direction 2: Lineage Tracing of Trophoblast ……...81
Stem Cells in vivo
3.3 Future Direction 3: Applications of Tpbpa-CIG mice……..83
3.4 Conclusions………………………………………………...85
REFERENCES……………………………………………………………..............86
vii

LIST OF FIGURES
Figure 1. Development of extraembryonic cell lineages 5
Figure 2. Cell Lineage Relationships in the extraembryonic tissues of the 11
Mouse
Figure 3. Mechanism of Cre Recombination 16
Figure 4. Generation of spongiotrophoblast specific Cre mice 48
Figure 5. Expression of Tpbpa-CIG in the developing placenta 53
Figure 6. Cre-mediated recombination occurs in all spongiotrophoblast 58
and glycogen trophoblast cells by E14.5
Figure 7. A proportion of secondary trophoblast giant cells arise from 61
Tpbpa-expressing precursor cells
Figure 8. Cells lining large maternal blood spaces within the labyrinth 64
are derived from the ectoplacental cone
Figure 9. Cells immediately lining the lumen of maternal spiral arteries 67
are derived from the ectoplacental cone
viii

LIST OF TABLES
Table 1. Cre-Responsive Indicator Mice 21
Table 2. PCR genotyping of Tpbpa-CIG transgenic mice 50
Table 3. Inheritance of the Tpbpa-CIG transgene based on the presence 54
of hPLAP staining in the EPC or placenta in Tpbpa-CIG x
Z/AP crosses
ix

LIST OF ABBREVIATIONS
AP alkaline phosphatase
bp base pairs
BSA bovine serum albumin
1,1’-dioctadecyl-3,3,3’,3’-tetramethyl indocarbocyanine
diI perchlorate
diO 3,3 ′-dioctadecyloxacarbo-cyanine
DNA deoxyribonucleic acid
E embryonic day
EGFP enhanced green fluorescent protein
EPC ectoplacental cone
ES embryonic stem
FRT Flp recombinase recognition target
hPLAP human placental alkaline phosphatase
HRP horseradish peroxidase
ICM inner cell mass
IRES internal ribosome entry site
JG juxtaglomerular
loxP location of crossover (x) in P1 bacteriophage
PCR polymerase chain reaction
RDX rhodamine-conjugated dextran
TE trophectoderm
tet tetracycline
tetO tetracyline operator
Tpbpa trophoblast specific protein alpha
x

CHAPTER ONE:
INTRODUCTION

2
1.1 General Introduction
The establishment of a mature placenta is critical for the growth and development
of the fetus. Defects in placental development have been associated with many problems
of pregnancy, including growth restriction, preeclampsia and death. Understanding how
the placenta develops will assist in the comprehension of the problems that arise during
pregnancy, and improve the chance for successful outcomes.
In the mouse, the mature placenta contains three main trophoblast cell types; the
hormone-producing trophoblast giant cells, the supportive spongiotrophoblast layer and
the syncytiotrophoblast separating maternal and fetal blood (Cross et al., 1994) (Figure
1). These cell types all arise from the same cell type, the trophectoderm (Cross, 2000),
but after the initial formation of this progenitor population, little is known about the cell
lineage decisions that lead to the generation of the three distinct cell types in the mature
placenta. Indirect evidence, largely through cell and explant culture experiments,
suggests that there are two stages of differentiation. The first decision establishes the
extraembryonic ectoderm and the ectoplacental cone, and the second establishes the final
phenotype of the cells (Figure 2).
Direct cell lineage tracing experiments are important to the understanding of the
molecular mechanisms underlying trophoblast differentiation, but in the mouse placenta
have been difficult as this tissue is not readily manipulated in vivo. As new techniques
have been developed for studying cell lineage in vivo, the ability to introduce permanent,
heritable genetic change using site-specific recombinases has made cell lineage tracing in
the placenta possible. We have exploited the Cre-loxP system to study cell lineage in the
placenta. This introduction will focus on our current understanding of placental
development and the lineage decisions that lead to the generation of the terminal cell
types, cell lineage tracing methods and applications of site-specific recombinases in
general.

3
1.2 Placental Development
1.2.1 Early Development of the Trophoblast Lineage
The trophoblast lineage is the first cell type to be specified in the developing
mouse embryo. It first appears at the blastocyst stage as a simple epithelium termed the
trophectoderm (TE) (Figure 1) (Cross, 2000). These cells surround the outside of the
blastocyst, enclosing the inner cell mass (ICM), which will form the embryo proper, and
the blastocoel. At this early stage, only 50-60 trophoblast cells are formed, such that a
significant amount of proliferation occurs following implantation (Cross, 2000). The
signal for proliferation originates in the ICM, so placental development depends on the
presence of a viable embryo (Cross, 2000; Rossant and Tamura-Lis, 1981). The
proliferative population of trophoblast cells is limited to the cells of the polar TE, which
are immediately overlying the ICM (Figure 1) and later to the extraembryonic ectoderm
of the chorion (Cross, 2000). The mural TE cells, which are the cells surrounding the
blastocoel, cease proliferating and terminally differentiate to form primary trophoblast
giant cells immediately following implantation (Cross, 2000).
1.2.2 Cell Types in the Mature Placenta
Within the mature placenta, there are three main layers of trophoblast cells: the
outermost layer of trophoblast giant cells, the intermediate spongiotrophoblast layer and
the labyrinth closest to the embryo (Figure 1) (Cross et al., 1994). The labyrinth forms
after embryonic day (E) 9 following chorioallantoic attachment. The labyrinth is mostly
made up of two layers of trophoblast syncytia separating the maternal blood spaces from
the fetal blood vessels (Adamson et al., 2002; Cross, 2000). The spongiotrophoblast
layer is derived from a flattening of the ectoplacental cone after E7.5 (Cross, 2000).
Trophoblast giant cells lie at the periphery of the placenta and first mediate invasion and
implantation into the uterus (Cross et al., 1994). Following implantation, trophoblast
giant cells interact with the maternal blood vessels, and produce hormones, growth
factors and angiogenic factors that affect maternal physiology (Adamson, et al. 2002;
Cross et al., 1994; Hemberger et al., 2003b).

4
Figure 1. Development of extraembryonic cell lineages. Development of the mouse
embryo from embryonic day (E) 3.5 to 12.5, highlighting the development of
extraembryonic lineages. ICM=inner cell mass. Adapted from Rossant and Cross
(2001).

5

6
1.2.2.1 Labyrinth
The development of the labyrinth is dependant upon the interaction of the
allantoic mesoderm with the chorionic trophoblast cells (Cross, 2000). The allantois
grows out from the posterior end of the embryo and contacts the chorion at E8.5 (Downs,
1998). Within the chorion, some cells continue to proliferate, while some of the
trophoblast cells begin to form primary branch points for the villous structure (Cross,
2000). Within these branch points, allantoic mesoderm and fetal blood vessels bud into
the chorionic plate, these continue to elongate and branch to form the fetal blood spaces
within the labyrinth.
Syncytiotrophoblast cell differentiation also begins at E9.0. (Adamson et al.,
2002; Cross, 2000). Syncytiotrophoblast cells form by the fusion of precursor cells to
form multinucleate cells (Cross, 2000). The precursor of this cell population has yet to be
identified, but likely resides in the chorion based on the conserved expression of certain
genes exclusively in the chorion and later in the labyrinth layer of the placenta (Cross,
2000). The bulk of the labyrinth is made up of the two layers of these syncytial cells,
which surround the fetal blood spaces within the labyrinth (Adamson et al., 2002).
The factors required for trophoblast fusion in the mouse placenta are unknown.
However, two genes involved in fusion of the analogous human villous cytotrophoblast
cells have been identified, syncytin-1(Mi et al., 2000) and syncytin-2 (Blaise et al., 2003).
Of the two, syncytin-1 has been shown to be expressed exclusively in the syncytial cells
of the human placenta. The syncytin proteins are encoded by an envelope gene of the
human endogenous retroviral family, and mediate cell fusion in vitro (Blaise et al., 2003;
Chang et al., 2004). These genes are not present in mice, however, indicating that other
mechanisms of cell fusion are likely responsible for fusion in other mammals.
1.2.2.2 Spongiotrophoblast and Glycogen Trophoblast
The spongiotrophoblast layer lies between the innermost labyrinth layer and the
outer trophoblast giant cell layer, and is comprised of a densely packed layer of diploid
cells (Cross et al., 2002a). The spongiotrophoblast layer is likely derived from the
diploid precursor population within the EPC based on the conservation of gene
expression patterns. Both trophoblast-specific protein alpha (Tpbpa) (Carney et al., 1993;

7
Lescisin et al., 1988) and FMS-like tyrosine kinase-1 (Flt 1) (He et al., 1999) are
expressed in a subset of cells within the EPC, and become restricted to the
spongiotrophoblast layer as placental development proceeds (Cross et al., 2003).
The function of the spongiotrophoblast layer is twofold. First, it provides
structural support to the underlying labyrinth (Cross, 2000; Rossant and Cross, 2001).
Evidence for this is provided by analysis of several genetic mutants with defects in
spongiotrophoblast formation. In mice deficient for the basic helix-loop-helix
transcription factor Mash2, the spongiotrophoblast layer is lost, with an associated
increase in trophoblast giant cell formation (Guillemot et al., 1994). Additionally, these
mice demonstrate defects in labyrinth morphogenesis, which was shown to be secondary
to the spongiotrophoblast defect in chimaeric studies (Tanaka et al., 1997). Similarly, in
the absence of ARNT, a subunit of hypoxia inducible factor-1 (HIF-1),
spongiotrophoblast maintenance is impaired and again, the trophoblast giant cell
population is expanded (Adelman et al., 2000; Kozak et al., 1997). These mice also
demonstrate defects in labyrinth morphogenesis, including decreased fetal blood vessel
invasion. Chimaeric mice demonstrated that Arnt-/- mesodermal cells were able to
invade into the placenta in a wild type context, indicating that the defect resides in the
trophoblast compartment, though the experiment does not distinguish between roles in
the spongiotrophoblast versus the labyrinth trophoblast cells. In a different context,
Cited1-deficient mice demonstrate an expanded spongiotrophoblast layer with larger
projections into the labyrinth layer, as well as defects in labyrinth morphogenesis
characterized by larger, less branched maternal blood spaces (Rodriguez et al., 2004).
Rodriguez et al. (2004) propose that the increase in the spongiotrophoblast layer may
inhibit branching morphogenesis in the labyrinth by either physical or molecular means.
Together, these data support the hypothesis that a major function of the
spongiotrophoblast layer is to support the underlying labyrinth.
A second important role of the spongiotrophoblast is the production of hormones
that are targeted to both maternal and fetal tissues (Lu et al., 1994). In particular, the
spongiotrophoblast produces and releases proteins of the prolactin family of hormones
and cytokines that are important for the establishment and maintenance of pregnancy
8
(Soares, 2004; Soares et al., 1998). This function is shared with glycogen trophoblast
cells and trophoblast giant cells, but each cell type expresses distinct members of the
prolactin family (Soares, 2004), suggesting distinct roles for each of these cell types in
physiological contol.
Glycogen trophoblast cells first appear within the spongiotrophoblast layer, and
express the spongiotrophoblast marker Tpbpa (Adamson et al., 2002). These cells likely
represent a specialized subtype of spongiotrophoblast (Cross et al., 2003), and are known
to invade into the maternal decidua by an interstitial route (Adamson et al., 2002), and
secrete hormones important for the maintenance of pregnancy (Soares, 2004; Soares et
al., 1998). These data suggest that glycogen trophoblast cells may play an important role
in influencing maternal physiology for maintaining pregnancy and perhaps in preparing
the maternal system for postpartum requirements such as lactation.
1.2.2.3 Trophoblast Giant Cells
Trophoblast giant cells are so named because of the large cell and nuclear sizes
they achieve. Trophoblast giant cells exhibit an unusual form of DNA replication, in
which the cells cease dividing but continue to replicate their DNA, reaching ploidies up
to 1024C (Zybina and Zybina, 1996). In rodents, trophoblast giant cells arise in two
distinct stages during placental development. The first trophoblast giant cells to
differentiate (‘primary’ giant cells) result from the differentiation of the mural TE after
implantation (Cross, 1998). A second set of trophoblast giant cells (‘secondary’ giant
cells) is derived from a precursor cell population at the outer edge of the ectoplacental
cone, and later from the spongiotrophoblast. The evidence for this developmental
pathway is indirect, and lineage tracing studies have yet to be done. However, the
isolation and culture of ectoplacental cone or spongiotrophoblast cells results in a rapid
arrest of proliferation and differentiation to trophoblast giant cells (Carney et al., 1993).
Trophoblast stem cells have been shown to reside in the chorion layer (Tanaka et al.,
1998), and if these cells are cultured in the absence of growth factors they differentiate to
form trophoblast giant cells after passing through an intermediate stage where the cells
express ectoplacental cone markers (Carney et al., 1993). These data suggest that
9
trophoblast giant cells differentiate from an intermediate precursor population in the
ectoplacental cone.
1.2.3 Trophoblast Stem Cells
Early studies of explant cultures showed that if extraembryonic ectoderm cells
were cultured in close association with embryonic tissue, they continued to proliferate
and some did not initiate differentiation to form trophoblast giant cells (Rossant and
Tamura-Lis, 1981). In constrast, EPC cells in culture initiated giant cell differentiation
regardless of culture conditions. Examination of known markers of placental cell
subtypes in various explant cultures provided some clues as to cell lineage relationships
(Figure 2) (Carney et al., 1993). When EPC cells are dissected and placed into culture,
they express the spongiotrophoblast specific gene Tpbpa within 2 days, and then activate
expression of the trophoblast giant cell specific genes Pl1, Pl2 and Plf after 4 days
(Carney et al., 1993). Cultured extraembryonic ectoderm cells also turn on these gene,
though the sequence is delayed by about 2 days (Carney et al., 1993). These results
suggest that cells of the extraembryonic ectoderm are capable of forming EPC cells, and
that from EPC cells trophoblast giant cells can develop (Carney et al., 1993). These two
sets of results suggest that extraembryonic ectoderm cells may serve as a stem cell
population for the other trophoblast cell types (Rossant and Tamura-Lis, 1981). This
suggestion has been validated by the isolation of trophoblast stem cells from the
extraembryonic ectoderm of E6.5 to E8.5 conceptuses in the presence of fibroblast
growth factor 4 (FGF4) (Tanaka et al., 1998; Uy et al., 2002).
1.3 Placental Vascularization
The establishment of maternal blood flow to the implantation site is vital to the
successful growth and development of the fetus. The exchange of oxygen, nutrients and
waste occurs within the labyrinth layer of the placenta, where maternal blood and fetal
blood are brought into close proximity to facilitate the exchange.

10
Figure 2. Cell lineage relationships in the extraembryonic tissues of the mouse. Cell
lineage relationships of trophoblast cells in the mouse based on experimental evidence.
Direct cell lineage tracing has yet to be done in the mouse. E= embryonic day. (Adapted
from Cross, 2000).

11

12
1.3.1 Maternal Vascular System
Maternal blood vessels grow towards each implantation site by angiogenesis, ultimately
allowing blood to reach the developing placenta (Cross et al., 2002b). Maternal arteries
enter through the maternal decidua, branching into several smaller arteries with a
characteristic spiral shape (Adamson et al., 2002). These spiral arteries come together at
the trophoblast giant cell layer to form large central canals. A range from 1 to 4 central
canals has been observed in the mouse placenta. These central canals travel toward the
fetal side of the placenta, where blood enters into the small blood spaces within the
labyrinth. The maternal blood then drains into venous channels and exits the placenta
where it returns to maternal circulation through wide veins (Adamson et al., 2002). This
arrangement allows the most oxygenated blood to flow immediately to the fetal side of
the placenta, and then flow back toward the maternal side as exchange of nutrients for
waste occurs within the labyrinth.
Interestingly, maternal blood spaces within the labyrinth are not lined by
endothelial cells, but rather by trophoblast cells (Adamson et al., 2002; Hemberger et al.,
2003; Wooding, 1994). This type of placentation is referred to as ‘hemochorial’
(Wooding, 1994). Within the labyrinth, maternal blood spaces are surrounded by three
layers of trophoblast cells; a layer of small cuboidal cells directly in contact with the
maternal blood surrounded by two layers of syncytiotrophoblast cells (Adamson et al.,
2002).
The maternal spiral arteries entering the placenta are also associated with
trophoblast cells. These trophoblast cells invade into the maternal decidua by a
peri/endovascular route, and replace the vascular endothelial lining (Adamson et al.,
2002; Hemberger et al., 2003). This replacement is observed up to 300 µm away from
the main trophoblast giant cell layer (Hemberger et al., 2003), and these cells express the
trophoblast giant cell marker Plf (Adamson et al., 2002; Hemberger et al., 2003).
Interestingly, these cells do not express another marker of trophoblast giant cells, Pl1
(placental lactogen-I), suggesting that they may represent a specialized type of
trophoblast giant cell (Cross et al., 2002b; Hemberger et al., 2003).

13
1.3.2 Fetal Vascular System
Fetal blood enters the placenta through a single umbilical artery. Fetal blood
vessels grow into the labyrinth region through a process of concerted branching
morphogenesis of the trophoblast cells, consisting of syncytiotrophoblast, trophoblast
giant cells and mononuclear cells, and mesoderm, consisting of blood vessels and stromal
cells (Cross et al., 2002b). In the region where it contacts the placenta, the single
umbilical artery branches extensively, and the resulting arterioles grow up into the
labyrinth (Adamson et al., 2002). Once the fetal arterioles reach the spongiotrophoblast
layer, they become highly branched as they travel back toward the fetal side of the
placenta. Fetal blood drains through venules into a single umbilical vein (Adamson et al.,
2002). The arrangement of fetal arteries results in blood flow that runs countercurrent to
the maternal blood, allowing for efficient exchange between the two blood
compartments. In contrast to the maternal blood spaces, the fetal blood vessels are lined
by endothelial cells throughout development (Adamson et al., 2002).
Although the morphological development of the mouse placenta is beginning to be
understood, the molecular mechanisms underlying this development as well as the cell
lineage decisions that lead to the development of three different trophoblast cell types
remain unclear. The development of new methods for genetic analysis in mice, such as
the application of site-specific recombinases will allow for the study of these early
molecular mechanisms and cell fate decisions.
1.4 Site-Specific Recombinases
The development of site-specific recombinases has revolutionized genetic analysis
in mice. These recombinases recognize defined target sites and catalyze recombination
between the sites, resulting in genetic change. Several of these recombinase enzymes
have been shown to be active in mammalian systems.
14
1.4.1 Cre-loxP System
Cre recombinase is a 38 kDa protein from the P1 bacteriophage that catalyzes
recombination between two defined consensus 34 bp sites, called loxP (location of
crossover (x) in P1 bacteriophage) sites (Hoess et al., 1984; Hoess et al., 1982). The loxP
site consists of two inverted repeats of 13bp palindromic sequences, separated by an 8bp
spacer (Figure 3) (Hoess and Abremski, 1984). Cre recombinase is a member of the λ
integrase family of site specific recombinases. Members of the λ integrase superfamily
share a common mechanism of DNA recombination involving strand cleavage, exchange
and ligation (Branda and Dymecki, 2004; Sadowski, 1995). Two target sites are required
for recombination to occur. These target sites are bound by recombinase monomers
which promote the formation of a DNA synapse. Recombination then occurs within the
spacers (Amin et al., 1991). The product of the recombination reaction is dependent on
the orientation of the loxP sites (Figure 3). When the two loxP sites are oriented in a
head-to-tail manner on the same chromosome, the recombination reaction is essentially
irreversible due to the loss of a circular reaction product.
One attractive feature of this system is that Cre recombinase catalyzes this
recombination in any DNA in any cellular environment (Nagy, 2000; Sauer and
Henderson, 1988). This includes both actively dividing and post-mitotic cells, as well as
in most tissue types (Branda and Dymecki, 2004).
1.4.2 Other Site-Specific Recombinases
Another member of the λ integrase family, Flp, so named because of its’ ability to
“flip” DNA sequences in Sacchromyces cerevisiae, uses the same recombination
mechanism as Cre recombinase. Flp catalyzes recombination between FRT (Flp
recombinase recognition target) sites (McLeod et al., 1986), which share the same overall
organization as loxP sites. The mechanism of recombination is the same as for Cre
recombinase (Amin et al., 1991).

15
Figure 3. Mechanism of Cre recombination. (A) The sequence of a loxP site,
consisting of two inverted palindromic repeats (black) and an 8 bp spacer (red). The
black arrows indicate the two inverted palindromes. (B) Schematic representation of the
model for Cre recombination. Four Cre molecules form a tetramer resulting in synapsis.
DNA cleavage occurs at tyrosine residues, and nucleophilic attack of the released 5’ OH
groups results in Holliday junction formation. A second round of cleavage and strand
exchange gives rise to recombination products. (C) Schematic representation of
conditional gene activation. A stop sequence is flanked by two loxP sites in a head to tail
orientation. In the presence of Cre recombinase, excision occurs releasing a circular
product and allowing expression of the gene of interest. (Modified from Troche et al.
2002).

16

17
Another site-specific recombinase has recently been established for use in ES
cells (Belteki et al., 2003). The φC31 site-specific recombinase is derived from
Streptomyces and catalyzes recombination between two heterotypic recognition sites;
attB is 34 bp long while attP is 39 bp long (Groth et al., 2000). These two sites contain
imperfect inverted repeats and are thought to be bound by recombinase monomers (Groth
et al., 2000). Due to the heterotypic nature of the recognition sites, the product sites are
unable to catalyze further φC31-mediated recombination reactions (Belteki et al., 2003).
Of significant importance is the finding that expression of φC31 does not inhibit the
ability of ES cells to populate the germline when used to generate chimaeric mice
(Belteki et al., 2003).
1.4.3 Conditional Genome Alteration in the Mouse
One very attractive feature of most site-specific recombinases is that they are
active in both actively dividing and post-mitotic cell populations, and can catalyze
recombination in most tissue types (Branda and Dymecki, 2004). This has allowed for
the generation of a system for conditional genome alteration in the mouse, whereby a
site-specific recombinase can be expressed in a spatially- and/or temporally-controlled
manner to induce a genetic change only in the place or at the time desired. This can be
accomplished by placing the expression of Cre recombinase under the control of a
specific promoter, in order to express it only when and where the genome alteration is
desired. The list of tissue-specific Cre recombinase bearing mice is increasing at a rapid
pace, and already includes mice expressing Cre recombinase in most of the major organs
and tissue types including the central nervous system (Cinato et al., 2001; Dragatsis and
Zeitlin, 2000) primordial germ cells (Lomeli et al., 2000), male germ line (O'Gorman et
al., 1997), female germline (Lan et al., 2004); endothelial cells (Gustafsson et al., 2001;
Kisanuki et al., 2001) and heart (Agah et al., 1997; Sohal et al., 2001; Stanley et al.,
2002). As of yet, no trophoblast cell type specific Cre mice have been described.
Using the Cre-lox system, a conditionally activated or inactivated transgene is
possible. In order to conditionally activate or inactivate a gene, a construct is created in
which expression is under the control of a ubiquitous promoter. The construct itself
should contain two loxP sites flanking a DNA sequence, which can be a reporter gene,

18
such as a gene whose product can be assayed colorimetrically or a drug resistance
gene or an extensive stop sequence. Alternately, if the goal is to conditionally inactivate a
gene, this gene should be placed between the two loxP sites. If you wish to conditionally
activate a gene, this gene is placed after the second loxP site (Figure 3). In the presence
of Cre recombinase, the DNA between the two loxP sites is excised, resulting in
activation or inactivation of the gene in question. This binary transgenic approach has
been very useful in studying genes in which traditional knockout studies result in an
embryonic lethal phenotype, precluding study of the gene function at later developmental
stages. The growing number of tissue-specific Cre mice is leading to the ability to
conditionally activate or inactivate genes in most tissue types without consequence to
other tissues in the animal.
Several alternatives have also been developed to allow temporal control of Cre
expression. Expression of Cre has been placed under the control of tetracycline (tet)
dependent gene regulatory systems (Gossen and Bujard, 1992). This system involves the
expression of a transactivator gene that specifically binds tetracycline or its analog
doxycycline, and the tet operator (tetO) sequence, resulting in transcription. The tetO is
fused to the recombinase gene, such that the recombinase is only expressed upon
transactivation (St-Onge et al., 1996). This system has been modified such that there are
two versions: in the original version, the tetracycline transactivator cannot bind the tet
operator in the presence of tetracycline (‘tet-off’). In the revised system, the
transactivator can only bind the operator in the presence of tetracycline (‘tet-on’). The
main difficulty with this system is that the rate of tetracycline or doxycycline clearance,
which can take 24 hours to 1 week, greatly affects its utility (Hasan et al., 2001; Kistner
et al., 1996).
Another modification allowing temporal control of recombinase expression is the
fusion of a mutant ligand binding domain of the estrogen receptor to the C-terminus of
the site-specific recombinase (Brocard et al., 1997; Feil et al., 1996; Kellendonk et al.,
1996; Logie and Stewart, 1995; Metzger et al., 1995; Schwenk et al., 1998). The mutated
estrogen receptor is not activated by endogenous β-estradiol, but is activated by the
synthetic estrogen antagonist, 4-OH tamoxifen (Feil et al., 1996). Activation of the site

19
specific recombinase is dependent on administration of 4-OH tamoxifen, which results
in transport of the fusion protein to the nucleus. Using a ubiquitous promoter to drive
CreERTM expression, efficient recombination was observed within 15 hours of
administration of the activator, and peaked at 48 hours (Hayashi and McMahon, 2002).
This system has not widely been used to study recombination events in utero, as it has
been difficult to optimize the dosage required for recombination to occur and the required
doses are often too close to toxic ranges (Indra et al., 1999). This system cannot be used
to study recombination events in the preimplantation embryo in vivo, as administration of
4-OH tamoxifen at E3.5 blocks implantation because it interferes with the essential
estrogen surge around implantation (Bloxham et al., 1977).
1.4.4 Cre Reporter Mice
Several lines of transgenic mice have been generated that are useful in studying
the expression of Cre recombinase in promoter-Cre transgenic mice. These reporter mice
fall into two basic categories: the single reporter system and the double reporter system
(Table 1).
1.4.4.1 Single Reporter Systems
The most common design for Cre reporter constructs involves a single reporter,
whereby a histochemical or fluorescent reporter gene is only expressed following Cre
mediated recombination. The basic design involves a loxP flanked stop region, followed
by the reporter gene. In the presence of Cre recombinase, recombination brings the
reporter gene under control of a ubiquitous promoter, allowing its expression in any cell
type that has expressed Cre recombinase (Table 1).
The most commonly used single reporter line was developed by Phillipe Soriano,
and was created using the “gene trap – reverse orientation splice acceptor” or Gt Rosa
system (Zambrowicz et al., 1997). In this case, a cassette containing a loxP flanked stop
sequence followed by the E.coli β-galactosidase gene was engineered to insert into a
ubiquitously expressed gene by homologous recombination. In these mice, β
galactosidase is only expressed following Cre-mediated recombination (Soriano, 1999).

20
1.4.4.2 Double Reporter Systems
The double reporter system is particularly useful, as these mice will allow for the
identification of cells that have not expressed Cre recombinase, as well as those cells that
have expressed Cre recombinase. The basic system relies on having one reporter gene
followed by an extensive polyA sequence, flanked by loxP sites, such that in the absence
of Cre recombinase expression, only this first reporter gene is expressed. Following the
second loxP site, a second reporter gene is inserted such that it is only expressed
following Cre-mediated recombination. The first line of double reporter mice to be
created carry a Z/AP transgene, in reference to their two histochemical reporter systems:
prior to Cre excision, these mice express β-galactosidase (Z) ubiquitously (Lobe et al.,
1999). Following Cre excision, human placental alkaline phosphatase (AP) is expressed.
A second line, based on this same principle, was developed using β-galactosidase
(Z) and EGFP (EG) as the reporters, to give rise to Z/EG reporter mice (Novak et al.,
2000). These lines of reporter mice allow for the evaluation of expression patterns in
tissue specific Cre mice. Breeding of the Cre mice to a reporter line to generate double
transgenic offspring allows for the visualization of Cre expression patterns using the
reporter gene, often by fluorescent imaging or histochemical staining.
1.5 Cell Lineage Tracing in the Mouse
Although little direct cell lineage tracing has been done in the mouse placenta,
much has been done to study cell lineages in either the earliest developmental stages or in
the embryo. With advances in technology, many different methods have been used to
approach questions of cell lineage in the developing mouse embryo.
1.5.1 Inert Compounds, Enzymes, Dyes and Fluorescent Markers
The earliest work attempting to directly analyze cell lineage in the developing
mouse embryo involved the use of inert compounds, enzymes or dyes as markers. In this
approach, a cell was injected with the marker, which can then be followed either visually
in live or cultured tissues, or by histochemical staining of fixed tissues. The earliest
attempts at direct lineage tracing used inert silicone fluid to study the first divisions in the
preimplantation mouse embryo (for example: (Graham and Deussen, 1978; Wilson et al.,
1972)). A drop of the oil would be injected deep into the cytoplasm of a single cell and
21
Table 1. Cre-Responsive Indicator Mice Transgenic or Promoter/ Indicator Knock In Enhancer Reporter Reference
cAct-XStopXlacZ Transgenic chicken β-actin nuclear β-gal (Tsien et al., 1996) floxLacZ Transgenic chicken β-actin β-gal (Akagi et al., 1997) Cβ-STOP-lacZ Transgenic chicken β-actin nuclear β-gal (Zinyk et al., 1998) R26R Knock In ROSA26 β-gal (Soriano, 1999) ROSA26flox Knock In proviral β-gal (Mao et al., 2001)
ROSA26 Z/AP Transgenic CAG β-gal (Lobe et al., 1999)
hPLAP Z/EG Transgenic CAG β-gal (Novak et al., 2000)
eGFP CAG-CAT-EGFP Transgenic CAG eGFP (Kawamoto et al.,
2000) R26R-EYFP Knock In ROSA26 eYFP (Srinivas et al., 2001) R26R-ECFP Knock In ROSA26 eCFP (Srinivas et al., 2001) ROSA26-EGFPf Knock In ROSA26 eGFP (Mao et al., 2001) LSLMAP2GFP Transgenic chicken β-actin MAP2-GFP (Huang et al., 2002) Table adapted from (Branda and Dymecki, 2004) CAG, chicken β-actin promoter linked to cytomegalovirus enhancer; β-gal, beta galactosidase; hPLAP, human placental alkaline phosphatase; EGFP, enhanced green fluorescent protein; EYFP, enhanced yellow fluorescent protein; ECFP, enhanced cyan fluorescent protein.
22
then could be visualized as the cells of the embryo divided in culture (Graham and
Deussen, 1978). There were several limitations to this method. First, the oil drop would
not be partitioned between progeny cells such that it would only mark one daughter cell
following cell division, making it difficult to follow the lineage of a particular
blastomere. Additionally, this technique could only be used to study the earliest cell
divisions of the developing embryo, as culture techniques do not allow the in vitro
maintenance of embryos past the blastocyst stage without losing normal cellular
behaviour and positioning. A similar method was also employed using melanin granules
(Copp, 1979), but this method had all the same caveats.
To overcome some of the limitations of the previous method, the injection of
enzymes, dyes or fluorescent markers was used to examine questions of cell lineage.
These methods were superior to the injection of inert compounds for several reasons;
there was a reduction in the incidence of the marker segregating to a single daughter cell,
the marker had a longer effective lifetime and the marked cells were easily detected either
visually, fluorescently or histochemically (Cruz and Pedersen, 1985). Horseradish
peroxidase (HRP) was commonly used as a histochemical marker. Once injected into a
cell, it would partition to daughter cells, which could be identified using histochemical
staining of fixed materials. The cells were injected during early development but it was
found that HRP could not be detected in full term animals due to the dilution of the HRP
over many cell divisions (Cruz and Pedersen, 1985). One difficulty involved in the
injection of HRP was that it was not possible to immediately identify whether only one
cell had been injected or if neighbouring cells had also received HRP. This led to the co
injection of readily visible markers such as rhodamine-conjugated dextran (RDX) or Fast
Green, which are easily visible using fluorescent microscopy (Cruz and Pedersen, 1985).
These markers could also be visualized over approximately 24 hours. However, Fast
Green tended to diffuse independent of HRP due to its lower molecular weight, while
RDX fluorescence would fade or become particulate within the first 24 hours (Cruz and
Pedersen, 1985). Despite the improvements over the injection of inert compounds, these
methods still only allowed short term examination of cell lineages and could only be
performed in vitro.

23
A similar approach was attempted using carboxylated yellow green fluorescent
latex microparticles to label cells (Fleming, 1987). The fluorescent latex microparticles
are taken up by endocytosis and are useful for studying cell lineage up to three cell
divisions after labelling. This lineage marker was found to be autonomous to the labelled
cells and their daughter cells, and was not transferred to adjacent unlabelled cells, even
when these cells were joined by a midbody connection, due to the collection of the
microparticles in lysosomal compartments that were too large to pass through the
cytoplasmic bridges (Fleming, 1987). Again, the main disadvantage of this marker is that
cells can only be followed for the short term, and these manipulations can only be studied
in vitro.
Another set of lineage markers that has been used to examine embryos in culture
are the carbocyanine dyes, DiI (1, 1’-dioctadecyl-3, 3, 3’, 3’-tetramethyl
indocarbocyanine perchlorate) and DiO (3, 3 ′-dioctadecyloxacarbo-cyanine). These
lipophilic dyes may be topically applied to single cells or groups of cells by manual
application, followed by embryo culture in vitro. Labelled cells can still be visualized
within the developing embryo after 48 hours of development in vitro, however
persistence of labelled cells after this point is difficult to assess, because of the limited
time span of normal development in vitro (Wilson and Beddington, 1996).
The main drawback in all of these methods of marking cell lineage was that their
analysis was limited to in vitro analysis of very early developmental stages. In order to
look at later stages of development, methods for introducing a more permanent lineage
marker were required.
1.5.2 Passive Endogenous Genetic Markers
As techniques developed for the manipulation of early mouse embryos, it became
possible to introduce passive markers into the genome, allowing for the study of cell
lineage using more permanent markers. Genetic markers have many advantages over
other labelling methods, because they are permanent, heritable and, if chosen wisely, are
not likely to damage a cell or change its developmental potential (Price, 1987). Several
different methods were developed to examine more permanent genetic markers. Among

24
these methods, the introduction of genetic material by retroviral infection has proven
useful in the study of cell lineage.
Retroviral vectors have been designed to introduce foreign DNA into cells, in
order to genetically mark these cells. The main advantage of this system is that it is
naturally evolved, and as a result it is both highly efficient and highly accurate (Price,
1987). During retroviral infection, an exact copy of the retroviral genome is inserted into
the host cell chromosome. The information for integration and expression is all
contained within sequences flanking the retroviral genome (long terminal repeats
(LTRs)). Based on this organization, any genetic sequence could theoretically be placed
between LTRs and the virus would maintain the ability to infect a cell, integrate the DNA
and transcribe the gene (Price, 1987). This naturally evolved system for transferring
genes needed only minor modifications to generate a very effective approach for gene
introduction. The most important modification was to render the viral genome
replication-deficient, such that the DNA would be introduced into cells without
subsequent replication and further infection of cells (Price, 1987). Once a retrovirus has
infected a cell, the DNA it carries is stably integrated into the host chromosome, such that
all progeny of the cell will carry the genetic change. Also, each retrovirus integrates
randomly within the cell it has infected, marking each cell with a unique genetic identity.
Several applications of retroviral gene transfer have been applied in studying cell
lineage in the mouse. Retroviruses were used to introduce a lineage marker into
haematopoietic stem cells in vitro, which were then transferred into lethally irradiated
mice, allowing the lineage of these stem cells to be tracked in vivo over several months
(Lemischka et al., 1986). One major limitation of this approach is that even though a
stem cell may only populate one compartment, it does not prove that its fate was
determined or that it could not populate other compartments. In addition, the mice
examined in experiments such as this are not normal animals, as they are recovering from
radiation and bone marrow transplantation. A similar approach involves the injection of
retroviral vectors into the living animal at low levels to cause localized infection, and
then later examining cells that express the lineage marker (Price et al., 1987). This
method also has several limitations. It is not easy to demonstrate that a clone of marked

25
cells originated from one precursor cell, although each cell would have a unique
integration site, this would have to be examined using Southern blotting or by cloning of
the integration site (Price et al., 1987). To study early cell lineage decisions, ES cells
have been infected with retroviral vectors, and used to generate chimaeric mice by
aggregating the ES cells with wild type embryos. Alternately, early preimplantation
embryos can be infected in vitro and then introduced into pseudopregnant females,
allowing for the tracking of marked cells. This approach is similar to other methods for
generating chimaeric mice but less invasive as no aggregation or injection is required
(Price, 1987). A general limitation of the use of retroviral vectors is that infection with
the retroviral vector may result in viremia leading to non-cell autonomy and possible
growth or differentiation effect (Lo et al., 1987; Soriano and Jaenisch, 1986).
1.5.3 Active Endogenous Genetic Markers
The transplantation of genetically disparate cells in early development has been
used to study cell fate in several vertebrates. Perhaps best known are experiments in
which quail tissues were transplanted into developing chick embryos to determine
developmental potential (Hornbruch et al., 1979; Tickle et al., 1978). This approach has
been modified for use in the early mouse embryo, using heterotypic transplantation of
cells, which has revealed that in the epiblast, cells have a high level of plasticity and can
acquire a novel cell fate after transplantation (Beddington, 1982; Parameswaran and Tam,
1995). In addition, fate mapping of the gastrulating mouse embryo has shown
regionalization of the epiblast, with specific regions representing precursor populations
for the major tissue types (Lawson et al., 1991; Lawson and Pedersen, 1992;
Parameswaran and Tam, 1995). These features of development have allowed for the
study of cell lineage in the epiblast using orthotopic transplantation of cells expressing a
visible marker such as lacZ into non-expressing embryos to follow the fate of the
transplanted cells (Parameswaran and Tam, 1995; Tam and Zhou, 1996). Following
transplantation, embryos are allowed to develop in culture and cell fates of the
transplanted epiblast can be analyzed using histochemical methods. This approach is
limited by the developmental window during which embryos can be maintained in
culture.
26
One of the most versatile systems currently being used for cell lineage tracing
in the mouse involves the controlled activation of a permanent cell marker. Using the
site-specific recombinases and reporter strains described in the previous section, a
permanent genetic change which is heritable by all of its daughter cells can be introduced
into a cell. The expression of the recombinase can be controlled in a spatial and temporal
manner, either by changing the promoter and enhancer elements driving its expression, or
by using one of the many inducible systems available. Since the reporter strains available
express either a fluorescent or a histochemical marker in the presence of the recombinase,
activation of the recombinase in a specific cell type can mark that cell and all of its
progeny, and this marker can be examined at any stage of development.
This approach has many advantages for cell lineage tracing. Cells can be marked
very early in development without a requirement for physical manipulation of the
embryo. The genetic change introduced by the recombinase is irreversible and heritable
and as a result can be examined at any stage following the recombination. Detection of
the reporter gene in tissues can be done histochemically or immunohistochemically,
allowing for the study of serial histological sections using markers for other cell types, to
identify the contribution of marked cells to various populations.
1.6 Promoters Useful in the Creation of Trophoblast Cell-Type-Specific Cre Mice
1.6.1 Genes Expressed Throughout the Trophoblast Lineage
1.6.1.1 Keratin-18 (K18)
Keratin proteins form intermediate filaments in epithelial cells. This large protein
family is subdivided into the acidic type I keratins and the basic type II keratins.
Intermediate filaments are formed by the polymerization of keratin heterodimers, which
always contain one type I keratin and one type II keratin, and different keratin pairs are
characteristic of specific tissue types (Thorey et al., 1993). Keratin 18 (K18), a type I
intermediate filament protein, and its dimerization partner Keratin 8 (K8) are the first
keratins to be expressed during mouse development, beginning at the 8 cell stage
(Oshima et al., 1983). In the developing placenta, K18 is expressed in all trophoblast cells
derived from the TE, from the differentiation of the TE until term. K18 knockout mice
are phenotypically normal because K19 appears to completely replace K18 in its absence

27
in vivo, resulting in normal cytoskeletal architecture (Magin et al., 1998). This
replacement theory was supported by the appearance of a midgestational lethality
phenotype in K18/K19 double knockout mice generated by interbreeding the single
knockouts for these two type I keratins (Hesse et al., 2000).
In transgenic studies, the human K18 coding region, including 2.5 kb of 5’
flanking sequence and 3.5 kb of 3’ flanking sequence has been used to direct expression
of K18, β-galactosidase, EGFP, Alkaline Phosphatase (AP) and Cre recombinase in
epithelial tissues expressing the mouse K18 gene (Abe and Oshima, 1990; Thorey et al.,
1993; Wen et al., 2003). In the initial study, a 10kb region of human K18 was found to
direct expression of the human form of K18 in essentially the same spatial and temporal
manner as the mouse K18 gene, with a few exceptions that had been previously described
as being different between mouse and human expression patterns (Abe and Oshima,
1990). Subsequently, the E. coli β-galactosidase was inserted into the same 10kb
sequence by homologous recombination, resulting in the removal of exons 2-7 of the K18
gene (Thorey et al., 1993). The deleted fragment of the human K18 gene was included in
the construct downstream of the polyadenylation site, in an attempt to include the known
cis acting factors. The addition of the β-galactosidase coding sequence into the K18
construct resulted in the loss of expression in all adult tissues (Thorey et al., 1993).
Unexpected expression also occurred in various mesenchymal tissues not known to
express K18. No β-galactosidase expression was detected in adult mouse tissues.
Examination of various epigenetic changes to the human K18-β-galactosidase constructs
identified a change in chromatinization, likely resulting in the silencing of these
constructs in vivo (Thorey et al., 1993). The generation of constructs driving EGFP, AP
and Cre expression differed slightly from the previous approaches, in that an internal
ribosome entry site (IRES) was introduced downstream of the polyadenylation site in
exon 7 of the human K18 gene, and the reporter gene coding sequence was added
downstream of this IRES (Wen et al., 2003). The expression of EGFP was only verified
by Northern and Western blot analysis, and was observed in the tissue types expressing
mouse K18. The expression of AP was revealed in sections of embryonic mice and adult

28
mice by histochemical methods, and was found to be very similar to the expression of
the human K18 transgene (Wen et al., 2003).
In order to express Cre recombinase in epithelial tissues, a Cre recombinase
mutant estrogen receptor fusion protein (CreERT2) was used, rendering the activity of Cre
recombinase dependent on the estrogen receptor antagonist tamoxifen. The
K18iresCreERT2 mice were examined by mating to the R26R Cre reporter line (described
previously). Double transgenic animals were treated with 4-OH tamoxifen or vehicle,
and Cre activity was shown to be completely dependent on 4-OH tamoxifen
administration. Cre activity in the tissues was found to be mosaic, even in tissues with
uniform K18 expression and in both embryonic and adult tissues (Wen et al., 2003).
Given that the 4-OH tamoxifen-dependent Cre activity is not uniform, these particular
strains of mice will only be useful for applications where not every cell type of a
particular epithelium needs to be marked.
1.6.1.2 Adenosine Deaminase (ADA)
Adenosine deaminase (ADA) is a purine metabolic enzyme that catalyzes the
irreversible amination of adenine or deoxyadenine to form inosine or deoxyinosine. As
such, it is an important regulator of steady state adenosine and deoxyadenosine, both of
which have toxic effects when in excess (Simmonds et al., 1978). The sequence of ADA
is highly conserved from bacteria to humans (Shi et al., 1997). In humans, severe
deficiency for ADA is associated with a form of severe combined immunodeficiency
(SCID) (Buckley, 2004).
ADA activity has been detected in all mammalian tissue types, but levels of
expression vary over a range of 1000 fold (Shi et al., 1997). In mice, the levels of ADA
expression can vary over as much as 10,000 fold, with the highest levels of expression
being observed in decidua, placenta, tongue, esophagus, stomach and proximal small
intestine(Shi et al., 1997). The expression of ADA within the placenta is subject to
developmental regulation, and high levels of expression must be maintained in the
placenta in order for normal development of the embryo to occur. ADA-deficient mice
die perinatally of severe liver damage, as a result of the severe disturbances in purine
metabolism (Wakamiya et al., 1995). Expression of ADA within the rodent placenta is

29
first detected at E7.5 in the trophoblast giant cells and in diploid precursor cells within
the ectoplacental cone (Shi et al., 1997). As the placenta develops, expression of ADA
increases. At E13.5, ADA expression is observed in all cells of the trophoblast lineage
and this expression persists until term (Shi et al., 1997).
Analysis of the ADA promoter region demonstrated that the basal promoter, plus
6.4 kb of 5’ flanking sequence could direct chloramphenicol acetyltransferase (CAT)
activity in transgenic mice generated by microinjection (Winston et al., 1992). A deletion
series of this initial construct identified a 770 bp fragment located 5.4 kb upstream of the
transcriptional start site that is able to direct high levels of CAT activity in transgenic
mice (Shi et al., 1997).
1.6.2 Syncytiotrophoblast-Specific Promoters
1.6.2.1 Tissue Non-Specific Alkaline Phosphatase (TNAP)
Alkaline phosphatases (APs) are membrane-anchored enzymes found in most
organisms, with the exception of some higher plants (Hoshi et al., 1997). Most
organisms, including humans and rodents, express several different alkaline phosphatase
genes. The APs catalyze the hydrolysis of monophosphate esters, resulting in the release
of inorganic phosphate (Le Du and Millan, 2002), but the physiological role of these
enzymes is not well understood.
In the mouse, at least four different alkaline phosphatase (AP) genes have been
identified. Three of these alkaline phosphatase genes exhibit tissue specific expression
patterns; intestinal alkaline phosphatase (IAP), placental alkaline phosphatase (PLAP)
and germ cell alkaline phosphatase (GCAP). Tissue non-specific alkaline phosphatase is
expressed in several different tissues during development, including the skeletal system,
the gonad, the intestine, and the labyrinth layer of the placenta (MacGregor et al., 1995).
Within the labyrinth, TNAP is expressed specifically in the syncytiotrophoblast cells
(Smith, 1973). TNAP deficient mice survive to birth, with no obvious effect on
embryonic development, including primordial germ cell migration (MacGregor et al.,
1995). However, the homozygous null animals developed seizures and died perinatally at
about 2 weeks of age. The lethality was subsequently found to be due to defects in the
metabolism of vitamin B6 (Waymire et al., 1995).

30
Attempts to generate transgenic mice with a β-galactosidase gene under the
control of various sequences found upstream of the TNAP locus have been mostly
unsuccessful. The lack of expression from the transgenic constructs was attributed to
gene silencing effects due to increased methylation of both the 5’ sequences and the β
galactosidase sequence (Escalante-Alcalde et al., 1996). The generation of TNAP-Cre
mice was achieved using a knock-in approach, whereby Cre recombinase was inserted
into the TNAP locus by homologous recombination in ES cells, and subsequently
germline chimaeras were generated (Lomeli et al., 2000). The expression of Cre in these
mice was assessed by crossing with the Z/AP reporter mice. Double transgenic embryos
showed specific Cre expression in the primordial germ cells (PGC) at E9.5 and E10.5.
This expression was also observed at E13, along with expression in the labyrinth layer of
the placenta, intestine and ventral neural tube. However, the expression in tissues other
than the PGCs was observed at a much lower level than in the PGCs. Therefore, the
frequency of PGC-only excision is high enough to consider these mice useful for the
study of PGC, as opposed to the other tissues that normally express TNAP (Lomeli et al.,
2000).
1.6.2.2 Aromatase (CYP19)
Aromatase is an important enzyme in the biosynthesis of estrogens from
androgens. The aromatase cytochrome P450 enzyme is coupled to NADPH-cytochrome
P450 reductase, a ubiquitous flavoprotein, in order to catalyze the conversion of C19
steroids (androstenedione, testosterone) to C18 estrogens (estrone, estradiol). In humans,
aromatase deficiency is often only detected in pregnancy, based on the virilization of
genetically female embryos due to increased levels of testosterones and decreased levels
of estrogens in the fetal environment.
Aromatase is encoded by the CYP19 gene, which is highly conserved in all
vertebrates. In most species, including mice and other rodents, expression of aromatase
is restricted to the gonads and brain (Conley and Hinshelwood, 2001). In humans,
aromatase is also expressed in the syncytiotrophoblast cells of the labyrinth in the
placenta, as well as adipose stromal cells, osteoblasts, fibroblasts, some vascular
components and the fetal liver (Kamat et al., 1999). The expression of aromatase in these

31
diverse tissues is controlled by several tissue-specific promoters and a specific exon 1
(Harada et al., 2003). In humans, placental expression is initiated at a unique exon, exon
I.1, located 40 bp upstream of the rest of the CYP19 gene. The translational start site is
located in exon 2, such that an identical protein is produced in all tissues despite the use
of different first exons.
The placental specific exon I.1 has been studied extensively, and a region
spanning -501bp to +103 bp was shown to mediate syncytiotrophoblast specific
expression in transgenic mice, using a human growth hormone (hGH) fusion protein
(Kamat et al., 1999). These results suggest that rodents have the trans acting factors that
are necessary for placenta-specific expression of the aromatase gene. However, another
group generated transgenic mice carrying a 12.7 kb construct consisting of four of the
upstream exons (I.1, I.4, I.3 and PII) driving expression of a β-galactosidase reporter
gene (Harada et al., 2003). In this case, although reporter gene expression was detected
in the mouse placenta, its expression was not initiated at exon I.1, but rather at either
exon I.4 or I.3. The difference between the two studies lies in the construct of the
reporters. Of principle importance, the construct used in first study contained only 500
bp of sequence upstream of exon I.1 (Kamat et al., 1999) while the construct generated
for the second study included 2400 bp of promoter region upstream of exon I.1 (Harada
et al., 2003). Harada et al. (2003) suggest that silencer elements may reside outside of
the 500 bp minimal region used in the previous study, that result in silencing of the
expression from exon I.1 in mice carrying larger genomic regions. An alternate
possibility is that mice may lack transcriptional elements that are required for the tissue-
specific expression of aromatase in the placenta, while still having factors that loosely
enhance the transcription of aromatase from all of the exons I in the mouse (Harada et al.,
2003).
1.6.3 Spongiotrophoblast/Glycogen Trophoblast Specific Promoters
1.6.3.1 Trophoblast-specific protein alpha (Tpbpa)
Trophoblast-specific protein alpha (Tpbpa) was identified in a differential screen
seeking to identify genes that are expressed specifically in the trophoblast lineage
(Lescisin et al., 1988). The identified cDNA (cDNA 4311) was found to encode a protein

32
that lacks a transmembrane domain and contains a putative signal peptide at the amino
terminal end of the protein, suggesting it is a secreted protein (Iwatsuki et al., 2000;
Lescisin et al., 1988). Very little is known about the function of this protein. However, it
is predicted to be an inhibitor of the C1A family of cysteine peptidases, which includes
many of the cathepsin proteins (Deussing et al., 2002). The assignment of this putative
function is based on the amino acid sequence similarity of Tpbpa to the proregion of the
cysteine peptidases, as well as the mapping of the murine genes for Tpbpa and Tpbpb to a
dense cluster of placenta-specific cysteine peptidase genes (Deussing et al., 2002).
Additionally, the cytotoxic T-lymphocyte antigen (CTLA)-2a and -2b genes map to the
same cluster (Deussing et al., 2002) and are also classified as cysteine peptidase
inhibitors (Cheon et al., 2004; Delaria et al., 1994; Iwatsuki et al., 2000). The CTLA-2s
have been shown to inhibit cathepsin L-like cysteine peptidases in vitro (Delaria et al.,
1994). As the CTLA-2s share similarity in sequence to the Tpbp genes (Deussing et al.,
2002), it is possible they also share similar functions. As of yet, no human orthologs of
the Tpbp genes, the CTLA-2 genes, or the murine placenta-specific cysteine peptidase
genes have been identified (Deussing et al., 2002).
The expression of murine Tpbpa is restricted to the placenta, as no expression has
been observed other tissues of the developing embryo or adult animal. Tpbpa mRNA can
be detected beginning at E6.5 and by E7.5 is expressed in a small subset of cells in the
EPC. At E8.5 until E10.5, a subset of cells at the mesometrial end of the EPC express
Tpbpa, as well as isolated cells within the decidua. From E13.5 until term, Tpbpa
expression is seen within the spongiotrophoblast region of the placenta, with no
expression observed in TGCs or within the labyrinth layer (Calzonetti et al., 1995;
Carney et al., 1993; Lescisin et al., 1988).
Transgenic mice have been developed using various lengths of 5’ flanking
sequence in an attempt to direct spongiotrophoblast specific transgene expression. When
5.4 kb of 5’ flanking sequence and the first intron of the Tpbpa gene are placed upstream
of a β-galactosidase gene, appropriate spongiotrophoblast specific expression was
observed in the developing placenta (Calzonetti et al., 1995). Further promoter deletions
identified a 340 bp region in the 5’ flanking sequence that is sufficient, with the

33
endogenous minimal promoter, to direct lacZ expression to the spongiotrophoblast
region of the placenta (Calzonetti et al., 1995).
1.6.4 Trophoblast Giant Cell Specific Promoters
1.6.4.1 Renin 1 (Ren-1)
Renin is an aspartyl protease that is best known for its role in maintaining blood
pressure and electrolyte homeostasis, as part of the renin-angiotensin system (Sigmund
and Gross, 1991). Active renin is produced and stored in the juxtaglomerular (JG) cells
of the adult kidney, where it is then secreted into the bloodstream. All inbred strains of
mice have at least one locus encoding renin (Ren-1) on chromosome 1, while some
strains also harbour a relatively recent duplication of this locus, encoding a second renin
gene, Ren-2 (Fabian et al., 1989). Two different alleles of Ren-1 have been identified in
different strains carrying a single locus encoding renin; Ren-1c and Ren-1d . All three
genes are highly similar in both nucleotide sequence and genomic organization (Fabian et
al., 1989). The Ren-1d locus has been knocked out in 129 mice, carrying both Ren-1d and
Ren-2 encoding genes (Clark et al., 1997). The Ren-1d -/- mice showed abnormal kidney
morphology and a complete absence of granulation in the JG cells, as well as sexually
dimorphic hypotension with female mice having significantly decreased mean arterial
pressure. Ren-2 has also been knocked out. These mice were healthy and viable, with no
changes to mean arterial pressure in adult mice (Sharp et al., 1996). The only observable
change was a decrease in the concentration of circulating inactive prorenin, and an
increase in the concentration of circulating active renin. Thus, Ren-2 is not required for
maintaining homeostasis. As it had been previously found that Ren-2 is likely to have
different glycosylation potential, due to the loss of several asparagine-linked
glycosylation sites (Sigmund and Gross, 1991), the Ren-2 protein may not be active in the
mouse.
The expression of renin in the developing and adult mouse has been studied in
great detail. In mice, renin expression is first detected at about E14, in the forming renal
arteries, and becomes progressively restricted to more distal areas of the arteries as the
kidney develops (Sigmund and Gross, 1991). As the vascular smooth muscle cells
differentiate, they stop producing renin until only the specialized smooth muscle cells of

34
the JG express renin in the most distal regions of the intrarenal arteries (Jones et al.,
1990). These vascular smooth muscle cells of the intrarenal arteries appear to retain the
ability to express renin, and can be recruited to a renin-expressing phenotype in response
to physiological cues or the administration of angiotensin-converting enzyme inhibitors
(Petrovic et al., 1996).
Extrarenal sites of renin expression have also been observed in the mouse. Renin
expression has been observed in the adrenal gland during early development; this
expression is strong at E14, but becomes progressively weaker until it is no longer
apparent by E17 (Fabian et al., 1989; Jones et al., 2000). Renin expression can also be
detected in the gonadal arteries; this expression continues at least into the early neonatal
period (Jones et al., 2000). In the adult, renin expression is detectable in the
submandibular gland in a sexually dimorphic manner; male mice express renin at this
site, while female mice do not (Jones et al., 2000).
The components of the renin-angiotensin system have been observed in the
pregnant human uterus. However, the localization of the site of renin production has long
been disputed (Hanssens et al., 1995; Ihara et al., 1987; Poisner et al., 1981; Shaw et al.,
1989). In the mouse, renin expression has been localized to the trophoblast giant cells,
beginning at about E13 and continuing until parturition (Jones et al., 2000).
Extensive studies have been undertaken to examine the regulation of the renin
genes. Many of these studies involve the introduction of renin 5’ flanking sequence
linked to a variety of reporters into either cell culture systems or transgenic mice. These
studies have shown that the addition of either 0.45 kb or 2.5 kb of 5’ flanking sequence
linked to the SV40 large T antigen (TAg) exhibited inappropriate expression patterns in
transgenic mice. However, if 4.6 kb of upstream sequence was included, correct tissue-
and cell-specific expression could be achieved (Sola et al., 1989). Further examination of
this upstream region reduced the required 5’ flanking sequence to 4.1 kb (Petrovic et al.,
1996). A 241 bp fragment from -2625 to -2866 was also identified that, in conjunction
with the basal renin promoter, retained full activity in cell culture in an orientation
independent manner. This response is typical of a classical enhancer element. The 4.1
kb 5’ flanking sequence was further tested in vivo by linking this to GFP (Jones et al.,
35
2000). When introduced into mice, this construct directed high levels of GFP
expression in the same tissue- and cell-specific manner of renin expression beginning at
E13 and continuing into adulthood. Additionally, treatment of these transgenic mice with
an angiotensin-converting enzyme inhibitor induced recruitment of vascular smooth
muscle cells to a renin expressing phenotype (Jones et al., 2000). Thus, 4.1 kb of 5’
flanking sequence of the Ren-1 locus is sufficient to drive strong, tissue- and cell-specific
expression in transgenic mice.
1.6.4.2 Placental Lactogen 1(PL1) and Placental Lactogen 2 (PL2)
Placental lactogen (Pl) 1 and Pl2 are members of the prolactin/growth hormone
family (Colosi et al., 1987; Jackson et al., 1986). These molecules both bind the prolactin
receptor with high affinity and are involved in the maintenance of ovarian progesterone
production and the development of the maternal mammary glands for postpartum
lactation (Ogren and Talamantes, 1988). Both Pl1 and Pl2 are expressed exclusively
from trophoblast giant cells in the mouse placenta (Faria et al., 1991). Expression of Pl1
begins at about E9, while at E10 both Pl1 and Pl2 are expressed and by E11 and
afterward, Pl2 is expressed exclusively. This pattern of expression coincides with a
midgestation shift in placental hormone expression that includes changes from expression
of Pl1, proliferin and the proliferin-like proteins (PLP) A and E to Pl2 and proliferin
related protein (PRP) (Carney et al., 1993; Faria et al., 1991). These changes in gene
expression represent a molecular basis for identifying distinct stages of trophoblast giant
cell differentiation (Shida et al., 1992).
The regulation of the Pl1gene has been studied in the rat choriocarcinoma cell
line Rcho-1 (Shida et al., 1993). This study identified a 274 bp sequence extending
upstream from the transcriptional start site that was sufficient to direct maximal
expression in this trophoblast culture model. This sequence and another larger upstream
sequence (2700 bp) were unable to direct expression in a variety of other cell types in
culture (Shida et al., 1993). The expression of these upstream sequences has yet to be
investigated in transgenic mice. Initial attempts by our lab to create mice expressing Cre
recombinase under the control of the Pl1 promoter have been unsuccessful, even using 10
kb of 5’ upstream sequence (H. Yamamoto and J.C. Cross, unpublished results).

36
The regulation of the Pl2 gene has also been studied (Shida et al., 1992). A 2.7
kb region of upstream sequence was linked to the SV40 T antigens and used to generate
transgenic mice by microinjection. Three transgenic lines were generated, and placenta
specific expression was observed in all of these lines. The pattern of T antigen
expression was identical to that of the endogenous Pl2 in the transgenic mice. A deletion
construct containing only 569 bp of upstream sequence was unable to direct placenta
specific expression. These results suggest that the 2.7 kb upstream sequence could be
useful for directing Cre recombinase expression to the trophoblast giant cells of the
mouse placenta.
1.7 Conclusion
The use of the Cre-loxP system and reporter mice allows for the introduction of
permanent, heritable genetic changes that can be followed throughout development. This
enables the study of cell lineage questions in vivo in tissues that were not previously
studied with traditional techniques. We have generated mice in which Cre recombinase
expression is under the control of the Tpbpa promoter, and is therefore expressed in the
EPC and spongiotrophoblast region of the placenta. By crossing these mice to the Z/AP
reporter line (Lobe et al., 1999), we were able to examine the fate of Tpbpa-expressing
cells in vivo. The development of other trophoblast-specific Cre mice will allow for the
examination of other cell lineage relationships in the developing placenta.

37
CHAPTER TWO:
PLACENTAL CELL LINEAGE TRACING USING
CRE RECOMBINASE TRANSGENIC MICE
The studies in this chapter were performed by the author except that plasmid generation
(not including the pGEM-Cre plasmid), the RNase protection assays and the EGFP
fluorescence image shown in Figure 4 were performed by Dr. Hideyuki Yamamoto.

38
2.1 Introduction
The cell lineage relationships in the placenta have thus far largely been assumed
based on indirect evidence. The methods used for cell lineage tracing were not generally
amenable to the study of development in utero. However, the use of site specific
recombinases both in vitro and in vivo has allowed for the development of cell lineage
tracing methods in tissues that were previously unavailable for direct studies, including
the placenta. Cell-type specific expression of Cre recombinase can be used to make a
permanent, heritable and readily detectable genetic change in specific cell populations,
simply by crossing Cre transgenic mice to one of the many available Cre reporter lines.
The most important feature of this system is the Cre expression in a cell will result in the
expression of the reporter in all cells descendent from the recombined cell. This feature
is based on the use of ubiquitous promoters to drive the reporter expression, such that
even in the absence of Cre, cells that have arisen from a cell that has undergone
recombination will express the reporter.
The trophoblast lineage is the main component of the placenta and is derived from
the first cell lineage to be specified during development. In the mouse, the trophectoderm
is specified at E3.5, when the blastocyst is formed. The trophectoderm surrounds the
blastocyst and the inner cell mass (ICM), and already has two different fates at this stage.
At implantation, the cells that are not in direct contact with the ICM cease proliferating
and terminally differentiate to form primary trophoblast giant cells (Cross, 2000). This
initial connection between the trophoblast and the maternal decidua is essential for the
early nutrition of the embryo and failure to establish this connection can lead to
nutritional insufficiency and peri-implantation death (Copp, 1995). The polar
trophectoderm cells that overlie the ICM continue to proliferate and will give rise to the
trophoblast cell types of the placenta (Cross, 2000). The cell lineage relationship
between the trophoblast cells beyond this point are much less clear, and have mostly been
inferred from indirect evidence. The polar trophectoderm gives rise to two distinct cell
populations, the extraembryonic ectoderm and the ectoplacental cone.

39
Cells of the extraembryonic ectoderm give rise to the chorion, and then to the
syncytiotrophoblast cells, which form the bulk of the labyrinth layer of the placenta.
Evidence for this lineage is indirect and primarily based on the restricted expression of
certain genes within these cell types (Cross, 2000). Cells of the EPC give rise to the
secondary trophoblast giant cells and the spongiotrophoblast and glycogen trophoblast
cells. The evidence for this lineage is based on both gene expression patterns and explant
cultures of the EPC. Expression of the spongiotrophoblast/glycogen trophoblast specific
marker, Tpbpa begins in the EPC at E7.5 in a small subset of cells and expression
increases as placental development proceeds (Lescisin et al., 1988). At E10.5, when a
mature placenta has been formed, Tpbpa expression is restricted to the middle
spongiotrophoblast layer and later to the glycogen trophoblast cells (Calzonetti et al.,
1995; Lescisin et al., 1988). The secondary trophoblast giant cells arise from the
differentiation of cells at the tip of the EPC, at the furthest distance from the embryo, and
later from the spongiotrophoblast. Additional evidence supporting the formation of these
cell types from the EPC arises from the explant culture of EPC cells (Carney et al., 1993).
When these cells are dissected and placed in culture, they pass through a stage where they
express Tpbpa and within 2 days begin to express trophoblast giant cell marker genes,
including placental lactogen-I (Pl1) and proliferin (Plf).
The developing vasculature of the placenta, which facilitates the transfer of
nutrients and gases to the fetus, is influenced by the movement of trophoblast cells within
the placenta (Adamson et al., 2002). The maternal blood enters the placenta through
spiral arteries that form in the implantation site by angiogenesis. These arteries are
invaded by trophoblast cells, which displace the endothelial cell lining and reduce
maternal control of blood flow to the placenta (Hemberger et al., 2003). These cells
express markers of trophoblast giant cells. As the spiral arteries approach the outer
trophoblast giant cell layer, they converge to form large central canals that flow toward
the base of the placenta, where maternal blood then passes into very small sinusoid
spaces that are separated from the fetal blood spaces by three layers of trophoblast cells,
two of which are syncytiotrophoblast (Adamson et al., 2002). Fetal blood enters the

40
placenta through a single umbilical artery, which branches extensively to form a dense
network for exchange of nutrients, gases and waste.
In order to examine the question of cell lineage in the mouse placenta, we have
exploited the features of Cre recombinase reporter lines. We have generated mice in
which Cre recombinase is expressed in the EPC and spongiotrophoblast, under the
control of the Tpbpa promoter. These mice have been crossed to the Z/AP reporter line
(Lobe et al., 1999) to examine the fate of Tpbpa-expressing cells in vivo.
2.2 Materials and Methods
2.2.1 Plasmids
Transgenic constructs. In order to generate an expression cassette for the
bicistronic expression of both Cre recombinase and EGFP, several steps were required.
First, an XbaI/blunted to BglII fragment of pCAGGS (Niwa et al., 1991) containing the
Cre recombinase coding sequence was subcloned into pUC19 to generate the 4000bp
pCre-1 plasmid. pCre-1 was digested with BstI, blunted and further digested with EcoRI
to liberate the Cre coding sequence, which was then inserted into pIRES2-EGFP
(Clontech) between the blunted XhoI site and the EcoRI site, to generate the 8355 bp
plasmid pCIG. To create a more versatile plasmid containing the Cre-IRES-EGFP
construct, a PstI fragment liberating the entire Cre-IRES-EGFP construct was subcloned
into pBS-KS+ (Stratagene) to generate pCIG-BSK1.
To generate a construct in which the Cre-IRES-EGFP bicistronic cassette would be
specifically expressed in the spongiotrophoblast region of the mouse placenta, it was
placed under the control of the Tpbpa promoter (Calzonetti et al., 1995). This was
accomplished by sucloning a 6991 bp EcoRI fragment of pKS4311 (provided by the
laboratory of J. Rossant) containing 5.4 kb of 5’ flanking sequence as well as the first
intron of the Tpbpa gene into the EcoRI site of pCIG-BSK1 to generate the 13167 bp
plasmid, pTpbpa-CIG.
Riboprobe plasmids. Several constructs were generated for the creation of riboprobes
for the detection of mRNA, either by RNase protection or in situ hybridization. To
generate a riboprobe for the detection of Tpbpa RNA in the RNase protection assay, the

41
plasmid p4311-214 was generated. This plasmid was created by cloning a portion of
the Tpbpa cDNA by RT-PCR from total placental RNA using the primers JCC612 (5’
GCAAGAGCAGA AGGATAAAGAAGTTCTCATA 3’) and JCC613 (5’
TGGCTGTGGTTTGTTTTCCTCCTC 3’) and inserting the resultant product into the
pGEM-T vector (Promega). To generate a riboprobe for the detection of EGFP RNA in
the RNase protection assay, the plasmid pEGFP-263 was generated. This plasmid was
created by first generating a fragment of the EGFP cDNA by PCR amplification from the
plasmid pCIG-BSK1 using the primers JCC381 (5’TTCAAGGACGACGGCAA
CTACAAGA 3’) and JCC382 (5’ GGGGGTGTTCTGCTGGTAGTGGTC 3’). This
fragment of the EGFP cDNA was then ligated into the pGEM-T vector (Promega).
To generate a riboprobe for Cre recombinase, a 1.1kb EcoRI fragment from
pTurbo-Cre containing the complete NLS-Cre sequence was inserted into the EcoRI site
of the pGEM-7Zf vector (Promega). This created the plasmid pGEM-Cre, which was
used to generate antisense riboprobe for in situ hybridization.
2.2.2 Generation of Tpbpa-CIG transgenic mice and breeding
The Tpbpa-CIG construct was prepared for microinjection by PvuII digestion of the
plasmid pTpbpa-CIG, followed by isolation of the 10 kb fragment containing the intact
construct without as little flanking bacterial sequence as possible. The DNA was
purified, quantified and diluted to a concentration of 1-2 ng/µl prior to being sent to the
transgenic core at the Centre for Molecular Medicine and Therapeutics (Vancouver,
British Columbia), where it was used to create transgenic mice by microinjection. Three
founder transgenic males were outcrossed to CD1 females to produce progeny that were
heterozygous for the Tpbpa-CIG transgene.
2.2.3 Genotyping
The initial genotyping of Tpbpa-CIG transgenic mice was based on PCR detection
of the EGFP coding region using the primers JCC381 and JCC382 (primer sequences
shown above). The components of the PCR reaction were Fisher ‘B’ 10X PCR buffer
(Fisher Scientific), 25mM MgCl2, 5pmol dNTPs, 10 pmol each of JCC381 and JCC382,
1U Taq polymerase and 1µl of DNA in a final volume of 25 µl. The PCR reaction was
conducted as follows: 94oC for 4 minutes followed by 30 cycles of 94oC for 1 second,

42
65oC for 1 minute, and 72oC for 1 minute. This reaction generates an approximately
250 bp PCR fragment if the EGFP coding region is present in the DNA sample.
An alternative method for genotyping the Tpbpa-CIG transgenic mice was based on
detection of region encoding Cre using the primers JCC383 (5’GTTCGCAAGAAC
CTGATGGACA 3’) and JCC384 (5’ CTAGAGCCTGTTTTGCACGTTC 3’). The
components of the PCR reaction were Fisher ‘B’ 10X PCR buffer (Fisher Scientific), 25
mM MgCl2, 5 pmol dNTPs, 10 pmol each of JCC383 and JCC384, 1U Taq polymerase
and 1 µl of DNA in a final volume of 25 µl. The PCR reaction was conducted as follows:
94oC for 5 minutes then 30 cycles of 94oC for 1 minute, 54oC for 1 minute, 72oC for 1
minute followed by a 5 minute extension at 72oC. This reaction generates a ~300 bp PCR
fragment if the Cre recombinase coding region is present in the DNA sample. This
method was used for routine genotyping of the Tpbpa-Cre mice.
Genotyping for Z/AP transgenes was carried out on ear punches (for adult mice) or
on small tissue samples (for embryos, a small piece of tail was cut for genotyping) as
described previously (Lobe et al., 1999). Samples were rinsed in PBS, fixed for 15
minutes in 0.2% glutaraldehyde in PBS, and washed three times for 5 minutes in PBS.
Samples were then stained with lacZ stain (0.5mg/ml 4-chloro-5-bromo-3-indolyl-β-D
galactopyranoside (X-gal), 5mM potassium ferrocyanide and 5mM potassium
ferricyanide in lacZ wash buffer) at room temperature with protection from light.
PCR genotyping of Gt Rosa Sor tm1sor mice (Soriano, 1999) was conducted using
the primers JCC745 (5’GCGAAGAGTTTGTCCTCAACC 3’), JCC746 (5’
GGAGCGGGAGAAATGGATATG 3’) and JCC747 (5’ AAAGTCGCTCTGAGTTGT
TAT 3’). These primers were designed by the lab of Dr. Phillipe Soriano (Friedrich and
Soriano, 1991; Zambrowicz et al., 1997). The PCR reaction was conducted using
Epicentre FailSafe 2X PCR Premix Buffer B (Epicentre Technologies), 10pmol each of
JCC745, JCC746 and JCC747, 0.5U Taq polymerase and 1µl of DNA in a final volume
of 25µl. The PCR reaction was conducted as follows: 94oC for 3 minutes then 35 cycles
of 94oC for 30 seconds, 67oC for 1 minute, 72oC for 1 minute followed by a 10 minute
extension at 72oC. This three primer system generates a ~550 bp wild type band and a
~300 bp transgenic band.
43
2.2.4 RNase Protection Assay
RNase protection assays were performed using the Ambion RPA III kit (Ambion),
generally as described in the kit instruction manual but with minor modifications as
follows. All required reagents are included in the RPA III kit. Briefly, Tpbpa and EGFP
riboprobes generated using the plasmids p4311-214 and pEGFP-263 were added to 10
20µg of total RNA isolated from embryos or placentas from Tpbpa-Cre transgenic mice
and dried in a speed-vac for 15-30 minutes. To this, Hybridization III buffer was added
and the solution was heated to 85-95oC for 4 minutes and then incubated at 43oC for a
minimum of 16 hours. RNase solution (RNaseA/RNase T1 mix and RNase Digestion
Buffer) was added; samples were mixed well and incubated at 37oC for 30 minutes.
RNase inactivation buffer was added. Samples were incubated at -20oC for 15 minutes,
followed by a 15 minute centrifugation at top speed. The supernatant was carefully
removed and tubes were dried for 5 minutes. Pellets were resuspended in Gel Loading
Buffer II and heated to 95oC for 3 minutes before being run on an acrylamide gel at 40
watts for 1.5-2 hours. Gels were dried, exposed overnight at -85oC and films were
developed.
2.2.5 Tissue collection for whole-mount staining or for sectioning
Embryos and extraembryonic tissues were dissected at various gestational ages.
Noon of the day on which a vaginal plug was detected was considered to be E0.5.
Fixation of tissues for whole mount histochemical staining was performed as described
previously (Lobe et al., 1999). Briefly, small embryos and placentas (harvested on or
before E9.5) to be used for X-gal staining were fixed in lacZ fix (0.2% glutaraldehyde,
50mM EGTA, pH 7.3, 100mM MgCl2 in PBS) overnight at 4oC. Embryos and placentas
harvested after E9.5 for X-gal staining were fixed in 2% paraformaldehyde, 0.2%
glutaraldehyde in PBS overnight at 4oC. Embryos and placentas to be used for alkaline
phosphatase staining were fixed in 0.2% glutaraldehyde, 5mM EGTA, pH 7.3, 10mM
MgCl2, 0.02% Nonidet-P40, 0.01% sodium deoxycholate in phosphate buffered saline
overnight at 4oC.
Placentas to be used for routine histology, in situ hybridization or
immunohistochemistry were fixed overnight in 10% neutral buffered formalin (10%

44
formaldehyde, 33mM sodium phosphate, monobasic, 45mM sodium phosphate,
dibasic in distilled H20) and embedded in paraffin. Sections were cut at 8µm.
2.2.6 Whole-mount β-galactosidase staining and embedding
Whole-mount β-galactosidase staining was performed as described previously
(Lobe et al., 1999). Briefly, fixed samples were washed three times in lacZ wash buffer
(2mM MgCl2, 0.01% sodium deoxycholate, 0.02% Nonidet-P40 in PBS), for 20 minutes.
Samples were stained in lacZ stain (0.5mg/ml 4-chloro-5-bromo-3-indolyl-β-D
galactopyranoside (X-gal), 5mM potassium ferrocyanide and 5mM potassium
ferricyanide in lacZ wash buffer) at room temperature for 30 minutes to overnight, with
shaking and protection from light. Once staining was complete, samples were washed
three times for 10 minutes in PBS and stored in lacZ wash buffer at 4oC.
Stained tissues were prepared for embedding using a modified procedure due to the
increased fragility of the tissues as a result of the processing for staining. Samples were
dehydrated through an ethanol series (30%, 50%, 70%, 85%, 95% and 100% in PBS) for
5 minutes each, followed by two 15-minute washes in xylene. Samples were paraffin-
embedded and sections were cut at 8µm.
2.2.7 Whole-mount alkaline phosphatase staining and embedding
Whole-mount alkaline phosphatase staining was performed as described previously
(Lobe et al., 1999). Briefly, fixed samples were rinsed in PBS then endogenous alkaline
phosphatase activity was inactivated by incubation at 75oC for 30 minutes. Samples were
rinsed in PBS, and washed in AP buffer (100mM Tris-HCl, pH 9.5, 100mM NaCl, 10mM
MgCl2 in H20) for 10 minutes. Samples were stained with BM Purple AP substrate,
precipitating (Roche) at 4oC for 0.5 to 36 hours. Once staining was complete, samples
were washed extensively in 0.1% Tween-20, 2mM MgCl2 in PBS and stored at 4oC.
Stained tissues were prepared for paraffin embedding as described for tissues
stained for β-galactosidase activity.
2.2.8 In situ hybridization
Histological sections prepared as described above were either stained with Harris’
haematoxylin and eosin (Sigma) or subjected to in situ hybridization. Digoxygenin
45
labeled antisense riboprobes for Tpbpa (Lescisin et al., 1988), Cre or Plf (Carney et
al., 1993; Linzer et al., 1985) were prepared according to the manufacturer’s instructions,
using an RNA transcription kit (Roche). In situ hybridizations were carried out overnight
at 53oC using standard procedures (Komminoth et al., 1992). Signal detection was
carried out using an anti-digoxygenin alkaline-phosphatase conjugated antibody (Roche)
at a 1:800 dilution, and staining was performed using NBT/BCIP to effect. Sections were
counterstained with nuclear fast red (Dako).
2.2.9 Immunohistochemistry
Histological sections prepared as described above were also used for
immunohistochemical detection of the human placental alkaline phosphatase protein.
Sections were first prepared by removal of the paraffin wax. Samples were soaked in
xylene. The slides were then rehydrated through a series of ethanol at decreasing
concentrations, followed by PBS. Endogenous peroxidase activity was quenched by
soaking the slides in 4% H202 in PBS for 30 minutes at room temperature. An antigen
retrieval step was carried out whereby sections were incubated in 1mg/ml trypsin (1 mg
trypsin tablets (Sigma) were dissolved in 1 ml of water) for 5 minutes at room
temperature. In order to block non-specific binding of the secondary antibody, samples
were incubated in 5% normal goat serum (Cederlane) in PBS for 45 minutes at room
temperature. Detection of the hPLAP protein was conducted using a rabbit monoclonal
antibody (PLAP clone SP15, Labvision Corporation). The primary antibody was diluted
to a concentration of 1:50 in 1% BSA in PBS. Sections were incubated at 4oC overnight.
A horseradish peroxidase (HRP)-conjugated goat anti-rabbit secondary antibody (Santa
Cruz) was diluted 1:200 in 1% BSA in PBS. Sections were incubated in secondary
antibody for 1 hour at room temperature. The HRP was detected using the DAKO
Liquid DAB+ Chromagen System (Dako), which is a substrate system for the
visualization of HRP activity. Sections were incubated in substrate to effect, and
counterstained with nuclear fast red (Dako) prior to mounting.
2.2.10 Statistical Analysis
Data are presented as proportions ± standard error of the mean. A Chi square test
was used for comparisons between the observed inheritance of the transgene and values

46
expected assuming normal Mendelian inheritance. An unpaired Student’s t test was
used for comparisons between the three transgenic lines. Probability values of P < 0.05
were considered significant.
2.3 Results
2.3.1 The Tpbpa promoter can direct placental-specific expression of Cre and EGFP
Previous studies identified 5.4 kb of Tpbpa 5’ flanking sequence that, along with the first
intron of the coding region, could direct high level expression in the developing mouse
placenta in a pattern that recapitulates the endogenous pattern of expression of the gene
(Calzonetti et al., 1995). This region was linked to a CreIresEGFP (CIG) cassette (Figure
4A). The CIG cassette allows for the bi-cistronic transcription of both Cre recombinase
and EGFP under the control of the same promoter. The Tpbpa-CIG construct was used to
generate transgenic mice by microinjection. Of 31 pups, 11 (35.5%) were found to carry
the Tpbpa-CIG transgene by PCR genotyping for the EGFP coding sequence. Of these
11 mice, 4 were females and were excluded from further study. The 7 male founder mice
carrying the transgene were outcrossed to CD1 females, and embryos and placentas were
collected at various stages to assess for Cre recombinase and EGFP expression. Total
RNA was collected for individual embryos and placentas of offspring that were found to
have inherited the transgene based on PCR genotyping. RNase protection assays
demonstrated that the Cre and EGFP mRNAs were present in total RNA from the
placenta, but not in total RNA from the fetus at E14.5 in three of the founder lines
designated Line 3, Line 4 and Line 5 (Figure 4B). Further examination of the expression
of the transgene (described below) revealed ectopic expression of the Tpbpa-CIG
transgene in the developing central nervous system in offspring from Line 4 (Figure 4D),
but not in Lines 3 and 5 (not shown).
Fluorescent microscopy was also used to visualize the expression of EGFP in the
placentas and embryos carrying the Tpbpa-CIG transgene. EGPF was readily visible in
the placenta, in a region corresponding to the spongiotrophoblast, in all three transgenic
lines (Figure 4C, and data not shown). The fluorescence could be observed in the
developing placenta as early as E9.5 (data not shown), but could not be visualized at any

47
Figure 4. Generation of spongiotrophoblast specific Cre mice. (A) Schematic
diagram of the Tpbpa-CIG transgene. (B) RNase protection assay of total RNA isolated
from embryos and placentas from each of the transgenic lines. Yeast RNA was used as a
negative control. (C) EGFP fluorescence in the spongiotrophoblast region of the placenta
at E10.5 (Line 4). (D) Ectopic transgene expression in the embryo of Line 4 transgenic
mice. Shown is a Tpbpa-CIG and Gt Rosa Sor tm1sor double transgenic embryo at E11.5.
(E-G) Expression of Cre recombinase is limited to Tpbpa-expressing cells at E9.5.
Sections shown are from Line 3. In situ hybridization for Tpbpa (E), Cre (F) and Plf (G).
Dec, decidua; EGFP; enhanced green fluorescent protein; EPC, ectoplacental cone; IRES,
internal ribosome entry site; Lab, labyrinth; SpT, spongiotrophoblast; TGC, trophoblast
giant cell.

48

49
earlier stages. The visualization of EGFP was found to correlate exactly with offspring
found to carry the transgene by PCR genotyping.
The expression of Tpbpa, Cre and Plf in the developing placenta was examined
by in situ hybridization at E9.5 in all three lines. Both Tpbpa and Cre mRNAs were
detected in cells at the tip of the EPC, just inside the Plf expressing trophoblast giant cell
layer (Figure 4E-G, and data not shown). These observations indicate that Tpbpa and Cre
are expressed in the same population of cells.
Routine PCR genotyping of offspring of the three Tpbpa-CIG lines revealed that
the transgene is inherited at Mendelian ratios (Table 2). These results demonstrate that
the transgene does not have a detrimental effect on development.
2.3.2 Activity of Tpbpa-CIG during development in Line 3
In order to examine the activity of the Tpbpa-CIG transgene, male transgenic mice
from each founder line were crossed to females carrying the Z/AP reporter transgene
(Lobe et al., 1999) in order to generate double transgenic offspring which could be
examined by histochemical staining. Embryos and placentas were dissected at various
developmental stages and whole implantation sites (E8.5) or placentas were split in half.
One half of the placenta was stained for β-galactosidase activity, indicating cells which
had not undergone Cre-mediated recombination. The embryo and the other half of the
placenta were stained for alkaline phosphatase activity, indicating cells which had
undergone Cre-mediated recombination (Figure 5A). Alkaline phosphatase activity was
never observed in mice that were not carrying both transgenes.
At the whole mount level, the activity pattern of the Tpbpa-CIG transgene in the
placenta for Line 3 essentially recapitulated the expression of endogenous Tpbpa
(Lescisin et al., 1988) (Figure 5A). However, the onset of expression may be slightly
delayed in this line as expression was only evident in a very small subset of cells at the
tip of the EPC by E8.5 (Figure 5B), whereas expression can usually be detected in more
cells at this stage (Lescisin et al., 1988; Scott et al., 2000; Wessells et al., 2000). The
expression pattern was more widespread in the EPC by E9.5. By E11.5, alkaline

50
Table 2. PCR genotyping of Tpbpa-CIG transgenic mice
Cre Positive Total animals % Cre positive P-value
Line 3 51 107 47.7% P>0.05
Line 4 85 155 54.8% P>0.05
Line 5 73 128 57.0% P>0.05

51
phosphatase activity appeared to be restricted to the spongiotrophoblast region of the
placenta. This restricted expression was also observed at E14.5.
2.3.3 Activity of Tpbpa-CIG during development in Line 4
The expression of Line 4 in the placenta was essentially indistinguishable from the
expression pattern observed for Line 3. However, this line also exhibited ectopic
transgene activity in the embryo proper. This expression was observed in the hindbrain
and somites of the developing embryo at E11.5 and E14.5 (Figure 4D, and data not
shown), but was only observable after prolonged staining of the embryo in BM Purple
alkaline phosphatase substrate (7-10 days).
2.3.4 Activity of Tpbpa-CIG during development in Line 5
Tpbpa-CIG Line 5 demonstrated a different pattern of activation in the developing
placenta at early time points. At E8.5, widespread alkaline phosphatase activity was
observed in the EPC as well as in an asymmetric pattern along one lateral side of the
implantation site (Figure 5B). The observed pattern of alkaline phosphatase activity in
the EPC suggests an earlier onset of transgene activity in Tpbpa-CIG line 5, compared
with the other two lines, but is more representative of the endogenous expression of
Tpbpa. The alkaline phosphatase activity outside of the EPC appeared to extend down the
side of the implantation chamber in a position where trophoblast giant cells lie (see
below).
Interestingly, for Line 5, alkaline phosphatase activity was observed in a much
lower proportion of implantation sites than expected under Mendelian inheritance (11.8%
of the total number of conceptuses compared to the expected ratio of 25%) (Table 3). For
this reason, PCR genotyping was undertaken to identify all conceptuses carrying the
Tpbpa-CIG transgene. The presence of β-galactosidase staining was used to identify all
Z/AP positive conceptuses. Combining these two results, it was found that 35.3% of all
double transgenic conceptuses exhibited alkaline phosphatase activity. The remaining
double transgenic conceptuses did not have any discernible alkalkine phosphatase
activity. The ratio of double transgenic placentas observed upon PCR genotyping was
within the expected values under normal Mendelian inheritance (p>0.10)

52
Figure 5. Expression of Tpbpa-CIG in the developing placenta. Tpbpa-CIG mice
were crossed to the Cre recombinase double reporter line Z/AP (Lobe et al., 1999).
hPLAP activity is present in cells that have undergone Cre-mediated recombination. (A)
Expression of Tpbpa-CIG at various developmental stages for three independent
transgenic lines. The boxes at E8.5 correspond to higher magnification images in Figure
5B. (B) The three Tpbpa-CIG transgenic lines demonstrate different levels of activity at
E8.5. Lines 3 and 4 have a small number of hPLAP positive cells in the EPC
(arrowheads). Line 5 exhibits a more widespread pattern of expression in the EPC and
asymmetrically along one lateral edge of the implantation site. The right hand panel is a
higher magnification view, showing staining in TGCs but not in neighboring diploid
cells. (C) Cre recombinase expression was not detected in secondary trophoblast giant
cells in all three transgenic lines. Asterisks indicate secondary trophoblast giant cells.
Dec, decidua; epc, ectoplacental cone; Lab, labyrinth; SpT, spongiotrophoblast; TGC,
trophoblast giant cells.
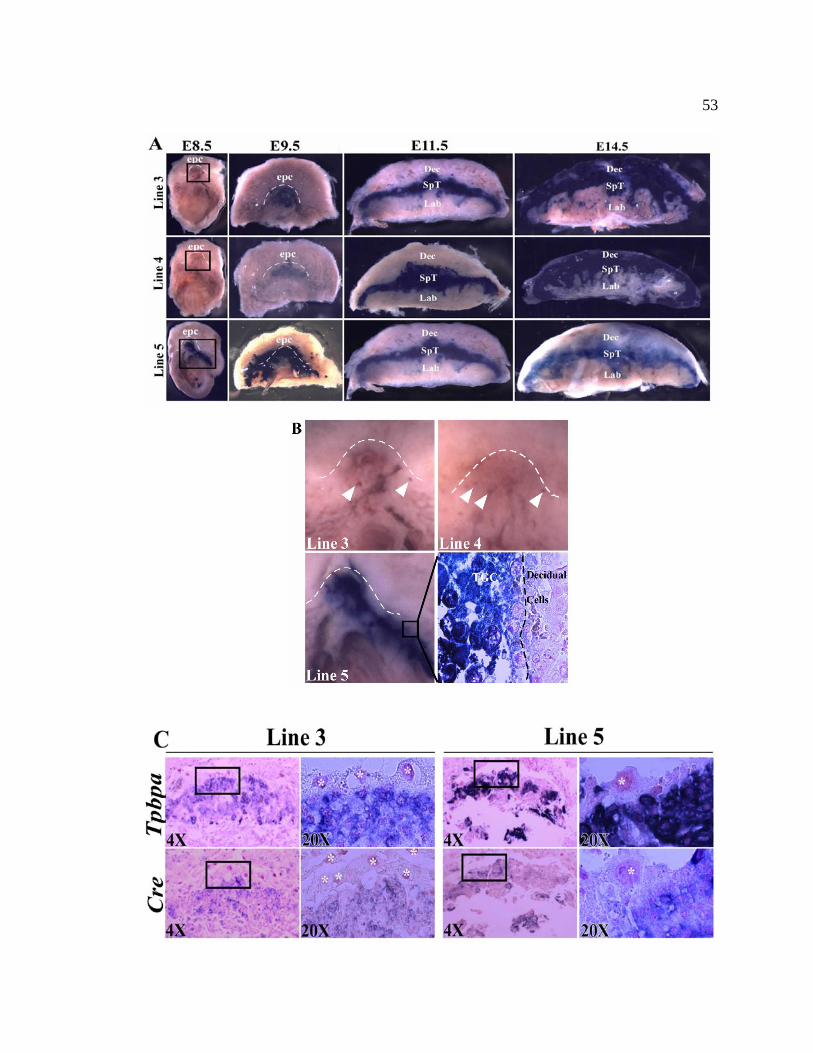
53

54
Table 3. Inheritance of the Tpbpa-CIG transgene based on the presence of hPLAP staining in the EPC or placenta in Tpbpa-CIG x Z/AP crosses
Stage Line 3 Line 4 Line 5
E8.5 Number 21 12 37 hPLAP positive (%) 5 (23.8%) 3 (25.0%) 4 (10.8%)
E9.5 Number 24 19 22 hPLAP positive (%) 6 (25.0%) 8 (42.1%) 10 (45.5%)
E11.5 Number 25 11 21 hPLAP positive (%) 4 (16.0%) 2 (18.2%) 5 (23.8%)
E14.5 Number 18 24 25 hPLAP positive (%) 7 (38.9%) 11 (45.8%) 8 (32.0%)
Total Number 88 66 105 hPLAP positive (%) 22 (25.0%) 21 (31.8%) 27 (25.7%)
Number, the total number of EPCs or placentas that were stained for transgene activity; hPLAP positive, the number of EPCs or placentas with detectable hPLAP staining indicating Cre excision has occurred in a mouse carrying the Z/AP transgene.

55
pattern more closely resembled that observed in the other two transgenic lines (Figure
5A). Alkaline phosphatase expression appeared to be restricted to the spongiotrophoblast
region of the placenta at E11.5 and at E14.5, as for the endogenous expression of Tpbpa
mRNA.
2.3.5 Confirmation of recombination with a different target transgene
Confirmation of the activity patterns observed with the Z/AP reporter line was
attempted using the single reporter line, Gt Rosa Sor tm1sor (Soriano, 1999). However, this
approach was problematic, as placental tissues had to be stained in β-galactosidase stain
for up to 14 days in order to observe staining. After prolonged staining, though, the
pattern of activity observed in Tpbpa-CIG and Gt Rosa Sor tm1sor double transgenic
placentas at E11.5 and E14.5 were identical to those observed with the Z/AP reporter line
(data not shown). The ectopic activity in embryos from Line 4 was also observed using
the Gt Rosa Sor tm1sor reporter (Figure 4D), and expression was not observed in embryos
from Lines 3 and 5. These results indicate that the Cre recombinase expressed in Tpbpa-
CIG transgenic mice is capable of mediating recombination of at least 2 distinct target
transgenes.
2.3.6 Assessment of recombination activity at the cellular level
To assess whether recombination occurred in all cells within the spongio
trophoblast and glycogen trophoblast cell populations, serial sections of double
transgenic population, placentas at E14.5 were subjected to in situ hybridization to
identify cells expressing the mRNA for Tpbpa (to mark the endogenously expressing
population) (Lescisin et al., 1988), Cre recombinase and Plf (a trophoblast giant cell
marker) (Carney et al., 1993; Linzer et al., 1985). A further slide was subjected to
immunohistochemistry to identify cells expressing the human placental alkaline
phosphatase (hPLAP) protein. Using these sets of slides, recombination was quantified
by comparing the number of cells expressing Tpbpa to the number of cells co-expressing
Tpbpa and hPLAP for each transgenic line (Figure 6). Gross examination of the slides
indicated that the hPLAP antibody, which recognizes the membrane-bound enzyme, did
not label glycogen trophoblast cells very well due to their morphology. These cells tend
to cluster in groups of cells with a foamy appearance due to the loss of the cell granule

56
contents during histological processing. These clusters were always labeled strongly
along the outside edges of each cluster, but cells within each cluster did not always label
well. To adjust for this under-representation, the total number of cells co-expressing
Tpbpa and Cre but not expressing hPLAP, were added to the total cell number expressing
Tpbpa and hPLAP (Figure 6). The proportion of Tpbpa-expressing cells that also
expressed either hPLAP or Cre was variable between lines (84.2% of cells in Line 3
(n=833), 93.6% of cells in Line 4 (n=537) and 78.7% of cells in Line 5 (n=371)) but
these differences were not statistically significant. Based on morphology and on cell
markers, all three Tpbpa-CIG transgenic lines appeared to go recombination in most, if
not all, of the cells that express the endogenous Tpbpa gene.
The failure to detect hPLAP and/or Cre expression in 100% of spongiotrophoblast
cells suggested possible mosaic expression or activity of the Tpbpa-CIG transgene.
However, it was also possible that the analysis under-represented actual recombination
events because expression of hPLAP may lag even if recombination has occurred.
Therefore, a parallel approach was undertaken to quantify the recombination events more
precisely. Placentas from all three transgenic lines were stained for β-galactosidase
activity, paraffin-embedded, sectioned and counterstained with nuclear fast red. These
sections were examined to determine if any cells that morphologically resembled
spongiotrophoblast or glycogen trophoblast cells had failed to undergo recombination as
indicated by continued expression of β-galactosidase. Examination of double transgenic
placentas at E14.5 revealed that for all three transgenic lines, recombination had taken
place in all cells known to express endogenous Tpbpa (Figure 6 and data not shown).
The number of double transgenic placentas examined was 7 from Line 3, 11 from Line 4
and 8 from Line 5. Each of these placentas was represented by a minimum of 4 sections
which were examined for mosaic recombination. Cells that continued to express β
galactosidase included the syncytiotrophoblast of the labyrinth and some trophoblast
giant cells.

57
Figure 6. Cre-mediated recombination occurs in all spongiotrophoblast and
glycogen trophoblast cells by E14.5. (A) Serial analysis of cell-type specific markers
reveals that >75% of cells expressing Tpbpa also express hPLAP, the indicator of
recombination, or Cre recombinase (n=1731). There is no significant difference between
the three transgenic lines. (B-F) Histological sections through lacZ stained placentas.
Positive lacZ staining indicates the absence of Cre-mediated recombination. (B)
Trophoblast giant cells are strongly positive for b-galactosidase expression but
neighboring glycogen trophoblast cells are negative. (C-D) Syncytiotrophoblast cells in
the labyrinth have not undergone Cre-mediated recombination but neighboring
spongiotrophoblast cells have. (D; higher magnification view of C) (E-F) Glycogen
trophoblast cells have undergone Cre-mediated recombination (F; higher magnification
view of E). GlyT, glycogen trophoblast; Lab; labyrinth; SpT, spongiotrophoblast; TGC,
trophoblast giant cell.

58

59
2.3.7 Cell lineage analysis of Tpbpa-expressing cells
One of the great advantages of Cre-activated reporter lines is that a recombination
event in a specific cell is a permanent, heritable change that is passed on to all progeny of
that cell, even if that cell no longer continues to express Cre. This feature of the system
allows for lineage tracing of cells that have expressed Cre recombinase. Based on the
observation that the three lines of Tpbpa-CIG mice undergo recombination in the
majority of cells that express Tpbpa endogenously, these mice were used to assess the
fate of cells that have expressed Tpbpa.
2.3.7.1 Cell fates at E8.5 using Tpbpa-CIG Line 5
The widespread and asymmetrical pattern of alkaline phosphatase activity in Line 5
at E8.5 provided an opportunity to examine cell lineage at this early stage. The location
of the cells along the lateral side of the implantation site suggested that these cells
represented secondary trophoblast giant cells, but the cell type could not be identified at
the whole mount level. To more precisely localize this asymmetric pattern of alkaline
phosphatase activity, implantation sites were carefully dissected and the orientation of
each implantation site was physically marked prior to staining for alkaline phosphatase
activity. One litter was examined, and of 15 implantation sites, 2 of these stained for
alkaline phosphatase activity. In both cases, the asymmetric distribution of the cells was
oriented toward the ovary. Histological sections showed that the alkaline phosphatase
activity was indeed limited to trophoblast giant cells (Figure 5B). Importantly, Cre
mRNA expression was not detected in secondary trophoblast giant cells at E9.5 (Figure
5C and data not shown). Trophoblast giant cells (n=149) were assessed in three different
Line 5/ZAP transgenic conceptuses and Cre mRNA was never detected. Similarly, for
line 3, Cre mRNA was never detected (n=485 cells; 4 double transgenics). Therefore, the
alkaline phosphatase activity in the secondary giant cells in line 5 was not due to ectopic
expression of Tpbpa-CIG in trophoblast giant cells, but rather due to Tpbpa-expressing
EPC cells that subsequently differentiated into giant cells.
2.3.7.2 Cell fates at E14.5 using all three Tpbpa-CIG transgenic lines
In order to study the fate of Tpbpa expressing cells, serial sections were used to
examine expression patterns of the reporter protein, hPLAP, and the mRNA expression

60
Figure 7. A proportion of secondary trophoblast giant cells arise from Tpbpa-
expressing precursor cells. (A) Serial analysis of cell-type specific markers indicates
that >25% of Plf positive giant cells are hPLAP positive or Cre positive (n=532 cells
from 10 double transgenic placentas {4 from Line 3, 2 from Line 4 and 4 from Line 5}).
Values with different superscripts are significantly different (p<0.05). (B-E)
Representative image of a Plf (C) positive trophoblast giant cell that also expressed
hPLAP (B), but not Tpbpa (D) or Cre (E) (arrowhead).
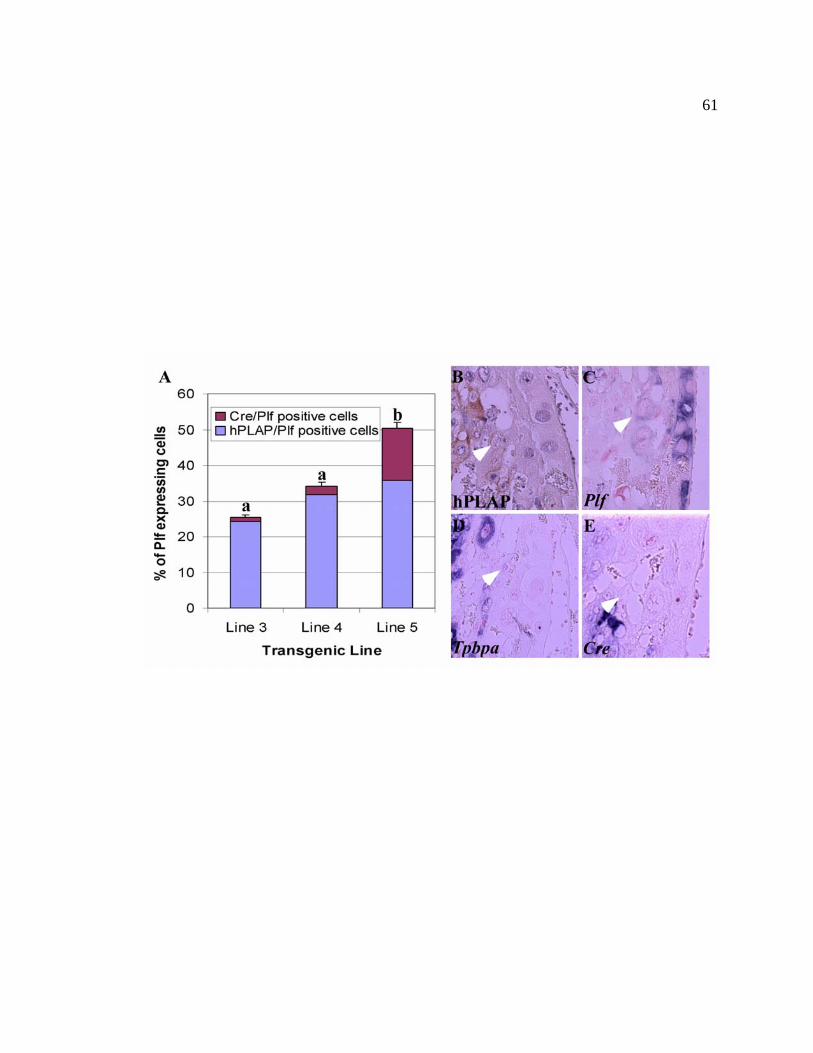
61

62
patterns of Tpbpa (Lescisin et al., 1988), Cre and Plf (Carney et al., 1993; Linzer et al.,
1985). Initial overall examination of the slides indicated that, as expected, the majority
of hPLAP expressing cells also expressed Tpbpa and Cre, or both. To quantify
expression patterns, random fields were selected and the markers expressed by each cell
in the field were ascertained. hPLAP expressing cells were not often seen within the
labyrinth layer of the placenta, except in association with large maternal blood spaces,
including the central arterial canals and the peripheral venous channels. Similarly,
outside the trophoblast giant cell layer, in the maternal decidua, hPLAP positive cells
were only seen in association with maternal spiral arteries entering the placenta.
The proportion of Plf expressing trophobast giant cells that were derived from
Tpbpa-expressing cells through secondary giant cell differentiation was found to be quite
high. The cells were counted in random fields throughout the placenta, but did not
include cells that were directly lining maternal blood spaces (discussed below). This
number was then adjusted to include Plf positive cells that were also Cre positive, to
account for cells that were expressing Cre recombinase without strong expression of the
reporter (Figure 7). These results indicated that Line 5 had a significantly larger
proportion of Plf expressing cells (50.4%, n=115 cells from 4 double transgenic
placentas) that also express hPLAP or Cre, compared to both of the other lines (25.4 %,
n= 335 cells from 4 double transgenic placentas for Line 3; 34.2%, n= 85 cells from 2
double transgenic placentas for Line 4) (P<0.03). This result was expected, as the onset
of transgene expression is earlier for Line 5 than for the other two lines, and it would
appear that more of the precursors of secondary trophoblast giant cells became labeled in
the early stages of development.
As mentioned previously, hPLAP-positive cells within the labyrinth layer were
found in close association with large maternal blood spaces. These blood spaces were
identified as central arterial canals and large venous channels based on their locations and
large size. The expression of each marker was assessed in each cell directly surrounding
these large maternal blood spaces, within one cell layer. Based on the expression patterns
revealed in the whole mount analysis, results for Lines 3 and 4 were grouped together and
compared to results for Line 5. Smaller maternal blood sinuses located throughout the

63
Figure 8. Cells lining large maternal blood spaces within the labyrinth are derived
from the ectoplacental cone. (A) Serial analysis of cell-type specific markers indicates
that >95% of the cells immediately lining the central arterial canals and large venous
channels in the labyrinth are derived from Tpbpa-expressing cells in the ectoplacental
cone (n=126). The asterisk indicates a statistically significant difference in the
proportion of cells expressing only hPLAP, and no other marker, between Lines 3 and 4
and Line 5. (B-E) Representative images of a maternal blood space demonstrating that
the majority of the cells express hPLAP (B), the marker of recombination and that these
cells may also express Plf (C) or Tpbpa (D). mbs; maternal blood space.

64

65
labyrinth region were not examined, as these were not readily identifiable in histological
sections. For the large maternal canal/channel blood spaces within the labyrinth, cells
were observed that expressed hPLAP plus Plf and hPLAP plus Tpbpa (Figure 8). In
Lines 3 and 4 (n=98 cells from 6 double transgenic placentas), a significantly larger
proportion of cells expressing only hPLAP,and no other marker (Plf, Tpbpa or Cre), were
observed as compared to for Line 5 (n=44) (P<0.01).
For maternal spiral arteries within the maternal decidua, a significantly larger
proportion of cells in Line 5 (54.3%, n=35 cells from 4 double transgenic placentas)
expressed hPLAP and Plf compared to Lines 3 and 4 (19.8%, n=91 cells from 6 double
transgenic placentas) (P<0.01) (Figure 9). These cells were located in a position such
that they were directly lining the lumen of the spiral artery, and did not resemble
glycogen trophoblast cells. The cells tended to have either an elongated, spindle-like
shape or to be rounded, with a more dense appearance than glycogen trophoblast cells.
The presence of hPLAP positive cells in this location indicates that the trophoblast cells
lining the maternal spiral arteries are largely represented by trophoblast giant cells that
are derived from EPC/spongiotrophoblast with cells. These cells likely differentiate
during earlier stages of development, along with what is recognized as the secondary
giant cell population. As described by Hemberger et al. (2003), the Plf positive cells
associated with the maternal spiral arteries did not have the characteristic large size and
nuclei typical of trophoblast giant cells. These cells often had an elongated, spindle like
appearance, as described previously (Hemberger et al., 2003). Cells lining maternal
spiral arteries in Lines 3 and 4 were significantly more likely to co-express hPLAP and
Tpbpa than were the same population of cells in Line 5 (P<0.01). Both lines had a large
number of cells expressing only hPLAP, and none of the other markers (Plf, Tpbpa or
Cre) examined.

66
Figure 9. Cells immediately lining the lumen of maternal spiral arteries are derived
from the ectoplacental cone. (A) Serial analysis of cell-type specific markers indicates
that >92% of the cells immediately lining the maternal blood spaces in the labyrinth are
derived from Tpbpa-expressing cells in the ectoplacental cone (n=91). Asterisks indicate
a statistically significant difference in the proportions of cells expressing hPLAP + Plf,
and hPLAP+Tpbpa between Lines 3 and 4 and Line 5. (B-E) Representative images of a
maternal spiral artery showing hPLAP-positive secondary trophoblast giant cells (B-C) in
association with the lumen of the artery. msa, maternal spiral artery. These cells do not
express Tpbpa (D) or Cre (E).

67
68
2.4 Discussion
This study has described the generation and characterization of transgenic mice
expressing Cre recombinase and EGFP specifically in the spongiotrophoblast layer of the
placenta under the control of the Tpbpa promoter. Three independent lines were
generated, and one of these lines (Line 4) faithfully recapitulates the endogenous
expression of Tpbpa in the placenta (Carney et al., 1993; Lescisin et al., 1988). The
Tpbpa-CIG transgenic mice were crossed with the Z/AP reporter mice (Lobe et al., 1999)
to generate a heritable change in all cells that initially expressed the Cre transgene. This
approach allowed for cell lineage to be examined within the mouse placenta. Analysis of
serial sections through E14.5 double transgenic placentas labelled for cell type specific
markers as well as Cre recombinase and the reporter protein, hPLAP, identified
descendents of the Tpbpa expressing population. The results of this study indicate that
EPC and spongiotrophoblast cells can contribute to the secondary trophoblast giant cell
population. Descendents of this population were also seen in association with maternal
blood spaces both within the labyrinth and in the maternal decidua. It has been shown
previously that cells lining the maternal blood spaces within the labyrinth of mice are
trophoblast cells, not endothelial cells (Adamson et al., 2002; Wooding, 1994). The
results of this study suggest that the cells lining the maternal blood spaces within the
labyrinth are derived from the EPC, and may be a mixture of spongiotrophoblast and
giant cells. In the maternal decidua, the majority of cells observed in association with
maternal spiral arteries were Plf expressing trophoblast giant cells, descendent from the
Tpbpa-expressing EPC population. This supports previous studies which have identified
the endovascular invading cell type lining maternal spiral arteries as being Plf-expressing
trophoblast giant cells(Adamson et al., 2002; Hemberger et al., 2003).
2.4.1 Expression of the Tpbpa-CIG transgene during development recapitulates
endogenous placental expression of Tpbpa
Tpbpa-CIG and Z/AP double transgenic EPCs and placentas were stained for
alkaline phosphatase activity at various developmental stages to identify the onset of
Examination of alkaline phosphatase activity indicated that for Lines 3 and 4, the

69
transgene is expressed as early as E8.5 in a subset of cells in the EPC. This expression
became more widespread throughout the EPC by E9.5, and was restricted to the
spongiotrophoblast region of the mature placenta at E11.5 and E14.5. These two lines of
Tpbpa-CIG mice exhibit transgene expression that resembles that of the endogenous
Tpbpa gen. However, the onset of expression is slightly delayed compared to the
endogenous gene.
The onset of expression for Line 5 appears to occur earlier than in Lines 3 and 4,
based on the presence of more widespread alkaline phosphatase staining throughout the
EPC at E8.5. The expression observed, is more representative of the endogenous Tpbpa
expression pattern. In addition, the expression pattern exhibited by the double transgenic
mice is asymmetrical, with alkaline phosphatase expression extending beyond the EPC
and along one side of the implantation site. The expression of the transgene is also more
widespread at E9.5 in Line 5 compared to the other two transgenic lines, which is likely a
direct result of the more widespread expression observed at E8.5. At E11.5 and E14.5,
the expression of the transgene in Line 5 resembles the pattern observed for the other two
transgenic lines.
The identification of cells expressing the transgene was hampered by the use of
whole-mount staining to study the onset and pattern of expression. At the whole mount
level, expression can only be attributed to regions of the placenta and not to specific cell
types. In particular, expression in the trophoblast giant cell population cannot be directly
identified, because of the small number and disperse localization of these cells.
2.4.2 The ROSA26 locus is not strongly expressed in the spongiotrophoblast
In an attempt to confirm the expression patterns observed in crossing the Tpbpa-
CIG transgenic lines to the Z/AP double reporter (Lobe et al., 1999), these lines were
crossed to the single reporter strain, Gt Rosa Sor tm1sor (Soriano, 1999). This line of
reporter mice contains a loxP-flanked stop sequence, followed by a region coding for β
galactosidase. The construct was targeted to the ROSA26 locus, which had previously
been identified in a gene trap screen as being constitutively active during development
(Friedrich and Soriano, 1991; Zambrowicz et al., 1997). This approach proved

70
problematic, as the placentas had to be left in β-galactosidase stain for very long periods,
up to 14 days, to visualize β-galactosidase staining in the spongiotrophoblast region. The
requirement for extended staining periods suggests that the ROSA26 locus may not be
strongly expressed in the spongiotrophoblast region of the placenta. Intriguingly, similar
results were observed when ROSA26 ES cells in which the β-galactosidase gene was
knocked in to the ROSA26 locus were used in ES cell ↔ tetraploid aggregation
experiments (Tanaka et al., 1997). When tetraploid ROSA26 cells are aggregated with
wild type ES cells, the tetraploid cells will only contribute to the trophoblast lineages and
the primitive ectoderm (Nagy et al., 1990; Tanaka et al., 2001). LacZ staining of the
resultant placentas demonstrated that β-galactosidase activity was only observed in the
labyrinthine trophoblast and spongiotrophoblast cell types, and not in the non-trophoblast
lineages (Tanaka et al., 1997). The staining observed in the placenta is much stronger in
the labyrinth as compared to the spongiotrophoblast region, supporting the idea that the
ROSA26 locus is not strongly expressed in these cell types.
2.4.3 The Tpbpa-CIG transgene is expressed in all spongiotrophoblast and glycogen
trophoblast cells
Two methods were undertaken to assess the potential for mosaic expression of the
transgenes within the spongiotrophoblast and glycogen trophoblast cells at E14.5. First,
halves of placentas carrying both the Tpbpa-CIG transgene and the Z/AP transgene were
stained for β-galactosidase activity to identify cells in which recombination had not
occurred. These placentas were then paraffin-embedded and sectioned to allow for
analysis at the cellular level. If mosaic expression or recombination was occurring, one
would expect to see patches of blue cells that had not undergone excision within the
spongiotrophoblast region of the placenta. Examination of these sections revealed that all
cells identified as spongiotrophoblast or glycogen trophoblast cells based on location and
morphology did not express β-galactosidase, indicating that Cre-mediated excision had
occurred in all of these cells.
A second method to assess mosaicism involved the use of cell-type specific
markers, which were used to label the cells by in situ hybridization. Serial sections were

71
analyzed for the expression of cell type specific markers. The total number of cells
expressing Tpbpa was compared to the number of cells expressing hPLAP and Tpbpa for
all three transgenic lines. Based on the observation that glycogen trophoblast cells do not
label well with the hPLAP antibody, the cells expressing Tpbpa and Cre recombinase
were added to the hPLAP and Tpbpa-expressing cells to adjust for the under-
representation of this population that was likely to occur. These results indicated that
>78% of Tpbpa-expressing cells either expressed Cre or had undergone Cre-mediated
excision.
The loss of β-galactosidase activity is likely a more reliable indicator of excision,
due to the stability of the β-galactosidase protein. This protein is highly stable, and its
half life has been estimated by histochemical methods to be approximately 24 hours
(Smith et al., 1995). Given that β-galactosidase activity was not observed in any cells
identified by morphology and location within the placenta as being spongiotrophoblast or
glycogen trophoblast cells, it is likely that excision had occurred in all cells at least 24
hours prior to collection of the tissue samples. Additionally, given that hPLAP is a
membrane-bound isoform of the protein (Ogata et al., 1988), labelling of cells was
assessed based on complete or near-complete staining of the cell membrane by hPLAP.
This approach resulted in the exclusion of cells with membranes that were not completely
stained for hPLAP, and may have undergone Cre-mediated excision more recently.
Based on these points, the absence of β-galactosidase activity is likely to represent a
more accurate indicator of Cre-mediated excision in this particular experiment. These
results suggest that Cre-mediated excision has occurred in all cells of the
spongiotrophoblast and glycogen trophoblast populations for all three transgenic lines.
2.4.4 Tpbpa-expressing cells do not contribute to the syncytiotrophoblast of the
labyrinth
Analysis of the serial sections described in Section 4.6 revealed that hPLAP
positive cells were not seen in the labyrinth, except in association with maternal blood
spaces (discussed below). Cells expressing only hPLAP and none of the other markers
were only observed rarely. These results indicate that cells derived from Tpbpa

72
expressing progenitors do not make a significant contribution to the labyrinth. This raises
the question of what precursor population gives rise to the syncytiotrophoblast cells in the
labyrinth, as these cells do not arise from the same population as the spongiotrophoblast,
glycogen trophoblast and trophoblast giant cells. The precursor population from which
the syncytiotrophoblast lineage arises has yet to be identified, but is likely found within
the chorion. The expression of certain syncytiotrophoblast markers begins within the
chorion prior to syncytiotrophoblast differentiation (Cross, 2000), which strongly
implicate these cells in labyrinth formation. Cell lineage tracing of cells derived from the
chorion may provide further evidence for this relationship.
2.4.5 Spongiotrophoblast cells and secondary trophoblast giant cells share a
common precursor population
The earlier onset of transgene expression in Line 5 allowed for the examination of
early cell lineage. The asymmetrical pattern of alkaline phosphatase staining that was
observed at E8.5 suggested that the cells along the lateral edge of the implantation site
were descendent from the Tpbpa-expressing population in the EPC. Secondary
trophoblast giant cell differentiation can be detected as early as E6.5 (Carney et al.,
1993), and based on the location of these cells it seemed likely that the positively staining
cells belonged to this population. These results may indicate that secondary trophoblast
giant cells and Tpbpa-expressing spongiotrophoblast and glycogen trophoblast cells share
a common precursor population.
To further study cell lineage, serial marker analysis was conducted at E14.5 in all
three transgenic lines. To assess the contribution of Tpbpa-expressing cells to the
secondary trophoblast giant cell population, the percentage of cells expressing hPLAP in
the total population of cells expressing the trophoblast giant cell marker, Plf, was
determined for each of the transgenic lines. To this was added the cells also expressing
both Cre and Plf, to account for any possible under-representation of the hPLAP
expressing population, as described previously. The adjusted percentage of Plf
expressing cells that express either hPLAP or Cre was significantly higher in Line 5 than
in the other two lines. This is not surprising, given that the onset of expression was

73
earlier and more widespread in Line 5 than in the other two lines. This would result in
more proliferating cells undergoing Cre-mediated excision, and therefore more cells
would ultimately express hPLAP. Greater than 20% of the Plf expressing trophoblast
giant cells were also hPLAP positive in all three transgenic lines, indicating that at least
some portion of cells that begin to express Tpbpa can then turn off the expression of this
marker and differentiate to form trophoblast giant cells in vivo.
Secondary trophoblast giant cells differentiating from the outer edge of the EPC are
detectable as early as E6.5 (Carney et al., 1993). The EPC also gives rise to the
spongiotrophoblast in the mature placenta (Cross et al., 1994). Indirect evidence that
trophoblast giant cells and spongiotrophoblast cells share a common precursor population
has been demonstrated by explant culture of extraembryonic ectoderm and EPC cells
(Carney et al., 1993). When extraembryonic ectoderm cells were explanted and placed in
culture, they passed through an intermediate stage where they expressed Tpbpa prior to
differentiating to cells that both expressed the markers of and were morphologically
identifiable as trophoblast giant cells. When EPC cells were explanted and maintained in
culture, the onset of Tpbpa expression was very early, and these cells differentiated to
form trophoblast giant cells at a rate that was accelerated compared to extraembryonic
ectoderm cultures. The fact that both extraembryonic ectoderm explant and EPC explant
cultures expressed the spongiotrophoblast marker Tpbpa prior to differentiating to
generate trophoblast giant cells supports the proposal that these two cell types share a
common precursor population. This suggestion is now supported by in vivo evidence that
cells expressing Tpbpa, a marker typical of spongiotrophoblast, are capable of
differentiating to form secondary trophoblast giant cells.
It is intriguing, however, that greater than half of the trophoblast giant cells in vivo
are not derived from cells that have expressed Tpbpa. Previous studies using trophoblast
stem cell cultures have demonstrated that retinoic acid is capable of blocking
spongiotrophoblast formation and promoting trophoblast giant cell differentiation in vitro
(Yan et al., 2001). In the presence of high levels of retinoic acid, trophoblast stem cells
did not express detectable levels of Tpbpa, even after only one day of differentiation, and
at levels of retinoic acid that were only partially inhibitory of spongiotrophoblast fate,

74
Tpbpa and another spongiotrophoblast marker, Cea4 were still detected although at lower
levels than in the absence of retinoic acid. Based on these observations, Yan et al. (2001)
proposed a model whereby trophoblast stem cells first differentiate to a bipotent
precursor cell that may then form either trophoblast giant cells or spongiotrophoblast
cells. The idea that trophoblast giant cells may directly differentiate from a progenitor
cell is not entirely improbable; mural trophectoderm cells do not express Tpbpa prior to
forming primary trophoblast giant cells. It is therefore possible that some of the cells in
the ectoplacental cone are a bipotent precursor population that can differentiate to give
rise to spongiotrophoblast or trophoblast giant cells.
2.4.6 The cells lining maternal blood spaces are predominantly secondary
trophoblast giant cells
One of the observations made during this study was that trophoblast giant cells that
arose from the differentiation of cells that had previously expressed Tpbpa were often
associated with maternal blood. This association was seen both within the labyrinth,
where these cells were observed lining large maternal blood spaces, as well as in the
decidua where these cells were observed lining the maternal spiral arteries.
Maternal blood spaces within the labyrinth are lined by trophoblast cells rather than
the endothelial cells that are typical in most mammals; this type of placenta is referred to
as ‘hemochorial’ (Wooding, 1994). The origin of these cells lining the maternal blood
spaces has remained unclear, however the arrangement of these cells is highly ordered.
The smaller maternal sinusoid spaces in the labyrinth are partitioned from each other by
three cell layers; the innermost layer lining the lumen has been described as cuboidal
mononuclear cells, while the two outer layers are composed of multinucleated
syncytiotrophoblast cells (Adamson et al., 2002). These small maternal sinusoid spaces
could not readily be identified on histological sections and were therefore not included in
the quantification. Previous studies have indicated that the maternal sinusoid blood
spaces in the labyrinth are only readily observed in histological sections when the
maternal arterial flow is ligated before fixation, as these small blood spaces collapse

75
during fixation (Adamson et al., 2002). As this procedure was not followed for this
study, the maternal sinusoid spaces were not readily identifiable.
In this study, greater than 80% of the cells directly lining the lumen of the large
maternal blood spaces in the labyrinth at E14.5 were hPLAP positive in Lines 3 and 4,
which were combined due to their similar transgene expression patterns. For Line 5,
virtually all (95.5%) of the cells directly lining the maternal blood spaces at E14.5 were
hPLAP positive. Again, this difference probably arises from the earlier onset of
transgene expression in these lines, resulting in a larger population of labelled cells.
These hPLAP positive cells also expressed either Plf or Tpbpa. For Line 5, these were
the only expression patterns observed. In Lines 3 and 4, some cells were observed that
expressed only one of hPLAP, Tpbpa or Plf.
These observations suggest that cells derived from the EPC become distributed
throughout the labyrinth region of the placenta as part of the rearrangement of trophoblast
cells that occurs to shape the maternal blood spaces. These cells line the maternal blood
spaces in the central arterial canal and the venous channels, and are a mixture of
trophoblast giant cells and spongiotrophoblast cells. Due to the small numbers observed
in this study, a more detailed examination of this cell lineage question should be
undertaken to confirm the results. The presence of cells derived from the EPC within the
labyrinth supports the suggestion that spongiotrophoblast morphogenesis is important for
the proper development of the labyrinth layer. The rearrangement of EPC-derived
trophoblast cells to generate maternal blood spaces within the labyrinth may be involved
in establishing the pattern of fetal blood flow into the labyrinth, by physically restricting
the domains into which fetal blood vessels can grow.
In this study, greater than 75% of the trophoblast cells directly lining the lumen of
maternal spiral arteries within the maternal decidua were positive for hPLAP expression
in all three lines, indicating that they had at one point expressed Tpbpa. A proportion of
these cells also expressed the trophoblast giant cell marker, Plf. In Lines 3 and 4, which
were grouped together based on their similar transgene expression pattern, this proportion
was significantly lower than that observed for Line 5. This difference is likely due to the
earlier onset of transgene expression in Line 5, resulting in a larger population of cells

76
that have undergone excision. A small proportion of cells (<5%) in all three lines were
also positive for Plf alone, although this may simply be an artefact of the method as these
cells may not have been included in the hPLAP expressing population due to the stringent
inclusion of only cells that were essentially completely bound by hPLAP expression.
Alternately, the cells may not have been perfectly correlated on the serial sections from
one slide to the next, resulting in slight differences in marker assignment between slides.
The Plf expressing cells lining maternal spiral arteries were not readily identifiable
as trophoblast giant cells. Rather than the large cell and nuclear size characteristic of this
cell type, these cells were elongated and had smaller nuclei. Interestingly, a significantly
higher proportion of the hPLAP positive cells lining the maternal spiral arteries in Lines 3
and 4 were also Tpbpa positive. Line 5 had very few cells demonstrating the expression
of these two markers together.
Previous studies have shown that trophoblast giant cells line the spiral arteries
within the maternal decidua region of the placenta as early as E8.5 (Hemberger et al.,
2003). This association occurred only within 150-300 µm from the main trophoblast giant
cell layer, and the trophoblast giant cells were only seen closely associated to the spiral
arteries. Based on this observation, it was suggested that trophoblast giant cells invade
into the maternal spiral arteries by an endovascular route (Adamson et al., 2002). A more
detailed study of the endovascular invasion described invasion of trophoblast giant cells
into the maternal spiral arteries as early as E8.5 (Hemberger et al., 2003). These cells
were shown to interact with and replace the endothelial lining of the spiral artery;
proximal to the main trophoblast giant layer spiral arteries were almost completely
enclosed by Plf positive cells while further away fewer Plf positive cells were observed
with an increase in endothelial cells. Of note, the Plf positive trophoblast giant cells did
not have the typical large nucleus and cell size usually associated with this cell type, but
rather had a spindle-like appearance and smaller nuclei (Hemberger et al., 2003). This is
in agreement with the morphology observed in this study.
Given that endovascular trophoblast giant cell invasion of the maternal spiral
arteries has occurred by E8.5, these cells likely arise from the secondary giant cell
population that begins to differentiate by E6.5 (Carney et al., 1993). The results of this

77
study, as well as previous studies (Adamson et al., 2002; Hemberger et al., 2003), suggest
that trophoblast giant cells at the tip of the EPC invade into the maternal spiral arteries as
they enter the EPC, replacing the endothelial lining. The loss of this endothelial lining
results in a loss of maternal control over vasoconstriction and therefore increased blood
flow to the implantation site (Hemberger et al., 2003). Trophoblast giant cells also
produce and release several angiogenic factors, such as VEGF (vascular endothelial
growth factor) and Plf, which are believed to promote the growth of new vessels into the
implantation site (Adamson et al., 2002). These results suggest that secondary
trophoblast giant cells that have differentiated from the EPC, invade into the maternal
spiral arteries where they line the arteries, increasing blood flow to the implantation site
through the loss of endothelial lining.
The actual route of invasion by trophoblast giant cells into the maternal spiral
arteries is unclear based on the results of this study. Another form of invasive cell is
observed in the maternal decidua beginning at E12.5, when glycogen trophoblast cells
begin to invade into the decidua in an interstitial pattern (Adamson et al., 2002). It is
possible that cells lining the maternal arteries at E14.5 invade into the decidua
interstitially first, with the glycogen trophoblast cells and then move into the spiral
arteries, displacing the endothelial lining. However, two observations suggest that this is
not the case. First, previous work demonstrated that secondary trophoblast giant cells are
associated with maternal spiral arteries as early as E8.5, and have already invaded to a
depth as great as 300 µm (Hemberger et al., 2003). Interstitial invasion of glycogen
trophoblast cells is not observed until E12.5, after endovascular invasion seems to be
complete. Also, cells expressing trophoblast giant cell markers have not been seen in the
decidua, except in association with the maternal spiral arteries (Adamson et al., 2002;
Hemberger et al., 2003). Second, the results of this study show that for Line 5, a greater
proportion of the cells lining the maternal spiral arteries are expressing both the lineage
marker hPLAP and the trophoblast giant cell marker when compared to the same
population in Lines 3 and 4. If the endovascular invading cells first followed a route of
interstitial invasion, these would all have passed through a ‘glycogen trophoblast-like’
stage, during which Tpbpa would be expressed and these cells would have undergone

78
Cre-mediated recombination. If this were the case, we would not expect to see a
difference between the lines with respect to the proportions of trophoblast giant cells that
had undergone recombination. Based on these two lines of evidence, it is unlikely that
endovascular cells invade interstitially prior to invading into the maternal spiral arteries,
but rather they invade in a solely endovascular pattern.

79
CHAPTER THREE:
FUTURE DIRECTIONS

80
3.1 Future Direction 1: Cell Lineage Tracing at Earlier Developmental Stages
Detailed analysis of cell lineage at E14.5 revealed that Tpbpa-expressing cells
within the EPC can contribute to the secondary trophoblast giant cell population, and that
these cells are involved in the process of endovascular invasion of the maternal spiral
arteries. As a mature placenta has formed by E10.5, and is completely vascularized by
this point (Adamson et al., 2002; Cross et al., 2002b), it is clear that endovascular
invasion occurs much earlier in development than we have examined. Previous work has
identified trophoblast giant cells associated with maternal spiral arteries as early as E8.5
(Hemberger et al., 2003). Detailed analysis of cell lineage prior to the establishment of a
mature placenta, using the same methods described in this study, may allow for a clearer
picture of endovascular invasion to be determined. If the endovascular invading cells
invade directly into the maternal spiral arteries from the tip of the EPC, one would expect
to see hPLAP and Plf co-expressing cells in the maternal decidua only in association with
the spiral arteries. If the endovascular trophoblast cells invade interstitially prior to
interacting with the maternal spiral arteries, one would expect to see cells expressing
hPLAP in the decidua in locations other than in strict association with the maternal spiral
arteries. These cells would not be expected to express the trophoblast giant cell marker at
this point, as markers for this cell type have not been detected in the interstitial regions of
the decidua.
Another question which may be addressed with cell lineage tracing at earlier stages
is the manner in which differentiation to form secondary trophoblast giant cells proceeds.
In the present study, it was apparent that some of the cells expressing Tpbpa differentiate
to and form trophoblast giant cells and in doing so turn off Tpbpa expression. This
pattern of gene expression has been observed in explant cultures of extraembryonic
ectoderm (Carney et al., 1993) and trophoblast stem cell cultures (Tanaka et al., 1998),
where differentiating cells passed through a stage where they expressed Tpbpa prior to
trophoblast giant cell differentiation. Also, occasional cells were observed that expressed
both Tpbpa and Plf, or Cre and Plf. These cells were very rare, and are not likely
representative of a normal expression pattern. Plf is one of the earliest markers of

81
trophoblast giant cell differentiation (Carney et al., 1993), and so it is possible that
expression is downregulated coincident with giant cell differentiation. This could
account for a small number of cells that express Tpbpa and Plf, if these represent the
earliest stage in differentiation. If this is the case, Tpbpa and Plf co-expressing cells
would be more common during the early stages of secondary trophoblast giant cell
differentiation. We are currently examining the question of cell lineage at E9.5 using the
same approach described in this study, to address the questions outlined in this section.
3.2 Future Direction 2: Lineage Tracing of Trophoblast Stem Cells in vivo
Given that trophoblast stem cells have not been isolated from EPC cells (Uy et al.,
2002) it was not surprising to find that Tpbpa-expressing cells do not contribute
significantly to the labyrinth layer. However, trophoblast stem cells have been isolated
from the extraembryonic ectoderm (Tanaka et al., 1998; Uy et al., 2002) and from its
derivative, the chorionic ectoderm, as late as the 9 somite pair stage (approximately E8.0
8.5) (Uy et al., 2002). These observations would suggest that the major proliferative
population of the developing placenta resides within this tissue. However, in vivo
evidence for this is lacking. Additionally, when extraembryonic ectoderm cells are
placed in culture, these cells pass through an EPC-like stage prior to differentiating to
form trophoblast giant cells (Carney et al., 1993). Although it seems unlikely that
extraembryonic ectoderm contributes to the trophoblast giant cell population in vivo, it
has been suggested that the ability of trophoblast stem cells to form trophoblast giant
cells throughout pregnancy may represent a mechanism to ensure that an adequate level
of hormone production is maintained by this cell type (Carney et al., 1993).
A similar approach to lineage tracing as was undertaken in this study could be used
to address the question of trophoblast stem cell proliferation. This would require the
generation of mice in which Cre recombinase is expressed specifically within the
extraembryonic ectoderm/chorionic ectoderm population. In order to generate such
mice, a promoter region driving specific expression only to these tissues, or at least
exclusively to these tissues in the extraembryonic compartment, would be required.
Although many genes are known to be expressed within the extraembryonic ectoderm
and chorion, few of these are restricted to this compartment or expressed throughout the

82
compartment. There is one gene that meets these requirements, the orphan nuclear
receptor Esrrb (estrogen-related receptor beta). Esrrb is expressed in a subset of cells of
the extraembryonic ectoderm by E5.5 and this expression becomes more widespread
throughout the extraembryonic ectoderm by E6.0 (Luo et al., 1997). As development
proceeds, expression remains limited to the ectodermal regions which form the chorion at
E6.5. Expression of Esrrb is detectable throughout the chorion at E7.5, but this
expression decreases as chorioallantoic attachment occurs, and by E8.5 expression of
Esrrb is only observed at the lateral edges of the chorion that are not in contact with the
allantois (Luo et al., 1997). Esrrb is also expressed in undifferentiated trophoblast stem
cells in vitro (Tanaka et al., 1998). Expression of Esrrb has also been observed in the
primordial germ cells of the developing embryo from E11.5 to E14.5 in females and
E15.5 in males, at which point the expression diminishes (Mitsunaga et al., 2004).
Postnatally, expression was observed in spermatogonia at postnatal day 7 (Mitsunaga et
al., 2004).
Expression of Esrrb in the embryo should not impede the use of the regulatory
regions of this gene to study cell lineage of the extraembryonic ectoderm and chorion, as
the expression in the primordial germ cells begins after the expression in the
extraembryonic tissues has already disappeared. Additionally, cells in the developing
embryo would not affect the outcome of cell lineage tracing questions in the
extraembryonic tissues. However, if the mice were to be used for the conditional
alteration of the genome, the other sites of expression may become significant.
There is one major shortcoming to the suggested use of the Esrrb promoter region
to drive Cre expression in transgenic mice, as was done in this study. Although the
chromosomal location of the gene has been mapped (Sladek et al., 1997), little work has
been done to characterize the regulatory regions controlling the expression of Esrrb.
These regulatory regions would have to be identified, and tested for their ability to direct
expression in transgenic mice, which would require a great deal of work.
An alternative approach would be to insert the Cre recombinase coding region into
the Esrrb locus using homologous recombination in ES cells (Doetschman et al., 1987).
This would generate mice in which the Cre recombinase is under the direct control of the

83
endogenous regulatory elements of Esrrb. Stable cell lines that have undergone the
desired homologous recombination reaction could then be used to generate chimaeric
mice by ES cell/embryo aggregation (Tanaka et al., 2001; Wood et al., 1993). If this
approach were chosen, the targeted locus would likely have to be maintained in a
heterozygous state. This is because the Esrrb gene would not be expressed from the
targeted allele, and embryos homozygous for a targeted disruption of the Esrrb died by
E10.5 due to placental defects (Luo et al., 1997). Once the Esrrb-Cre mice were
generated, full characterization of the transgene expression would have to be carried out
to validate the expression pattern prior to using the mice for lineage tracing experiments.
Cell lineage tracing experiments such as the ones described in this study could then
be undertaken to examine the contribution of Esrrb expressing cells to the different layers
of the mature placenta. The localization of a reporter to different cell types would
identify the in vivo ability of extraembryonic ectoderm and later the chorion, to contribute
to the labyrinth, the spongiotrophoblast and the trophoblast giant cell layer, to verify the
in vitro studies that have been done.
3.3 Future Direction 3: Applications of Tpbpa-CIG mice
The characterization of the Tpbpa-CIG transgenic mice revealed that one of the
three lines recapitulates the normal expression of the Tpbpa gene in the developing
placenta. The transgene is expressed in diploid precursor cells in the EPC by E8.5, and
by E11.5 is restricted to the spongiotrophoblast layer of the mature placenta. The
confirmation that the transgene follows this pattern of expression indicates that these
mice will be useful in the study of placental defects, by allowing for the generation of
spongiotrophoblast-specific genome alterations. Many genes have been identified that
result in embryonic lethal phenotypes when knocked out, often as a result of placental
defects. A few specific examples of these will be discussed here, in the context of
utilizing the Tpbpa-CIG to further examine the phenotypes observed in knockout
animals.
Cited1 is a transcriptional cofactor that is expressed in all the trophoblast derivates
in the placenta (Rodriguez et al., 2004). The Cited1 protein is largely located in the
nucleus of spongiotrophoblast and trophoblast giant cells, but is located through the cell

84
in both the cuboidal cells and syncytiotrophoblast of the labyrinth. Cited1 was knocked
out in all cell types using Cre-loxP technology (Rodriguez et al., 2004). Examination of
the resultant conceptuses revealed that placental organization was disrupted in Cited1
null animals (Rodriguez et al., 2004). Notably, there was an increase in the
spongiotrophoblast layer with a concomitant decrease in the labyrinth layer. The
organization of the spongiotrophoblast was irregular, with larger projections into the
labyrinth. The labyrinth layer demonstrated defects in maternal blood spaces; the
maternal sinusoids were less branched and had a larger diameter than wild type controls,
and the result was a decreased surface for exchange with fetal vessels due to the
discrepancy in size between the two blood spaces (Rodriguez et al., 2004). Rodriguez et
al. (2004) suggest that the abnormal spongiotrophoblast arrangement may affect the
development of the labyrinth either physically, by inhibiting branching of the maternal
blood spaces by taking up physical space within the labyrinth, or molecularly, by
secreting one or more factors which inhibit the normal behaviour of these cells
(Rodriguez et al., 2004).
As a floxed allele of Cited1 has already been prepared, this could be used to
generate mice in which Cited1 is inactivated only in the spongiotrophoblast layer of the
placenta by crossing these mice to the Tpbpa-CIG mice. Although this approach may not
clarify the question of whether the abnormal spongiotrophoblast arrangement results in
labyrinth defects by a physical or molecular means, it would identify whether Cited1 is
required cell autonomously within the labyrinth layer, perhaps ruling out either
possibility. If removing Cited1 expression from the spongiotrophoblast cells restores
normal labyrinth morphology, this would indicate that the defect observed in the
labyrinth layer is a cell autonomous effect caused by the loss of Cited1 in these cells. If
the labyrinth defects are still apparent, this would support the supposition that the
abnormal morphology of the spongiotrophoblast in the absence of Cited1 affects the
branching morphogenesis of the labyrinth.
Hypoxia inducible factor-1 (HIF-1) is a transcription factor composed of two
subunits, the HIF-1a and aryl hydrocarbon receptor nuclear translocator (ARNT) basic
helix loop helix proteins. The role of HIF-1 has been assessed by knocking out each of

85
the subunits separately. If either HIF-1a (Iyer et al., 1998; Ryan et al., 1998) or ARNT
(Kozak et al., 1997) are knocked out, the embryos died in utero by E10.5 due primarily
due to placental defects. ARNT-deficient mice demonstrate a loss of fetal vessel invasion
with a related decrease in labyrinth formation and defects in spongiotrophoblast
maintenance (Adelman et al., 2000; Kozak et al., 1997). A floxed allele of ARNT has
been generated (Tomita et al., 2003) and could be useful in dissecting the role of ARNT in
the labyrinth. Generating mice in which ARNT expression is only knocked out in the
spongiotrophoblast could provide information about the nature of the defect in the
labyrinth, as described for Cited1 above.
There are many potential uses of the Tpbpa-CIG mice in studying placental
development. These mice would not just be useful for further examining the role of
genes which have already been knocked out throughout the placenta, but also for
studying the role of genes that are known to be expressed in the spongiotrophoblast.
3.4 Conclusions
There are many different directions in which future work can continue. Cell
lineage tracing of Tpbpa-expressing cells at earlier developmental stages will be
approached as a priority, to examine both the route of endovascular invasion and how cell
differentiation occurs within the EPC. Additional questions relating to cell lineage will
require the generation of transgenic mice expressing Cre recombinase in other cell
compartments, such as the extraembryonic ectoderm/chorion. Direct cell lineage tracing
in the placenta will be useful in clarifying the relationship between the three main cell
types of this tissue.
The Tpbpa-CIG mice can now be used with confidence to study cell specific
genome alteration in the placenta, simply by choosing the transgenic line that is
appropriate to the needs of the experiment. This will allow for the study of specific
genetic elements in the spongiotrophoblast layer.

86
References
Abe, M., and Oshima, R. (1990). A single human keratin 18 gene is expressed in diverse
epithelial cells of transgenic mice. J. Cell Biol. 111, 1197-1206.
Adamson, S. L., Lu, Y., Whiteley, K. J., Holmyard, D., Hemberger, M., Pfarrer, C., and
Cross, J. C. (2002). Interactions between trophoblast cells and the maternal and
fetal circulation in the mouse placenta. Dev Biol 250, 358-73.
Adelman, D. M., Gertsenstein, M., Nagy, A., Simon, M. C., and Maltepe, E. (2000).
Placental cell fates are regulated in vivo by HIF-mediated hypoxia responses.
Genes Dev 14, 3191-203.
Agah, R., Frenkel, P. A., French, B. A., Michael, L. H., Overbeek, P. A., and Schneider,
M. D. (1997). Gene recombination in postmitotic cells. Targeted expression of
Cre recombinase provokes cardiac-restricted, site-specific rearrangement in adult
ventricular muscle in vivo. J Clin Invest 100, 169-79.
Akagi, K., Sandig, V., Vooijs, M., Van der Valk, M., Giovannini, M., Strauss, M., and
Berns, A. (1997). Cre-mediated somatic site-specific recombination in mice.
Nucleic Acids Res 25, 1766-73
Amin, A., Roca, H., Luetke, K., and Sadowski, P. D. (1991). Synapsis, strand scission,
and strand exchange induced by the FLP recombinase: analysis with half-FRT
sites. Mol Cell Biol 11, 4497-508.
Beddington, R. S. (1982). An autoradiographic analysis of tissue potency in different
regions of the embryonic ectoderm during gastrulation in the mouse. J Embryol
Exp Morphol 69, 265-85.

87
Belteki, G., Gertsenstein, M., Ow, D. W., and Nagy, A. (2003). Site-specific cassette
exchange and germline transmission with mouse ES cells expressing phiC31
integrase. Nat Biotechnol 21, 321-4.
Blaise, S., de Parseval, N., Benit, L., and Heidmann, T. (2003). Genomewide screening
for fusogenic human endogenous retrovirus envelopes identifies syncytin 2, a
gene conserved on primate evolution. Proc Natl Acad Sci U S A 100, 13013-8.
Bloxham, P.A., Pugh, D.M., and Sharma, S.C. (1977). Abolition of the pre-implantation
surge of plasma oestrogens in mice with tamoxifen. Irc Med Sci Reprod Obstet
Gynecol 5, 432.
Branda, C. S., and Dymecki, S. M. (2004). Talking about a revolution: The impact of
site-specific recombinases on genetic analyses in mice. Dev Cell 6, 7-28.
Brocard, J., Warot, X., Wendling, O., Messaddeq, N., Vonesch, J. L., Chambon, P., and
Metzger, D. (1997). Spatio-temporally controlled site-specific somatic
mutagenesis in the mouse. Proc Natl Acad Sci U S A 94, 14559-63.
Buckley, R. H. (2004). Molecular defects in human severe combined immunodeficiency
and approaches to immune reconstitution. Annu Rev Immunol 22, 625-55.
Calzonetti, T., Stevenson, L., and Rossant, J. (1995). A novel regulatory region is
required for trophoblast-specific transcription in transgenic mice. Dev Biol 171,
615-26.
Carney, E. W., Prideaux, V., Lye, S. J., and Rossant, J. (1993). Progressive expression of
trophoblast-specific genes during formation of mouse trophoblast giant cells in
vitro. Mol Reprod Dev 34, 357-68.

88
Chang, C., Chen, P. T., Chang, G. D., Huang, C. J., and Chen, H. (2004). Functional
Characterization of the Placental Fusogenic Membrane Protein Syncytin. Biol
Reprod.
Cheon, Y. P., DeMayo, F. J., Bagchi, M. K., and Bagchi, I. C. (2004). Induction of
cytotoxic T-lymphocyte antigen-2beta, a cysteine protease inhibitor in decidua: a
potential regulator of embryo implantation. J Biol Chem 279, 10357-63.
Cinato, E., Mirotsou, M., and Sablitzky, F. (2001). Cre-mediated transgene activation in
the developing and adult mouse brain. Genesis 31, 118-25.
Clark, A. F., Sharp, M. G. F., Morley, S. D., Fleming, S., Peters, J., and Mullins, J. J.
(1997). Renin-1 Is Essential for Normal Renal Juxtaglomerular Cell Granulation
and Macula Densa Morphology. J. Biol. Chem. 272, 18185-18190.
Colosi, P., Talamantes, F., and Linzer, D. I. (1987). Molecular cloning and expression of
mouse placental lactogen I complementary deoxyribonucleic acid. Mol
Endocrinol 1, 767-76.
Conley, A., and Hinshelwood, M. (2001). Mammalian aromatases. Reproduction 121,
685-95.
Copp, A. J. (1979). Interaction between inner cell mass and trophectoderm of the mouse
blastocyst. II. The fate of the polar trophectoderm. J Embryol Exp Morphol 51,
109-20.
Copp, A. J. (1995). Death before birth: clues from gene knockouts and mutations. Trends
Genet 11, 87-93.

89
Cross, J. C. (1998). Formation of the placenta and extraembryonic membranes. Ann N Y
Acad Sci 857, 23-32.
Cross, J. C. (2000). Genetic insights into trophoblast differentiation and placental
morphogenesis. Semin Cell Dev Biol 11, 105-13.
Cross, J. C., Anson-Cartwright, L., and Scott, I. C. (2002a). Transcription factors
underlying the development and endocrine functions of the placenta. Recent Prog
Horm Res 57, 221-34.
Cross, J. C., Baczyk, D., Dobric, N., Hemberger, M., Hughes, M., Simmons, D. G.,
Yamamoto, H., and Kingdom, J. C. (2003). Genes, development and evolution of
the placenta. Placenta 24, 123-30.
Cross, J. C., Hemberger, M., Lu, Y., Nozaki, T., Whiteley, K., Masutani, M., and
Adamson, S. L. (2002b). Trophoblast functions, angiogenesis and remodeling of
the maternal vasculature in the placenta. Mol Cell Endocrinol 187, 207-12.
Cross, J. C., Werb, Z., and Fisher, S. J. (1994). Implantation and the placenta: key pieces
of the development puzzle. Science 266, 1508-18.
Cruz, Y. P., and Pedersen, R. A. (1985). Cell fate in the polar trophectoderm of mouse
blastocysts as studied by microinjection of cell lineage tracers. Dev Biol 112, 73
83.
Delaria, K., Fiorentino, L., Wallace, L., Tamburini, P., Brownell, E., and Muller, D.
(1994). Inhibition of cathepsin L-like cysteine proteases by cytotoxic T-
lymphocyte antigen-2 beta. J Biol Chem 269, 25172-7.

90
Deussing, J., Kouadio, M., Rehman, S., Werber, I., Schwinde, A., and Peters, C. (2002).
Identification and characterization of a dense cluster of placenta-specific cysteine
peptidase genes and related genes on mouse chromosome 13. Genomics 79, 225
40.
Doetschman, T., Gregg, R. G., Maeda, N., Hooper, M. L., Melton, D. W., Thompson, S.,
and Smithies, O. (1987). Targetted correction of a mutant HPRT gene in mouse
embryonic stem cells. Nature 330, 576-8.
Downs, K. M. (1998). The murine allantois. Curr Top Dev Biol 39, 1-33.
Dragatsis, I., and Zeitlin, S. (2000). CaMKIIalpha-Cre transgene expression and
recombination patterns in the mouse brain. Genesis 26, 133-5.
Escalante-Alcalde, D., Recillas-Targa, F., Hernandez-Garcia, D., Castro-Obregon, S.,
Terao, M., Garattini, E., and Covarrubias, L. (1996). Retinoic acid and
methylation cis-regulatory elements control the mouse tissue non-specific alkaline
phosphatase gene expression. Mech Dev 57, 21-32.
Fabian, J. R., Field, L. J., McGowan, R. A., Mullins, J. J., Sigmund, C. D., and Gross, K.
W. (1989). Allele-specific expression of the murine Ren-1 genes. J Biol Chem
264, 17589-94.
Faria, T. N., Ogren, L., Talamantes, F., Linzer, D. I., and Soares, M. J. (1991).
Localization of placental lactogen-I in trophoblast giant cells of the mouse
placenta. Biol Reprod 44, 327-31.

91
Feil, R., Brocard, J., Mascrez, B., LeMeur, M., Metzger, D., and Chambon, P. (1996).
Ligand-activated site-specific recombination in mice. Proc Natl Acad Sci U S A
93, 10887-90.
Fleming, T. P. (1987). A quantitative analysis of cell allocation to trophectoderm and
inner cell mass in the mouse blastocyst. Dev Biol 119, 520-31.
Friedrich, G., and Soriano, P. (1991). Promoter traps in embryonic stem cells: a genetic
screen to identify and mutate developmental genes in mice. Genes Dev 5, 1513
23.
Gossen, M., and Bujard, H. (1992). Tight control of gene expression in mammalian cells
by tetracycline-responsive promoters. Proc Natl Acad Sci U S A 89, 5547-51.
Graham, C. F., and Deussen, Z. A. (1978). Features of cell lineage in preimplantation
mouse development. J Embryol Exp Morphol 48, 53-72.
Groth, A. C., Olivares, E. C., Thyagarajan, B., and Calos, M. P. (2000). A phage
integrase directs efficient site-specific integration in human cells. Proc Natl Acad
Sci U S A 97, 5995-6000.
Guillemot, F., Nagy, A., Auerbach, A., Rossant, J., and Joyner, A. L. (1994). Essential
role of Mash-2 in extraembryonic development. Nature 371, 333-6.
Gustafsson, E., Brakebusch, C., Hietanen, K., and Fassler, R. (2001). Tie-1-directed
expression of Cre recombinase in endothelial cells of embryoid bodies and
transgenic mice. J Cell Sci 114, 671-6.

92
Hanssens, M., Vercruysse, L., Keirse, M. J., Pijnenborg, R., and Van Assche, F. A.
(1995). Identification of 'renin'-containing cells in the choriodecidua. Placenta 16,
517-25.
Harada, N., Yoshimura, N., and Honda, S. (2003). Unique regulation of expression of
human aromatase in the placenta. J Steroid Biochem Mol Biol 86, 327-34.
Hasan, M. T., Schonig, K., Berger, S., Graewe, W., and Bujard, H. (2001). Long-term,
noninvasive imaging of regulated gene expression in living mice. Genesis 29,
116-22.
Hayashi, S., and McMahon, A. P. (2002). Efficient recombination in diverse tissues by a
tamoxifen-inducible form of Cre: a tool for temporally regulated gene
activation/inactivation in the mouse. Dev Biol 244, 305-18.
He, Y., Smith, S. K., Day, K. A., Clark, D. E., Licence, D. R., and Charnock-Jones, D. S.
(1999). Alternative splicing of vascular endothelial growth factor (VEGF)-R1
(FLT-1) pre-mRNA is important for the regulation of VEGF activity. Mol
Endocrinol 13, 537-45.
Hemberger, M., Nozaki, T., Masutani, M., and Cross, J. C. (2003). Differential
expression of angiogenic and vasodilatory factors by invasive trophoblast giant
cells depending on depth of invasion. Dev Dyn 227, 185-91.
Hesse, M., Franz, T., Tamai, Y., Taketo, M. M., and Magin, T. M. (2000). Targeted
deletion of keratins 18 and 19 leads to trophoblast fragility and early embryonic
lethality. Embo J 19, 5060-70.
93
Hoess, R., Abremski, K., and Sternberg, N. (1984). The nature of the interaction of the P1
recombinase Cre with the recombining site loxP. Cold Spring Harb Symp Quant
Biol 49, 761-8.
Hoess, R. H., and Abremski, K. (1984). Interaction of the bacteriophage P1 recombinase
Cre with the recombining site loxP. Proc Natl Acad Sci U S A 81, 1026-9.
Hoess, R. H., Ziese, M., and Sternberg, N. (1982). P1 site-specific recombination:
nucleotide sequence of the recombining sites. Proc Natl Acad Sci U S A 79, 3398
402.
Hornbruch, A., Summerbell, D., and Wolpert, L. (1979). Somite formation in the early
chick embryo following grafts of Hensen's node. J Embryol Exp Morphol 51, 51
62.
Hoshi, K., Amizuka, N., Oda, K., Ikehara, Y., and Ozawa, H. (1997).
Immunolocalization of tissue non-specific alkaline phosphatase in mice.
Histochem Cell Biol 107, 183-91.
Huang, Z. J., Yu, W., Lovett, C., and Tonegawa, S. (2002). Cre/loxP recombination-
activated neuronal markers in mouse neocortex and hippocampus. Genesis 32,
209-17.
Ihara, Y., Taii, S., and Mori, T. (1987). Expression of renin and angiotensinogen genes in
the human placental tissues. Endocrinol Jpn 34, 887-96.
Indra, A. K., Warot, X., Brocard, J., Bornert, J. M., Xiao, J. H., Chambon, P., and
Metzger, D. (1999). Temporally-controlled site-specific mutagenesis in the basal
layer of the epidermis: comparison of the recombinase activity of the tamoxifen

94
inducible Cre-ER(T) and Cre-ER(T2) recombinases. Nucleic Acids Res 27, 4324
7.
Iwatsuki, K., Shinozaki, M., Sun, W., Yagi, S., Tanaka, S., and Shiota, K. (2000). A
novel secretory protein produced by rat spongiotrophoblast. Biol Reprod 62,
1352-9.
Iyer, N. V., Kotch, L. E., Agani, F., Leung, S. W., Laughner, E., Wenger, R. H.,
Gassmann, M., Gearhart, J. D., Lawler, A. M., Yu, A. Y., and Semenza, G. L.
(1998). Cellular and developmental control of O2 homeostasis by hypoxia-
inducible factor 1 alpha. Genes Dev 12, 149-62.
Jackson, L. L., Colosi, P., Talamantes, F., and Linzer, D. I. (1986). Molecular cloning of
mouse placental lactogen cDNA. Proc Natl Acad Sci U S A 83, 8496-500.
Jones, C. A., Hurley, M. I., Black, T. A., Kane, C. M., Pan, L., Pruitt, S. C., and Gross, K.
W. (2000). Expression of a renin/GFP transgene in mouse embryonic, extra
embryonic, and adult tissues. Physiol Genomics 4, 75-81.
Jones, C. A., Sigmund, C. D., McGowan, R. A., Kane-Haas, C. M., and Gross, K. W.
(1990). Expression of murine renin genes during fetal development. Mol
Endocrinol 4, 375-83.
Kamat, A., Graves, K. H., Smith, M. E., Richardson, J. A., and Mendelson, C. R. (1999).
A 500-bp region, approximately 40 kb upstream of the human CYP19 (aromatase)
gene, mediates placenta-specific expression in transgenic mice. Proc Natl Acad
Sci U S A 96, 4575-80.

95
Kawamoto, S., Niwa, H., Tashiro, F., Sano, S., Kondoh, G., Takeda, J., Tabayashi, K.,
and Miyazaki, J. (2000). A novel reporter mouse strain that expresses enhanced
green fluorescent protein upon Cre-mediated recombination. FEBS Lett 470, 263
8.
Kellendonk, C., Tronche, F., Monaghan, A. P., Angrand, P. O., Stewart, F., and Schutz,
G. (1996). Regulation of Cre recombinase activity by the synthetic steroid RU
486. Nucleic Acids Res 24, 1404-11.
Kisanuki, Y. Y., Hammer, R. E., Miyazaki, J., Williams, S. C., Richardson, J. A., and
Yanagisawa, M. (2001). Tie2-Cre transgenic mice: a new model for endothelial
cell-lineage analysis in vivo. Dev Biol 230, 230-42.
Kistner, A., Gossen, M., Zimmermann, F., Jerecic, J., Ullmer, C., Lubbert, H., and
Bujard, H. (1996). Doxycycline-mediated quantitative and tissue-specific control
of gene expression in transgenic mice. Proc Natl Acad Sci U S A 93, 10933-8.
Komminoth, P., Merk, F. B., Leav, I., Wolfe, H. J., and Roth, J. (1992). Comparison of
35S- and digoxigenin-labeled RNA and oligonucleotide probes for in situ
hybridization. Expression of mRNA of the seminal vesicle secretion protein II and
androgen receptor genes in the rat prostate. Histochemistry 98, 217-28.
Kozak, K. R., Abbott, B., and Hankinson, O. (1997). ARNT-deficient mice and placental
differentiation. Dev Biol 191, 297-305.
Lan, Z. J., Xu, X., and Cooney, A. J. (2004). Differential oocyte-specific expression of
Cre recombinase activity in GDF-9-iCre, Zp3cre, and Msx2Cre transgenic mice.
Biol Reprod 71, 1469-74.
96
Lawson, K. A., Meneses, J. J., and Pedersen, R. A. (1991). Clonal analysis of epiblast
fate during germ layer formation in the mouse embryo. Development 113, 891
911.
Lawson, K. A., and Pedersen, R. A. (1992). Clonal analysis of cell fate during
gastrulation and early neurulation in the mouse. Ciba Found Symp 165, 3-21;
discussion 21-6.
Le Du, M. H., and Millan, J. L. (2002). Structural evidence of functional divergence in
human alkaline phosphatases. J Biol Chem 277, 49808-14.
Lemischka, I. R., Raulet, D. H., and Mulligan, R. C. (1986). Developmental potential and
dynamic behavior of hematopoietic stem cells. Cell 45, 917-27.
Lescisin, K. R., Varmuza, S., and Rossant, J. (1988). Isolation and characterization of a
novel trophoblast-specific cDNA in the mouse. Genes Dev 2, 1639-46.
Linzer, D. I., Lee, S. J., Ogren, L., Talamantes, F., and Nathans, D. (1985). Identification
of proliferin mRNA and protein in mouse placenta. Proc Natl Acad Sci U S A 82,
4356-9.
Lo, C. W., Coulling, M., and Kirby, C. (1987). Tracking of mouse cell lineage using
microinjected DNA sequences: analyses using genomic Southern blotting and
tissue-section in situ hybridizations. Differentiation 35, 37-44.
Lobe, C. G., Koop, K. E., Kreppner, W., Lomeli, H., Gertsenstein, M., and Nagy, A.
(1999). Z/AP, a double reporter for cre-mediated recombination. Dev Biol 208,
281-92.

97
Logie, C., and Stewart, A. F. (1995). Ligand-regulated site-specific recombination. Proc
Natl Acad Sci U S A 92, 5940-4.
Lomeli, H., Ramos-Mejia, V., Gertsenstein, M., Lobe, C. G., and Nagy, A. (2000).
Targeted insertion of Cre recombinase into the TNAP gene: excision in
primordial germ cells. Genesis 26, 116-7.
Lu, X. J., Deb, S., and Soares, M. J. (1994). Spontaneous differentiation of trophoblast
cells along the spongiotrophoblast cell pathway: expression of members of the
placental prolactin gene family and modulation by retinoic acid. Dev Biol 163, 86
97.
Luo, J., Sladek, R., Bader, J. A., Matthyssen, A., Rossant, J., and Giguere, V. (1997).
Placental abnormalities in mouse embryos lacking the orphan nuclear receptor
ERR-beta. Nature 388, 778-82.
MacGregor, G. R., Zambrowicz, B. P., and Soriano, P. (1995). Tissue non-specific
alkaline phosphatase is expressed in both embryonic and extraembryonic lineages
during mouse embryogenesis but is not required for migration of primordial germ
cells. Development 121, 1487-96.
Magin, T. M., Schroder, R., Leitgeb, S., Wanninger, F., Zatloukal, K., Grund, C., and
Melton, D. W. (1998). Lessons from Keratin 18 Knockout Mice: Formation of
Novel Keratin Filaments, Secondary Loss of Keratin 7 and Accumulation of
Liver-specific Keratin 8-Positive Aggregates. J. Cell Biol. 140, 1441-1451.

98
Mao, X., Fujiwara, Y., Chapdelaine, A., Yang, H., and Orkin, S. H. (2001). Activation of
EGFP expression by Cre-mediated excision in a new ROSA26 reporter mouse
strain. Blood 97, 324-6.
McLeod, M., Craft, S., and Broach, J. R. (1986). Identification of the crossover site
during FLP-mediated recombination in the Saccharomyces cerevisiae plasmid 2
microns circle. Mol Cell Biol 6, 3357-67.
Metzger, D., Clifford, J., Chiba, H., and Chambon, P. (1995). Conditional site-specific
recombination in mammalian cells using a ligand-dependent chimeric Cre
recombinase. Proc Natl Acad Sci U S A 92, 6991-5.
Mi, S., Lee, X., Li, X., Veldman, G. M., Finnerty, H., Racie, L., LaVallie, E., Tang, X.
Y., Edouard, P., Howes, S., Keith, J. C., Jr., and McCoy, J. M. (2000). Syncytin is
a captive retroviral envelope protein involved in human placental morphogenesis.
Nature 403, 785-9.
Mitsunaga, K., Araki, K., Mizusaki, H., Morohashi, K., Haruna, K., Nakagata, N.,
Giguere, V., Yamamura, K., and Abe, K. (2004). Loss of PGC-specific expression
of the orphan nuclear receptor ERR-beta results in reduction of germ cell number
in mouse embryos. Mech Dev 121, 237-46.
Nagy, A. (2000). Cre recombinase: the universal reagent for genome tailoring. Genesis
26, 99-109.
Nagy, A., Gocza, E., Diaz, E. M., Prideaux, V. R., Ivanyi, E., Markkula, M., and Rossant,
J. (1990). Embryonic stem cells alone are able to support fetal development in the
mouse. Development 110, 815-21.

99
Niwa, H., Yamamura, K., and Miyazaki, J. (1991). Efficient selection for high-expression
transfectants with a novel eukaryotic vector. Gene 108, 193-9.
Novak, A., Guo, C., Yang, W., Nagy, A., and Lobe, C. G. (2000). Z/EG, a double
reporter mouse line that expresses enhanced green fluorescent protein upon Cre
mediated excision. Genesis 28, 147-55.
Ogata, S., Hayashi, Y., Takami, N., and Ikehara, Y. (1988). Chemical characterization of
the membrane-anchoring domain of human placental alkaline phosphatase. J.
Biol. Chem. 263, 10489-10494.
O'Gorman, S., Dagenais, N. A., Qian, M., and Marchuk, Y. (1997). Protamine-Cre
recombinase transgenes efficiently recombine target sequences in the male germ
line of mice, but not in embryonic stem cells. Proc Natl Acad Sci U S A 94,
14602-7.
Ogren, L., and Talamantes, F. (1988). Prolactins of pregnancy and their cellular source.
Int Rev Cytol 112, 1-65.
Oshima, R. G., Howe, W. E., Klier, F. G., Adamson, E. D., and Shevinsky, L. H. (1983).
Intermediate filament protein synthesis in preimplantation murine embryos. Dev
Biol 99, 447-55.
Parameswaran, M., and Tam, P. P. (1995). Regionalisation of cell fate and
morphogenetic movement of the mesoderm during mouse gastrulation. Dev Genet
17, 16-28.

100
Petrovic, N., Black, T. A., Fabian, J. R., Kane, C., Jones, C. A., Loudon, J. A., Abonia, J.
P., Sigmund, C. D., and Gross, K. W. (1996). Role of proximal promoter elements
in regulation of renin gene transcription. J Biol Chem 271, 22499-505.
Poisner, A. M., Wood, G. W., Poisner, R., and Inagami, T. (1981). Localization of renin
in trophoblasts in human chorion laeve at term pregnancy. Endocrinology 109,
1150-5.
Price, J. (1987). Retroviruses and the study of cell lineage. Development 101, 409-19.
Price, J., Turner, D., and Cepko, C. (1987). Lineage analysis in the vertebrate nervous
system by retrovirus-mediated gene transfer. Proc Natl Acad Sci U S A 84, 156
60.
Rodriguez, T. A., Sparrow, D. B., Scott, A. N., Withington, S. L., Preis, J. I., Michalicek,
J., Clements, M., Tsang, T. E., Shioda, T., Beddington, R. S. P., and Dunwoodie,
S. L. (2004). Cited1 Is Required in Trophoblasts for Placental Development and
for Embryo Growth and Survival. Mol. Cell. Biol. 24, 228-244.
Rossant, J., and Cross, J. C. (2001). Placental development: lessons from mouse mutants.
Nat Rev Genet 2, 538-48.
Rossant, J., and Tamura-Lis, W. (1981). Effect of culture conditions on diploid to giant-
cell transformation in postimplantation mouse trophoblast. J Embryol Exp
Morphol 62, 217-27.
Ryan, H. E., Lo, J., and Johnson, R. S. (1998). HIF-1 alpha is required for solid tumor
formation and embryonic vascularization. Embo J 17, 3005-15.
101
Sadowski, P. D. (1995). The Flp recombinase of the 2-microns plasmid of
Saccharomyces cerevisiae. Prog Nucleic Acid Res Mol Biol 51, 53-91.
Sauer, B., and Henderson, N. (1988). Site-specific DNA recombination in mammalian
cells by the Cre recombinase of bacteriophage P1. Proc Natl Acad Sci U S A 85,
5166-70.
Schwenk, F., Kuhn, R., Angrand, P. O., Rajewsky, K., and Stewart, A. F. (1998).
Temporally and spatially regulated somatic mutagenesis in mice. Nucleic Acids
Res 26, 1427-32.
Scott, I. C., Anson-Cartwright, L., Riley, P., Reda, D., and Cross, J. C. (2000). The
HAND1 basic helix-loop-helix transcription factor regulates trophoblast
differentiation via multiple mechanisms. Mol Cell Biol 20, 530-41.
Sharp, M. G. F., Fettes, D., Brooker, G., Clark, A. F., Peters, J., Fleming, S., and Mullins,
J. J. (1996). Targeted Inactivation of the Ren-2 Gene in Mice. Hypertension 28,
1126-1131.
Shaw, K. J., Do, Y. S., Kjos, S., Anderson, P. W., Shinagawa, T., Dubeau, L., and Hsueh,
W. A. (1989). Human decidua is a major source of renin. J Clin Invest 83, 2085
92.
Shi, D., Winston, J. H., Blackburn, M. R., Datta, S. K., Hanten, G., and Kellems, R. E.
(1997). Diverse genetic regulatory motifs required for murine adenosine
deaminase gene expression in the placenta. J Biol Chem 272, 2334-41.

102
Shida, M. M., Jackson-Grusby, L. L., Ross, S. R., and Linzer, D. I. (1992). Placental-
specific expression from the mouse placental lactogen II gene promoter. Proc
Natl Acad Sci U S A 89, 3864-8.
Shida, M. M., Ng, Y. K., Soares, M. J., and Linzer, D. I. (1993). Trophoblast-specific
transcription from the mouse placental lactogen-I gene promoter. Mol Endocrinol
7, 181-8.
Sigmund, C. D., and Gross, K. W. (1991). Structure, expression, and regulation of the
murine renin genes. Hypertension 18, 446-57.
Simmonds, H. A., Panayi, G. S., and Corrigall, V. (1978). A role for purine metabolism
in the immune response: Adenosine-deaminase activity and deoxyadenosine
catabolism. Lancet 1, 60-3.
Sladek, R., Beatty, B., Squire, J., Copeland, N. G., Gilbert, D. J., Jenkins, N. A., and
Giguere, V. (1997). Chromosomal mapping of the human and murine orphan
receptors ERRalpha (ESRRA) and ERRbeta (ESRRB) and identification of a
novel human ERRalpha-related pseudogene. Genomics 45, 320-6.
Smith, M. S. (1973). Changes in distribution of alkaline phosphatase during early
implantation and development of the mouse. Aust J Biol Sci 26, 209-17.
Smith, R. L., Geller, A. I., Escudero, K. W., and Wilcox, C. L. (1995). Long-term
expression in sensory neurons in tissue culture from herpes simplex virus type 1
(HSV-1) promoters in an HSV-1-derived vector. J Virol 69, 4593-9.
Soares, M. J. (2004). The prolactin and growth hormone families: pregnancy-specific
hormones/cytokines at the maternal-fetal interface. Reprod Biol Endocrinol 2, 51.

103
Soares, M. J., Muller, H., Orwig, K. E., Peters, T. J., and Dai, G. (1998). The
uteroplacental prolactin family and pregnancy. Biol Reprod 58, 273-84.
Sohal, D. S., Nghiem, M., Crackower, M. A., Witt, S. A., Kimball, T. R., Tymitz, K. M.,
Penninger, J. M., and Molkentin, J. D. (2001). Temporally regulated and tissue-
specific gene manipulations in the adult and embryonic heart using a tamoxifen
inducible Cre protein. Circ Res 89, 20-5.
Sola, C., Tronik, D., Dreyfus, M., Babinet, C., and Rougeon, F. (1989). Renin-promoter
SV40 large T-antigen transgenes induce tumors irrespective of normal cellular
expression of renin genes. Oncogene Res 5, 149-53.
Soriano, P. (1999). Generalized lacZ expression with the ROSA26 Cre reporter strain.
Nat Genet 21, 70-1.
Soriano, P., and Jaenisch, R. (1986). Retroviruses as probes for mammalian development:
allocation of cells to the somatic and germ cell lineages. Cell 46, 19-29.
Srinivas, S., Watanabe, T., Lin, C. S., William, C. M., Tanabe, Y., Jessell, T. M., and
Costantini, F. (2001). Cre reporter strains produced by targeted insertion of EYFP
and ECFP into the ROSA26 locus. BMC Dev Biol 1, 4.
Stanley, E. G., Biben, C., Elefanty, A., Barnett, L., Koentgen, F., Robb, L., and Harvey,
R. P. (2002). Efficient Cre-mediated deletion in cardiac progenitor cells conferred
by a 3'UTR-ires-Cre allele of the homeobox gene Nkx2-5. Int J Dev Biol 46, 431
9.

104
St-Onge, L., Furth, P. A., and Gruss, P. (1996). Temporal control of the Cre recombinase
in transgenic mice by a tetracycline responsive promoter. Nucleic Acids Res 24,
3875-7.
Tam, P. P., and Zhou, S. X. (1996). The allocation of epiblast cells to ectodermal and
germ-line lineages is influenced by the position of the cells in the gastrulating
mouse embryo. Dev Biol 178, 124-32.
Tanaka, M., Gertsenstein, M., Rossant, J., and Nagy, A. (1997). Mash2 acts cell
autonomously in mouse spongiotrophoblast development. Dev Biol 190, 55-65.
Tanaka, M., Hadjantonakis, A. K., and Nagy, A. (2001). Aggregation chimeras.
Combining ES cells, diploid and tetraploid embryos. Methods Mol Biol 158, 135
54.
Tanaka, S., Kunath, T., Hadjantonakis, A. K., Nagy, A., and Rossant, J. (1998).
Promotion of trophoblast stem cell proliferation by FGF4. Science 282, 2072-5.
Thorey, I. S., Meneses, J. J., Neznanov, N., Kulesh, D. A., Pedersen, R. A., and Oshima,
R. G. (1993). Embryonic expression of human keratin 18 and K18-beta
galactosidase fusion genes in transgenic mice. Dev Biol 160, 519-34.
Tickle, C., Goodman, M., and Wolpert, L. (1978). Cell contacts and sorting out in vivo:
the behaviour of some embryonic tissues implanted into the developing chick
wing. J Embryol Exp Morphol 48, 225-37.
Tomita, S., Jiang, H.-B., Ueno, T., Takagi, S., Tohi, K., Maekawa, S.-i., Miyatake, A.,
Furukawa, A., Gonzalez, F. J., Takeda, J., Ichikawa, Y., and Takahama, Y.
(2003). T Cell-Specific Disruption of Arylhydrocarbon Receptor Nuclear
105
Translocator (Arnt) Gene Causes Resistance to 2,3,7,8-Tetrachlorodibenzo-p
dioxin-Induced Thymic Involution J Immunol 171, 4113-4120.
Tsien, J. Z., Chen, D. F., Gerber, D., Tom, C., Mercer, E. H., Anderson, D. J., Mayford,
M., Kandel, E. R., and Tonegawa, S. (1996). Subregion- and cell type-restricted
gene knockout in mouse brain. Cell 87, 1317-26.
Uy, G. D., Downs, K. M., and Gardner, R. L. (2002). Inhibition of trophoblast stem cell
potential in chorionic ectoderm coincides with occlusion of the ectoplacental
cavity in the mouse. Development 129, 3913-24.
Wakamiya, M., Blackburn, M. R., Jurecic, R., McArthur, M. J., Geske, R. S., Cartwright,
J., Jr., Mitani, K., Vaishnav, S., Belmont, J. W., and Kellems, R. E. (1995).
Disruption of the adenosine deaminase gene causes hepatocellular impairment
and perinatal lethality in mice. Proc Natl Acad Sci U S A 92, 3673-7.
Waymire, K. G., Mahuren, J. D., Jaje, J. M., Guilarte, T. R., Coburn, S. P., and
MacGregor, G. R. (1995). Mice lacking tissue non-specific alkaline phosphatase
die from seizures due to defective metabolism of vitamin B-6. Nat Genet 11, 45
51.
Wen, F., Cecena, G., Munoz-Ritchie, V., Fuchs, E., Chambon, P., and Oshima, R. G.
(2003). Expression of conditional cre recombinase in epithelial tissues of
transgenic mice. Genesis 35, 100-6.
Wessells, J., Wessner, D., Parsells, R., White, K., Finkenzeller, D., Zimmermann, W.,
and Dveksler, G. (2000). Pregnancy specific glycoprotein 18 induces IL-10
expression in murine macrophages. Eur J Immunol 30, 1830-40.

106
Wilson, I. B., Bolton, E., and Cuttler, R. H. (1972). Preimplantation differentiation in the
mouse egg as revealed by microinjection of vital markers. J Embryol Exp
Morphol 27, 467-9.
Wilson, V., and Beddington, R. S. (1996). Cell fate and morphogenetic movement in the
late mouse primitive streak. Mech Dev 55, 79-89.
Winston, J. H., Hanten, G. R., Overbeek, P. A., and Kellems, R. E. (1992). 5' flanking
sequences of the murine adenosine deaminase gene direct expression of a reporter
gene to specific prenatal and postnatal tissues in transgenic mice. J Biol Chem
267, 13472-9.
Wood, S. A., Allen, N. D., Rossant, J., Auerbach, A., and Nagy, A. (1993). Non-injection
methods for the production of embryonic stem cell-embryo chimaeras. Nature
365, 87-9.
Wooding, F. B. P. a. F., A.P.F. (1994). Placentation. In "Marshall's Physiology of
Reproduction" (G. E. Lamming, Ed.), pp. 233-460. Chapman and Hall, New
York.
Yan, J., Tanaka, S., Oda, M., Makino, T., Ohgane, J., and Shiota, K. (2001). Retinoic
acid promotes differentiation of trophoblast stem cells to a giant cell fate. Dev
Biol 235, 422-32.
Zambrowicz, B. P., Imamoto, A., Fiering, S., Herzenberg, L. A., Kerr, W. G., and
Soriano, P. (1997). Disruption of overlapping transcripts in the ROSA beta geo 26
gene trap strain leads to widespread expression of beta-galactosidase in mouse
embryos and hematopoietic cells. Proc Natl Acad Sci U S A 94, 3789-94.

107
Zybina, E. V., and Zybina, T. G. (1996). Polytene chromosomes in mammalian cells. Int
Rev Cytol 165, 53-119.
Zinyk, D. L., Mercer, E. H., Harris, E., Anderson, D. J., and Joyner, A. L. (1998). Fate
mapping of the mouse midbrain-hindbrain constriction using a site-specific
recombination system. Curr Biol 8, 665-8.


![Recombinase Polymerase Amplification-Based Assay to ... · Giardia assay (recombinase polymerase amplification-based Giardia [RPAG] assay) that is capable of detecting the pres ence](https://img.pdfslide.us/doc/110x75/60328fc63d35af025c01a9a2/recombinase-polymerase-amplification-based-assay-to-giardia-assay-recombinase.jpg)