Embed Size (px)
Citation preview

1
Place Management
NSW Annual Report 2017-18,
including Luna Park Reserve Trust
Annual Report 2017-18
• Financial statements for the
year ended 30 June 2018
• Statutory information

2
Dear Minister,
Place Management NSW and Luna Park Reserve Trust Annual Report 2017-18
I am pleased to submit the Annual Report for Place Management NSW and
Luna Park Reserve Trust, for the year ended 30 June 2018, for presentation
to Parliament.
This report has been prepared in accordance with the Annual Reports
(Statutory Bodies) Act 1984, the Public Finance and Audit Act 1983 and
regulations under those Acts.
Regards,
Sam Romaniuk
Chief Executive Officer
Place Management NSW
Manager of Luna Park Reserve Trust
The Hon Victor Dominello, MP
Minister for Finance, Services and Property
GPO Box, 5341
SYDNEY NSW 2001
Place Management NSW
Level 4, 66 Harrington Street, Sydney NSW 2000
PO Box N408, Grosvenor Place NSW 1220
Tel 02 9240 8500 | www.property.nsw.gov.au

3
Contents Place Management NSW and Luna Park Reserve Trust Annual Report 2017-18 .......................... 2
1. Charter............................................................................................................................... 4
2. Aims and objectives ........................................................................................................... 4
3. Access ................................................................................................................................ 5
4. Management and structure ................................................................................................ 5
5. Summary review of operations........................................................................................... 8
6. Funds granted to non-government community organisations........................................... 10
7. Management and activities .............................................................................................. 11
8. Human resources ............................................................................................................. 11
9. Workforce Diversity ......................................................................................................... 13
10. Consultants .................................................................................................................. 14
11. Disability inclusion action plans .................................................................................... 14
12. Consumer response ...................................................................................................... 14
13. Payment of accounts – Place Management NSW .......................................................... 16
14. Payment of accounts – Luna Park Reserve Trust ........................................................... 17
15. Risk management and insurance activities.................................................................... 18
16. Internal Audit and Risk Management Attestation Statement – PMNSW ........................ 21
17. Internal Audit and Risk Management Attestation – Luna Park Reserve Trust ................ 23
18. Digital information security policy attestation 2017/18 – Place Management NSW ...... 25
19. Digital information security policy attestation 2017/18 – Luna Park Reserve Trust ....... 26
20. Multicultural Policies and Services Program ................................................................. 27
21. Work Health and Safety (WHS) ..................................................................................... 27
22. Budgets – Place Management NSW .............................................................................. 29
23. Budgets – Luna Park Reserve Trust ............................................................................... 29
24. Additional matters for inclusion ................................................................................... 30
25. Liability management performance .............................................................................. 30
26. Numbers and remuneration of senior executives ......................................................... 31
27. Credit card certification ................................................................................................ 31
28. Government Information (Public Access) Act 2009 ....................................................... 31
29. Public Interest Disclosures ............................................................................................ 31
30. Exemptions and nil reports ........................................................................................... 32

4
1. Charter
Place Management NSW (PMNSW) is a statutory corporation and its general functions are
to:
• protect and enhance the natural and cultural heritage of the foreshore area
• promote, coordinate, manage, undertake and secure the orderly and economic
development and use of the foreshore area, including the provision of
infrastructure
• promote, coordinate, organise, manage, undertake, secure, provide and
conduct cultural, educational, commercial, tourist, recreational, entertainment
and transport activities and facilities.
PMNSW is not limited to exercising its functions in relation to land within the foreshore area
and includes the management of the Luna Park Reserve Trust (LPRT).
2. Aims and objectives
Under its Legislation (1), PMNSW is responsible for Sydney’s most historically and culturally significant waterfront locations. These responsibilities include the care, protection, management and promotion of this land and its important buildings. PMNSW is the State’s premier place making agency. It owns, manages and transforms Sydney’s key State-significant heritage and cultural precincts — The Rocks and Darling Harbour — into vibrant, welcoming places that support, sustain and inspire locals and visitors. Every year PMNSW brings Sydney’s foreshore to life in The Rocks and Darling Harbour with a colourful mix of some of the city’s biggest and most popular events. The division also cares for the natural and built environments that make the precincts the popular destinations they are today, attracting more than 40 million visitors annually. PMNSW manages significant commercial and retail leases, provides security, cleaning, building maintenance and other asset management services, and cares for the public domain and over 100 heritage items. PMNSW also holds ownership of State-significant sites including Ballast Point, and manages other major waterfront assets around Sydney Harbour on behalf of other agencies, such as King Street Wharf. It owns land, parks, wharves and boardwalks at Pyrmont and is responsible for 19 head leases, 89 licences and 150 market stall holders in The Rocks. Luna Park Reserve Trust Luna Park Reserve Trust is responsible for the care, control and management of the 3.13 hectares of Milsons Point that make up Luna Park Reserve.

5
Managed by PMNSW, the Trust oversees a 40-year operating lease for the Luna Park site and manages the Heritage and Infrastructure Fund to conserve and improve the park’s heritage and infrastructure features. The Trust was established in 1990 under the Luna Park Site Act 1990. Luna Park Reserve is dedicated under the Crown Lands Act 1989 for the purpose of public recreation, amusement and entertainment. The Minister for Finance, Services and Property has administrative responsibility for the Luna Park Reserve and oversees the Trust, any land dealings at Luna Park and its general administration. The Minister for Planning is the consent authority for any development at Luna Park, which is listed as a Schedule 3 site (State Significant) under State Environmental Planning Policy – Major Projects 2005. Luna Park Sydney Pty Ltd, an independent commercial operator, has complete operational responsibility for the day-to-day running of the park. The Trust works closely with Luna Park Sydney to ensure that the site remains a viable amusement park and entertainment precinct.
Luna Park Reserve Trust financial statements can be found following PMNSW’s financial statements.
3. Access
Place Management NSW 66 Harrington Street, The Rocks PO Box N408, Grosvenor Place NSW 1220 T: 02 9240 8500 [email protected]
www.property.nsw.gov.au
Core business hours are 8:30am – 5:00pm Monday to Friday.
4. Management and structure
Role of the Board
The Place Management NSW (PMNSW) Board is appointed in accordance with the Place Management NSW Act 1998. The Board oversees PMNSW’s policies, management and performance, sets strategic direction for the entity and monitors compliance with statutory requirements. The Board monitors organisational performance against strategic objectives. This is achieved both through written reports from management and direct interaction with senior management at quarterly Board meetings. The Code of Conduct and Ethics for Board Members prescribes procedures for disclosing and dealing with conflicts of interest. As per recommendation 2.1 of TPP 09-2, a Board Charter has been developed. The NSW Minister for Finance, Services and Property is responsible for the control and direction of PMNSW.

6
PMNSW’s CEO is responsible for the day-to-day management of PMNSW in accordance with specific policies and general direction of the Board, and is subject to the control and direction of the Minister.
Board
From 1 July 2017, PMNSW’s Board consisted of Chair, The Hon Helen Coonan, and Board members Martin Hoffman, Secretary, Department of Finance, Services and Innovation; along with PMNSW Chief Executive Officer, Sam Romaniuk, as an ex-officio Board member. In 2017 three Independent board members were appointed to the board, Jill Davies, Jennifer Lambert and Garry Browne. Board meetings and attendance Three Board meetings were held in 2017/18. Dates and attendees are outlined in the table below.
Attendees 20 Oct 2017
11 Dec 2017
19 Mar 2018
TOTAL
The Hon Helen Coonan Yes Yes Yes 3/3
Sam Romaniuk Yes Yes Yes 3/3
Martin Hoffman Yes Yes Yes 3/3
Jill Davies Yes Yes Yes 3/3
Jennifer Lambert Yes Yes Yes 3/3
Garry Browne N/A Yes Yes 2/2
The Hon. Helen Coonan BA, LLB
Board member Chair, Place Management NSW
Non-Executive Director Crown Resorts Limited Chair, Crown Resorts Foundation Snowy Hydro Limited Co-Chair, GRACosway Pty Ltd Chair, Supervised Investments Australia Limited Australian Children’s Television Foundation Obesity Australia Chair, Australian Financial Complaints Authority Advisory Board J.P. Morgan Allegis Partners
Appointed as the PMNSW Chair from 1 July 2016 for a period of one year. Reappointed from 4 August 2016 for a period of one year. Reappointed from 4 August 2017 for a period of one year. Helen was reappointed from 30 July 2018 for a period of two years.

7
Martin Hoffman MBA (Hons), MAppFin, BEcon Secretary, Department of Finance, Services and Innovation Board member Place Management NSW Pursuant to the Place Management NSW Act 1998, the Secretary of the Department is an ex-officio Board member. Sam Romaniuk B.Com, LLB, CA Chief Executive Officer, Place Management NSW Executive Director, Place Management, Property NSW Board member Place Management NSW Appointed as Chief Executive Officer 22 December 2015. Pursuant to the Place Management NSW Act 1998, the Chief Executive Officer is an ex-officio Board member. Jill Davies B.Econ Principal, Global Strategy & Events Consulting Board Member Appointed to the Place Management NSW Board on 1 July 2017 for a period of three years as an independent board member. Non-Executive Director Sydney Olympic Park Authority Roads and Maritime Services Jennifer Lambert Bachelor of Business, Masters Economics, AICD, ICA Board Member Appointed to the Place Management NSW Board on 1 July 2017 for a period of three years as an independent board member. Director Investa Office Management Shore Council Sydney Church of England Grammar School Mosman Church of England Preparatory School Mission Australia Garry Browne Bachelor of Business, Harvard Business School President Management program, AICD Chief Executive Officer, Stuart Alexander Pty Ltd. Board Member Appointed to the Place Management NSW Board on 30 November 2017 for a period of three years as an independent board member. Director Life Education Australia

8
UTS Faculty of Science Industry Advisory Group Centre for Social Impact – Advisory Council Foundation of National Parks and Wildlife – Chair/President
5. Summary review of operations
Place Management NSW (PMNSW) manages significant retail leases in The Rocks and Darling Harbour precincts, including over 150 stallholders at The Rocks Markets. The Rocks, Circular Quay, and Darling Harbour are significant cultural and heritage precincts for Sydney, NSW, and Australia. They are popular destinations for local and international visitors and contribute significantly to the State’s economy. Despite significant construction activity, tenant sales growth in PMNSW ’s retail portfolio has increased by 5% over the past year. This represented a significant growth in food and beverage tenants with growth of 16%. Vacancies for retail spaces continue to remain low (<1%) in comparison to the Sydney CBD benchmark of 3%. About 15.1 million people movements were recorded in The Rocks in 2017/18, with people enjoying the entertainment, shopping and dining experiences on offer. This was a 3.9% increase on the previous year. About 27.3 million people movements were recorded in Darling Harbour in 2017/18, with people enjoying attractions and events in the precinct. This was a 5.1% increase on the previous year. 1
1 Visitor numbers recorded from electronic people counters installed in The Rocks and Darling Harbour. Figures include repeat visits.
0.0
0.5
1.0
1.5
2.0
2.5
3.0
3.5
4.0
4.5
Mill
ion
s o
f p
eop
le m
ove
men
ts
Total VisitationDarling Harbour & The Rocks, millions of people movements
2017/18 2016/17

9
Retail Portfolio Performance
PMNSW manages significant retail leases in The Rocks and Darling Harbour precincts,
including over 150 stallholders at The Rocks Markets.
The Rocks, Circular Quay, and Darling Harbour are significant cultural and heritage precincts
to Sydney, New South Wales, and Australia. They are popular destinations for local and
international visitors and contribute significantly to the State’s economy.
In The Rocks, over 15.1 million people movements were recorded in 2017/18, with visitors
enjoying the entertainment, shopping and dining experiences on offer. This was an increase
of people movements on the previous year of approximately 4%.
In Darling Harbour, 27.2 million people movements were recorded in 2017/18, with visitors
enjoying attractions and events in the precinct. This was an increase in people movements
over the previous year of close to 5%.
Despite significant construction activity tenant sales turnover growth in PMNSW’s retail
portfolio has increased 8% over the past year, representing significant growth across
industries including retail, hospitality, and food & beverage tenants.
Vacancies for retail spaces continue to remain low at 1.0%, comparative to the Sydney CBD
benchmark of 3.0%2.
Retail Property Portfolio Vacancy Rate (%)
2 Retail Benchmark source – JLL Sydney CBD Prime Retail Vacancy Rate, June 2018.

10
International Convention Centre, Sydney
Darling Harbour’s International Convention Centre Sydney has generated substantial economic benefits for the State since it opened in December 2016. The NSW Government delivered the $1.6 billion, world-class convention, exhibition and entertainment facilities though a public-private partnership. In its first full financial year, ICC Sydney hosted 732 events and welcomed more than 1.2
million visitors through the doors in 2017/18.
ICC Sydney surpassed both international and interstate delegate targets for 2017/18, which
together with local and intrastate ICC Sydney attendees, generated $765.6 million in direct
expenditure into the NSW economy and generated a total 1,467,587 total room nights.
Client satisfaction for 2017/18 was excellent, at 94%, with a likelihood to recommend of 96.4%.
Delegate Satisfaction scores were also outstanding with overall satisfaction at 96%, and 94%
likelihood to recommend.
For 2017/18, ICC Sydney’s contribution to employment was 3,860 jobs, which included 1,191
in indirect jobs and 2,669 in direct jobs.
ICC Sydney was recognised with 21 awards over the period.
6. Funds granted to non-government community organisations
Each year, Place Management NSW (PMNSW) supports a diverse number of events which
provide cultural experiences and community-based activities that enrich the lives of visitors
to the precincts. These events help create the unique character of Darling Harbour and The
Rocks.
PMNSW continued its commitment to cultural organisations, community groups and
commercial enterprises, developing, curating and coordinating numerous events in The
Rocks and Darling Harbour during the year, including:
• Chinese New Year celebrations – Lunar Lanterns and Dragon Boat Races
• Sydney International Boat Show
• Smooth Festival of Chocolate in The Rocks
• Bastille Festival
• Icecapades – Harbourside Winter school holidays activation
• Head On Photo Festival
• 33 school and community public performances
• a substantial cultural program of festivals from around the world. These festivals are among Australia’s leading multicultural celebrations, where visitors explore various cultures through the arts, history, entertainment and great food.
These events bring a rich mix of activities for visitors to enjoy and provide opportunities for
tenants to participate.

11
PMNSW was also a partner for a number of community festivals and provided significant on-
the-ground operational support:
• Community and Cultural Festivals ($250,000)
7. Management and activities
Place Management NSW (PMNSW) is responsible for the ownership and management of NSW’s state-significant precincts, The Rocks and Darling Harbour. PMNSW aims to uphold community, social, heritage and commercial interests by providing world-class places and experiences that attract more than 40 million visitors per year to our precincts. The division’s multidisciplinary experience extends to asset management, retail and commercial leasing, strategic planning and heritage, as well as events and marketing. PMNSW works to ensure the activation of our precincts for the mutual benefit of tenants, visitors and the taxpayers of NSW. Key achievements for PMNSW in FY18 included:
• the commencement of a $23 million renewal of the heritage-listed Pyrmont Bridge
• the commencement of a $15 million upgrade of the public domain at Campbells Cove
• a $15 million revitalisation of the wharves and jetties at Cockle Bay
• a successful first year for the new ICC Sydney, with more than one million visitors.
• the continued refresh of the retail offering in The Rocks, with 30 new retailers over the past three years.
• completing the refurbishment of The Rocks Centre.
• a 4.5% increase in visitation to The Rocks and Darling Harbour, to more than
42 million across both precincts
8. Human resources
Employment Statistics
Division 20153,4 20163,4 20173,4 20183,4
Senior Executive 3 - 5 4.0
Senior Officer 18 13 - -
Ongoing 107.7 99.3 20.6 26.4
Temporary 10.6 16.5 7.8 2.0
Graduate - - 1 -
Total 139.3 128.8 34.4 32.4
3 Full time equivalent staff (excludes chairpersons, casuals, contractor/agency staff, statutory appointments, trustees, council
committee members, staff on secondment to other agencies and staff on long term leave without pay). 4 Statistics are based on Workforce Profile census data as at 18 June 2015, 30 June 2016, 29 June 2017 and 28 June 2018.

12
20175,6,7 20185,6,7
Senior Executive
Band Female Male Total
% Representation by Women Female Male Total
% Representation by Women
Band 4 (Secretary)
0 0 0 0% 0 0 0 0%
Band 3
(Deputy Secretary)
0 0 0 0% 0 0 0 0%
Band 2 (Executive Director)
0 1 1 0% 0 1 1 0%
Band 1 (Director)
3 1 4 75% 2 1 3 66.7%
Total 3 2 5 60% 2 2 4 50.0%
20178 20188
Senior Executive Band
Range $ Average
Remuneration $ Range $
Average Remuneration $
Band 4 (Secretary)
452,250 - 522,500 0 463,551 - 535,550 0
Band 3 (Deputy Secretary)
320,901 - 452,250 0 328,901 - 463,550 0
Band 2 (Executive Director)
255,051 - 320,900 281,875 261,451 - 328,900 288,922
Band 1 (Director)
178,850 - 255,050 219,453 183,300 - 261,450 235,784
Employee related costs
Employee related costs 2017 Amount
Executive $889,842
Non-Executive $4,315,221
Total $5,205,063
Ratio Senior Executive 17.1%
In 2018, 17.1% of employee related expenditure was for senior executives, compared with
2017 which was 19.4%.
5 Senior Executive statistics exclude casuals, contractor/agency staff, statutory appointments, staff on secondment to other agencies and staff on long term leave without pay. 6 Statistics are based on Workforce Profile census data as at 29 June 2017 and 28 June 2018. 7 All employees reported in 2017 and 2018 are appointed under the Government Sector Employment Act. Salary band based on current assignment including those on a temporary above level assignment for more than two months. 8 Salary ranges effective at the Workforce Profile census dates of 29 June 2017 and 28 June 2018.

13
9. Workforce Diversity
Trends in the Representation of Workforce Diversity Groups
Workforce Diversity Group Benchmark 20169,10 20179,10 20189
Women11 50% 52.2% 64.9% 63.6%
Aboriginal People and/or Torres Strait Islander People12 3.3% 0.0% 3.2% 3.2%
People whose First Language Spoken as a Child was not
English13
23.2% 12.1% 12.6% 13.2%
People with a Disability14 5.6% 0.7% 0.0% 3.2%
People with a Disability Requiring Work-Related
Adjustment14
N/A 0.0% 0.0% 0.0%
Trends in the Distribution of Workforce Diversity Groups
Workforce Diversity Group Benchmark15,16 2016 2017 2018
Women 100 93 N/A N/A
Aboriginal People and/or Torres Strait Islander People 100 N/A N/A N/A
People whose First Language Spoken as a Child was not English
100 N/A N/A N/A
People with a Disability 100 N/A N/A N/A
People with a Disability Requiring Work-Related Adjustment
100 N/A N/A N/A
9 Statistics are based on Workforce Profile census data as at 30 June 2016, 29 June 2017 and 28 June 2018.
10 Workforce diversity statistics for 2016 and 2017 reflect the current composition of the department and may vary from those
reported in previous annual reports. 11 The benchmark of 50% for representation of women across the sector is intended to reflect the gender composition of the
NSW community. 12 The NSW Public Sector Aboriginal Employment Strategy 2014 – 17 introduced an aspirational target of 1.8% by 2021 for
each of the sector’s salary bands. If the aspirational target of 1.8% is achieved in salary bands not currently at or above 1 .8%,
the cumulative representation of Aboriginal employees in the sector is expected to reach 3.3%. 13 A benchmark from the Australian Bureau of Statistics (ABS) Census of Population and Housing has been included for
People whose First Language Spoken as a Child was not English. The ABS Census does not provide information about first language, but does provide information about country of birth. The benchmark of 23.2% is the percentage of the NSW general
population born in a country where English is not the predominant language. 14 In December 2017, the NSW Government announced the target of doubling the representation of people with disability in the
NSW public sector from an estimated 2.7% to 5.6% by 2027. More information can be found at: Jobs for People with Disability:
A plan for the NSW public sector. The benchmark for ‘People with Disability Requiring Work-Related Adjustment’ was not
updated. 15 A Distribution Index score of 100 indicates that the distribution of members of the Workforce Diversity group across salary
bands is equivalent to that of the rest of the workforce. A score less than 100 means that members of the Workforce Diversity
group tend to be more concentrated at lower salary bands than is the case for other staff. The more pronounced this tendency is, the lower the score will be. In some cases, the index may be more than 100, indicating that members of the Workforce Diversity group tend to be more concentrated at higher salary bands than is the case for other staff. 16 The Distribution Index is not calculated when the number of employees in the Workforce Diversity group is less than 20 or
when the number of other employees is less than 20.

14
10. Consultants
Place Management NSW (PMNSW) engages consultants for specialised work on an as-
needed basis, including for economic appraisals and financial services.
In 2017/18, PMNSW engaged one consultant whose fees were more than $50,000.
This was an engagement with KPMG for accounting advice relating to the SICEEP, for a
total cost of $82,996.30.
PMNSW did not engage any consultants whose fees were less than $50,000.
11. Disability inclusion action plans
As part of the Department of Finance, Services and Innovation (DFSI), Place Management
NSW supports the department’s Disability Inclusion Action Plan 2015-18. The plan sets out
how DFSI will work towards:
• the development of positive community attitudes and behaviours towards people with
disability
• the creation of more liveable communities for people with disability
• the achievement of a higher rate of meaningful employment participation by people
with disability through inclusive employment practices
• more equitable access to mainstream services for people with disability through
better systems and processes.
12. Consumer response
Place Management NSW, as part of the Property and Advisory Group (PAG), responded
efficiently and effectively to feedback from customers, tenants and visitors to its precincts.
Our primary channel of feedback was through the Customer Request Management System
(CRMS).
This system was linked to a dedicated Customer Service Request Line which operated 24
hours a day, seven days a week and allowed us to identify key trends and issues within its
precincts and respond accordingly.
Across PAG, we received an average of 1,480 complaints, comments and queries per month
during the reporting period. Correspondence related to a range of matters, including
cleanliness, maintenance and access. We responded quickly and equitably to CRMS
complaints, completing an average of 98% of all requests on time.
Additionally, we encourage feedback from the general public via an email address on our
corporate website, www.property.nsw.gov.au. We received 733 compliments, complaints
and enquiries through this channel during the reporting period.

15
Further, in line with the Premier’s Priority to improve government services, we introduced a
Complaint Handling Improvement Program (CHIP) widget on the corporate website.
During the reporting period, we received 14 complaints, 16 suggestions and 12 compliments.
The average time to resolve and close complaints was five working days.
Feedback is also received via our precinct channels. In 2017-18, we captured 8,398 posts
on the Darling Harbour Facebook page and 8,578 posts on The Rocks Facebook page. We
also actioned 559 enquiries via the Darling Harbour website and 309 enquiries via The
Rocks website. In addition, we meet face-to-face with tenants across The Rocks and Darling
Harbour.
16
13. Payment of accounts – Place Management NSW
The table below highlights Place Management NSW’s account payment performance for 2017/18.
PLACE MANAGEMENT NSW
ACCOUNT PAYMENT PERFORMANCE AS AT
Total PM NSW Entity
ACCOUNT PAYMENT PERFORMANCE
PM NSW ENTITY - ALL PAYMENTS
AS AT
ALL SUPPLIERS
Value of Invoices Paid ($'000)
Paid Before Due $84,597 $93,554 $96,382 $125,017 $399,550
<30 Days Overdue $11,690 $2,353 $122 $109 $14,273
>30<60 Days Overdue $2,343 $710 $80 $2 $3,135
>60<90 Days Overdue $242 $191 $2 $0 $435
>90 Days Overdue $3,738 $2,988 $28 $0 $6,754
Total Value of Invoices Paid ($'000) $102,611 $99,795 $96,614 $125,128 $424,148
% Paid on Time - By Value 82% 94% 100% 100% 94%
Number of Invoice Paid
Paid Before Due Date 1,112 928 897 970 3,907
Paid Past Due Date 807 158 15 8 988
Total Number of Invoices Paid 1,919 1,086 912 978 4,895
% Paid on Time - By Number 58% 85% 98% 99% 80%
Interest Paid
Number of Payments for Interest on:
Overdue Invoices 0 0 0 - 0
Interest Paid on Over due Invoices 0 - 0 0 -
SMALL BUSINESS SUPPLIERS
Value of Invoices Paid ($'000)
Paid Before Due Date
<30 Days Overdue
>30<60 Days Overdue
>60<90 Days Overdue
>90 Days Overdue
Total Value of Invoices Paid ($'000) - - - - -
Total Value Paid on Time (%) 82% 94% 100% 100% 94%
Number of Invoices Paid
Paid Before Due Date
Paid Past Due Date
Total Number of Invoices Paid - - - - -
% Paid on Time - By Number 0% 0% 0% 0% 0%
Interest Paid
Number of Payments for Interest on:
Overdue Invoices - - - - -
Interest Paid on Over due Invoices 0 - 0 0 -
During the migration to SAP, vendors were invited to complete/renew a small business declaration. As no vendors
submitted a declaration,the number of invoices at 30 June 2018 for small business is $0.
TOTAL2017-18
2017-18
FULL YEAR
1ST QTR 2ND QTR 3RD QTR 4TH QTR

17
14. Payment of accounts – Luna Park Reserve Trust
The table below highlights Luna Park Reserve Trust’s account payment performance for 2017/18.
Luna Park Reserve Trust
ACCOUNT PAYMENT PERFORMANCE AS AT
Total PM NSW Entity
ACCOUNT PAYMENT PERFORMANCE
LPRT ENTITY - ALL PAYMENTS
AS AT
ALL SUPPLIERS
Value of Invoices Paid ($'000)
Paid Before Due $1,909 $11 $0 $1 $1,921
<30 Days Overdue $7 $357 $197 $211 $772
>30<60 Days Overdue $155 $0 $283 $9 $447
>60<90 Days Overdue $0 $0 $0 $538 $538
>90 Days Overdue $0 $0 $0 $0 -
Total Value of Invoices Paid ($'000) $2,071 $367 $480 $759 $3,677
% Paid on Time - By Value 92% 3% 0% 0% 52%
Number of Invoice Paid
Paid Before Due Date 7 2 - 1 10
Paid Past Due Date 2 7 5 11 25
Total Number of Invoices Paid 9 9 5 12 35
% Paid on Time - By Number 78% 22% 0% 9% 29%
Interest Paid
Number of Payments for Interest on:
Overdue Invoices 0 0 0 - 0
Interest Paid on Over due Invoices 0 - 0 0 -
SMALL BUSINESS SUPPLIERS
Value of Invoices Paid ($'000)
Paid Before Due Date
<30 Days Overdue
>30<60 Days Overdue
>60<90 Days Overdue
>90 Days Overdue
Total Value of Invoices Paid ($'000) - - - - -
Total Value Paid on Time (%) 92% 3% 0% 0% 52%
Number of Invoices Paid
Paid Before Due Date
Paid Past Due Date
Total Number of Invoices Paid - - - - -
% Paid on Time - By Number 0% 0% 0% 0% 0%
Interest Paid
Number of Payments for Interest on:
Overdue Invoices - - - - -
Interest Paid on Over due Invoices 0 - 0 0 -
During the migration to SAP, vendors were invited to complete/renew a small business declaration. As no vendors
submitted a declaration,the number of invoices at 30 June 2018 for small business is $0.
TOTAL2017-18
2017-18
FULL YEAR
1ST QTR 2ND QTR 3RD QTR 4TH QTR

18
15. Risk management and insurance activities
Risk Management Place Management NSW (PMNSW) constantly monitors its environment to assess the risks in its operations, and uses its resources to manage these risks. PMNSW’s approach to risk management seeks to balance risk, cost and growth for the benefits of its stakeholders, by:
• Adopting the DFSI Risk and Resilience Framework to manage strategic and business risks, which is consistent with PMNSW’s objectives and responsibilities to its stakeholders
• Development of a Risk Management guideline to support the implementation of the DFSI Framework
• Assessing the impact of proposed changes to laws, regulations and industry codes
• Reporting risks to the Audit and Risk Committee, relevant Boards, Executive Committee and senior leadership team.
The DFSI Risk and Resilience Framework has been developed in alignment with:
• NSW Treasury Policy Paper (TPP- 15-03): Internal Audit and Risk Management Policy for NSW Public Sector
• Australian/New Zealand Risk Management Standard (AS/NZS ISO31000): Risk Management Principles and Guidelines
Key achievements during 2017/18:
• Better integration of risk management with strategic and business planning processes
• Developed risk management system
• Developed standard risk reporting
• Successfully conducted Business Continuity walkthrough exercise
• Completed annual compliance attestation Insurance Arrangements and Activities PMNSW had insurance arrangements in place for all its assets and major risk. Insurable risk cover was primarily provided through participation in the NSW Treasury Managed Fund (TMF), a NSW Government self-insurance scheme. Insurable risk exposures covered through the TMF includes:
• Workers compensation
• Legal including liability classes like public liability, products liability, professional indemnity, directors and officer liability
• Property including buildings, plant, equipment, and consequential loss
• Motor vehicle
• Other miscellaneous losses, such as the cost of employee dishonesty, personal
accident and protection for overseas travel.
The main exposures that are not included are:
• illegal activities
• wear and tear, and inherent vice (Note: Inherent Vice is an exclusion found in most
property insurance policies eliminating coverage if there is a hidden defect in a good
or property which causes or contributes to its deterioration, damage, or wastage)
• pollution (not being sudden and accidental pollution)

19
Number of claims and net incurred costs
Insurance claims and net incurred cost for Place Management NSW for financial year 2016-
17 and 2017-18 are shown in the table below:
Number of Claims Net incurred cost ($)
2016-17 2017-18 2016-17 2017-18
Workers Comp 1 - $26,129 -
Property 1 3 $20,000 $295,799
Liability 9 2 $255,860 $550
Motor vehicle 1 1 $5,284 $3,800
Miscellaneous - - - -
Total 12 6 $307,273 $300,149 All incurred claims and relevant costs were sourced from the TMF database. They are based on the claims lodged and relevant
assessment to date. The final costs and claim numbers may vary due to the timing of loss incurred, claims reported and the outcome of negotiated settlement.
Property and Advisory Group Audit and Risk Committee (ARC)
Place Management NSW, as part of Property and Advisory Group (PAG), had an Audit and
Risk Committee (ARC) in place during 2017-18 financial year. The Audit and Risk
Committee provides independent assistance to the following participating entities by
monitoring, reviewing and providing advice about their governance processes, risk
management and control framework, and their external accountability requirements:
• Property NSW (PNSW)
• Teacher Housing Authority (THA)
• Waste Assets Management Corporation (WAMC)
• Place Management NSW (PMNSW)
• Luna Park Reserve Trust (LPRT) The above participating entities have entered into a collaborative shared arrangement and
have established a shared Audit and Risk Committee in compliance with:
• NSW Treasury Policy Paper (TPP15-03): Internal Audit and Risk Management Policy for NSW Public Sector
• NSW Treasury Policy Paper (TPP16-02): Guidance on Shared Arrangements and Subcommittees for Audit and Risk Committees.
The committee met five times during the 2017-18 financial year. DFSI, while not a participating entity, has a special role in providing audit, risk and secretariat services to the committee and the participating entities. This shared arrangement aims to maintain an appropriate level of internal oversight for all participating entities in assurance and independent advice, while minimising the associated administration, financial costs and resources. Membership
The Chair and members of the Audit and Risk Committee are:

20
• Carol Holley, Independent Chair, from 2 December 2015 to 1 December 2020
• Dianne Hill, Independent Member, from 1 February 2016 to 31 January 2019
• Mark O’Sullivan, Independent Member, from 25 January 2016 to 24 January 2018
• Nirmal Hansra, Independent Member, from 20 December 2017 to 19 December 2020

21
16. Internal Audit and Risk Management Attestation Statement – Place Management NSW

22

23
17. Internal Audit and Risk Management Attestation – Luna Park Reserve Trust

24

25
18. Digital information security policy attestation 2017/18 – Place Management NSW
26
19. Digital information security policy attestation 2017/18 – Luna Park Reserve Trust

27
20. Multicultural Policies and Services Program
Place Management NSW (PMNSW), as part of the Property and Advisory Group (PAG), has
multicultural policies and service programs guided by DFSI’s Diversity and Inclusion
Strategy, Aboriginal Workforce Strategy, Disability Inclusion Action Plan and the
Government Sector Employment Act 2013, which prioritises diversity in the workforce.
At an agency level, PMNSW promotes multiculturalism and diversity through a range of
initiatives, including but not limited to:
• supporting NAIDOC Week through a series of events and initiatives, including a
public ceremony featuring members of the Metropolitan Aboriginal Land Council.
• promoting diversity initiatives, including ‘Wear it Purple Day’, to support the LGBTQI+
community.
• hosting a detailed calendar of community festivals in Darling Harbour, celebrating
multiculturalism.
• the establishment of a Diversity Working Group within PAG, with an initial focus on
women in leadership, and improving PAG’s performance against key metrics
including Indigenous, English as a second language and ability employee
representation.
In addition, the PAG revised Corporate Plan includes a new KPI that women represent at
least 35% of the leadership team, an interim milestone to achieving DFSI’s target of 50% of
women in leadership roles.
21. Work Health and Safety (WHS)
In 2017/18, Place Management NSW (PMNSW) continued to take a proactive approach in
managing the safety of all employees, other workers, tenants and visitors to its properties,
sites and activations.
With the amalgamation of business groups within the Department of Finance, Services and
Innovation (DFSI) to create the Property and Advisory Group, a cluster-wide safety
management system is being developed to ensure a consistent approach to the reporting and
management of safety incidents and activities.
Specific Property and Advisory Group WHS activities undertaken in 2017/18 include:
• development of a Property Advisory Group and incident management software system
• initiated roll-out of the Integrum incident management software to several business
units
• roll out of a group incident management procedure
• increased WHS support before, during and after State Significant Events such as New
Year’s Eve, Australia Day and Vivid including on-the-ground WHS pre-inspections
• participating in the Harrington St Operational Readiness Working Group. This was
followed by WHS advice and support during the practical re-settlement of personnel at
66 Harrington

28
• assisting in the coordination of health and wellbeing initiatives such as the flu
vaccination program and provision of a lactation / faith room separate to our f irst aid
room at Harrington St.
• development of a Work Health and Safety Management System
WHS incidents – Place Management NSW
The following number of incidents were reported during the period 2017/18:
• 10 staff incidents.
There were no SafeWork NSW notifiable incidents or dangerous occurrences affecting staff.
WHS induction and training
Property and Advisory Group staff members were required to complete two WHS mandatory
courses:
• Introduction to Health and Safety, and
• WHS Due Diligence for managers.
As of 30 June 2018, there was 100% course completion by eligible workers across the group
across the group.
WHS consultation
The WHS Consultative Committee has continued to be active in consultation upon WHS
issues. Notably providing important feedback on the proposed group-wide Department of
Finance Service and Innovation WHS framework.
The Property and Advisory Group WHS Committee reviewed, updated and approved a
number of Safe Operating Procedures coinciding with the roll out of the Integrum Incident
Management software system and the development of the Work Health and Safety
Management System
Contractor management
WHS reviews for PMNSW facilities-related contractors continued through 2017/2018. These
reviews give contract managers insight and assurance that WHS activities, as specified in the
contract, are being delivered. As at 30 June 2018, 44 contractor WHS reviews had been
completed for FY17/18.
The online Visitor Registration web platform has continued to be used for WHS contractor
inductions and vehicle access inductions for Darling Harbour and The Rocks precincts. This
system will continue until a more suitable alternative is sourced.

29
22. Budgets – Place Management NSW
Performance against budget
Place Management NSW (PMNSW), including the financial performance of the Sydney International Convention Centre, finished the year with a net deficit of $10 million.
PMNSW delivered a shortfall in revenue primarily due to lower than budgeted profit on asset disposals, as six assets were deferred to 2018/19, costing the budget $38 million in profit.
In addition, because of an improved cash position due to gains made on refinancing loans in 2016/17, NSW Treasury reduced PMNSW’s FY2017/18 grant revenue by $40.4m.
Offsetting the shortfall in revenue, expenses finished the year $14.6 million favourable to budget. This is primarily due to $19.5 million worth of major planned maintenance being deferred to 2018/19 and forward years.
PMNSW’s property portfolio, which includes the Rocks and Darling Harbour, public domains and specialised assets, continues to deliver a net contribution to the group. Strong asset strategies are in place to minimise vacancies, improve tenancy mix, and activate precincts.
Budget overview
PMNSW is forecasted to deliver a $57.6 million deficit in the 2018/19 financial year.
The forecasted deficit is primarily due to non-cash expenses of $77 million in depreciation charges, and finance lease expenses of $59.9 million. Partially offsetting this is finance lease income of $12 million.
Within the 2018/19 budget, a $6m increase in Major Planned Maintenance (MPM) and Investment Program Property (IPP) works are budgeted to reflect the increased emphasis on maintenance and deal with a backlog of delayed works.
23. Budgets – Luna Park Reserve Trust
Performance against budget
Luna Park Reserve Trust finished the year unfavourably to budget by $1 million. This was a
result of additional unplanned maintenance expenses occurring in the 2017/18 financial
year.
Budget overview
Luna Park Reserve Trust is budgeted to return to surplus over the 2018/19 financial year.
2016/17 2017/18 2017/18 2017/18 2018/19
actual actual budget variance budget
$'000 $'000 $'000 $'000 $'000
Place Management NSW
Expenses 283,049 418,480 433,131 14,651 371,402
Revenues 204,191 307,291 346,391 (39,100) 289,155
Other gains/(losses)^ 116,489 101,147 54,561 46,586 24,604
Net operating result - surplus/(deficit) 37,631 (10,042) (32,179) 22,137 (57,643)

30
There is a budgeted increase in maintenance expenditure over 2018/19 as projects have
been identified by Luna Park Operator.
24. Additional matters for inclusion
Privacy and Personal Information Protection Act 1998 (PPIP Act) The Privacy and Personal Information Protection (PPIP) Act 1998 contains 12 information protection principles regulating the collection, use and disclosure of personal information by NSW public sector agencies. These principles ensure that agencies collect personal information for lawful purposes, and that such information is protected from misuse and unauthorised release. NSW Government agencies are required to prepare and implement a privacy management plan in accordance with section 33(1) of the Privacy and Personal Information Protection Act 1998. Additional information about how PMNSW manages its obligations under the PPIP Act is available at http://www.property.nsw.gov.au/government-property-nsw-privacy-statement. Accessing this report This report is available for download at www.property.nsw.gov.au/aboutus
25. Liability management performance
Debt management
At 30 June 2018, Place Management NSW’s total borrowings was $1.4 billion. It included
$270.9 million finance lease liability and $1.1 billion state guaranteed fixed loans from NSW
Treasury Corporation (TCorp) maturing between 2020 to 2029. TCorp manages the debt
portfolio on behalf of PMNSW based on an agreement between the parties.
TCorp has confirmed PMNSW’s cost of debt for the year as at 30 June 2018 was 2.30%
(see below).
2016/17 2017/18 2017/18 2017/18 2018/19
actual actual budget variance budget
$'000 $'000 $'000 $'000 $'000
Luna Park Reserve Trust
Expenses 4,398 3,292 1,964 (1,328) 2,038
Revenues 5,128 2,185 1,969 216 2,048
Other gains/(losses) - - - - -
Net operating result - surplus/(deficit) 730 (1,107) 5 (1,112) 10

31
26. Numbers and remuneration of senior executives
See Human Resources.
27. Credit card certification
Place Management NSW relies on the DFSI Corporate Credit Card Policy that complies with
NSW Treasury’s TD 205.01. Cardholders are required to observe the policy and complete a
reconciliation form each month, which is authorised by Place Management’s Executive
Director.
28. Government Information (Public Access) Act 2009
The Government Information (Public Access) Act 2009 (GIPA Act) requires NSW Government agencies to make mandatory disclosures of information, encourages proactive releases of information and provides mechanisms for individuals to apply to access government information. More information on how to access department information is available at https://www.finance.nsw.gov.au/accessing-ofs-information/how-can-i-access-ofs-information. Statistical information relating to formal applications under the GIPA Act is provided in the DFSI Annual Report Government Information (Public Access) statistics. Review of proactive release program Under section 7(3) of the GIPA Act, agencies must review their proactive release of government information program at least once every 12 months. Place Management NSW complies with this Act by proactively releasing information on the
Property NSW website www.property.nsw.gov.au.
29. Public Interest Disclosures
As staff members are employees of DFSI, Place Management NSW has adopted and adhered to the DFSI Fraud and Corruption Internal Reporting Policy. All staff members are advised of this policy by means of the Code of Conduct and intranet access. There were no public interest disclosures made by Place Management NSW officials for the period 1 July 2016 to 30 June 2017.

32
30. Exemptions and nil reports
Reporting requirement Reason for exemption Economic or other factors N/A
Legal change No legal change.
Land disposal No properties with a value greater than $5 million were disposed of during 2017-18 without going to public auction or tender. Property NSW keeps a register of government contracts. All contracts greater than $150,000 are released on the site https://tenders.nsw.gov.au/.
Agreements with Multicultural NSW
Place Management NSW does not have any agreements with Multicultural NSW under the Multicultural Act 2000.
Implementation of price determination
Place Management NSW is not subject to determinations or recommendations of the Independent Pricing and Regulatory Tribunal of NSW.
Promotion No Place Management NSW employees undertook overseas travel to promote or develop the business during the reporting period.
Disclosure of controlled entities N/A
Disclosure of subsidiaries Place Management NSW does not control or hold shares in any subsidiaries within the meaning of the Corporations Act 2001 (Cth.).
Investment Performance Place Management NSW does not have an investment portfolio.
Requirements arising from employee arrangements
N/A
Research and Development N/A

33
Place Management
NSW Annual Report 2017-18,
including Luna Park Reserve Trust
Annual Report 2017-18
• Financial statements for the
year ended 30 June 2018
INDEPENDENT AUDITOR’S REPORT
Place Management NSW
To Members of the New South Wales Parliament
Opinion
I have audited the accompanying financial statements of Place Management NSW (PMNSW), which
comprise the Statement of Comprehensive Income for the year ended 30 June 2018, the Statement of
Financial Position as at 30 June 2018, the Statement of Changes in Equity and the Statement of Cash
Flows for the year then ended, notes comprising a Statement of Significant Accounting Policies and
other explanatory information.
In my opinion, the financial statements:
• give a true and fair view of the financial position of PMNSW as at 30 June 2018 and of its
financial performance and its cash flows for the year then ended in accordance with Australian
Accounting Standards
• are in accordance with section 41B of the Public Finance and Audit Act 1983 (PF&A Act) and
the Public Finance and Audit Regulation 2015.
My opinion should be read in conjunction with the rest of this report.
Basis for Opinion
I conducted my audit in accordance with Australian Auditing Standards. My responsibilities under the
standards are described in the ‘Auditor’s Responsibilities for the Audit of the Financial Statements’
section of my report.
I am independent of PMNSW in accordance with the requirements of the:
• Australian Auditing Standards
• Accounting Professional and Ethical Standards Board’s APES 110 ‘Code of Ethics for
Professional Accountants’ (APES 110).
I have fulfilled my other ethical responsibilities in accordance with APES 110.
Parliament promotes independence by ensuring the Auditor-General and the Audit Office of
New South Wales are not compromised in their roles by:
• providing that only Parliament, and not the executive government, can remove an
Auditor-General
• mandating the Auditor-General as auditor of public sector agencies
• precluding the Auditor-General from providing non-audit services.
I believe the audit evidence I have obtained is sufficient and appropriate to provide a basis for my
audit opinion.
Other Information
Other information comprises the information included in PMNSW annual report for the year ended 30
June 2018, other than the financial statements and my Independent Auditor’s Report thereon. The
members of the Board of PMNSW are responsible for the other information. At the date of this
Independent Auditor’s Report, the other information I have received comprises the Statement by
Members.
My opinion on the financial statements does not cover the other information. Accordingly, I do not
express any form of assurance conclusion on the other information.
In connection with my audit of the financial statements, my responsibility is to read the other
information and, in doing so, consider whether the other information is materially inconsistent with the
financial statements or my knowledge obtained in the audit, or otherwise appears to be materially
misstated.
If, based on the work I have performed, I conclude there is a material misstatement of the other
information, I must report that fact.
I have nothing to report in this regard.
The Board’s Responsibilities for the Financial Statements
The members of the Board are responsible for the preparation and fair presentation of the financial
statements in accordance with Australian Accounting Standards and the PF&A Act, and for such
internal control as the members of the Board determine is necessary to enable the preparation and fair
presentation of the financial statements that are free from material misstatement, whether due to fraud
or error.
In preparing the financial statements, the members of the Board are responsible for assessing
PMNSW’s ability to continue as a going concern, disclosing as applicable, matters related to going
concern and using the going concern basis of accounting except where PMNSW will be dissolved by
an Act of Parliament or otherwise cease operations.
Auditor’s Responsibilities for the Audit of the Financial Statements
My objectives are to:
• obtain reasonable assurance about whether the financial statements as a whole are free from
material misstatement, whether due to fraud or error
• issue an Independent Auditor’s Report including my opinion.
Reasonable assurance is a high level of assurance, but does not guarantee an audit conducted in
accordance with Australian Auditing Standards will always detect material misstatements.
Misstatements can arise from fraud or error. Misstatements are considered material if, individually or
in aggregate, they could reasonably be expected to influence the economic decisions users take
based on the financial statements.
A description of my responsibilities for the audit of the financial statements is located at the Auditing
and Assurance Standards Board website at: www.auasb.gov.au/auditors_responsibilities/ar4.pdf. The
description forms part of my auditor’s report.

My opinion does not provide assurance:
• that PMNSW carried out its activities effectively, efficiently and economically
• about the security and controls over the electronic publication of the audited financial
statements on any website where they may be presented
• about any other information which may have been hyperlinked to/from the financial statements.
Weini Liao
Director, Financial Audit Services
20 September 2018
SYDNEY


Note Actual Actual
2018 2017
$'000 $'000
Revenue
Sale of Goods and Services B1(a) 188,979 118,905
Investment Revenue B1(b) 16,049 21,740
Grants and Contributions B1(c) 96,004 52,427
Other Revenue B1(d) 6,259 11,119
Total Revenue 307,291 204,191
Expenses Excluding Losses
Operating Expenses:
Personnel Services Expenses B2(a) - 12,297
Property Related Expenses B2(b) 145,252 103,076
Other Operating Expenses B2(c) 62,143 39,255
Depreciation and Amortisation B2(d) 79,356 58,253
Grants and Subsidies B2(e) - 3,200
Finance Costs B2(f) 131,729 66,968
Total Expenses Excluding Losses 418,480 283,049
Gain/(Loss) on Disposal of Non-Current Assets B3(a) 2,171 65
Other Gains/(Losses) B3(b) 98,976 116,424
Net Result Before Income Tax Equivalent (10,042) 37,631
Income Tax Equivalent B4(a) - -
Net Result After Income Tax Equivalent (10,042) 37,631
Other Comprehensive Income
Items that will not be Reclassified to Net Result:
Net Increase/(Decrease) in Property, Plant and
Equipment Revaluation Surplus E1(b) 31,548 41,519
Total Other Comprehensive Income 31,548 41,519
TOTAL COMPREHENSIVE INCOME 21,506 79,150
[The accompanying notes form part of these financial statements]
PLACE MANAGEMENT NSW
Audited Financial Statements
Statement of Comprehensive Income
For the Year Ended 30 June 2018
- 1 -

Notes Actual Actual
2018 2017
$'000 $'000
ASSETS
Current Assets
Cash and Cash Equivalents C1(a) 178,457 212,072
Receivables C2(a) 63,120 65,323
Inventories C3(a) 758 587
Non-Current Assets Held for Sale C4(a) 25,000 25,000
Total Current Assets 267,335 302,982
Non-Current Assets
Receivables C2(a) 145,267 154,922
Investment Properties C5(a) 614,532 519,439
Property, Plant and Equipment C6(a) 1,871,305 1,877,143
Intangible Assets C8(a) 575 2,279
Total Non-Current Assets 2,631,679 2,553,783
TOTAL ASSETS 2,899,014 2,856,765
LIABILITIES
Current Liabilities
Trade and Other Payables D1(a) 114,087 109,367
Borrowings D2(a) 12,207 18,477
Provisions D3(a) 5,688 7,840
Other Liabilities D4(a) 5,460 4,330
Total Current Liabilities 137,442 140,014
Non-Current Liabilities
Borrowings D2(a) 1,340,697 1,316,517
Other Liabilities D4(a) 33,027 33,892
Total Non-Current Liabilities 1,373,724 1,350,409
TOTAL LIABILITIES 1,511,166 1,490,423
NET ASSETS 1,387,848 1,366,342
EQUITY
Accumulated Funds E1(a) 1,230,371 1,240,413
Asset Revaluation Reserve E1(b) 157,477 125,929
TOTAL EQUITY 1,387,848 1,366,342
PLACE MANAGEMENT NSW
Statement of Financial Position
As At 30 June 2018
[The accompanying notes form part of these financial statements]
- 2 -

Asset Asset
Accumulated Revaluation Total Accumulated Revaluation Total
Note Funds Reserve Equity Funds Reserve Equity
2018 2018 2018 2017 2017 2017
$'000 $'000 $'000 $'000 $'000 $'000
Opening Balance 1,240,413 125,929 1,366,342 1,277,000 158,755 1,435,755
Net Result for the Year (10,042) (10,042) 37,631 37,631
Other Comprehensive Income
Transfer of Asset Revaluation Reserve
on Disposed Assets E1(a) - - - 74,345 (74,345) -
Net Increase/(Decrease) in Property, Plant
and Equipment Revaluation Surplus E1(b) - 31,548 31,548 - 41,519 41,519
Total Other Comprehensive Income - 31,548 31,548 74,345 (32,826) 41,519
Total Comprehensive Income for the Year (10,042) 31,548 21,506 111,976 (32,826) 79,150
Transactions with Owners as Owners
Financial Distributions E1(a) - - - (115,113) - (115,113)
Net Increase/(Decrease) in Net Assets from
Equity Transfers E1(a) - - - (33,450) - (33,450)
Total Transactions with Owners as Owners - - - (148,563) - (148,563)
Closing Balance 1,230,371 157,477 1,387,848 1,240,413 125,929 1,366,342
PLACE MANAGEMENT NSW
Statement of Changes in Equity
For the Year Ended 30 June 2018
[The accompanying notes form part of these financial statements]
- 3 -

Note Actual Actual
2018 2017
$'000 $'000
CASH FLOWS FROM OPERATING ACTIVITIES
Payments
Payments to Suppliers (inclusive of GST) (213,273) (144,293)
Finance Costs (99,657) (35,839)
Grants and Subsidies - (3,200)
Income Tax Equivalent Paid - (288)
Other (6,133) (4,895)
Total Payments (319,063) (188,515)
Receipts
Receipts from Customers (inclusive of GST) 234,197 182,150
Interest Received 2,212 2,734
Grants and Contributions 96,004 52,427
Total Receipts 332,413 237,311
NET CASH FLOWS FROM OPERATING ACTIVITIES C1(c) 13,350 48,796
CASH FLOWS FROM INVESTING ACTIVITIES
Purchases of Property, Plant and Equipment (40,282) (4,365)
Proceeds from Sale of Property, Plant and Equipment 7,480 65
Proceeds from Monetisation of Finance Lease Receivable - 188,489
NET CASH FLOWS FROM INVESTING ACTIVITIES (32,802) 184,189
CASH FLOWS FROM FINANCING ACTIVITIES
Payment of Finance Lease Liabilities (14,163) (3,968)
Financial Distributions to the State Government E1(a) - (115,113)
Proceeds from Refinancing Gain - 32,326
NET CASH FLOWS FROM FINANCING ACTIVITIES (14,163) (86,755)
NET INCREASE/(DECREASE) IN CASH AND CASH EQUIVALENTS (33,615) 146,230
Opening Cash and Cash Equivalents 212,072 65,842
CLOSING CASH AND CASH EQUIVALENTS C1(a) 178,457 212,072
[The accompanying notes form part of these financial statements]
PLACE MANAGEMENT NSW
Statement of Cash Flows
For the Year Ended 30 June 2018
- 4 -

A1. REPORTING ENTITY
Place Management NSW (PMNSW) was established under the Place Management NSW Act 1998 ("the Act") and is
responsible for Sydney’s most historically and culturally significant waterfront locations - principally within The Rocks and
Darling Harbour precincts in Sydney. These responsibilities include the care, protection, management and promotion of
this land and its important buildings. Place Management NSW also manages significant commercial and retail leases,
provides security, cleaning, building maintenance and other asset management services, and cares for the public domain
and over 100 heritage items.
PMNSW commenced operations in 1998 and is domiciled in Australia. Its principal business address is Foreshore House,
66 Harrington St, The Rocks, Sydney NSW 2000. PMNSW is indirectly consolidated as part of the NSW Total State Sector
Accounts.
These financial statements for the year ended 30 June 2018 have been authorised for issue by PMNSW's Board on 20
September 2018.
A2. BASIS OF PREPARATION AND SIGNIFICANT ACCOUNTING POLICIES
(a) Basis of Preparation
PMNSW's financial statements are general-purpose financial statements which have been prepared on an accrual basis
and in accordance with:
(i) applicable Australian Accounting Standards (which include Australian Accounting Interpretations);
(ii) the requirements of the Public Finance and Audit Act 1983 and Public Finance and Audit Regulation 2015 ; and
(iii) the Financial Reporting Directions mandated by the Treasurer.
Property, plant and equipment, assets held for sale and investment property are measured at fair value. Borrowings are
initially measured at the fair value of the consideration received and subsequently using the effective interest method.
Other financial report items are prepared in accordance with the historical cost convention except where specified
otherwise.
In the application of PMNSW’s accounting policies, management is required to make judgements, estimates and
assumptions about carrying values of assets and liabilities that are not readily apparent from other sources. The estimates
and associated assumptions are based on historical experience and other factors that are considered to be relevant. The
estimates and underlying assumptions are reviewed on an ongoing basis. Revisions to accounting estimates are
recognised in the period in which the estimates are recognised, or in the period in which the estimate is revised if the
revision affects only that period, or in the period of the revision and future periods if the revision affects both current and
future periods. Judgements, key assumptions and estimations made by management are disclosed in the relevant notes
to the financial statements.
PMNSW has assessed its profit status for the financial year ended 30 June 2018 and determined its status as
not-for-profit for financial reporting purposes, as profit is not its principle objective. All amounts are rounded to the
nearest one thousand dollars ($'000) and are expressed in Australian currency.
(b) Statement of Compliance
The financial statements and accompanying notes comply with Australian Accounting Standards, which include Australian
Accounting Interpretations.
PLACE MANAGEMENT NSW
Section A: Entity Information and Basis of Preparation
Notes to and Forming Part of the Financial Statements for the Year Ended 30 June 2018
- 5 -

PLACE MANAGEMENT NSW
Section A: Entity Information and Basis of Preparation
Notes to and Forming Part of the Financial Statements for the Year Ended 30 June 2018
(c) Accounting for the Goods and Services Tax (GST)
Income, expenses and assets are recognised net of the amount of GST, except that the:
(i) amount of GST incurred by PMNSW as a purchaser that is not recoverable from the Australian Taxation Office is
recognised as part of an asset’s cost of acquisition or as part of the expense; and
(ii) receivables and payables are stated inclusive of the amount of GST included.
(iii) commitment amounts disclosed in the financial statements include the amount of GST recoverable from, or payable to,
the Australian Taxation Office.
Cash flows are included in the cash flow statement on a gross basis. However, the GST components of cash flows arising
from investing and financing activities which is recoverable from, or payable to, the Australian Taxation Office are
classified as operating cash flows.
(d) Comparative information
Except when an Australian Accounting Standard permits or requires otherwise, comparative information is disclosed in
respect of the previous period for all amounts reported in the financial statements.
(e) Fair Value Measurement and Hierarchy
Fair value is the price that would be received to sell an asset or paid to transfer a liability in an orderly transaction
between market participants at the measurement date. The fair value measurement is based on the presumption that the
transaction to sell the asset or transfer the liability takes place either in the principal market for the asset or liability or in
the absence of a principal market, in the most advantageous market for the asset or liability.
A number of PMNSW’s accounting policies and disclosures require the measurement of fair values, for both financial and
non-financial assets and liabilities. When measuring fair value, the valuation technique used maximises the use of relevant
observable inputs and minimises the use of unobservable inputs. Under AASB 13 PMNSW categorises, for disclosure
purposes, the valuation techniques based on the inputs used in the valuation techniques as follows:
Level 1 – quoted prices in active markets for identical assets/liabilities that PMNSW can access at the measurement date.
Level 2 – inputs other than quoted prices included within Level 1 that are observable, either directly or indirectly.
Level 3 – inputs that are not based on observable market data (unobservable inputs).
PMNSW recognises transfers between levels of the fair value hierarchy at the end of the reporting period during which the
change has occurred. Refer to Notes C4, C5, C6, C7 and F1 for further disclosures regarding fair value measurements of
financial and non-financial assets.
(f) Changes in Accounting Policy including New or Revised Australian Accounting Standards
(i) Effective for the First Time in 2017-18
The accounting policies applied in 2017-18 are consistent with those of the previous financial year except as a result of
the following revised Australian Accounting Standards that have been applied for the first time in 2017-18:
- AASB 2016-2 Amendments to Australian Accounting Standards – Disclosure Initiative: Amendments to AASB 107
Statement of Cash Flows.
- AASB 2016-4 Amendments to Australian Accounting Standards – Recoverable Amount of Non-Cash-Generating
Specialised Assets of Not-for-Profit Entities.
- AASB 2016-7 Amendments to Australian Accounting Standards – Deferral of AASB 15 for Not-for-Profit Entities.
- AASB 2017-2 Amendments to Australian Accounting Standards – Further Annual Improvements 2014-2016 Cycle.
The adoption of the above revised Australia Accounting Standards have not had any significant impact on PMNSW.
- 6 -

PLACE MANAGEMENT NSW
Section A: Entity Information and Basis of Preparation
Notes to and Forming Part of the Financial Statements for the Year Ended 30 June 2018
(ii) Issued but Not Yet Effective
NSW public sector entities are not permitted to early adopt new Australian Accounting Standards, unless Treasury
determines otherwise. There are a number of recently issued or amended Australian Accounting Standards which are not
yet effective and have not been adopted for the reporting period ending 30 June 2018.
The following new Australian Accounting Standards, excluding standards not considered applicable or material to PMNSW
have not been applied and are not yet effective. The possible impact of these standards in the period of initial
application includes:
- AASB 16 "Leases" has application from annual reporting periods on or after 1 January 2019. This standard generally
requires a lessee to recognise right-of-use asset and lease liability at a lease's commencement date except for short
term and low value asset leases. The requirements for lessor accounting have been carried forward from AASB 117
largely unchanged. As PMNSW is not a lessee in most of its leasing arrangements, the change is not expected to
materially impact the financial statements.
- AASB 15 "Revenue from Contracts with Customers", including the amendments AASB 2014-5, AASB 2015-8 and AASB
2016-3 has application from annual reporting periods on or after 1 January 2019. PMNSW believes this standard may
impact on the timing recognition of certain Other Revenue given the core principle of the new standard requires revenue to
be recognised at the transaction price when control of the goods or services are transferred to the customer. The model
features a contract-based five step analysis of transactions to determine the nature, amount and timing of revenue arising
from contracts with customers.
- AASB 1058 "Income of Not-for-profit Entities" and AASB 2016-8 Amendments to Australian Accounting Standards –
Australian Implementation Guidance for Not-for-Profit Entities has application from annual reporting periods on or after 1
January 2019. The introduction of AASB 1058 results in the amendment of AASB 1004 "Contributions" with many of its
requirements being revised and relocated to AASB 1058. PMNSW is yet to undertake a detailed assessment of the impact
of AASB 1058 however management believe the initial adoption may defer the recognition of grant income in some
circumstances.
The impact of the following standards in the period of initial application is not expected to be significant.
Applicable to Annual
Standard Reporting Periods
Beginning on or after
AASB 9 "Financial Instruments" 1 January 2018
AASB 2016-6 "Amendments to Australian Accounting Standards - Applying AASB 9
Financial Instruments with AASB 4 Insurance Contracts" 1 January 2018
AASB 2017-1 "Amendments to Australian Accounting Standards – Transfers of
Investment Property, Annual Improvements 2014-2016 Cycle and Other Amendments" 1 January 2019
AASB 1059 "Service Concession Arrangements: Grantors" 1 January 2019
- 7 -

B1. REVENUE
Recognition and Measurement - Revenue
Revenue is measured at the fair value of the consideration or contribution received or receivable. PMNSW recognises
revenue when the amount of revenue can be reliably measured, it is probable that future economic benefits will flow to the
entity, and specific criteria have been met for each of PMNSW's activities as described below. The amount of revenue is
not considered to be reliably measurable until all contingencies relating to the sale have been resolved. Amounts
disclosed as revenue are net of returns, trade allowances, rebates, subvention discounts and amounts collected on behalf
of third parties.
Additional comments regarding the accounting policies for the recognition and measurement of revenue are noted within
each revenue category below.
(a) Sale of Goods and Services 2018 2017
$'000 $'000
Property Rental Income (i) 62,014 52,539
Major Assets Income (ii):
Venue Hire Revenue 117,053 55,777
Parking Revenue 9,912 10,589
188,979 118,905
(i) Property Rental Income - Dissection 2018 2017
$'000 $'000
Operating Lease Revenue 61,946 52,471
Long Term Operating Lease Revenue (Note D4(a)) 68 68
62,014 52,539
Future Minimum Lease Receipts under Non-Cancellable Operating Leases as Lessor
Receivable within one year 27,895 22,820
Receivable later than 1 year but not later than 5 years 73,205 58,727
Receivable later than 5 years 220,417 222,069
Total Including GST 321,517 303,616
The above represents future minimum lease receipts on PMNSW's owned properties. Future minimum lease receipts
as at 30 June 2018 include GST payable of $29.2 million ($27.6 million at 30 June 2017).
Operating lease income is recognised in accordance with AASB 117 "Leases". Lease income from operating leases
where PMNSW is the lessor is recognised as income in the Statement of Comprehensive Income on a straight-line basis
over the lease term. Contingent rental income is recognised as income in the period in which it is earned.
Leases are entered into at market rates and on commercial terms. Regular market valuations and tendering processes
are carried out to ensure commercial arrangements are maintained. Annual rents are varied by either a CPI review, a
market review, on a fixed basis, or the greater of a percentage of gross income or land value. Lease terms vary between
1 year and 99 years.
(ii) Amounts received upfront for events held at major asset venues are recognised as deferred income. The revenue is
then recognised as venue hire revenue after the event is held.
Major assets parking revenue is recognised from Casual Car Parking, Permanent Car Parking, Vending Machines and
Parking Voucher Sales.
PLACE MANAGEMENT NSW
Section B: Financial Performance
Notes to and Forming Part of the Financial Statements for the Year Ended 30 June 2018
- 8 -

PLACE MANAGEMENT NSW
Section B: Financial Performance
Notes to and Forming Part of the Financial Statements for the Year Ended 30 June 2018
(b) Investment Revenue 2018 2017
$'000 $'000
Property Finance Lease Income ((i) and Note C2(c)) 13,837 19,006
Interest Earned (ii) 2,212 2,734
16,049 21,740
(i) Income from finance leases as lessor includes contingent rent of $2.9 million in 2017-18 ($2.3 million in 2016-17).
Contingent rent is calculated as the difference between the current lease payments and the minimum lease payments
which were determined at the initial recognition of the finance lease arrangement.
Finance lease income is recognised in accordance with AASB 117 "Leases". Lease income from finance leases where
PMNSW is the lessor is recognised as income in the Statement of Comprehensive Income over the lease period so as to
allocate finance income over the lease term on a systematic and rational basis. This income allocation is based on a
pattern reflecting a constant period return on PMNSW’s net investment in the lease.
The estimated unguaranteed residual value used in computing PMNSW's gross investment in each lease is reviewed
regularly. If there has been a reduction in the estimated unguaranteed residual value, the income allocation over the lease
term is revised and any reduction in respect of amounts accrued is recognised immediately. Contingent rent from finance
leases as lessor is recognised as income in the period in which it is earned. Contingent rental income is generally
determined based on a percentage of tenant's revenue or sales.
(ii) Interest revenue is recognised using the effective interest method as set out in AASB 139 "Financial Instruments:
Recognition and Measurement". Interest earned is received on all PMNSW bank accounts.
(c) Grants and Contributions 2018 2017
$'000 $'000
State Government Contribution (i) 96,004 52,427
96,004 52,427
(i) Grant revenue comprises funding from the NSW Government for the Sydney International Convention, Exhibition and
Entertainment Precinct (SICEEP) costs. The grant provides funding for any shortfall experienced by PMNSW in relation
to SICEEP expenditures not covered by SICEEP revenues without further conditions.
(ii) Grants and contributions are recognised as income when PMNSW obtains control over the assets comprising the grant or
contribution, it is probable that the economic benefits will flow to PMNSW, and the amount of the grant or contribution can
be measured reliably. Control is normally obtained upon the receipt of cash.
(d) Other Revenue 2018 2017
$'000 $'000
Refinancing Gain - Finance Lease 804 546
First Time Recognition of Property, Plant and Equipment - 5,871
Development Contributions 189 70
Marketing Revenue (i) 3,164 2,238
Other 2,102 2,394
6,259 11,119
(i) Marketing revenue mostly is recognised from venue hire and advertising revenue at The Rocks and Darling Harbour
precincts.
- 9 -

PLACE MANAGEMENT NSW
Section B: Financial Performance
Notes to and Forming Part of the Financial Statements for the Year Ended 30 June 2018
B2. EXPENSES EXCLUDING LOSSES
(a) Personnel Services Expenses 2018 2017
$'000 $'000
Salaries and Wages (Including Recreation Leave) - 8,666
Superannuation (Defined Contribution Plans) - 785
Other Personnel Related Expenses - 2,846
- 12,297
PMNSW does not employ staff, however, to enable it to exercise its functions, PMNSW can obtain personnel services from
Government agencies that are able to engage staff under Part 4 of the Government Sector Employment Act 2013 . PMNSW
has no employee liabilities or provisions.
Up to 27 January 2017, personnel services were provided by the Department of Finance, Services & Innovation (DFSI).
From 28 January 2017, all administrative and operational services (including personnel services) to enable PMNSW
to exercise its functions, were transferred to Property NSW (PNSW) under formal agreement. Services provided by
Property NSW to PMNSW from this date are recognised as an administration charge under Other Operating
Expenses within Service Charges (Note B2(c)).
(b) Property Related Expenses 2018 2017
$'000 $'000
Major Assets Expenses (i):
Contractor Expenses 57,693 30,149
Operating Expenses 43,700 33,880
Management Fees 22,850 10,366
Place Management Expenses (ii) 16,957 14,009
Project Development Expenses (iii) - 12,113
Other Expenses 4,052 2,559
145,252 103,076
(i) Major assets contractor and operating expenses in 2018 reflect an increase in events held at venues due to the opening
of the new International Convention Centre (ICC) Sydney in December 2016.
(ii) Place management expenses include security, cleaning, waste management, utilities, taxes, and horticultural services.
(iii) Project development expenses include SICEEP costs of $10.7 million in 2016-17. The SICEEP project involving the
redevelopment of the former Sydney Convention and Exhibition Centre (SCEC), the Sydney Entertainment Centre (SEC),
the SEC car park and surrounding public realm will create an integrated and world class convention, exhibition and
entertainment precinct. The SICEEP project was procured through a Public Private Partnership (PPP) arrangement. The
main building ICC Sydney has been recognised in PMNSW's Statement of Financial Position with a corresponding
liability reflecting the PPP transaction.
- 10 -

PLACE MANAGEMENT NSW
Section B: Financial Performance
Notes to and Forming Part of the Financial Statements for the Year Ended 30 June 2018
(c) Other Operating Expenses 2018 2017
$'000 $'000
Administration 1,519 1,098
Information & Technology Expenses 752 1,737
Contractors 10,477 5,273
Consultants 98 898
Legal Fees 1,003 609
Auditor's Remuneration - Audit of Financial Statements 271 239
Allowance for Impairment of Receivables, Net of Recovery (56) 62
Marketing and Advertising 5,075 3,589
PAG Integration Project Costs (i) 12,946 5,487
Service Charges (ii):
DFSI Corporate Costs 3,753 2,385
PAG Service Charge 8,395 5,884
Repairs and Maintenance (iii) 17,017 11,543
Insurance (iv) 893 451
62,143 39,255
(i) PAG Integration Project Costs relate to PMNSW's contribution to Property and Advisory Group (PAG) Integration Project.
(ii) Services Charges comprise DFSI Corporate Costs relating to DFSI recoupments of corporate charges from PMNSW
and PAG Service Charge relating to Property NSW recoupments of employee related costs from PMNSW.
(iii) Reconciliation of Total Maintenance Expense:
Maintenance expense - contracted labour and other (Note B2(c)) 17,017 11,543
Personnel Services relating to maintenance - 1,333
Total Maintenance Expense 17,017 12,876
Day-to-day servicing costs or maintenance are charged as expenses as incurred, except where they relate to the
replacement of a part or component of an asset, in which case the costs are capitalised and depreciated.
(iv) PMNSW holds insurance policies covering property, public liability, workers compensation, directors’ liability and other
contingencies. These insurance covers are conducted through the NSW Treasury Managed Fund Scheme of self
insurance for Government agencies. The premium is determined by the Fund Manager based on past claims experience
and the insurance coverage is reviewed periodically to ensure that it is adequate.
(d) Depreciation and Amortisation Expense: 2018 2017
$'000 $'000
Depreciation of Property, Plant and Equipment (Note C6(b)) 78,509 50,353
Depreciation of Leasehold Assets (Note C6(b)) - 7,019
Amortisation of Intangible Assets (Note C8(b)) 847 881
79,356 58,253
- 11 -

PLACE MANAGEMENT NSW
Section B: Financial Performance
Notes to and Forming Part of the Financial Statements for the Year Ended 30 June 2018
Recognition and Measurement - Depreciation and Amortisation
Depreciation is provided for on a straight-line basis for all depreciable assets so as to write off the depreciable amount of
each asset as it is consumed over its useful life by PMNSW. Estimates of remaining useful lives are made on an annual
basis. All material separately identifiable components of assets are depreciated over their shorter useful lives.
The following asset useful lives have been applied:
Asset Class 2018 2017
Years Years
Buildings and Improvements 40 40
Infrastructure 10-200 10-200
Leasehold Improvements 3 3
Plant and Equipment 3-33 3-33
Intangible Assets 3-5 3-5
Land is also not depreciated as land is not a depreciable asset. Art and artefacts may not have a limited useful life
because appropriate curatorial and preservation policies are adopted.
In accordance with AASB 5 "Non-current Assets Held for Sale and Discontinued Operations", any assets held for sale
are not depreciated.
(e) Grants and Subsidies 2018 2017
$'000 $'000
Grants to Other Government Agencies - 3,200
- 3,200
(f) Finance Costs 2018 2017
$'000 $'000
TCorp Interest on Borrowings 14,280 -
Finance Lease Interest Charges (Note D2(b)) 83,990 66,968
Swap Break Costs (i) 33,459 -
131,729 66,968
(i) On 2 January 2018, PMNSW exercised the Conditional Debt Pay Down (CDPD) a year earlier than it was planned for its
finance lease liability from International Convention Centre Sydney with Darling Harbour Live consortium. As a result of
the early CDPD, PMNSW was required to pay an early termination amount to compensate the consortium for breaking its
swap agreements with various financial institutions in relation to external debt held for the project.
Borrowing Costs
Borrowing costs comprise mainly interest on borrowings and finance lease interest charges. In accordance with
Treasury’s Mandate for the not-for-profit general government sector agencies, borrowing costs are expensed and
recognised in the Statement of Comprehensive Income in the period in which they are incurred.
B3. GAINS AND LOSSES
(a) Gain/(Loss) on Disposal of Non-Current Assets 2018 2017
$'000 $'000
Net Proceeds from Disposal of Non-Current Assets 7,502 65
Written Down Value (Note C5(b) and C6(b)) (5,331) -
Net Gain/(Loss) on Disposal 2,171 65
- 12 -

PLACE MANAGEMENT NSW
Section B: Financial Performance
Notes to and Forming Part of the Financial Statements for the Year Ended 30 June 2018
(b) Other Gains/(Losses) 2018 2017
$'000 $'000
Fair Value Increment on Investment Property Revaluation (Note C5(b)) 100,386 51,625
Impairment of Non-Current Assets (1,410) -
Gain on Derecognition of Finance Lease Receivable (i) - 61,137
Make Good Provision Adjustment - 1,177
Recreation Leave and Long Service Leave Provision Adjustments (ii) - 2,485
98,976 116,424
(i) In 2017, PMNSW assigned 30 years lease income from the Darling Quarter 99 year lease to a private sector purchaser
and received $192 million for the assignment. A net gain from this transaction of $61.1 million was recognised in 2017.
(ii) All outstanding provisions for employee entitlements were settled with the Department of Finance, Services and Innovation
in 2017. As PMNSW is not an employer, it does not recognise any employee entitlement liabilities (Note B2(a)).
B4. INCOME TAX EQUIVALENT
(a) Income Tax Equivalent Calculation 2018 2017
$'000 $'000
Surplus Before Income Tax Equivalent: (10,042) 37,631
Prepaid Rental Revenue - Long Term Leases (Note B1(a)(i)) (93) (68)
Fair Value Increment on Investment Property Revaluation (Note B3(b)) (100,386) (51,625)
Grant Revenue (Note B1(c)) (96,004) (52,427)
Finance Revenue - Long Term Leases (Note B1(b)) (13,837) (19,006)
Gain on Derecognition of Finance Lease Receivable (B3(b)) - (61,137)
Rental Received- Finance Leases 13,837 11,217
Notional Taxable Surplus/(Deficit) (206,525) (135,415)
Income Tax Equivalent Calculated at 30% of Notional Taxable Surplus - -
Total Income Tax Equivalent - -
Recognition and Measurement - Income Tax Equivalent
In accordance with TPP 03-04 "Tax Equivalent Regime For Government Business", PMNSW is subject to paying tax
equivalents calculated based on the accounting profit model at the prevailing company tax rate 30%. As per Treasury
policy, prior year losses cannot be used to reduce accounting profits. PMNSW has obtained approval from the Revenue
NSW to exclude the following additional items from its accounting profit for the purpose of calculating its income tax
equivalent liability:
- amortised leased income for long-term leases entered into before 1 January 2007;
- unrealised movements in the fair value of PMNSW’s investment properties;
- gain or loss on revaluation of property, plant and equipment;
- finance revenue on long term leases; and
- Treasury grants for the Sydney International Convention, Exhibition and Entertainment Precinct development.
In accordance with the NSW Treasury requirements under the Tax Equivalent Regime, PMNSW does not practice tax
effect accounting.
- 13 -

C1. CASH AND CASH EQUIVALENTS
(a) Cash and Cash Equivalents Dissection 2018 2017
$'000 $'000
Cash at Bank and On Hand
Operating Funds 176,890 210,653
Restricted Cash (b) 1,567 1,419
178,457 212,072
Cash and Cash Equivalents in the Statement of Financial Position include cash at bank and in hand. Interest is earned on
daily bank balances at Reserved Bank of Australia's cash rate.
Interest Rate Risk
The effect on the Net Result and Equity due to a reasonably possible change in risk variable is outlined in the information
below, for interest rate risk and other price risk. A reasonably possible change in risk variable has been determined after
taking into account the economic environment in which PMNSW operates and the time frame for the assessment (i.e.
until the end of the next annual reporting period). The sensitivity analysis is based on risk exposures in existence at the
statement of financial position date. The analysis is performed on the same basis as for 2017. The analysis assumes that
all other variables remain constant.
Exposure to interest rate risk arises primarily through PMNSW’s cash and cash equivalents. PMNSW does not account
for any fixed rate financial instruments at fair value through profit or loss or as available for sale. Therefore for these
financial instruments a change in interest rates would not affect profit or loss or equity. A reasonably possible change of
+/-1% is used, consistent with current trends in interest rates (based on official RBA interest rate volatility over the last
five years). The basis will be reviewed annually and amended where there is a structural change in the level of interest
rate volatility. PMNSW’s exposure to interest rate risk is set out below.
Interest Rate Risk - 2018 Carrying
Amount Profit Equity Profit Equity
$'000 $'000 $'000 $'000 $'000
Financial Assets
Cash and Cash Equivalents 178,457 (1,785) (1,785) 1,785 1,785
Interest Rate Risk - 2017 Carrying
Amount Profit Equity Profit Equity
$'000 $'000 $'000 $'000 $'000
Financial Assets
Cash and Cash Equivalents 212,072 (2,121) (2,121) 2,121 2,121
(b) Restricted Cash 2018 2017
$'000 $'000
Opening Restricted Cash at Start of Year 1,419 403
Funds Received 125 1,039
Interest Received 23 7
Maintenance Expenses Paid - (30)
Restricted Cash at the End of the Year 1,567 1,419
The YHA Sinking Fund, Cadi Park Seawall Fund and Precinct Activation Fund, included in cash, are restricted in
application under the lease agreements. Funds can only be spent on maintenance of Sydney Harbour YHA, Cadi Park
Seawall and Precinct Activation activities as defined in the lease agreements.
-1% +1%
PLACE MANAGEMENT NSW
Section C: Assets
Notes to and Forming Part of the Financial Statements for the Year Ended 30 June 2018
-1% +1%
- 14 -

PLACE MANAGEMENT NSW
Section C: Assets
Notes to and Forming Part of the Financial Statements for the Year Ended 30 June 2018
(c) Reconciliation of Cash Flows from Operating Activities to Net Result 2018 2017
After Income Tax Equivalent $'000 $'000
Net Cash Flows from Operating Activities 13,350 48,796
Non Cash Revenues/(Expenses):
Depreciation and Amortisation (79,356) (58,253)
Gain/(Loss) on Disposal of Non-Current Assets 2,171 65
Other Gains/(Losses) 98,976 116,424
Swap Break Costs (33,459) -
Other Property Related Non-Cash Net Revenues/(Expenses) - 2,208
Changes in Operating Assets and Liabilities:
(Decrease)/Increase in Inventories 171 587
(Decrease)/Increase in Receivables (10,879) 3,684
Decrease/(Increase) in Creditors 3,394 (91,336)
Decrease/(Increase) in Provisions (3,212) 1,713
Decrease/(Increase) in Lease Receipts in Advance 68 11,799
Decrease/(Increase) in Revenue in Advance (1,266) 1,944
Net Result After Income Tax Equivalent (10,042) 37,631
(d) Non-Cash Investing and Financing Activities
The following transactions did not involve the use of cash or cash equivalents and are therefore not included in the
Statement of Cash Flows.
Non-Cash Investing and Financing Activities 2018 2017
$'000 $'000
Properties transferred to other Government Agencies (Note E1(a)) - (33,450)
Finance Lease Assets Recognised during the Year - (1,338,962)
Finance Lease Liabilities Recognised during the Year - 1,338,962
TCorp Borrowings for payment of Swap Break Costs (Note B2(f) 33,459 -
TCorp Borrowings for payment of Finance Lease Liability (Note D2(b) and (e)) 1,049,883 -
Early payment of Conditional Debt Pay Down (CDPD) (Note D2(b)and (e)) (1,049,883) -
Non-Cash Investing and Financing Activities 33,459 (33,450)
(e) Reconciliation of Liabilities arising from Financing Activities
2017 Cash Flows 2018
Reconciliation - 2018 $'000 Acquisition Amortisation $'000
Finance Lease Liabilities 1,334,994 (14,163) (1,049,883) - 270,948
TCorp Borrowings - - 1,083,342 (1,386) 1,081,956
Deferred Income - Refinancing Gain 31,780 - - (935) 30,845
Liabilities from Financing Activities 1,366,774 (14,163) 33,459 (2,321) 1,383,749
2016 Cash Flows 2017
Reconciliation - 2017 $'000 Acquisition Amortisation $'000
Finance Lease Liabilities - (3,968) 1,338,962 - 1,334,994
Deferred Income - Refinancing Gain - 32,326 - (546) 31,780
Liabilities from Financing Activities - 28,358 1,338,962 (546) 1,366,774
Non-Cash Changes
Non-Cash Changes
- 15 -

PLACE MANAGEMENT NSW
Section C: Assets
Notes to and Forming Part of the Financial Statements for the Year Ended 30 June 2018
C2. RECEIVABLES
(a) Receivables - Current and Non-Current Dissection 2018 2017
$'000 $'000
Current
Trade Receivables:
Rental Debtors 2,216 2,415
Sundry Debtors 5,685 12,489
Less: Impairment Allowance (b) (197) (342)
Subtotal - Trade Receivables 7,704 14,562
Other Receivables:
Finance Lease Receivables (c) 42,041 41,084
Lessee Lease Incentives (d) 208 1,015
Goods and Services Tax Recoverable 3,940 1,956
Prepayments and Accrued Revenue 9,227 6,706
Total Current Receivables 63,120 65,323
Non-Current
Other Receivables:
Finance Lease Receivables (c) 144,624 154,922
Non-Current Lease Incentive (d) 643 -
Total Non-Current Receivables 145,267 154,922
(b) Impairment Allowance 2018 2017
$'000 $'000
Movement:
Carrying Amount at 1 July (342) (424)
Amounts Written Off 116 153
Amounts Recovered 249 220
(Increase)/Decrease in Allowance (220) (291)
Carrying Amount at 30 June (197) (342)
- 16 -

PLACE MANAGEMENT NSW
Section C: Assets
Notes to and Forming Part of the Financial Statements for the Year Ended 30 June 2018
(c) Finance Lease Receivables 2018 2017
$'000 $'000
Movement:
Carrying Amount at 1 July 196,006 296,054
Reclassification from Non-Current Assets Held for Sale (Note C4(b)) - 36,600
Lease Payments Received (23,178) (155,654)
Property Finance Lease Income (Note B1(b)) 13,837 19,006
Carrying Amount at 30 June 186,665 196,006
(i) Reconciliation between Gross Investment in Finance Leases as Lessor
and the Present Value of the Minimum Lease Payments Receivable
Gross Investment in Finance Leases as Lessor 7,478,040 7,501,217
Less: Unearned Finance Income (7,291,375) (7,305,211)
Present Value of the Minimum Lease Payments Receivable 186,665 196,006
(ii) Aged Reconciliation of the Gross Investment in Finance Leases as Lessor
Not later than one year 43,071 43,007
Later than one year and not later than five years 71,327 89,880
Later than five years 7,363,642 7,368,330
Gross Investment in Finance Leases as Lessor 7,478,040 7,501,217
(iii) Aged Reconciliation of the Present Value of the Minimum Lease
Payments Receivable
Not later than one year 42,041 41,084
Later than one year and not later than five years 60,691 75,038
Later than five years 83,933 79,884
Present Value of the Minimum Lease Payments Receivable 186,665 196,006
(iv) Finance leases as lessor, in which substantially all the risks and rewards incidental to legal ownership are transferred by
PMNSW to the lessee, are classified in the Statement of Financial Position as Finance Lease Receivables and
recognised at an amount equal to the net investment in the lease. Lessee finance lease payments are treated by PMNSW
as repayment of principal and finance income over the lease term to reimburse and reward PMNSW’s investment and
services. Lease payments relating to the period, excluding costs for services, are applied against the gross investment in
the lease to reduce both the principal and the unearned finance income.
PMNSW's material leasing arrangements which give rise to finance lease receivables involve owned properties which are
leased to tenants under lease terms of 50 years or more.
Land under a long term lease, where PMNSW is lessor, is classified as a finance lease if it satisfies the provisions of
AASB 117 "Leases" and Treasury policy TPP 11-01 "Accounting Policy: Lessor classification of long-term land leases".
For long term lease classified as finance lease, a finance lease receivable is recognised at lease commencement equal
to the minimum lease payments plus any unguaranteed residual value at the end of lease, discounted at the interest rate
implicit in the lease. Throughout the term of such a lease, finance lease income is recognised each period, calculated as
the lease receivable multiplied by the interest rate implicit in the lease.
The unguaranteed residual value of all finance leases as lessor accruing to the benefit of PMNSW as at 30 June 2018 is
$19.4 million ($13.2 million at 30 June 2017).
- 17 -

PLACE MANAGEMENT NSW
Section C: Assets
Notes to and Forming Part of the Financial Statements for the Year Ended 30 June 2018
(d) Lessee Lease Incentives
Lease incentives include upfront cash payments to the lessee or the reimbursement or assumption by PMNSW, as the
lessor, of costs of the lessee (such as relocation costs, leasehold improvements, fit-out contributions and costs associated
with a pre-existing lease commitment). Alternatively, the initial period of the lease term may be agreed to be rent-free or at
a reduced rent.
Operating lease incentives represent a reduction of rental income over the lease term and are recognised on a
straight-line basis in accordance with Australian Standards and Interpretations.
(e) Recognition and Measurement - Receivables
Receivables are non-derivative financial assets with fixed or determinable payments that are not quoted in an active
market. These financial assets are recognised initially at fair value, usually based on the transaction cost or face value.
Subsequent measurement is an amortised cost using the effective interest method, less an allowance for any impairment
of receivables. Any changes are recognised in the Net Result when impaired, derecognised or through the amortisation
process.
When there is objective evidence that the amounts due will not be collected, PMNSW recognises an allowance for
impairment. The amount of the allowance is the difference between the receivable's carrying amount and the amount
expected to be received. When an impairment is recognised, the loss is recorded in the Net Result for the year. Where
there is objective evidence of recovering a previously impaired receivable, the reversal of impairment losses is also
recognised through the net result for the year.
Short-term receivables with no stated interest rate are measured at the original invoice amount where the effect of
discounting is immaterial. Such receivables, which generally have 30-day terms, are recognised and carried at original
invoice amount less an allowance for any uncollectible amounts.
(f) Credit Risk - Trade Debtors
All trade debtors are recognised as amounts receivable at balance date. Collectability of trade debtors is reviewed on
an ongoing basis. Procedures as established in the Treasurer’s Directions are followed to recover outstanding amounts,
including letters of demand. Debts which are known to be uncollectable are written off. An allowance for impairment is
raised when there is objective evidence that PMNSW will not be able to collect all amounts due. This evidence includes
past experience, current and expected changes in economic conditions and debtor credit ratings. No interest is earned
on trade debtors. Sales are made on 30-day terms.
PMNSW is not materially exposed to concentrations of credit risk to a single trade debtor or group of debtors. Based on
past experience, debtors which are not past due totalling $6.6 million ($10.2 million as at 30 June 2017) and debtors
that are past due but not considered impaired totalling $1.3 million ($4.1 million as at 30 June 2017) together represent
97.5% (2017: 97.7%) of the total debtors. There are no debtors which are currently not past due or impaired whose
terms have been renegotiated.
The only financial assets that are past due or impaired are rental debtors and sundry debtors. These are included within
Receivables in the Statement of Financial Position.
- 18 -

PLACE MANAGEMENT NSW
Section C: Assets
Notes to and Forming Part of the Financial Statements for the Year Ended 30 June 2018
Credit Risk - 2018 Total
<1 Mth >1 <2 Mths >2 <3 Mths >3 Mths 2018
Financial Assets $'000 $'000 $'000 $'000 $'000
Receivables:
Past Due But Not Impaired 128 954 - - 1,082
Considered Impaired - 1 75 121 197
Total Credit Risk 128 955 75 121 1,279
Credit Risk - 2017 Total
<1 Mth >1 <2 Mths >2 <3 Mths >3 Mths 2017
Financial Assets $'000 $'000 $'000 $'000 $'000
Receivables:
Past Due But Not Impaired - 3,804 - 257 4,061
Considered Impaired - 135 - 207 342
Total Credit Risk - 3,939 - 464 4,403
Notes
1. Each column in the table reports "gross receivables".
2. The aging analysis excludes statutory receivables, as these are not within the scope of AASB 7 and excludes
receivables that are not past due and not impaired. Therefore, the "total" will not reconcile to receivables total recognised
in the statement of financial position.
C3. INVENTORIES
(a) Inventories - Dissection 2018 2017
$'000 $'000
Current
Trading Stock (b) 758 587
Total Current Inventories 758 587
(b) Recognition and Measurement - Inventories
Trading stock are stated at the lower of cost and net realisable value. Cost of stock are determined after deducting
rebates and discounts. Net realisable value is the estimated selling price in the ordinary course of business less the
estimated costs of completion and the estimated costs necessary to make sales. PMNSW’s trading stock is the
inventories (food, beverage and consumables) held by the International Convention Centre Sydney.
C4. NON-CURRENT ASSETS HELD FOR SALE
(a) Non-Current Assets Held for Sale - Dissection 2018 2017
$'000 $'000
Current
Investment Properties 25,000 25,000
Total Current Non-Current Assets Held for Sale 25,000 25,000
(b) Reconciliation of Opening and Closing Carrying Amounts 2018 2017
$'000 $'000
Non-Current Assets Held for Sale
Carrying Amount at 1 July 25,000 36,600
Reclassification from Investment Properties (Note C5(b)) - 25,000
Reclassification to Finance Lease Receivable (Note C2(c)) - (36,600)
Carrying Amount at 30 June 25,000 25,000
Overdue
Overdue
- 19 -

PLACE MANAGEMENT NSW
Section C: Assets
Notes to and Forming Part of the Financial Statements for the Year Ended 30 June 2018
(c) Recognition and Measurement - Non-Current Assets Held for Sale
PMNSW has certain non-current assets classified as held for sale, where their carrying amount will be recovered
principally through a sale transaction, not through continuing use. Non-Current Assets Held for Sale are recognised at
the lower of carrying amount and fair value less costs to sell. These assets are not depreciated while they are classified
as held for sale.
An impairment loss is recognised for any initial or subsequent write-down of the asset to fair value less costs to sell. A
gain is recognised for any subsequent increases in fair value less costs to sell of an asset, but not in excess of any
cumulative impairment loss previously recognised. A gain or loss not previously recognised by the date of the sale of the
non-current asset is recognised at the date of derecognition.
There was no movement in the value of Non-Current Assets Held for Sale in 2017-18 due to the settlement date is
expected in January 2019.
C5. INVESTMENT PROPERTIES
(a) Investment Property - Dissection 2018 2017
$'000 $'000
Non-Current
Investment Properties
At Fair Value 614,532 519,439
Carrying Amount at 30 June 614,532 519,439
(b) Reconciliation of Opening and Closing Carrying Amounts 2018 2017
$'000 $'000
Investment Properties
Carrying Amount at 1 July 519,439 492,814
Disposals (Note B3(a)) (5,293) -
Reclassification to Non-Current Assets Held for Sale (Note C4(b)) - (25,000)
Net Gain/(Loss) from Fair Value Adjustments (Note B3(b)) 100,386 51,625
Carrying Amount at 30 June 614,532 519,439
(c) Amounts Recognised in Profit and Loss for Investment Properties 2018 2017
$'000 $'000
Rental Income 64,126 62,022
Direct Operating Expenses arising from:
Investment Properties that Generated Rental Income (13,093) (10,542)
Investment Properties that did not Generate Rental Income (266) (257)
Total Recognised in Profit and Loss for Investment Properties 50,767 51,223
(d) Recognition and Measurement - Investment Properties
PMNSW owns properties held to earn rentals and/or for capital appreciation. These properties are classified by PMNSW
as Investment Properties in accordance with AASB 140 "Investment Property". Investment properties are stated at fair
value in the Statement of Financial Position, using the valuation technique that maximises the use of relevant observable
inputs. Gains or losses arising from changes in fair value are included in the surplus for the year in the period in which
they arise. No depreciation is charged on investment properties.
Investment properties are comprehensively revalued every three years with interim revaluations performed in the years
between comprehensive revaluations. The last comprehensive revaluation was undertaken by independent valuers, AON
Risk Services Australia on 31 March 2018. The valuation, which conforms to Australian Valuation Standards and Australian
Accounting Standards, was arrived at by reference to market evidence of transaction prices for similar properties and by
the capitalisation of income approach.
- 20 -

PLACE MANAGEMENT NSW
Section C: Assets
Notes to and Forming Part of the Financial Statements for the Year Ended 30 June 2018
C6. PROPERTY, PLANT AND EQUIPMENT
(a) Property, Plant and Equipment - Dissection 2018 2017
$'000 $'000
Non-Current
Land and Buildings
At Fair Value 517,864 493,828
Less Accumulated Depreciation (52,730) (51,662)
Carrying Amount at 30 June 465,134 442,166
Finance Lease Assets
At Fair Value 1,316,017 1,354,727
Less Accumulated Depreciation (92,296) (40,463)
Carrying Amount at 30 June 1,223,721 1,314,264
Infrastructure
At Fair Value 201,651 195,235
Less Accumulated Depreciation (99,926) (95,303)
Carrying Amount at 30 June 101,725 99,932
Plant and Equipment
At Fair Value 51,303 26,242
Less Accumulated Depreciation (25,012) (21,867)
Carrying Amount at 30 June 26,291 4,375
Art and Artefacts
At Fair Value 11,788 11,518
Less Accumulated Depreciation - -
Carrying Amount at 30 June 11,788 11,518
Work in Progress 42,646 4,888
Total Property, Plant and Equipment at 30 June 1,871,305 1,877,143
At Fair Value 2,141,269 2,086,438
Less Accumulated Depreciation (269,964) (209,295)
Total Property, Plant and Equipment at 30 June 1,871,305 1,877,143
- 21 -

PLACE MANAGEMENT NSW
Section C: Assets
Notes to and Forming Part of the Financial Statements for the Year Ended 30 June 2018
(b) Reconciliation of Opening and Closing Carrying Amounts 2018 2017
$'000 $'000
Land and Buildings (Includes Open Spaces and Roads)
Carrying Amount at 1 July 442,166 437,901
Additions - 3,847
Transfer to other NSW Government Agency - (33,450)
Net Revaluation Increment/(Decrement) 28,997 39,681
Depreciation Expense (6,029) (5,813)
Carrying Amount at 30 June 465,134 442,166
Finance Lease Assets
Carrying Amount at 1 July 1,314,264 -
Additions - 1,354,727
Depreciation expense (68,270) (40,463)
Transfer to Plant and Equipment (22,273) -
Carrying Amount at 30 June 1,223,721 1,314,264
Infrastructure
Carrying Amount at 1 July 99,932 96,364
Additions 2,610 4,583
Net Revaluation Increment/(Decrement) 2,281 1,838
Depreciation Expense (3,098) (2,853)
Carrying Amount at 30 June 101,725 99,932
Plant and Equipment
Carrying Amount at 1 July 4,375 5,599
Additions 793 -
Depreciation Expense (1,112) (1,224)
Disposals (Note B3(a)) (38) -
Transfer from Finance Lease Assets 22,273 -
Carrying Amount at 30 June 26,291 4,375
Leasehold Improvements
Carrying Amount at 1 July - 7,019
Depreciation Expense - (7,019)
Carrying Amount at 30 June - -
Art and Artefacts
Carrying Amount at 1 July 11,518 11,518
Net Revaluation Increment/(Decrement) 270 -
Carrying Amount at 30 June 11,788 11,518
Work in Progress
Carrying Amount at 1 July 4,888 18,846
Additions 41,714 4,365
Impairment (553) -
Transfer to Fixed Assets (3,403) (18,323)
Carrying Amount at 30 June 42,646 4,888
Total Property, Plant and Equipment at 30 June 1,871,305 1,877,144
- 22 -

PLACE MANAGEMENT NSW
Section C: Assets
Notes to and Forming Part of the Financial Statements for the Year Ended 30 June 2018
(c) Recognition and Measurement - Property, Plant and Equipment
(i) Acquisitions of Assets
Assets acquired are initially recognised at cost. Cost is the amount of cash or cash equivalents paid or the fair value of
the other consideration given to acquire the asset at the time of its acquisition or construction or, where applicable, the
amount attributed to that asset when initially recognised in accordance with the specific requirements of other Australian
Accounting Standards.
Assets acquired at no cost, or for nominal consideration, are initially recognised as assets and revenues at their fair value
at the date of acquisition. Fair value is the price that would be received to sell an asset in an orderly transaction between
market participants at measurement date.
Where settlement of any part of cash consideration is deferred, its cost is the cash price equivalent, that is, the deferred
payment amount is effectively discounted at an asset-specific rate.
(ii) Capitalisation Thresholds
Property, plant and equipment and intangible assets costing $5,000 and above individually (or forming part of a network
costing more than $5,000) are capitalised.
Property development that gives rise to an effective and material increase in the future economic benefit of the property
to PMNSW is capitalised.
(iii) Revaluation of Property, Plant and Equipment
Physical non-current assets are valued in accordance with Treasury Policy and Guidelines Paper TPP 14-01 "Valuation of
Physical Non-Current Assets at Fair Value". This policy adopts fair value in accordance with AASB 13 "Fair Value
Measurement", AASB 116 "Property, Plant and Equipment" and AASB 140 "Investment Property".
Property, plant and equipment is measured at the highest and best use by market participants that is physically possible,
legally permissible and financially feasible. The highest and best use must be available at a period that is not remote and
take into account the characteristics of the asset being measured, including any social-political restrictions imposed by
government. In most cases after taking into account these considerations, the highest and best use is the existing use. In
limited circumstances, the highest and best use may be a feasible alternative use, where there are no restrictions on use
or where there is a feasible higher restricted alternative use.
Fair value of Property, Plant and Equipment is based on a market participants’ perspective, using valuation techniques
(market approach, cost approach, income approach) that maximise relevant observable inputs and minimise unobservable
inputs. PMNSW revalues each class of property, plant and equipment on an annual basis to ensure that the carrying
amount of each asset in the class does not differ materially from its fair value at reporting date.
Land and Buildings, including open spaces and roads, are comprehensively revalued every three years with interim
revaluations performed in the years between comprehensive revaluations. The last comprehensive revaluation was
undertaken by independent valuers, AON Risk Services Australia (AON) on 31 March 2018.
Finance Lease assets as at 30 June 2018 comprise the International Convention Centre (ICC), Sydney. Finance Lease
assets are comprehensively revalued every 3 years with interim revaluations performed in the years between
comprehensive revaluations when it is necessary.
- 23 -

PLACE MANAGEMENT NSW
Section C: Assets
Notes to and Forming Part of the Financial Statements for the Year Ended 30 June 2018
Infrastructure assets are revalued every five years. The last comprehensive revaluation was performed at 30 June 2014
by AON. Interim revaluations are conducted between comprehensive revaluations. An interim formal revaluation was
completed on 31 March 2018 by AON.
AON also performed a comprehensive revaluation of Art and Artefacts at 30 June 2016. Art and Artefacts are revalued
every 5 years with interim revaluations performed in the years between comprehensive revaluations.
The assets that were not revalued are also shown at fair value as the written down value approximates fair value. At
reporting date there was no indication of impairment.
Non-specialised assets with short useful lives are measured at depreciated historical cost, as an approximation of fair
value. PMNSW has assessed that any difference between fair value and depreciated historical cost is unlikely to be
material.
When revaluing non-current assets using the cost approach, the gross amount and the related accumulated depreciation
are separately restated. For other assets valued using other valuation techniques, any balances of accumulated
depreciation at the revaluation date in respect of those assets are credited to the asset accounts to which they relate. The
net asset accounts are then increased or decreased by the revaluation increments or decrements.
Revaluation increments are credited directly to the asset revaluation reserve, except that, to the extent that an increment
reverses a revaluation decrement in respect of that class of asset previously recognised as an expense in the
surplus/deficit, the increment is recognised immediately as revenue in the surplus/deficit.
Revaluation decrements are recognised immediately as expenses in the surplus/deficit, except that, to the extent that a
credit balance exists in the asset revaluation reserve in respect of the same class of assets, they are debited directly to
the asset revaluation reserve.
As a not-for-profit entity, revaluation increments and decrements are offset against one another within a class of
non-current assets, but not otherwise.
Where an asset that has previously been revalued is disposed of, any balance remaining in the asset revaluation reserve
in respect of that asset is transferred to accumulated funds.
(iv) Finance Lease Assets
A distinction is made between finance leases, which effectively transfer from the lessor to the lessee substantially all the
risks and benefits incidental to ownership of the leased assets, and operating leases under which the lessor effectively
retains all such risks and benefits. Leases in which a significant portion of the risks and rewards of ownership are not
transferred to PMNSW as lessee are classified as operating leases. Payments made under operating leases are charged
to the Statement of Comprehensive income on a straight-line basis over the period of the lease.
Property, Plant and Equipment acquired under finance leases are recognised, at the commencement of the lease, at an
amount equal to the fair value of the leased property, or if lower, the present value of the minimum lease payments. The
corresponding liability to the lessor is included in the Statement of Financial Position as Finance Lease Liabilities
under Borrowings (Note D2). Lease payments are allocated between the principal component of the lease liability and
the finance cost (interest expense). The finance cost is charged to expenses over the lease period so as to produce a
constant periodic rate of interest on the remaining balance of the liability for each period.
After recognition as an asset, an item of property, plant and equipment acquired under finance lease is measured at a
revalued amount, being its fair value at the date of the revaluation less any subsequent accumulated depreciation and
subsequent accumulated impairment losses. Finance leased assets are revalued as part of the property, plant and
equipment revaluation process.
- 24 -

PLACE MANAGEMENT NSW
Section C: Assets
Notes to and Forming Part of the Financial Statements for the Year Ended 30 June 2018
The Finance Lease assets recognised by PMNSW as at 30 June 2018 comprise the International Convention Centre
(ICC), Sydney. The ICC finance lease asset is being amortised over the life of the lease. The ICC commenced operation
in December 2016 and as per Treasury Policy TPP 06-8 "Accounting for Privately Financed Projects", AASB 116
"Property, Plant and Equipment" and AASB 117 "Leases", was initially recognised at the lower of fair value and present
value of the minimum lease payment. An equivalent Finance Lease liability was also recognised under Borrowings within
the Statement of Financial Position (Note D2(b)). The project costs incurred by PMNSW during the construction phase
of SICEEP project were identified as directly attributable to activities for the finance lease and were included in the
calculation of the initial finance lease asset recognition.
(v) Impairment of Property, Plant and Equipment
As a not-for-profit entity with no cash generating units, impairment under AASB 136 "Impairment of Assets" is unlikely to
arise. As property, plant and equipment is carried at fair value, impairment can only arise in the rare circumstances
where the costs of disposal are material. Specifically, impairment is unlikely for not-for-profit entities given that AASB
136 modifies the recoverable amount test for non-cash generating assets of not-for-profit entities to the higher of fair value
less costs of disposal and depreciated replacement cost, where depreciated replacement cost is also fair value.
PMNSW assesses, at each reporting date, whether there is an indication that an asset may be impaired. If any indication
exists, or when annual impairment testing for an asset is required, PMNSW estimates the asset’s recoverable amount.
When the carrying amount of an asset exceeds its recoverable amount, the asset is considered impaired and is written
down to its recoverable amount. As a not for-profit entity, an impairment loss is recognised in the net result to the extent
the impairment loss exceeds the amount in the revaluation surplus for the class of asset.
(vi) Restoration Costs
The present value of the expected cost for the restoration or cost of dismantling of an asset after its use is included in the
cost of the respective asset if the recognition criteria for a provision are met.
(vii) Major Inspection Costs
When each major inspection is performed, the labour cost of performing inspections for faults is recognised in the
carrying amount of an asset as a replacement of a part, if the recognition criteria are satisfied.
(viii) Maintenance
Day-to-day servicing costs or maintenance are charged as expenses as incurred, except where they relate to the
replacement of a part or component of an asset, in which case the costs are capitalised and depreciated.
C7. FAIR VALUE MEASUREMENT OF NON-FINANCIAL ASSETS
(a) Fair Value Hierarchy
2018 Level 1 Level 2 Level 3 Total Fair
Value
$'000 $'000 $'000 $'000
Investment Properties (Note C5) - 614,532 - 614,532
Property, Plant and Equipment (Note C6):
Land and Buildings - 436,734 28,400 465,134
Finance Lease Assets - - 1,223,721 1,223,721
Infrastructure - - 101,725 101,725
Art and Artefacts - 11,788 - 11,788
- 1,063,054 1,353,846 2,416,900
- 25 -

PLACE MANAGEMENT NSW
Section C: Assets
Notes to and Forming Part of the Financial Statements for the Year Ended 30 June 2018
2017 Level 1 Level 2 Level 3 Total Fair
Value
$'000 $'000 $'000 $'000
Investment Properties (Note C5) - 519,439 - 519,439
Property, Plant and Equipment (Note C6): - - - -
Land and Buildings - 392,673 49,493 442,166
Finance Lease Assets - - 1,314,264 1,314,264
Infrastructure - - 99,932 99,932
Art and Artefacts - 11,500 18 11,518
- 923,612 1,463,707 2,387,319
There were no transfers between Level 1 or 2 during 2017-18 (Nil in 2016-17).
(b) Valuation Techniques, Inputs and Processes
For each class of property, plant and equipment, a description of the valuation technique applied and the inputs used in
the fair value measurement is disclosed in the table below. For the valuation process refer to Note C6(c)(iii).
Class
Investment Properties Income approach (recurring) - assets are valued by - Market rental income
converting income to a single current amount and includes - Outgoings
present value techniques. - Vacancy rate
- Capitalisation rate
Land and Buildings Market approach (recurring) - assets are valued based on - Comparable property sales
comparable property sales transactions and where identical values
properties are not available, adjustments have been made to - Adjustments including condition,
reflect the following characteristics of the asset, including location, capital improvements
condition, location or comparability of the asset. or comparability of the asset
Specialised Buildings Current replacement cost approach (recurring) - the - Capital improvements,
assets' current replacement costs were calculated having remaining useful lives
regard to Rawlinson's Australian Construction Handbook - Current replacement cost
2015, with the costs then depreciated to reflect the assets estimates
lives already consumed.
Finance Lease Assets The assets were recognised in 2016-17 financial year, they - Capital improvements,
were valued by current replacement cost approach remaining useful lives
(recurring), same as the specialised buildings disclosed above. - Current replacement cost
estimates
Infrastructure Current replacement cost approach (recurring) - assets - Current unit replacement costs
are valued based on the gross replacement cost of a modern - Professional fees
equivalent asset which has been optimised for the particular - Remaining useful lives
purpose, which is then adjusted for depreciation to reflect
the reduced lifespan of the original asset.
Art and Artefacts Market approach (recurring) - assets are valued based on - Market selling prices
observable market selling prices involving identical or similar assets
Cost approach (recurring) - assets are valued by referring to - Replication costs
cost of constructing another asset that is either a replica of
the original or one that could furnish equal utility.
Valuation Technique Key Inputs
- 26 -

PLACE MANAGEMENT NSW
Section C: Assets
Notes to and Forming Part of the Financial Statements for the Year Ended 30 June 2018
(c) Reconciliation of Recurring Level 3 Fair Value Measurements
2018Land and
Buildings
Leased
AssetsInfrastructure
Art and
Artefacts
Total Recurring
Level 3 Fair
Value
$'000 $'000 $'000 $'000 $'000
Fair Value as at 1 July 49,493 1,314,264 99,932 18 1,463,707
Additions - - 2,610 - 2,610
Gain/(Loss) on Revaluation 815 60,087 2,281 - 63,183
Depreciation (2,006) (68,270) (3,098) - (73,374)
Transfer Level 3 to 2 (19,902) (22,273) - (18) (42,193)
Fair Value as at 30 June 28,400 1,283,808 101,725 - 1,413,933
2017Land and
Buildings
Leased
AssetsInfrastructure
Art and
Artefacts
Total Recurring
Level 3 Fair
Value
$'000 $'000 $'000 $'000 $'000
Fair Value as at 1 July 52,204 - 96,364 18 148,586
Additions - 1,354,727 4,583 - 1,359,310
Gain/(Loss) on Revaluation 148 - 1,838 - 1,986
Depreciation (2,859) (40,463) (2,853) - (46,175)
Fair Value as at 30 June 49,493 1,314,264 99,932 18 1,463,707
C8. INTANGIBLE ASSETS
(a) Intangible Assets - Dissection 2018 2017
$'000 $'000
Non-Current
Intangible Assets - Computer Software
Gross Carrying Amount 3,020 5,076
Less Accumulated Amortisation (2,445) (2,797)
Total Intangible Assets - Computer Software at 30 June 575 2,279
(b) Reconciliation of Opening and Closing Carrying Amounts 2018 2017
$'000 $'000
Intangible Assets - Computer Software
Carrying Amount at 1 July 2,279 3,160
Amortisation expense (847) (881)
Impairment (857) -
Carrying amount at 30 June 575 2,279
(c) Recognition and Measurement - Intangible Assets
PMNSW recognises intangible assets only if it is probable that future economic benefits will flow to PMNSW and the cost
of the asset can be measured reliably. Intangible assets are measured initially at cost. Where an asset is acquired at no
or nominal cost, the cost is its fair value as at the date of acquisition.
All research costs are expensed. Development costs are only capitalised when certain criteria are met.
The useful lives of intangible assets are assessed to be finite. Intangible assets are subsequently measured at fair value
only if there is an active market. As there is no active market for PMNSW’s intangible assets, the assets are carried at
cost less at cost less any accumulated amortisation.
PMNSW’s intangible assets are amortised using the straight line method over a period of either three or five years.
Intangible assets are tested for impairment where an indicator of impairment exists. If the recoverable amount is less than
its carrying amount, the carrying amount is reduced to recoverable amount and the reduction is recognised as an
impairment loss.
- 27 -

D1. PAYABLES
(a) Payables - Dissection 2018 2017
$'000 $'000
Current
Trade Creditors 13,729 3,382
Sundry Creditors and Accruals 60,049 43,068
Finance Lease Interest Accruals 12,098 31,387
Refundable Security Deposits and Bonds 390 540
Forward Deposits 27,821 30,990
Total Current Payables 114,087 109,367
(b) Recognition and Measurement - Payables
Payables represent liabilities for goods and services provided to PMNSW and other amounts. Payables are recognised
initially at fair value, usually based on the transaction cost or face value. Subsequent measurement is at amortised cost
using the effective interest method. Short-term payables with no stated interest rate are measured at the original invoice
amount where the effect of discounting is immaterial.
PMNSW's payables are all non-interest bearing. Payable items which are out of the scope of AASB 7 "Financial
Instruments: Disclosures" have been excluded from the carrying amount shown in the Statement of Financial Position.
(c) Liquidity Risk
Liquidity risk is the risk that PMNSW will be unable to meet its payment obligations when they fall due. PMNSW
manages risk through monitoring future cash flows and maturities planning to ensure adequate holding of high quality
liquid assets. The objective is to maintain a balance between continuity of funding and flexibility through the use of
overdrafts, loans and other advances.
During the current and prior years, there were no defaults on any loans payable. No assets have been pledged as
collateral. PMNSW’s exposure to liquidity risk is deemed insignificant based on prior periods’ data and current
assessment of risk.
(d) Maturity Profile
All of PMNSW's trade payables, sundry payables and accruals have a maturity of less than 12 months (2017: less than
12 months). Amounts owing to suppliers (which are unsecured) are settled in accordance with the policy set out in NSW
Treasury Circular 11/12. For small business suppliers, where terms are not specified, payment is made not later than 30
days from date of receipt of a correctly rendered invoice. For other suppliers, if trade terms are not specified, payment is
made no later than the end of the month following the month in which an invoice or a statement is received. For small
business suppliers, where payment is not made within the specified time period, simple interest must be paid
automatically unless an existing contract specifies otherwise. For payments to other suppliers, PMNSW may
automatically pay the supplier simple interest. The rate of interest applied by PMNSW accords with the current rate
applicable under section 22 of the Taxation Administration Act 1996.
PLACE MANAGEMENT NSW
Section D: Liabilities
Notes to and Forming Part of the Financial Statements for the Year Ended 30 June 2018
- 28 -

PLACE MANAGEMENT NSW
Section D: Liabilities
Notes to and Forming Part of the Financial Statements for the Year Ended 30 June 2018
The tables below summarises the maturity profile and interest rate exposure of PMNSW’s other major payables.
Maturity Profile Nominal
Amount < 1 yr >1yr < 5 yrs > 5 yrs
2018 $'000 $'000 $'000 $'000
Payables:
Security Deposits 308 115 140 53
Casual Bonds 82 82 - -
Forward Deposits 27,821 27,821 - -
28,211 28,018 140 53
2017
Payables:
Security Deposits 387 258 2 127
Casual Bonds 153 153 - -
Forward Deposits 30,990 29,476 1,514 -
31,530 29,887 1,516 127
Interest Rate Exposure Weighted
Average
Effective
Interest Rate
Nominal
Amount
Fixed
Interest Rate
Variable
Interest Rate
Non-interest
Bearing
% $'000 $'000 $'000 $'000
2018
Payables:
Security Deposits 1.51% 308 - 308 -
Casual Bonds - 82 - - 82
Forward Deposits - 27,821 - - 27,821
28,211 - 308 27,903
2017
Payables:
Security Deposits 1.52% 387 - 387 -
Casual Bonds - 153 - - 153
Forward Deposits - 30,990 - - 30,990
31,530 - 387 31,143
Note: The amounts disclosed are the contractual undiscounted cash flows of each class of financial liabilities and
therefore will not reconcile to the statement of financial position.
A maturity profile analysis of PMNSW's Finance Lease liabilities and other Borrowings is presented at Note D2(c).
Ageing
- 29 -

PLACE MANAGEMENT NSW
Section D: Liabilities
Notes to and Forming Part of the Financial Statements for the Year Ended 30 June 2018
D2. BORROWINGS
(a) Borrowings - Current and Non-Current Dissection 2018 2017
$'000 $'000
Current
Finance Lease Liabilities (b) 12,207 18,477
Total Current Borrowings 12,207 18,477
Non-Current
Finance Lease Liabilities (b) 258,741 1,316,517
TCorp Borrowings (e) 1,081,956 -
Total Non-Current Borrowings 1,340,697 1,316,517
(b) Finance Lease Liabilities 2018 2017
$'000 $'000
Movement:
Carrying Amount at 1 July 1,334,994 -
Finance Lease Recognised during the Year - 1,338,962
Early payment of Conditional Debt Pay Down (CDPD) (Note D2(e)) (1,049,883) -
Minimum Lease Payments (98,153) (70,936)
Finance Lease Interest Charges (Note B2(f)) 83,990 66,968
Carrying Amount at 30 June 270,948 1,334,994
(c) Finance Lease Commitments 2018 2017
$'000 $'000
Minimum Lease Payments:
Payable within one year 52,444 174,930
Payable later than one year but not later than five years 164,120 559,775
Payable later than five years 759,639 2,724,341
Total Minimum Lease Payment Commitment 976,203 3,459,046
Finance Costs:
Payable within one year (40,237) (156,453)
Payable later than one year but not later than five years (156,912) (484,653)
Payable later than five years (508,106) (1,482,946)
Total Finance Costs Commitment (705,255) (2,124,052)
Present Value of Finance Lease Commitments:
Payable within one year 12,207 18,477
Payable later than one year but not later than five years 7,208 75,122
Payable later than five years 251,533 1,241,395
Total Present Value of Finance Lease Commitments 270,948 1,334,994
(d) Recognition and Measurement - Finance Lease Liabilities
The finance lease liabilities are determined in accordance with AASB 117 "Leases". PMNSW's finance lease liability
comprises the lease on the International Convention Centre Sydney. The lease has a lease term of 25 years with the
asset returned to PMNSW at the end of lease term. The discount rate implicit in the lease is 9.45% p.a. The lease
liability is being amortised over the lease term.
- 30 -

PLACE MANAGEMENT NSW
Section D: Liabilities
Notes to and Forming Part of the Financial Statements for the Year Ended 30 June 2018
(e) New South Wales Treasury Corporation (TCorp) Borrowings
On 2 January 2018, TCorp issued two interim loans with total value of $1,083.3 million to PMNSW for early payment of
CDPD for its finance lease liability from SICEEP with Darling Harbour Live consortium. The 1,083.3 million Torp
Borrowings were recognised as a reduction of finance lease liability of $1,049.9 million and Finance Costs - Swap Break
Costs of $33.4 million in 2017-18.
On 8 February 2018, the principal balance of both interim loans were refinanced and replaced with the Final TCorp loan
portfolio. The Final TCorp loan portfolio took effect consisting of 10 separate loans with different principal balances,
different maturing dates and varying rates of interest for each of the loans. These loans are interest-only with the principal
amounts only payable on maturity dates of the loans. The coupon interest rates vary between 2.0% - 4.5%. These loans
constitute the CDPD of the Finance Lease Liability of the SICEEP.
Borrowings are not held for trading or designated at fair value through profit or loss. Borrowings are initially measured at
the fair value of the consideration received. Subsequently they are measured at amortised cost. Any difference between
the proceeds and the redemption amount (premium or discount) is recognised in the net result over the period of the
borrowings using the effective interest method.
Borrowings are removed from the Statement of Financial Position when the obligation specified in the contract is
discharged, cancelled or expired. The difference between the carrying amount of a financial liability that has been
extinguished or transferred to another party and the consideration paid is recognised in profit or loss as other income or
finance costs.
Borrowings are classified as current liabilities unless PMNSW has an unconditional right to defer settlement of the liability
for at least 12 months after the reporting date.
Repayment of TCorp Borrowings 2018 2017
$'000 $'000
Payable within one year - -
Payable later than one year but not later than five years 345,000 -
Payable later than five years 736,956 -
Total Repayment of TCorp Borrowings 1,081,956 -
D3. PROVISIONS
(a) Provisions - Dissection 2018 2017
$'000 $'000
Current
Land Remediation (b) 2,372 5,181
Other 3,316 2,659
Total Current Provisions at 30 June 5,688 7,840
(b) Land Remediation 2018 2017
$'000 $'000
Movement:
Carrying Amount at 1 July 5,181 -
Provision Recognised during the Year 644 5,181
Decrease in Provision from Payments (3,453) -
Carrying Amount at 30 June 2,372 5,181
- 31 -

PLACE MANAGEMENT NSW
Section D: Liabilities
Notes to and Forming Part of the Financial Statements for the Year Ended 30 June 2018
(i) PMNSW's Land Remediation provision relates to the SICEEP Major Commercial Development sites. As part of the
commercial development sites of the SICEEP project, the State entered into Project Delivery Agreements that granted
construction licences to Lend Lease to develop these sites with 99 year ground leases to apply at the conclusion of the
construction period.
The provision related to remediation and artefact risk which was shared with the State. The arrangement was tiered with
Lend Lease liable for the risk up to a predetermined level, the State and Lend Lease would then share the risk above this
level up to another predetermined level. Any costs above this final level would be born entirely by the State.
(c) Other Provisions 2018 2017
$'000 $'000
Movement:
Carrying Amount at 1 July 2,659 2,314
Provision Recognised during the Year 2,354 1,348
Decrease in Provision from Payments (1,697) (1,003)
Carrying Amount at 30 June 3,316 2,659
(i) Other provisions include obligations in relation to land tax. PMNSW is not exempted from land tax.
(d) Recognition and Measurement - Provisions
Provisions are recognised when PMNSW has a present obligation as a result of a past event, it is probable that PMNSW
will be required to settle the obligation, and a reliable estimate can be made of the amount of the obligation. Provisions
are measured at the present value of management's best estimate of the expenditure required to settle the present
obligation at the reporting date. The discount rate used to determine the present value reflects current assessments of
the time value of money and the risks specific to the liability. The increase in the provision due to the passage of time is
recognised as a finance cost.
D4. OTHER LIABILITIES
(a) Other Liabilities - Current and Non-Current Dissection 2018 2017
$'000 $'000
Current
Lease Receipts in Advance (i) 68 68
Deferred Income - Refinancing Gain (ii) 935 1,071
Revenue in Advance 4,457 3,191
Total Current Liability at 30 June 5,460 4,330
Non-Current
Lease Receipts in Advance (i) 3,117 3,183
Deferred Income - Refinancing Gain (ii) 29,910 30,709
Total Non-Current Liability at 30 June 33,027 33,892
(i) Lease Receipts in Advance relates to upfront rent payments received from tenants for long-term leases classified as
operating lease.
(ii) Deferred income relates to the SICEEP Project finance lease refinancing gain. This is being amortised over the finance
lease term.
- 32 -

E1. EQUITY
(a) Accumulated Funds
The category "Accumulated Funds" includes all current and prior period retained funds. All financial distributions are
made directly from Accumulated Funds.
Accumulated Funds - Movement 2018 2017
$'000 $'000
Carrying Amount at 1 July 1,240,413 1,277,000
Net Result for the Year (10,042) 37,631
Transfer from Asset Revaluation Reserve on Disposal of PP&E (E1(b)) - 74,345
Financial Distributions (i) - (115,113)
Net Increase/(Decrease) in Net Assets from Equity Transfers (ii) - (33,450)
Carrying Amount at 30 June 1,230,371 1,240,413
(i) Financial Distributions 2018 2017
$'000 $'000
Capital Repatriations from the Net Proceeds of Asset
Sales (Paid to the NSW Government) - (115,113)
- (115,113)
As a NSW Public Trading Enterprise, PMNSW operates under the State Government's Commercial Policy Framework.
A key component of this Framework is the requirement to make financial distributions to owners. In PMNSW's case, its
owner is the State Government. All payments of financial distributions are made to the Crown Finance Entity. The nature
and calculation of the required annual distributions is determined by NSW Treasury Policy and Guidelines Paper, TPP
16-04 "Financial Distribution Policy for Government Businesses". The distributions made by PMNSW may include normal
distribution payments from cash operating surpluses or capital repatriations, from the sale of its own properties.
Contributions to New South Wales Government are set by negotiation between stakeholders, the board and management
of PMNSW with the ultimate determination reserved for stakeholders. Consideration is given to PMNSW’s working capital,
investment capital requirements, provision of social and non-commercial activities and an appropriate contingency for
financial flexibility.
(ii) Net Increase/(Decrease) in Net Assets from Equity Transfers 2018 2017
$'000 $'000
Transfer of Properties to other Government Agencies:
Land and Buildings (Note C6(b)) - (33,450)
- (33,450)
The establishment of new statutory bodies or transfer of net assets between agencies as a result of an administrative
restructure, transfers of programs/functions and parts thereof between NSW public sector agencies are designated as a
contribution by owners and recognised as an adjustment to Accumulated Funds. This treatment is in accordance with
Treasury Policy and Guidelines Paper TPP 09-3 "Contributions By Owners Made to Wholly-Owned Public Sector
Entities" and is consistent with Interpretation 1038 "Contributions by Owners Made to Wholly-Owned Public Sector
Entities" and Australian Accounting Standards.
Transfers arising from an administrative restructure between government agencies are recognised at the amount at which
the asset was recognised by the transferor government agency immediately prior to the restructure. In most cases this
will approximate fair value. All other equity transfers are recognised at fair value.
Equity transfers in 2016-17 comprised of the transfer of lands to Roads and Maritime Services NSW. There were no
equity transfers made in 2017-18.
PLACE MANAGEMENT NSW
Section E: Equity
Notes to and Forming Part of the Financial Statements for the Year Ended 30 June 2018
- 33 -

PLACE MANAGEMENT NSW
Section E: Equity
Notes to and Forming Part of the Financial Statements for the Year Ended 30 June 2018
(b) Asset Revaluation Reserve
The total asset revaluation reserve is used to record increments and decrements on the revaluation of non-current
property plant and equipment and finance leases. This accords with PMNSW's policy on the Revaluation of Property,
Plant and Equipment (Note C6). No financial distributions are made from the Asset Revaluation Reserve.
Asset Revaluation Reserve - Movement 2018 2017
$'000 $'000
Carrying Amount at 1 July 125,929 158,755
Net Increase in Property, Plant and Equipment Revaluation Surplus (i) 31,548 41,519
Transfer to Accumulated Funds on Disposal of PP&E (E1(a)) - (74,345)
Carrying Amount at 30 June 157,477 125,929
Asset Revaluation Reserve - Asset Class Dissection 2018 2017
$'000 $'000
Land and Buildings 137,257 108,260
Infrastructure 13,014 10,733
Art & Artefacts 7,206 6,936
Total Asset Revaluation Reserve at 30 June 157,477 125,929
(i) Net Increase in Property, Plant and Equipment Revaluation Surplus - Dissection 2018 2017
$'000 $'000
Land and Buildings (Note C6(b)) 28,997 39,681
Infrastructure (Note C6(b)) 2,281 1,838
Art & Artefacts (Note C6(b)) 270 -
Net Increase in Property, Plant and Equipment Revaluation Surplus 31,548 41,519
- 34 -

F1. FINANCIAL INSTRUMENTS
PMNSW’s principal financial instruments are outlined below. These financial instruments arise directly from PMNSW’s
operations or are required to finance PMNSW’s operations. PMNSW does not enter into or trade financial instruments,
including derivative financial instruments, for speculative purposes.
Quantitative and qualitative disclosures together with the PMNSW's objectives, policies and processes for measuring and
managing risk are included throughout the financial statements.
The Board has overall responsibility for the establishment and oversight of risk management and reviews and agrees
policies for managing each of these risks. Risk management policies are established to identify and analyse the risks
faced by PMNSW, to set risk limits and controls and to monitor risks. Compliance with policies is reviewed by
Management on a continuous basis.
(a) Financial Instrument Categories
2018 2017
Financial Assets - Carrying Amounts $'000 $'000
Class Category Notes
Cash and Cash Equivalents n/a C1 178,457 212,072
Receivables (i) Loans and Receivables
(at Amortised Cost) C2 195,220 210,608
Financial Liabilities - Carrying Amounts
Class Category Notes
Payables (ii) Financial Liabilities
(at Amortised Cost) D1 73,778 35,137
Borrowings Financial Liabilities
(at Amortised Cost) D2 1,352,904 1,334,994
(i) Excludes statutory receivables and prepayments as they are not within the scope of AASB 7.
(ii) Excludes statutory payables and unearned revenue as they are not within the scope of AASB 7.
(b) Credit Risk
Credit risk arises when there is the possibility that the counterparty will default on their contractual obligations, resulting in
a financial loss to PMNSW. The maximum exposure to credit risk is generally represented by the carrying amount of the
financial assets (net of any allowance for impairment).
Credit risk arises from the financial assets of PMNSW, including cash and receivables (Notes C1 and C2). No collateral
is held by PMNSW and PMNSW has not granted any financial guarantees. Credit risk associated with PMNSW’s
financial assets, other than receivables, is managed through the selection of counterparties and establishment of
minimum credit rating standards.
(c) Market Risk
Market risk is the risk that the fair value or future cash flows of a financial instrument will fluctuate because of changes in
market prices. PMNSW's exposures to market risk are primarily through interest rate on PMNSW's cash and cash
equivalents. PMNSW has no exposure to foreign currency risk and does not enter into commodity contracts.
PLACE MANAGEMENT NSW
Section F: Financial Instruments and Other Notes
Notes to and Forming Part of the Financial Statements for the Year Ended 30 June 2018
- 35 -

PLACE MANAGEMENT NSW
Section F: Financial Instruments and Other Notes
Notes to and Forming Part of the Financial Statements for the Year Ended 30 June 2018
(d) Fair Value of Financial Instruments
PMNSW's financial instruments are recognised at cost. The amortised cost of PMNSW's financial instruments recognised
in the Statement of Financial Position approximates the fair value, because of the short-term nature of the financial
instruments. PMNSW has not identified any financial instruments whose fair value differs materially from the carrying
amount.
(e) Impairment of Financial Assets
All financial assets, except those measured at fair value through profit and loss, are subject to an annual review for
impairment. An allowance for impairment is established when there is objective evidence that PMNSW will not be able to
collect all amounts due.
For financial assets carried at amortised cost, the amount of the allowance is the difference between the asset’s carrying
amount and the present value of estimated future cash flows, discounted at the effective interest rate. The amount of the
impairment loss is recognised in the Net Result for the year.
Any reversals of impairment losses are reversed through the Net Result for the year, where there is objective evidence.
Reversals of impairment losses of financial assets carried at amortised cost cannot result in a carrying amount that
exceeds what the carrying amount would have been had there not been an impairment loss.
(f) Derecognition of Financial Assets and Financial Liabilities
A financial asset is derecognised when the contractual rights to the cash flows from the financial assets expire or if
PMNSW transfers the financial asset:
- where substantially all the risks and rewards have been transferred; or
- where PMNSW has not transferred substantially all the risks and rewards, if PMNSW has not retained control.
Where PMNSW has neither transferred nor retained substantially all the risks and rewards or transferred control, the
asset is recognised to the extent of PMNSW’s continuing involvement in the asset.
A financial liability is derecognised when the obligation specified in the contract is discharged or cancelled or expires.
F2. COMMITMENTS FOR EXPENDITURE
(a) Capital Expenditure Commitments 2018 2017
$'000 $'000
Capital expenditure contracted at balance date but not
provided for:
Payable within one year 15,347 7,852
Payable later than one year but not later than five years - -
Payable later than five years - -
Total Capital Expenditure Commitments (Incl GST) 15,347 7,852
Total capital expenditure commitments relate to contracted upgrading and refurbishment works on various owned buildings
and infrastructure assets. Capital expenditure commitments at 30 June 2018 include GST recoverable input tax credits
of $1.4 million ($0.7m at 30 June 2017) that are expected to be recoverable from the Australian Taxation Office.
- 36 -
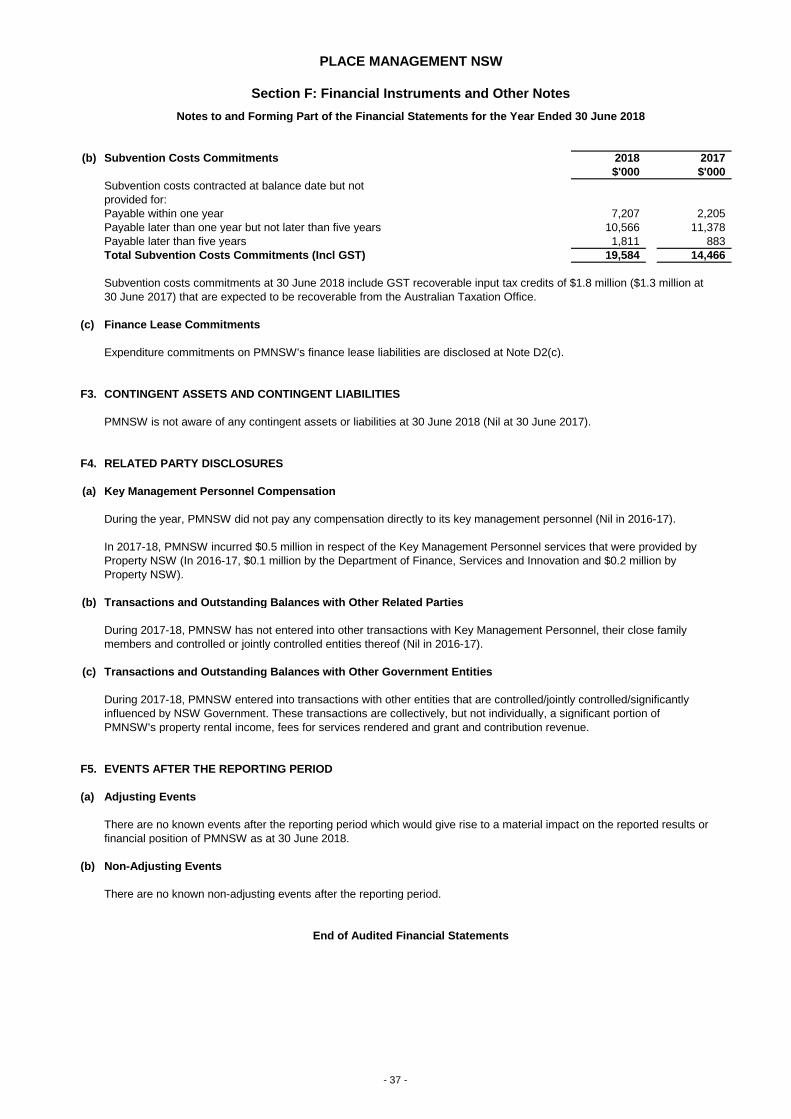
PLACE MANAGEMENT NSW
Section F: Financial Instruments and Other Notes
Notes to and Forming Part of the Financial Statements for the Year Ended 30 June 2018
(b) Subvention Costs Commitments 2018 2017
$'000 $'000
Subvention costs contracted at balance date but not
provided for:
Payable within one year 7,207 2,205
Payable later than one year but not later than five years 10,566 11,378
Payable later than five years 1,811 883
Total Subvention Costs Commitments (Incl GST) 19,584 14,466
Subvention costs commitments at 30 June 2018 include GST recoverable input tax credits of $1.8 million ($1.3 million at
30 June 2017) that are expected to be recoverable from the Australian Taxation Office.
(c) Finance Lease Commitments
Expenditure commitments on PMNSW's finance lease liabilities are disclosed at Note D2(c).
F3. CONTINGENT ASSETS AND CONTINGENT LIABILITIES
PMNSW is not aware of any contingent assets or liabilities at 30 June 2018 (Nil at 30 June 2017).
F4. RELATED PARTY DISCLOSURES
(a) Key Management Personnel Compensation
During the year, PMNSW did not pay any compensation directly to its key management personnel (Nil in 2016-17).
In 2017-18, PMNSW incurred $0.5 million in respect of the Key Management Personnel services that were provided by
Property NSW (In 2016-17, $0.1 million by the Department of Finance, Services and Innovation and $0.2 million by
Property NSW).
(b) Transactions and Outstanding Balances with Other Related Parties
During 2017-18, PMNSW has not entered into other transactions with Key Management Personnel, their close family
members and controlled or jointly controlled entities thereof (Nil in 2016-17).
(c) Transactions and Outstanding Balances with Other Government Entities
During 2017-18, PMNSW entered into transactions with other entities that are controlled/jointly controlled/significantly
influenced by NSW Government. These transactions are collectively, but not individually, a significant portion of
PMNSW's property rental income, fees for services rendered and grant and contribution revenue.
F5. EVENTS AFTER THE REPORTING PERIOD
(a) Adjusting Events
There are no known events after the reporting period which would give rise to a material impact on the reported results or
financial position of PMNSW as at 30 June 2018.
(b) Non-Adjusting Events
There are no known non-adjusting events after the reporting period.
End of Audited Financial Statements
- 37 -

INDEPENDENT AUDITOR’S REPORT
Luna Park Reserve Trust
To Members of the New South Wales Parliament
Opinion
I have audited the accompanying financial statements of Luna Park Reserve Trust (the Trust), which
comprise the Statement of Comprehensive Income for the year ended 30 June 2018, the Statement of
Financial Position as at 30 June 2018, the Statement of Changes in Equity and the Statement of Cash
Flows for the year then ended, notes comprising a Statement of Significant Accounting Policies and
other explanatory information.
In my opinion, the financial statements:
• give a true and fair view of the financial position of the Trust as at 30 June 2018 and of its
financial performance and its cash flows for the year then ended in accordance with Australian
Accounting Standards
• are in accordance with section 41B of the Public Finance and Audit Act 1983 (PF&A Act) and
the Public Finance and Audit Regulation 2015.
My opinion should be read in conjunction with the rest of this report.
Basis for Opinion
I conducted my audit in accordance with Australian Auditing Standards. My responsibilities under the
standards are described in the ‘Auditor’s Responsibilities for the Audit of the Financial Statements’
section of my report.
I am independent of the Trust in accordance with the requirements of the:
• Australian Auditing Standards
• Accounting Professional and Ethical Standards Board’s APES 110 ‘Code of Ethics for
Professional Accountants’ (APES 110).
I have fulfilled my other ethical responsibilities in accordance with APES 110.
Parliament promotes independence by ensuring the Auditor-General and the Audit Office of
New South Wales are not compromised in their roles by:
• providing that only Parliament, and not the executive government, can remove an
Auditor-General
• mandating the Auditor-General as auditor of public sector agencies
• precluding the Auditor-General from providing non-audit services.
I believe the audit evidence I have obtained is sufficient and appropriate to provide a basis for my
audit opinion.

Other Information
Other information comprises the information included in the Trust’s annual report for the year ended
30 June 2018, other than the financial statements and my Independent Auditor’s Report thereon. The
Trust Manager are responsible for the other information. At the date of this Independent Auditor’s
Report, the other information I have received comprises the Statement by Trust Manager.
My opinion on the financial statements does not cover the other information. Accordingly, I do not
express any form of assurance conclusion on the other information.
In connection with my audit of the financial statements, my responsibility is to read the other
information and, in doing so, consider whether the other information is materially inconsistent with the
financial statements or my knowledge obtained in the audit, or otherwise appears to be materially
misstated.
If, based on the work I have performed, I conclude there is a material misstatement of the other
information, I must report that fact.
I have nothing to report in this regard.
The Trust Manager’s Responsibilities for the Financial Statements
The Trust Manager is responsible for the preparation and fair presentation of the financial statements
in accordance with Australian Accounting Standards and the PF&A Act, and for such internal control
as the Trust Manager determines is necessary to enable the preparation and fair presentation of the
financial statements that are free from material misstatement, whether due to fraud or error.
In preparing the financial statements, the Trust Manager is responsible for assessing the Trust’s ability
to continue as a going concern, disclosing as applicable, matters related to going concern and using
the going concern basis of accounting except where the Trust will be dissolved by an Act of
Parliament or otherwise cease operations.
Auditor’s Responsibilities for the Audit of the Financial Statements
My objectives are to:
• obtain reasonable assurance about whether the financial statements as a whole are free from
material misstatement, whether due to fraud or error
• issue an Independent Auditor’s Report including my opinion.
Reasonable assurance is a high level of assurance, but does not guarantee an audit conducted in
accordance with Australian Auditing Standards will always detect material misstatements.
Misstatements can arise from fraud or error. Misstatements are considered material if, individually or
in aggregate, they could reasonably be expected to influence the economic decisions users take
based on the financial statements.
A description of my responsibilities for the audit of the financial statements is located at the Auditing
and Assurance Standards Board website at: www.auasb.gov.au/auditors_responsibilities/ar4.pdf. The
description forms part of my auditor’s report.

My opinion does not provide assurance:
• that the Trust carried out its activities effectively, efficiently and economically
• about the assumptions used in formulating the budget figures disclosed in the financial
statements
• about the security and controls over the electronic publication of the audited financial
statements on any website where they may be presented
• about any other information which may have been hyperlinked to/from the financial statements.
Weini Liao
Director, Financial Audit Services
20 September 2018
SYDNEY
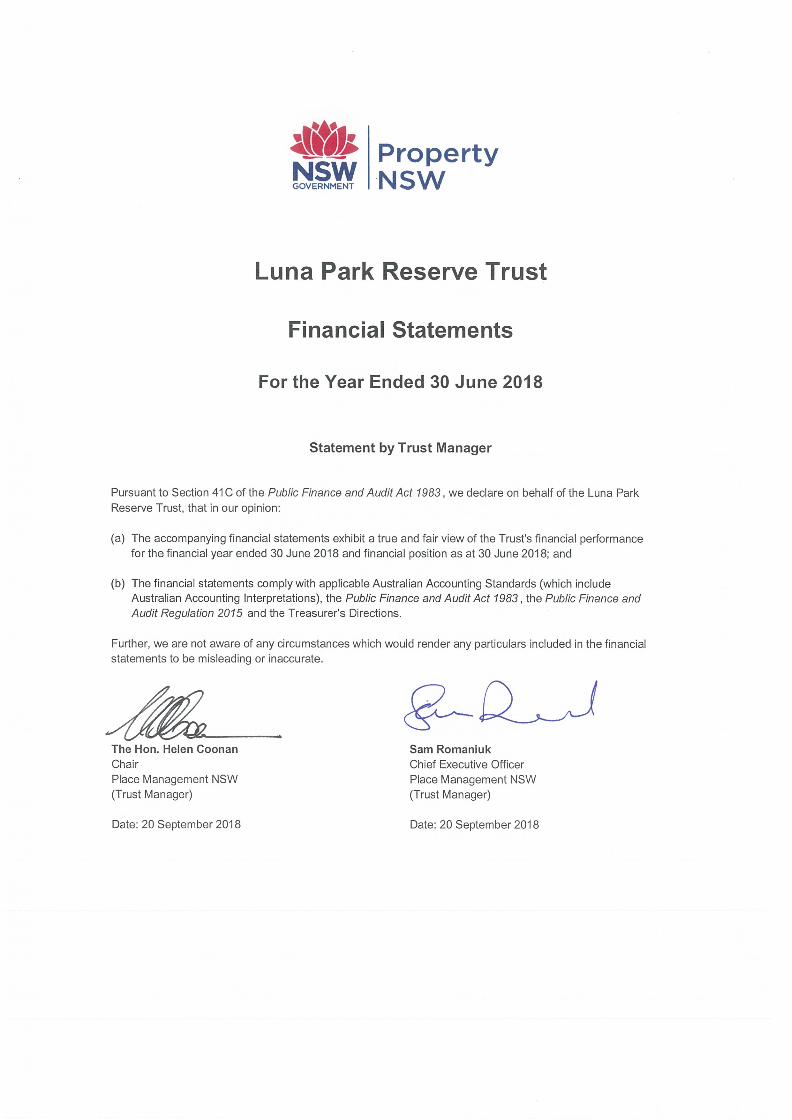

Note Actual Budget Actual
2018 2018 2017
$'000 $'000 $'000
Revenue
Sale of Goods and Services B1(a) 2,152 1,866 1,864
Investment Revenue B1(b) 33 103 64
Grants and Contributions B1(c) - - 3,200
Total Revenue 2,185 1,969 5,128
Expenses Excluding Losses
Other Operating Expenses B2(a) 2,454 1,127 3,576
Depreciation Expense B2(b) 838 837 822
Total Expenses Excluding Losses 3,292 1,964 4,398
Net Result (1,107) 5 730
Other Comprehensive Income
Items that will not be Reclassified to Net Result:
Net Increase/(Decrease) in Property, Plant and
Equipment Revaluation Surplus E1(b) 1,693 - (713)
Total Other Comprehensive Income 1,693 - (713)
TOTAL COMPREHENSIVE INCOME 586 5 17
LUNA PARK RESERVE TRUSTStart of Audited Financial Statements
Statement of Comprehensive Income
For the Year Ended 30 June 2018
[The accompanying notes form part of these financial statements]
- 1 -

Notes Actual Budget Actual
2018 2018 2017
$'000 $'000 $'000
ASSETS
Current Assets
Cash and Cash Equivalents C1(a) 2,158 3,575 3,228
Receivables C2(a) 547 221 333
Total Current Assets 2,705 3,796 3,561
Non-Current Assets
Property, Plant and Equipment C3(a) 41,581 40,315 40,726
Total Non-Current Assets 41,581 40,315 40,726
TOTAL ASSETS 44,286 44,111 44,287
LIABILITIES
Current Liabilities
Payables D1(a) 430 164 1,017
Total Current Liabilities 430 164 1,017
TOTAL LIABILITIES 430 164 1,017
NET ASSETS 43,856 43,947 43,270
EQUITY
Accumulated Funds E1(a) 8,603 9,967 9,710
Asset Revaluation Reserve E1(b) 35,253 33,980 33,560
TOTAL EQUITY 43,856 43,947 43,270
LUNA PARK RESERVE TRUST
Statement of Financial Position
As At 30 June 2018
[The accompanying notes form part of these financial statements]
- 2 -

Asset Asset
Notes Accumulated Revaluation Total Accumulated Revaluation Total
Funds Reserve Equity Funds Reserve Equity
2018 2018 2018 2017 2017 2017
$'000 $'000 $'000 $'000 $'000 $'000
Opening Balance 9,710 33,560 43,270 8,980 34,273 43,253
Net Result for the Year (1,107) - (1,107) 730 - 730
Other Comprehensive Income:
Net Increase/(Decrease) in Property, Plant
and Equipment Revaluation Surplus C3(b) - 1,693 1,693 - (713) (713)
Total Other Comprehensive Income - 1,693 1,693 - (713) (713)
Total Comprehensive Income for the Year (1,107) 1,693 586 730 (713) 17
Closing Balance 8,603 35,253 43,856 9,710 33,560 43,270
LUNA PARK RESERVE TRUST
Statement of Changes in Equity
For the Year Ended 30 June 2018
[The accompanying notes form part of these financial statements]
- 3 -

Notes Actual Budget * Actual
2018 2018 2017
$'000 $'000 $'000
CASH FLOWS FROM OPERATING ACTIVITIES
Payments
Other (2,998) (1,296) (2,989)
Total Payments (2,998) (1,296) (2,989)
Receipts
Sale of Goods and Services 1,896 2,034 2,086
Interest Received 33 103 64
Total Receipts 1,929 2,137 2,150
NET CASH FLOWS FROM OPERATING
ACTIVITIES C1(c) (1,069) 841 (839)
NET INCREASE/(DECREASE) IN CASH (1,069) 841 (839)
Opening Cash and Cash Equivalents 3,228 2,734 4,067
CLOSING CASH AND CASH EQUIVALENTS C1(a) 2,158 3,575 3,228
* The Budget Statement of Cash Flows was not reported to parliament in 2017-18 Budget Paper No. 3 and instead published online
at www.budget.nsw.gov.au.
LUNA PARK RESERVE TRUST
Statement of Cash Flows
For the Year Ended 30 June 2018
[The accompanying notes form part of these financial statements]
- 4 -

A1. REPORTING ENTITY
The Luna Park Reserve Trust (the Trust), is a NSW government entity. The Trust is a not-for-profit entity (as profit is not
its principal objective) and it has no cash generating units. The reporting entity is consolidated as part of the NSW Total
State Sector Accounts.
The Trust was established on 12 October 1990, under the Luna Park Site Act 1990 . The purpose of the Trust is to control
the Luna Park Site, which has been dedicated to an area of public amusement, recreation and entertainment.
On 9 February 2001, Place Management NSW (PMNSW) was appointed to manage the affairs of the Trust.
These financial statements for the year ended 30 June 2018 have been authorised for issue by the PMNSW Board on
20 September 2018.
A2. BASIS OF PREPARATION AND SIGNIFICANT ACCOUNTING POLICIES
(a) Basis of Preparation
The Trust’s financial statements are general purpose financial statements which have been prepared on an accrual basis
in accordance with:
(i) applicable Australian Accounting Standards (which include Australian Accounting Interpretations);
(ii) the requirements of the Public Finance and Audit Act 1983 and Public Finance and Audit Regulation 2015 ; and
(iii) Financial Reporting Directions mandated by the Treasurer.
Property, Plant and Equipment are measured at fair value. Other financial statement items are prepared in accordance
with the historical cost convention.
The accrual basis of accounting has been adopted in the preparation of the financial statements, except for cash flow
information.
Judgements, key assumptions and estimations management has made are disclosed in the relevant notes to the financial
statements.
All amounts are rounded to the nearest one thousand dollars and are expressed in Australian currency.
(b) Statement of Compliance
The financial statements and notes comply with Australian Accounting Standards, which include Australian Accounting
Interpretations.
(c) Accounting for the Goods and Services Tax (GST)
Revenue, expenses and assets are recognised net of the amount of GST, except that:
(i) the amount of GST incurred by the entity as a purchaser that is not recoverable from the Australian Taxation Office is
recognised as part of an asset's cost of acquisition or as part of an item of expense; and
(ii) receivables and payables are stated with the amount of GST included.
Cash flows are included in the Statement of Cash Flows on a gross basis. However, the GST components of cash flows
arising from investing and financing activities which are recoverable from, or payable to, the Australian Taxation Office
are classified as operating cash flows.
LUNA PARK RESERVE TRUST
Section A: Entity Information and Basis of Preparation
Notes to and Forming Part of the Financial Statements for the Year Ended 30 June 2018
- 5 -
LUNA PARK RESERVE TRUST
Section A: Entity Information and Basis of Preparation
Notes to and Forming Part of the Financial Statements for the Year Ended 30 June 2018
(d) Comparative Information
Except when an Australian Accounting Standard permits or requires otherwise, comparative information is presented in
respect of the previous period for all amounts reported in the financial statements.
(e) Fair Value Measurement and Hierarchy
Fair value is the price that would be received to sell an asset or paid to transfer a liability in an orderly transaction
between market participants at the measurement date. The fair value measurement is based on the presumption that the
transaction to sell the asset or transfer the liability takes place either in the principal market for the asset or liability or in
the absence of a principal market, in the most advantageous market for the asset or liability.
A number of the Trust’s accounting policies and disclosures require the measurement of fair values, for both financial and
non-financial assets and liabilities. When measuring fair value, the valuation technique used maximises the use of relevant
observable inputs and minimises the use of unobservable inputs. Under AASB 13, the Trust categorises, for disclosure
purposes, the valuation techniques based on the inputs used in the valuation techniques as follows:
Level 1 – quoted prices in active markets for identical assets/liabilities that the Trust can access at the measurement date.
Level 2 – inputs other than quoted prices included within Level 1 that are observable, either directly or indirectly.
Level 3 – inputs that are not based on observable market data (unobservable inputs).
The Trust recognises transfers between levels of the fair value hierarchy at the end the reporting period during which the
change has occurred.
Refer to Notes C3, C4 and F1 for further disclosures regarding fair value measurements of financial and non-financial
assets.
(f) Changes in Accounting Policy including New or Revised Australian Accounting Standards
(i) Effective for the First Time in 2017-18
The accounting policies applied in 2017-18 are consistent with those of the previous financial year except as a result of
the following revised Australian Accounting Standards that have been applied for the first time in 2017-18:
- AASB 2016-2 Amendments to Australian Accounting Standards – Disclosure Initiative: Amendments to AASB 107
Statement of Cash Flows.
- AASB 2016-7 Amendments to Australian Accounting Standards – Deferral of AASB 15 for Not-for-Profit Entities.
- AASB 2017-2 Amendments to Australian Accounting Standards – Further Annual Improvements 2014-2016 Cycle.
The adoption of the above revised Australian Accounting Standards has not had any significant impact on the Trust.
(ii) Issued but Not Yet Effective
NSW public sector entities are not permitted to early adopt new Australian Accounting Standards, unless Treasury
determines otherwise. There are a number of recently issued or amended Australian Accounting Standards which are not
yet effective and have not been adopted for the reporting period ending 30 June 2018.
The following new Australian Accounting Standards, excluding standards not considered applicable or material to the
Trust have not been applied and are not yet effective. The possible impact of these standards in the period of initial
application includes:
- AASB 16 "Leases" has application from annual reporting periods on or after 1 January 2019. This standard generally
requires a lessee to recognise right-of-use asset and lease liability at a lease's commencement date except for short
term and low value asset leases. The requirements for lessor accounting have been carried forward from AASB 117
largely unchanged. As the Trust is not a lessee in its leasing arrangements, the change is not expected to materially
impact the financial statements.
- 6 -

LUNA PARK RESERVE TRUST
Section A: Entity Information and Basis of Preparation
Notes to and Forming Part of the Financial Statements for the Year Ended 30 June 2018
- AASB 15 "Revenue from Contracts with Customers", including the amendments AASB 2014-5, AASB 2015-8 and AASB
2016-3 has application from annual reporting periods on or after 1 January 2019. The Trust believes this standard may
impact on the timing recognition of certain Grants and Contributions Revenue given the core principle of the new standard
requires revenue to be recognised at the transaction price when control of the goods or services are transferred to the
customer. The model features a contract-based five step analysis of transactions to determine the nature, amount and
timing of revenue arising from contracts with customers.
- AASB 1058 "Income of Not-for-profit Entities" and AASB 2016-8 Amendments to Australian Accounting Standards –
Australian Implementation Guidance for Not-for-Profit Entities has application from annual reporting periods on or after 1
January 2019. The introduction of AASB 1058 results in the amendment of AASB 1004 "Contributions" with many of its
requirements being revised and relocated to AASB 1058. The Trust is yet to undertake a detailed assessment of the
impact of AASB 1058 however management believe the initial adoption may defer the recognition of income in some
circumstances.
The impact of the following standards in the period of initial application is not expected to be significant.
Applicable to Annual
Standard Reporting Periods
Beginning on or after
AASB 9 Financial Instruments 1 January 2018
AASB 2016-6 Amendments to Australian Accounting Standards - Applying AASB 9
Financial Instruments with AASB 4 Insurance Contracts" 1 January 2018
- 7 -

B1. REVENUE
Recognition and Measurement - Revenue
Revenue is measured at the fair value of the consideration or contribution received or receivable. Additional comments
regarding the accounting policies for the recognition and measurement of revenue is discussed within each revenue
category below.
(a) Sale of Goods and Services 2018 2017
$'000 $'000
Property Rental Income - Operating Lease Income 940 784
Heritage and Infrastructure Rental Income - Operating Lease Income 1,212 1,080 2,152 1,864
Operating lease income is recognised in accordance with AASB 117 "Leases". Lease income from operating leases
where the Trust is the lessor is recognised as income in the Statement of Comprehensive Income on a straight-line basis
over the lease term. Contingent rental income is recognised as income in the period in which it is earned.
(b) Investment Revenue 2018 2017
$'000 $'000
Interest 33 64
33 64
Interest revenue is recognised using the effective interest method as set out in AASB 139 "Financial Instruments:
Recognition and Measurement".
(c) Grants and Contributions 2018 2017
$'000 $'000
Grant Revenue - 3,200
- 3,200
Contributions and grants are recognised as revenue when the Trust obtains control over the asset comprising the
contributions. Grant revenue received in 2017 includes a one-off contribution from Place Management NSW for
purchase of a leasehold interest.
B2. EXPENSES EXCLUDING LOSSES
(a) Other Operating Expenses 2018 2017
$'000 $'000
Management Fee 313 313
Auditor's Remuneration - Audit of Financial Statements 14 14
Other Contractors 97 133
Repairs and Maintenance (i) 2,030 3,083
Legal Fees - 33
2,454 3,576
(i) Repairs and Maintenance
Day-to-day servicing costs or maintenance are charged as expenses as incurred, except where they relate to the
replacement of a part or component of an asset, in which case the costs are capitalised and depreciated.
LUNA PARK RESERVE TRUST
Section B: Financial Performance
Notes to and Forming Part of the Financial Statements for the Year Ended 30 June 2018
- 8 -

LUNA PARK RESERVE TRUST
Section B: Financial Performance
Notes to and Forming Part of the Financial Statements for the Year Ended 30 June 2018
(b) Depreciation Expense 2018 2017
$'000 $'000
Depreciation Expense 838 822
838 822
Recognition and Measurement - Depreciation of Property, Plant and Equipment
Except for certain heritage assets, depreciation is provided for on a straight-line basis for all depreciable assets so as to
write off the depreciable amount of each asset as it is consumed over its useful life to the entity. All material separately
identifiable components of assets are depreciated over their shorter useful lives.
The following asset useful lives have been applied for depreciation purposes:
Asset Class 2018 2017
Years Years
Buildings and Improvements 20-50 20-50
Infrastructure 50 50
Land is not a depreciable asset. Certain heritage assets including original artworks and collections and heritage buildings
may not have a limited useful life because appropriate curatorial and preservation policies are adopted. Such assets are not
subject to depreciation. The decision not to recognise depreciation for these assets is reviewed annually.
B3. BUDGET REVIEW
The budgeted amounts are drawn from the original budgeted financial statements presented to Parliament in respect of the
reporting period, except for Budget statement of cash flows. Subsequent amendments to the original budget (e.g.
adjustment for transfer of functions between entities as a result of administrative arrangements orders) are not reflected in
the budgeted amounts. Major variances between the original budgeted amounts and the actual amounts disclosed in the
primary financial statements are explained below.
(a) Net Result
The Net Result of $1.1 million deficit was $1.1 million lower than budget, primarily due to significant increase in repair and
maintenance expenses for heritage and infrastructure assets.
(b) Assets and Liabilities
Total Assets of $44.3 million were $0.2 million greater than budget, primarily due to:
• $1.4 million decrease in Cash and Cash Equivalents due to increase in heritage and infrastructure spending; offset by
• $1.2 million increase in Property, Plant and Equipment from revaluation increment in 2017-18.
Total Liabilities of $0.4 million were $0.2 million greater than budget, primarily due to increase in Payables for heritage and
infrastructure spending.
(c) Cash Flows
Closing Cash and Cash Equivalents of $2.1 million was $1.4 million lower than budget, primarily due to increase in
heritage and infrastructure spending in 2017-18.
- 9 -

C1. CASH AND CASH EQUIVALENTS
(a) Cash and Cash Equivalents - Dissection 2018 2017
$'000 $'000
Current
Cash at Bank 1,998 2,118
Restricted Cash:
Luna Park Heritage Infrastructure Fund (b) 160 1,110
2,158 3,228
Cash at Bank comprises of balances within the NSW Treasury Banking System. Interest as determined by NSW
Treasury is earned on daily bank balances and paid twice yearly.
For the purposes of the Statement of Cash Flows, cash includes Cash at Bank and Restricted Cash.
Interest Rate Risk
The effect on the Net Result and Equity due to a reasonably possible change in risk variable is outlined in the
information below, for interest rate risk and other price risk. A reasonably possible change in risk variable has been
determined after taking into account the economic environment in which the Trust operates and the time frame for the
assessment (i.e. until the end of the next annual reporting period). The sensitivity analysis is based on risk exposures
in existence at 30 June 2018 The analysis is performed on the same basis as for 2017. The analysis assumes that all
other variables remain constant.
Exposure to interest rate risk arises primarily through the Trust’s cash and cash equivalents. The Trust does not
account for any fixed rate financial instruments at fair value through profit or loss or as available for sale. Therefore for
these financial instruments a change in interest rates would not affect profit or loss or equity. A reasonably possible
change of +/-1% is used, consistent with current trends in interest rates (based on official RBA interest rate volatility
over the last five years). The basis will be reviewed annually and amended where there is a structural change in the level
of interest rate volatility. The Trust’s exposure to interest rate risk is set out below.
Interest Rate Risk - 2018 Carrying
Amount Profit Equity Profit Equity
$'000 $'000 $'000 $'000 $'000
Financial Assets
Cash and Cash Equivalents 2,158 (22) (22) 22 22
Interest Rate Risk - 2017 Carrying
Amount Profit Equity Profit Equity
$'000 $'000 $'000 $'000 $'000
Financial Assets
Cash and Cash Equivalents 3,228 (32) (32) 32 32
(b) Restricted Cash 2018 2017
$'000 $'000
At the Beginning of Financial Year 1,110 1,414
Collection of Heritage and Infrastructure Rental 932 1,301
Payment for Heritage and Infrastructure Works During the Period (2,911) (1,630)
Collection of Interest Income 4 25
Transfer from Operating Bank Account 1,025 -
At the End of Financial Year 160 1,110
The Luna Park Heritage Infrastructure Fund, included in cash, is restricted in application under the Trust. Funds can
only be spent on the maintenance of Heritage and Infrastructure Items as defined in the Trust Deed agreement between
the Trust and the lessee.
LUNA PARK RESERVE TRUST
Section C: Assets
Notes to and Forming Part of the Financial Statements for the Year Ended 30 June 2018
-1% +1%
-1% +1%
- 10 -

LUNA PARK RESERVE TRUST
Section C: Assets
Notes to and Forming Part of the Financial Statements for the Year Ended 30 June 2018
(c) Reconciliation of Cash Flows from Operating Activities to Net Result 2018 2017
$'000 $'000
Net Cash Flow From Operating Activities (1,069) (839)
Non Cash Revenue/(Expenses):
Depreciation (838) (822)
Grants and Contributions - 3,200
Changes in Operating Assets and Liabilities:
Increase/(Decrease) in Receivables 307 (32)
Decrease/(Increase) in Payables 493 (777)
Net Result (1,107) 730
C2. RECEIVABLES
(a) Receivables - Dissection 2018 2017
$'000 $'000
Current
Trade Debtors - Rent Receivable 132 61
GST Receivable 23 160
Accrued Revenue 392 112
Total Current Receivables 547 333
(b) Recognition and Measurement - Receivables
Receivables are non-derivative financial assets with fixed or determinable payments that are not quoted in an active
market. These financial assets are recognised initially at fair value, usually based on the transaction cost or face value.
Subsequent measurement is at amortised cost using the effective interest method, less an allowance for any impairment
of receivables. Any changes are recognised in the Net Result when impaired, derecognised or through the amortisation
process.
When there is objective evidence that the amounts due will not be collected, the Trust recognises an allowance for
impairment. The amount of the allowance is the difference between the receivable's carrying amount and the amount
expected to be received. When an impairment is recognised, the loss is recorded in the Net Result for the year. Where
there is objective evidence of recovering a previously impaired receivable, the reversal of impairment losses is also
recognised through the net result for the year.
Short-term receivables with no stated interest rate are measured at the original invoice amount where the effect of
discounting is immaterial. Such receivables, which generally have 30-day terms, are recognised and carried at original
invoice amount less an allowance for any uncollectible amounts.
(c) Credit Risk - Trade Debtors
All trade debtors are recognised as amounts receivable at balance date. Collectability of trade debtors is reviewed on an
ongoing basis. Procedures as established in the Treasurer’s Directions are followed to recover outstanding amounts,
including letters of demand. Debts which are known to be uncollectible are written off. An allowance for impairment is raised
when there is objective evidence that the entity will not be able to collect all amounts due. This evidence includes past
experience, and current and expected changes in economic conditions and debtor credit ratings. No interest is earned on
trade debtors. Sales are generally made on 30 day terms.
Debtors that are not past due as at 30 June 2018 of $nil ($nil as at 30 June 2017) and debtors that are past due but not
considered impaired as at 30 June 2018 of $132,000 ($61,000 as at 30 June 2017) represent 100% (2017: 100%) of the
total debtors. There are no debtors which together are currently not past due or impaired whose terms have been
renegotiated. There are no debtors that are considered impaired.
The only financial assets that are past due are rental debtors in Receivables within the Statement of Financial Position.
- 11 -

LUNA PARK RESERVE TRUST
Section C: Assets
Notes to and Forming Part of the Financial Statements for the Year Ended 30 June 2018
2018 Overdue Total
<3 Mths >3 <6 Mths >3 Mths 2018
Financial Assets $'000 $'000 $'000 $'000
Receivables:
Past due but not Impaired 132 - - 132
Considered Impaired - - - -
Total Credit Risk 132 - - 132
2017 Overdue Total
<3 Mths >3 <6 Mths >3 Mths 2017
Financial Assets $'000 $'000 $'000 $'000
Receivables:
Past due but not Impaired 61 - - 61
Considered Impaired - - - -
Total Credit Risk 61 - - 61
Notes
(i) Each column in the table reports gross receivables.
(ii) The aging analysis excludes statutory receivables, as these are not within the scope of AASB 7 and excludes
receivables that are not past due and not impaired. Therefore, the total will not reconcile to receivables total recognised
in the Statement of Financial Position.
C3. PROPERTY, PLANT AND EQUIPMENT
(a) Property, Plant and Equipment - Dissection 2018 2017
$'000 $'000
Non-Current
Land
At Fair Value 17,690 16,846
Carrying Amount at 30 June 17,690 16,846
Buildings
At Fair Value 25,626 24,853
Accumulated Depreciation (9,319) (8,644)
Carrying Amount at 30 June 16,307 16,209
Infrastructure
At Fair Value 15,901 15,592
Accumulated Depreciation (8,317) (7,921)
Carrying Amount at 30 June 7,584 7,671
Total Property, Plant and Equipment
At Fair Value 59,217 57,291
Accumulated Depreciation (17,636) (16,565)
Total Property Plant and Equipment Carrying Amount at 30 June 41,581 40,726
- 12 -

LUNA PARK RESERVE TRUST
Section C: Assets
Notes to and Forming Part of the Financial Statements for the Year Ended 30 June 2018
(b) Reconciliation of Opening and Closing Carrying Amounts 2018 2017
$'000 $'000
Land
Carrying Amount at 1 July 16,846 15,000
Additions - 3,200
Net Revaluation Increment/(Decrement) 844 (1,354)
Carrying Amount at 30 June 17,690 16,846
Buildings
Carrying Amount at 1 July 16,209 16,217
Depreciation Expense (526) (515)
Net Revaluation Increment/(Decrement) 625 507
Carrying Amount at 30 June 16,308 16,209
Infrastructure
Carrying Amount at 1 July 7,671 7,844
Depreciation Expense (312) (307)
Net Revaluation Increment/(Decrement) 224 134
Carrying Amount at 30 June 7,583 7,671
Total Property Plant and Equipment Carrying Amount at 30 June 41,581 40,726
(c) Recognition and Measurement - Property, Plant and Equipment
(i) Acquisitions of Assets
Assets acquired are initially recognised at cost. Cost is the amount of cash or cash equivalents paid or the fair value of
the other consideration given to acquire the asset at the time of its acquisition or construction or, where applicable, the
amount attributed to that asset when initially recognised in accordance with the requirements of other Australian
Accounting Standards.
Assets acquired at no cost, or for nominal consideration, are initially recognised at their fair value at the date of
acquisition. Fair value is the price that would be received to sell an asset in an orderly transaction between market
participants at measurement date.
Where payment for an asset is deferred beyond normal credit terms, its cost is the cash price equivalent; i.e. deferred
payment amount is effectively discounted at an asset-specific rate.
(ii) Capitalisation Thresholds
Property Plant and equipment, and intangible assets costing $5,000 and above individually (or forming part of a network
costing more than $5,000) are capitalised.
- 13 -

LUNA PARK RESERVE TRUST
Section C: Assets
Notes to and Forming Part of the Financial Statements for the Year Ended 30 June 2018
(iii) Revaluation of Property, Plant and Equipment
Physical non-current assets are valued in accordance with Treasury Policy and Guidelines Paper TPP 14-01 "Valuation
of Physical Non-Current Assets at Fair Value". This policy adopts fair value in accordance with AASB 13 "Fair Value
Measurement" and AASB 116 "Property, Plant and Equipment".
Property, plant and equipment is measured at the highest and best use by market participants that is physically
possible, legally permissible and financially feasible. The highest and best use must be available at a period that is not
remote and take into account the characteristics of the asset being measured, including any social-political restrictions
imposed by government. In most cases after taking into account these considerations, the highest and best use is the
existing use. In limited circumstances, the highest and best use may be a feasible alternative use, where there are no
restrictions on use or where there are no restrictions on use or where there is a feasible higher restricted alternative use.
Fair value of property, plant and equipment is based on a market participants’ perspective, using valuation techniques
(market approach, cost approach, income approach) that maximise relevant observable inputs and minimise
unobservable inputs. Also refer to Note C4 for further information regarding fair value.
The Trust revalues each class of property, plant and equipment at least every three years or with sufficient regularity to
ensure that the carrying amount of each asset in the class does not differ materially from its fair value at reporting date.
A comprehensive revaluation was performed on 30 June 2016 by AON Global Risk Consulting Valuation Services (AON).
Interim revaluations are conducted between comprehensive revaluations where cumulative changes to indicators
suggest fair value may differ materially from carrying value. An interim formal revaluation was completed by AON on30 June 2018.
Non-specialised assets with short useful lives are measured at depreciated historical cost, as a surrogate for fair value.
When revaluing non-current assets by reference to current prices for assets newer than those being revalued (adjusted
to reflect the present condition of the assets), the gross amount and the related accumulated depreciation are
separately restated.
For other assets, any balances of accumulated depreciation at the revaluation date in respect of those assets are
credited to the asset accounts to which they relate. The net asset accounts are then increased or decreased by the
revaluation increments or decrements.
Revaluation increments are credited directly to Asset Revaluation Reserve, except that, to the extent that an increment
reverses a revaluation decrement in respect of that class of asset previously recognised as an expense in the net
result, the increment is recognised immediately as revenue in the net result.
Revaluation decrements are recognised immediately as expenses in the net result, except that, to the extent that a credit
balance exists in the Asset Revaluation Reserve in respect of the same class of assets, they are debited directly to the
Asset Revaluation Reserve.
As a not-for-profit entity, revaluation increments and decrements are offset against one another within a class of
non-current assets, but not otherwise.
Where an asset that has previously been revalued is disposed of, any balance remaining in the Asset Revaluation
Reserve in respect of that asset is transferred to accumulated funds.
(iv) Impairment of Property, Plant and Equipment
As a not-for-profit entity with no cash generating units, impairment under AASB 136 "Impairment of Assets" is unlikely
to arise. As property, plant and equipment is carried at fair value, impairment can only arise in the rare circumstances
where the costs of disposal are material. Specifically, impairment is unlikely for not-for-profit entities given that AASB
136 modifies the recoverable amount test for non-cash generating assets of not-for-profit entities to the higher of fair
value less costs of disposal and depreciated replacement cost, where depreciated replacement cost is also fair value.
At each reporting date the Trust assesses whether there is an indication that an asset may be impaired. If any
indication exists, or when annual impairment testing for an asset is required, the Trust estimates the asset’s
recoverable amount. When the carrying amount of an asset exceeds its recoverable amount, the asset is considered
impaired and is written down to its recoverable amount. As a not-for-profit entity, an impairment loss is recognised in
the net result to the extent the impairment loss exceeds the amount in the Asset Revaluation Reserve for the class of asset.
- 14 -

LUNA PARK RESERVE TRUST
Section C: Assets
Notes to and Forming Part of the Financial Statements for the Year Ended 30 June 2018
(v) Major Inspection Costs
When each major inspection is performed, the labour cost of performing major inspections for faults is recognised in the
carrying amount of an asset as a replacement of a part, if the recognition criteria are satisfied.
(vi) Restoration Costs
The estimated cost of dismantling and removing an asset and restoring the site is included in the cost of an asset, to
the extent it is recognised as a liability.
C4. FAIR VALUE MEASUREMENT OF NON-FINANCIAL ASSETS
The following table shows the levels within the hierarchy of non-financial assets measured at fair value on a recurring
basis (Refer to Notes A2(e) and C4):
(a) Fair Value Hierarchy
2018 Level 1 Level 2 Level 3 Total Fair
Value
$'000 $'000 $'000 $'000
Property, Plant and Equipment (Note C3)
Land - 17,690 - 17,690
Buildings - - 16,308 16,308
Infrastructure - - 7,583 7,583
- 17,690 23,891 41,581
2017 Level 1 Level 2 Level 3 Total Fair
Value
$'000 $'000 $'000 $'000
Property, Plant and Equipment (Note C3)
Land - 16,846 - 16,846
Buildings - - 16,209 16,209
Infrastructure - - 7,671 7,671
- 16,846 23,880 40,726
There were no transfers between Level 1 or 2 during the periods.
(b) Valuation Techniques, Input and Processes
For each class of property, plant and equipment, a description of the valuation technique applied and the inputs used in
the fair value measurement is disclosed in the table below. For the valuation processes refer note C3(b)(iii).
Class
Land Market approach (recurring) - assets are valued based on - Comparable property sales
comparable property sales transactions having regard to values
matters such as heritage restrictions, zoning, location, - Adjustments including
topography, aspect, frontage, size, shape, date of contract condition, location, heritage
and current market conditions restrictions topography
Buildings Depreciated replacement cost approach (recurring) - assets - Current unit replacement
are valued based on the structure, fabric and finishes as a costs
heritage structure, rates reflect modern building techniques - Adjustments including capital
with regard to Rawlinson's Australian Construction improvements, remaining useful
Handbook 2018 lives of buildings
Infrastructure Depreciated replacement cost approach (recurring) - assets - Current unit replacement
are valued based on the structure, fabric and finishes as a costs
heritage structure, rates reflect modern building techniques - Adjustments including capital
with regard to Rawlinson's Australian Construction improvements, remaining useful
Handbook 2018 lives of infrastructure
Valuation Technique Key Inputs
- 15 -

LUNA PARK RESERVE TRUST
Section C: Assets
Notes to and Forming Part of the Financial Statements for the Year Ended 30 June 2018
(c) Reconciliation of Recurring Level 3 Fair Value Measurements
2018 Buildings Infrastructure
Total Recurring
Level 3 Fair
Value
$'000 $'000 $'000
Fair Value as at 1 July 2017 16,209 7,671 23,880
Revaluation Increments/(Decrements) 625 224 849
Depreciation (526) (312) (838)
Fair Value as at 30 June 2018 16,308 7,583 23,891
2017 Buildings Infrastructure
Total Recurring
Level 3 Fair
Value
$'000 $'000 $'000
Fair Value as at 1 July 2016 16,217 7,844 24,061
Revaluation Increments/(Decrements) 507 134 641
Depreciation (515) (307) (822)
Fair Value as at 30 June 2017 16,209 7,671 23,880
There were no transfers into or out of Level 3 during the periods.
- 16 -

D1. PAYABLES
(a) Payables 2018 2017
$'000 $'000
Current
Trade Creditors 382 21
Accrued Expenses 48 996
430 1,017
(b) Recognition and Measurement - Payables
Payables are recognised for amounts due to be paid in the future for goods or services received, whether or not invoiced
Payables represent liabilities for goods and services provided to the entity and other amounts. Payables are recognised
initially at fair value, usually based on the transaction cost or face value. Subsequent measurement is at amortised cost
using the effective interest method. Short-term payables with no stated interest rate are measured at the original invoice
amount where the effect of discounting is immaterial.
The Trust's payables are all non-interest bearing. Payable items which are out of the scope of AASB 7 "Financial
Instruments: Disclosures" have been excluded from the carrying amount shown in the Statement of Financial Position.
(c) Liquidity Risk
Liquidity risk is the risk that the Trust will be unable to meet its payment obligations when they fall due. The Trust
manages risk through monitoring future cash flows and maturities planning to ensure adequate holding of high quality
liquid assets. The objective is to maintain a balance between continuity of funding and flexibility through the use of
overdrafts, loans and other advances. The Trust has no borrowings as at 30 June 2018.
During the current period, there were no defaults or breaches on any loan payable. No assets have been pledged as
collateral. The Trust's exposure to liquidity risk is deemed insignificant based on current assessment of risk.
(d) Maturity Profile
All of the Trust's payables and accruals have a maturity of less than 12 months (2017: less than 12 months). Amounts
owing to suppliers (which are unsecured) are settled in accordance with the policy set out in Treasury Circular TC 11/12.
If trade terms are not specified, payment is made no later than the end of the month following the month in which an
invoice or statement is received. Treasury Circular TC 11/12 allows the Minister to award interest for late payment.
LUNA PARK RESERVE TRUST
Section D: Liabilities
Notes to and Forming Part of the Financial Statements for the Year Ended 30 June 2018
- 17 -

E1. EQUITY
(a) Accumulated Funds
The category Accumulated Funds includes all current and prior period retained funds.
Accumulated Funds Movement 2018 2017
$'000 $'000
Carrying Amount at 1 July 9,710 8,980
Net Result for the Year (1,107) 730
Carrying Amount at 30 June 8,603 9,710
(b) Asset Revaluation Reserve
The revaluation surplus is used to record increments and decrements on the revaluation of non-current assets. This
accords with the Trust’s policy on the Revaluation of Property, Plant and Equipment as discussed in Note C3.
Asset Revaluation Reserve Movement 2018 2017
$'000 $'000
Carrying Amount at 1 July 33,560 34,273
Net Increase/(Decrease) on Revaluation (Note C3(b)) 1,693 (713)
Carrying Amount at 30 June 35,253 33,560
Dissection by Asset Class:
Land 12,870 12,026
Buildings 15,242 14,617
Infrastructure 7,141 6,917
Total Asset Revaluation Reserve at 30 June 35,253 33,560
LUNA PARK RESERVE TRUST
Section E: Equity
Notes to and Forming Part of the Financial Statements for the Year Ended 30 June 2018
- 18 -

F1. FINANCIAL INSTRUMENTS
The Trust’s principal financial instruments are outlined below. These financial instruments arise directly from the Trust’s
operations or are required to finance the Trust’s operations. The Trust does not enter into or trade financial instruments,
including derivative financial instruments, for speculative purposes.
Quantitative and qualitative disclosures together with the Trust's objectives, policies and processes for measuring and
managing risk are included throughout the financial statements.
The PMNSW Board (as the Trust manager) has overall responsibility for the establishment and oversight of risk
management and reviews and agrees policies for managing each of these risks. Risk management policies are
established to identify and analyse the risks faced by the Trust, to set risk limits and controls and to monitor risks.
Compliance with policies is reviewed by Management on a continuous basis.
(a) Financial Instrument Categories 2018 2017
$'000 $'000
Financial Assets - Carrying Amounts
Class: Category Notes
Cash and Cash Equivalents C1 2,158 3,228
Receivables (i) Loans and Receivables
(at Amortised Cost) C2 524 173
Financial Liabilities - Carrying Amounts
Class: Category Notes
Payables (ii) Financial Liabilities
(at Amortised Cost) D1 430 1,017
(i) Excludes statutory receivables and prepayments as they are not within scope of AASB 7.
(ii) Excludes statutory payables and unearned revenue as they are not within scope of AASB 7.
(b) Credit Risk
Credit risk arises when there is the possibility that a counterparty will default on their contractual obligations, resulting
in a financial loss to the Trust. The maximum exposure to credit risk is generally represented by the carrying amount of
the financial assets (net of any allowance for impairment).
Credit risk arises from the financial assets of the Trust, including cash and receivables (Notes C1 and C2). No collateral
is held by the Trust and the Trust has not granted any financial guarantees. Credit risk associated with the Trust’s
financial assets, other than receivables, is managed through the selection of counterparties and establishment of
minimum credit rating standards.
(c) Market Risk
Market risk is the risk that the fair value or future cash flows of a financial instrument will fluctuate because of changes in
market prices. The Trust’s exposures to market risk are primarily through interest rate risk on the Trust’s Cash and Cash
Equivalents (Note C1). The Trust has no exposure to foreign currency risk and does not enter into commodity contracts.
(d) Fair Value of Financial Instruments
The Trust's financial instruments are recognised at cost. The amortised cost of the Trust's financial instruments
recognised in the Statement of Financial Position approximates the fair value, because of the short-term nature of the
financial instruments. The Trust has not identified any financial instruments whose fair value differs materially from the
carrying amount.
N/A
LUNA PARK RESERVE TRUST
Section F: Financial Instruments and Other Notes
Notes to and Forming Part of the Financial Statements for the Year Ended 30 June 2018
- 19 -

LUNA PARK RESERVE TRUST
Section F: Financial Instruments and Other Notes
Notes to and Forming Part of the Financial Statements for the Year Ended 30 June 2018
(e) Impairment of Financial Assets
All financial assets, except those measured at fair value through profit and loss, are subject to an annual review for
impairment. An allowance for impairment is established when there is objective evidence that the entity will not be able to
collect all amounts due.
For financial assets carried at amortised cost, the amount of the allowance is the difference between the asset's carrying
amount and the present value of estimated future cash flows, discounted at the effective interest rate. The amount of the
impairment loss is recognised in the Net Result for the year.
Any reversals of impairment losses are reversed through the Net Result for the year, where there is objective evidence.
Reversals of impairment losses of financial assets carried at amortised cost cannot result in a carrying amount that
exceeds what the carrying amount would have been had there not been an impairment loss.
F2. COMMITMENTS FOR EXPENDITURE
The Trust has no expenditure commitments at 30 June 2018 (Nil at 30 June 2017).
F3. CONTINGENT ASSETS AND CONTINGENT LIABILITIES
The Trust is not aware of any contingent assets or liabilities at 30 June 2018 (Nil at 30 June 2017).
F4. RELATED PARTY DISCLOSURES
(a) Key Management Personnel Compensation
During the year, the Trust did not pay any compensation to its key management personnel, nor did the Trust incur any
expense in respect of the key management personnel services that are provided by a separate management entity.
(b) Transactions and Outstanding Balances with Other Related Parties
During the year, the Trust did not enter into other transactions with key management personnel, their close family
members and controlled or jointly controlled entities thereof.
(c) Transactions and Outstanding Balances with Other Government Entities
During the year, the Trust entered into transactions with other entities that are controlled/jointly controlled/significantly
influenced by NSW Government. These transactions in aggregate are a significant portion of the Trust’s sale of
goods/rendering of services/receiving of services.
F5. EVENTS AFTER REPORTING DATE
The Trust has not identified any events or transactions that are material to require adjustments or disclosures in the
financial report.
End of Audited Financial Statements
- 20 -