Embed Size (px)
Citation preview
Place branding and economic developmentat the local level in Ontario, Canada
Evan Cleave • Godwin Arku
� Springer Science+Business Media Dordrecht 2014
Abstract Municipalities in Ontario, Canada are
increasingly adopting place branding as a policy
strategy, to promote economic development—that is,
to attract investment, tourists, labour force, and
residents. This study examines the extent of branding
in the province of Ontario, Canada, through a com-
prehensive content analysis of municipal branding as
presented through logos and slogans. This analysis
affirms that place branding is a widely used practice in
Ontario, but that there are classes of municipalities
with specific characteristics (size, type, and location)
that use logos and slogans less frequently. Thus the
results of this study suggest Ontario’s municipalities
may not be reaping the expected benefits in their place
branding efforts, as some municipalities are falling
behind the rest of the province in their ability to
promote themselves. The paper recommends that
municipalities need to consider re-examining their
branding strategy to maximize the opportunity for
future economic development while demonstrating
fiscal responsibility and sound public governance.
Keywords Place branding � Economic
development � International competitiveness �Municipality � Ontario
Introduction
Over the past two to three decades, the practice of
place branding has attracted an increasing attention
from policy-makers and scholars, with regards to its
role in facilitating local and regional development (see
Allen 2007; Kavaratzis 2005; Pasquinelli 2013; Rant-
isi and Leslie 2006; Urry 1995). Evidence of this
emergence can be found in the actions of governments
at all geographic levels, who are adopting place
branding as part of their policymaking to promote
economic growth and development (Eshuis and
Edwards 2013; Hansen 2010; Johansson 2012; Pas-
quinelli 2010, 2013; Stern and Hall 2010).
This growing importance can be linked to several
changes, most notably the increasing competition
spurred on by globalization, political restructuring
caused by the emergence of neoliberalism and its
associated policymaking, and the emergence of
service and knowledge-based economies. Globaliza-
tion and the emergence of new urban regions as
centres of capital accumulation has redefined the
economic landscape, forcing traditional markets to
adjust their approach to the way they pursue economic
development policymaking. Commenting on global
changes, Anhold (2006, p. 2) observes that ‘‘in today’s
globalized, networked world every place has to
compete with every other place for its share of the
world’s consumers, tourists, businesses, investment,
capital, respect and attention.’’ Concurrently, neolib-
eralization has had the effect of liberalizing the global
E. Cleave � G. Arku (&)
Western University, London, ON, Canada
e-mail: [email protected]
123
GeoJournal
DOI 10.1007/s10708-014-9555-9
marketplace to allow a freer-flowing of resources and
capital between competing areas. As well, in some
advanced societies such as Canada there has been a
trend of deregulation at upper levels of government,
and the downloading of responsibilities—including
economic development to the local level (Keil 2002).
Taking together these global and national changes are
forcing a spatial restructuring of contemporary urban
centres as the sites of capital accumulation (Brenner
and Theodore 2002). Specifically, municipalities have
increasingly become the focus of the international
competition for investment, talent, and business.
The global and national changes pose paradoxical
challenges to municipalities. Traditional manufactur-
ing industries have declined and given way to a service
and knowledge-based economies, subsequently affect-
ing the approaches of municipal governments towards
their local development (Scott 2007). An example of
this can be seen in the policymaking of twenty-first
century Canadian cities, which have emphasized talent
recruitment to sustain the emerging knowledge-based
economy (Grant and Buckwold 2013). The changes
also offer local policy-makers with new avenues for
tools and ideas for defining their economic develop-
ment path such as the promotion of culture and
creativity in talent attraction (Rantisi and Leslie 2006).
On the downside, the changes have made some
municipal vulnerable to fiscal decline and economic
dislocation. The Province of Ontario in Canada is not
immune to such vulnerabilities, as its municipalities
face the same critical economic and social challenges
as those being experienced by their national, conti-
nental, and global counterparts. Specific challenges
include declines in their industrial base, increases in
unemployment and poverty, reductions in financial
support for municipal services, competition within the
international market, and the need to attract highly
mobile capital (Arku 2013, 2014; Wolfe and Gertler
2001).
Over the past decades, place branding has increas-
ingly become a crucial policy tool for localities and
regions, with considerable public resources being
spent on range of initiatives (Harvey and Young 2012;
Stern and Hall 2010). This study contextualizes place
branding as an outcome of contemporary political-
economics, facilitated by the structural changes to
governments, policymaking, and economic markets at
all scales. Embedded within this research, is the
exploration of how these processes have manifested
over a larger number of municipalities encapsulated in
a single region.
To achieve this goal, this study provides a com-
prehensive review of the place branding currently
implemented in the 414 local municipalities in the
province of Ontario, Canada. Ontario is selected for
this study because of its size and the diversity of its
municipalities. As noted earlier, the province also
suffers from a range of economic problems, such as
plant closures and rising unemployment, as a result
municipalities have become very pro-active in their
economic development efforts (Arku 2013, 2014).
This diversity allows several previously unasked
research questions to be answered, specifically: is
place branding a ubiquitously policy approach in
Ontario? Or are there characteristics associated with
municipalities that encourage or discourage its use?
Based on the uneven distribution of political struc-
tures, resources, industries, and population within the
province’s municipalities, it seems likely that charac-
teristics such as population size, municipal type, and
location in the province will influence whether place
branding is utilized. To test this assertion, the 414 local
municipalities are examined for use of a constructed
visual identity component to a place brand—a logo or
slogan. These components form the baseline for place
branding and are frequently utilize tools by munici-
palities to brand, create identity and promote them-
selves (Johansson 2012). A municipality that has
adopted a logo or slogan can therefore be identified as
having placed some consideration on how they wish to
be perceived externally.
An overview of place branding
In its basic form, place branding is a policy exercise in
economic development. By promoting positive
aspects of the municipality, there is an implicit
message being presented that indicates that the place
being represented is better than its competitors. To
achieve this, the brand attempts to create an emotional
connection with its audience, using two important
components of place: the sense of place and its
experiential nature (Hansen 2010). This experience is
initially cultivated in the way a place presents its
locale environment, facilitates psychological experi-
ences, and grows expectations and perception over
time, through all manners of sensory encounters
GeoJournal
123
(Allen 2007). Allen (2007) argues that the experience
of a place can extend ahead of actual consumption.
This before-place experience includes the period
during which an intent to consume is formed, and
extends to the post-place experience of memory
formation, loyalty reinforcement, and word-of-mouth
dissemination and communication (Allen 2007; Jo-
hansson 2012). The perception of a place formed by
potential customers prior to actually engaging in the
consuming of the place is of critical importance within
the branding process. Similarly to consumer products
and services, formulating predisposition and intent to
buy is one of the central drivers of brand investment
and decision-making (Allen 2007). The goal is to
create a proposition that compels the customer to buy
into the ideas being presented. As Anholt (2006 p. 18)
puts it, ‘‘all of people’s decisions, whether they are as
trivial as buying an everyday product or as important
as relocating a company, are partly rational and partly
emotional. No human activity is exempt from this rule,
and the brand images of cities and countries underpin
the emotional part of every decision and strongly
affect the rational part too.’’ Place branding, can
therefore be seen as the conscious attempt of govern-
ments to shape a specifically designed place identity
and to promote it to desired markets and consumers
(Allen 2007; Khirfan and Momani 2013; Johansson
2012). Any consideration, therefore, of the fundamen-
tal geographical conception of sense of place must
include the deliberate creation of such senses through
place branding.
This description of places as an experience draws
heavily from the humanist propositions of place,
space, and sense of place. The ultimate goal is to
develop a strong enough connection with the con-
sumer—potential capital investors, labourers, and
industry—that it affects their decision-making pro-
cess. One of the main goals is to create imagery and
narrative that are developed to attract external atten-
tion—essentially attempting to improve economic
standing at the municipal level through the creation of
place and sense of place. While place ultimately
becomes the dominant explanation of what comprises
the world, understanding of space is a required
underpinning. In this regard space provides a context
from which the idea of place can spring; or as Tuan
(1976) argues, place is explained in the broader frame
of space. Tuan (1971) defines space as formless and
profane, devoid of any true meaning; contrasted with
place, which incarnates the experiences and aspira-
tions of people. Contextually, this space-place rela-
tionship can be used to explain the political-economic
environment of an increasingly globalized world. As
homogenization continues—where cities are increas-
ingly providing similar services and infrastructures
and improvements in communication and transporta-
tion allow increased connectivity—the exceptional
becomes the mundane. As a result, any meaning and
uniqueness imbued in the municipality is diminished.
From the decision-maker trying to find a location for
labour, capital, or industry the lack of distinguishable
features over space can make it appear formless.
Therefore, in the context of economic development,
branding becomes important because it provides
meaning (Allen 2007; Hansen 2010). Johansson
(2012) argues that branding allows for meaning and
association to be developed for a municipality,
differentiating itself from its contemporaries, and
ultimately becoming a place within the larger politi-
cal-economic space.
The sense of place developed by the consumer at
the point of initial contact will be shaped by the visual
brand imagery presented by the municipality. While
not a brand by itself, the brand image is created
through the text and symbols contained within the logo
or slogan. This set of semiotic relationships distills the
concepts that the municipality desires to project.
Acting as a wedge into the global marketplace, the
logo and slogan act as an interface for the initial
contact between the municipality and its audience.
The experience of initial contact with the logo or
slogan allows the consumer to develop a preliminary
opinion—manifested in a sense of place—about the
municipality.
In this initial interaction, the place brand acts as an
interface between the municipality (the producer) and
its audience (the consumer). From the audience
perspective, the interaction with the brand occurs
through the consumption of the brand image. The
reputation that is cultivated from this interaction
incorporates the perceptions of quality and values
(Kavaratzis 2005). Municipality brands, therefore, can
be divided into two key elements: the image, which is
the external reputation of the brand; and the identity,
which is the internal view. The image is the sum of
beliefs, ideas, and impressions that are developed
about the municipality by its audience (Kotler and
Andreasen 1993). If this reputation is seen as the total
GeoJournal
123
of the descriptive, observed, and inferred beliefs one
has about a municipality, at the point of contact
between the brand and the consumer, when little else
will be known about the municipality, there is the
opportunity to shape the consumer’s ideas, beliefs, and
impressions (Papadopoulos 2004). In contrast, the
identity is created within the municipality, and is a
manifestation of the local identity that is cultivated out
of local politics, policymaking, history, as well as
social and economic realities.
Place branding in a political economic context
Within local economic development theory, branding
can be considered a form of what Blakely and Green
Leigh (2010) describe as an attraction model. Within
this context, municipalities are considered as products
that need to be packaged and appropriately displayed,
to facilitate consumption by a targeted audience.
Evidence of this packaging can be observed in
magazine and newspaper advertisements (Blakely
and Green Leigh 2010), municipal webpages (Florek
et al. 2008), and social media campaigns (Ketter and
Avraham 2012), all of which extol the virtues of one
location over another. Indeed, in an increasingly
competitive global market place municipality need
to differentiate themselves in order to attract attention
and gain reputation, goodwill and trust. Developing a
unique brand is increasingly becoming the major
avenue by which municipalities attempt to promote
themselves and create identity.
The increased adoption of municipal branding can
be further linked to the emergence of ‘the entrepre-
neurial city’ (Hubbard and Hall 1998) and neoliberal
policy programmes in North American and European
cities (Greenberg 2008). This economic environment
developed from the global economic crises of the
1970s, and the initial stages of economic transforma-
tion away from the traditional Fordist-structure
towards neoliberal policymaking (Harvey 1989). In
this period, Giovanardi (2012, p. 32) argues that there
was a ‘‘crisis of the nation state as a meaningful unit of
competition’’ and that there was a trend of ‘‘cities
returning to being economic arenas of primary
importance.’’ City administrators, however, found
themselves in onset of their own crisis (Kavaratzis
2005). As Hannigan (2003, p. 353) describes, ‘‘in the
late 1980s and early 1990s, a fiscal crisis in cities
across Europe and North America caused by the triple
problems of de-industrialisation, a falling tax base and
declining public expenditure had some serious impli-
cations for cities.’’ Factories were closing and jobs
disappearing as the industrial culture on which the
economy was built had begun to erode. Concurrently,
the pursuit of neoliberal policy allowed the emergence
of political-economic structures and ideologies based
around privatization and deregulation (Leslie and
Rantisi 2006). Viewed as the precursor to the terminal
decline of traditional urban economies, there was a
need for economic restructuring and which ‘‘stimu-
lated the search for new roles for cities and new ways
of managing their problems’’ (Barke 1999, p. 486).
The rapidly changing political economies of North
America and Europe facilitated the emergence of a
new ‘entrepreneurial’ style of local economic devel-
opment in which image promotion was privileged as
being central by planners and politicians (Hannigan
2003; Harvey 1989). Entrepreneurialism captures the
sense in which cities are being run in a more
businesslike manner, and the practices that have seen
local government imbued with characteristics once
distinctive to businesses—risk-taking, inventiveness,
promotion and profit motivation (Harvey 1989; Hub-
bard and Hall 1998). The use of branding within this
municipality management is a natural consequence of
this entrepreneurial governance, as it presented a
means of allowing cities to remain economically
relevant (Pasquinelli 2010, 2013).
Based on a free-market ideology, these pro-
grammes propose a decrease in state regulation and
the introduction of private-sector strategies (Rantisi
and Leslie 2006). Marketing-led strategies of eco-
nomic development have come to play a more
important role (Greenberg 2008). Municipal branding,
therefore, has been described as a ‘market-led’
approach to stimulating local economic development
(Greenberg 2008; Pasquinelli 2010), as its develop-
ment, refinement, and application as an economic
development strategy have strong links with the
changing global economy (Giovanardi 2012; Kava-
ratzis 2005; Papadopoulos 2004; Pasquinelli 2010). In
fact, municipal branding is typically interpreted from
the context of globalization (Pasquinelli 2013), and is
situated in the climate of strong inter- municipality
competition.
GeoJournal
123
Introducing Ontario: setting the context
for economic development
Ontario is Canada’s most populous province, home to
about 13 million of Canada’s 34 million inhabitants,
distributed over 444 municipalities, each holding
sufficient political autonomy to allow for independent
decisions to be made (Tassonyi 2005). These 444
municipalities are structured politically into three
general classes: an upper-tier that provides regional
governance; a lower-tier that exists directly below the
upper-tier, working in conjunction to provide local
governance; and a single-tier of stand-alone commu-
nities. Since this investigation focuses on place
branding at the local level, the 30 regional upper-tier
communities were excluded, leaving a study group of
414 single and lower-tier municipalities (Government
of Ontario 2001). An important criterion for selection
of Ontario within this study is the diversity of
municipalities engaged in place branding, ranging in
size from villages with 150 inhabitants to a metropolis
of over 2 million residents.
Additionally, Ontario represents one of Canada’s
most important economic markets. In 2011, Ontario’s
gross domestic product (GDP) was approximately
$CAN 638 billion, contributing between 37 and 40 %
of Canada’s total GDP and 45 and 50 % of Canada’s
manufacturing GDP (Statistics Canada 2012). Busi-
ness activity in Ontario—manufacturing, retail trade,
construction, finance—accounts for 45 % of the
province’s GDP (Ontario Ministry of Finance 2012).
The province also has strong traditions of agriculture,
culture, and tourism. Over the last decade, municipal-
ities in Ontario have attempted to promote positive
economic growth through the cultivation of knowl-
edge economies, information and technology clusters,
and the creative class (Florida 2012; Gertler et al.
2002). The diversity of the economy allows munici-
palities a range of potential assets in which to
communicate through place branding.
Since the 1980s, Ontario has been forced to cope
with the challenges of significant economic restruc-
turing caused by globalization and neo-liberal policy
making. Municipalities which had previously pros-
pered from the presence of large manufacturing
complexes were forced to cope with the aftermath of
industrial restructuring and frequent relocation of
businesses to low-cost producing countries (Tassonyi
2005). From 2008 the province and its municipalities
have been affected by the ongoing global economic
crisis, manifested through plant closures and rising
unemployment. These challenges have affected the
economic fortunes of most municipalities in Ontario
and their approaches to local economic development
(Vinodrai 2010). To cope with these issues, munici-
palities in Ontario have been forced to become very
pro-active in their economic development efforts.
An additional issue facing municipalities in Ontario
is the tension that exists between the neoliberalization
of global economic markets and the institutional
controls at the provincial level that constrain them.
Despite the continual downloading of economic
responsibilities from the province to its municipalities,
forcing them to become the primary units for economic
development, the lower tiers of government remain
creatures of the provincial government (Arku 2014).
This institutional reality contrasts the prescribed role of
the province in a neoliberal environment, where the
upper tier governments should keep interventions into
the market to the bare minimum (Harvey 2007).
Through the Municipal Act Ontario’s municipalities
face a range of legislative restraints that define the
scope of their power. Specifically, the province holds
an array of historical institutional controls that define
the tools available to municipalities in the area of
economic development. Municipalities in Ontario
have the authority and responsibility to provide basic
services, to develop appropriate infrastructure, and
negotiate financing to carry out their mandate as set out
by provincial statutes and regulations. Direct financial
assistance by municipalities to business, however, has
been forbidden since 1880s (Gertler 1990; Tassonyi
2005). The subsequent Acts have carried this prohibi-
tion forward, with the 2001 Act, for instance stating
that: ‘‘A municipality is not permitted, despite any Act,
to assist any manufacturing business or other industrial
or commercial enterprise, either directly or indirectly,
through the granting of bonuses’’.
In essence, this statute makes it difficult for
municipalities to utilize any of the following practices
without explicit consent of the province: (a) giving or
lending any property or money that is controlled by the
municipality; (b) guaranteeing borrowing of monetary
funds; (c) leasing or selling any property held by the
municipality at below fair market value; or (d) giving a
total or partial exemption from any levy, charge, or fee
(see Section 106(2) of the Municipal Act, Government
of Ontario 2001).
GeoJournal
123
There are a few areas under the Municipal Act
where municipalities have some flexibility. In partic-
ular, there is the ability to deliver incentives for
heritage development and brownfield redevelopment
within a municipal development plan (Reese and
Sands 2007; Tassonyi 2005). A potential avenue for
business expansion and retention is the ability for
municipalities to waive development charges for
businesses for certain areas of their jurisdiction (e.g.,
downtown, business parks) and to provide serviced
land at competitive market prices. They also have
flexibility with respect to the establishment of small
businesses, acquisition and sales of properties to small
businesses, and the establishment of economic devel-
opment corporations (EDCs).
Overall, the hierarchical restrictions on the prov-
ince’s municipalities have guided the approach to
economic development. Gertler (1990, p. 43) argued
that ‘‘such restrictive provincial statutes have impor-
tant implications for the manner in which local
governments fashion and pursue their own economic
development strategies, since they are constrained
from engaging fully in the kind of competitive inter-
jurisdictional bidding for economic activity that
American municipalities have developed.’’ Due to
these restrictions, municipalities in Ontario have been
compelled to find creative ways to enhance the
economic growth and competitiveness of their juris-
diction, particularly as other Canadian provinces (e.g.
Alberta) and American states have taken a more
liberal, free market approach to local economic
development. As a result of the need for creativity,
there has been increased emphasis on place branding
to positively promote the municipality to draw in
tourists, talent, and business. The leveraging of local
attributes, such as waived development charges or
existing infrastructure, are methods of managing the
identity, image, and reputation of the municipality.
Reese and Sands (2007) have shown that the occur-
rence of municipal promotion has occurred at a higher
rate than the neighbouring state of Michigan, which
traditionally has more lenient policies toward muni-
cipal spending to attract and retain business.
Methods
The main research questions guiding this study are: is
place branding a ubiquitously policy approach in
Ontario? Are there municipal characteristics that
influence its use? To answer these questions, the 414
single and lower-tier municipalities (acquired from
Government of Ontario 2001; Ministry of Municipal
Affairs and Housing 2014) in Ontario were examined
to determine whether they were communicating some
form of local identity through a logo or slogan. Data
was collected through a systematic cataloguing of
municipal logos and slogans. Municipal websites were
used as the starting point for data collection. As the
internet is a primary medium for contemporary
communication, as it is increasingly becoming the
initial point of contact between a municipality and its
target audience. A municipality that desires to com-
municate its brand will therefore display it promi-
nently on its website. As a result, the logos and slogans
appearing on municipal websites were considered to
be the primary ones used by the municipality. The data
collection was limited to main municipal brands only.
Subservient brands of municipal departments or EDCs
were not included in the analysis. In instances where
no logo or slogans were displayed or no website
existed, direct inquiries were made to ensure a
complete dataset was developed. A simple binary
(yes/no) system was utilized to record the presence or
absence of a logo and slogan on each website for the
414 municipalities in Ontario.
To analyze the data to satisfy the research ques-
tions, a series of testable research hypotheses were
developed. To compare the use of logos and slogans
across the province, four independent variables were
identified: population size; municipal tier; self-iden-
tified municipal type; and location in the province’s
core or periphery. The research objectives consider
whether there is a difference in the level of place
branding that is observed because of particular char-
acteristics of a municipality. Different municipalities
will have different levels of resources to develop and
maintain brands, and may have structural or political
desires to differentiate themselves from associated
entities. As such, a potential explanation is that
municipalities with larger populations are more likely
to have a place brand than smaller ones due to access
to greater financial resources or larger government to
more easily allow develop and maintain its brand.
Similarly, lower-tier municipalities may have several
reasons to use a place brand compared to single-tier
municipalities and those with in-house economic
development offices: first, there may be greater
GeoJournal
123
resources available to develop a municipal brand, as
some financial, resource, and political burdens are
alleviated by strong external upper-tier, regional
governments or outsourced economic development
offices; while alternatively, a separate municipal brand
might be viewed as a necessity to differentiate from
these associated groups. Furthermore, it is probable
that municipalities that comprise the economic core of
the province are more likely to implement place
brands, as they are more fully integrated into the
global economic markets.
Finally, a consideration needs to be given as to how
municipalities have historically viewed themselves and
their place in the political hierarchy of the province.
While the 2001 Municipal Act redefined communities
into upper, lower, and single-tiers, its 1990 predecessor
maintained a historical precedent by delineating munic-
ipalities into cities, towns, townships, villages, and
generic municipalities (Government of Ontario 1990).
Though partially defined by population, such as the
minimum of 10,000 people for city status, there was
considerable latitude in determining municipal distinc-
tion. In part, these distinctions indicate social and
economic complexity at the municipal level, as well as
the size of local government. This distinction is
important for several reasons in this investigation: first,
place branding can be a long term process, and the
historical municipal definitions may influence contem-
porary place branding usage; and second, though the
designations of the 1990 Municipal Act were largely
removed by its successor, there remain lingering
elements in which communities are provided the
opportunity to self-identify as a city, town, township,
village, or generic municipalities (the one restriction is
that a city still requires a minimum population of
10,000). As a result, the self-identified municipal type
may provide insight into underlying reasons for differ-
ence in observed branding rates. It is expected that as
community complexity decreases, from city (most) to
villages (least), there will be differences in usage of
place branding. Specifically, in the larger municipal
governments of cities and towns there may be greater
opportunity to develop brands than smaller local
governments employed in townships or villages.
If true, this relationship should be identifiable
between municipality size, self-identified type, location,
and municipal-tier and place branding usage. As a result,
to explain the research questions, the hypotheses postu-
lated that: the use of place branding is not a ubiquitous
process for economic development in Ontario; and that
municipal characteristics influence both the use of place
branding as manifested through logos and slogans. To
examine these research hypotheses, a series of testable
statistical hypotheses were proposed. In general, the
hypothesis that guided the analysis was:
H0 municipality characteristics (population size,
municipal tier, municipal type, and location) do not
influence the rate of place branding;
HA the rate of place branding is influenced by the
characteristics of the municipality.
Due to the categorical nature of the dataset, there
are limitations on the analysis that can be performed to
answer the research questions. Since the place brand
data collected through the content analysis was
separated into discrete classes and is predicted to be
influenced by the characteristics of the municipality, it
can be used as the dependent variable in a contingency
table. In this study, Pearson’s Chi square test for
independence was used to examine the relationships
between branding and the various classes of munic-
ipalities (a = 0.05). An issue with Pearson’s Chi
square test is that on tables larger than 2 9 2, it is
difficult to determine whether all relationships are
significant or whether a single relationship influences
the outcome (Agresti 2013). Therefore, a second level
analysis was needed to better understand the dynamics
of the relationships within the data set. For relation-
ships that were found to be significant using Pearson’s
Chi square test, a one-sample test for proportions using
the z-statistic (a = 0.05) was applied. The advantage
of this two-level approach is that it identifies general
relationships between municipal characteristics, as
well as identifies specific categories of municipality
that over- and under-use branding techniques com-
pared to their peers. Since tier-level provides only two
categories, only Chi square tests were performed.
For the cataloguing and analysis of municipal brand
images, four pieces of data were utilized: the place
brand absence or presence data, broken down into logo
use, slogan use, and overall use; the population of each
municipality; the self-identified type of each munic-
ipality; the location of each municipality within the
province based on its Metropolitan Influence Zone
(MIZ) rating; and the municipal tier. For the three
independent variables (population, type, and location
through MIZ) the 2011 Statistics Canada census
GeoJournal
123
subdivision dataset was used as the source of the data.
Municipal tier was gathered through the Ministry of
Municipal Affairs and Housing (2014).
In this study, municipalities were classified into five
groups of municipality types based on their descrip-
tion in the 2011 Canadian census: cities (n = 51),
towns (n = 87), townships (n = 208), villages
(n = 11), and generic municipalities (n = 57). The
municipalities were also classified into six classes
based on population size. The classes were defined by
population thresholds that traditionally helped define
municipalities in Ontario: less than 500 people
(n = 32); 500–1,000 people (n = 48); 1,000–2,000
(n = 36); 2,000–10,000 (n = 155); 10,000–75,000
(n = 110); and having a population greater than
75,000 (n = 33). The first four categories were
defined by the 1990 Municipal Act; while the latter
two were developed from Arku (2014), as a method of
separating mid-sized and large municipalities.
Location in the province was assigned based on
each municipality’s MIZ rating from the 2011 Cana-
dian census. This approach subdivides municipalities
into seven categories that capture the social and
economic integration of communities with the urban
core of the province (du Plessis et al. 2002). Category
1 (n = 85) and 2 (n = 13) are considered primary
urban areas, with full economic and social integration.
Category 3 MIZs (n = 38) are characterized by a
strong influence by core urban areas, and have high
integration as at least 30 % of the workforce occupies
jobs in the urban core. Category 4 (n = 87) is
considered moderately integrated, with between 5
and 30 % of residents holding employment in a core
urban area. Category 5 (n = 126) suggests weak
integration as there is little interconnection (less than
5 %) between the municipality and the core. The last
two, categories 6 (n = 48) and 7 (n = 10) have no
integration with the provincial core. In general terms,
the MIZ provide a way of characterizing municipal-
ities as being located in the province’s core or
periphery. Finally, the municipalities were subdivided
into single-tier (n = 173) and lower-tier (n = 241).
Results
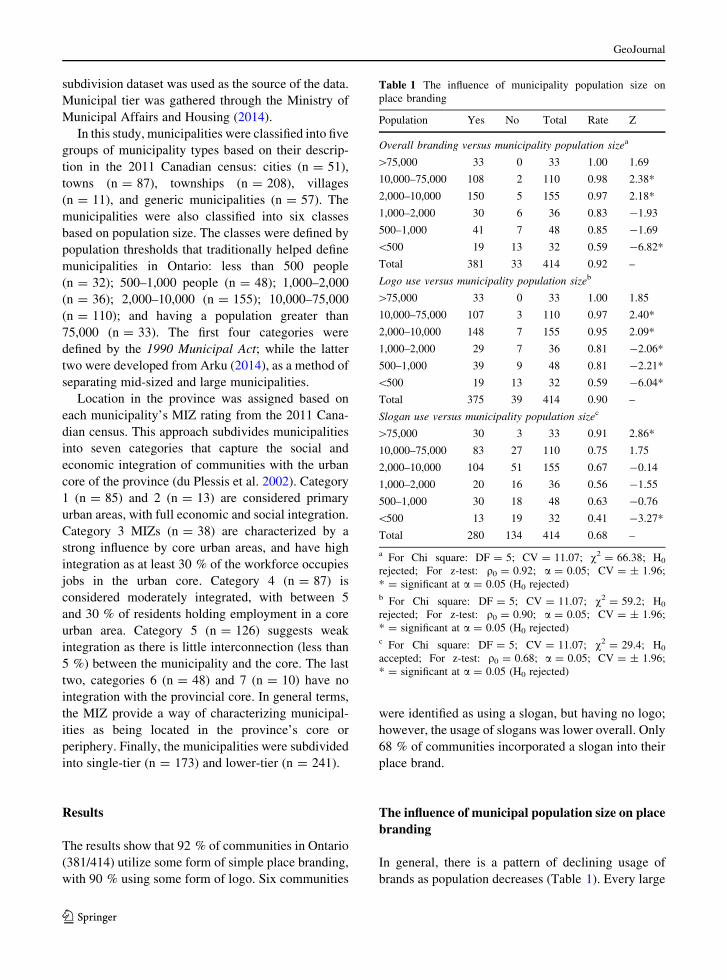
The results show that 92 % of communities in Ontario
(381/414) utilize some form of simple place branding,
with 90 % using some form of logo. Six communities
were identified as using a slogan, but having no logo;
however, the usage of slogans was lower overall. Only
68 % of communities incorporated a slogan into their
place brand.
The influence of municipal population size on place
branding
In general, there is a pattern of declining usage of
brands as population decreases (Table 1). Every large
Table 1 The influence of municipality population size on
place branding
Population Yes No Total Rate Z
Overall branding versus municipality population sizea
[75,000 33 0 33 1.00 1.69
10,000–75,000 108 2 110 0.98 2.38*
2,000–10,000 150 5 155 0.97 2.18*
1,000–2,000 30 6 36 0.83 -1.93
500–1,000 41 7 48 0.85 -1.69
\500 19 13 32 0.59 -6.82*
Total 381 33 414 0.92 –
Logo use versus municipality population sizeb
[75,000 33 0 33 1.00 1.85
10,000–75,000 107 3 110 0.97 2.40*
2,000–10,000 148 7 155 0.95 2.09*
1,000–2,000 29 7 36 0.81 -2.06*
500–1,000 39 9 48 0.81 -2.21*
\500 19 13 32 0.59 -6.04*
Total 375 39 414 0.90 –
Slogan use versus municipality population sizec
[75,000 30 3 33 0.91 2.86*
10,000–75,000 83 27 110 0.75 1.75
2,000–10,000 104 51 155 0.67 -0.14
1,000–2,000 20 16 36 0.56 -1.55
500–1,000 30 18 48 0.63 -0.76
\500 13 19 32 0.41 -3.27*
Total 280 134 414 0.68 –
a For Chi square: DF = 5; CV = 11.07; v2 = 66.38; H0
rejected; For z-test: q0 = 0.92; a = 0.05; CV = ± 1.96;
* = significant at a = 0.05 (H0 rejected)b For Chi square: DF = 5; CV = 11.07; v2 = 59.2; H0
rejected; For z-test: q0 = 0.90; a = 0.05; CV = ± 1.96;
* = significant at a = 0.05 (H0 rejected)c For Chi square: DF = 5; CV = 11.07; v2 = 29.4; H0
accepted; For z-test: q0 = 0.68; a = 0.05; CV = ± 1.96;
* = significant at a = 0.05 (H0 rejected)
GeoJournal
123
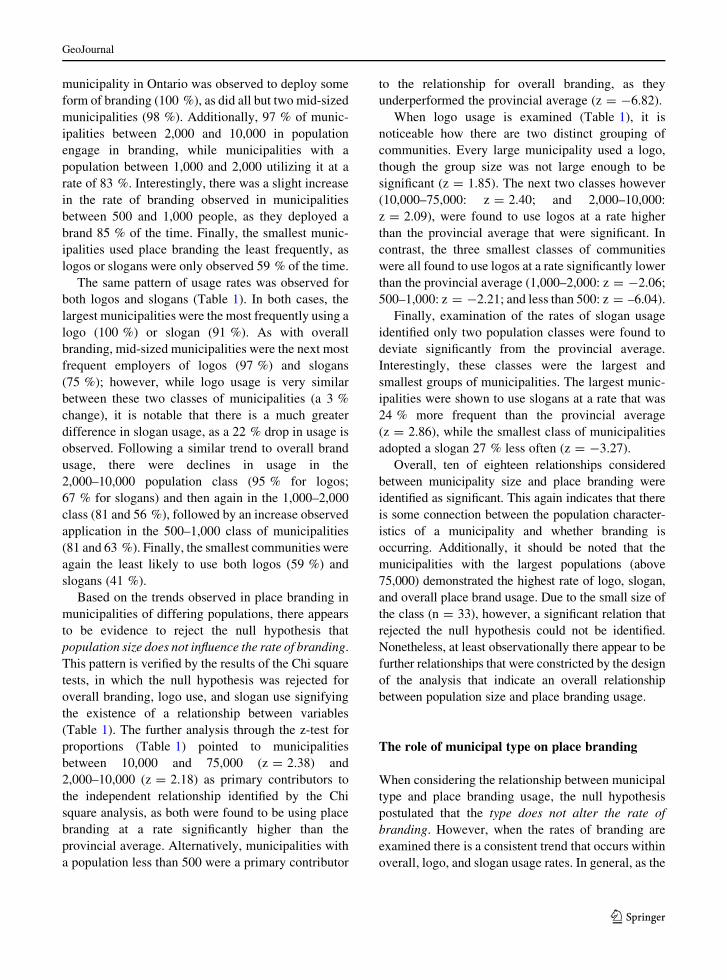
municipality in Ontario was observed to deploy some
form of branding (100 %), as did all but two mid-sized
municipalities (98 %). Additionally, 97 % of munic-
ipalities between 2,000 and 10,000 in population
engage in branding, while municipalities with a
population between 1,000 and 2,000 utilizing it at a
rate of 83 %. Interestingly, there was a slight increase
in the rate of branding observed in municipalities
between 500 and 1,000 people, as they deployed a
brand 85 % of the time. Finally, the smallest munic-
ipalities used place branding the least frequently, as
logos or slogans were only observed 59 % of the time.
The same pattern of usage rates was observed for
both logos and slogans (Table 1). In both cases, the
largest municipalities were the most frequently using a
logo (100 %) or slogan (91 %). As with overall
branding, mid-sized municipalities were the next most
frequent employers of logos (97 %) and slogans
(75 %); however, while logo usage is very similar
between these two classes of municipalities (a 3 %
change), it is notable that there is a much greater
difference in slogan usage, as a 22 % drop in usage is
observed. Following a similar trend to overall brand
usage, there were declines in usage in the
2,000–10,000 population class (95 % for logos;
67 % for slogans) and then again in the 1,000–2,000
class (81 and 56 %), followed by an increase observed
application in the 500–1,000 class of municipalities
(81 and 63 %). Finally, the smallest communities were
again the least likely to use both logos (59 %) and
slogans (41 %).
Based on the trends observed in place branding in
municipalities of differing populations, there appears
to be evidence to reject the null hypothesis that
population size does not influence the rate of branding.
This pattern is verified by the results of the Chi square
tests, in which the null hypothesis was rejected for
overall branding, logo use, and slogan use signifying
the existence of a relationship between variables
(Table 1). The further analysis through the z-test for
proportions (Table 1) pointed to municipalities
between 10,000 and 75,000 (z = 2.38) and
2,000–10,000 (z = 2.18) as primary contributors to
the independent relationship identified by the Chi
square analysis, as both were found to be using place
branding at a rate significantly higher than the
provincial average. Alternatively, municipalities with
a population less than 500 were a primary contributor
to the relationship for overall branding, as they
underperformed the provincial average (z = -6.82).
When logo usage is examined (Table 1), it is
noticeable how there are two distinct grouping of
communities. Every large municipality used a logo,
though the group size was not large enough to be
significant (z = 1.85). The next two classes however
(10,000–75,000: z = 2.40; and 2,000–10,000:
z = 2.09), were found to use logos at a rate higher
than the provincial average that were significant. In
contrast, the three smallest classes of communities
were all found to use logos at a rate significantly lower
than the provincial average (1,000–2,000: z = -2.06;
500–1,000: z = -2.21; and less than 500: z = –6.04).
Finally, examination of the rates of slogan usage
identified only two population classes were found to
deviate significantly from the provincial average.
Interestingly, these classes were the largest and
smallest groups of municipalities. The largest munic-
ipalities were shown to use slogans at a rate that was
24 % more frequent than the provincial average
(z = 2.86), while the smallest class of municipalities
adopted a slogan 27 % less often (z = -3.27).
Overall, ten of eighteen relationships considered
between municipality size and place branding were
identified as significant. This again indicates that there
is some connection between the population character-
istics of a municipality and whether branding is
occurring. Additionally, it should be noted that the
municipalities with the largest populations (above
75,000) demonstrated the highest rate of logo, slogan,
and overall place brand usage. Due to the small size of
the class (n = 33), however, a significant relation that
rejected the null hypothesis could not be identified.
Nonetheless, at least observationally there appear to be
further relationships that were constricted by the design
of the analysis that indicate an overall relationship
between population size and place branding usage.
The role of municipal type on place branding
When considering the relationship between municipal
type and place branding usage, the null hypothesis
postulated that the type does not alter the rate of
branding. However, when the rates of branding are
examined there is a consistent trend that occurs within
overall, logo, and slogan usage rates. In general, as the
GeoJournal
123
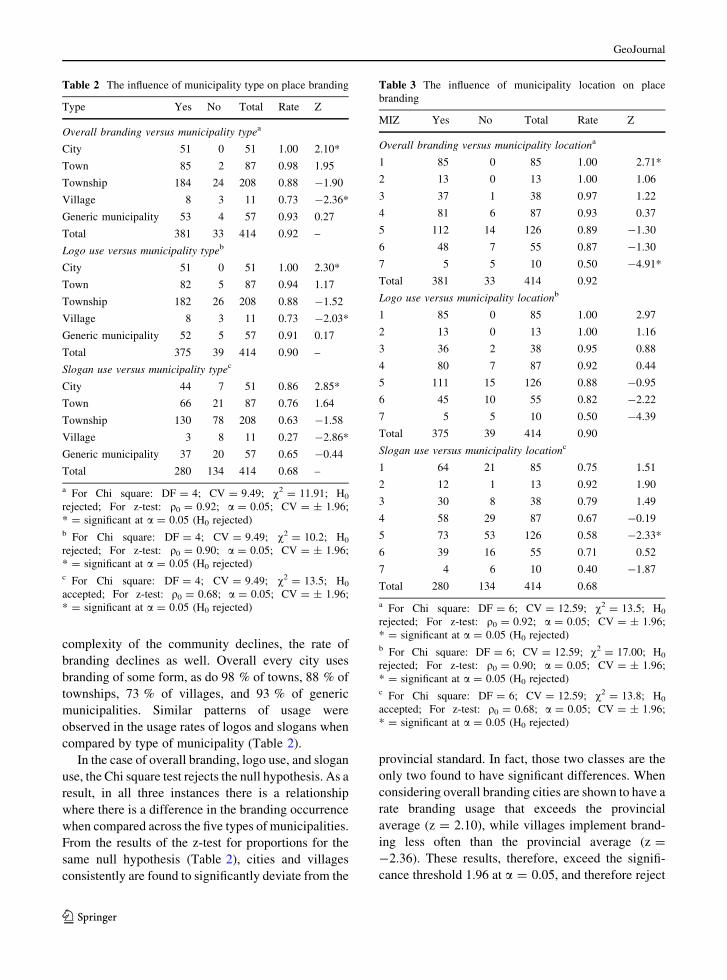
complexity of the community declines, the rate of
branding declines as well. Overall every city uses
branding of some form, as do 98 % of towns, 88 % of
townships, 73 % of villages, and 93 % of generic
municipalities. Similar patterns of usage were
observed in the usage rates of logos and slogans when
compared by type of municipality (Table 2).
In the case of overall branding, logo use, and slogan
use, the Chi square test rejects the null hypothesis. As a
result, in all three instances there is a relationship
where there is a difference in the branding occurrence
when compared across the five types of municipalities.
From the results of the z-test for proportions for the
same null hypothesis (Table 2), cities and villages
consistently are found to significantly deviate from the
provincial standard. In fact, those two classes are the
only two found to have significant differences. When
considering overall branding cities are shown to have a
rate branding usage that exceeds the provincial
average (z = 2.10), while villages implement brand-
ing less often than the provincial average (z =
-2.36). These results, therefore, exceed the signifi-
cance threshold 1.96 at a = 0.05, and therefore reject
Table 2 The influence of municipality type on place branding
Type Yes No Total Rate Z
Overall branding versus municipality typea
City 51 0 51 1.00 2.10*
Town 85 2 87 0.98 1.95
Township 184 24 208 0.88 -1.90
Village 8 3 11 0.73 -2.36*
Generic municipality 53 4 57 0.93 0.27
Total 381 33 414 0.92 –
Logo use versus municipality typeb
City 51 0 51 1.00 2.30*
Town 82 5 87 0.94 1.17
Township 182 26 208 0.88 -1.52
Village 8 3 11 0.73 -2.03*
Generic municipality 52 5 57 0.91 0.17
Total 375 39 414 0.90 –
Slogan use versus municipality typec
City 44 7 51 0.86 2.85*
Town 66 21 87 0.76 1.64
Township 130 78 208 0.63 -1.58
Village 3 8 11 0.27 -2.86*
Generic municipality 37 20 57 0.65 -0.44
Total 280 134 414 0.68 –
a For Chi square: DF = 4; CV = 9.49; v2 = 11.91; H0
rejected; For z-test: q0 = 0.92; a = 0.05; CV = ± 1.96;
* = significant at a = 0.05 (H0 rejected)b For Chi square: DF = 4; CV = 9.49; v2 = 10.2; H0
rejected; For z-test: q0 = 0.90; a = 0.05; CV = ± 1.96;
* = significant at a = 0.05 (H0 rejected)c For Chi square: DF = 4; CV = 9.49; v2 = 13.5; H0
accepted; For z-test: q0 = 0.68; a = 0.05; CV = ± 1.96;
* = significant at a = 0.05 (H0 rejected)
Table 3 The influence of municipality location on place
branding
MIZ Yes No Total Rate Z
Overall branding versus municipality locationa
1 85 0 85 1.00 2.71*
2 13 0 13 1.00 1.06
3 37 1 38 0.97 1.22
4 81 6 87 0.93 0.37
5 112 14 126 0.89 -1.30
6 48 7 55 0.87 -1.30
7 5 5 10 0.50 -4.91*
Total 381 33 414 0.92
Logo use versus municipality locationb
1 85 0 85 1.00 2.97
2 13 0 13 1.00 1.16
3 36 2 38 0.95 0.88
4 80 7 87 0.92 0.44
5 111 15 126 0.88 -0.95
6 45 10 55 0.82 -2.22
7 5 5 10 0.50 -4.39
Total 375 39 414 0.90
Slogan use versus municipality locationc
1 64 21 85 0.75 1.51
2 12 1 13 0.92 1.90
3 30 8 38 0.79 1.49
4 58 29 87 0.67 -0.19
5 73 53 126 0.58 -2.33*
6 39 16 55 0.71 0.52
7 4 6 10 0.40 -1.87
Total 280 134 414 0.68
a For Chi square: DF = 6; CV = 12.59; v2 = 13.5; H0
rejected; For z-test: q0 = 0.92; a = 0.05; CV = ± 1.96;
* = significant at a = 0.05 (H0 rejected)b For Chi square: DF = 6; CV = 12.59; v2 = 17.00; H0
rejected; For z-test: q0 = 0.90; a = 0.05; CV = ± 1.96;
* = significant at a = 0.05 (H0 rejected)c For Chi square: DF = 6; CV = 12.59; v2 = 13.8; H0
accepted; For z-test: q0 = 0.68; a = 0.05; CV = ± 1.96;
* = significant at a = 0.05 (H0 rejected)
GeoJournal
123

the null hypothesis. This pattern also holds true for
logo usage (city z = 2.30; villages z = -2.03;
Table 2). Finally, the same classes are shown to have
a rate that significantly differs from that of all the
municipalities in the province, with cities again
utilizing the brand form more often (z = 2.85) and
villages less often (z = -2.86; see Table 2).
The influence of municipality location on place
branding
Table 3 summarizes the rates of place branding based
on the MIZ location within the province. Again, the
null hypothesis suggested that the location of the
municipality does not influence the rate of branding.
The results of Table 3, however, show that there is a
trend of decreased overall brand and logo usage as the
municipalities became more peripheral. Every com-
munity rated in MIZ categories 1 and 2 employed a
logo, and as a result, an overall brand. The usage rate
for logos and overall brands then decreased in each
subsequent MIZ category (from 97 % in category 3 to
50 % in category 7). In both cases, the branding rate in
category 7 was considerably lower than the others; as
between categories 1 and 6, no overall or logo usage
rate fell below 82 %.
The usage rates of slogans, however, were more
sporadic across the MIZs; though a very general
downward trend was identified as the rate of integra-
tion with primary urban centres decreased. The urban
core represented in MIZ category 1 was found to use
slogans three-quarters of the time, while municipali-
ties in category 2 were observed to have slogans 92 %
of the time. This decreased to 58 % in category 5.
Interestingly, there was a slight increase to 71 % in
category 6, once communities no longer had any
integration with core areas.
In the Chi square tests, the null hypothesis was
rejected for all three relationships between location
and place branding, signifying the existence of a
relationship between variables. For overall branding,
it was the communities in the core (MIZ category 1)
and the extreme periphery (MIZ category 7) that
deviated significantly from the provincial average,
while the middle categories did not vary enough to
present a significant differentiation. As expected, the
core communities exceeded the provincial standard
(z = 2.71), while the peripheral communities failed to
reach it (z = -4.91). The same pattern was observed
in logo usage, with the core out-pacing the rest of the
province (z = 2.97) and the peripheral regions lag-
ging behind (MIZ category 6: z = -2.22; category 7:
z = -4.39). Finally, slogans were noted to have a
sporadic distribution across the seven MIZ classes,
and as a result only category 5 deviated from the mean
with any level of significance, as branding was more
infrequent compared to other municipalities (z =
-2.32).
The impact of municipality tier
The null hypothesis for municipal tier predicts that the
independent variables would not have influence on the
rate of place branding. Table 4 outlines the results of
the Chi square comparing branding usage rates in
single and lower-tier municipalities. In all brand
forms, lower-tier municipalities are observed to utilize
branding more frequently than single-tier municipal-
ities. This trend holds significance in overall branding
rates and logo usage rates, where the null hypothesis
was rejected. In these instances, the Chi squared
analysis found independence between the variables,
indicating that whether the municipality is associated
with an upper-tier government has influence on
Table 4 The influence of municipality tier on place branding
Tier Yes No Total Rate
Overall branding versus municipality tiera
Lower 234 7 241 0.97
Single 147 26 173 0.85
Total 381 33 414 0.92
Logo use versus municipality tierb
Lower 231 10 241 0.96
Single 144 29 173 0.83
Total 375 39 414 0.90
Slogan use versus municipality tierc
Lower 164 77 241 0.68
Single 116 57 173 0.67
Total 280 134 414 0.68
a For Chi square: DF = 4; CV = 3.81; v2 = 20.18; H0
rejectedb For Chi square: DF = 4; CV = 3.81; v2 = 18.78; H0
rejectedc For Chi square: DF = 4; CV = 3.81; v2 = 0.05; H0
accepted
GeoJournal
123
whether branding is used, with more frequent usage
observed when the relationship exists.
Discussion and lingering issues of place branding
in Ontario
From this investigation, it is clear that place branding
is a strategy that municipalities in Ontario are
adopting. It is not, however, a ubiquitous process with
delivery method varying across municipalities. 273
communities use both a logo and a slogan, while 101
municipalities had a logo but no slogan, and addition-
ally only six had a slogan but no logo. The ultimate
goal of these delivery methods is to promote a positive
sense of place for the municipality. In the case of
economic development, the sense of place needs to be
designed to stimulate interest and connection with
their target audience. Consider the slogans used by
municipalities that resonate in several sectors for
economic development, as they imply a certain
characteristic about the city and its desired areas of
growth. Several slogans provide a specific intent, such
as Barrie’s ‘Canada’s most investment ready city’ or
Markham’s ‘Canada’s high-tech capital’ suggest
explicit goals for the city’s development. As the new
economy has grown in stature within the province,
several communities have developed brands that
reflect this, focusing on talent attraction. Kingston
implies both a historic and a modern connection within
its brand (‘where history and innovation thrive’),
while Collingwood draws on elements of new urban-
ism to promote a positive lifestyle (‘A place to live,
work, and place’). Similarly, Wollaston (‘Live natu-
rally, Play naturally’), contextualizes the positives
lifestyle elements—important for engaging and
attracting talent and service workers within a more
general tourism brand. Brampton is more subtle in its
approach, though its ‘B…More; B…Extraordinary’
campaign that highlights the creative elements
through the discovery of the city’s ‘Guggenheim’ or
creative and innovative core.1 Tourism is a common
message with brands, as municipalities in the province
that have adopted tourism include: Belleville (‘On the
Bay of Quinte’) and Brockville (‘City of the Thousand
Islands’) that attach themselves to local natural
features; or Coleman (‘Over 2 billion square feet of
opportunity’), Dryden (‘Welcome to the wilderness
city’), and Kawartha Lakes (‘Catch the Kawartha
Spirit’) that taps into the exploration, discovery, and
relaxation available in their cities. The implication
within all of these brand messages is that it creates a
central point in which the sense of place can be built
around, further developed nuanced, and used to attract
attention and investment from a desired audience.
Regardless of its delivery method, it is clear that
place branding is widely adopted within the province.
There are several potential explanations for the use of
logos and slogans to promote a brand. First, the nature
of place identities is changing. Neoliberal approaches
have led to a decentralisation of political power, the
increased emphasis on the municipalities as the
functional unit for development, and ultimately a
thinning of regional identities (Reese 2010; Terlouw
2012). As a result, the entrenched institutional
emphasis on the municipalities has shifted the respon-
sibility of identity development and promotion to
these local tiers of government. At the municipality
level, therefore, efforts need to be made to actively
promote themselves and participate in the global
market. In this context, the logo and slogan becomes
an important tool to communicate the brand and create
a foray into the market, and to attract the attention of
the consumers.
Further reason for place branding development
over the past two decades can be found in the political
structure and restructuring that has occurred in the
province. In response to the stresses of changing
global and local economies and the downloading of
responsibilities from the province to the local level,
Ontario underwent a series of amalgamations of the
1980s and 1990s, reducing the number of single and
lower-tier municipalities from 815 to the 414 that
currently exist (Sancton 2000). As municipalities
merged, thought was needed in how best to represent
these new, emerging municipalities; in essence forcing
new local governments to consider how best to brand
and promote themselves. A second structural issue is
the upper and lower tiers of municipal governments
that exist within the province. As noted in the results,
the lower-tier of government uses place branding more
1 Though Brampton has traditionally used the ‘Flower City’
slogan, through direct inquiry it is now understood that the
‘B…more’ economic development brand is being phased in as
the new primary brand for the city, and will be replacing the
‘Flower City’ brand as it is phased out over the next 3 years.
Though not a true city brand yet, its inclusion reflects the
direction being taken by a primary urban centre in Ontario.
GeoJournal
123
often than the stand-alone single-tiers (Table 4). This
suggests that lower-tier communities are making the
conscious effort to establish an identity that is separate
from their associated upper-tier government. This
suggests that there is emphasis by municipalities to
ensure that they remain distinct from other, external
bodies.
A third potential explanation is that municipalities
are adopting strategies that they observe in others.
Sands and Reese (2008) argue that municipalities tend
to utilize ideas that have been implemented with
positive results in other locales, even ones external to
the region. Additionally, Arku (2014) demonstrates
that in Ontario there is formal and informal passing of
ideas between practitioners. This suggests that there is
a continual interchange of ideas, and provides an
explanation as to why branding has proliferated:
municipalities are viewing what strategies their local
and global competitors are using, and adopt the
approaches that appear to be the most promising.
A fourth potential explanation for the rapid rate of
recent and ongoing branding initiatives in the province
involves the availability of funding opportunities for
brand development provided by the Government of
Ontario. Rural municipalities (for example, Brighton
and Port Hope) have access to the Rural Economic
Development (RED) Program through the Ontario
Ministry of Agriculture, Food and Rural Affairs
(OMAFRA), in which branding is one of the three
priority areas of development (OMAFRA 2013).
Offering between $CAN 4.5 million and $CAN 15
million per year, the RED program covers between 50
and 90 % cent of project costs, providing strong
incentive for municipalities to undergo a branding
exercise (OMAFRA 2013). With provincial funding
and support, a climate that prioritizes branding in
Ontario has been fostered, and further explains its
recent emphasis as a development technique within
the provinces’ municipalities.
Finally, the development of a brand and its
communication through a matching logo and slogan
may be heavily utilized by municipalities as it
provides an approach that is the least costly to
implement. Giovanardi (2012) suggests that a brand
can be communicated by representational means (i.e.
logos and slogans) or functionalism (i.e. infrastructure
and local economic capacity). The former presents an
option to communicate the attributes of the munici-
palities to a large audience, while expending fewer
resources than undertaking infrastructural improve-
ments. Together, the representationalism can draw
attention to the municipalities, while the functional
element can further enhance the locale’s desirability.
As municipalities expend large amounts of resources
to modernize, it makes sense that some funds may be
utilized to develop a corresponding sense of place that
captures the contemporary locale.
While branding is widespread in Ontario, it is clear
that the process is not standardized among municipal-
ities. It can be deduced that a logo is considered a more
favourable approach of communicating elements of an
identity and to differentiate themselves. Images and
symbols are capable of helping to create a strong sense
of place, and therefore are an important tool in
communicating information and connecting with a
desired audience. Additionally, variation in the use of
logos or slogans is observed, indicating there are
municipality characteristics that influence whether a
branding is being used.
Furthermore, there are some classes of municipality
that are not projecting a brand through a logo or slogan
as frequently as others. In general, smaller communi-
ties—mainly townships and villages—that have weak
integration into the urban core are lagging behind the
rest of the province. This may be due to a lack of
financial resources or people within the municipalities
to develop and maintain its brand. Additionally,
Bergqvist (2009) notes, distance challenged regions,
in this case municipalities on the geographical and
economic periphery of the province need to develop
logistical and infrastructure capabilities in order to
support existing business and to attract new business.
The development of logistics capabilities, however, is
not sufficient, and place marketing is becoming an
essential tool for attracting new business. If these
small townships fall too far behind the rest of the
province, they risk economic stagnation. A role of the
provincial government moving forward, therefore,
could be to incentivize these municipalities into
adopting branding and promotional strategies. An
additional strategy could be to initiate formalized
cooperation between municipalities. This is already
occurring in some sectors of economic development
(see Arku 2014; Arku and Oosterbaan 2014), and
provides an avenue to help reduce the costs associated
with branding. By developing municipal partnerships,
an economy of scale is developed, and financial
burden on each individual jurisdiction is reduced.
GeoJournal
123
It is, therefore, vital that politicians and practitio-
ners within municipalities understand their brand, how
it is communicated, and how they are viewed by
potential visitors, investors, customers, and future
citizens around the world. Municipalities that are not
adequately promoting themselves face the problem of
losing relevance in the global marketplace. This is
particularly important in the internet era, where
municipal information is regularly accessible through
a few keystrokes. As such, it is incumbent on
municipal leaders and practitioners to have a well-
developed point of initial contact through a visual
identity that successfully communicates the virtues of
the locale. As previously noted, the RED Program
provides opportunity for funding as these municipal-
ities continue to develop.
It should be understood, however, that the devel-
opment of logos and slogans on their own do not
constitute a brand for municipalities (Kavaratzis
2009). These are meant to be distillations of the
values, goals, and realities of each municipality
(Khirfan and Momani 2013), and therefore simply
developing a logo or slogan for the sake of doing so
can be a frivolous expense of resources in a time of
tightening budgets. It is necessary that the municipal-
ities that wish to undertake the development and
communication of a brand understand that it has to be
representative of the current economic, social, and
political climates; and that visual tools to promote the
brand need to reflect this local identity. The develop-
ment of a brand requires the expense of public funds,
taken from the taxpayer, and therefore care needs to be
taken to ensure that the branding and it communication
ensures responsible public spending. This is particu-
larly true in Ontario where there is a movement
towards public–private partnership for economic
development. Eshuis and Edwards (2013) and Klijn
et al. (2012) argue that the process of branding a
municipality must be a democratic one, and that public
participation is important to developing and articulat-
ing an accurate local identity that can effectively draw
attention to the municipality. Indeed, a lack of public
backing can undermine any positive messages being
communicated. It is important, therefore, that local
governments balance the issue of private sector
participation in economic development to ensure that
the strongest brand is developed and promoted.
Conclusions
Past trends in economic development are extremely
hard to change, as is evident in efforts of some smaller
cities to change their economic base from traditional
to the current ‘new’ economy (Sands 2010). As
municipalities in Ontario face the issues of an
increasingly globalized market place, there has been
increased emphasis on identifying methods of recruit-
ing business, investment, and talent. This study
demonstrated that place branding at a municipal level
is an approach to economic development that is being
adopted extensively in Ontario. There are, however,
some general classes of municipalities that are falling
behind the rest of the province in their promotional
abilities, and therefore risk becoming less prominent
in the global market. Additionally, there are several
challenges associated with branding, including the
expenditure of public funds, the democratic legitimacy
of the process, and the already heavy use of brands. If
every municipality has a logo or slogan, it becomes
increasingly difficult to be unique amongst a homog-
enizing global landscape. The brand, therefore, needs
to extend beyond the logo and slogan to fully tap into
the local advantages and sense of place that a
municipality has to offer. In this regard, future
research will need to examine the branding processes
and outcomes that underpin the usage of logos and
slogans. As branding becomes more widely accepted
as an approach to development, its local value will
increase in importance rather than decrease, as it will
be incumbent on municipalities to show that they are
unique.
Acknowledgments This research was conducted with financial
support from the Social Sciences and Humanities Research
Council of Canada (SSHRC). The authors would also like to thank
the anonymous reviewers for their helpful suggestions.
References
Agresti, A. (2013). Categorical data analysis (3rd ed.). Wiley:
Hoboken.
Allen, G. (2007). Place branding: New tools for economic
development. Design Management Review, 18(Spring),
60–69.
Anholt, S. (2006). The Anholt-GMI City Brands Index: How the
world sees the world’s cities. Place Branding, 2(1), 18–31.
GeoJournal
123
Arku, G. (2013). Outsourcing functions to economic develop-
ment corporations: Exploring the perceptions of officials in
Ontario. Public Organization Review, 14(1), 49–70.
Arku, G. (2014). Competition and cooperation in economic
development: Examining the perceptions of city officials in
Ontario, Canada. Journal of Urban Affairs, 36(1), 99–118.
Arku, G., & Oosterbaan, C. (2014). Evidence of inter-territorial
collaborative economic development strategies in Ontario,
Canada. Geojournal. doi:10.1007/s10708-013-9517-7.
Barke, M. (1999). City marketing as a planning tool. In M.
Pacione (Ed.), Applied geography: Principles and prac-
tice. London: Routledge.
Bergqvist, R. (2009). Place marketing in a logistics context: A
Swedish case study and discourse. Place Branding and
Public Diplomacy, 5(1), 54–66.
Blakely, E. J., & Green Leigh, N. (2010). Planning local eco-
nomic development: Theory and practice (4th ed.).
Washington: Sage.
Brenner, N., & Theodore, N. (2002). Cities and the geographies
of actually existing neoliberalism. In N. Brenner & N.
Theodore (Eds.), Spaces of neoliberalism: Urban restruc-
turing in North America and Western Europe (pp. 2–32).
Oxford, UK: Blackwell.
Du Plessis, V., Beshiri, R., Bollman, R. D., & Clemenson, H.
(2002). Definitions of ‘Rural’. Statistics Canada: Agricul-
ture and rural working paper series working paper no. 61,
pp. 1–43.
Eshuis, J., & Edwards, A. (2013). Branding the City: The
democratic legitimacy of a new mode of governance.
Urban Studies, 50(5), 1066–1082.
Florek, M., Insch, A., & Gnoth, J. (2008). The trademark protec-
tion of country brands: Insights from New Zealand. Journal
of Place Management and Development, 1(3), 292–306.
Florida, R. (2012). Rise of the creative class revisited: 10th
anniversary edition. New York: Basic Books.
Gertler, M. S. (1990). Economic development. In R. A. Loreto &
T. Price (Eds.), Urban policy issues: Canadian perspec-
tives (pp. 33–57). Toronto: McClelland and Stewart.
Gertler, M.S. et al. (2002). Competing on creativity: Placing
Ontario’s cities in North American context. Toronto, ON:
A report prepared for the Ontario Ministry of Enterprise,
Opportunity and Innovation and the Institute for Compet-
itiveness and Prosperity.
Giovanardi, M. (2012). Haft and sord factors in place branding:
Between functionalism and representationalism. Place
Branding and Public Diplomacy, 8(1), 30–45.
Government of Ontario. (1990). Municipal Act, 1990: S.O.
1990, Chapter 25. Toronto, ON: Government of Ontario.
Government of Ontario. (2001). Municipal Act, 2001: S.O.
2001, Chapter 25. Toronto, ON: Government of Ontario.
Grant, J. L., & Buckwold, B. (2013). Precarious creativity:
immigrant cultural workers. Cambridge Journal of
Regions, Economy, and Society, 6(1), 113–126.
Greenberg, M. A. (2008). Branding New York: How a city in
crisis was sold to the world. London: Routledge.
Hannigan, J. (2003). Symposium on branding, the entertainment
economy and urban place building: Introduction. Interna-
tional Journal of Urban and Regional Research, 27(2),
352–360.
Hansen, R. H. (2010). The narrative nature of place branding.
Place Branding and Public Diplomacy, 6(4), 268–279.
Harvey, D. (1989). From managerialism to entrepreneurialism:
The transformation in urban governance in late capitalism.
Geografiska Annaler. Series B, Human Geography, 71(1),
3–17.
Harvey, D. (2007). Neoliberalism as creative destruction. The
Annals of the American Academy of Political and Social
Science, 610(1), 22–44.
Harvey, J., & Young, R. (2012). Image-building in CanadianMunicipalities. Kingston: McGill-Queen’s University
Press.
Hubbard, P., & Hall, T. (1998). The entrepreneurial city and the
new urban politics. In T. Hall & P. Hubbard (Eds.), The
entrepreneurial city: Geographies of politics, regime and
representation. Chichester: Wiley.
Johansson, M. (2012). Place branding and the imaginary: The
politics of re-imagining a garden city. Urban Studies,
49(16), 3611–3626.
Kavaratzis, M. (2005). Place branding: A review of trends and
conceptual models. The Marketing Review, 5(4), 329–342.
Kavaratzis, M. (2009). Cities and their brands: Lessons from
corporate branding. Place Branding and Public Diplo-
macy, 5(1), 26–37.
Keil, R. (2002). ‘‘Common-Sense’’ neoliberalism: Progressive
conservative urbanism in Toronto, Canada. Antipode,
34(3), 452–472.
Ketter, E., & Avraham, E. (2012). The social revolution of place
marketing: The growing power of users in social media
campaigns. Place Branding and Public Diplomacy, 8(4),
285–294.
Khirfan, L., & Momani, B. (2013). (Re) branding Amman: A
‘lived’ city’s values, image and identity. Place Branding
and Public Diplomacy, 9(1), 49–65.
Klijn, E. H., Eshuis, J., & Braun, E. (2012). The influence of
stakeholder involvement on the effectiveness of place
branding. Public Management Review, 14(4), 499–519.
Kotler, P., & Andreasen, A. (1993). Designing the places image.
In P. Kotler, et al. (Eds.), Marketing places: Attracting
investment, industry, and tourism to cities, states, and
nations. New York: The Free Press.
Leslie, D., & Rantisi, N. M. (2006). Governing the design
economy in Montreal, Canada. Urban Affairs Review,
41(3), 309–337.
Ontario Ministry of Agriculture, Food and Rural Affairs. (2013).
Rural Economic Development Program. Toronto, ON.
Ontario Ministry of Finance. (2012). Ontario economic
accounts: Third Quarter of 2012. Toronto, ON
Ontario Ministry of Municipal Affairs and Housing. (2014). List
of municipalities. Toronto, ON.
Papadopoulos, N. (2004). Place branding: Evolution, meaning
and implications. Place Branding, 1(1), 36–49.
Pasquinelli, C. (2010). The limits of place branding for local
development: The case of tuscany and the Arnovalley
Brand. Local Economy, 25(7), 558–572.
Pasquinelli, C. (2013). Competition, cooperation and co-opeti-
tion: Unfolding the process of inter-territorial branding.
Urban Research and Practice, 6(1), 1–18.
Rantisi, N. M., & Leslie, D. (2006). Branding the design met-
ropole: The case of Montreal, Canada. Area, 38(4),
364–376.
Reese, L. A. (2010). The state of Canadian cities: Theoretical
and applied themes. GeoJournal, 75(6), 509–516.
GeoJournal
123
Reese, L. A., & Sands, G. (2007). Making the least of our dif-
ferences? Trends in local economic development in
Ontario and Michigan, 1990–2005. Canadian Public
Administration, 50(1), 77–99.
Sancton, A. (2000). Amalgamations, service realignment, and
property taxes: Did the Harris government have a plan for
Ontario’s municipalities? Canadian Journal of Regional
Science, 23(1), 135–156.
Sands, G. (2010). Prosperity and the New Economy in Canada’s
major city regions. GeoJournal, 75(6), 539–552.
Sands, G., & Reese, L. A. (2008). Cultivating the creative class:
And what about Nanaimo? Economic Development
Quarterly, 22(1), 8–23.
Scott, A. J. (2007). Capitalism and urbanization in a new key?
The cognitive-cultural dimension. Social Forces, 85(4),
1465–1482.
Statistics Canada. (2012). 2011 Economic indicators, by prov-
ince and territory. Retrieved on February 5, 2013 from:
http://www.statcan.gc.ca/tables-tableaux/sum-som/l01/
cst01/indi02g-eng.htm.
Stern, P., & Hall, P. (2010). Historical limits: Narrowing pos-
sibilities in ‘Ontario’s most historic town’. The Canadian
Geographer, 54(2), 209–227.
Tassonyi, A. (2005). Local economic development: Theory and
the Ontario experience. ITP Paper, 0511, 1–21.
Terlouw, K. (2012). From thick to thin regional identities?
GeoJournal, 77(5), 707–721.
Tuan, Y. F. (1971). Geography, phenomenology, and the study
of human nature. Canadian Geographer, 15(3), 181–192.
Tuan, Y. F. (1976). Humanistic geography. Annals of the
Association of American Geographers, 66(2), 266–276.
Urry, J. (1995). Consuming places. London: Routledge.
Vinodrai, T. (2010). The dynamics of economic change in
Canadian cities: Innovation, culture, and the emergence of
a knowledge-based economy. In Bunting, T., Filion., P., &
Walker, R. (Eds.). Canadian cities in transition: New
directions in the twenty-first century (pp. 87–109). Oxford:
Oxford University Press.
Wolfe, D. A., & Gertler, M.S. (2001). Globalization and eco-
nomic restructuring in Ontario: From industrial heartland
to learning region? European Planning Studies, 9(5),
575–592.
GeoJournal
123