Embed Size (px)
Citation preview
1 • 144
PKPK––NCA, PK based Design, Biostatistics (Part I/II)NCA, PK based Design, Biostatistics (Part I/II)
Moscow, 23 May 2012
Helmut SchützBEBAC
Helmut SchützBEBAC
Wik
imed
iaW
ikim
edia
Com
mon
s C
omm
ons
••20
06
2006
Sch
wal
lex
Sch
wal
lex
••C
reat
ive
Com
mon
s A
ttrib
utio
nC
reat
ive
Com
mon
s A
ttrib
utio
n --S
hare
Alik
eS
hare
Alik
e3.
0 3.
0 U
npor
ted
Unp
orte
d
PK–NCA, PK based Design, Biostatistics
Part I
PKPK––NCA, PK based NCA, PK based Design, BiostatisticsDesign, Biostatistics
Part IPart I

2 • 144
PKPK––NCA, PK based Design, Biostatistics (Part I/II)NCA, PK based Design, Biostatistics (Part I/II)
Moscow, 23 May 2012
To bear in Remembrance...To bear in Remembrance...
Whenever a theory appears to youWhenever a theory appears to youas the only possible one, take this asas the only possible one, take this asa sign that you have neither undera sign that you have neither under --stood the theory nor the problemstood the theory nor the problemwhich it was intended to solve.which it was intended to solve. Karl R. PopperKarl R. Popper
Even though it’s Even though it’s appliedapplied sciencesciencewe’re dealin’ with, it still is we’re dealin’ with, it still is –– science!science!
Leslie Z. BenetLeslie Z. Benet
3 • 144
PKPK––NCA, PK based Design, Biostatistics (Part I/II)NCA, PK based Design, Biostatistics (Part I/II)
Moscow, 23 May 2012
NCA NCA vs.vs. PK ModelingPK Modeling�Pharmacokinetic models
�Useful for understanding the drug/formulation� Study design of BA/BE, e.g.,
washout, accumulation / saturation to steady state
�Drawbacks� Almost impossible to validate (fine-tuning of side
conditions, weighting schemes, software, …)� Still a mixture of art and science� Impossible to recalculate any given dataset using different
software – sometimes even different versions of the same software!
� Not acceptable for evaluation of BA/BE studies!
4 • 144
PKPK––NCA, PK based Design, Biostatistics (Part I/II)NCA, PK based Design, Biostatistics (Part I/II)
Moscow, 23 May 2012
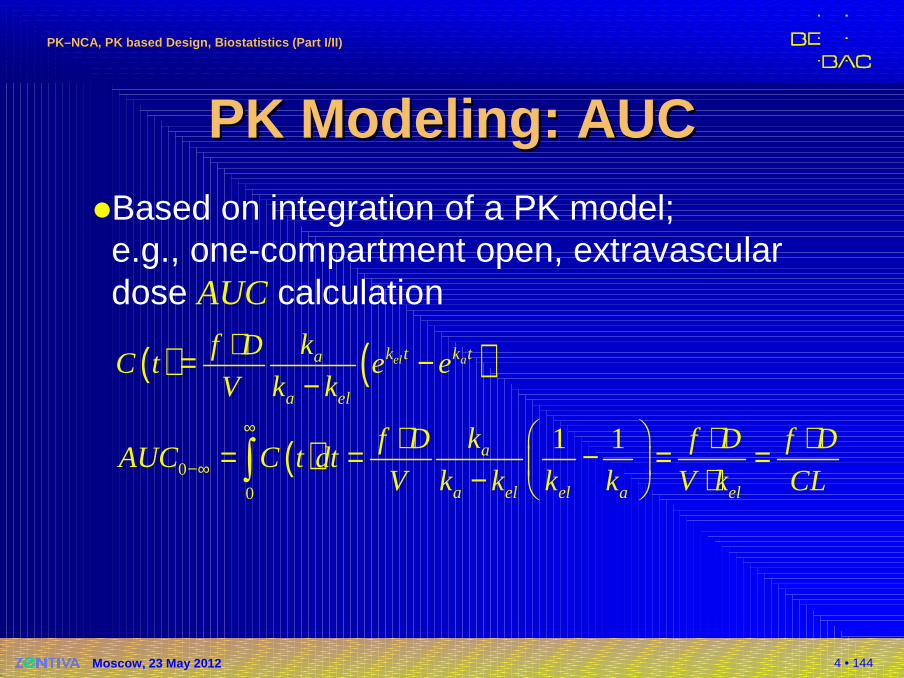
PK Modeling: AUCPK Modeling: AUC�Based on integration of a PK model;e.g., one-compartment open, extravascular dose AUC calculation
( ) ( )
( )0
0
1 1
el ak t k ta
a el
a
a el el a el
kf DC t e e
V k k
kf D f D f DAUC C t dt
V k k k k V k CL
∞
−∞
⋅= −−
⋅ ⋅ ⋅= = − = = − ⋅ ∫
5 • 144
PKPK––NCA, PK based Design, Biostatistics (Part I/II)NCA, PK based Design, Biostatistics (Part I/II)
Moscow, 23 May 2012
NCA: Single DoseNCA: Single Dose�Noncompartmental methods do not rely on a pharmacokinetic (=compartmental) model
�Also called SHAM (Shape, Height, Area, Moments)�Metrics (plasma, single dose)
� Extent of absorption (EU…), total exposure (US):AUC (Area Under the Curve)
� Rate of absorption (EU…), peak exposure (US): Cmax
� tmax (EU…)� Early exposure (US, CAN): AUCtmax; partial AUC truncated
at population (CAN: subject’s) tmax of the reference� Others: Cmin, Fluctuation, MRT, Occupancy time, tlag,…
6 • 144
PKPK––NCA, PK based Design, Biostatistics (Part I/II)NCA, PK based Design, Biostatistics (Part I/II)
Moscow, 23 May 2012
NCA: AUCNCA: AUC�Compartmental models not acceptable in BE,numeric approximation required�Linear trapezoidal rule*)
�Lin-log trapezoidal rule*)
�Lin-up log-down trapezoidal rule
�Cubic splines�Lagrange-polynomials
�Simpson’s rule
*) Stated in Russian GL; only these two acceptable?
7 • 144
PKPK––NCA, PK based Design, Biostatistics (Part I/II)NCA, PK based Design, Biostatistics (Part I/II)
Moscow, 23 May 2012
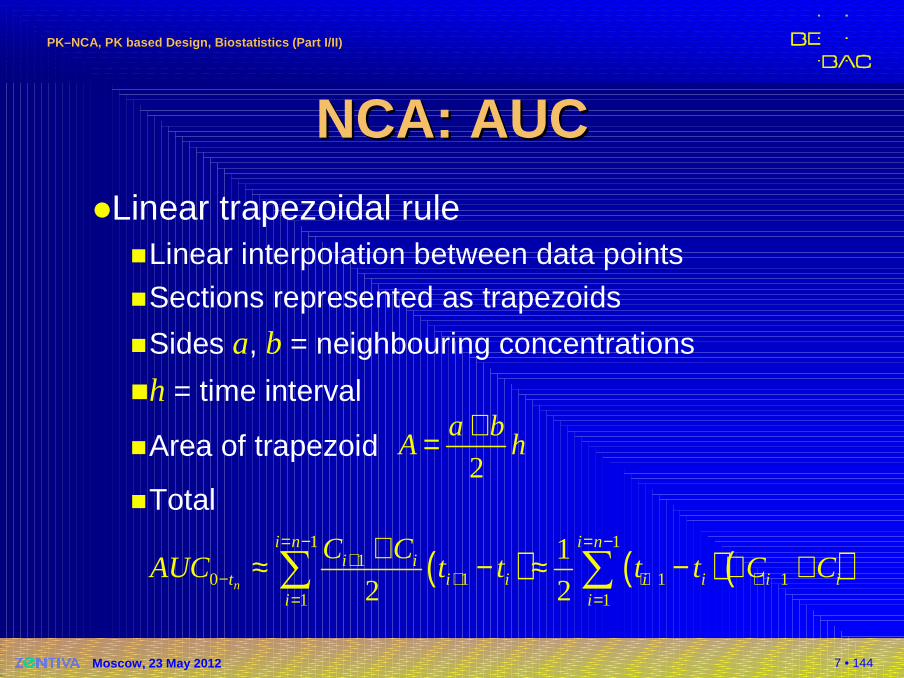
NCA: AUCNCA: AUC�Linear trapezoidal rule
�Linear interpolation between data points
�Sections represented as trapezoids
�Sides a, b = neighbouring concentrations
�h = time interval
�Area of trapezoid
�Total2
a bA h
+=
( ) ( ) ( )1 1
10 1 1 1
1 1
1
2 2n
i n i ni i
t i i i i i ii i
C CAUC t t t t C C
= − = −+
− + + += =
+≈ − ≈ − ⋅ +∑ ∑
8 • 144
PKPK––NCA, PK based Design, Biostatistics (Part I/II)NCA, PK based Design, Biostatistics (Part I/II)
Moscow, 23 May 2012
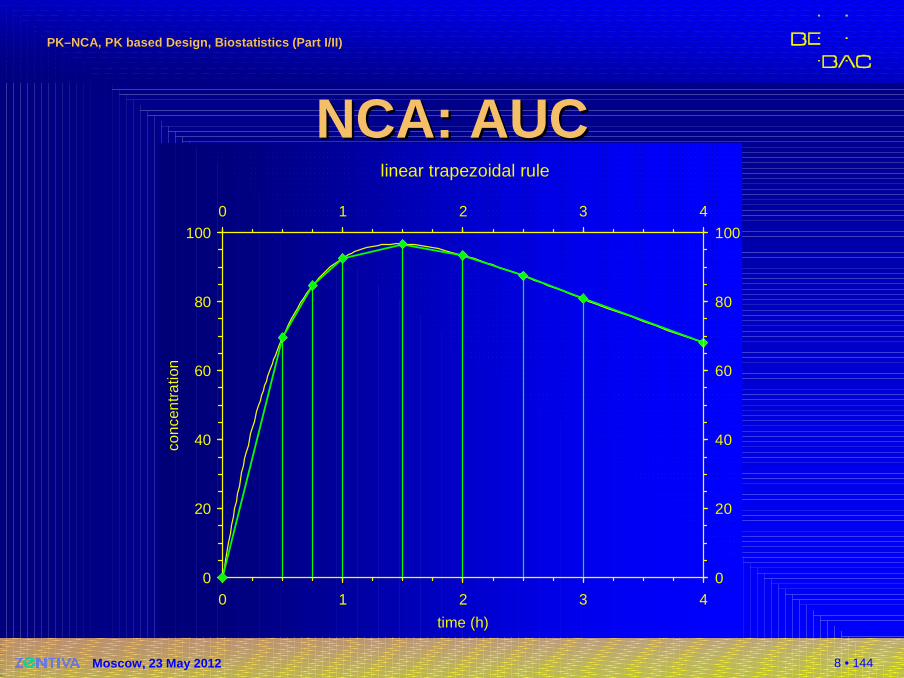
linear trapezoidal rule
0
20
40
60
80
100
0 1 2 3 4
time (h)
conc
entr
atio
n
0
20
40
60
80
1000 1 2 3 4
NCA: AUCNCA: AUC
9 • 144
PKPK––NCA, PK based Design, Biostatistics (Part I/II)NCA, PK based Design, Biostatistics (Part I/II)
Moscow, 23 May 2012
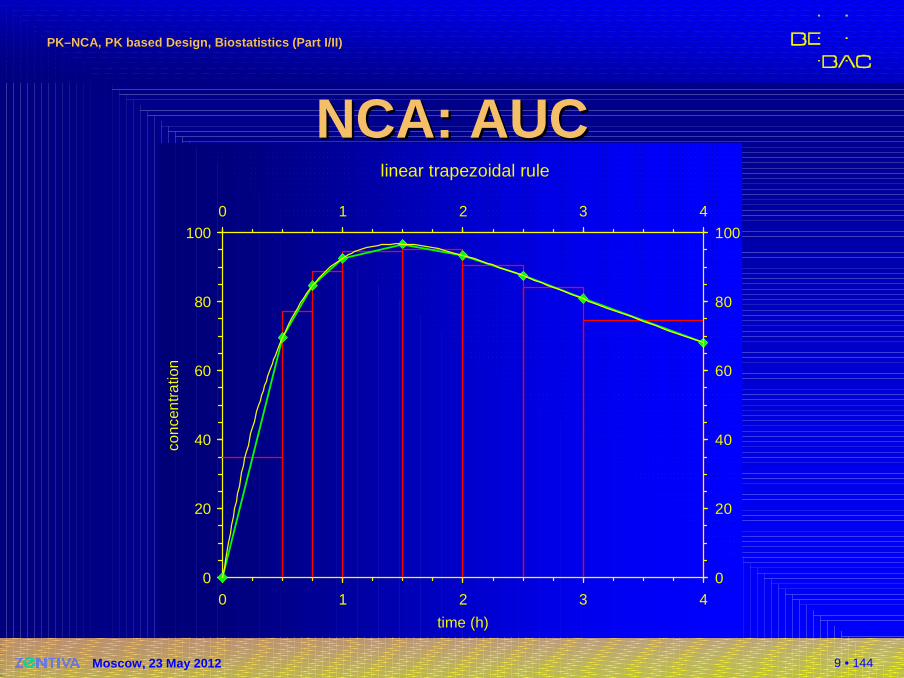
linear trapezoidal rule
0
20
40
60
80
100
0 1 2 3 4
time (h)
conc
entr
atio
n
0
20
40
60
80
1000 1 2 3 4
NCA: AUCNCA: AUC
10 • 144
PKPK––NCA, PK based Design, Biostatistics (Part I/II)NCA, PK based Design, Biostatistics (Part I/II)
Moscow, 23 May 2012
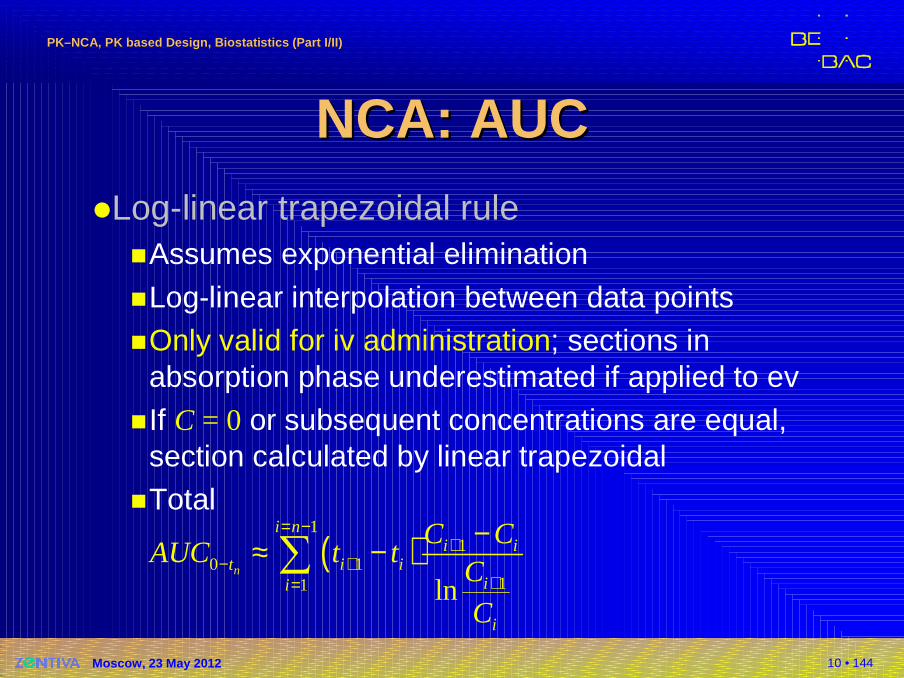
NCA: AUCNCA: AUC�Log-linear trapezoidal rule
�Assumes exponential elimination
�Log-linear interpolation between data points�Only valid for iv administration; sections in
absorption phase underestimated if applied to ev�If C = 0 or subsequent concentrations are equal,
section calculated by linear trapezoidal�Total
( )1
10 1
11 lnn
i ni i
t i iii
i
C CAUC t t
C
C
= −+
− ++=
−≈ −∑
11 • 144
PKPK––NCA, PK based Design, Biostatistics (Part I/II)NCA, PK based Design, Biostatistics (Part I/II)
Moscow, 23 May 2012
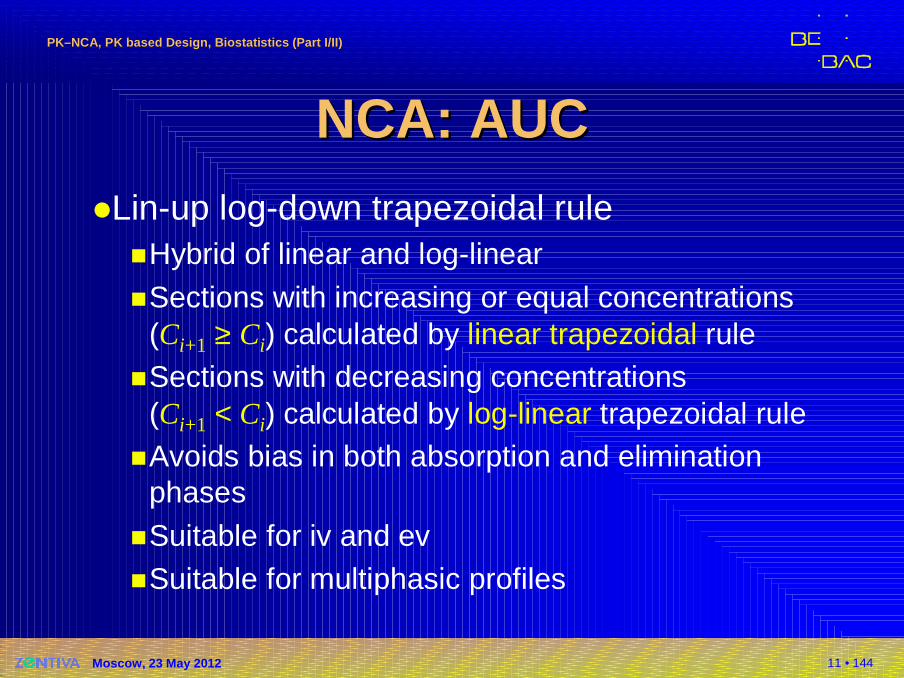
NCA: AUCNCA: AUC�Lin-up log-down trapezoidal rule
�Hybrid of linear and log-linear
�Sections with increasing or equal concentrations(Ci+1 ≥ Ci) calculated by linear trapezoidal rule
�Sections with decreasing concentrations(Ci+1 < Ci) calculated by log-linear trapezoidal rule
�Avoids bias in both absorption and elimination phases
�Suitable for iv and ev�Suitable for multiphasic profiles
12 • 144
PKPK––NCA, PK based Design, Biostatistics (Part I/II)NCA, PK based Design, Biostatistics (Part I/II)
Moscow, 23 May 2012
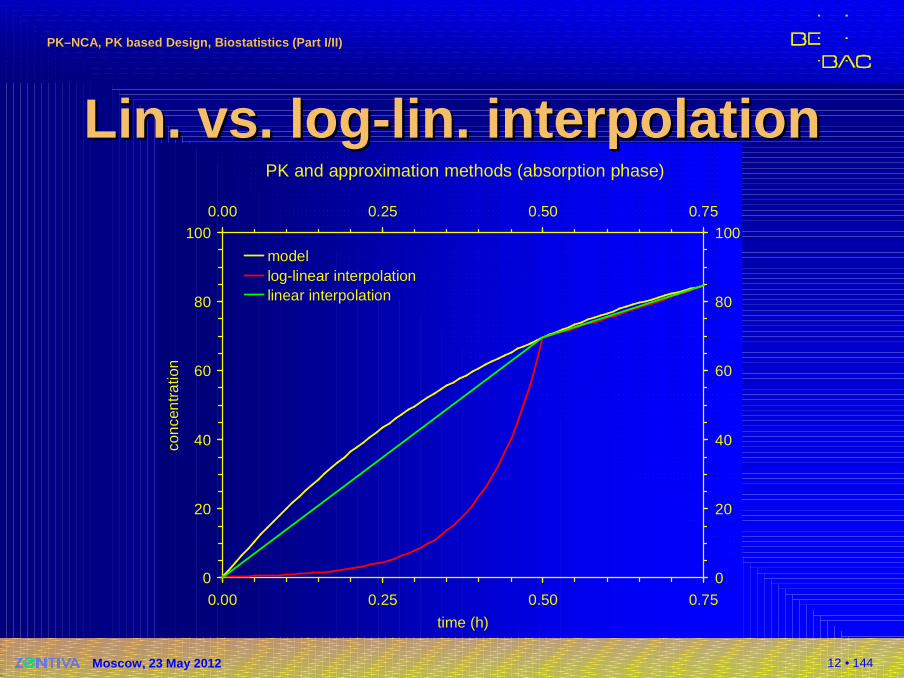
PK and approximation methods (absorption phase)
0
20
40
60
80
100
0.00 0.25 0.50 0.75
time (h)
conc
entr
atio
n
0
20
40
60
80
1000.00 0.25 0.50 0.75
modellog-linear interpolationlinear interpolation
Lin. Lin. vs.vs. loglog --lin. interpolationlin. interpolation
13 • 144
PKPK––NCA, PK based Design, Biostatistics (Part I/II)NCA, PK based Design, Biostatistics (Part I/II)
Moscow, 23 May 2012
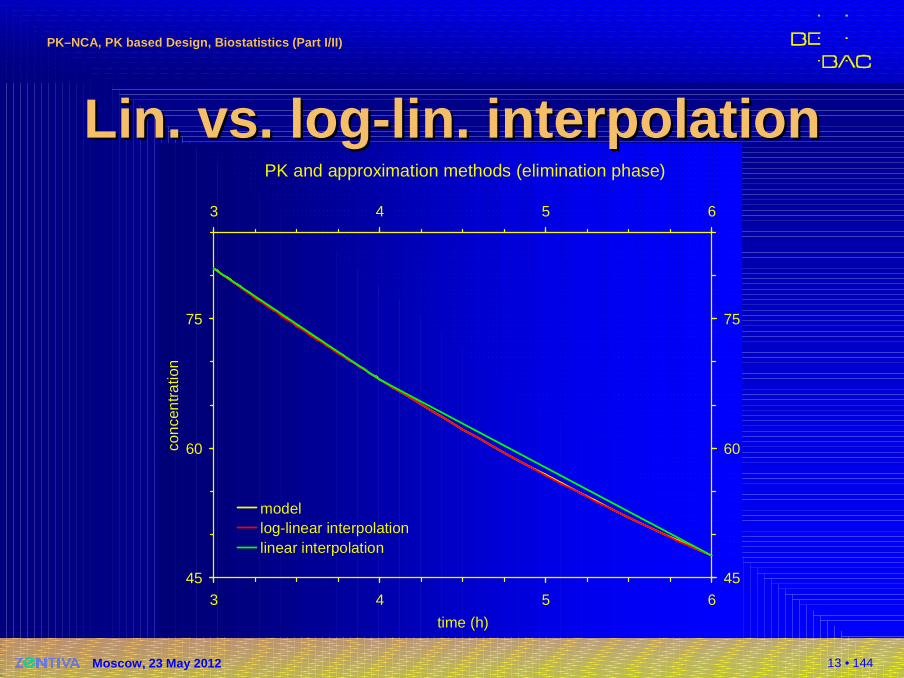
PK and approximation methods (elimination phase)
45
60
75
3 4 5 6
time (h)
conc
entr
atio
n
45
60
75
3 4 5 6
modellog-linear interpolationlinear interpolation
Lin. Lin. vs.vs. loglog --lin. interpolationlin. interpolation
14 • 144
PKPK––NCA, PK based Design, Biostatistics (Part I/II)NCA, PK based Design, Biostatistics (Part I/II)
Moscow, 23 May 2012
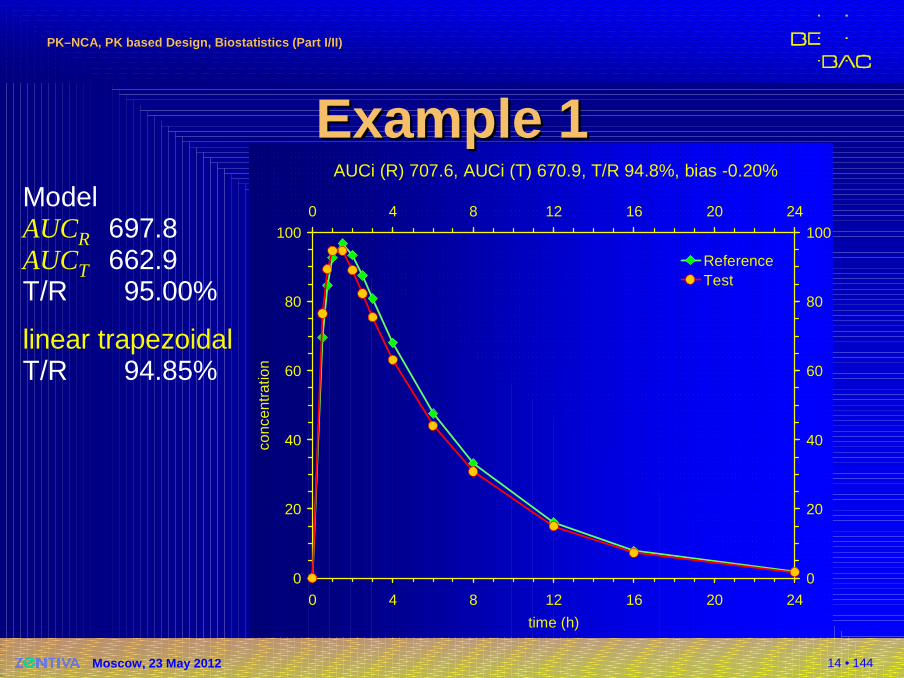
AUCi (R) 707.6, AUCi (T) 670.9, T/R 94.8%, bias -0.20%
0
20
40
60
80
100
0 4 8 12 16 20 24
time (h)
conc
entr
atio
n
0
20
40
60
80
1000 4 8 12 16 20 24
ReferenceTest
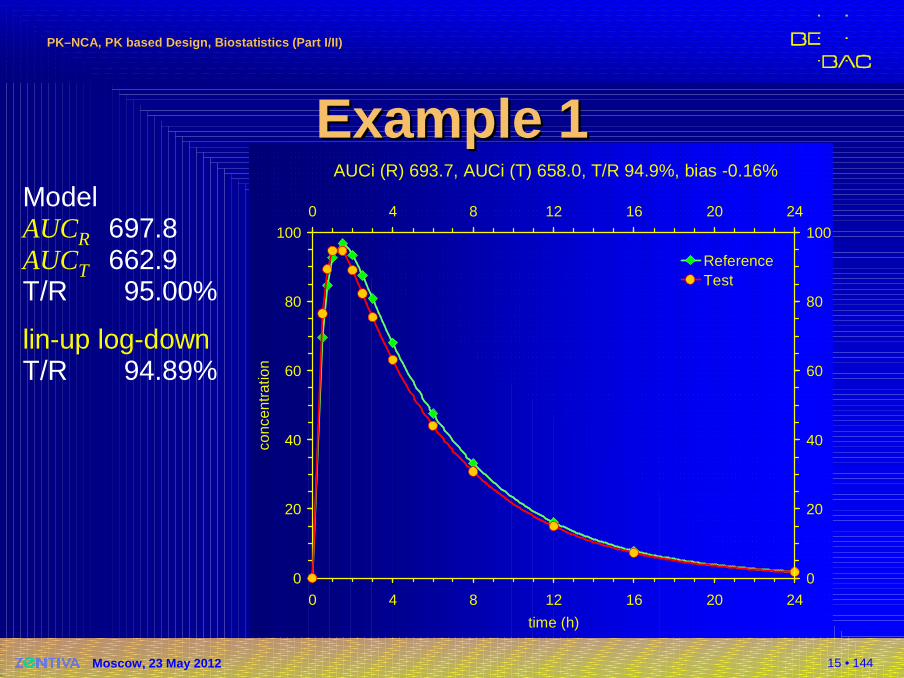
Example 1Example 1ModelAUCR 697.8AUCT 662.9T/R 95.00%
linear trapezoidalT/R 94.85%
15 • 144
PKPK––NCA, PK based Design, Biostatistics (Part I/II)NCA, PK based Design, Biostatistics (Part I/II)
Moscow, 23 May 2012
AUCi (R) 693.7, AUCi (T) 658.0, T/R 94.9%, bias -0.16%
0
20
40
60
80
100
0 4 8 12 16 20 24
time (h)
conc
entr
atio
n
0
20
40
60
80
1000 4 8 12 16 20 24
ReferenceTest
Example 1Example 1ModelAUCR 697.8AUCT 662.9T/R 95.00%
lin-up log-downT/R 94.89%
16 • 144
PKPK––NCA, PK based Design, Biostatistics (Part I/II)NCA, PK based Design, Biostatistics (Part I/II)
Moscow, 23 May 2012
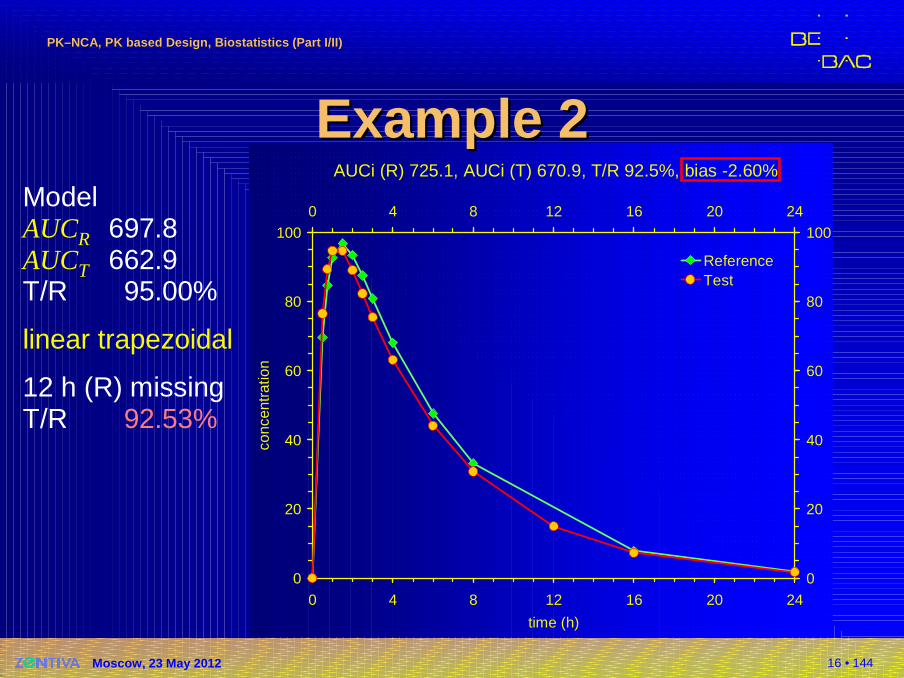
AUCi (R) 725.1, AUCi (T) 670.9, T/R 92.5%, bias -2.60%
0
20
40
60
80
100
0 4 8 12 16 20 24
time (h)
conc
entr
atio
n
0
20
40
60
80
1000 4 8 12 16 20 24
ReferenceTest
Example 2Example 2ModelAUCR 697.8AUCT 662.9T/R 95.00%
linear trapezoidal
12 h (R) missingT/R 92.53%
17 • 144
PKPK––NCA, PK based Design, Biostatistics (Part I/II)NCA, PK based Design, Biostatistics (Part I/II)
Moscow, 23 May 2012
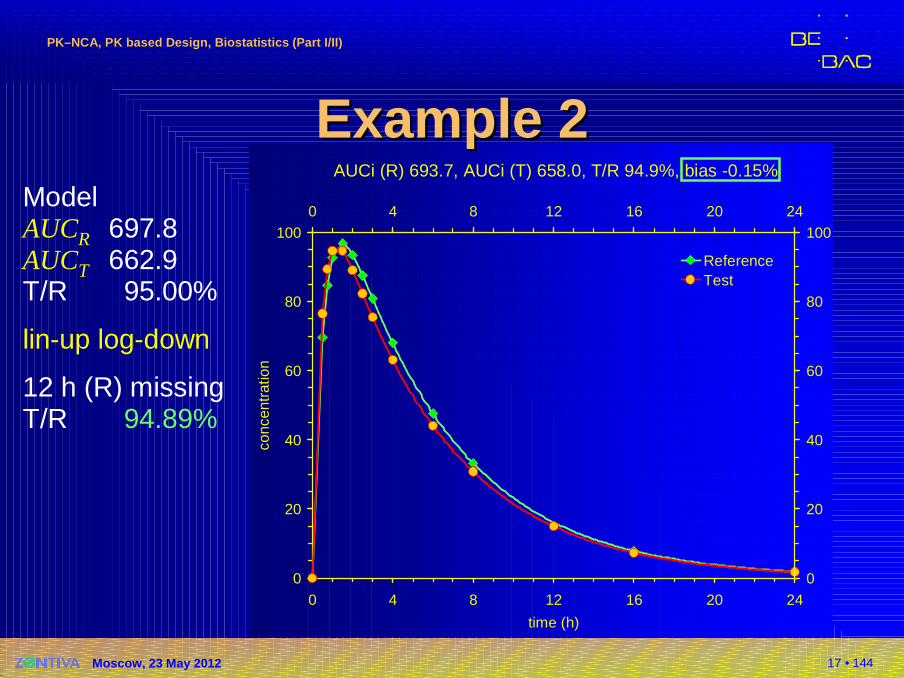
AUCi (R) 693.7, AUCi (T) 658.0, T/R 94.9%, bias -0.15%
0
20
40
60
80
100
0 4 8 12 16 20 24
time (h)
conc
entr
atio
n
0
20
40
60
80
1000 4 8 12 16 20 24
ReferenceTest
Example 2Example 2ModelAUCR 697.8AUCT 662.9T/R 95.00%
lin-up log-down
12 h (R) missingT/R 94.89%
18 • 144
PKPK––NCA, PK based Design, Biostatistics (Part I/II)NCA, PK based Design, Biostatistics (Part I/II)
Moscow, 23 May 2012
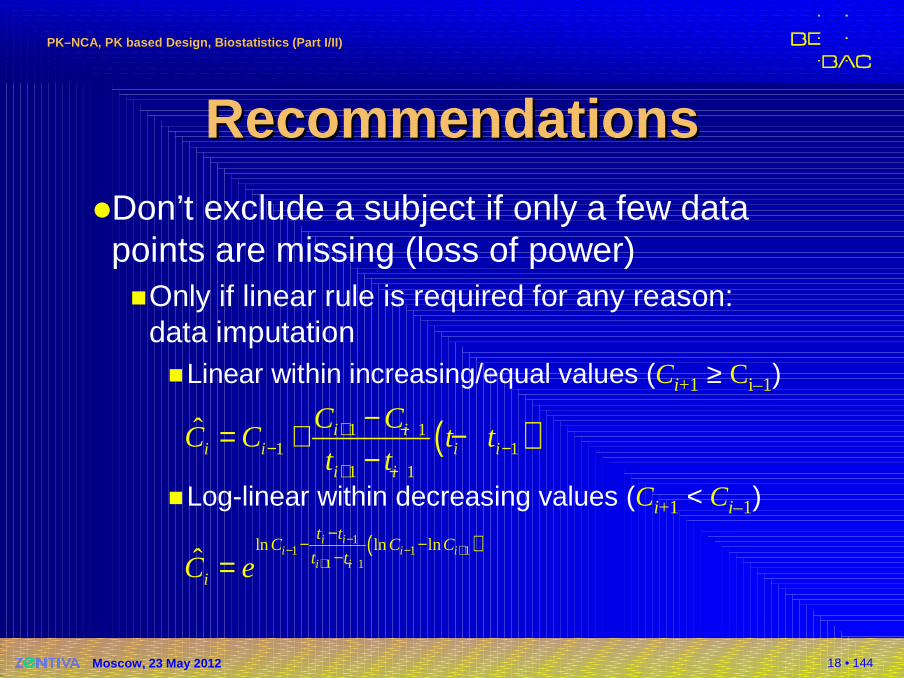
RecommendationsRecommendations�Don’t exclude a subject if only a few data points are missing (loss of power)�Only if linear rule is required for any reason:
data imputation�Linear within increasing/equal values (Ci+1 ≥ Ci–1)
�Log-linear within decreasing values (Ci+1 < Ci–1)
( )1 11 1
1 1
ˆ i ii i i i
i i
C CC C t t
t t+ −
− −+ −
−= + −−
( )11 1 1
1 1
ln ln lnˆ
i ii i i
i i
t tC C C
t tiC e
−− − +
+ −
−− −
−=
19 • 144
PKPK––NCA, PK based Design, Biostatistics (Part I/II)NCA, PK based Design, Biostatistics (Part I/II)
Moscow, 23 May 2012
RecommendationsRecommendations�Don’t exclude a subject … (cont’d)
�Although I had never problems with this procedure in 500+ BE studies (stated in the protocol, accord-ing to SOP, and by validated software) data imputation may be unfamiliar to assessors
�Lin-up log-down trapezoidal ‘automatically’ corrects for missing values and unbiased estimates are obtained
20 • 144
PKPK––NCA, PK based Design, Biostatistics (Part I/II)NCA, PK based Design, Biostatistics (Part I/II)
Moscow, 23 May 2012
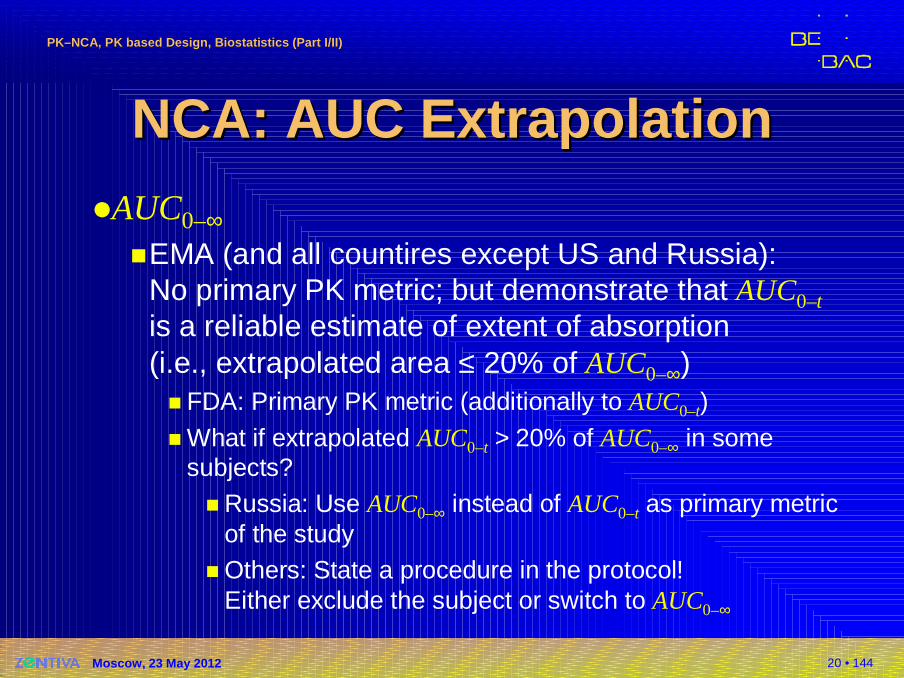
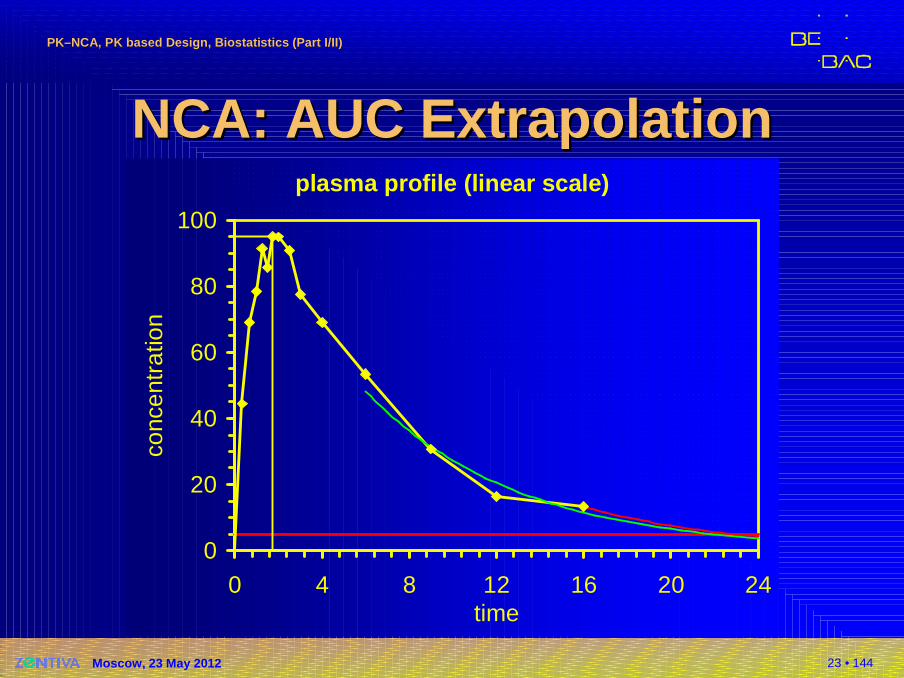
NCA: AUC ExtrapolationNCA: AUC Extrapolation�AUC0–∞
�EMA (and all countires except US and Russia):No primary PK metric; but demonstrate that AUC0–t
is a reliable estimate of extent of absorption(i.e., extrapolated area ≤ 20% of AUC0–∞)� FDA: Primary PK metric (additionally to AUC0–t)� What if extrapolated AUC0–t > 20% of AUC0–∞ in some
subjects?� Russia: Use AUC0–∞ instead of AUC0–t as primary metric
of the study� Others: State a procedure in the protocol!
Either exclude the subject or switch to AUC0–∞
21 • 144
PKPK––NCA, PK based Design, Biostatistics (Part I/II)NCA, PK based Design, Biostatistics (Part I/II)
Moscow, 23 May 2012
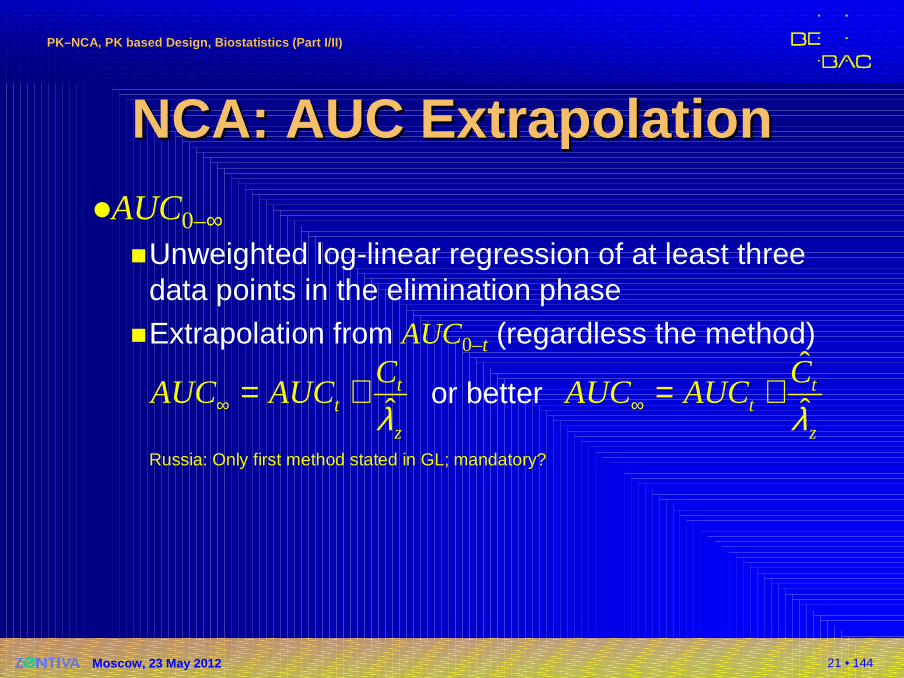
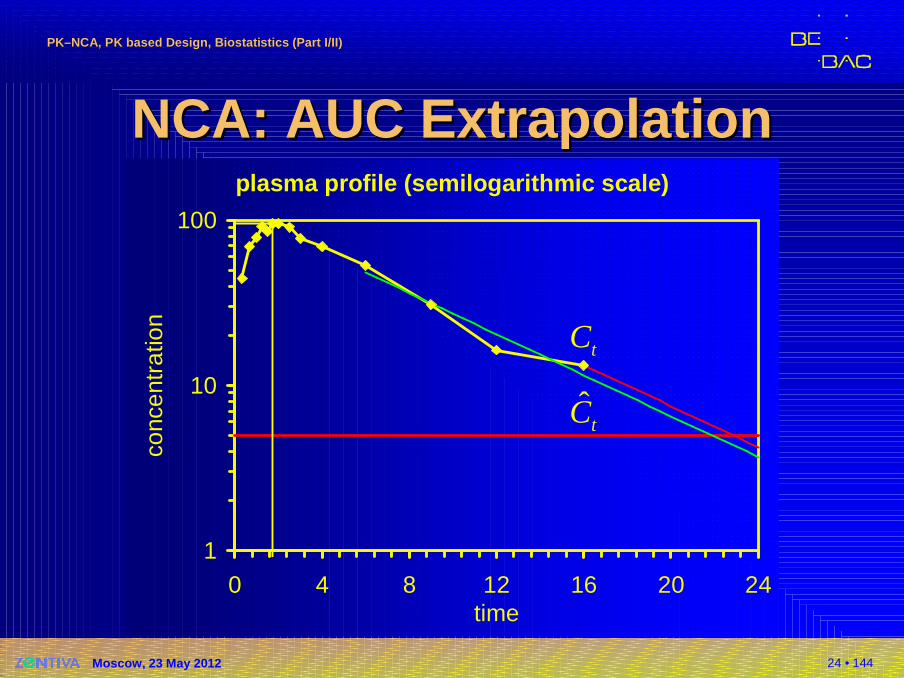
NCA: AUC ExtrapolationNCA: AUC Extrapolation�AUC0–∞
�Unweighted log-linear regression of at least three data points in the elimination phase
�Extrapolation from AUC0–t (regardless the method)
or better
Russia: Only first method stated in GL; mandatory?
ˆt
t
z
CAUC AUC
λ∞ = +ˆ
ˆt
t
z
CAUC AUC
λ∞ = +
22 • 144
PKPK––NCA, PK based Design, Biostatistics (Part I/II)NCA, PK based Design, Biostatistics (Part I/II)
Moscow, 23 May 2012
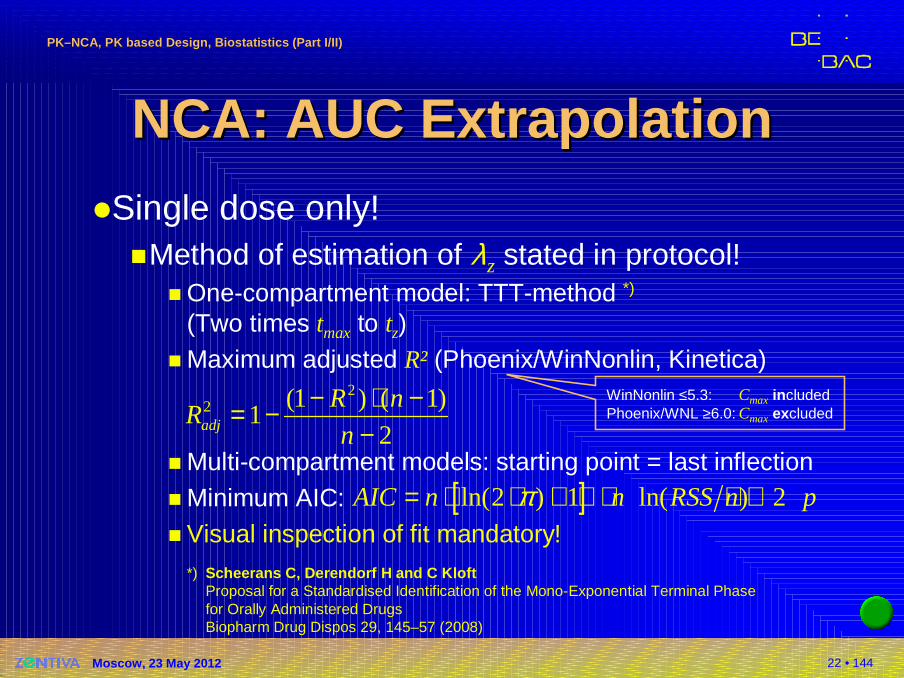
NCA: AUC ExtrapolationNCA: AUC Extrapolation�Single dose only!
�Method of estimation of λz stated in protocol!� One-compartment model: TTT-method *)
(Two times tmax to tz)� Maximum adjusted R² (Phoenix/WinNonlin, Kinetica)
� Multi-compartment models: starting point = last inflection� Minimum AIC:� Visual inspection of fit mandatory!
*) Scheerans C, Derendorf H and C KloftProposal for a Standardised Identification of the Mono-Exponential Terminal Phasefor Orally Administered DrugsBiopharm Drug Dispos 29, 145–57 (2008)
22 (1 ) ( 1)
12adj
R nR
n
− ⋅ −= −−
[ ]ln(2 ) 1 ln( ) 2AIC n n RSS n pπ= ⋅ ⋅ + + ⋅ + ⋅
WinNonlin ≤5.3: Cmax includedPhoenix/WNL ≥6.0: Cmaxexcluded
23 • 144
PKPK––NCA, PK based Design, Biostatistics (Part I/II)NCA, PK based Design, Biostatistics (Part I/II)
Moscow, 23 May 2012
NCA: AUC ExtrapolationNCA: AUC Extrapolationplasma profile (linear scale)
0
20
40
60
80
100
0 4 8 12 16 20 24time
conc
entr
atio
n
24 • 144
PKPK––NCA, PK based Design, Biostatistics (Part I/II)NCA, PK based Design, Biostatistics (Part I/II)
Moscow, 23 May 2012
NCA: AUC ExtrapolationNCA: AUC Extrapolationplasma profile (semilogarithmic scale)
1
10
100
0 4 8 12 16 20 24time
conc
entr
atio
n
tC
ˆtC
25 • 144
PKPK––NCA, PK based Design, Biostatistics (Part I/II)NCA, PK based Design, Biostatistics (Part I/II)
Moscow, 23 May 2012
NCA: oNCA: o therther PK MetricsPK Metrics�Single dose
�Cmax and tmax directly from profile
�Metrics describing the shape of the profile� Early exposure (US, CAN): AUCtmax; partial AUC truncated
at population (CAN: subject’s) tmax of the reference� Biphasic MR formulations: Partial AUCstruncated at
prespecific cut-off time point� FDA: Product specific guidances (methylphenidate,
zolpidem)� EMA: All products
Questions & Answers: positions on specific questions addressed to the pharmacokinetics working partyEMA/618604/2008 Rev. 4 (16 February 2012)http://www.ema.europa.eu/docs/en_GB/document_library/Scientific_guideline/2009/09/WC500002963.pdf
26 • 144
PKPK––NCA, PK based Design, Biostatistics (Part I/II)NCA, PK based Design, Biostatistics (Part I/II)
Moscow, 23 May 2012
NCA: oNCA: o therther PK MetricsPK Metrics�Single dose
�Metrics describing the shape of the profile� Cmax/AUC
� t75% (Plateau time: interval where C(t) ≥ 75% of Cmax)*)
� HVD (Half value duration: time interval where C(t) ≥ 50% of Cmax)
� Occupancy time, t ≥ MIC (time interval where C(t) is above some limiting concentration)
*) Russia: mandatory for sustained release formulations
27 • 144
PKPK––NCA, PK based Design, Biostatistics (Part I/II)NCA, PK based Design, Biostatistics (Part I/II)
Moscow, 23 May 2012
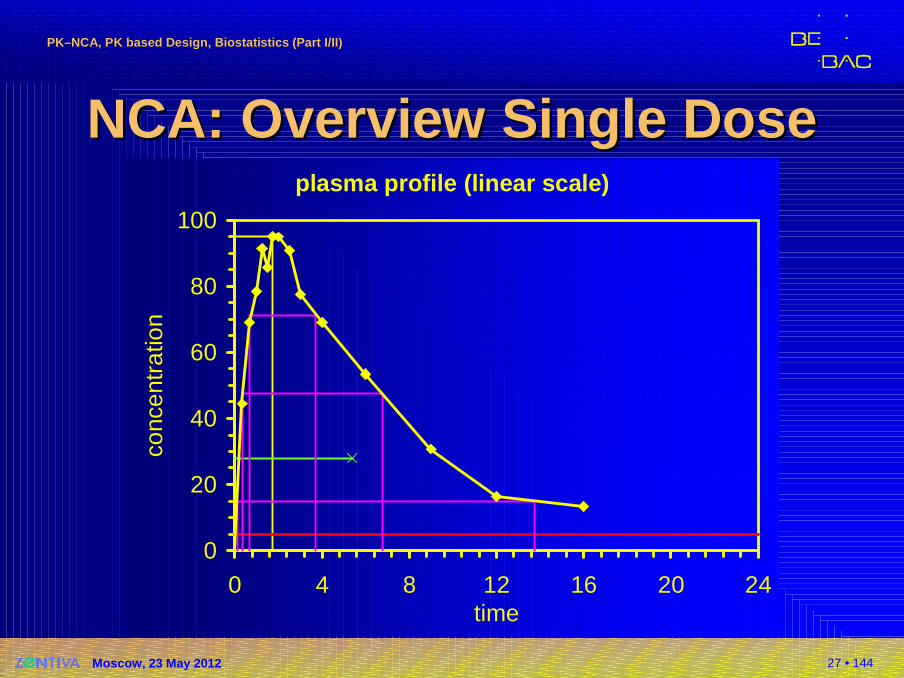
NCA: NCA: Overview Single DoseOverview Single Doseplasma profile (linear scale)
0
20
40
60
80
100
0 4 8 12 16 20 24time
conc
entr
atio
n
28 • 144
PKPK––NCA, PK based Design, Biostatistics (Part I/II)NCA, PK based Design, Biostatistics (Part I/II)
Moscow, 23 May 2012
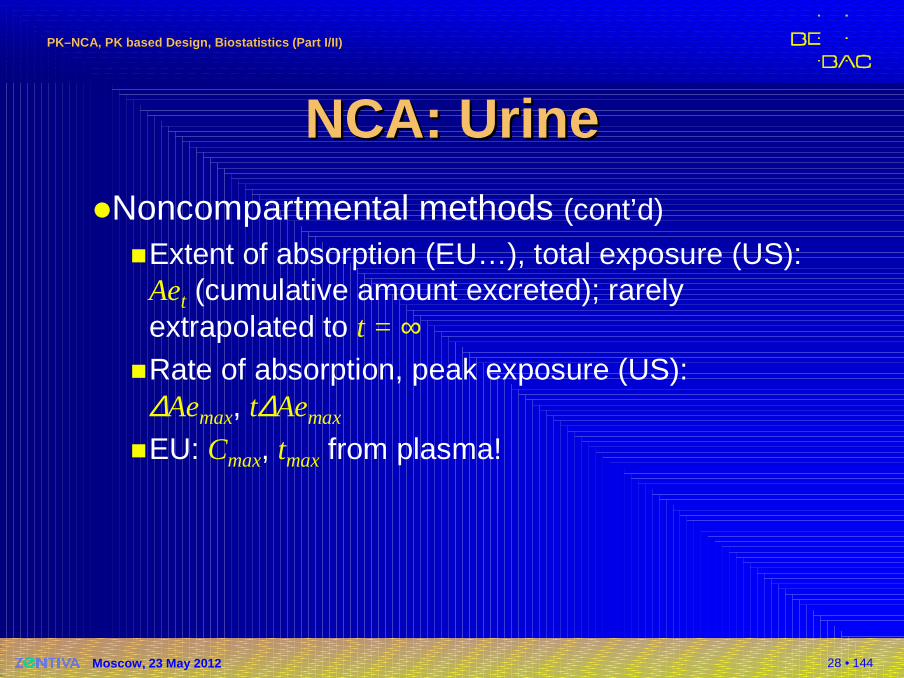
NCA: UrineNCA: Urine�Noncompartmental methods (cont’d)
�Extent of absorption (EU…), total exposure (US):Aet (cumulative amount excreted); rarely extrapolated to t = ∞
�Rate of absorption, peak exposure (US):∆Aemax, t∆Aemax
�EU: Cmax, tmax from plasma!
29 • 144
PKPK––NCA, PK based Design, Biostatistics (Part I/II)NCA, PK based Design, Biostatistics (Part I/II)
Moscow, 23 May 2012
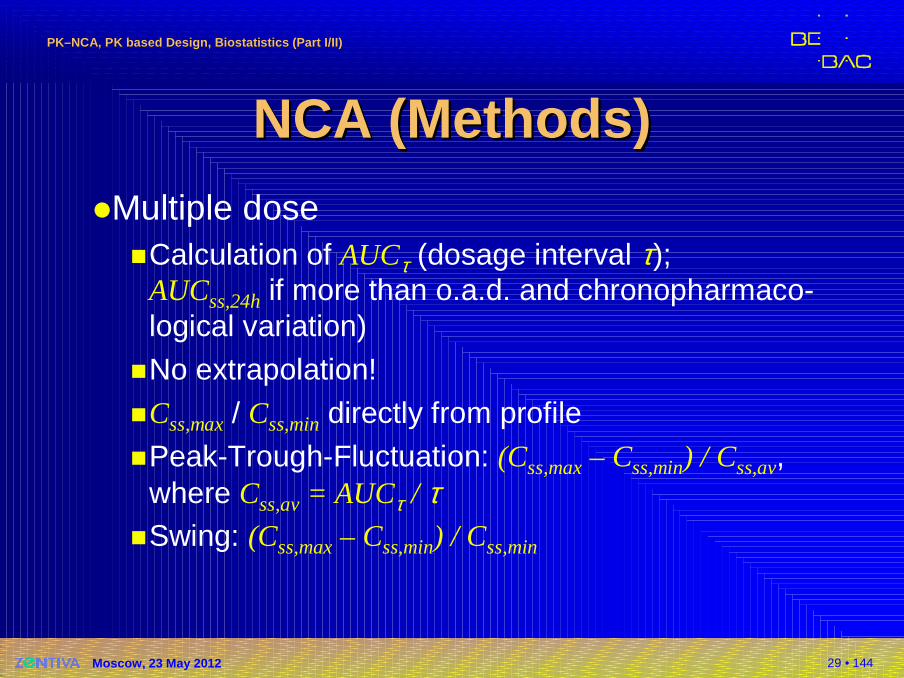
NCA NCA ((MethodsMethods ))�Multiple dose
�Calculation of AUCτ (dosage interval τ);AUCss,24hif more than o.a.d. and chronopharmaco-logical variation)
�No extrapolation!
�Css,max/ Css,mindirectly from profile
�Peak-Trough-Fluctuation: (Css,max– Css,min) / Css,av, where Css,av= AUCτ / τ
�Swing: (Css,max– Css,min) / Css,min
30 • 144
PKPK––NCA, PK based Design, Biostatistics (Part I/II)NCA, PK based Design, Biostatistics (Part I/II)
Moscow, 23 May 2012
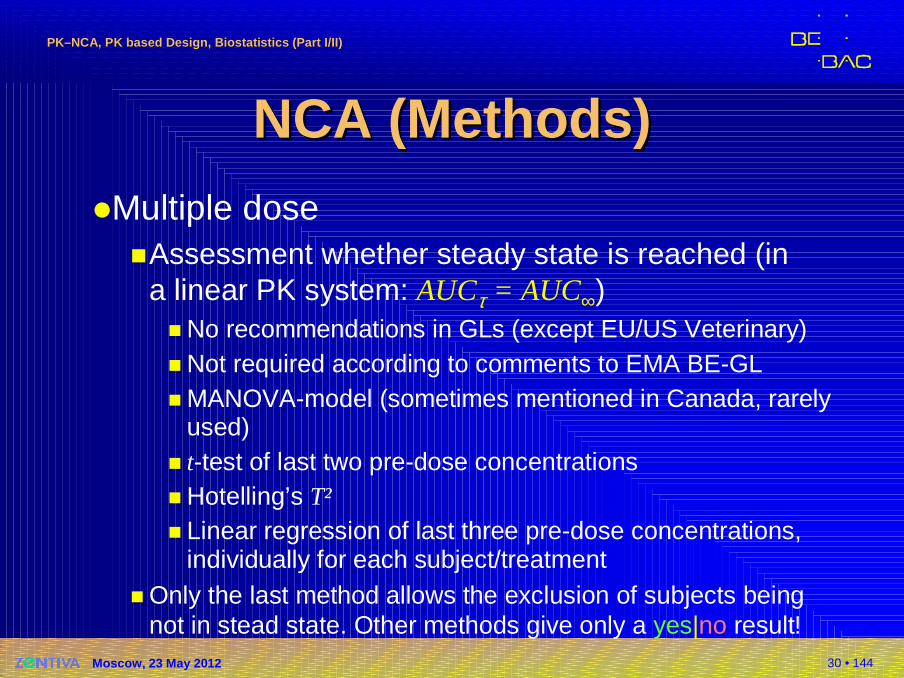
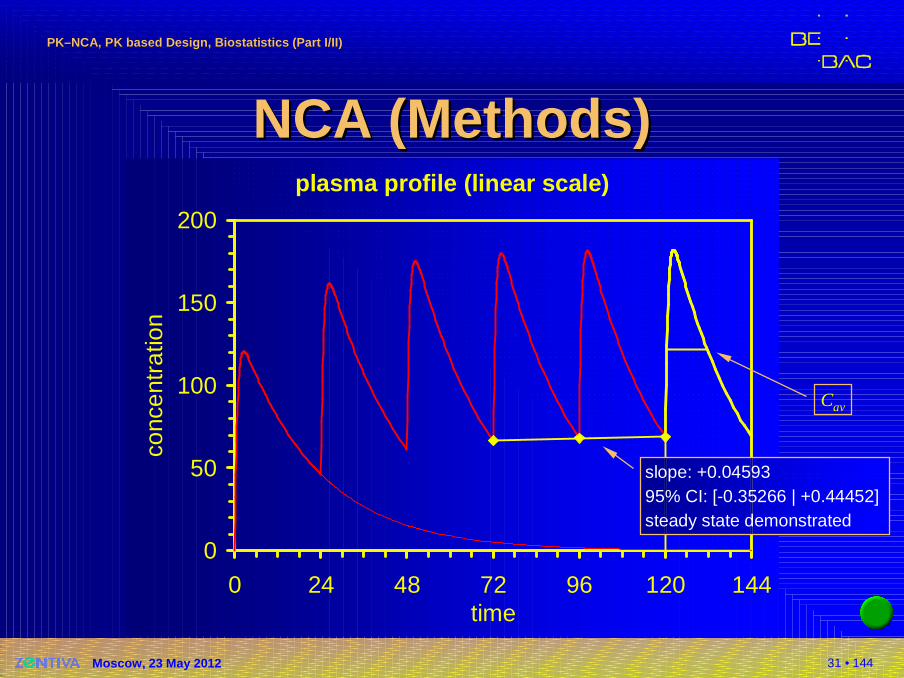
NCA NCA ((MethodsMethods ))�Multiple dose
�Assessment whether steady state is reached (ina linear PK system: AUCτ = AUC∞)� No recommendations in GLs (except EU/US Veterinary)� Not required according to comments to EMA BE-GL� MANOVA-model (sometimes mentioned in Canada, rarely
used)� t-test of last two pre-dose concentrations� Hotelling’s T²� Linear regression of last three pre-dose concentrations,
individually for each subject/treatment� Only the last method allows the exclusion of subjects being
not in stead state. Other methods give only a yes|no result!
31 • 144
PKPK––NCA, PK based Design, Biostatistics (Part I/II)NCA, PK based Design, Biostatistics (Part I/II)
Moscow, 23 May 2012
NCA NCA ((MethodsMethods ))plasma profile (linear scale)
0
50
100
150
200
0 24 48 72 96 120 144time
conc
entr
atio
n
Cav
slope: +0.0459395% CI: [-0.35266 | +0.44452]steady state demonstrated
32 • 144
PKPK––NCA, PK based Design, Biostatistics (Part I/II)NCA, PK based Design, Biostatistics (Part I/II)
Moscow, 23 May 2012
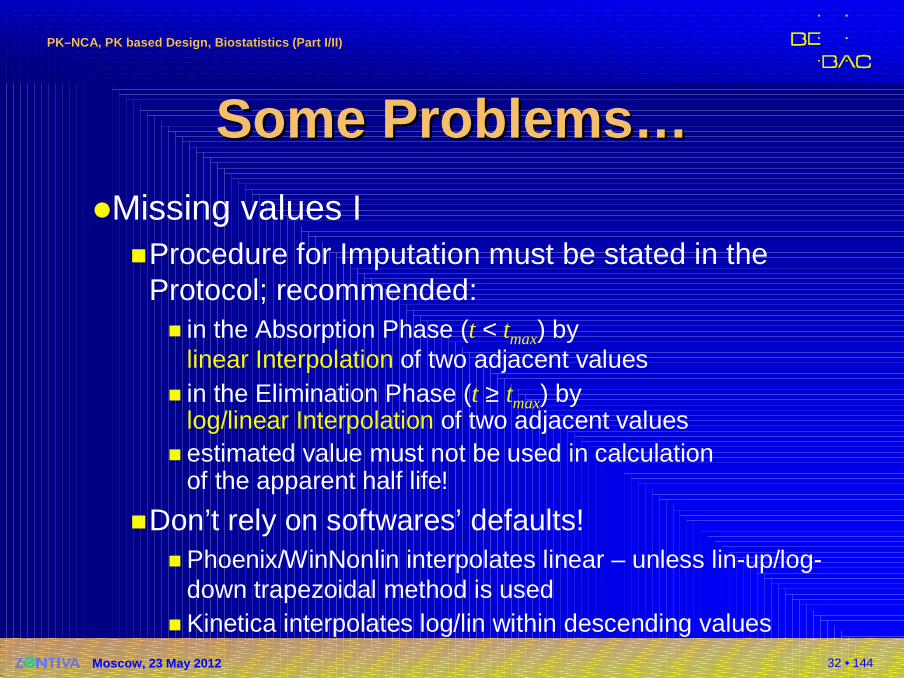
Some Problems…Some Problems…�Missing values I
�Procedure for Imputation must be stated in the Protocol; recommended:� in the Absorption Phase (t < tmax) by
linear Interpolation of two adjacent values� in the Elimination Phase (t ≥ tmax) by
log/linear Interpolation of two adjacent values� estimated value must not be used in calculation
of the apparent half life!
�Don’t rely on softwares’ defaults!� Phoenix/WinNonlin interpolates linear – unless lin-up/log-
down trapezoidal method is used� Kinetica interpolates log/lin within descending values
33 • 144
PKPK––NCA, PK based Design, Biostatistics (Part I/II)NCA, PK based Design, Biostatistics (Part I/II)
Moscow, 23 May 2012
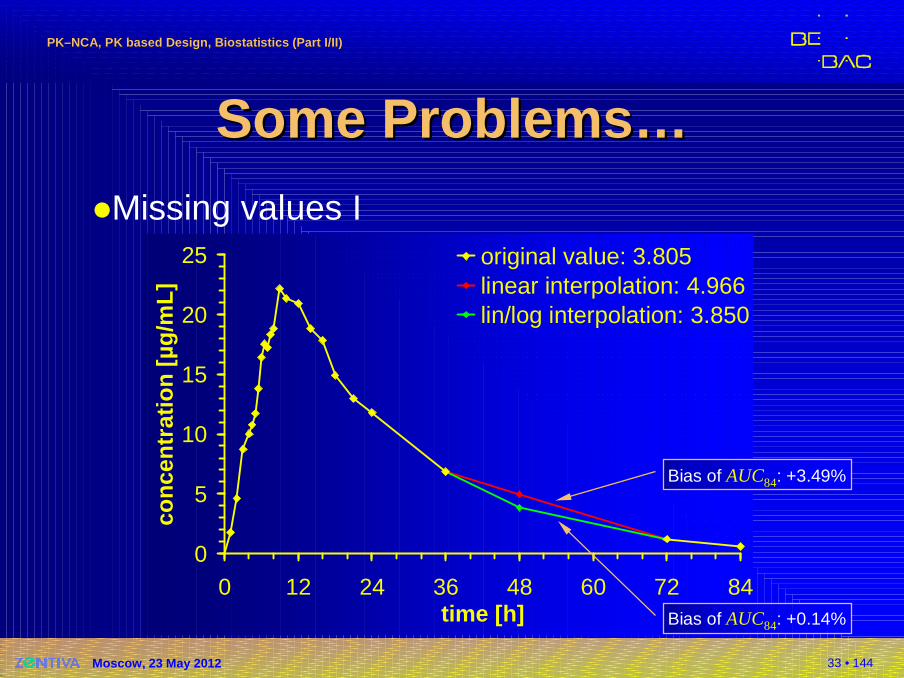
Some Problems…Some Problems…�Missing values I
0
5
10
15
20
25
0 12 24 36 48 60 72 84time [h]
conc
entr
atio
n [µ
g/m
L]
original value: 3.805linear interpolation: 4.966lin/log interpolation: 3.850
Bias of AUC84: +3.49%
Bias of AUC84: +0.14%

34 • 144
PKPK––NCA, PK based Design, Biostatistics (Part I/II)NCA, PK based Design, Biostatistics (Part I/II)
Moscow, 23 May 2012
Some Problems…Some Problems…
0
20
40
60
80
100
0 12 24 36 48 60 72
time
conc
entr
atio
n
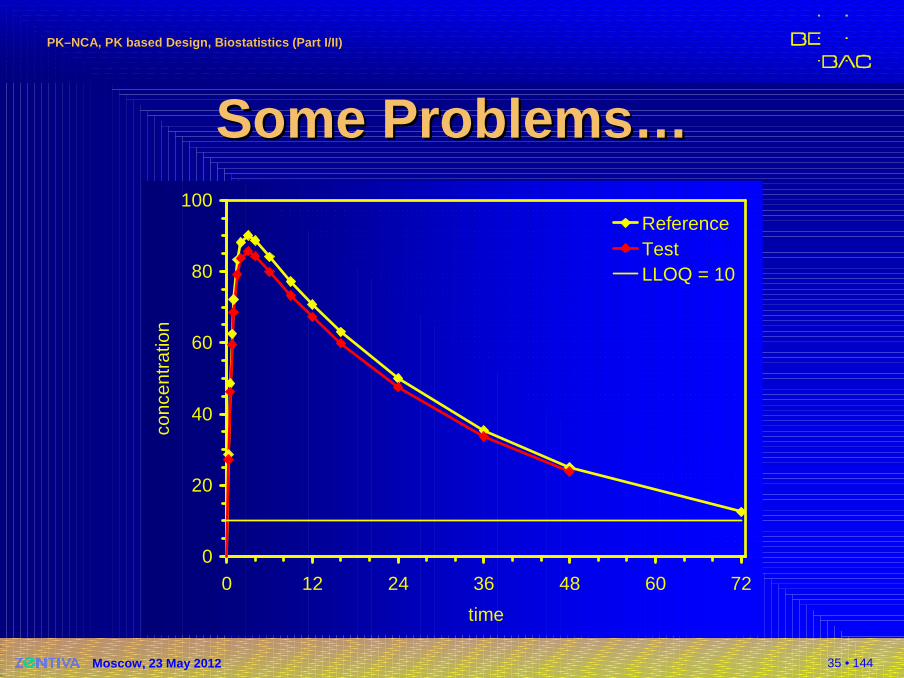
ReferenceTestLLOQ = 10
35 • 144
PKPK––NCA, PK based Design, Biostatistics (Part I/II)NCA, PK based Design, Biostatistics (Part I/II)
Moscow, 23 May 2012
Some Problems…Some Problems…
0
20
40
60
80
100
0 12 24 36 48 60 72
time
conc
entr
atio
n
ReferenceTestLLOQ = 10
36 • 144
PKPK––NCA, PK based Design, Biostatistics (Part I/II)NCA, PK based Design, Biostatistics (Part I/II)
Moscow, 23 May 2012
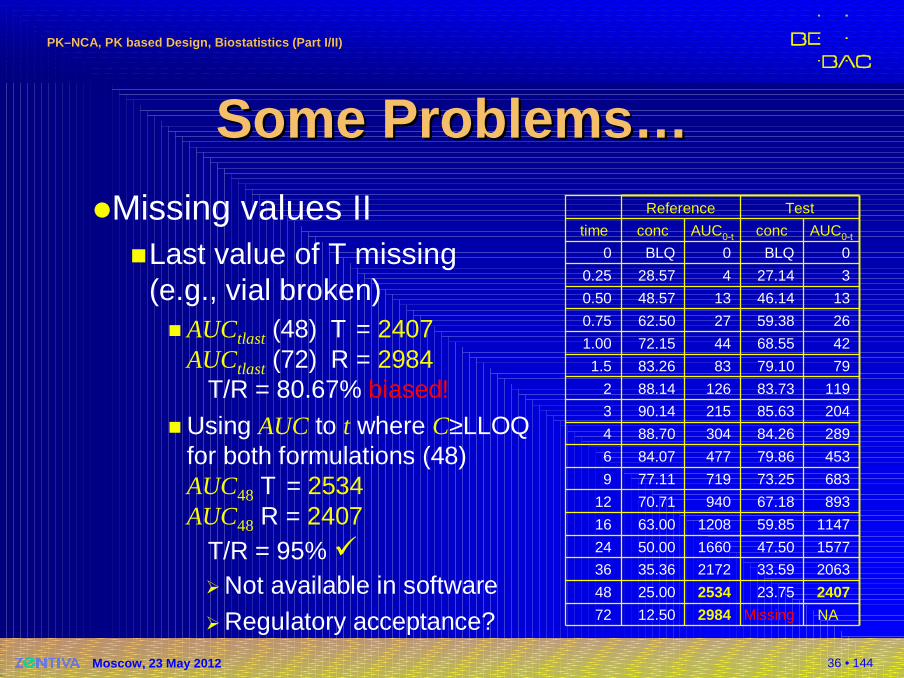
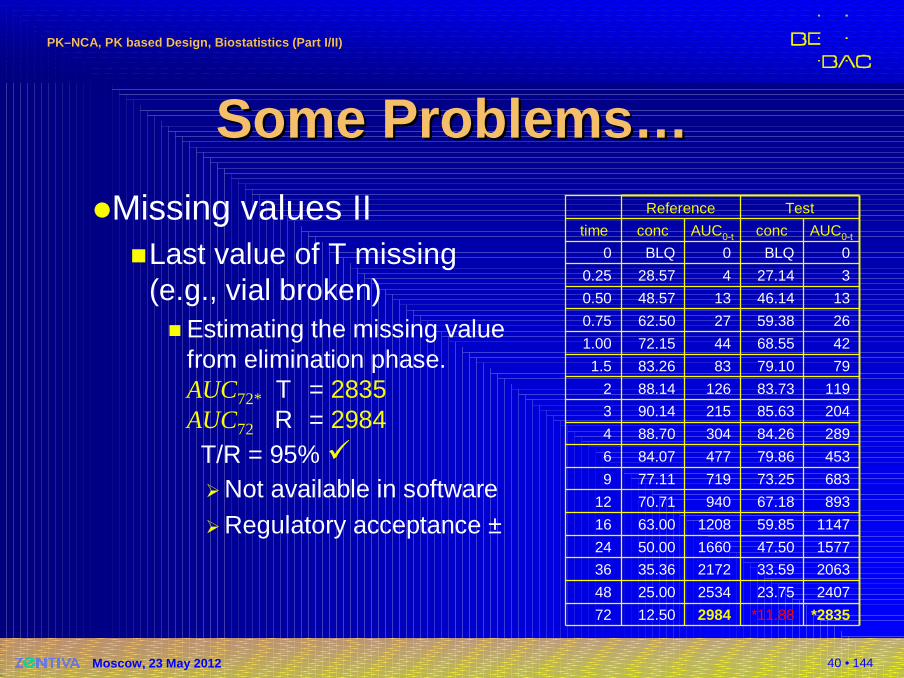
Some Problems…Some Problems…�Missing values II
�Last value of T missing(e.g., vial broken)� AUCtlast (48) T = 2407
AUCtlast (72) R = 2984T/R = 80.67% biased!
� Using AUC to t where C≥LLOQfor both formulations (48)AUC48 T = 2534AUC48 R = 2407
T/R = 95% ��Not available in software�Regulatory acceptance? NAMissing298412.5072
240723.75253425.0048
206333.59217235.3636
157747.50166050.0024
114759.85120863.0016
89367.1894070.7112
68373.2571977.119
45379.8647784.076
28984.2630488.704
20485.6321590.143
11983.7312688.142
7979.108383.261.5
4268.554472.151.00
2659.382762.500.75
1346.141348.570.50
327.14428.570.25
0BLQ0BLQ0
AUC0-tconcAUC0-tconctime
TestReference
37 • 144
PKPK––NCA, PK based Design, Biostatistics (Part I/II)NCA, PK based Design, Biostatistics (Part I/II)
Moscow, 23 May 2012
Some Problems…Some Problems…
0
20
40
60
80
100
0 12 24 36 48 60 72
time
conc
entr
atio
n
ReferenceTestLLOQ = 10
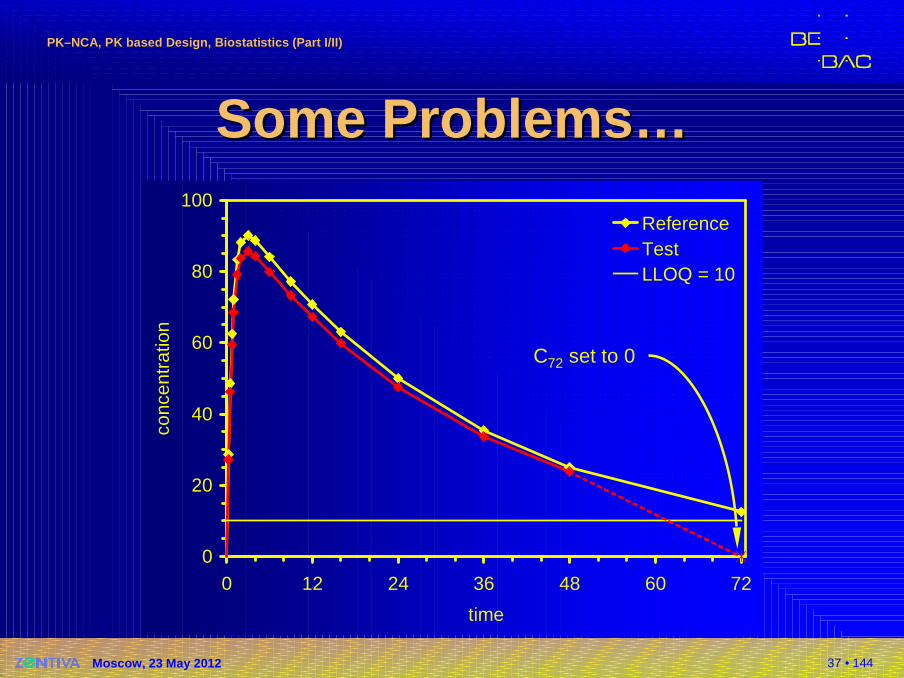
C72 set to 0
38 • 144
PKPK––NCA, PK based Design, Biostatistics (Part I/II)NCA, PK based Design, Biostatistics (Part I/II)
Moscow, 23 May 2012
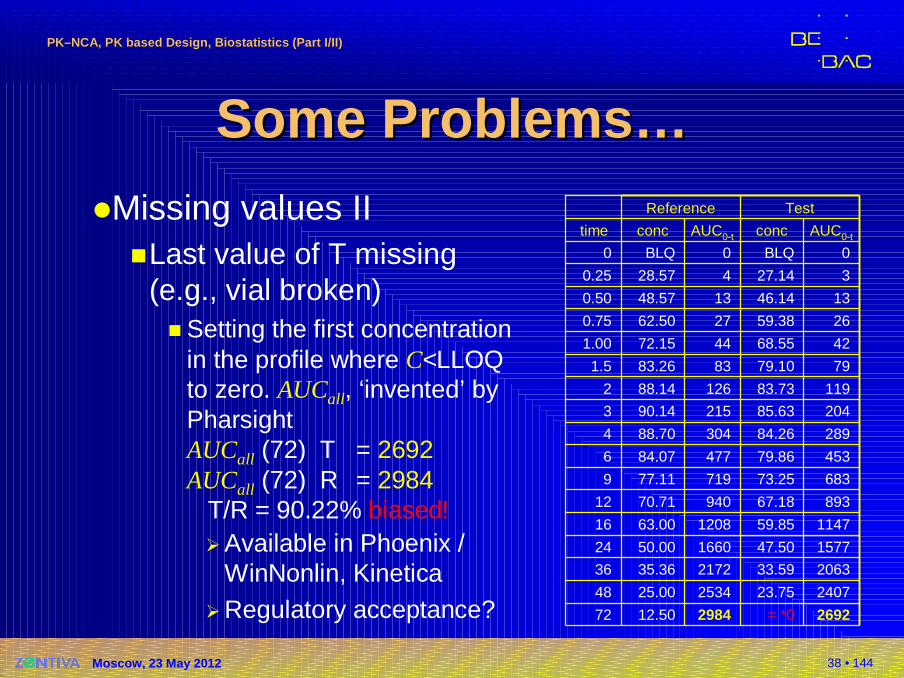
Some Problems…Some Problems…�Missing values II
�Last value of T missing(e.g., vial broken)� Setting the first concentration
in the profile where C<LLOQto zero. AUCall, ‘invented’ byPharsightAUCall (72) T = 2692AUCall (72) R = 2984
T/R = 90.22% biased!�Available in Phoenix /
WinNonlin, Kinetica�Regulatory acceptance? 2692= *0298412.5072
240723.75253425.0048
206333.59217235.3636
157747.50166050.0024
114759.85120863.0016
89367.1894070.7112
68373.2571977.119
45379.8647784.076
28984.2630488.704
20485.6321590.143
11983.7312688.142
7979.108383.261.5
4268.554472.151.00
2659.382762.500.75
1346.141348.570.50
327.14428.570.25
0BLQ0BLQ0
AUC0-tconcAUC0-tconctime
TestReference
39 • 144
PKPK––NCA, PK based Design, Biostatistics (Part I/II)NCA, PK based Design, Biostatistics (Part I/II)
Moscow, 23 May 2012
Some Problems…Some Problems…
0
20
40
60
80
100
0 12 24 36 48 60 72
time
conc
entr
atio
n
ReferenceTestLLOQ = 10
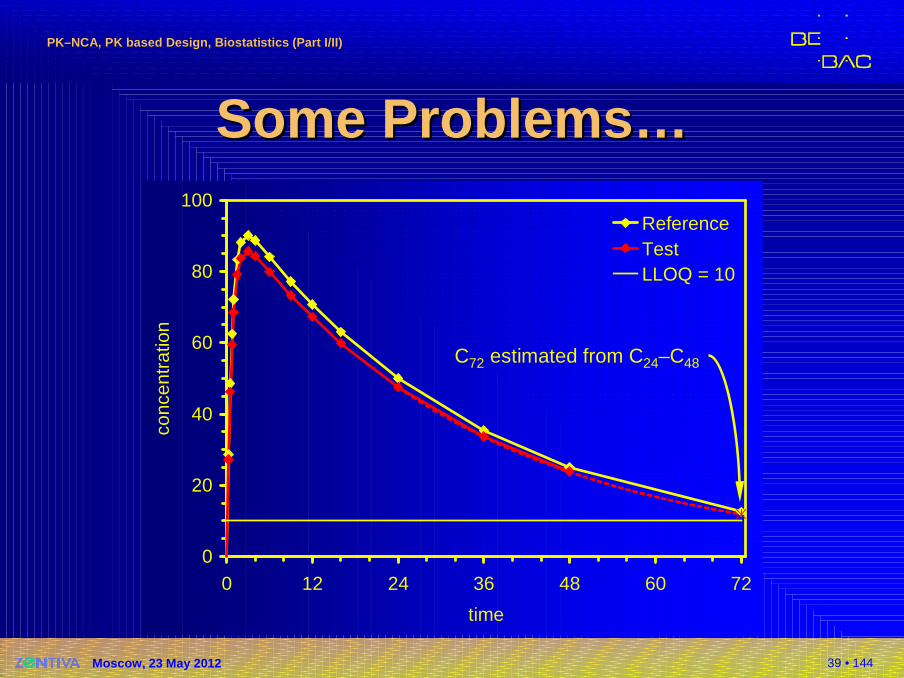
C72 estimated from C24–C48
40 • 144
PKPK––NCA, PK based Design, Biostatistics (Part I/II)NCA, PK based Design, Biostatistics (Part I/II)
Moscow, 23 May 2012
Some Problems…Some Problems…�Missing values II
�Last value of T missing(e.g., vial broken)� Estimating the missing value
from elimination phase.AUC72* T = 2835AUC72 R = 2984
T/R = 95% ��Not available in software�Regulatory acceptance ±
*2835*11.88298412.5072
240723.75253425.0048
206333.59217235.3636
157747.50166050.0024
114759.85120863.0016
89367.1894070.7112
68373.2571977.119
45379.8647784.076
28984.2630488.704
20485.6321590.143
11983.7312688.142
7979.108383.261.5
4268.554472.151.00
2659.382762.500.75
1346.141348.570.50
327.14428.570.25
0BLQ0BLQ0
AUC0-tconcAUC0-tconctime
TestReference
41 • 144
PKPK––NCA, PK based Design, Biostatistics (Part I/II)NCA, PK based Design, Biostatistics (Part I/II)
Moscow, 23 May 2012
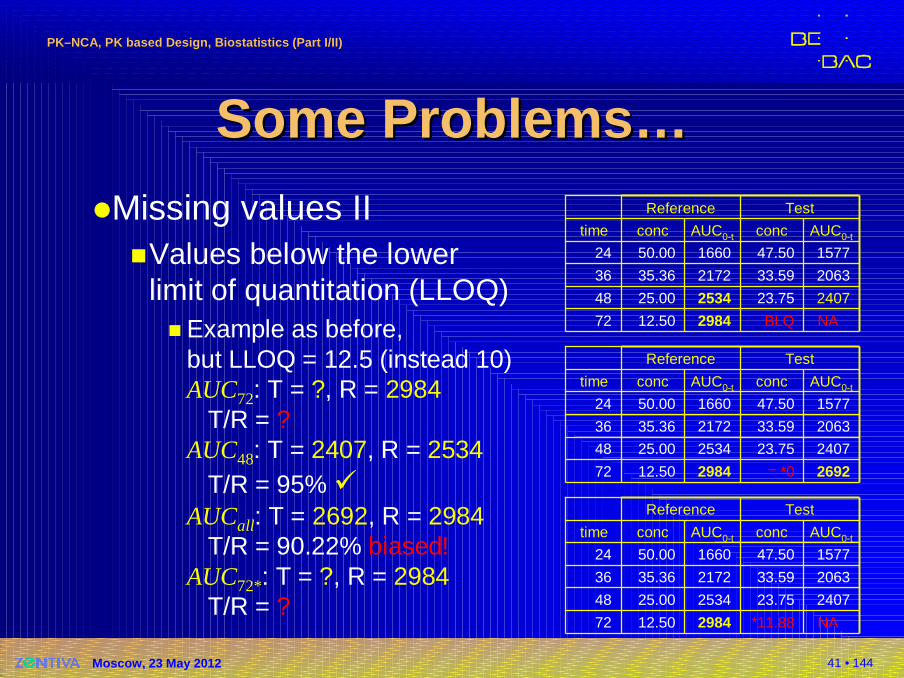
Some Problems…Some Problems…�Missing values II
�Values below the lowerlimit of quantitation (LLOQ)� Example as before,
but LLOQ = 12.5 (instead 10)AUC72: T = ?, R = 2984
T/R = ?AUC48: T = 2407, R = 2534
T/R = 95% �AUCall: T = 2692, R = 2984
T/R = 90.22% biased! AUC72*: T = ?, R = 2984
T/R = ?
NABLQ298412.5072
240723.75253425.0048
206333.59217235.3636
157747.50166050.0024
AUC0-tconcAUC0-tconctime
TestReference
2692= *0298412.5072
240723.75253425.0048
206333.59217235.3636
157747.50166050.0024
AUC0-tconcAUC0-tconctime
TestReference
NA*11.88298412.5072
240723.75253425.0048
206333.59217235.3636
157747.50166050.0024
AUC0-tconcAUC0-tconctime
TestReference
42 • 144
PKPK––NCA, PK based Design, Biostatistics (Part I/II)NCA, PK based Design, Biostatistics (Part I/II)
Moscow, 23 May 2012
Some Problems…Some Problems…
0
20
40
60
80
100
0 12 24 36 48 60 72
time
conc
entr
atio
n
ReferenceTestLLOQ = 12.5
BQL
0
20
40
60
80
100
0 12 24 36 48 60 72
time
conc
entr
atio
n
ReferenceTestLLOQ = 12.5
0
20
40
60
80
100
0 12 24 36 48 60 72
time
conc
entr
atio
n
ReferenceTestLLOQ = 12.5
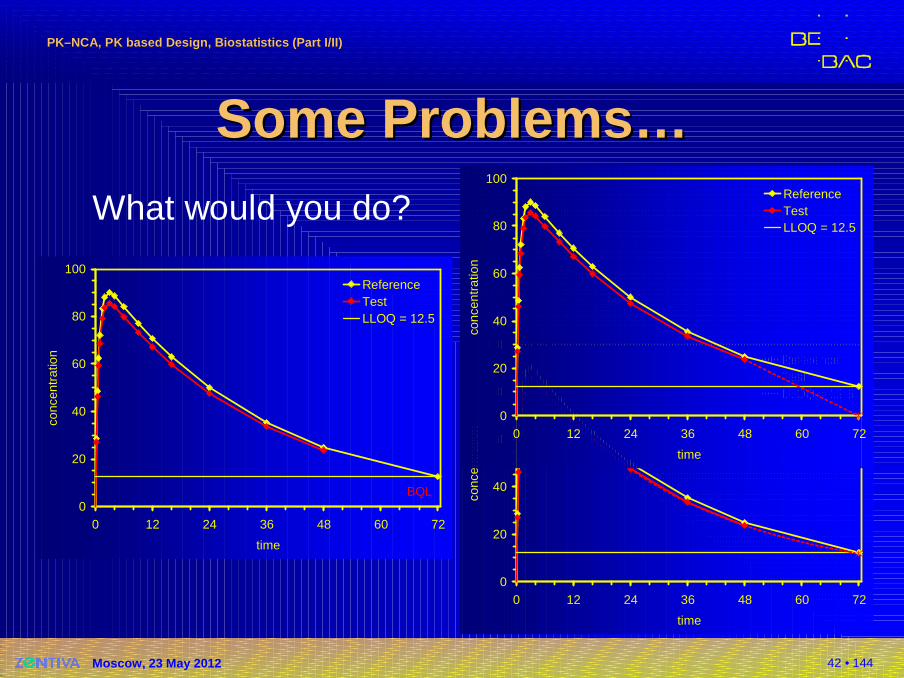
What would you do?
43 • 144
PKPK––NCA, PK based Design, Biostatistics (Part I/II)NCA, PK based Design, Biostatistics (Part I/II)
Moscow, 23 May 2012
Sampling at Sampling at CCmaxmax
�With any (!) given sampling scheme the ‘true’Cmax is missed�It is unlikely that we sample exactly at the true
Cmax for any given subject
�High inter- and/or intra-subject variability (single point metric)
�Variability higher than AUC’s
�In many studies the win/loose metric!
�Try to decrease variability� Increase sample size (more subjects)� Increase sampling within each subject (maybe better)
44 • 144
PKPK––NCA, PK based Design, Biostatistics (Part I/II)NCA, PK based Design, Biostatistics (Part I/II)
Moscow, 23 May 2012
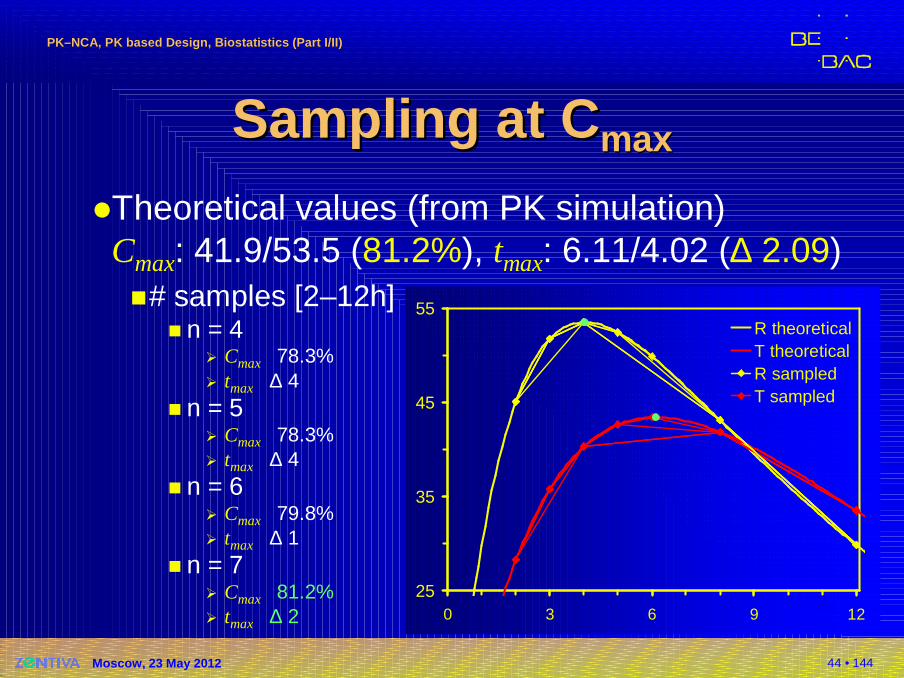
Sampling at Sampling at CCmaxmax
�Theoretical values (from PK simulation)Cmax: 41.9/53.5 (81.2%), tmax: 6.11/4.02 (∆ 2.09)�# samples [2–12h]
� n = 4� Cmax 78.3%� tmax ∆ 4
� n = 5� Cmax 78.3%� tmax ∆ 4
� n = 6� Cmax 79.8%� tmax ∆ 1
� n = 7� Cmax 81.2%� tmax ∆ 2
25
35
45
55
0 3 6 9 12
R theoreticalT theoreticalR sampledT sampled
45 • 144
PKPK––NCA, PK based Design, Biostatistics (Part I/II)NCA, PK based Design, Biostatistics (Part I/II)
Moscow, 23 May 2012
Sampling at Sampling at CCmaxmax
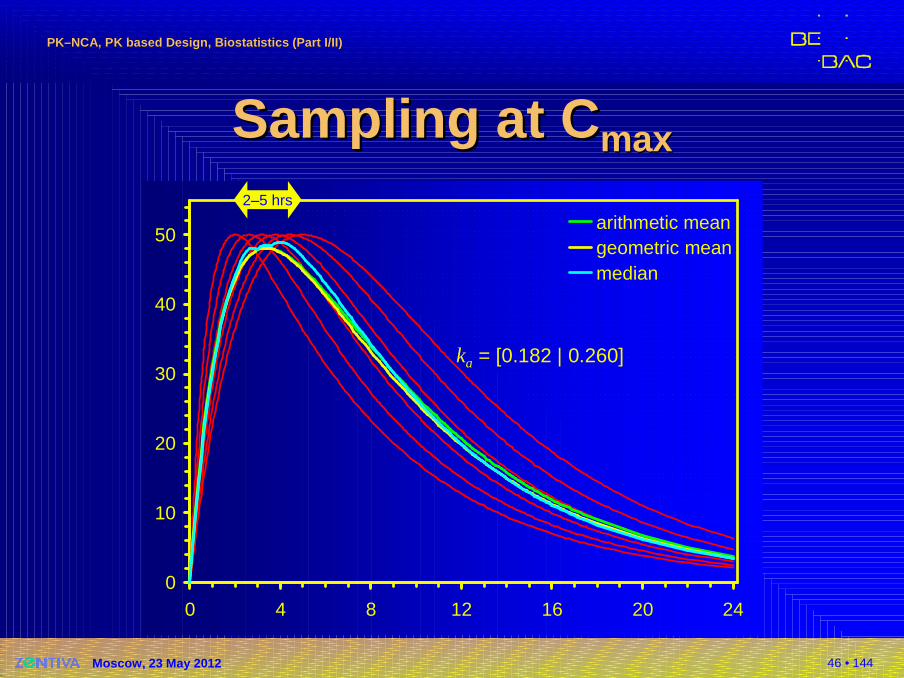
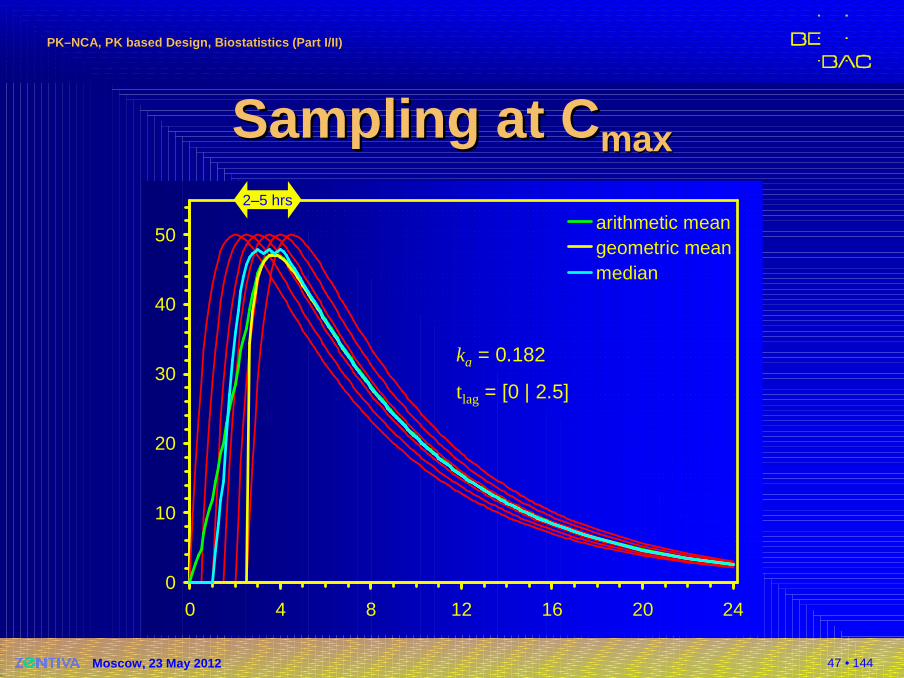
�Quote from the literature:Cmax was observed within two to five hours after oral administration…�Elimination is drug specific,�but what about absorption?
�Formulation specific!�Dependent on the sampling schedule (in a strict
sense study-specific)
46 • 144
PKPK––NCA, PK based Design, Biostatistics (Part I/II)NCA, PK based Design, Biostatistics (Part I/II)
Moscow, 23 May 2012
Sampling at Sampling at CCmaxmax
0
10
20
30
40
50
0 4 8 12 16 20 24
arithmetic meangeometric meanmedian
ka = [0.182 | 0.260]
2–5 hrs
47 • 144
PKPK––NCA, PK based Design, Biostatistics (Part I/II)NCA, PK based Design, Biostatistics (Part I/II)
Moscow, 23 May 2012
Sampling at Sampling at CCmaxmax
0
10
20
30
40
50
0 4 8 12 16 20 24
arithmetic meangeometric meanmedian
ka = 0.182
tlag = [0 | 2.5]
2–5 hrs
48 • 144
PKPK––NCA, PK based Design, Biostatistics (Part I/II)NCA, PK based Design, Biostatistics (Part I/II)
Moscow, 23 May 2012
Another ProblemAnother Problem�EMA GL on BE (2010)
�Section 4.1.8 Reasons for exclusion 1)� A subject with lack of any measurable concentrations or
only very low plasma concentrations for reference medicinal product. A subject is considered to have very low plasma concentrations if its AUC is less than 5% of reference medicinal product geometric mean AUC (which should be calculated without inclusion of data from the outlying subject). The exclusion of data […] will only be accepted in exceptional cases and may question the validity of the trial.
Remark: Only possible after unblinding!
49 • 144
PKPK––NCA, PK based Design, Biostatistics (Part I/II)NCA, PK based Design, Biostatistics (Part I/II)
Moscow, 23 May 2012
Another ProblemAnother Problem�EMA GL on BE (2010)
�Section 4.1.8 Resons for exclusion 1) cont’d� The above can, for immediate release formulations, be the
result of subject non-compliance […] and should as far as possible be avoided by mouth check of subjects after intake of study medication to ensure the subjects have swallowed the study medication […]. The samples from subjects excluded from the statistical analysis should still be assayed and the results listed.
50 • 144
PKPK––NCA, PK based Design, Biostatistics (Part I/II)NCA, PK based Design, Biostatistics (Part I/II)
Moscow, 23 May 2012
Another ProblemAnother Problem�Gastro-resistant (enteric coated) preparations
�Gastric emptying of single unit dosage formsnon-disintegrating in the stomach is prolongedand highly erratic. The consequences of thiseffect on the enteric coating of delayed release formulations are largely unpredictable.� Sampling period should be designed such that measurable
concentrations are obtained, taking into consideration not only the half-life of the drug but the possible occurrence of this effect as well. This should reduce the risk of obtaining incomplete concentration-time profiles due to delay to the most possible extent. These effects are highly dependent on individual behaviour.
51 • 144
PKPK––NCA, PK based Design, Biostatistics (Part I/II)NCA, PK based Design, Biostatistics (Part I/II)
Moscow, 23 May 2012
Another ProblemAnother Problem�Gastro-resistant (enteric coated) preparations
� Therefore, but only under the conditions that sampling times are designed to identify very delayed absorption and that the incidence of this outlier behaviour is observed with a comparable frequency in both, test and reference pro-ducts, these incomplete profiles can be excluded from statistical analysis provided that it has been considered in the study protocol.EMEA, CHMP (EWP-PK)Questions & Answers: positions on specific questions addressed to the pharmacokinetics working party EMA/618604/2008 Rev. 4 (16 February 2012)http://www.ema.europa.eu/docs/en_GB/document_library/Scientific_guideline/2009/09/WC500002963.pdf
What is ‘comparable’? For a study in 24 subjects, we get a significant difference for 5/0 (Fisher’s exact test: p 0.0496).
52 • 144
PKPK––NCA, PK based Design, Biostatistics (Part I/II)NCA, PK based Design, Biostatistics (Part I/II)
Moscow, 23 May 2012
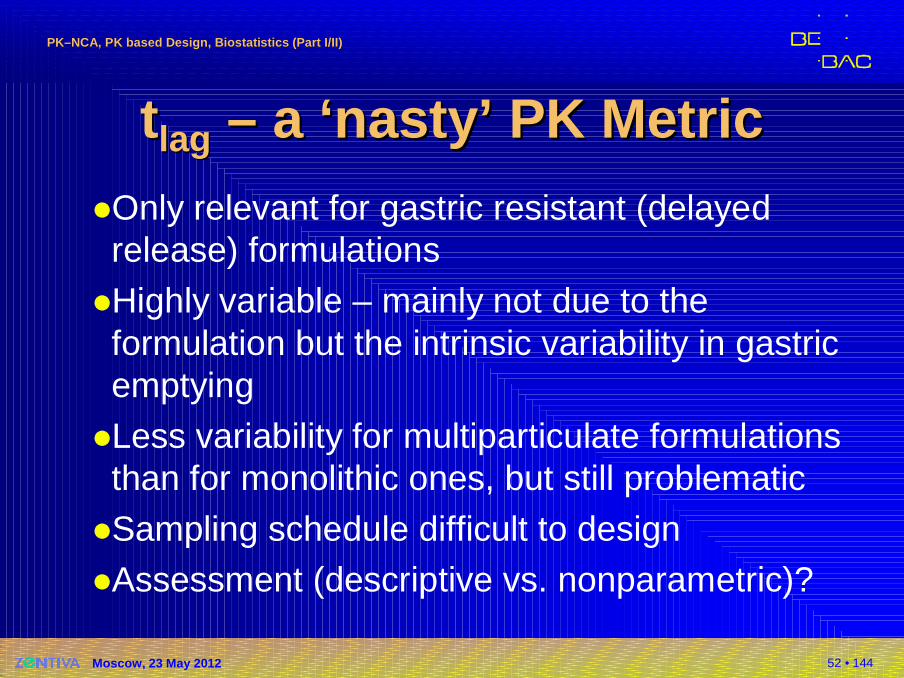
tt laglag –– a ‘nasty’ PK Metrica ‘nasty’ PK Metric�Only relevant for gastric resistant (delayed release) formulations
�Highly variable – mainly not due to the formulation but the intrinsic variability in gastric emptying
�Less variability for multiparticulate formulations than for monolithic ones, but still problematic
�Sampling schedule difficult to design
�Assessment (descriptive vs. nonparametric)?
53 • 144
PKPK––NCA, PK based Design, Biostatistics (Part I/II)NCA, PK based Design, Biostatistics (Part I/II)
Moscow, 23 May 2012
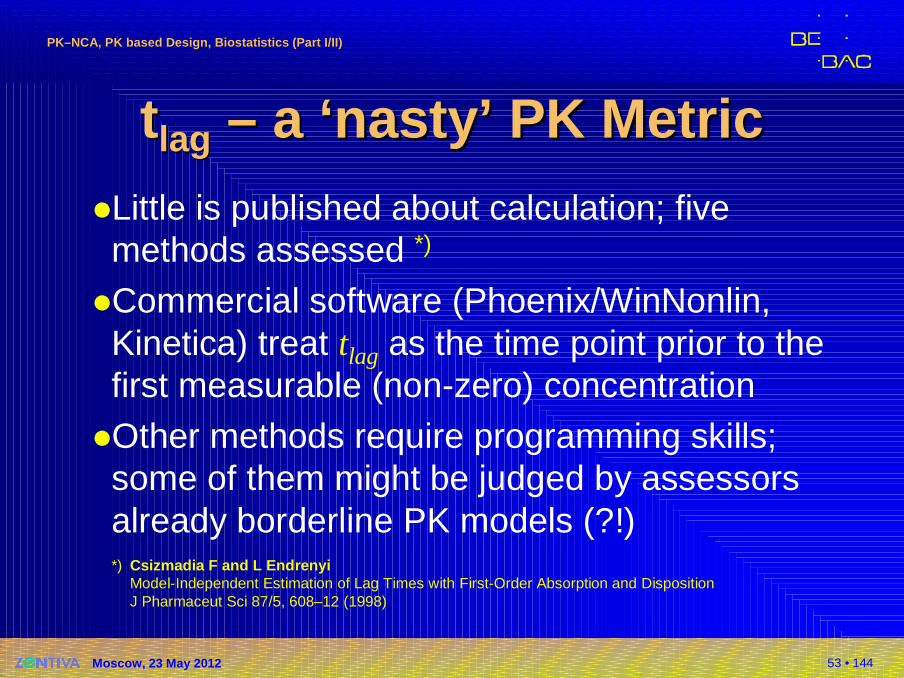
tt laglag –– a ‘nasty’ PK Metrica ‘nasty’ PK Metric�Little is published about calculation; five methods assessed *)
�Commercial software (Phoenix/WinNonlin, Kinetica) treat tlag as the time point prior to the first measurable (non-zero) concentration
�Other methods require programming skills; some of them might be judged by assessors already borderline PK models (?!)*) Csizmadia F and L Endrenyi
Model-Independent Estimation of Lag Times with First-Order Absorption and DispositionJ Pharmaceut Sci 87/5, 608–12 (1998)
54 • 144
PKPK––NCA, PK based Design, Biostatistics (Part I/II)NCA, PK based Design, Biostatistics (Part I/II)
Moscow, 23 May 2012
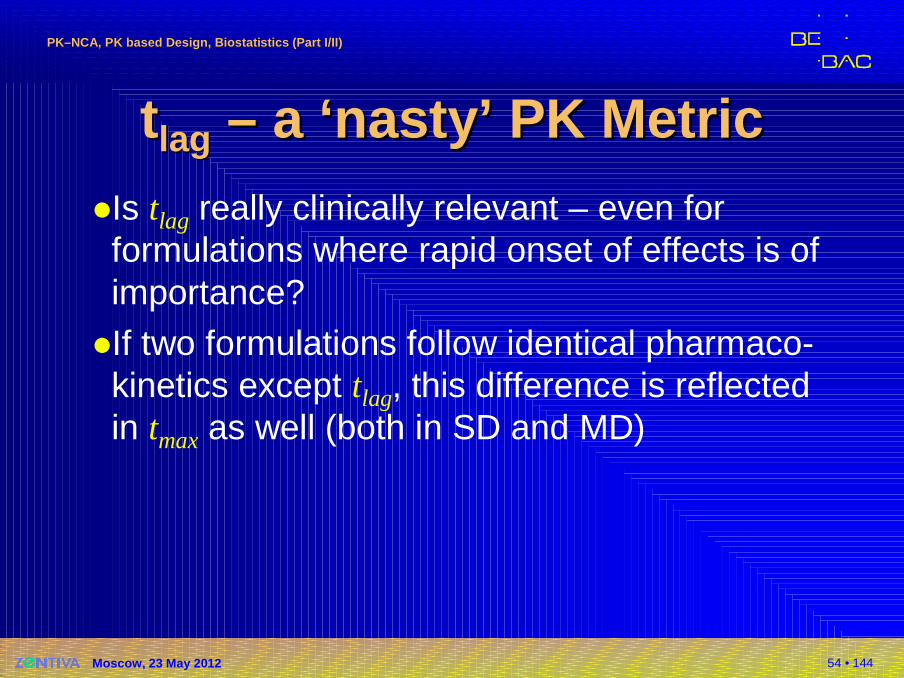
tt laglag –– a ‘nasty’ PK Metrica ‘nasty’ PK Metric�Is tlag really clinically relevant – even for formulations where rapid onset of effects is of importance?
�If two formulations follow identical pharmaco-kinetics except tlag, this difference is reflected in tmax as well (both in SD and MD)
55 • 144
PKPK––NCA, PK based Design, Biostatistics (Part I/II)NCA, PK based Design, Biostatistics (Part I/II)
Moscow, 23 May 2012
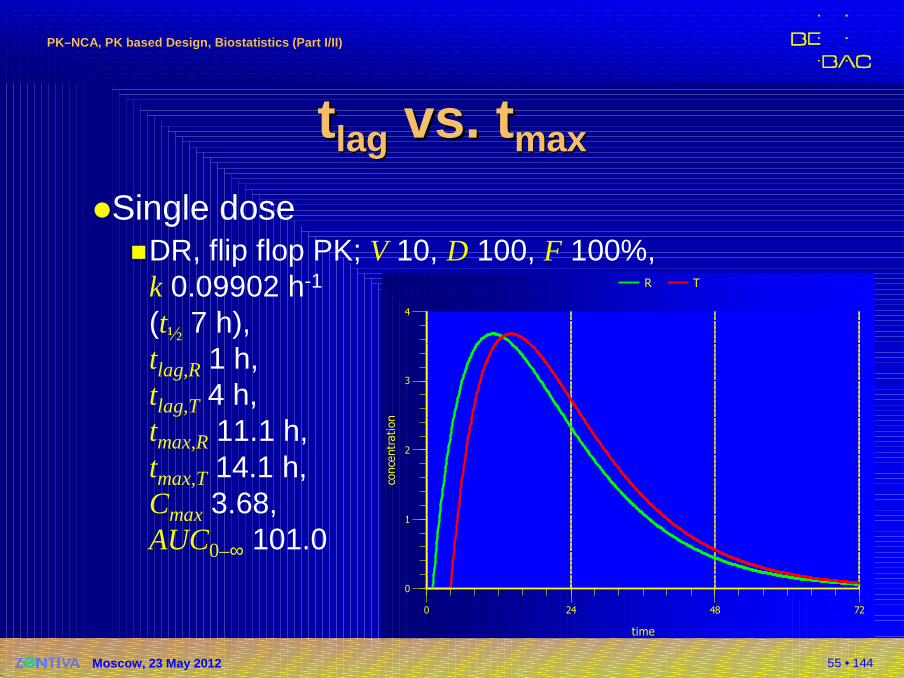
tt laglag vs.vs. ttmaxmax
�Single dose�DR, flip flop PK; V 10, D 100, F 100%,
k 0.09902 h-1
(t½ 7 h),tlag,R 1 h,tlag,T 4 h, tmax,R 11.1 h,tmax,T 14.1 h,Cmax 3.68,AUC0–∞ 101.0
0
1
2
3
4
conce
ntr
ation
0 24 48 72
time
R T
56 • 144
PKPK––NCA, PK based Design, Biostatistics (Part I/II)NCA, PK based Design, Biostatistics (Part I/II)
Moscow, 23 May 2012
tt laglag vs.vs. ttmaxmax
Tau
Tla
g (
R)
Tla
g (
T)
0
1
2
3
4
5
6
conce
ntr
ation
conce
ntra
tion
120 124 128 132 136 140 144
time
R T
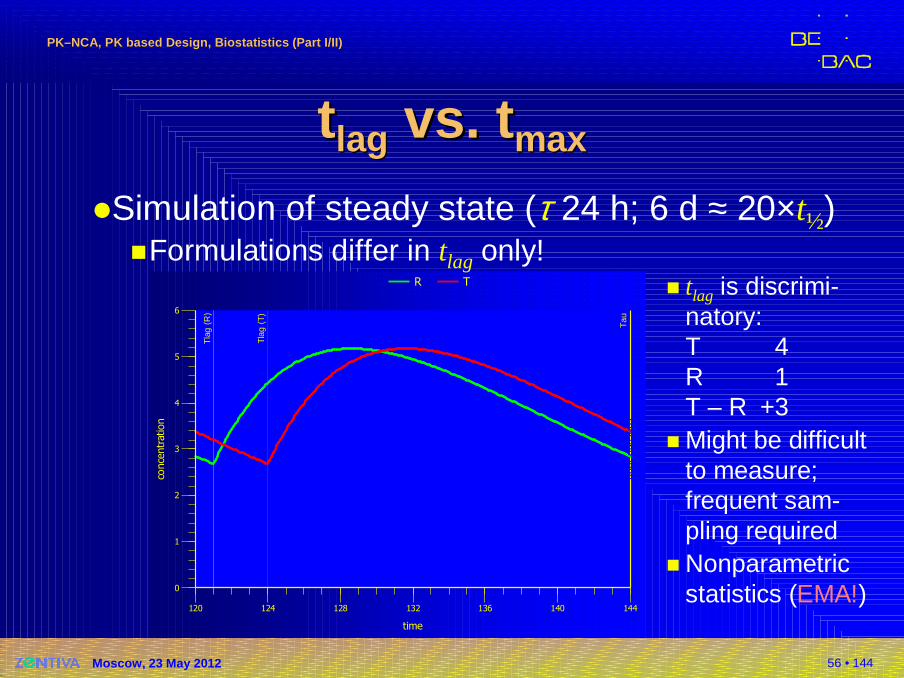
�Simulation of steady state (τ 24 h; 6 d ≈ 20×t½)�Formulations differ in tlag only!
� tlag is discrimi-natory:T 4R 1T – R +3
� Might be difficult to measure; frequent sam-pling required
� Nonparametric statistics (EMA!)
57 • 144
PKPK––NCA, PK based Design, Biostatistics (Part I/II)NCA, PK based Design, Biostatistics (Part I/II)
Moscow, 23 May 2012
Tau
Tm
ax (
R)
Tm
ax (
R)
0
1
2
3
4
5
6
conce
ntr
ation
conce
ntra
tion
120 124 128 132 136 140 144
time
R T
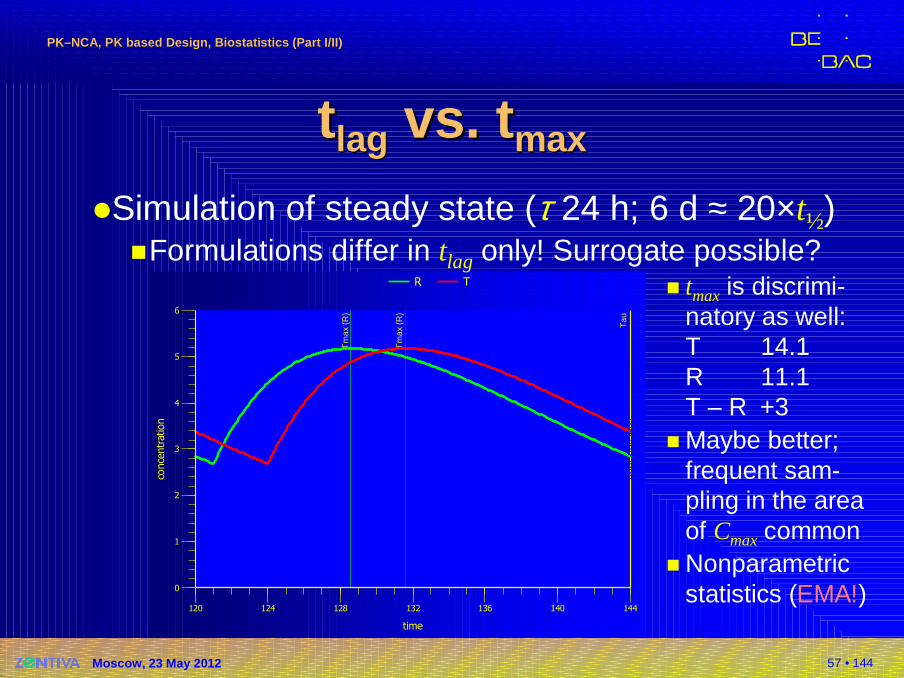
�Simulation of steady state (τ 24 h; 6 d ≈ 20×t½)�Formulations differ in tlag only! Surrogate possible?
� tmax is discrimi-natory as well:T 14.1R 11.1T – R +3
� Maybe better; frequent sam-pling in the area of Cmaxcommon
� Nonparametric statistics (EMA!)
tt laglag vs.vs. ttmaxmax
58 • 144
PKPK––NCA, PK based Design, Biostatistics (Part I/II)NCA, PK based Design, Biostatistics (Part I/II)
Moscow, 23 May 2012
0 4 8 12 16 20 24
5
25
50
250
500
1500
time (h)
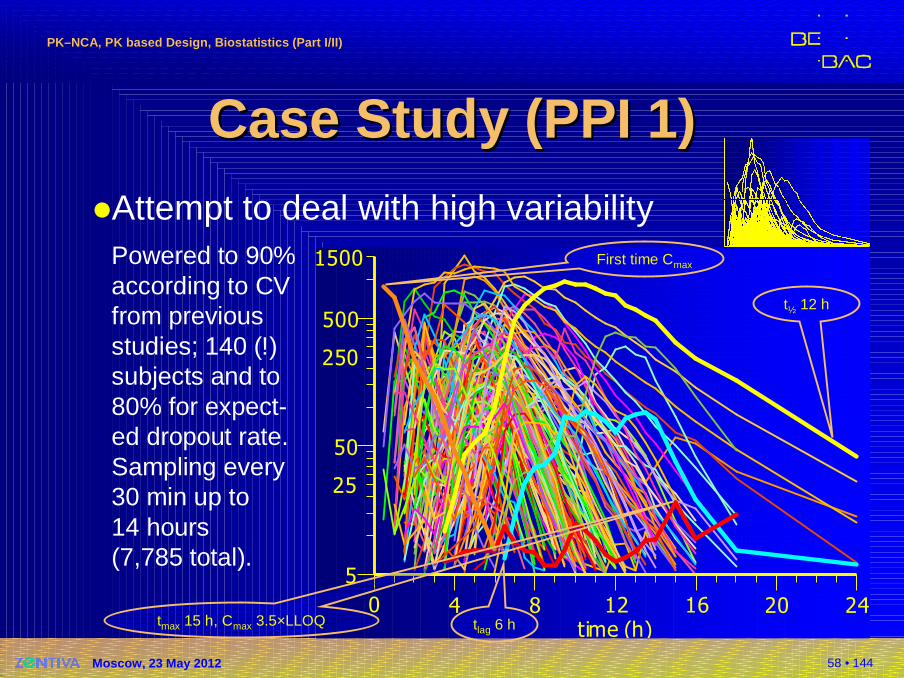
Case Study (PPI 1)Case Study (PPI 1)�Attempt to deal with high variability
Powered to 90%according to CVfrom previousstudies; 140 (!)subjects and to80% for expect-ed dropout rate.Sampling every30 min up to14 hours(7,785 total).
First time Cmax
t½ 12 h
tmax 15 h, Cmax 3.5×LLOQ tlag 6 h
59 • 144
PKPK––NCA, PK based Design, Biostatistics (Part I/II)NCA, PK based Design, Biostatistics (Part I/II)
Moscow, 23 May 2012
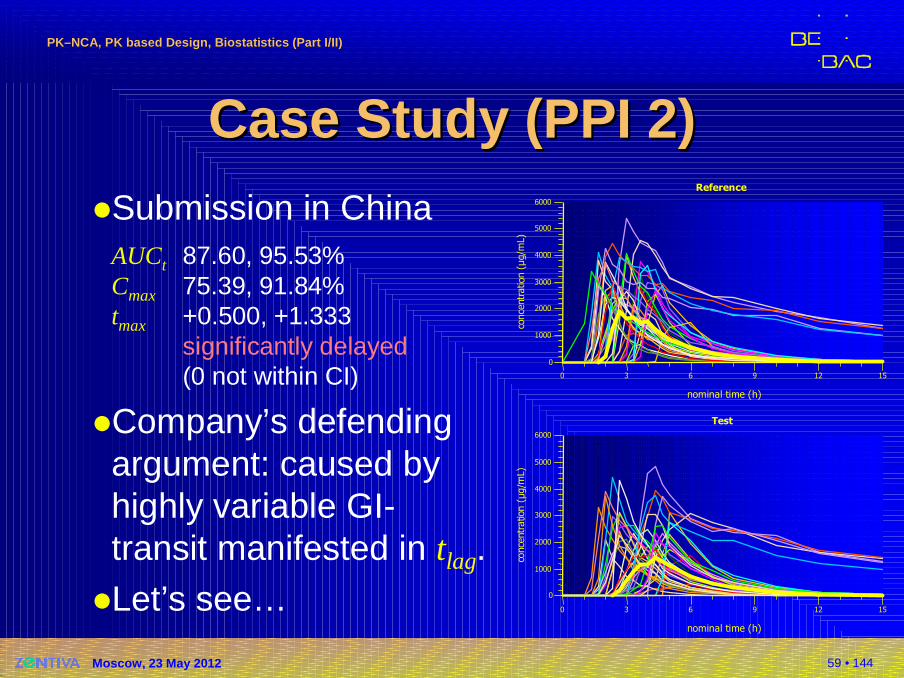
Case Study (PPI 2)Case Study (PPI 2)�Submission in China
AUCt 87.60, 95.53%Cmax 75.39, 91.84%tmax +0.500, +1.333
significantly delayed(0 not within CI)
�Company’s defendingargument: caused byhighly variable GI-transit manifested in tlag.
�Let’s see…
0
1000
2000
3000
4000
5000
6000
conce
ntr
ation
(µg/m
L)
0 3 6 9 12 15
nominal time (h)
Reference
0
1000
2000
3000
4000
5000
6000
conce
ntr
atio
n( µ
g/m
L)
0 3 6 9 12 15
nominal time (h)
Test
60 • 144
PKPK––NCA, PK based Design, Biostatistics (Part I/II)NCA, PK based Design, Biostatistics (Part I/II)
Moscow, 23 May 2012
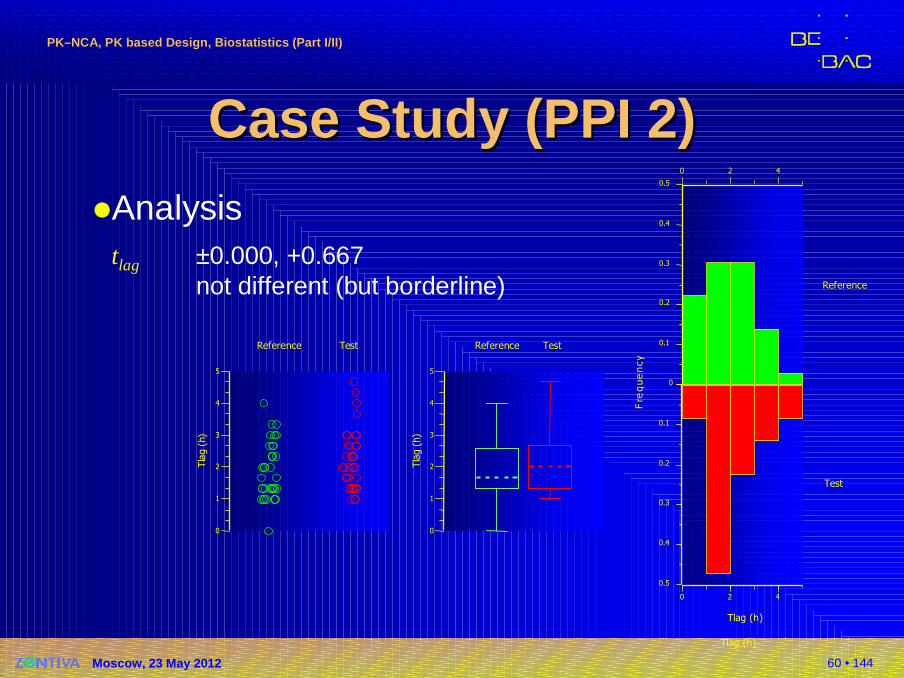
Case Study (PPI 2)Case Study (PPI 2)�Analysis
tlag ±0.000, +0.667not different (but borderline)
0
1
2
3
4
5
Tla
g(h
)
Reference Test
0
1
2
3
4
5
Tla
g(h
)
Reference Test
Tlag (h)
Reference
0
0.1
0.2
0.3
0.4
0.5
Fre
que
ncy
0 2 4
0.1
0.2
0.3
0.4
0.5
Test
0 2 4
Tlag (h)
61 • 144
PKPK––NCA, PK based Design, Biostatistics (Part I/II)NCA, PK based Design, Biostatistics (Part I/II)
Moscow, 23 May 2012
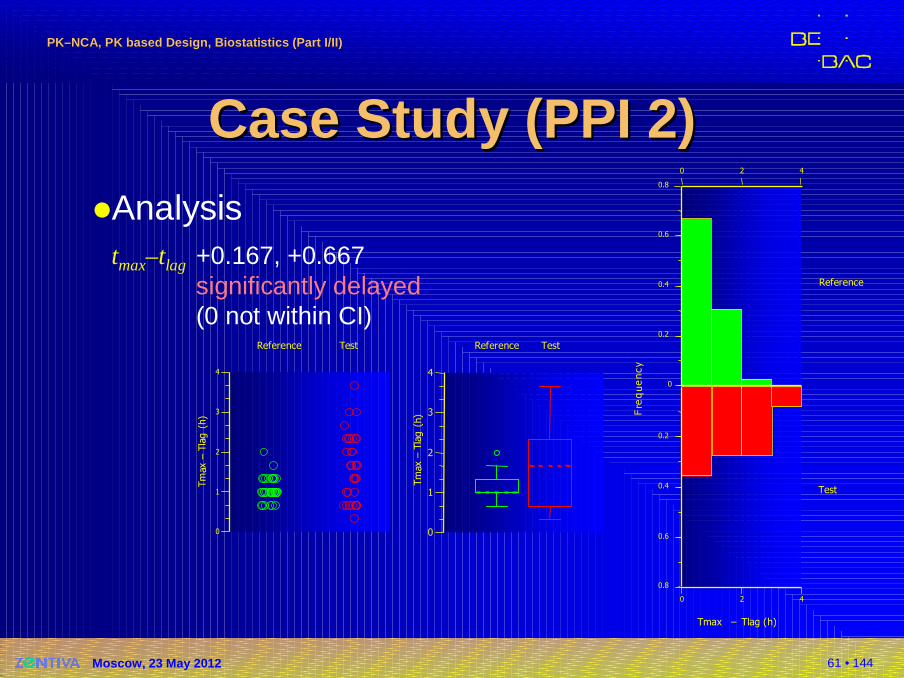
Case Study (PPI 2)Case Study (PPI 2)�Analysis
tmax–tlag +0.167, +0.667significantly delayed(0 not within CI)
0
1
2
3
4
Tm
ax–
Tla
g(h
)
Reference Test
0
0.2
0.4
0.6
0.8
Fre
que
ncy
0 2 4
0 2 4
Tmax – Tlag (h)
0.2
0.4
0.6
0.8
Reference
Test
0
1
2
3
4
Tm
ax–
Tla
g( h
)
Reference Test
62 • 144
PKPK––NCA, PK based Design, Biostatistics (Part I/II)NCA, PK based Design, Biostatistics (Part I/II)
Moscow, 23 May 2012
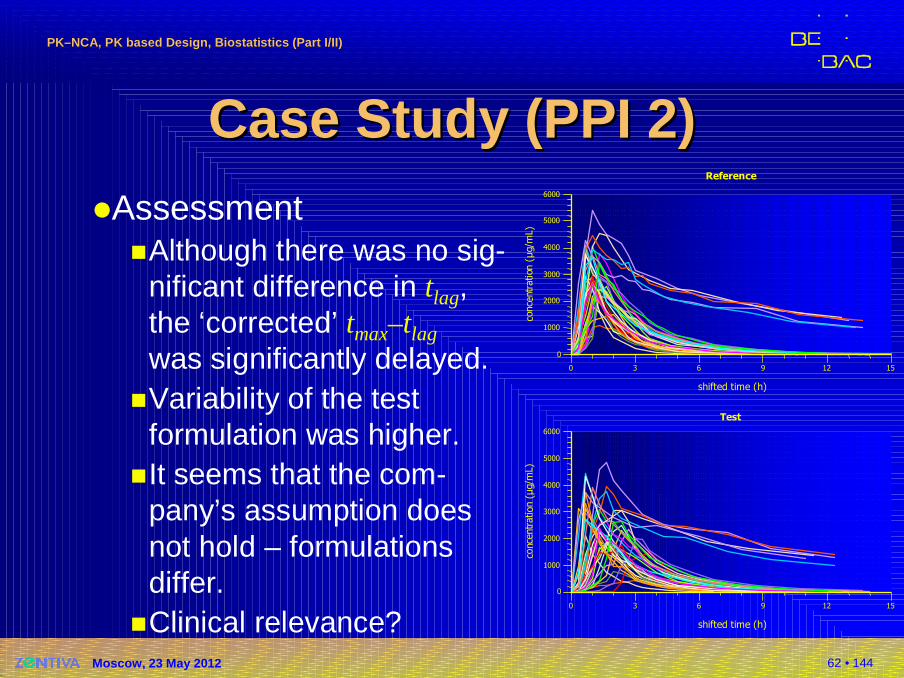
Case Study (PPI 2)Case Study (PPI 2)�Assessment
�Although there was no sig-nificant difference in tlag,the ‘corrected’ tmax–tlag
was significantly delayed.�Variability of the test
formulation was higher.�It seems that the com-
pany’s assumption doesnot hold – formulationsdiffer.
�Clinical relevance?15
0
1000
2000
3000
4000
5000
6000
conc e
ntr
ation
(µg/
mL )
0 3 6 9 12 15
shifted time (h)
Reference
0
1000
2000
3000
4000
5000
6000
conc
entr
ation
(µg/
mL)
0 3 6 9 12
shifted time (h)
Test
63 • 144
PKPK––NCA, PK based Design, Biostatistics (Part I/II)NCA, PK based Design, Biostatistics (Part I/II)
Moscow, 23 May 2012
Half livesHalf lives�Drug specific, but…
�The apparent elimination represents the slowestrate constant (controlled release, topicals,transdermals) – not necessarily elimination!
�Avoid the term ‘terminal elimination’ –might not be true
�Important in designing studies� To meet AUCt ≥ 80% AUC∞ criterion� To plan sufficiently long wash-out (avoid carry-over)� To plan saturation phase for steady state
64 • 144
PKPK––NCA, PK based Design, Biostatistics (Part I/II)NCA, PK based Design, Biostatistics (Part I/II)
Moscow, 23 May 2012
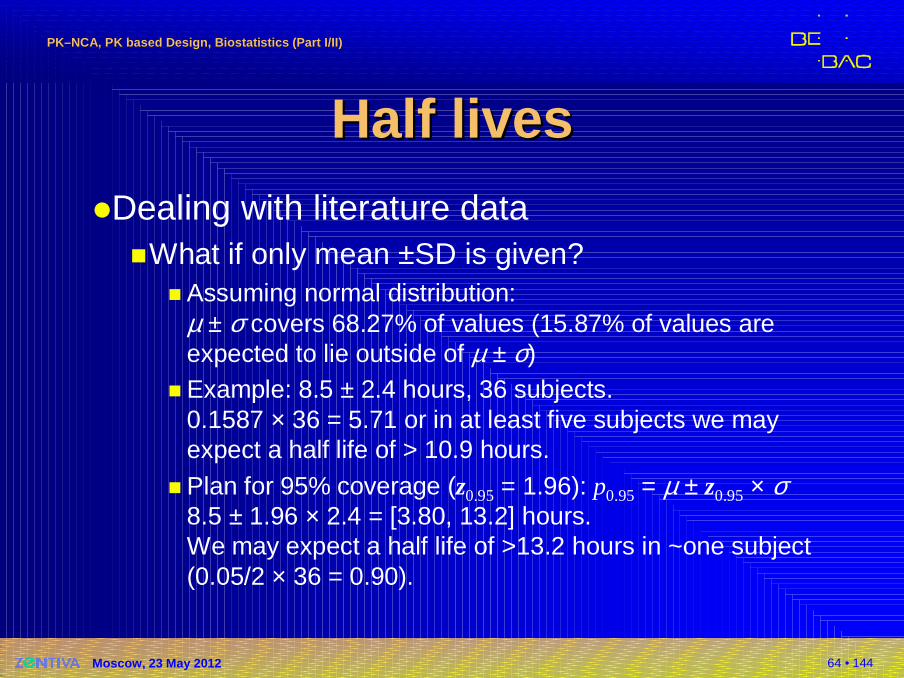
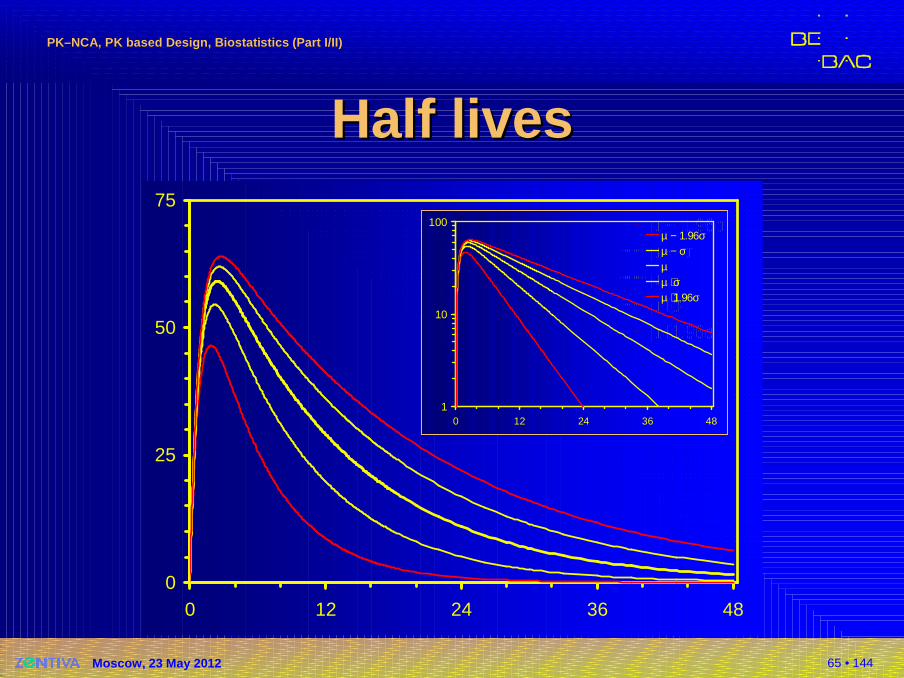
Half livesHalf lives�Dealing with literature data
�What if only mean ±SD is given?� Assuming normal distribution:
µ ± σ covers 68.27% of values (15.87% of values are expected to lie outside of µ ± σ)
� Example: 8.5 ± 2.4 hours, 36 subjects.0.1587 × 36 = 5.71 or in at least five subjects we may expect a half life of > 10.9 hours.
� Plan for 95% coverage (z0.95 = 1.96): p0.95 = µ ± z0.95 × σ8.5 ± 1.96 × 2.4 = [3.80, 13.2] hours.We may expect a half life of >13.2 hours in ~one subject (0.05/2 × 36 = 0.90).
65 • 144
PKPK––NCA, PK based Design, Biostatistics (Part I/II)NCA, PK based Design, Biostatistics (Part I/II)
Moscow, 23 May 2012
Half livesHalf lives
0
25
50
75
0 12 24 36 48
µ − 1.96σµ − σµµ + σµ + 1.96σ
1
10
100
0 12 24 36 48
µ − 1.96σµ − σµµ + σµ + 1.96σ
66 • 144
PKPK––NCA, PK based Design, Biostatistics (Part I/II)NCA, PK based Design, Biostatistics (Part I/II)
Moscow, 23 May 2012
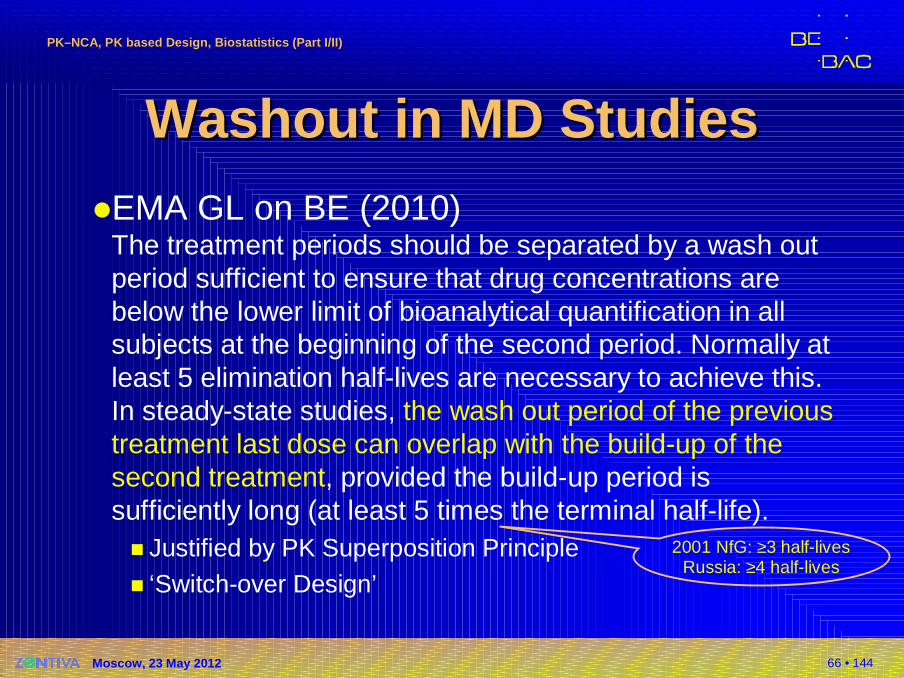
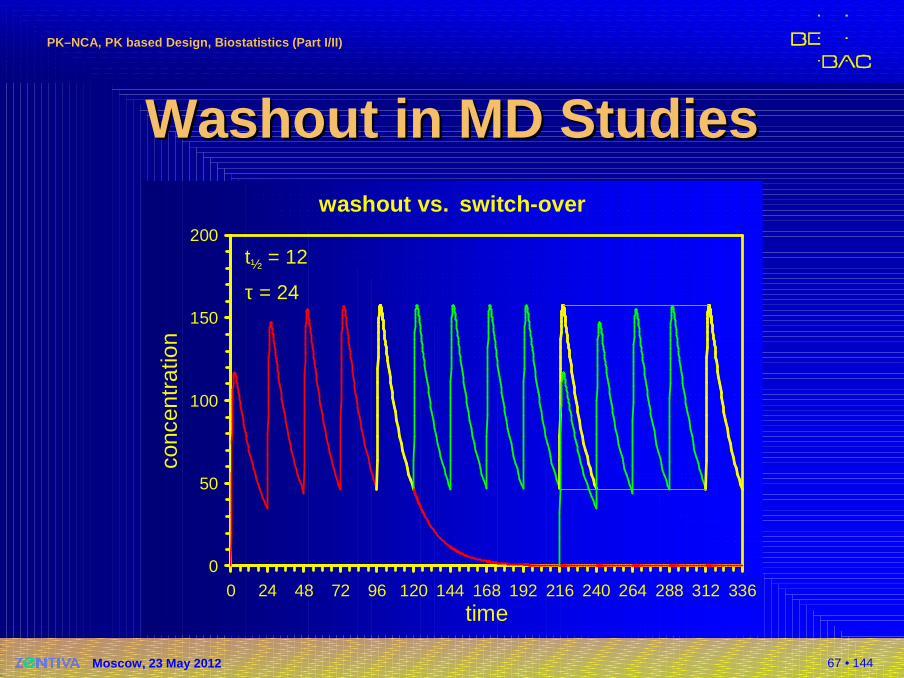
Washout in MD StudiesWashout in MD Studies�EMA GL on BE (2010)
The treatment periods should be separated by a wash out period sufficient to ensure that drug concentrations are below the lower limit of bioanalytical quantification in all subjects at the beginning of the second period. Normally at least 5 elimination half-lives are necessary to achieve this. In steady-state studies, the wash out period of the previous treatment last dose can overlap with the build-up of the second treatment, provided the build-up period is sufficiently long (at least 5 times the terminal half-life).� Justified by PK Superposition Principle� ‘Switch-over Design’
2001 NfG: ≥3 half-livesRussia: ≥4 half-lives
67 • 144
PKPK––NCA, PK based Design, Biostatistics (Part I/II)NCA, PK based Design, Biostatistics (Part I/II)
Moscow, 23 May 2012
Washout in MD StudiesWashout in MD Studieswashout vs. switch-over
0
50
100
150
200
0 24 48 72 96 120 144 168 192 216 240 264 288 312 336
time
conc
entr
atio
n
t½ = 12
τ = 24

68 • 144
PKPK––NCA, PK based Design, Biostatistics (Part I/II)NCA, PK based Design, Biostatistics (Part I/II)
Moscow, 23 May 2012
(Bio)statistics(Bio)statistics
StatisticsStatistics. . A subject which most A subject which most statisticians find difficult but in which nearly statisticians find difficult but in which nearly all physicians are expert.all physicians are expert.
BiostatisticianBiostatistician. . One who has neither theOne who has neither theintellect for mathematicsintellect for mathematics nor the commitment for nor the commitment for medicine but likes to dabble in both.medicine but likes to dabble in both.
Medical Medical sstatisticiantatistician. . One who will not accept that One who will not accept that Columbus discovered America…Columbus discovered America… because he said because he said he was looking for India in the trial plan.he was looking for India in the trial plan.
Stephen Stephen SennSenn

69 • 144
PKPK––NCA, PK based Design, Biostatistics (Part I/II)NCA, PK based Design, Biostatistics (Part I/II)
Moscow, 23 May 2012
BioequivalenceBioequivalence�Background / definition (EMA 2010)
�Two medicinal products containing the same active substance are considered bioequivalent if they are pharmaceutically equivalent or pharmaceutical alternatives and their bioavailabilities (rate and extent) after administration in the same molar doselie within acceptable predefined limits. These limits are set to ensure comparable in vivo performance, i.e. similarity in terms of safety and efficacy.
70 • 144
PKPK––NCA, PK based Design, Biostatistics (Part I/II)NCA, PK based Design, Biostatistics (Part I/II)
Moscow, 23 May 2012
BioequivalenceBioequivalence�Background (EMA 2010)
�In bioequivalence studies, the plasma concentration time curve is generally used to assess the rate and extent of absorption. Selected pharmacokinetic parameters and preset acceptance limits allow the final decision on bioequivalence of the tested pro-ducts. AUC, the area under the concentration time curve, reflects the extent of exposure. Cmax, the maximum plasma concentration or peak exposure, and the time to maximum plasma concentration, tmax, are parameters that are influenced by absorp-tion rate.
71 • 144
PKPK––NCA, PK based Design, Biostatistics (Part I/II)NCA, PK based Design, Biostatistics (Part I/II)
Moscow, 23 May 2012
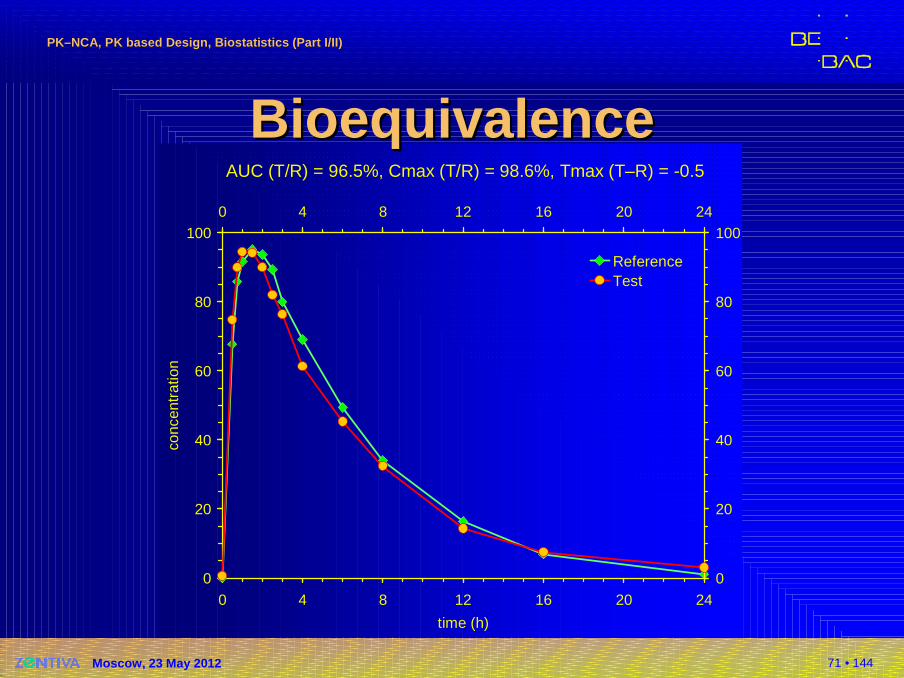
AUC (T/R) = 96.5%, Cmax (T/R) = 98.6%, Tmax (T–R) = -0.5
0
20
40
60
80
100
0 4 8 12 16 20 24
time (h)
conc
entr
atio
n
0
20
40
60
80
1000 4 8 12 16 20 24
ReferenceTest
BioequivalenceBioequivalence
72 • 144
PKPK––NCA, PK based Design, Biostatistics (Part I/II)NCA, PK based Design, Biostatistics (Part I/II)
Moscow, 23 May 2012
BioequivalenceBioequivalence�Regulatory background
�Generic applications�EMA: Directive 2001/83/EC, Article 10(1)�FDA: Abbreviated New Drug Applications
(21CFR320.21)
�Bridging studies�Scale-up from pilot batches used in Phase III
to full production batches�Major variations of approved formulations
EMA: Type II(d)–(f), FDA: SUPAC Level 3�Line extensions (e.g., new dosage forms, new
strengths if waiving not possible)
73 • 144
PKPK––NCA, PK based Design, Biostatistics (Part I/II)NCA, PK based Design, Biostatistics (Part I/II)
Moscow, 23 May 2012
Concept of BE…Concept of BE…�Statistical concept of BE also applicable to
�Food effect studies
�PK interaction studies�Studies of fixed-dose combination products
‘[…] are similar to such degree that their effects, with respect to both efficacy and safety, will beessentially the same.’
EMEA Human Medicines Evaluation Unit / CPMPModified Release Oral and Transdermal Dosage Forms: Section II (Quality)CPMP/EWP/280/96 (1999)EMEA Human Medicines Evaluation Unit / CPMPThe Investigation of Drug InteractionsCPMP/EWP/560/95 (1997) EMEAFixed Combination Medicinal ProductsCPMP/EWP/240/95 Rev. 1 (2008)
74 • 144
PKPK––NCA, PK based Design, Biostatistics (Part I/II)NCA, PK based Design, Biostatistics (Part I/II)
Moscow, 23 May 2012
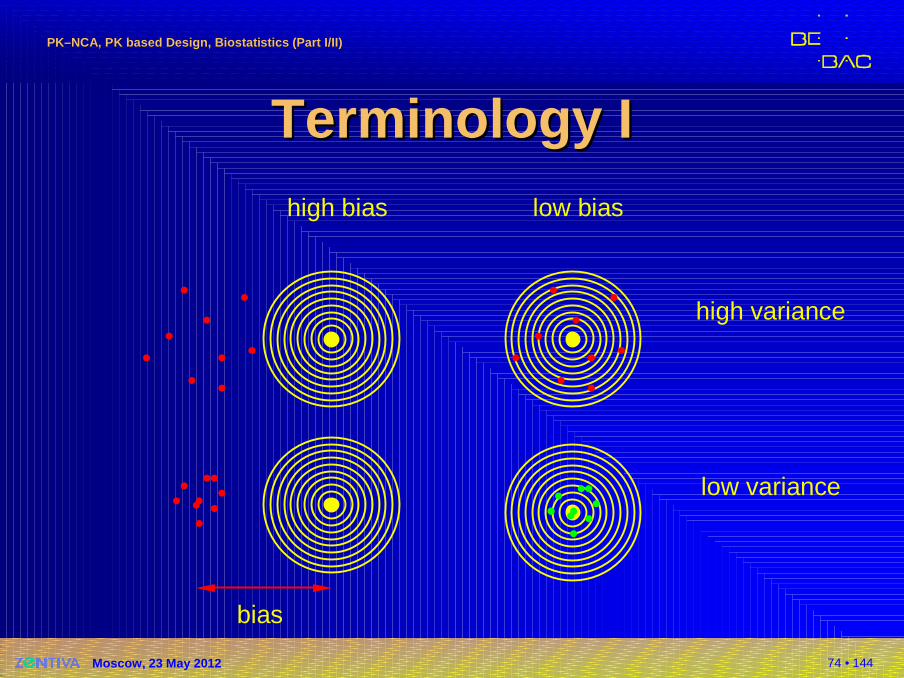
TerminologyTerminology IIhigh bias low bias
high variance
low variance
bias
75 • 144
PKPK––NCA, PK based Design, Biostatistics (Part I/II)NCA, PK based Design, Biostatistics (Part I/II)
Moscow, 23 May 2012
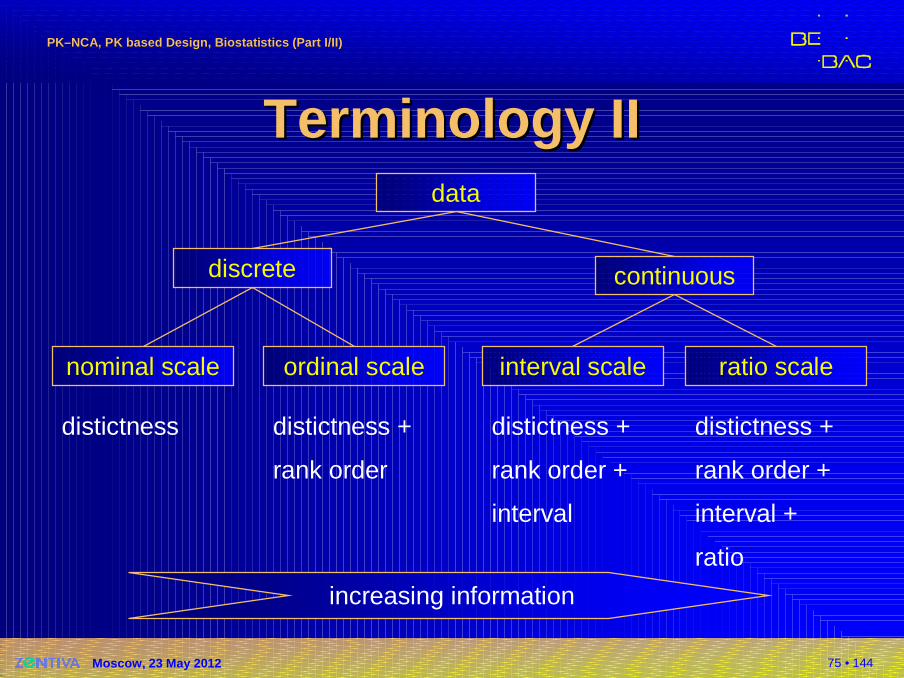
TerminologyTerminology IIIIdata
continuousdiscrete
nominal scale ordinal scale interval scale ratio scale
distictness distictness +
rank order
distictness +
rank order +
interval
distictness +
rank order +
interval +
ratio
increasing information
76 • 144
PKPK––NCA, PK based Design, Biostatistics (Part I/II)NCA, PK based Design, Biostatistics (Part I/II)
Moscow, 23 May 2012
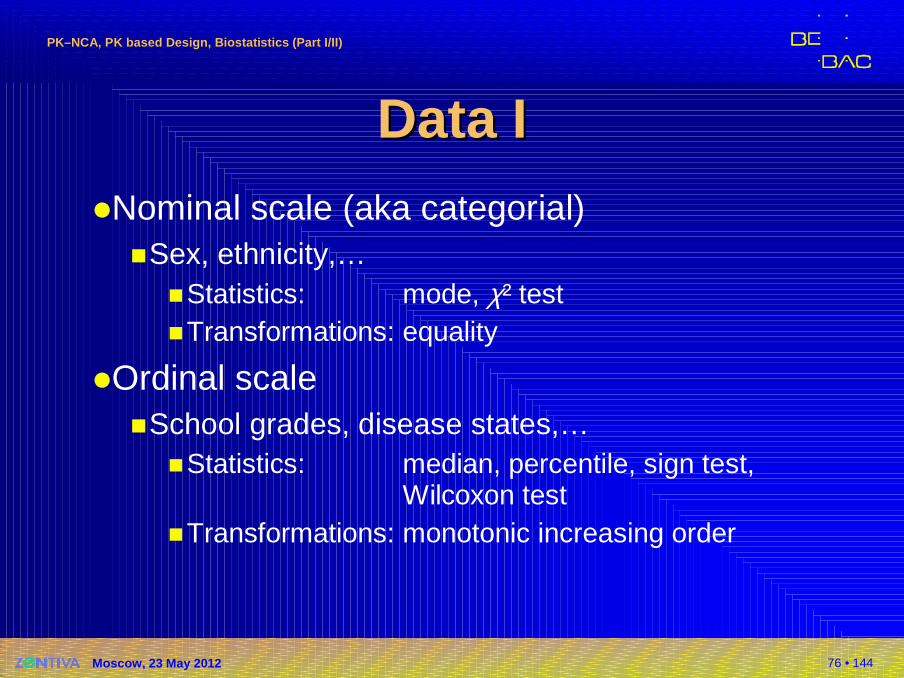
DataData II�Nominal scale (aka categorial)
�Sex, ethnicity,…�Statistics: mode, χ² test�Transformations: equality
�Ordinal scale�School grades, disease states,…
�Statistics: median, percentile, sign test,Wilcoxon test
�Transformations: monotonic increasing order
77 • 144
PKPK––NCA, PK based Design, Biostatistics (Part I/II)NCA, PK based Design, Biostatistics (Part I/II)
Moscow, 23 May 2012
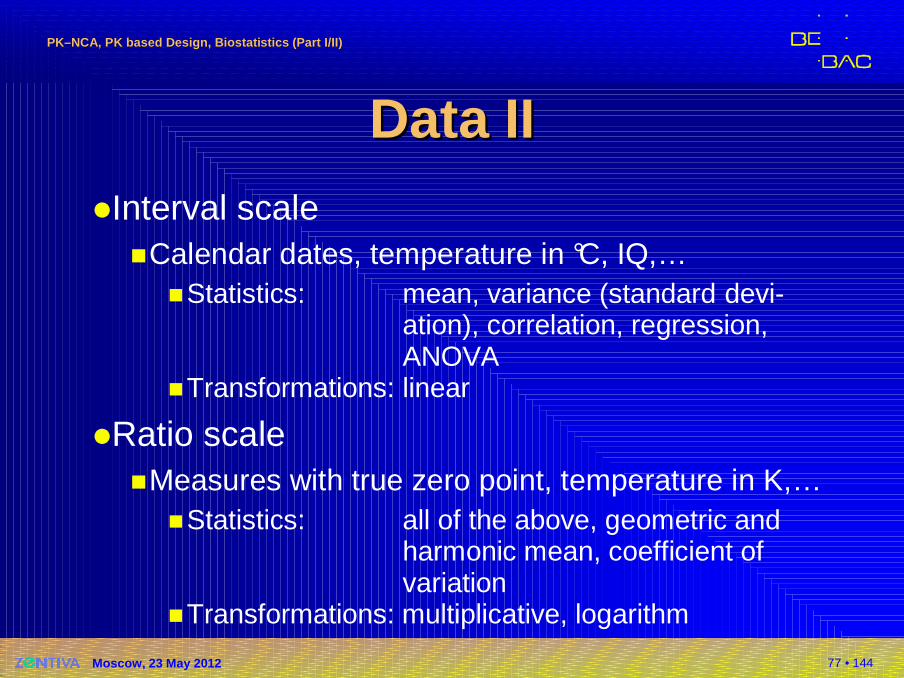
DataData IIII�Interval scale
�Calendar dates, temperature in °C, IQ,…�Statistics: mean, variance (standard devi-
ation), correlation, regression,ANOVA
�Transformations: linear
�Ratio scale�Measures with true zero point, temperature in K,…
�Statistics: all of the above, geometric and harmonic mean, coefficient ofvariation
�Transformations: multiplicative, logarithm
78 • 144
PKPK––NCA, PK based Design, Biostatistics (Part I/II)NCA, PK based Design, Biostatistics (Part I/II)
Moscow, 23 May 2012
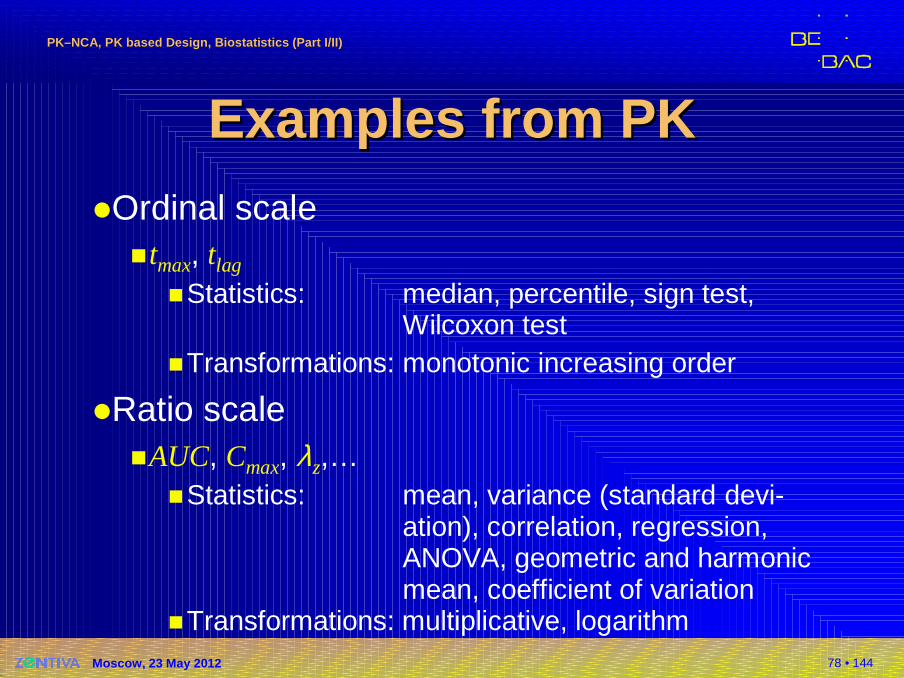
Examples fromExamples from PKPK�Ordinal scale
�tmax, tlag
�Statistics: median, percentile, sign test,Wilcoxon test
�Transformations: monotonic increasing order
�Ratio scale�AUC, Cmax, λz,…
�Statistics: mean, variance (standard devi-ation), correlation, regression,ANOVA, geometric and harmonicmean, coefficient of variation
�Transformations: multiplicative, logarithm
79 • 144
PKPK––NCA, PK based Design, Biostatistics (Part I/II)NCA, PK based Design, Biostatistics (Part I/II)
Moscow, 23 May 2012
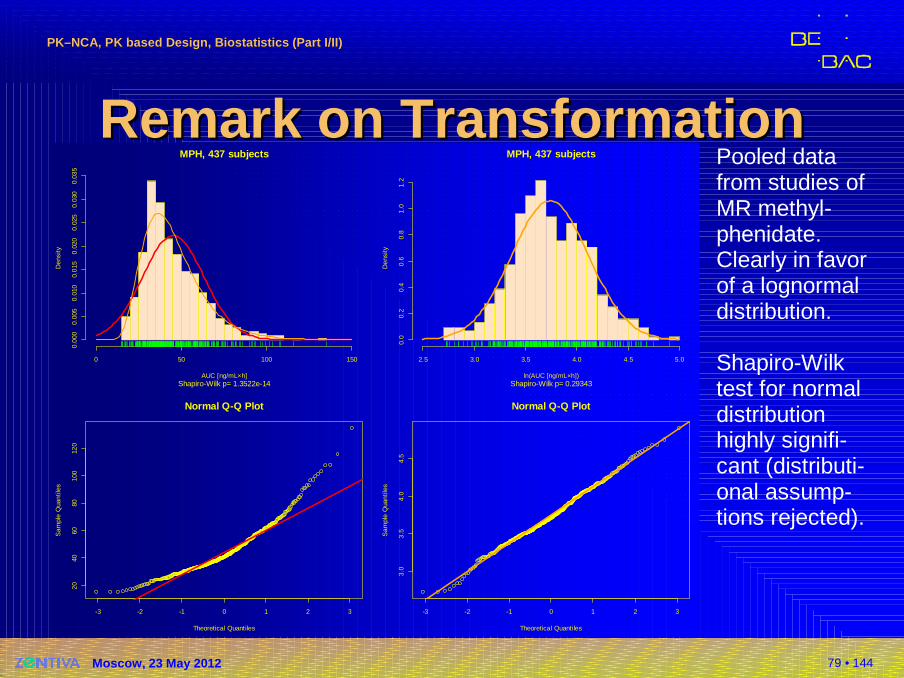
Remark on TransformationRemark on TransformationPooled data from studies of MR methyl-phenidate. Clearly in favorof a lognormal distribution.
Shapiro-Wilktest for normal distribution highly signifi-cant (distributi-onal assump-tions rejected).
MPH, 437 subjects
Shapiro-Wilk p= 1.3522e-14AUC [ng/mL×h]
Den
sity
0 50 100 150
0.00
00.
005
0.01
00.
015
0.02
00.
025
0.03
00.
035
MPH, 437 subjects
Shapiro-Wilk p= 0.29343ln(AUC [ng/mL×h])
Den
sity
2.5 3.0 3.5 4.0 4.5 5.0
0.0
0.2
0.4
0.6
0.8
1.0
1.2
-3 -2 -1 0 1 2 3
2040
6080
100
120
Normal Q-Q Plot
Theoretical Quantiles
Sam
ple
Qua
ntile
s
-3 -2 -1 0 1 2 3
3.0
3.5
4.0
4.5
Normal Q-Q Plot
Theoretical Quantiles
Sam
ple
Qua
ntile
s
80 • 144
PKPK––NCA, PK based Design, Biostatistics (Part I/II)NCA, PK based Design, Biostatistics (Part I/II)
Moscow, 23 May 2012
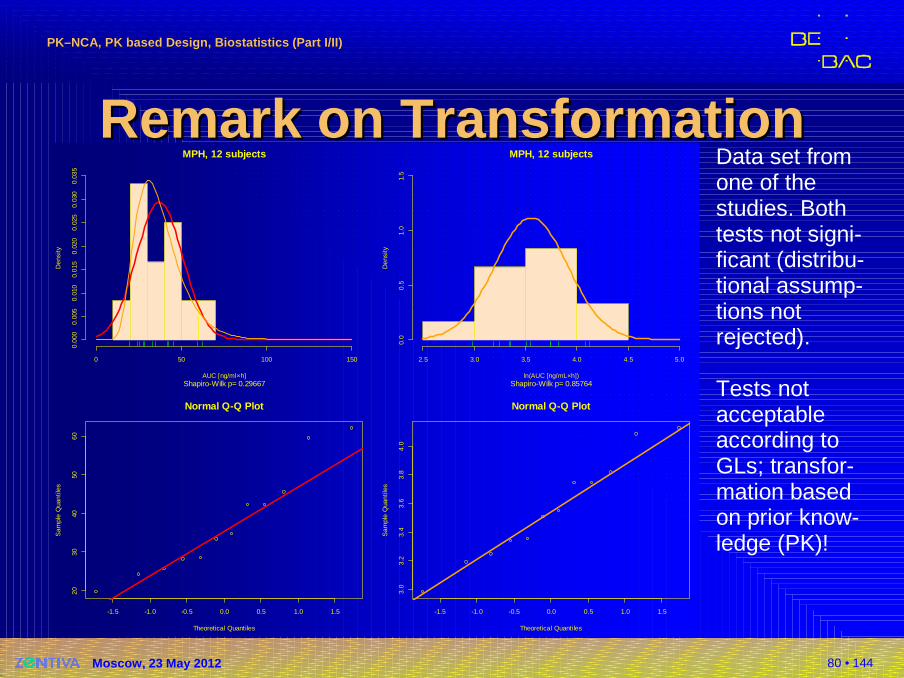
Remark on TransformationRemark on TransformationData set fromone of the studies. Both tests not signi-ficant (distribu-tional assump-tions notrejected).
Tests not acceptable according to GLs; transfor-mation basedon prior know-ledge (PK)!
MPH, 12 subjects
Shapiro-Wilk p= 0.29667AUC [ng/ml×h]
Den
sity
0 50 100 150
0.00
00.
005
0.01
00.
015
0.02
00.
025
0.03
00.
035
MPH, 12 subjects
Shapiro-Wilk p= 0.85764ln(AUC [ng/mL×h])
Den
sity
2.5 3.0 3.5 4.0 4.5 5.0
0.0
0.5
1.0
1.5
-1.5 -1.0 -0.5 0.0 0.5 1.0 1.5
2030
4050
60
Normal Q-Q Plot
Theoretical Quantiles
Sam
ple
Qua
ntile
s
-1.5 -1.0 -0.5 0.0 0.5 1.0 1.5
3.0
3.2
3.4
3.6
3.8
4.0
Normal Q-Q Plot
Theoretical Quantiles
Sam
ple
Qua
ntile
s
81 • 144
PKPK––NCA, PK based Design, Biostatistics (Part I/II)NCA, PK based Design, Biostatistics (Part I/II)
Moscow, 23 May 2012
GlobalGlobal HarmonizationHarmonization ??
Transformations (e.g. […], logarithm) should be speci-fied in the protocol and a rationale provided […]. The general principles guiding the use of transformations toensure that the assumptions underlying the statistical methods are met are to be found in standard texts […].In the choice of statistical methods due attention should be paid to the statistical distribution […]. When making this choice (for example between parametric and non-parametric methods) it is important to bear in mind the need to provide statistical estimates of the size of treat-ment effects together with confidence intervals […].
ICH Topic E 9Statistical Principles for Clinical Trials (1998)
82 • 144
PKPK––NCA, PK based Design, Biostatistics (Part I/II)NCA, PK based Design, Biostatistics (Part I/II)
Moscow, 23 May 2012
GlobalGlobal HarmonizationHarmonization ??
No analysis is complete until the assumptions that have been made in the modeling have been checked. Among the assumptions are that the repeated measurementson each subject are independent, normally distributed random variables with equal variances. Perhaps the most important advantage of formally fitting a linearmodel is that diagnostic information on the validity of the assumed model can be obtained. These assumptions can be most easily checked by analyzing the residuals.
Jones B and MG KenwardDesign and Analysis of Cross-Over TrialsChapman & Hall, Boca Raton (2nd ed 2003)
83 • 144
PKPK––NCA, PK based Design, Biostatistics (Part I/II)NCA, PK based Design, Biostatistics (Part I/II)
Moscow, 23 May 2012
NonparametricsNonparametrics
The limited sample size in a typical BE study precludesa reliable determination of the distribution of the data set. Sponsors and/or applicants are not encouraged to test for normality of error distribution after log-transform-ation […].
FDA, Center for Drug Evaluation and Research (CDER)Guidance for Industry: Statistical Approaches to Establishing Bioequivalence (2001)
But: acceptable inTurkey (MOH, November 2005)Saudia Arabia (SFDA, May 2005)Japan (NIHS, November 2006)
84 • 144
PKPK––NCA, PK based Design, Biostatistics (Part I/II)NCA, PK based Design, Biostatistics (Part I/II)
Moscow, 23 May 2012
NonparametricsNonparametrics
5. In which cases may a non-parametric statistical m odelbe used?
The NfG states under 3.6.1–Statistical analysis: “AUC and Cmaxshould be analysed using ANOVA after log transformation.”The reasons for this request are the following:
a) the AUC and Cmax values as biological parameters are usually not normally distributed;
b) a multiplicative model may be plausible;c) after log transformation the distribution may allow a parametric
analysis.
Comments:a) – true b) – true c) – maybe, but may also terribly fail
EMEA/CHMP/EWP/40326/2006Questions & Answers on the BA and BE Guideline (2006)
85 • 144
PKPK––NCA, PK based Design, Biostatistics (Part I/II)NCA, PK based Design, Biostatistics (Part I/II)
Moscow, 23 May 2012
NonparametricsNonparametrics
5. In which cases may a non-parametric statistical m odelbe used?
However, the true distribution in a pharmacokinetic data set usually cannot be characterised due to the small sample size, so it is not recommended to have the analysis strategy depend on a pre-test for normality. Parametric testing using ANOVA on log-transformed data should be the rule. Results from non-parametric statistical methods or other statistical approaches are nevertheless welcomeas sensitivity analyses. Such analyses can provide reassurance that conclusions from the experiment are robust against violations of the assumptions underlying the analysis strategy.Comment: It is well known that the efficiency of e.g., the Wilcoxon-Mann-
Whitney test for normal distributed data is 3/π ≈ 95.5 %; for not normal distributed data the efficiency is >100 %!
86 • 144
PKPK––NCA, PK based Design, Biostatistics (Part I/II)NCA, PK based Design, Biostatistics (Part I/II)
Moscow, 23 May 2012
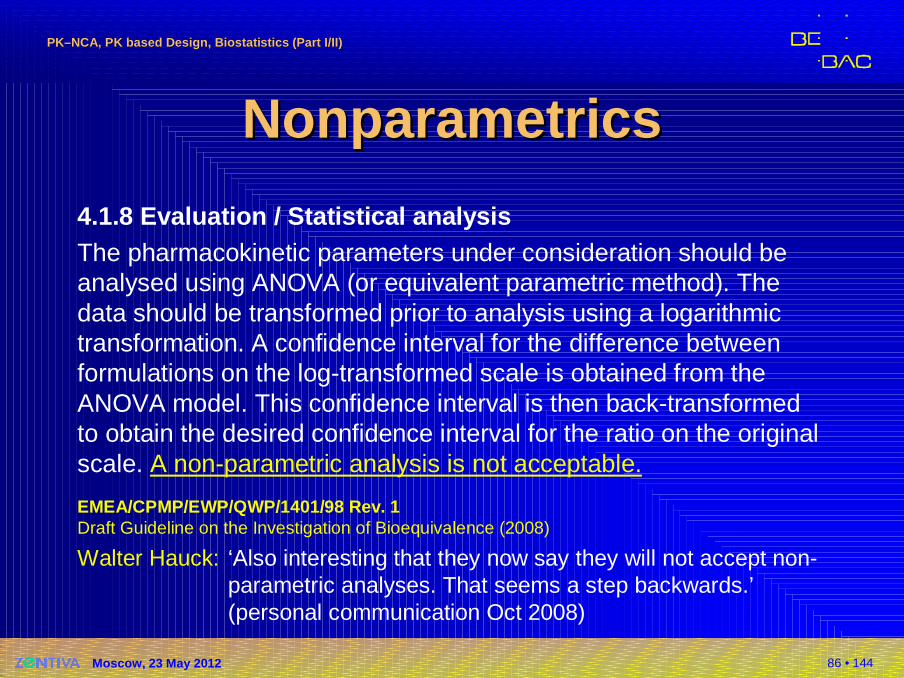
NonparametricsNonparametrics
4.1.8 Evaluation / Statistical analysisThe pharmacokinetic parameters under consideration should be analysed using ANOVA (or equivalent parametric method). The data should be transformed prior to analysis using a logarithmictransformation. A confidence interval for the difference betweenformulations on the log-transformed scale is obtained from the ANOVA model. This confidence interval is then back-transformed to obtain the desired confidence interval for the ratio on the original scale. A non-parametric analysis is not acceptable.
EMEA/CPMP/EWP/QWP/1401/98 Rev. 1Draft Guideline on the Investigation of Bioequivalence (2008)
Walter Hauck: ‘Also interesting that they now say they will not accept non-parametric analyses. That seems a step backwards.’(personal communication Oct 2008)
87 • 144
PKPK––NCA, PK based Design, Biostatistics (Part I/II)NCA, PK based Design, Biostatistics (Part I/II)
Moscow, 23 May 2012
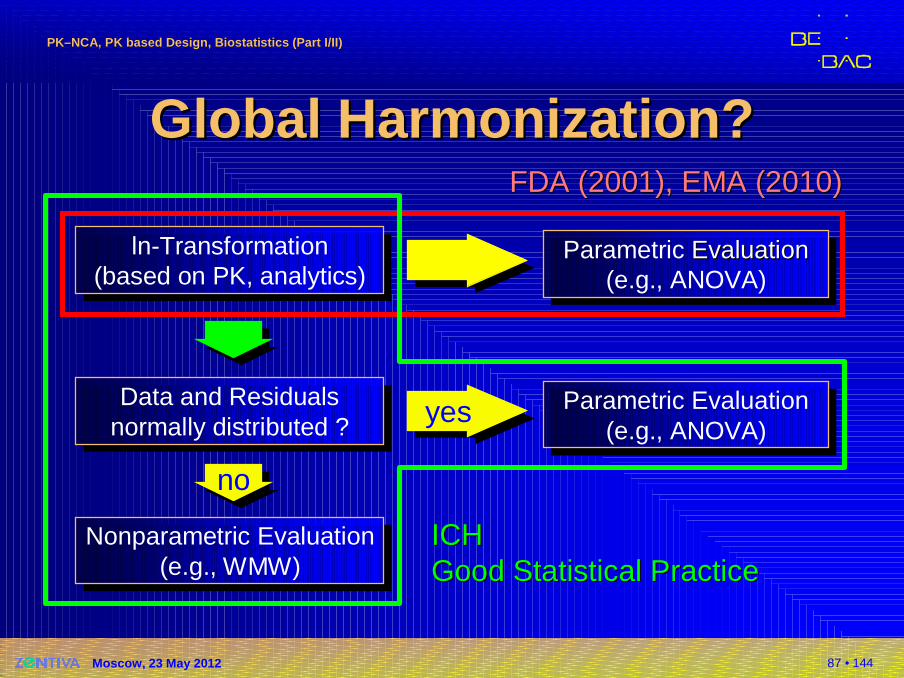
ln-Transformation(based on PK, analytics)
ln-Transformation(based on PK, analytics)
GlobalGlobal HarmonizationHarmonization ??
Parametric Evaluation(e.g., ANOVA)
Parametric EvaluationEvaluation(e.g., ANOVA)
yesyesData and Residualsnormally distributed ?
Data and Residualsnormally distributed ?
nono
Parametric Evaluation(e.g., ANOVA)
Parametric Evaluation(e.g., ANOVA)
Nonparametric Evaluation(e.g., WMW)
Nonparametric Evaluation(e.g., WMW)
FDA (2001)FDA (2001), EMA (2010), EMA (2010)
ICHICHGoodGood Statistical PracticeStatistical Practice
88 • 144
PKPK––NCA, PK based Design, Biostatistics (Part I/II)NCA, PK based Design, Biostatistics (Part I/II)
Moscow, 23 May 2012
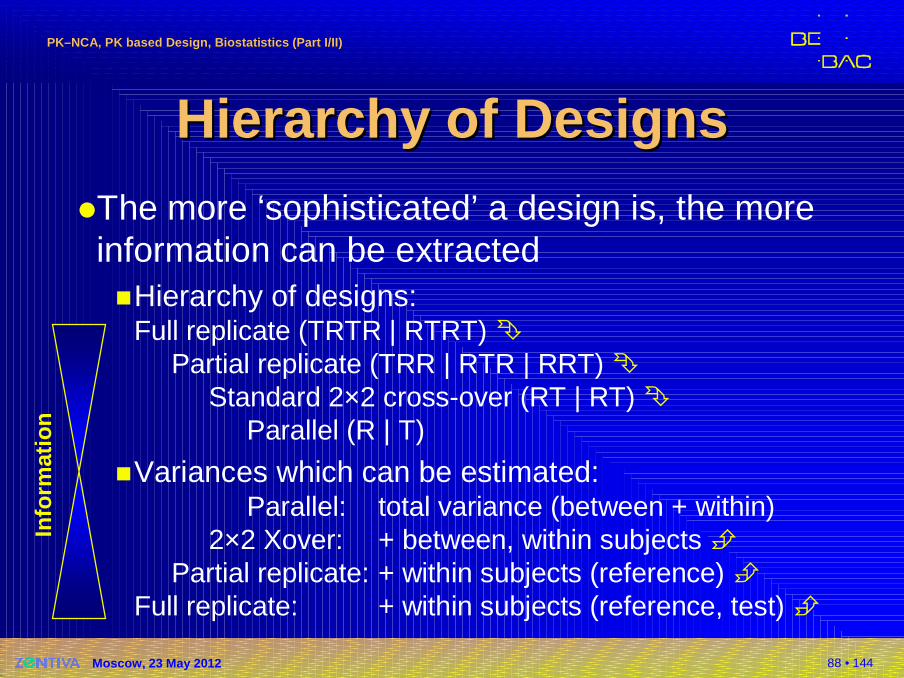
Hierarchy Hierarchy of Designsof Designs�The more ‘sophisticated’ a design is, the more information can be extracted�Hierarchy of designs:
Full replicate (TRTR | RTRT) �Partial replicate (TRR | RTR | RRT) �
Standard 2×2 cross-over (RT | RT) �Parallel (R | T)
�Variances which can be estimated:Parallel: total variance (between + within)
2×2 Xover: + between, within subjects �Partial replicate: + within subjects (reference) �
Full replicate: + within subjects (reference, test) �
Info
rmat
ion
89 • 144
PKPK––NCA, PK based Design, Biostatistics (Part I/II)NCA, PK based Design, Biostatistics (Part I/II)
Moscow, 23 May 2012
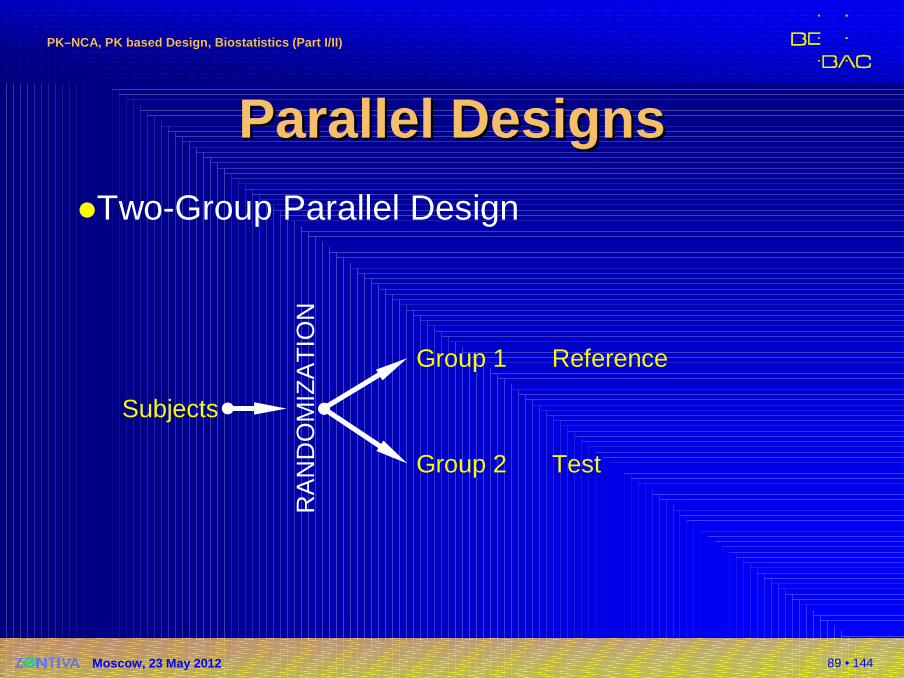
Parallel DesignsParallel Designs�Two-Group Parallel Design
Subjects
RA
ND
OM
IZA
TIO
N
Group 1
Group 2
Reference
Test
90 • 144
PKPK––NCA, PK based Design, Biostatistics (Part I/II)NCA, PK based Design, Biostatistics (Part I/II)
Moscow, 23 May 2012
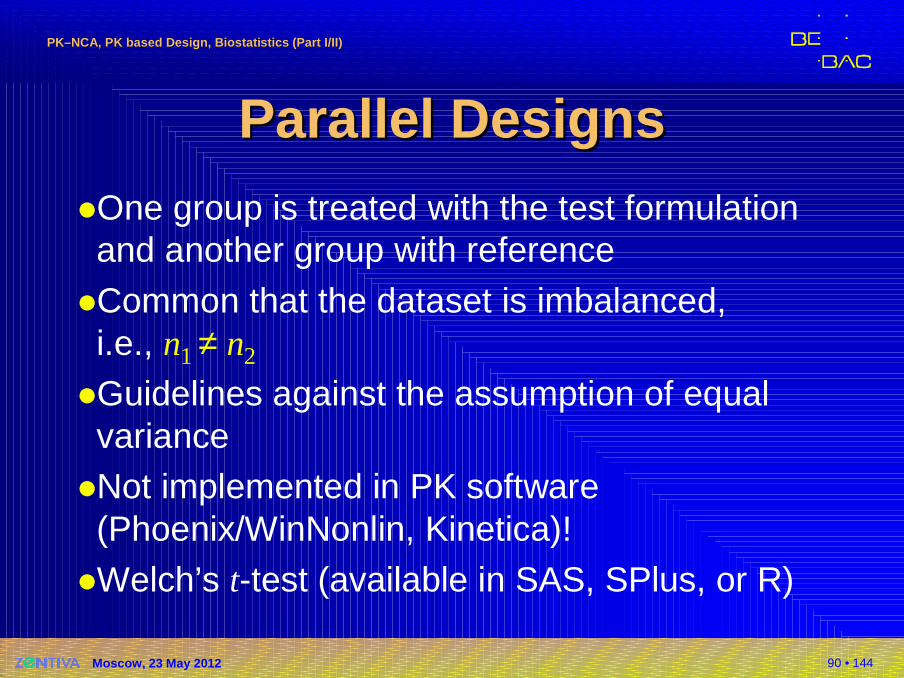
Parallel DesignsParallel Designs�One group is treated with the test formulationand another group with reference
�Common that the dataset is imbalanced,i.e., n1 ≠ n2
�Guidelines against the assumption of equal variance
�Not implemented in PK software (Phoenix/WinNonlin, Kinetica)!
�Welch’s t-test (available in SAS, SPlus, or R)
91 • 144
PKPK––NCA, PK based Design, Biostatistics (Part I/II)NCA, PK based Design, Biostatistics (Part I/II)
Moscow, 23 May 2012
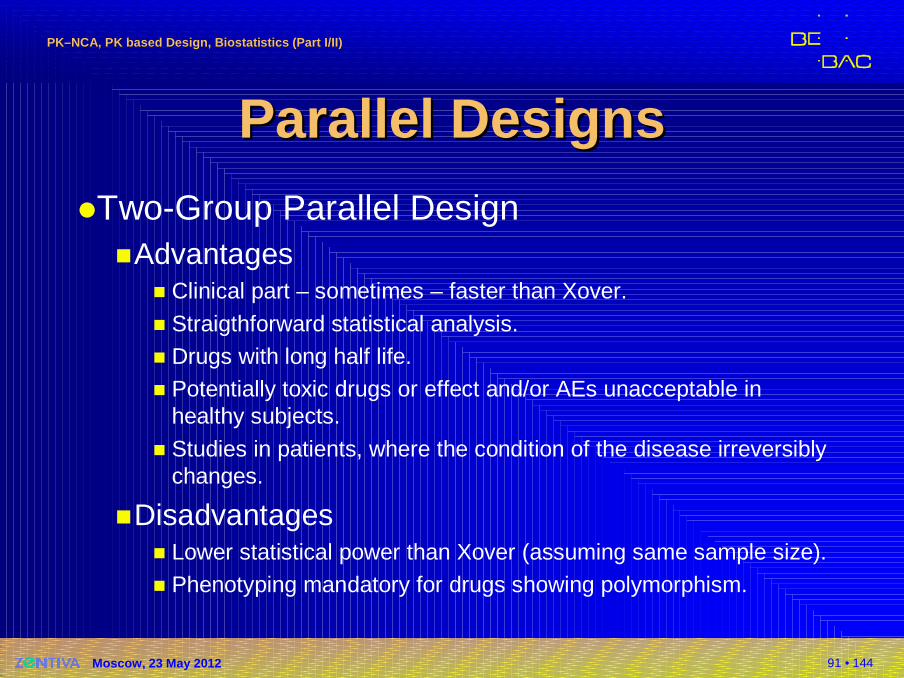
Parallel DesignsParallel Designs�Two-Group Parallel Design
�Advantages� Clinical part – sometimes – faster than Xover.
� Straigthforward statistical analysis.� Drugs with long half life.� Potentially toxic drugs or effect and/or AEs unacceptable in
healthy subjects.
� Studies in patients, where the condition of the disease irreversibly changes.
�Disadvantages� Lower statistical power than Xover (assuming same sample size).� Phenotyping mandatory for drugs showing polymorphism.

92 • 144
PKPK––NCA, PK based Design, Biostatistics (Part I/II)NCA, PK based Design, Biostatistics (Part I/II)
Moscow, 23 May 2012
CrossCross --over over DDesignesign ss�Standard 2×2×2 Design
Subjects
RA
ND
OM
IZA
TIO
N
Sequence 1
Sequence 2
Period
I II
Reference
Test WA
SH
OU
T Test
Reference
93 • 144
PKPK––NCA, PK based Design, Biostatistics (Part I/II)NCA, PK based Design, Biostatistics (Part I/II)
Moscow, 23 May 2012
Xover Xover DDesignsesigns ((cont’dcont’d ))
�Every subject is treated once with both test andreference.
�Subjects are randomized into two groups; one is receiving formulations in the order RT and the other one in the order TR.These two orders are called sequences.
�Whilst in a paired design we must rely on the assumption that no external influences affect the periods, a cross-over design will account for that.
94 • 144
PKPK––NCA, PK based Design, Biostatistics (Part I/II)NCA, PK based Design, Biostatistics (Part I/II)
Moscow, 23 May 2012
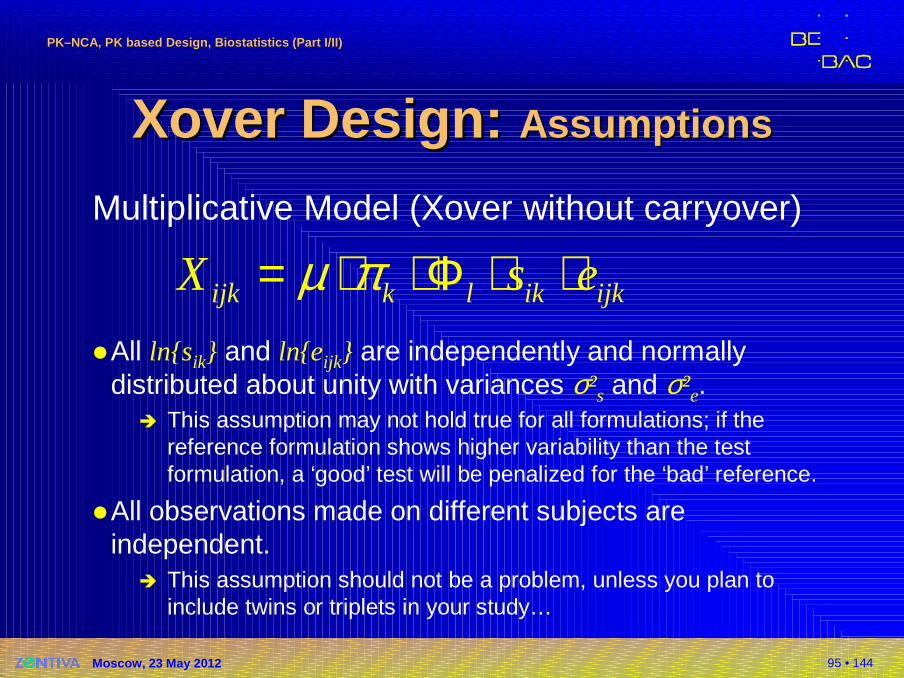
Xover DesignXover Design :: ModelModel
Multiplicative Model (Xover without carryover)
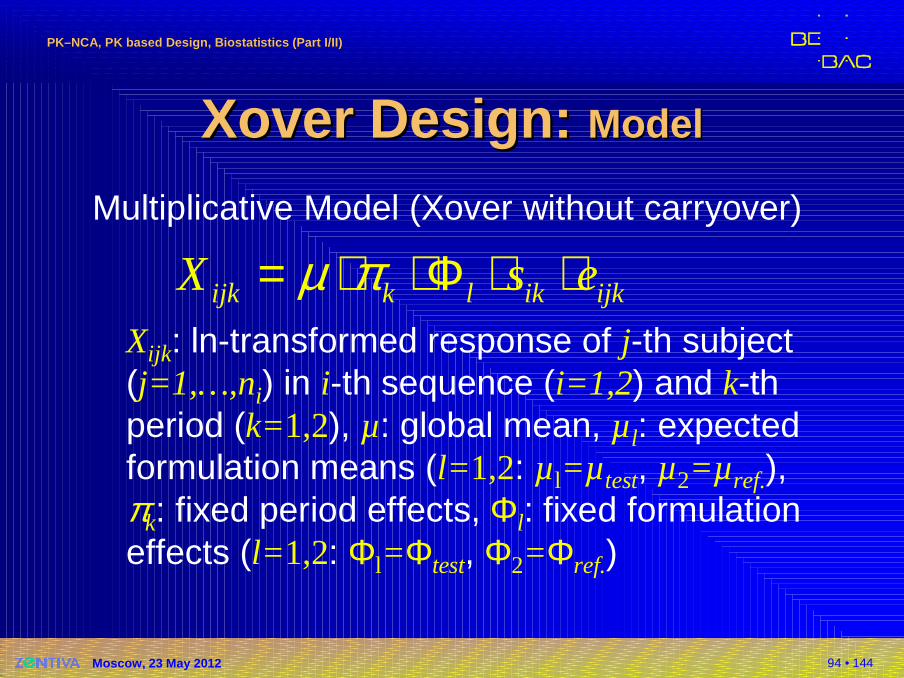
Xijk: ln-transformed response of j-th subject(j=1,…,ni) in i-th sequence (i=1,2) and k-th period (k=1,2), µ: global mean, µl: expected formulation means (l= 1,2: µl=µ test, µ2=µ ref.),πk: fixed period effects, Φl: fixed formulation effects (l= 1,2: Φl=Φtest, Φ2=Φref.)
ijk k l ik ijkX s eµ π= ⋅ ⋅Φ ⋅ ⋅
95 • 144
PKPK––NCA, PK based Design, Biostatistics (Part I/II)NCA, PK based Design, Biostatistics (Part I/II)
Moscow, 23 May 2012
Xover Design: Xover Design: AssumptionsAssumptions
Multiplicative Model (Xover without carryover)
�All ln{sik} and ln{eijk} are independently and normally distributed about unity with variances σ²s and σ²e.
� This assumption may not hold true for all formulations; if the reference formulation shows higher variability than the testformulation, a ‘good’ test will be penalized for the ‘bad’ reference.
�All observations made on different subjects areindependent.
� This assumption should not be a problem, unless you plan toinclude twins or triplets in your study…
ijk k l ik ijkX s eµ π= ⋅ ⋅Φ ⋅ ⋅
96 • 144
PKPK––NCA, PK based Design, Biostatistics (Part I/II)NCA, PK based Design, Biostatistics (Part I/II)
Moscow, 23 May 2012
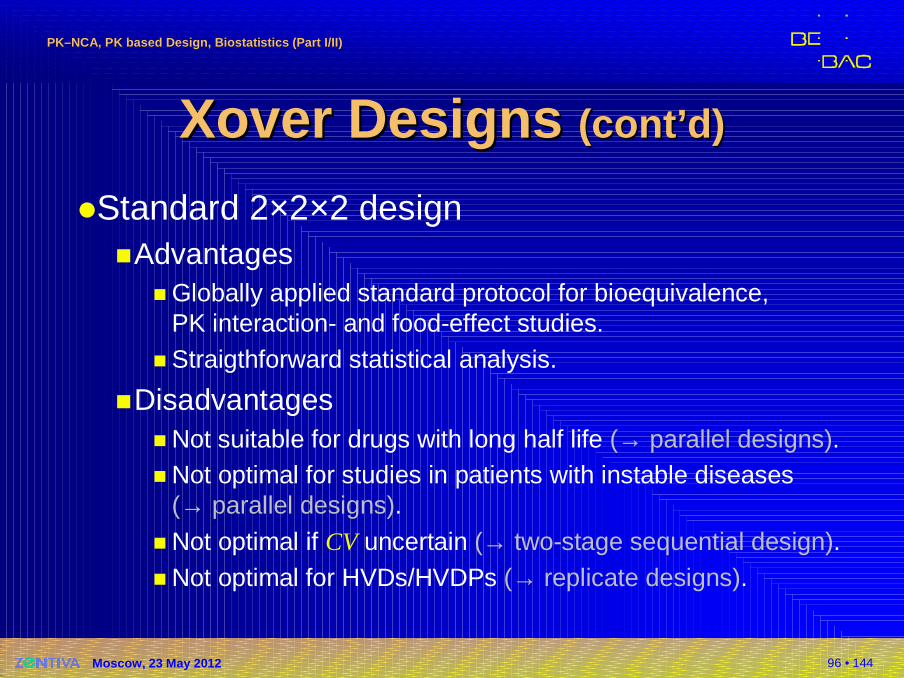
Xover Xover DDesignsesigns ((cont’dcont’d ))
�Standard 2×2×2 design�Advantages
� Globally applied standard protocol for bioequivalence,PK interaction- and food-effect studies.
� Straigthforward statistical analysis.
�Disadvantages� Not suitable for drugs with long half life (→ parallel designs).� Not optimal for studies in patients with instable diseases
(→ parallel designs).� Not optimal if CV uncertain (→ two-stage sequential design).� Not optimal for HVDs/HVDPs (→ replicate designs).
97 • 144
PKPK––NCA, PK based Design, Biostatistics (Part I/II)NCA, PK based Design, Biostatistics (Part I/II)
Moscow, 23 May 2012
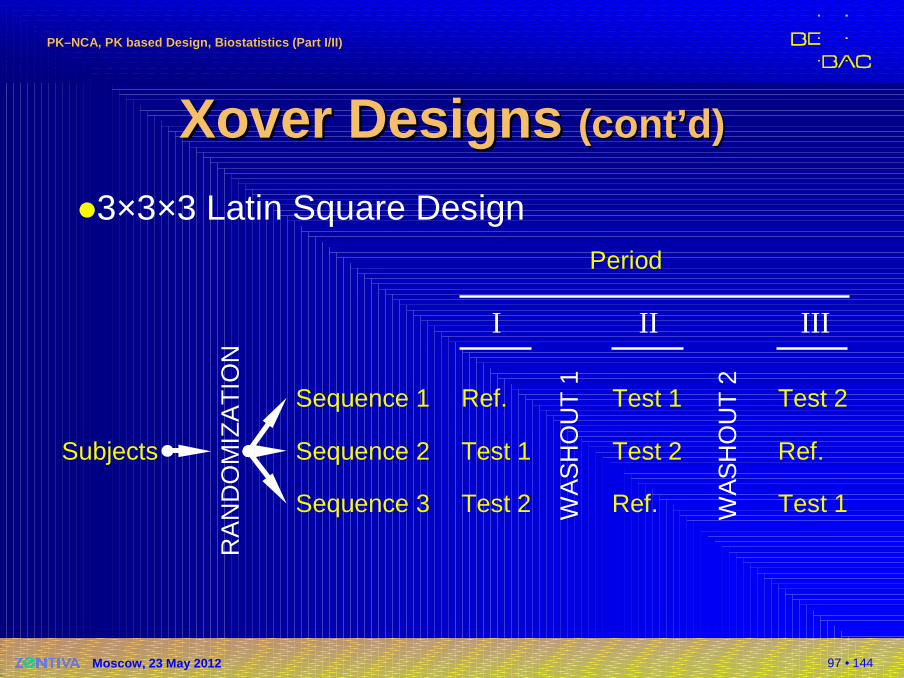
Xover Xover DDesignsesigns (cont’d)(cont’d)
�3×3×3 Latin Square Design
Subjects
RA
ND
OM
IZA
TIO
N
Sequence 1
Sequence 2
Period
I II
Ref.
Test 1
WA
SH
OU
T 1
Test 1
Test 2
Sequence 3 Test 2 Ref. WA
SH
OU
T 2
Test 2
Ref.
Test 1
III
98 • 144
PKPK––NCA, PK based Design, Biostatistics (Part I/II)NCA, PK based Design, Biostatistics (Part I/II)
Moscow, 23 May 2012
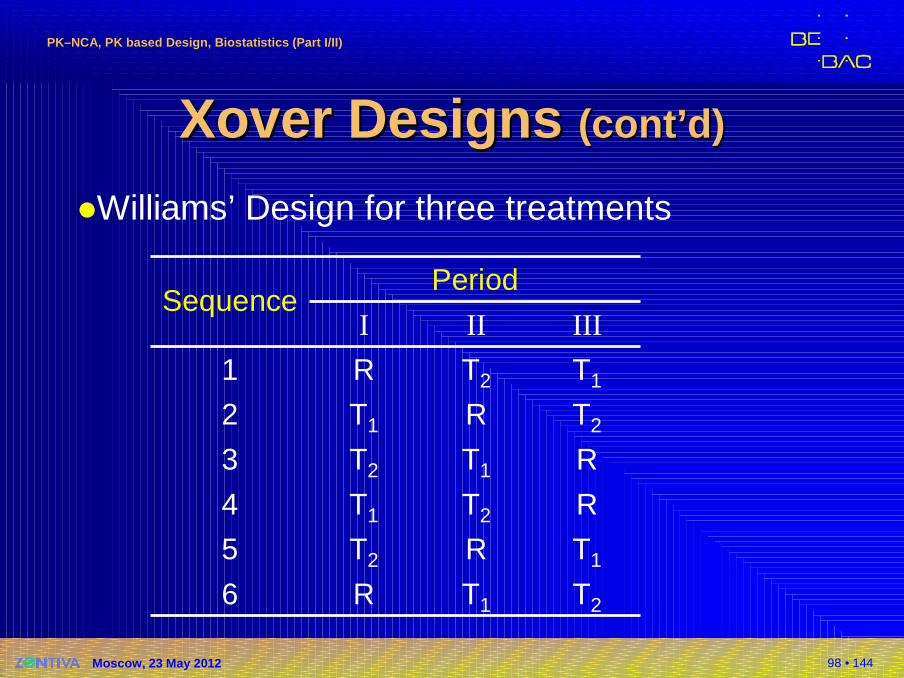
Xover Xover DDesignsesigns (cont’d)(cont’d)
�Williams’ Design for three treatments
T2T1R6
T1RT25
RT2T14
RT1T23
T2RT12
T1T2R1
IIIIII
PeriodSequence
99 • 144
PKPK––NCA, PK based Design, Biostatistics (Part I/II)NCA, PK based Design, Biostatistics (Part I/II)
Moscow, 23 May 2012
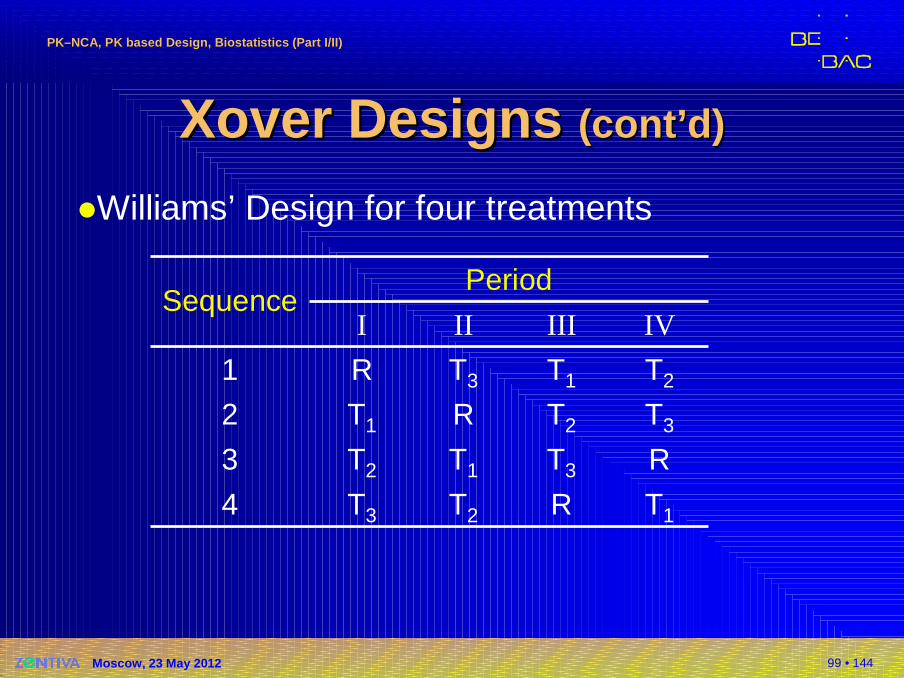
Xover Xover DDesignsesigns ((cont’dcont’d ))
�Williams’ Design for four treatments
T1
R
T3
T2
IV
RT2T34
T3T1T23
T2RT12
T1T3R1
IIIIII
PeriodSequence
100 • 144
PKPK––NCA, PK based Design, Biostatistics (Part I/II)NCA, PK based Design, Biostatistics (Part I/II)
Moscow, 23 May 2012
HVDs / HVDPsHVDs / HVDPs�For Highly Variable Drugs / Drug Products(HVDs/HVDPs) it may be almost impossibleto show BE with a reasonable sample size.
�The common 2×2 Xover assumes Indepen-dent Identically Distributions (IID), which may not hold.If e.g., the variability of the reference is higher than the one of the test, one obtains a high common (pooled) variance and the test will be penalized for the ‘bad’ reference.
101 • 144
PKPK––NCA, PK based Design, Biostatistics (Part I/II)NCA, PK based Design, Biostatistics (Part I/II)
Moscow, 23 May 2012
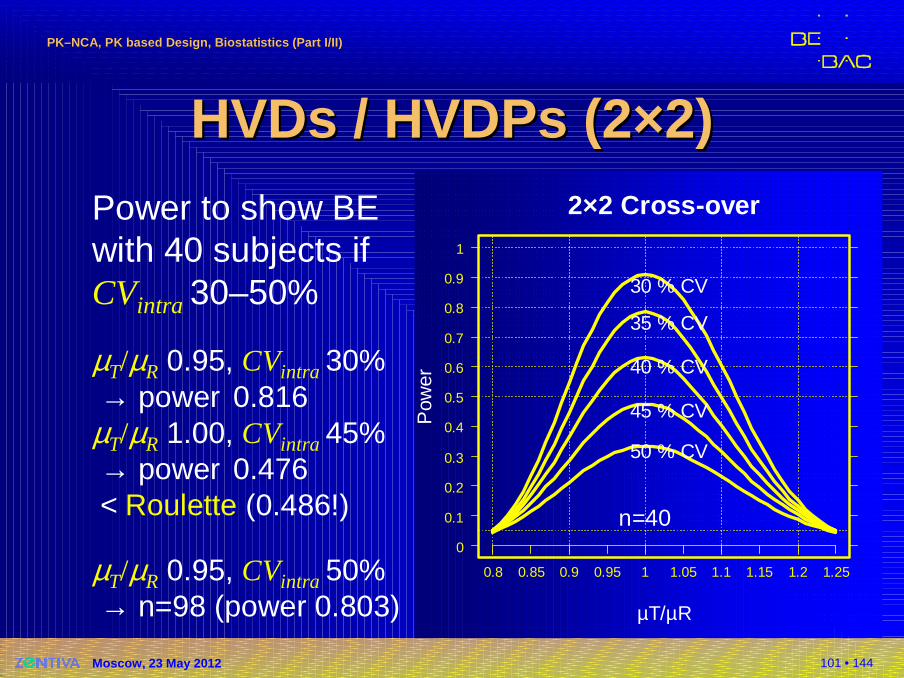
HVDs / HVDPs (2×2)HVDs / HVDPs (2×2)Power to show BEwith 40 subjects if CVintra 30–50%
µT/µR 0.95, CVintra 30% → power 0.816
µT/µR 1.00, CVintra 45% → power 0.476 < Roulette (0.486!)
µT/µR 0.95, CVintra 50% → n=98 (power 0.803)
2×2 Cross-over
µT/µR
Pow
er
n=40
0.8 0.85 0.9 0.95 1 1.05 1.1 1.15 1.2 1.25
0
0.1
0.2
0.3
0.4
0.5
0.6
0.7
0.8
0.9
1
30 % CV
35 % CV
40 % CV
45 % CV
50 % CV
102 • 144
PKPK––NCA, PK based Design, Biostatistics (Part I/II)NCA, PK based Design, Biostatistics (Part I/II)
Moscow, 23 May 2012
HVDs / HVDPs (2×2)HVDs / HVDPs (2×2)∆ ∆
CI of ∆ CI of ∆
LLLL UL UL
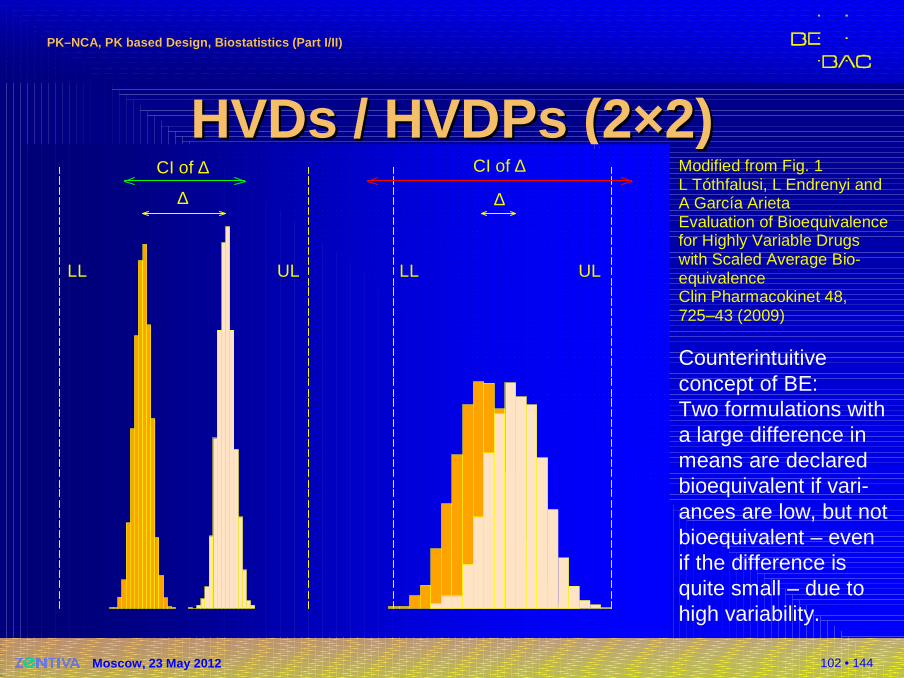
Modified from Fig. 1L Tóthfalusi, L Endrenyi and A García ArietaEvaluation of Bioequivalencefor Highly Variable Drugs with Scaled Average Bio-equivalenceClin Pharmacokinet 48,725–43 (2009)
Counterintuitive concept of BE:Two formulations witha large difference in means are declared bioequivalent if vari-ances are low, but not bioequivalent – even if the difference is quite small – due to high variability.
103 • 144
PKPK––NCA, PK based Design, Biostatistics (Part I/II)NCA, PK based Design, Biostatistics (Part I/II)
Moscow, 23 May 2012
ReplicateReplicate Xover DesignsXover Designs�Each subject is randomly assigned to sequences, where at least one of the treat-ments is administered at least twice.�Not only the global within-subject variability, but
also the within-subject variability per treatment may be estimated.
�Smaller subject numbers compared to a standard2×2×2 design – but outweighed by an increased number of periods.Note: Similar overall number of administered treat-ments!
104 • 144
PKPK––NCA, PK based Design, Biostatistics (Part I/II)NCA, PK based Design, Biostatistics (Part I/II)
Moscow, 23 May 2012
ReplicateReplicate Xover DesignsXover Designs�Two-sequence three-period*)
TRTRTR
�Two-sequence four-period*)
TRTRRTRT
*) Recommended designs:László TóthfalusiScaled Average Bioequivalence to Evaluate Bioequivalence of Highly Variable DrugsDissolution Testing, Bioavailability & Bioequivalence ConferenceBudapest, May 24th, 2007
105 • 144
PKPK––NCA, PK based Design, Biostatistics (Part I/II)NCA, PK based Design, Biostatistics (Part I/II)
Moscow, 23 May 2012
ReplicateReplicate Xover DesignsXover Designs�… and many others (examples)
�Two-period�TT | RR | RT | TR
Balaam’s design: not recommended by the FDA – but stated in ANVISA’s GL
�Three-period�TRR | RTR�TRR | RTR | RRT
FDA’s partial replicate design
�Four-period�TTRR | RRTT�TRTR | RTRT | TTRR | RRTT
completely randomized
106 • 144
PKPK––NCA, PK based Design, Biostatistics (Part I/II)NCA, PK based Design, Biostatistics (Part I/II)
Moscow, 23 May 2012
ReplicateReplicate Xover DesignsXover Designs�Required for
� Reference-scaled average bioequivalence for AUC and Cmax
(FDA: RSABE)
� Average BE with expanding limits for Cmax (EMA 2010: ABEL)� Widening of the AR to 75–133% for Cmax (EMEA’s 2001 NfG,
Q&A document 2006)
�Advantages� Some experience from FDA’s initiative on Population Bioequi-
valence (PBE) and Individual Bioequivalence (IBE)
� Mentioned in RSA’s GL; FDA’s API-specific GLs and EMA� Scaling of different metrics acceptable in some countries (FDA
and RSA: AUC and Cmax, EMA: Cmax only)
� Handling of outliers (Subject-by-Formulation Interaction may be ruled out).
107 • 144
PKPK––NCA, PK based Design, Biostatistics (Part I/II)NCA, PK based Design, Biostatistics (Part I/II)
Moscow, 23 May 2012
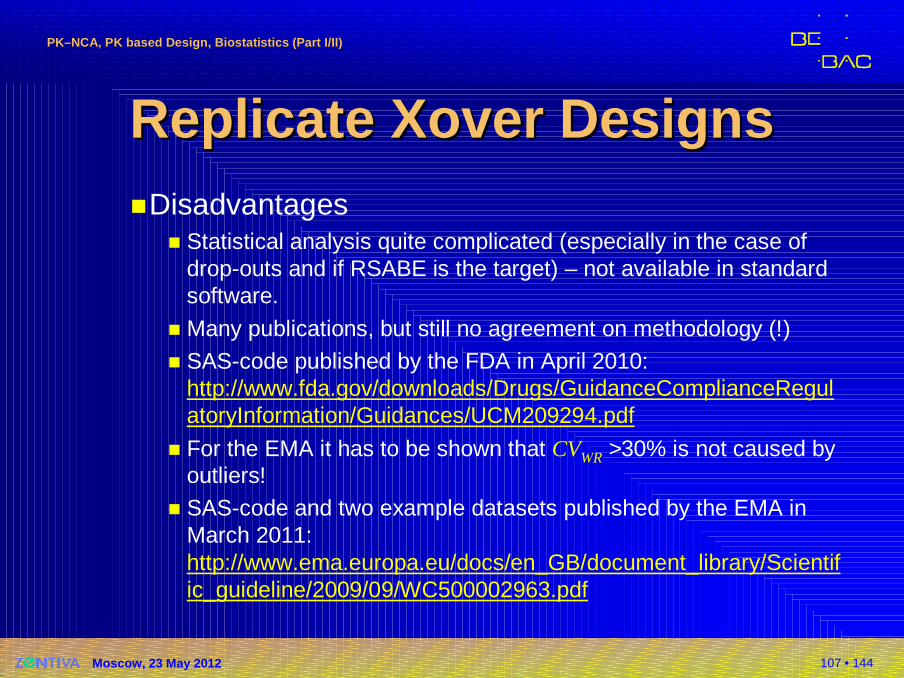
ReplicateReplicate Xover DesignsXover Designs�Disadvantages
� Statistical analysis quite complicated (especially in the case of drop-outs and if RSABE is the target) – not available in standardsoftware.
� Many publications, but still no agreement on methodology (!)� SAS-code published by the FDA in April 2010:
http://www.fda.gov/downloads/Drugs/GuidanceComplianceRegulatoryInformation/Guidances/UCM209294.pdf
� For the EMA it has to be shown that CVWR >30% is not caused by outliers!
� SAS-code and two example datasets published by the EMA in March 2011:http://www.ema.europa.eu/docs/en_GB/document_library/Scientific_guideline/2009/09/WC500002963.pdf
108 • 144
PKPK––NCA, PK based Design, Biostatistics (Part I/II)NCA, PK based Design, Biostatistics (Part I/II)
Moscow, 23 May 2012
BEBE EvaluationEvaluation�Based on the design set up a statistical model.
�Calculate the test/reference ratio.
�Calculate the 90% confidence interval (CI) around the ratio.
�The width of the CI depends on the variability observed in the study.
�The location of the CI depends on the observed test/reference-ratio.

109 • 144
PKPK––NCA, PK based Design, Biostatistics (Part I/II)NCA, PK based Design, Biostatistics (Part I/II)
Moscow, 23 May 2012
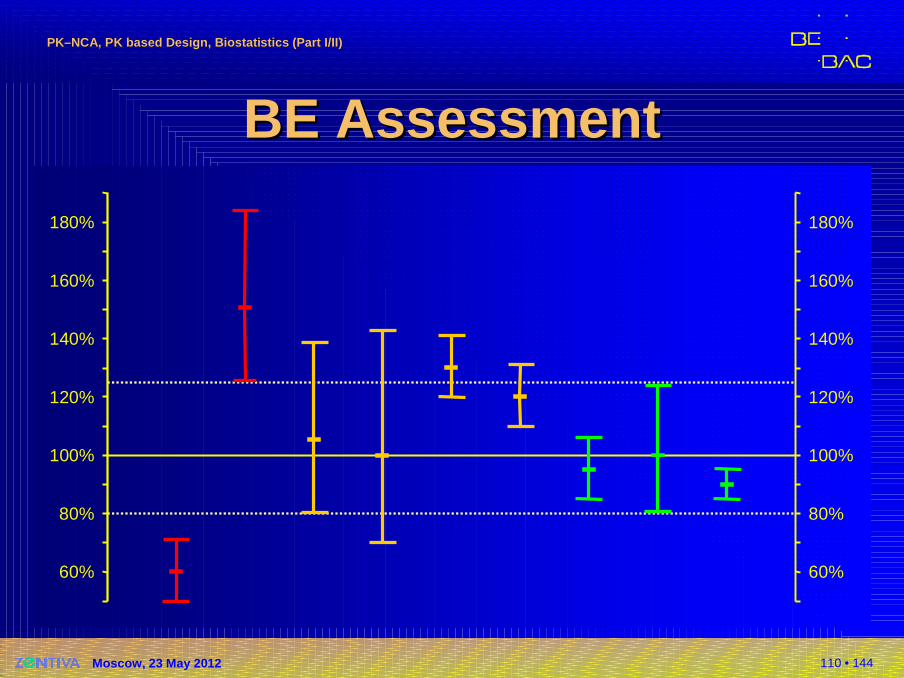
BEBE AssessmentAssessment�Decision rules based on the CI and the Acceptance Range (AR)�CI entirely outside the AR:
Bioinequivalence proven
�CI overlaps the AR (lies not entirely within the AR):Bioequivalence not proven
�CI lies entirely within the AR:Bioequivalence proven
110 • 144
PKPK––NCA, PK based Design, Biostatistics (Part I/II)NCA, PK based Design, Biostatistics (Part I/II)
Moscow, 23 May 2012
BEBE AssessmentAssessment
60%
80%
100%
120%
140%
160%
180%
60%
80%
100%
120%
140%
160%
180%
111 • 144
PKPK––NCA, PK based Design, Biostatistics (Part I/II)NCA, PK based Design, Biostatistics (Part I/II)
Moscow, 23 May 2012
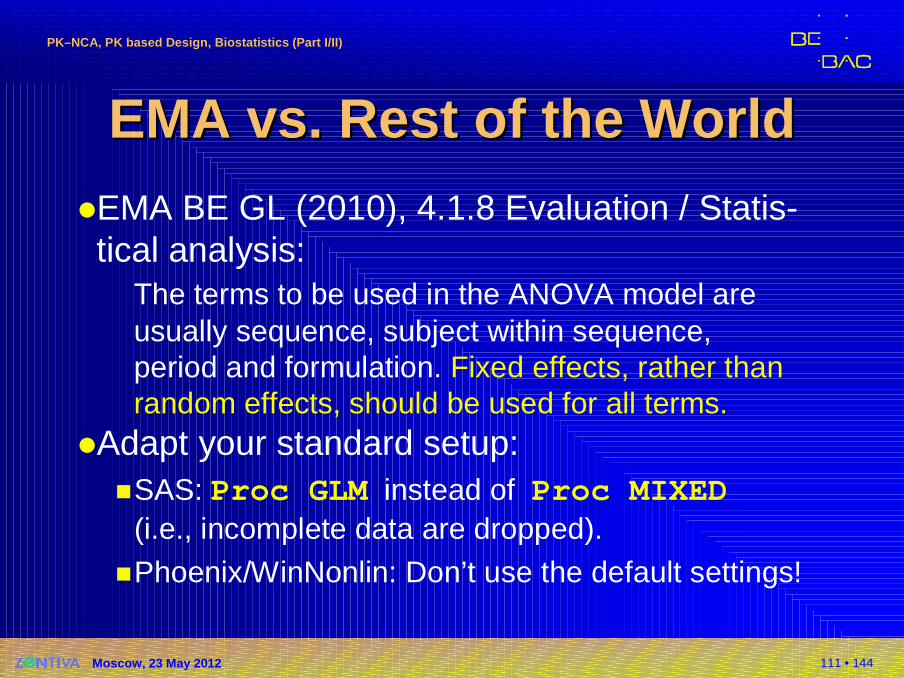
EMA EMA vs.vs. Rest of the WorldRest of the World�EMA BE GL (2010), 4.1.8 Evaluation / Statis-tical analysis:
The terms to be used in the ANOVA model are usually sequence, subject within sequence, period and formulation. Fixed effects, rather than random effects, should be used for all terms.
�Adapt your standard setup:�SAS: Proc GLM instead of Proc MIXED
(i.e., incomplete data are dropped).
�Phoenix/WinNonlin: Don’t use the default settings!
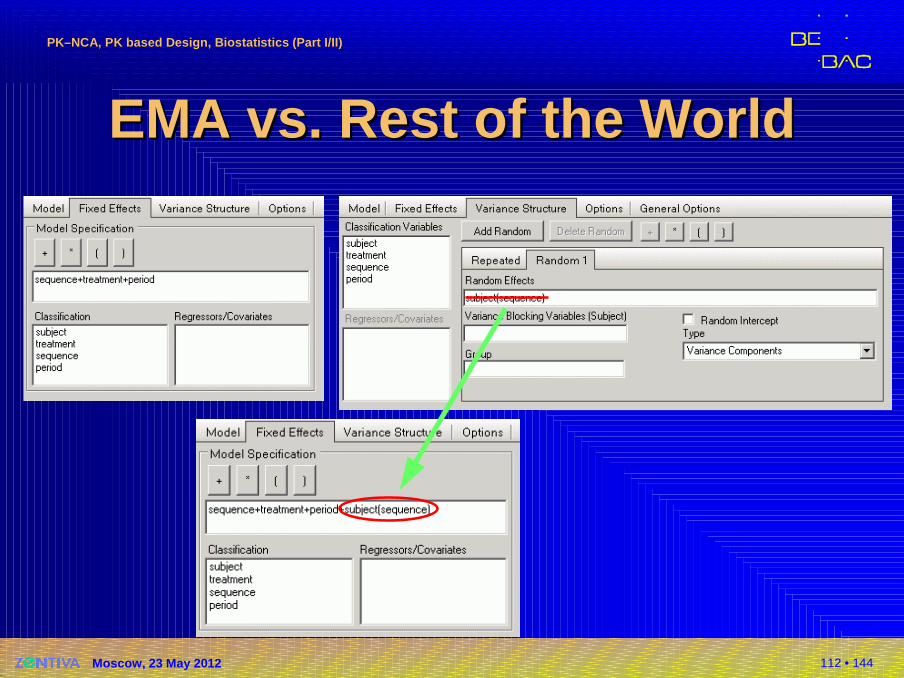
112 • 144
PKPK––NCA, PK based Design, Biostatistics (Part I/II)NCA, PK based Design, Biostatistics (Part I/II)
Moscow, 23 May 2012
EMA EMA vs.vs. Rest of the WorldRest of the World
113 • 144
PKPK––NCA, PK based Design, Biostatistics (Part I/II)NCA, PK based Design, Biostatistics (Part I/II)
Moscow, 23 May 2012
Sample Size EstimationSample Size Estimation�Introduction
�‘Classical’ sample size estimation in BE�Patient’s & producer’s risk�Power in study planning
�Details (→ day 2)
�Uncertainties in assumptions�Variability, Test/Reference-ratio�Sensitivity analysis
�Recent developments�Review of guidelines (Two-Stage Design, Replicates)
114 • 144
PKPK––NCA, PK based Design, Biostatistics (Part I/II)NCA, PK based Design, Biostatistics (Part I/II)
Moscow, 23 May 2012
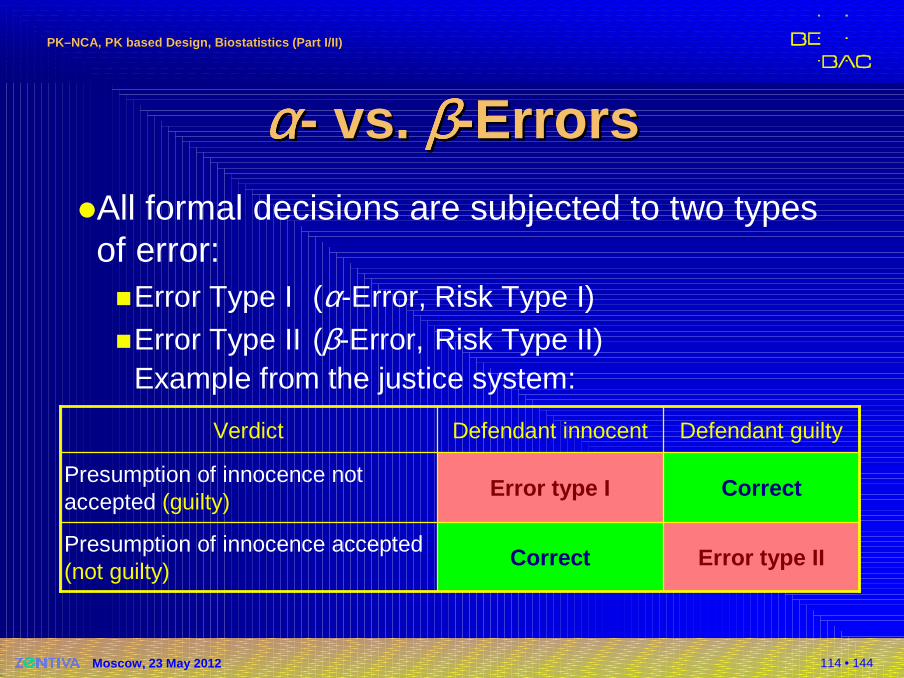
αααααααα-- vs.vs. ββββββββ--ErrorsErrors�All formal decisions are subjected to two typesof error:�Error Type I (α-Error, Risk Type I)�Error Type II (β-Error, Risk Type II)
Example from the justice system:
Error type IICorrectPresumption of innocence accepted(not guilty)
CorrectError type I Presumption of innocence not accepted (guilty)
Defendant guiltyDefendant innocentVerdict
115 • 144
PKPK––NCA, PK based Design, Biostatistics (Part I/II)NCA, PK based Design, Biostatistics (Part I/II)
Moscow, 23 May 2012
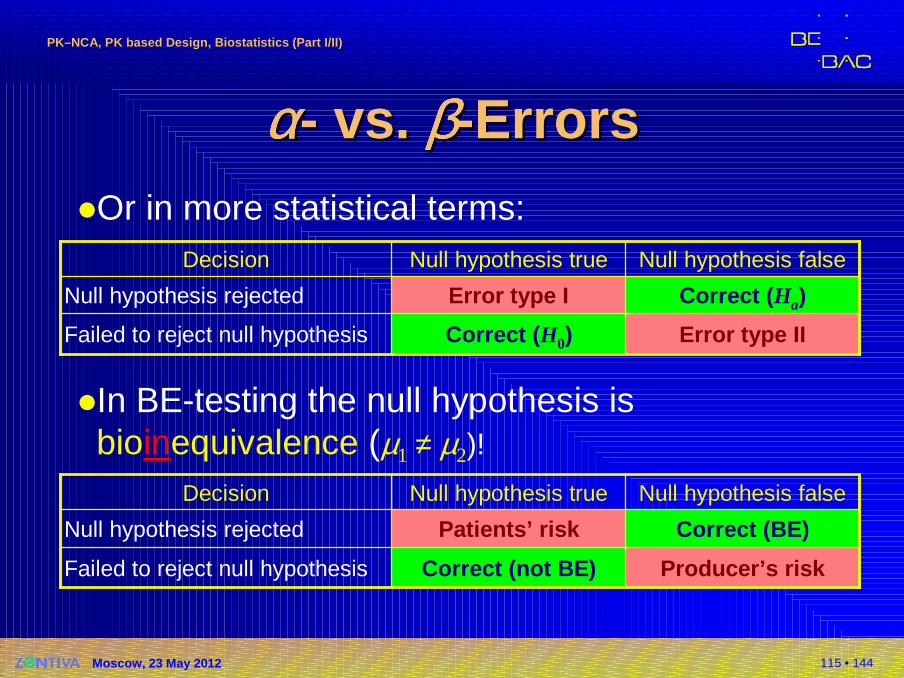
αααααααα-- vs.vs. ββββββββ--ErrorsErrors�Or in more statistical terms:
�In BE-testing the null hypothesis is bioinequivalence (µ1 ≠ µ2)!
Error type IICorrect ( H0)Failed to reject null hypothesis
Correct ( Ha)Error type I Null hypothesis rejected
Null hypothesis falseNull hypothesis trueDecision
Producer’s riskCorrect (not BE)Failed to reject null hypothesis
Correct (BE)Patients’ riskNull hypothesis rejected
Null hypothesis falseNull hypothesis trueDecision
116 • 144
PKPK––NCA, PK based Design, Biostatistics (Part I/II)NCA, PK based Design, Biostatistics (Part I/II)
Moscow, 23 May 2012
95% one-sided CI
particular patient
0.6 0.8 1 1.25 1.67
95% one-sided CI
particular patient
0.6 0.8 1 1.25 1.67
90% two-sided CI= two 95% one-sided
population of patients
0.6 0.8 1 1.25 1.67
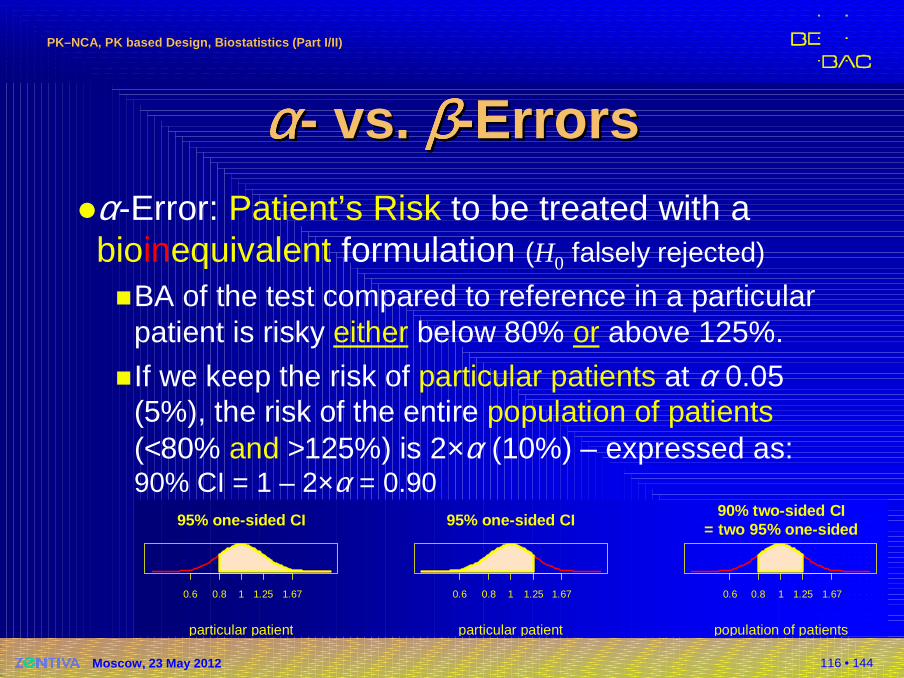
αααααααα-- vs.vs. ββββββββ--ErrorsErrors�α-Error: Patient’s Risk to be treated with a bioinequivalent formulation (H0 falsely rejected)
�BA of the test compared to reference in a particularpatient is risky either below 80% or above 125%.
�If we keep the risk of particular patients at α 0.05 (5%), the risk of the entire population of patients(<80% and >125%) is 2×α (10%) – expressed as:90% CI = 1 – 2×α = 0.90
117 • 144
PKPK––NCA, PK based Design, Biostatistics (Part I/II)NCA, PK based Design, Biostatistics (Part I/II)
Moscow, 23 May 2012
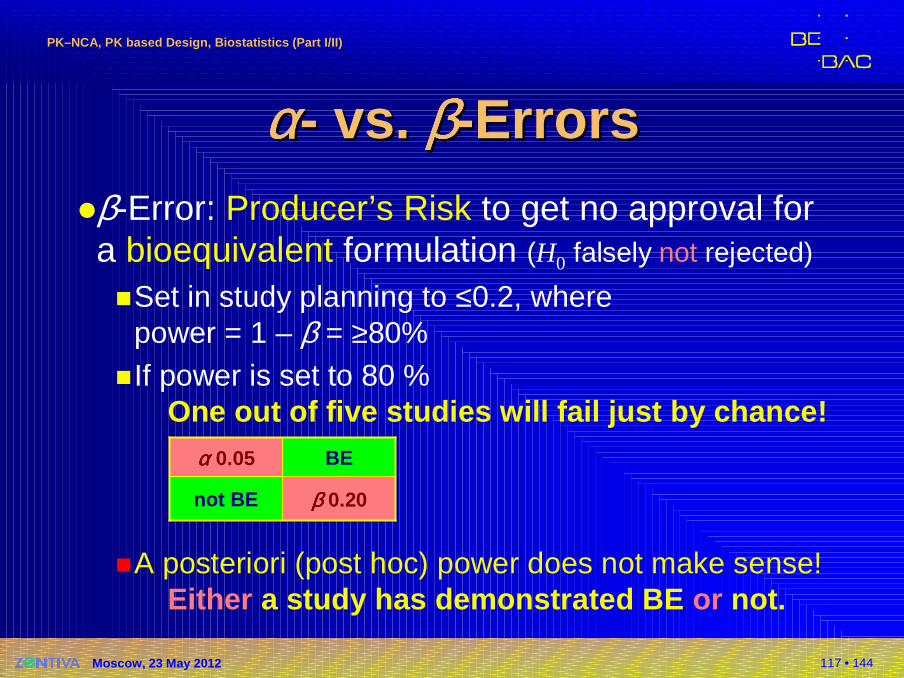
αααααααα-- vs.vs. ββββββββ--ErrorsErrors�β-Error: Producer’s Risk to get no approval fora bioequivalent formulation (H0 falsely not rejected)
�Set in study planning to ≤0.2, wherepower = 1 – β = ≥80%
�If power is set to 80 %One out of five studies will fail just by chance!
�A posteriori (post hoc) power does not make sense!Either a study has demonstrated BE or not.
ββββ 0.20not BE
BEαααα 0.05
118 • 144
PKPK––NCA, PK based Design, Biostatistics (Part I/II)NCA, PK based Design, Biostatistics (Part I/II)
Moscow, 23 May 2012
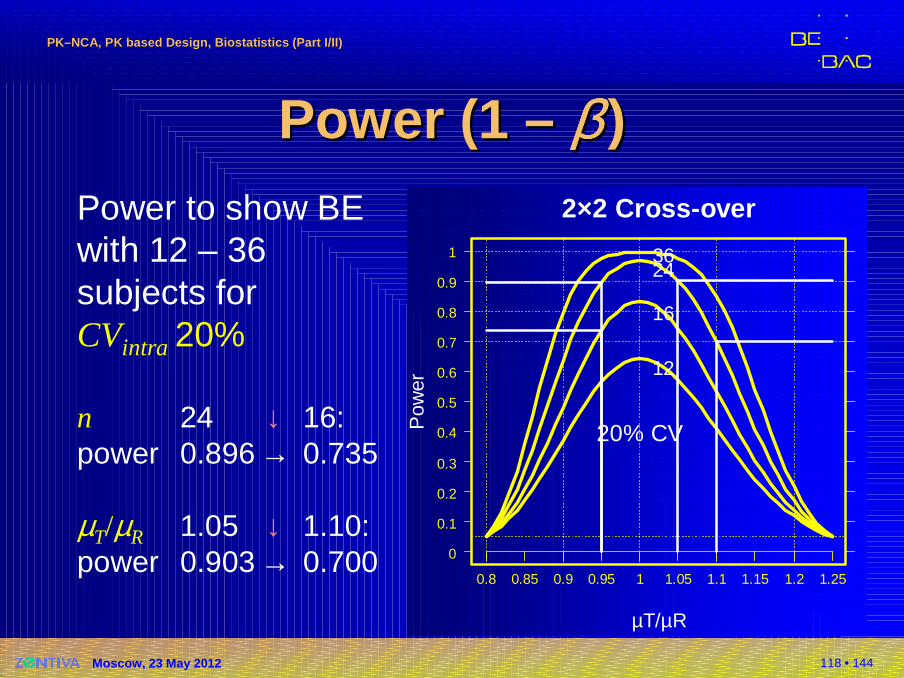
Power (1 Power (1 –– ββββββββ ))Power to show BE with 12 – 36 subjects forCVintra 20%
n 24 ↓ 16:power 0.896 → 0.735
µT/µR 1.05 ↓ 1.10:power 0.903 → 0.700
2×2 Cross-over
µT/µR
Pow
er20% CV
0.8 0.85 0.9 0.95 1 1.05 1.1 1.15 1.2 1.25
0
0.1
0.2
0.3
0.4
0.5
0.6
0.7
0.8
0.9
1
12
16
2436
119 • 144
PKPK––NCA, PK based Design, Biostatistics (Part I/II)NCA, PK based Design, Biostatistics (Part I/II)
Moscow, 23 May 2012
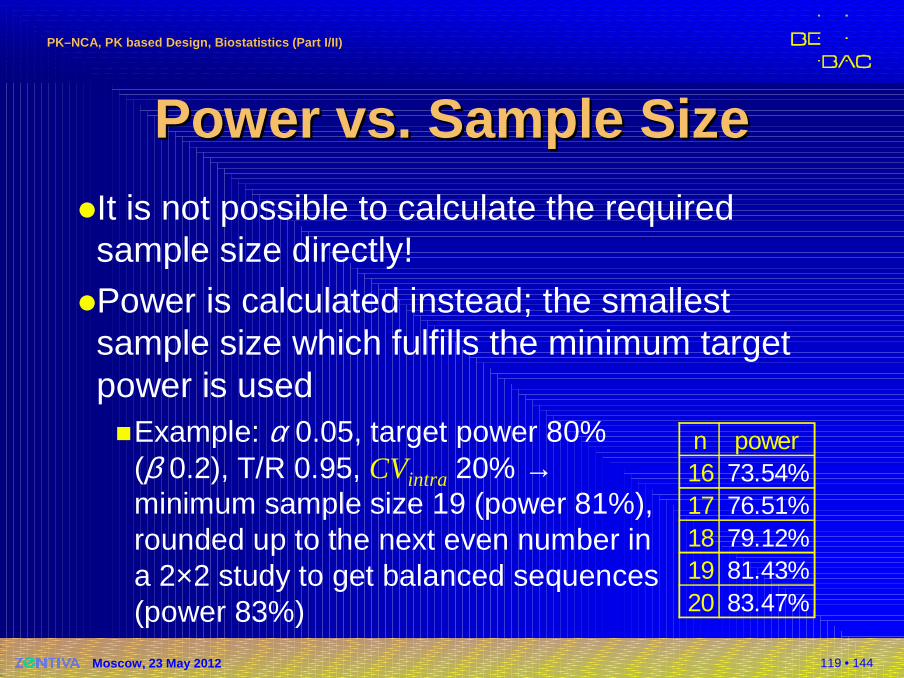
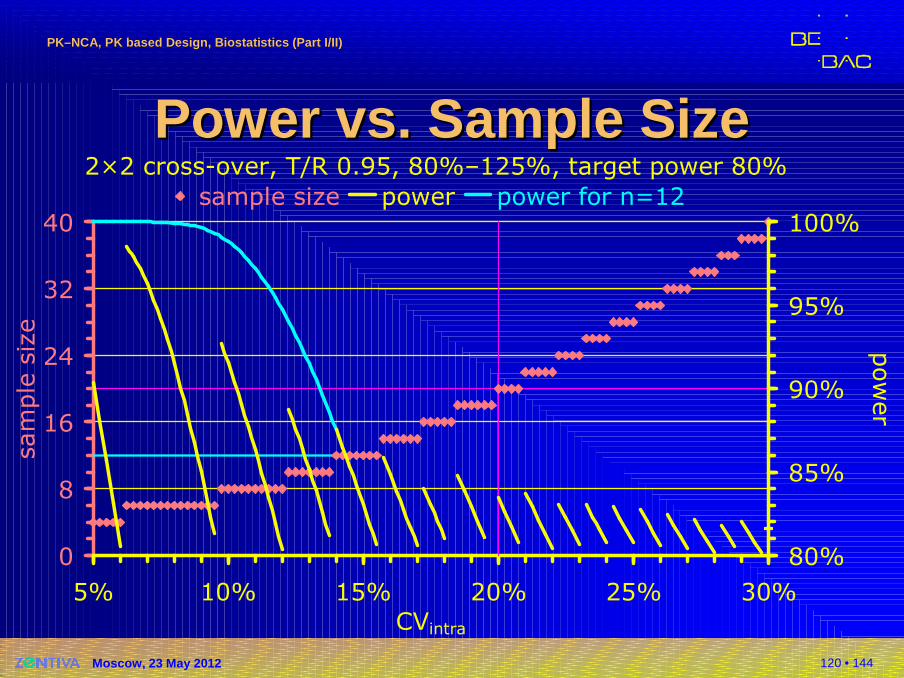
Power Power vs.vs. Sample SizeSample Size�It is not possible to calculate the requiredsample size directly!
�Power is calculated instead; the smallestsample size which fulfills the minimum target power is used�Example: α 0.05, target power 80%
(β 0.2), T/R 0.95, CVintra 20% →minimum sample size 19 (power 81%),rounded up to the next even number ina 2×2 study to get balanced sequences(power 83%)
n power16 73.54%17 76.51%18 79.12%19 81.43%20 83.47%
120 • 144
PKPK––NCA, PK based Design, Biostatistics (Part I/II)NCA, PK based Design, Biostatistics (Part I/II)
Moscow, 23 May 2012
2×2 cross-over, T/R 0.95, 80%–125%, target power 80%
0
8
16
24
32
40
5% 10% 15% 20% 25% 30%
CVintra
sample size
80%
85%
90%
95%
100%
power
sample size power power for n=12
Power Power vs.vs. Sample SizeSample Size
121 • 144
PKPK––NCA, PK based Design, Biostatistics (Part I/II)NCA, PK based Design, Biostatistics (Part I/II)
Moscow, 23 May 2012
AddAdd --on / Twoon / Two --Stage DesignsStage Designs�History / early approaches
�Add-on studies
�Problems with α-inflation
�Uncertain Uncertain CVintra …
�Recent developments�Review of guidelines
�Two-stage sequential designs
122 • 144
PKPK––NCA, PK based Design, Biostatistics (Part I/II)NCA, PK based Design, Biostatistics (Part I/II)
Moscow, 23 May 2012
AddAdd --on / Twoon / Two --Stage DesignsStage Designs�Sometimes properly planned and executed studies fail due to�Pure chance (producer’s risk hit)
�False assumptions about variability and/or T/R-ratio�Poor study conduct (increasing variability)
�‘True’ bioinequivalence
�The patient’s risk must be preserved�Already noticed at Bio-International Conferences
(1989, 1992) and guidelines from the 1990s
123 • 144
PKPK––NCA, PK based Design, Biostatistics (Part I/II)NCA, PK based Design, Biostatistics (Part I/II)
Moscow, 23 May 2012
Sequential DesignsSequential Designs�Methods by Potvin et al. (2008) promising
�Supported by ‘The Product Quality Research Institute’ (members: FDA/CDER, Health Canada, USP, AAPS, PhRMA, …)�Acceptable by US-FDA�Canada? Or Gould (1995) mandatory?�Acceptable as a Two-Stage Design in the EU�Three of BEBAC’s protocols approved by German
BfArM, one study acceptedPotvin D, Diliberti CE, Hauck WW, Parr AF, Schuirma nn DJ, and RA SmithSequential design approaches for bioequivalence studies with crossover designsPharmaceut Statist 7/4, 245–62 (2008), DOI: 10.1002/pst.294http://www3.interscience.wiley.com/cgi-bin/abstract/115805765/ABSTRACT
124 • 144
PKPK––NCA, PK based Design, Biostatistics (Part I/II)NCA, PK based Design, Biostatistics (Part I/II)
Moscow, 23 May 2012
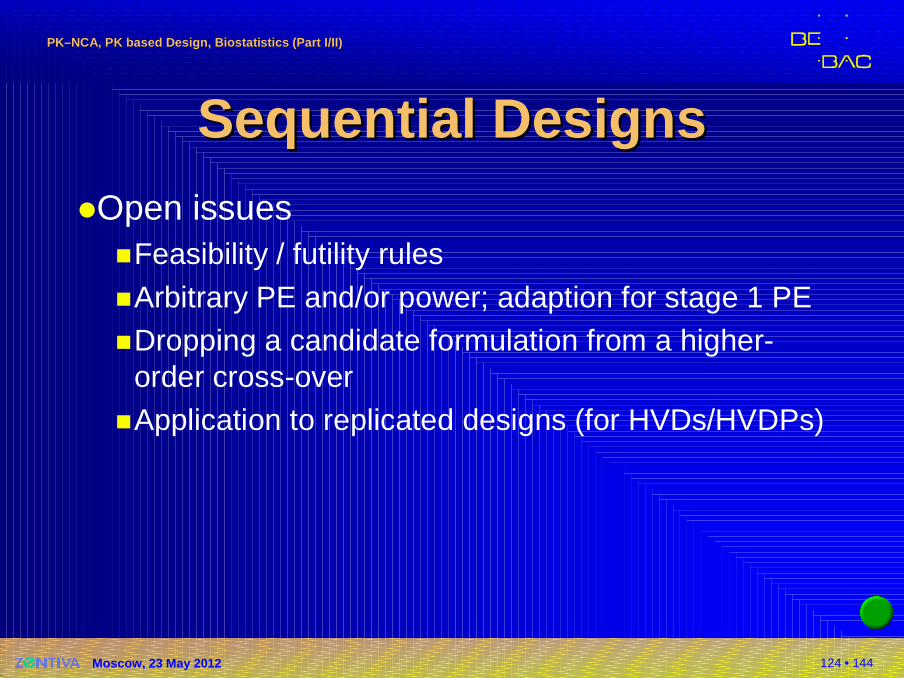
Sequential DesignsSequential Designs�Open issues
�Feasibility / futility rules
�Arbitrary PE and/or power; adaption for stage 1 PE �Dropping a candidate formulation from a higher-
order cross-over�Application to replicated designs (for HVDs/HVDPs)
125 • 144
PKPK––NCA, PK based Design, Biostatistics (Part I/II)NCA, PK based Design, Biostatistics (Part I/II)
Moscow, 23 May 2012
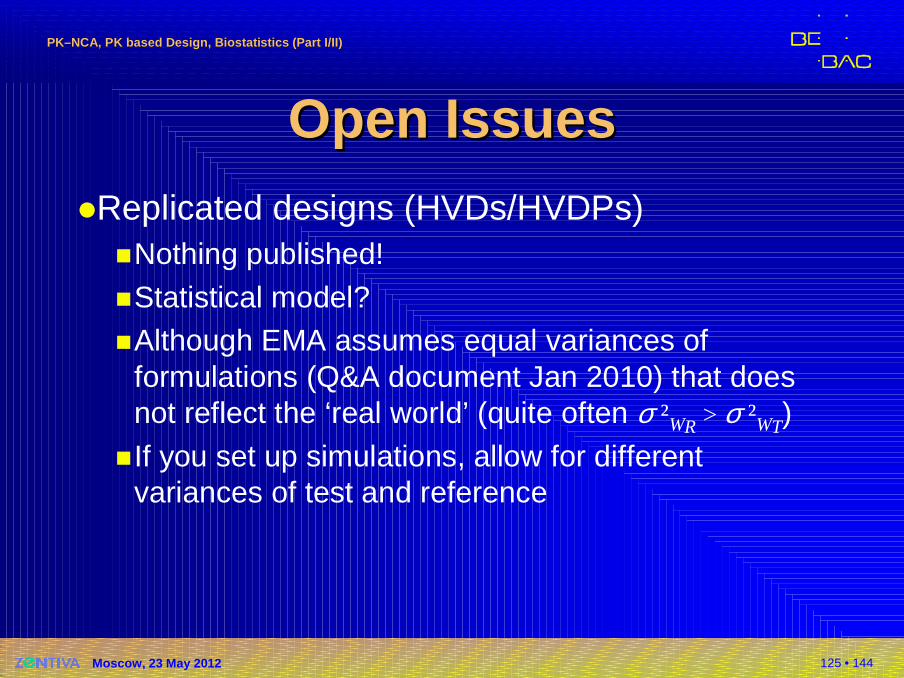
Open IssuesOpen Issues�Replicated designs (HVDs/HVDPs)
�Nothing published!
�Statistical model?�Although EMA assumes equal variances of
formulations (Q&A document Jan 2010) that does not reflect the ‘real world’ (quite often σ ²WR > σ ²WT)
�If you set up simulations, allow for different variances of test and reference
126 • 144
PKPK––NCA, PK based Design, Biostatistics (Part I/II)NCA, PK based Design, Biostatistics (Part I/II)
Moscow, 23 May 2012
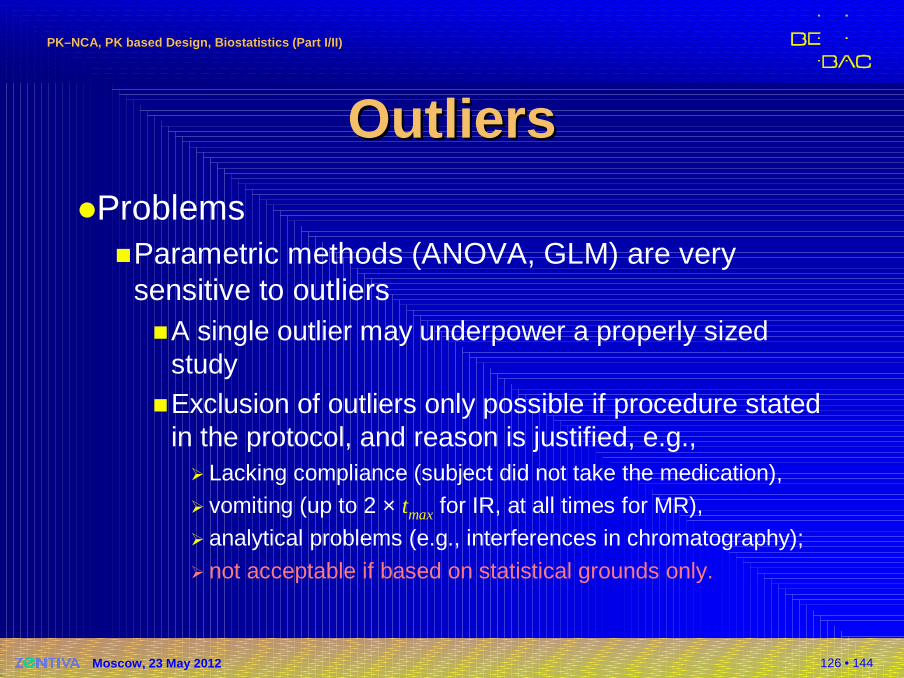
OutliersOutliers�Problems
�Parametric methods (ANOVA, GLM) are very sensitive to outliers�A single outlier may underpower a properly sized
study�Exclusion of outliers only possible if procedure stated
in the protocol, and reason is justified, e.g.,� Lacking compliance (subject did not take the medication),� vomiting (up to 2 × tmax for IR, at all times for MR),� analytical problems (e.g., interferences in chromatography);
� not acceptable if based on statistical grounds only.

127 • 144
PKPK––NCA, PK based Design, Biostatistics (Part I/II)NCA, PK based Design, Biostatistics (Part I/II)
Moscow, 23 May 2012
Nuisances in BE StudiesNuisances in BE Studies�Period effect�Sequence (aka unequal carry-over) effect
�Group effect
128 • 144
PKPK––NCA, PK based Design, Biostatistics (Part I/II)NCA, PK based Design, Biostatistics (Part I/II)
Moscow, 23 May 2012
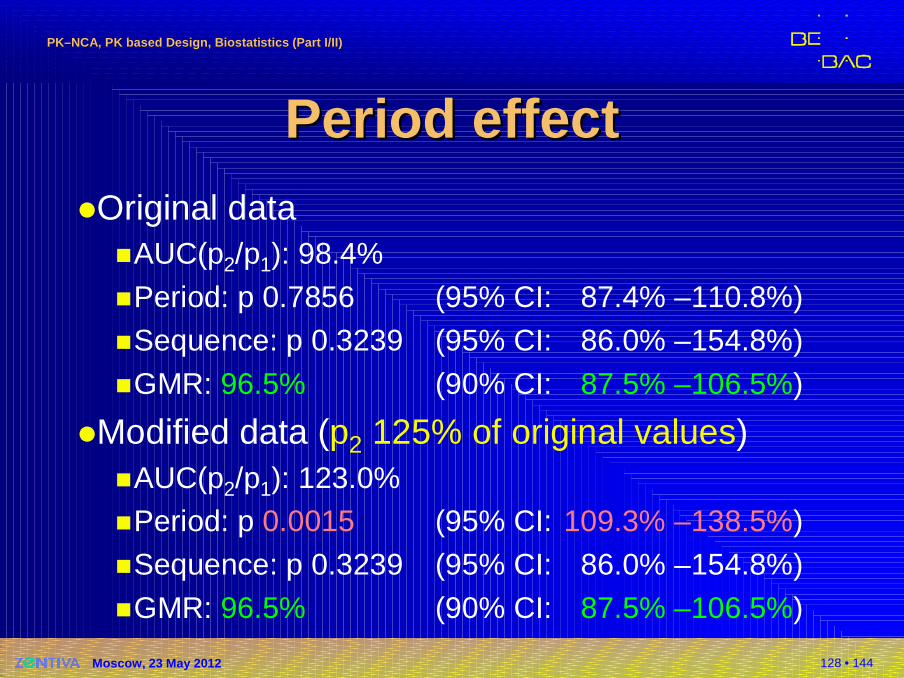
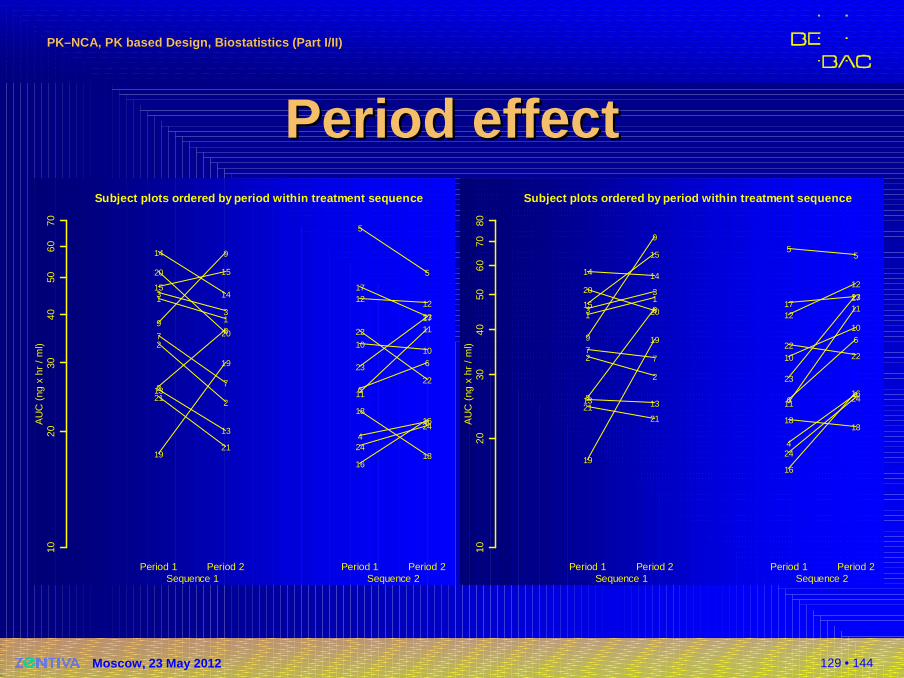
Period effectPeriod effect�Original data
�AUC(p2/p1): 98.4%
�Period: p 0.7856 (95% CI: 87.4% –110.8%)
�Sequence: p 0.3239 (95% CI: 86.0% –154.8%)
�GMR: 96.5% (90% CI: 87.5% –106.5%)
�Modified data (p2 125% of original values)�AUC(p2/p1): 123.0%�Period: p 0.0015 (95% CI: 109.3% –138.5%)
�Sequence: p 0.3239 (95% CI: 86.0% –154.8%)
�GMR: 96.5% (90% CI: 87.5% –106.5%)
129 • 144
PKPK––NCA, PK based Design, Biostatistics (Part I/II)NCA, PK based Design, Biostatistics (Part I/II)
Moscow, 23 May 2012
Period effectPeriod effect
AU
C (
ng x
hr
/ m
l)
Subject plots ordered by period within treatment se quence
1020
3040
5060
70
Period 1 Period 2 Period 1 Period 2
1
1
2
2
3
3
7
78
89
9
13
13
14
1415
15
19
19
20
20
21
214
4
5
5
6
6
1010
11
11
12 12
16
16
17
17
18
18
22
22
23
23
24
24
Sequence 1 Sequence 2
AU
C (
ng x
hr
/ m
l)
Subject plots ordered by period within treatment se quence
1020
3040
5060
7080
Period 1 Period 2 Period 1 Period 2
1
1
2
2
3
3
77
8
8
9
9
13 13
14 14
15
15
19
19
20
20
2121
4
4
55
6
6
10
10
11
1112
12
16
16
1717
1818
2222
23
23
24
24
Sequence 1 Sequence 2
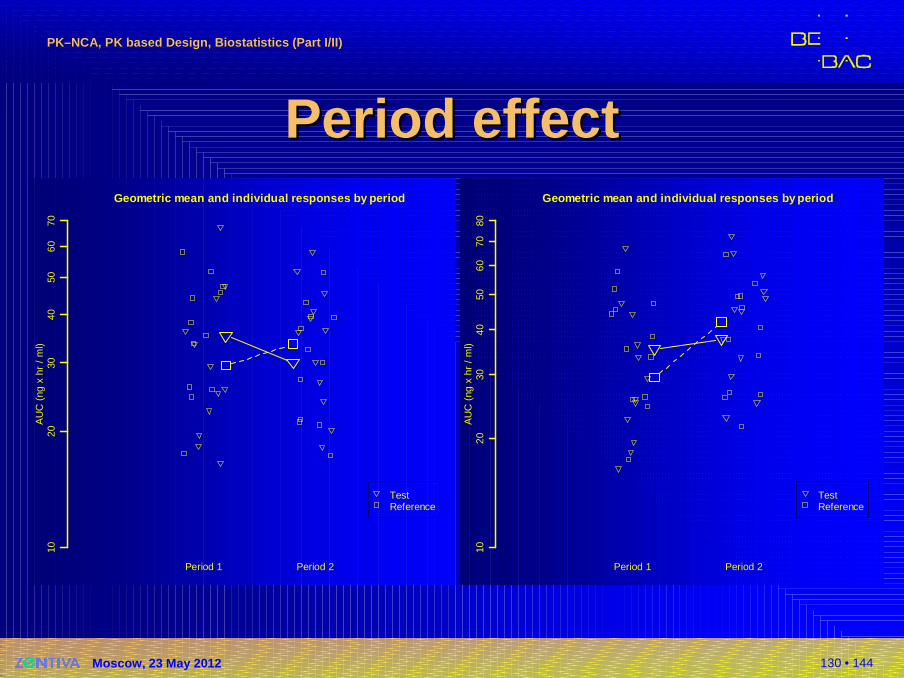
130 • 144
PKPK––NCA, PK based Design, Biostatistics (Part I/II)NCA, PK based Design, Biostatistics (Part I/II)
Moscow, 23 May 2012
Period effectPeriod effect
AU
C (
ng x
hr
/ m
l)
Geometric mean and individual responses by period
1020
3040
5060
70
Period 1 Period 2
TestReference
AU
C (
ng x
hr
/ m
l)
Geometric mean and individual responses by period
1020
3040
5060
7080
Period 1 Period 2
TestReference
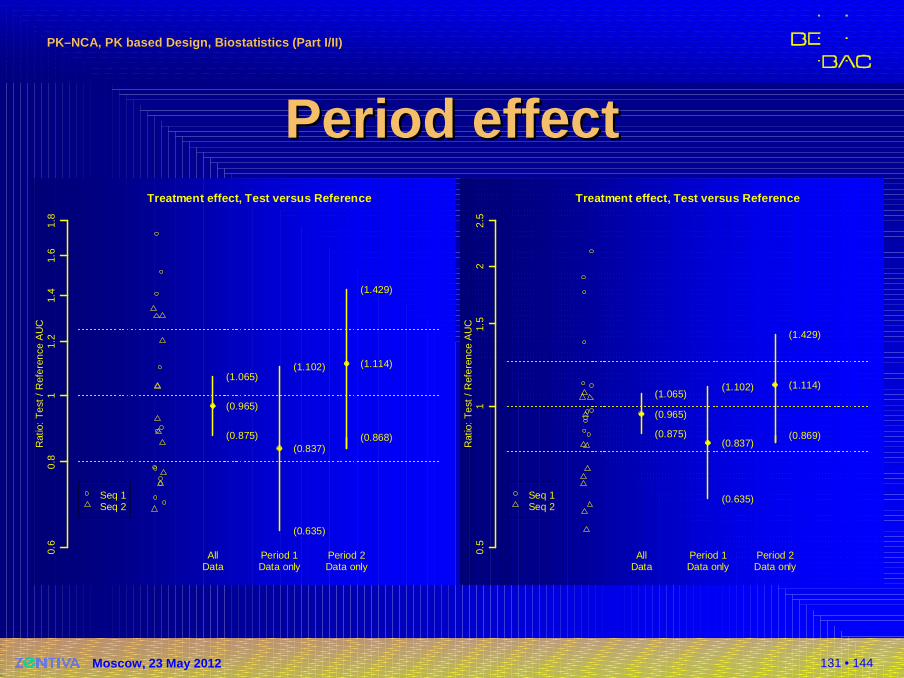
131 • 144
PKPK––NCA, PK based Design, Biostatistics (Part I/II)NCA, PK based Design, Biostatistics (Part I/II)
Moscow, 23 May 2012
Period effectPeriod effect
Rat
io:
Tes
t /
Ref
eren
ce A
UC
Treatment effect, Test versus Reference
0.6
0.8
11.
21.
41.
61.
8
(0.875)
(0.965)
(1.065)
(0.635)
(0.837)
(1.102)
(0.868)
(1.114)
(1.429)
AllData
Period 1Data only
Period 2Data only
Seq 1Seq 2
Rat
io:
Tes
t /
Ref
eren
ce A
UC
Treatment effect, Test versus Reference
0.5
11.
52
2.5
(0.875)
(0.965)
(1.065)
(0.635)
(0.837)
(1.102)
(0.869)
(1.114)
(1.429)
AllData
Period 1Data only
Period 2Data only
Seq 1Seq 2
132 • 144
PKPK––NCA, PK based Design, Biostatistics (Part I/II)NCA, PK based Design, Biostatistics (Part I/II)
Moscow, 23 May 2012
Sequence effectSequence effect�In a ‘standard’ 2×2 cross-over design
�the sequence effect is confounded with � the carry-over effect, and� the formulation-by-period interaction
�Therefore, a statistically significant sequence effect could indicate that there is
� a true sequence effect,� a true carry-over effect,� a true formulation by period interaction, or � a failure of randomization
133 • 144
PKPK––NCA, PK based Design, Biostatistics (Part I/II)NCA, PK based Design, Biostatistics (Part I/II)
Moscow, 23 May 2012
Sequence effectSequence effect�‘Two-stage analysis’1 was – and regrettably still is –
often applied� Test for a significant sequence effect at α 0.10� If a significant sequence effect is found, evaluation of the first
period as a parallel design
�This procedure was shown to be statistically flawed2
1 JE GrizzleThe two-period change over design and ist use in clinical trialsBiometrics 21, 467–80 (1965)
2 P FreemanThe performance of the two-stage analysis of two-treatment, two-period cross-over trialsStatistics in Medicine 8, 1421–32 (1989)
134 • 144
PKPK––NCA, PK based Design, Biostatistics (Part I/II)NCA, PK based Design, Biostatistics (Part I/II)
Moscow, 23 May 2012
Sequence effectSequence effect�In a large metastudy (n=420) significant sequence
effects were found at ≈ α, both for AUC and Cmax*)
�2×2 studies (n=324)� AUC: 34/324 (10.5% ) Cmax: 37/324 (11.4%)
�6×3 studies (n=96)� AUC: 4/96 ( 4.2%) Cmax: 4/96 ( 4.2%)
�For both metrics the distribution of p values followed closely Uniform [0,1]
*) D’Angelo G, Potvin D and J TurgeonCarry-over effects in bioequivalence studiesJ Biopharm Stat 11, 35–43 (2001)
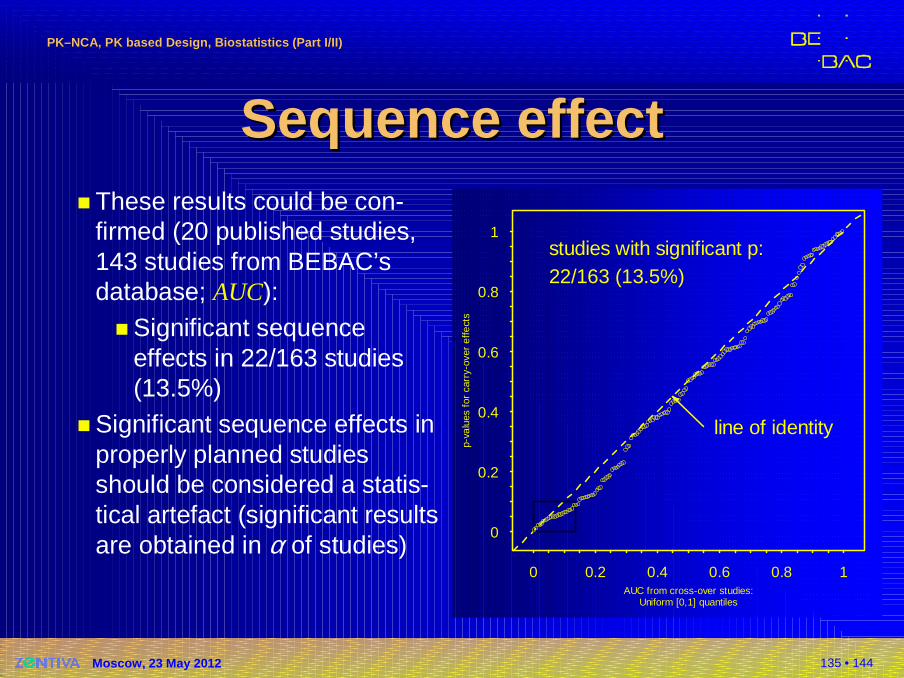
135 • 144
PKPK––NCA, PK based Design, Biostatistics (Part I/II)NCA, PK based Design, Biostatistics (Part I/II)
Moscow, 23 May 2012
Sequence effectSequence effect� These results could be con-
firmed (20 published studies, 143 studies from BEBAC’sdatabase; AUC):
� Significant sequence effects in 22/163 studies (13.5%)
� Significant sequence effects in properly planned studies should be considered a statis-tical artefact (significant results are obtained in α of studies)
AUC from cross-over studies:Uniform [0,1] quantiles
p-va
lues
for
car
ry-o
ver
effe
cts
0
0.2
0.4
0.6
0.8
1
0 0.2 0.4 0.6 0.8 1
line of identity
studies with significant p:22/163 (13.5%)
136 • 144
PKPK––NCA, PK based Design, Biostatistics (Part I/II)NCA, PK based Design, Biostatistics (Part I/II)
Moscow, 23 May 2012
Sequence effectSequence effect�Conclusions
�No valid statistical procedure exists to correct for a true sequence/carry-over effect
�A true sequence/carry-over is highly unlikely in a BE study if
� the study is performed in healthy subjects,� the drug is not an endogenous entity, and� an adequate washout period was maintained (no
predose concentrations >5% of Cmax observed).
�Testing for a sequence effect is futile!
137 • 144
PKPK––NCA, PK based Design, Biostatistics (Part I/II)NCA, PK based Design, Biostatistics (Part I/II)
Moscow, 23 May 2012
Sequence effectSequence effect�Conclusions (cont’d)
�EMA GL on BE (2010)� A test for carry-over should not be performed and no
decisions regarding the analysis (e.g. analysis of the first period, only) should be made on the basis of such a test. The potential for carry-over can be directly addressed by examination of the pre-treat-ment plasma concentrations in period 2 (and beyond if applicable).
138 • 144
PKPK––NCA, PK based Design, Biostatistics (Part I/II)NCA, PK based Design, Biostatistics (Part I/II)
Moscow, 23 May 2012
Group effectGroup effect�More than one group of subjects
�‘If a crossover study is carried out in two or more groups of subjects (e.g., if for logistical reasons only a limited number of subjects can be studied at one time), the statistical model should be modified to reflect the multigroup nature of the study. In particular, the model should reflect the fact that the periods for the first group are different from the periods for the second group.’
FDA, Center for Drug Evaluation and Research (CDER)Guidance for Industry: Statistical Approaches to Establishing Bioequivalence (2001)
139 • 144
PKPK––NCA, PK based Design, Biostatistics (Part I/II)NCA, PK based Design, Biostatistics (Part I/II)
Moscow, 23 May 2012
Group effectGroup effect�More than one group of subjects
�Cases where ‘… the study is carried out in two or more groups and those groups are studied at diffe-rent clinical sites, or at the same site but greatly separated in time (months apart, for example) […] should be discussed with the appropriate CDER review division.’
�EMEA BA/BE (2001), BE GL (2010)�The study should be designed in such a way that the
formulation effect can be distinguished from other effects.
140 • 144
PKPK––NCA, PK based Design, Biostatistics (Part I/II)NCA, PK based Design, Biostatistics (Part I/II)
Moscow, 23 May 2012
Group effectGroup effect�Increasing number of referrals (deficiency letters) from�Canada
�Gulf States (Saudia Arabia, Emirates, Oman)
�Extended Statistical model (fixed effects in ANOVA)�Group�Group × Treatment Interaction
�If both terms are not significant (p>0.05), pooling of groups is justified.
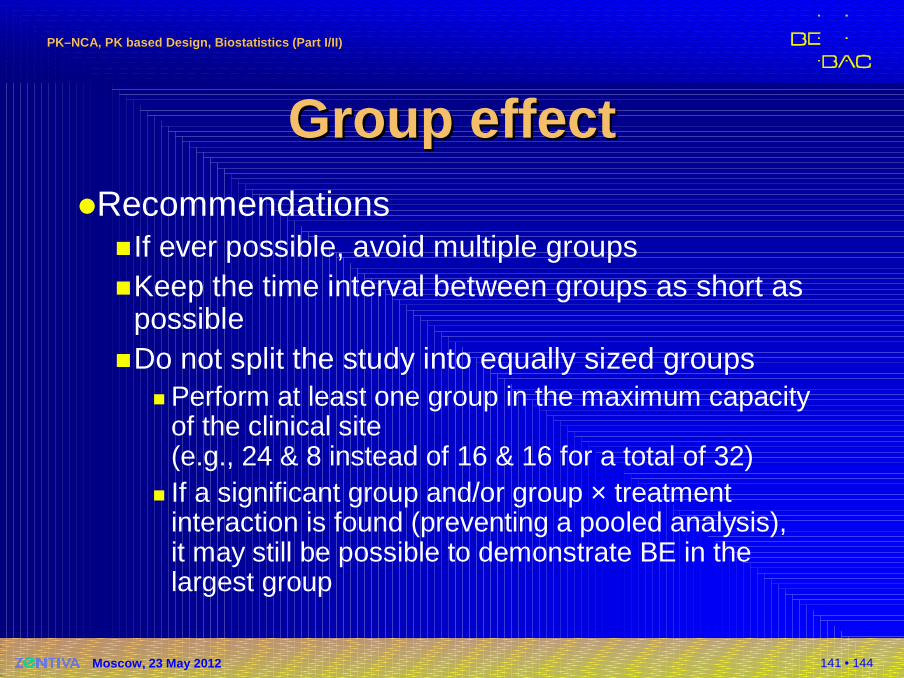
141 • 144
PKPK––NCA, PK based Design, Biostatistics (Part I/II)NCA, PK based Design, Biostatistics (Part I/II)
Moscow, 23 May 2012
Group effectGroup effect�Recommendations
�If ever possible, avoid multiple groups�Keep the time interval between groups as short as
possible�Do not split the study into equally sized groups
� Perform at least one group in the maximum capacity of the clinical site(e.g., 24 & 8 instead of 16 & 16 for a total of 32)
� If a significant group and/or group × treatment interaction is found (preventing a pooled analysis),it may still be possible to demonstrate BE in the largest group
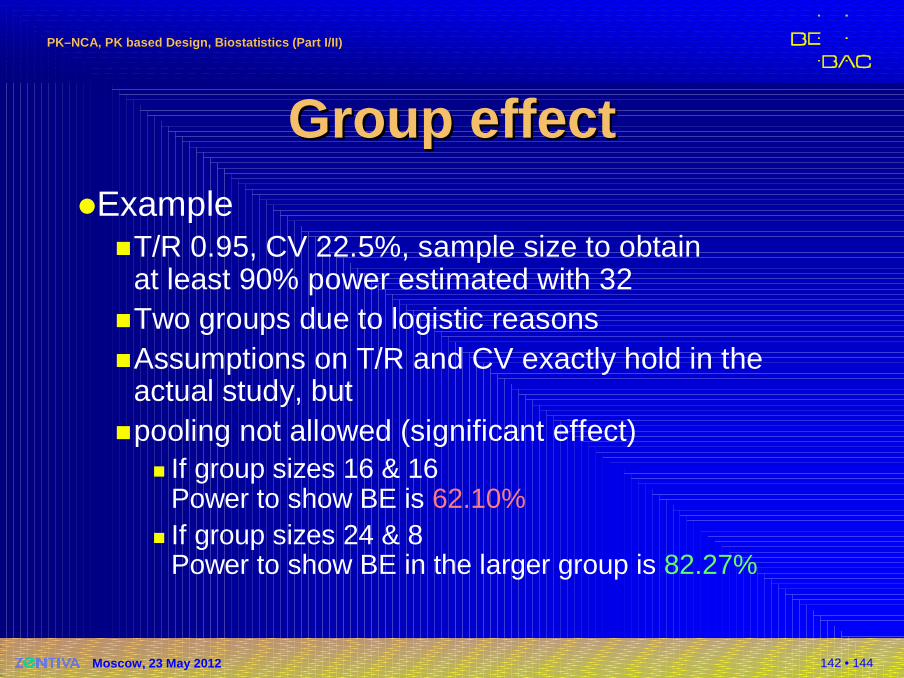
142 • 144
PKPK––NCA, PK based Design, Biostatistics (Part I/II)NCA, PK based Design, Biostatistics (Part I/II)
Moscow, 23 May 2012
Group effectGroup effect�Example
�T/R 0.95, CV 22.5%, sample size to obtainat least 90% power estimated with 32
�Two groups due to logistic reasons�Assumptions on T/R and CV exactly hold in the
actual study, but�pooling not allowed (significant effect)
� If group sizes 16 & 16Power to show BE is 62.10%
� If group sizes 24 & 8Power to show BE in the larger group is 82.27%

143 • 144
PKPK––NCA, PK based Design, Biostatistics (Part I/II)NCA, PK based Design, Biostatistics (Part I/II)
Moscow, 23 May 2012
Thank You!Thank You!
PKPK––NCA, PK based Design, NCA, PK based Design, BiostatisticsBiostatistics
Open Questions?Open Questions?
Helmut SchützBEBAC
Consultancy Services forBioequivalence and Bioavailability Studies
1070 Vienna, [email protected]

144 • 144
PKPK––NCA, PK based Design, Biostatistics (Part I/II)NCA, PK based Design, Biostatistics (Part I/II)
Moscow, 23 May 2012
To bear in Remembrance...To bear in Remembrance...
The fundamental cause of trouble in the world todayThe fundamental cause of trouble in the world today isisthat the stupid are cocksurethat the stupid are cocksurewhile the intelligent are full of doubtwhile the intelligent are full of doubt. Bertrand RussellBertrand Russell
If you shut your door to all errorsIf you shut your door to all errorstruth will be shut out.truth will be shut out.
Rabindranath Rabindranath TagoreTagore
It is a good morning exercise for a researchIt is a good morning exercise for a research scientistscientistto discard a pet hypothesis every day beforeto discard a pet hypothesis every day beforebreakfast.breakfast.It keeps him young.It keeps him young. Konrad LorenzKonrad Lorenz