Embed Size (px)
Citation preview
PJSC RosneftInvestor Presentation
13.09.2016
August 2016
Important Notice
Information herein has been prepared by the Company. The presented conclusions are based on the general informationcollected as of the date hereof and can be amended without any additional notice. The Company relies on the informationobtained from the sources which it deems credible; however, it does not guarantee its accuracy or completeness.
These materials contain statements about future events and explanations representing a forecast of such events. Anyassertion in these materials that is not a statement of historical fact is a forward-looking statement that involves known andunknown risks, uncertainties and other factors, which may cause our actual results, performance or achievements to bematerially different from any future results, performance or achievements expressed or implied by such forward-lookingstatements. We assume no obligations to update the forward-looking statements contained herein to reflect actual results,changes in assumptions or changes in factors affecting such statements.
This presentation does not constitute an offer to sell, or any solicitation of any offer to subscribe for or purchase anysecurities. It is understood that nothing in this report / presentation provides grounds for any contract or commitmentwhatsoever. The information herein should not for any purpose be deemed complete, accurate or impartial. The informationherein in subject to verification, final formatting and modification. The contents hereof has not been verified by the Company.Accordingly, we did not and do not give on behalf of the Company, its shareholders, directors, officers or employees or anyother person, any representations or warranties, either explicitly expressed or implied, as to the accuracy, completeness orobjectivity of information or opinions contained in it. None of the directors of the Company, its shareholders, officers oremployees or any other persons accepts any liability for any loss of any kind that may arise from any use of this presentationor its contents or otherwise arising in connection therewith.
2

4.1
4.1
5.2
10.3
3.4
2.3
59
83
131
bln boe mmboed $/boe
Hydrocarbon reserves1 Hydrocarbon production2 Lifting costs3
Global Leader in Reserves, Production and Efficiency
2.3
2.5
2.7
3.3
3.6
14.6
13.4
13.0
11.3
10.4
13.09.2016
31
37
38
50
52
Liquids Gas
3Note: (1) Rosneft ABC1+C2 reserves under Russian classification as of Jan 1, 2016, data for other companies is taken from Wood Mackenzie reserve estimates including commercial andsub-commercial reserves; (2) Data for 1H2016; (3) Rosneft, Petrobras, Lukoil , Petrochina data for 1H2016, other competitors – for 2015.

The Company's environmental policy was approved. Itdefines Rosneft’s goals, objectives and principles inenvironmental protection
Program to improve the environmental efficiency by 2025 inplace. Its implementation will help achieving strategic goalsin the environmental protection
International organization BSI confirmed the compliance ofHSE Information System with ISO 14001, highlighting thestrengths of the environmental management system werepointed out
The approved marine ecosystems biodiversity preservationprogram is being implemented in the Rosneft license areaslocated in the Arctic zone of the Russian Federation till 2020
The Company and World Wildlife Fund (WWF) RussianOffice are implementing agreed Road Map of activities for2015-2016
Environmental Protection Activities
The Company's objective in environmental protection is to be the leader inenvironmental safety among oil and gas companies
Key 2015 results The Company's environmental policy was approved. It
defines Rosneft’s goals, objectives and principles inenvironmental protection
Program to improve the environmental efficiency by 2025 inplace. Its implementation will help achieving strategic goalsin the environmental protection
International organization BSI confirmed the compliance ofHSE Information System with ISO 14001, highlighting thestrengths of the environmental management system werepointed out
The approved marine ecosystems biodiversity preservationprogram is being implemented in the Rosneft license areaslocated in the Arctic zone of the Russian Federation till 2020
The Company and World Wildlife Fund (WWF) RussianOffice are implementing agreed Road Map of activities for2015-2016
4
RUB 71.7 bln – environmental protectionexpenses of which
RUB 44.7 bln capital investments aimedat reducing negative impact on the
environment (+65% vs. 2012)
0,282
0,3290,298
0,327
LTIF 2014
LTIF 2015
Lost time injury frequency
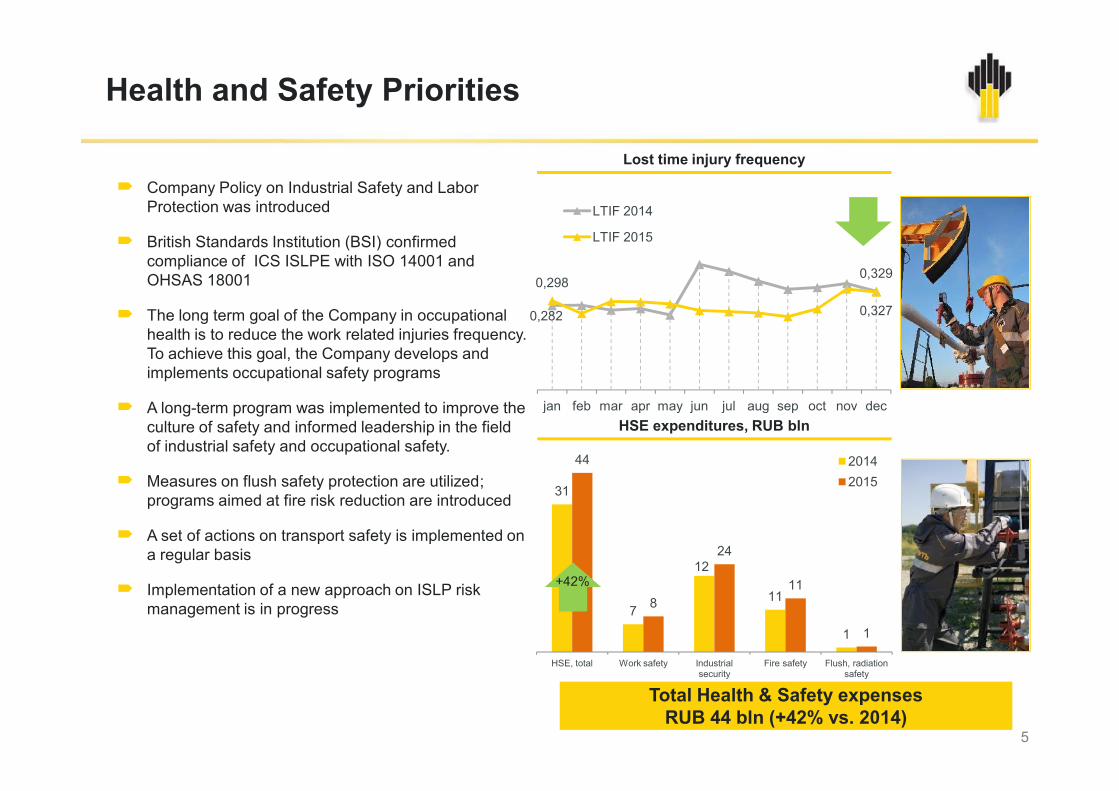
Health and Safety Priorities
Company Policy on Industrial Safety and LaborProtection was introduced
British Standards Institution (BSI) confirmedcompliance of ICS ISLPE with ISO 14001 andOHSAS 18001
The long term goal of the Company in occupationalhealth is to reduce the work related injuries frequency.To achieve this goal, the Company develops andimplements occupational safety programs
A long-term program was implemented to improve theculture of safety and informed leadership in the fieldof industrial safety and occupational safety.
Measures on flush safety protection are utilized;programs aimed at fire risk reduction are introduced
A set of actions on transport safety is implemented ona regular basis
Implementation of a new approach on ISLP riskmanagement is in progress
jan feb mar apr may jun jul aug sep oct nov dec
31
7
12
11
1
44
8
24
11
1
HSE, total Work safety Industrialsecurity
Fire safety Flush, radiationsafety
20142015
5
HSE expenditures, RUB bln
+42%
Company Policy on Industrial Safety and LaborProtection was introduced
British Standards Institution (BSI) confirmedcompliance of ICS ISLPE with ISO 14001 andOHSAS 18001
The long term goal of the Company in occupationalhealth is to reduce the work related injuries frequency.To achieve this goal, the Company develops andimplements occupational safety programs
A long-term program was implemented to improve theculture of safety and informed leadership in the fieldof industrial safety and occupational safety.
Measures on flush safety protection are utilized;programs aimed at fire risk reduction are introduced
A set of actions on transport safety is implemented ona regular basis
Implementation of a new approach on ISLP riskmanagement is in progress
Total Health & Safety expensesRUB 44 bln (+42% vs. 2014)
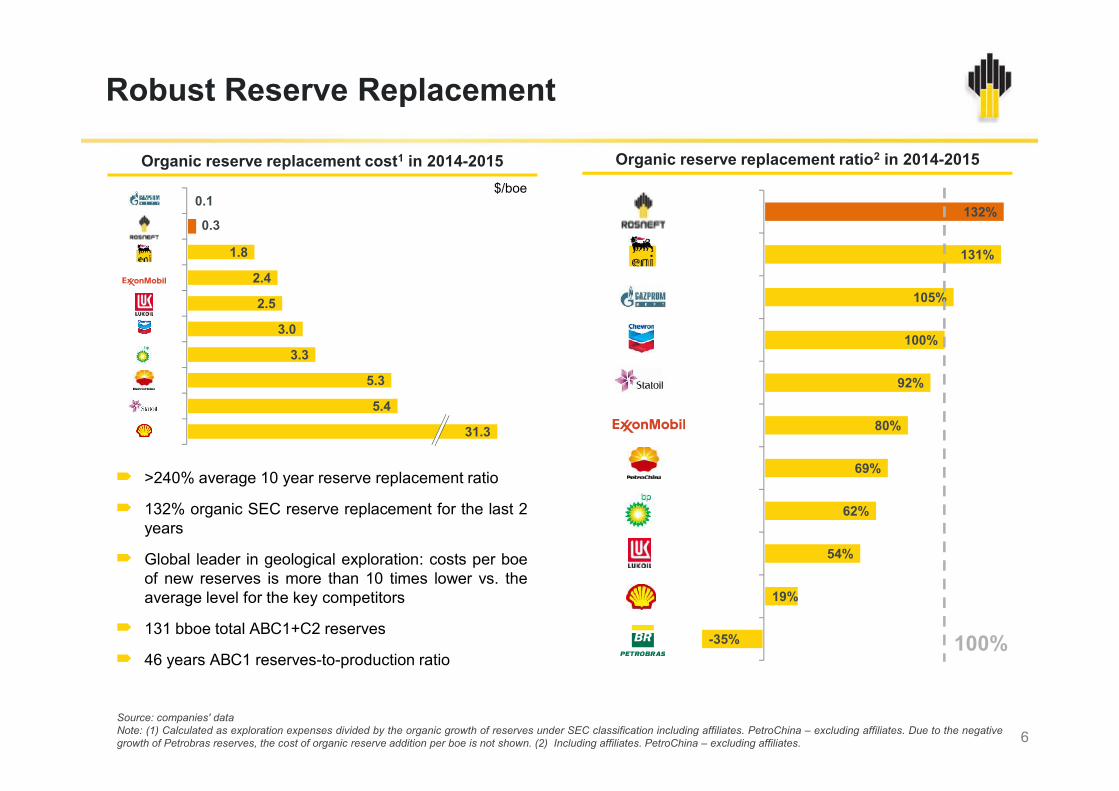
Robust Reserve Replacement
92%
100%
105%
131%
132%
5.3
3.3
3.0
2.5
2.4
1.8
0.3
0.1
Organic reserve replacement cost1 in 2014-2015 Organic reserve replacement ratio2 in 2014-2015
$/boe
6
>240% average 10 year reserve replacement ratio
132% organic SEC reserve replacement for the last 2years
Global leader in geological exploration: costs per boeof new reserves is more than 10 times lower vs. theaverage level for the key competitors
131 bboe total АВС1+С2 reserves
46 years АВС1 reserves-to-production ratio
Source: companies' dataNote: (1) Calculated as exploration expenses divided by the organic growth of reserves under SEC classification including affiliates. PetroChina – excluding affiliates. Due to the negativegrowth of Petrobras reserves, the cost of organic reserve addition per boe is not shown. (2) Including affiliates. PetroChina – excluding affiliates.
-35%
19%
54%
62%
69%
80%31.3
5.4
100%
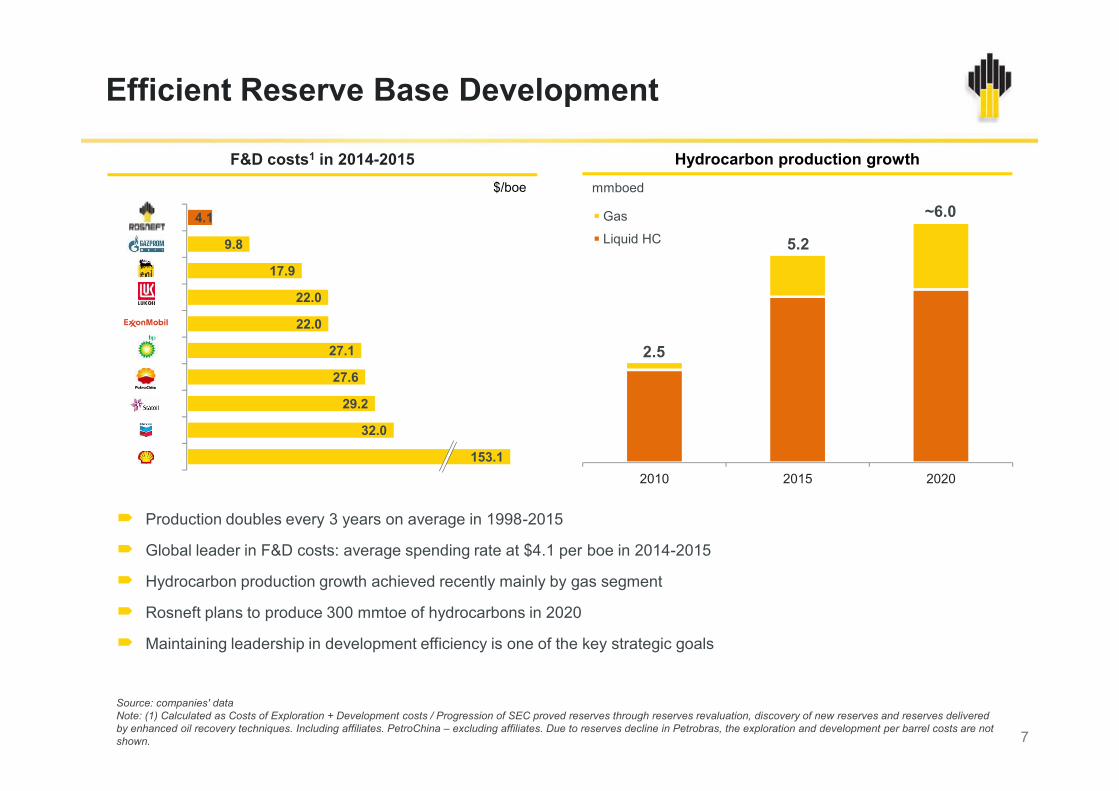
Gas
Liquid HC
~6.0
2.5
5.2
Efficient Reserve Base Development
Hydrocarbon production growthmmboed
29.2
27.6
27.1
22.0
22.0
17.9
9.8
4.1
F&D costs1 in 2014-2015$/boe
7
2010 2015 2020
Production doubles every 3 years on average in 1998-2015
Global leader in F&D costs: average spending rate at $4.1 per boe in 2014-2015
Hydrocarbon production growth achieved recently mainly by gas segment
Rosneft plans to produce 300 mmtoe of hydrocarbons in 2020
Maintaining leadership in development efficiency is one of the key strategic goals
Source: companies' dataNote: (1) Calculated as Costs of Exploration + Development costs / Progression of SEC proved reserves through reserves revaluation, discovery of new reserves and reserves deliveredby enhanced oil recovery techniques. Including affiliates. PetroChina – excluding affiliates. Due to reserves decline in Petrobras, the exploration and development per barrel costs are notshown.
153.1
32.0
29.2
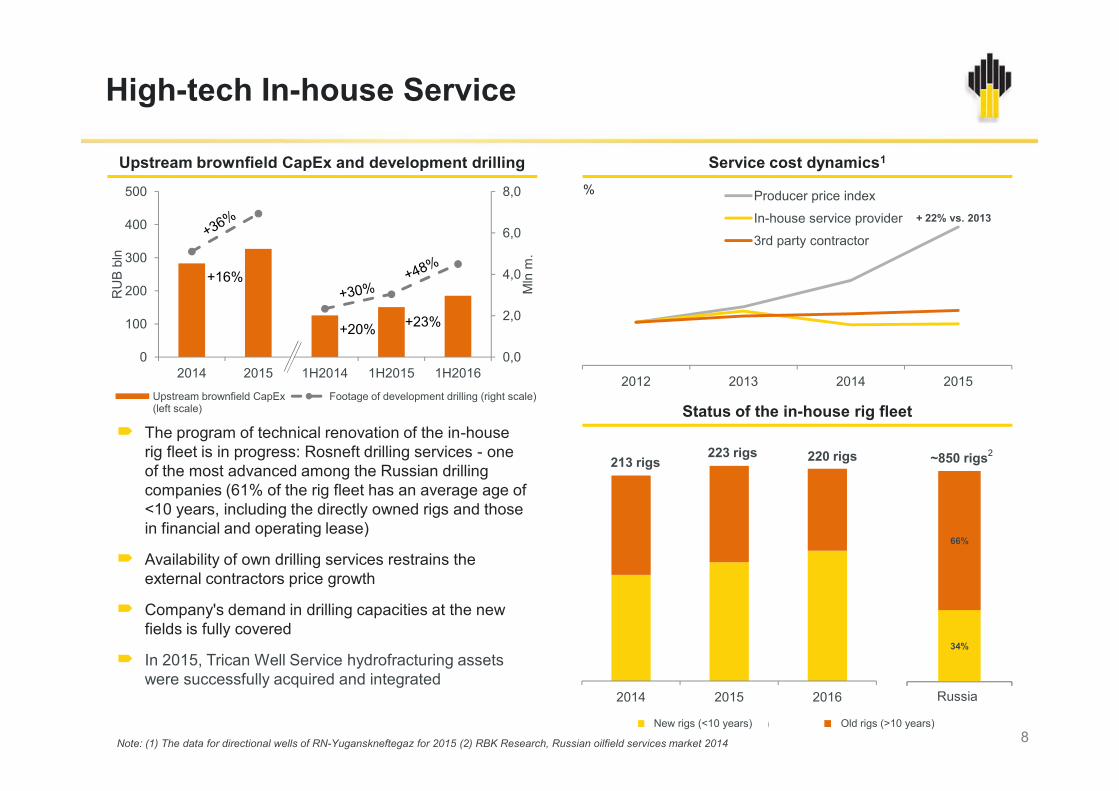
2012 2013 2014 2015
Producer price index
In-house service provider
3rd party contractor
+ 22% vs. 2013
High-tech In-house Service
Upstream brownfield CapEx and development drilling Service cost dynamics1
%
0,0
2,0
4,0
6,0
8,0
0
100
200
300
400
500
2014 2015 1H2014 1H2015 1H2016
Mln
m.
RU
Bbl
n
Upstream brownfield CapEx(left scale)
Footage of development drilling (right scale)
+16%
+20% +23%
8
Status of the in-house rig fleet
2014 2015 2016
Новые БУ (<10 лет) Старые БУ (>10 лет)
34%
66%
РФ
213 rigs223 rigs 220 rigs ~850 rigs2
New rigs (<10 years) Old rigs (>10 years)
The program of technical renovation of the in-houserig fleet is in progress: Rosneft drilling services - oneof the most advanced among the Russian drillingcompanies (61% of the rig fleet has an average age of<10 years, including the directly owned rigs and thosein financial and operating lease)
Availability of own drilling services restrains theexternal contractors price growth
Company's demand in drilling capacities at the newfields is fully covered
In 2015, Trican Well Service hydrofracturing assetswere successfully acquired and integrated
Note: (1) The data for directional wells of RN-Yuganskneftegaz for 2015 (2) RBK Research, Russian oilfield services market 2014
34%
66%
РФRussia
Upstream brownfield CapEx(left scale)
Footage of development drilling (right scale)

2014 2015 2016
Directional wellsHorizontal wells
31%
20% 20%
38%
21%
29%
47%
22%
30%
53%
28% 30%
Gazprom neft Lukoil Rosneft
2013 2014 2015 1H2016
1,8391,594
+15%
Drilling Activity Ramp-up andApplication of Advanced Technologies
Horizontal wells dynamics1 New oil wells completed
Average flow rates in 20152
9
14.3
49.0
9.4
34.0
Average flow rate per oil well Average flow rate per new oil well
Rosneft Russia average
tpd Horizontal wells share growth to 30% across theentire portfolio
Flow rates significantly exceed the sector average
Optimization of well construction technologicalprograms – horizontal wells drilling rate increased by6% vs 2014
Efficient wellwork – horizontal wells with multi-stagehydrofrac increased by ~45%; side-trackingoperations incresed by >44% with incrementalproduction exceeding 2.6 mmt
Yuganskneftegaz: the share of horizontal wells withmultifrac increased to 14% in 1H2016 (13% in 2015,8% in 2014)
Note: (1) CDU TEK data, well performance, constructed wells (rate of horizontal wells in development drilling) (2) CDU TEK data, Rosneft - IFRS
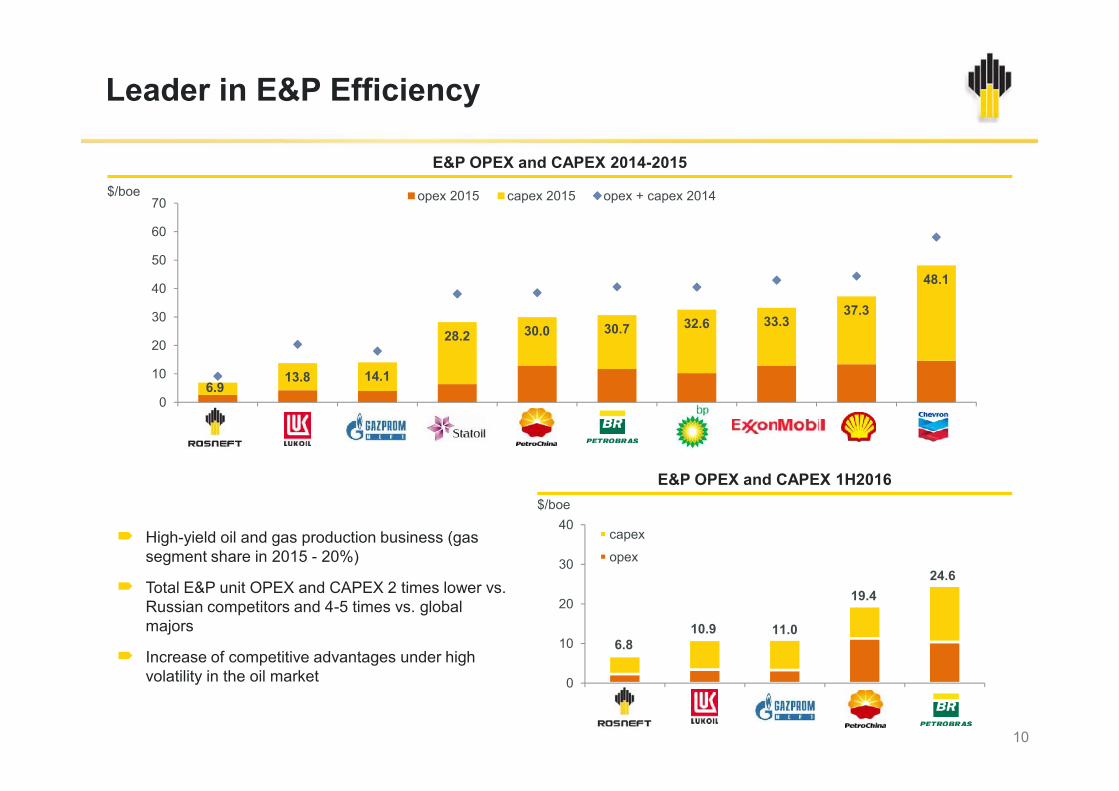
Leader in E&P Efficiency
6.913.8 14.1
28.2 30.0 30.7 32.6 33.337.3
48.1
0
10
20
30
40
50
60
70 opex 2015 capex 2015 opex + capex 2014$/boe
E&P OPEX and CAPEX 2014-2015
10
High-yield oil and gas production business (gassegment share in 2015 - 20%)
Total E&P unit OPEX and CAPEX 2 times lower vs.Russian competitors and 4-5 times vs. globalmajors
Increase of competitive advantages under highvolatility in the oil market
0
E&P OPEX and CAPEX 1H2016
0
10
20
30
40capex
opex
6.810.9 11.0
19.424.6
$/boe
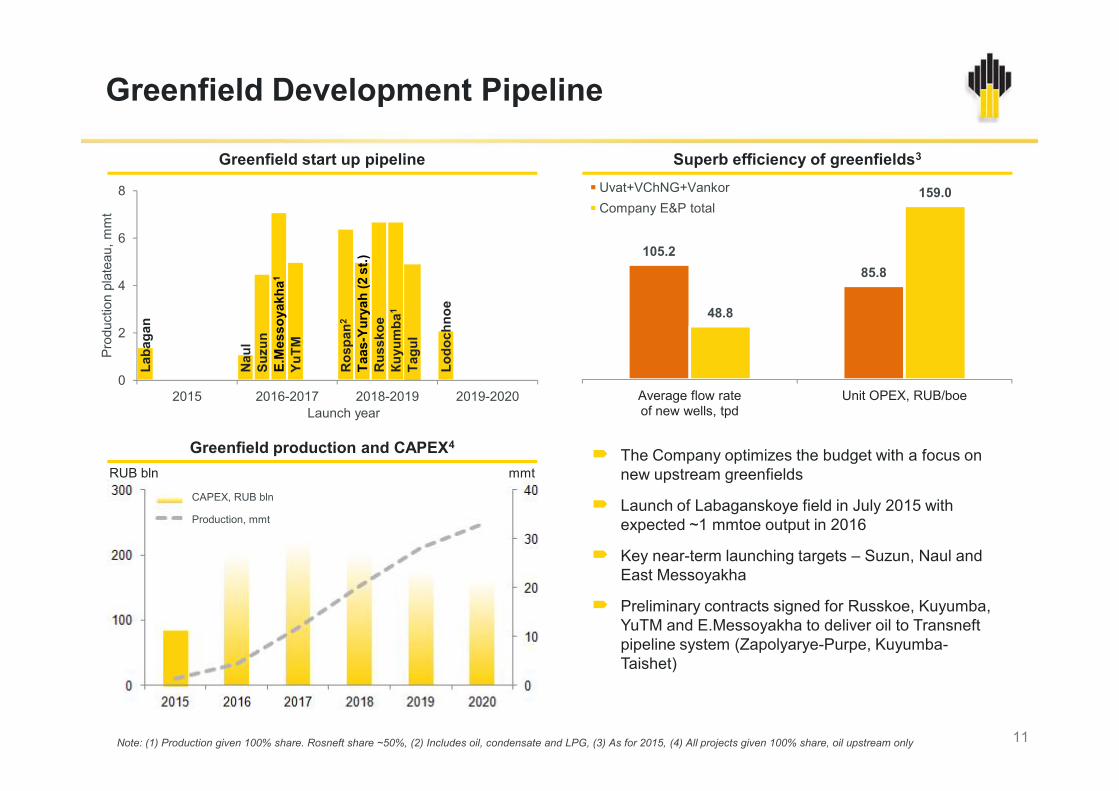
Greenfield Development Pipeline
Greenfield start up pipeline Superb efficiency of greenfields3
105.285.8
48.8
159.0
Average flow rateof new wells, tpd
Unit OPEX, RUB/boe
Uvat+VChNG+VankorCompany E&P total
Laba
gan
Nau
l
Ros
pan2
Lodo
chno
e
Suzu
n
Тааs
-Yur
yah
(2st
.)
E.M
esso
yakh
а1
Rus
skoe
YuТМ
Кuyu
mba
1
Tagu
l
0
2
4
6
8
2015 2016-2017 2018-2019 2019-2020
Prod
uctio
n pl
atea
u,m
mt
11
Average flow rateof new wells, tpd
Unit OPEX, RUB/boe
The Company optimizes the budget with a focus onnew upstream greenfields
Launch of Labaganskoye field in July 2015 withexpected ~1 mmtoe output in 2016
Key near-term launching targets – Suzun, Naul andEast Messoyakha
Preliminary contracts signed for Russkoe, Kuyumba,YuTM and E.Messoyakha to deliver oil to Transneftpipeline system (Zapolyarye-Purpe, Kuyumba-Taishet)
Greenfield production and CAPEX4
Note: (1) Production given 100% share. Rosneft share ~50%, (2) Includes oil, condensate and LPG, (3) As for 2015, (4) All projects given 100% share, oil upstream only
2015 2016-2017 2018-2019 2019-2020Launch year
CAPEX, RUB bln
Production, mmt
mmtRUB bln
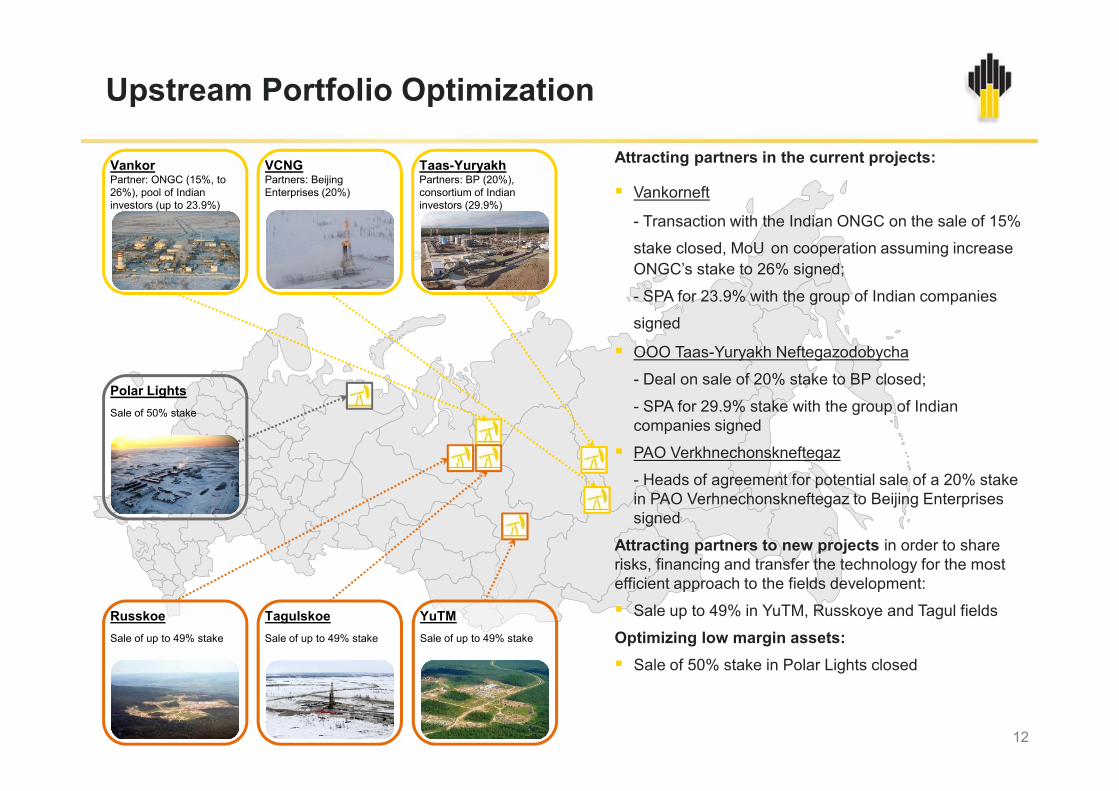
Upstream Portfolio Optimization
VankorPartner: ONGC (15%, to26%), pool of Indianinvestors (up to 23.9%)
Taas-YuryakhPartners: BP (20%),consortium of Indianinvestors (29.9%)
Polar LightsSale of 50% stake
Attracting partners in the current projects:
Vankorneft
- Transaction with the Indian ONGC on the sale of 15%
stake closed, MoU on cooperation assuming increaseONGC’s stake to 26% signed;
- SPA for 23.9% with the group of Indian companies
signed
OOO Taas-Yuryakh Neftegazodobycha
- Deal on sale of 20% stake to BP closed;
- SPA for 29.9% stake with the group of Indiancompanies signed
PAO Verkhnechonskneftegaz
- Heads of agreement for potential sale of a 20% stakein PAO Verhnechonskneftegaz to Beijing Enterprisessigned
Attracting partners to new projects in order to sharerisks, financing and transfer the technology for the mostefficient approach to the fields development:
Sale up to 49% in YuTM, Russkoye and Tagul fields
Optimizing low margin assets: Sale of 50% stake in Polar Lights closed
VCNGPartners: BeijingEnterprises (20%)
RusskoeSale of up to 49% stake
TagulskoeSale of up to 49% stake
YuTMSale of up to 49% stake
Polar LightsSale of 50% stake
Attracting partners in the current projects:
Vankorneft
- Transaction with the Indian ONGC on the sale of 15%
stake closed, MoU on cooperation assuming increaseONGC’s stake to 26% signed;
- SPA for 23.9% with the group of Indian companies
signed
OOO Taas-Yuryakh Neftegazodobycha
- Deal on sale of 20% stake to BP closed;
- SPA for 29.9% stake with the group of Indiancompanies signed
PAO Verkhnechonskneftegaz
- Heads of agreement for potential sale of a 20% stakein PAO Verhnechonskneftegaz to Beijing Enterprisessigned
Attracting partners to new projects in order to sharerisks, financing and transfer the technology for the mostefficient approach to the fields development:
Sale up to 49% in YuTM, Russkoye and Tagul fields
Optimizing low margin assets: Sale of 50% stake in Polar Lights closed
12
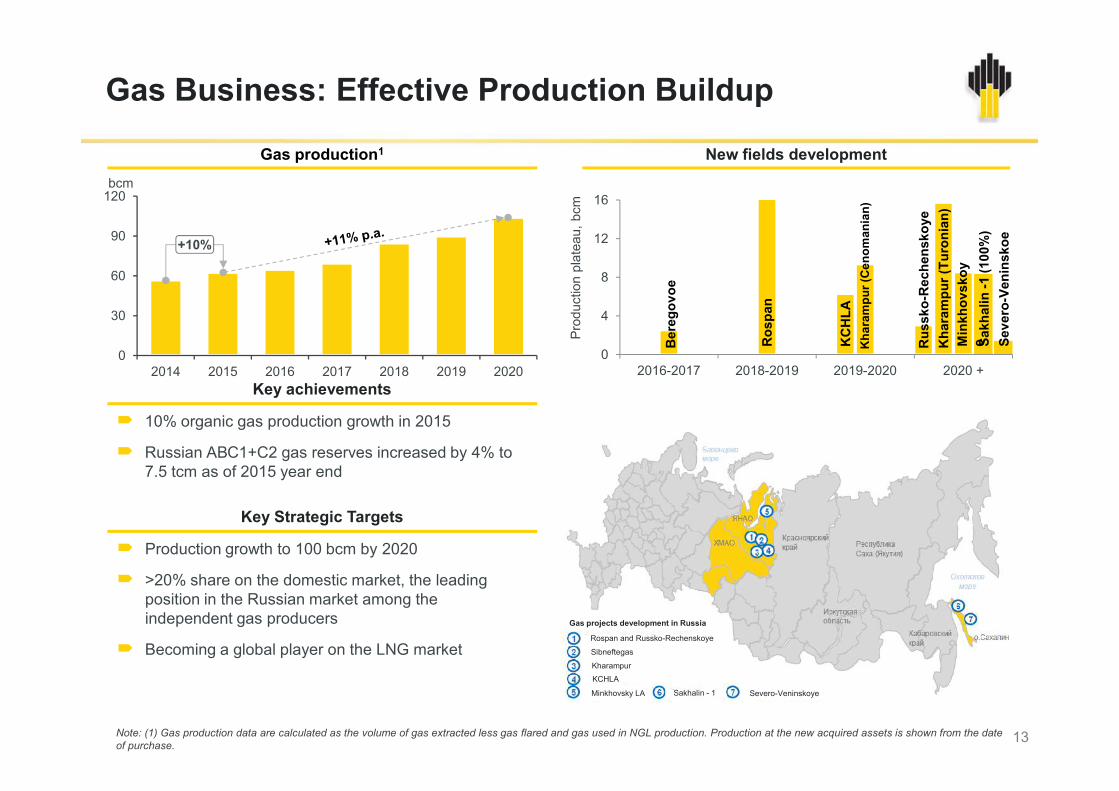
Gas Business: Effective Production Buildup
Key achievements
Gas production1
bcm
0
30
60
90
120
2014 2015 2016 2017 2018 2019 20200
4
8
12
16
2016-2017 2018-2019 2019-2020 2020 +
Prod
uctio
n pl
atea
u, b
cm
Ber
egov
oe
Ros
pan
KC
HLA
Kha
ram
pur (
Cen
oman
ian)
Rus
sko-
Rec
hens
koye
Kha
ram
pur (
Turo
nian
)M
inkh
ovsk
oye Sa
khal
in-1
(100
%)
Seve
ro-V
enin
skoe
New fields development
+10%
13
10% organic gas production growth in 2015
Russian АВС1+С2 gas reserves increased by 4% to7.5 tcm as of 2015 year end
Key achievements
Key Strategic Targets
Production growth to 100 bcm by 2020
>20% share on the domestic market, the leadingposition in the Russian market among theindependent gas producers
Becoming a global player on the LNG market
Note: (1) Gas production data are calculated as the volume of gas extracted less gas flared and gas used in NGL production. Production at the new acquired assets is shown from the dateof purchase.
Rospan and Russko-Rechenskoye
Sibneftegas
Kharampur
KCHLA
Gas projects development in Russia
Sakhalin - 1 Severo-VeninskoyeMinkhovsky LA
less than 5 bcmmore than 5 bcm
KhMAO
KaliningradRegion
Bashkortostan
Perm Kray
SverdlovskRegion
MoscowRegion
KrasnodarRegion
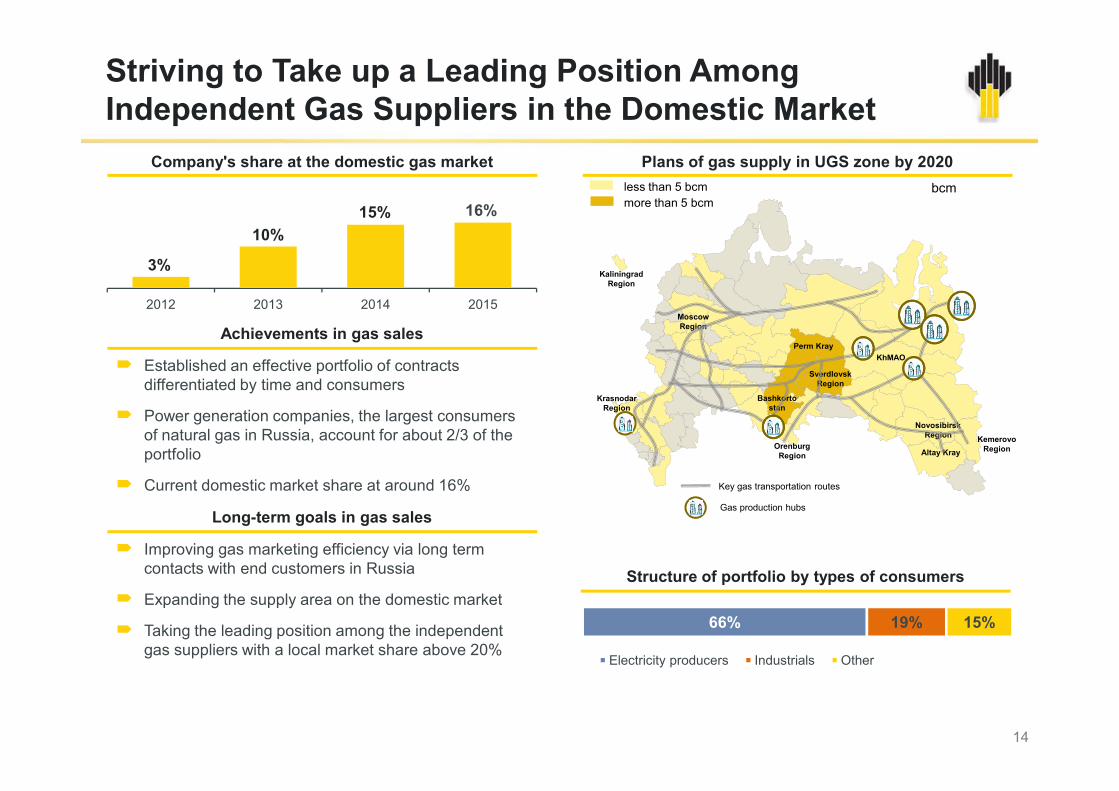
Company's share at the domestic gas market
2012 2013 2014 2015
3%
10%15% 16%
Plans of gas supply in UGS zone by 2020
Achievements in gas sales
Established an effective portfolio of contractsdifferentiated by time and consumers
Power generation companies, the largest consumersof natural gas in Russia, account for about 2/3 of theportfolio
Current domestic market share at around 16%
bcm
Striving to Take up a Leading Position AmongIndependent Gas Suppliers in the Domestic Market
14
Key gas transportation routes
Gas production hubs
66% 19% 15%
Electricity producers Industrials Other
KemerovoRegion
Bashkortostan
KrasnodarRegion
NovosibirskRegion
Altay KrayOrenburg
Region
Long-term goals in gas sales
Established an effective portfolio of contractsdifferentiated by time and consumers
Power generation companies, the largest consumersof natural gas in Russia, account for about 2/3 of theportfolio
Current domestic market share at around 16%
Improving gas marketing efficiency via long termcontacts with end customers in Russia
Expanding the supply area on the domestic market
Taking the leading position among the independentgas suppliers with a local market share above 20%
Structure of portfolio by types of consumers

85 87 8588
9451%
59%
80% 81%
100%
54%
55% 55% 55%
69%
0%
20%
40%
60%
80%
100%
0
16
31
47
63
79
94
2013 2014 2015 2017 Modernizationcompletion
Key achievements for 2015
Light product yield improved from 54.8% to 55.3%,refining depth increased from 65.3% to 66.5%
Full transition to Euro-5 motor fuels production for theRussian market in accordance with TechnicalRegulations requirements
Commissioning of isomerization units at Kuibyshevrefinery, at Novokuybyshev refinery and at Ryazanrefinery and launching MTBE in Angarskpetrochemical company
Reconstruction of catalytic reforming unit at Syzranand Kuybyshev refineries completed
Processing and production of motor fuel1
Rosneft Continues the Refining Modernization in Russia
46%
49%
51%
55%
56%
60%
60%
63%
Ryazan Refinery
Achinsk Refinery
Angarsk PCC
Komsomolsk Refinery
Novokuybyshev Refinery
Syzran Refinery
Tuapse Refinery
Kuybyshev Refinery
2013 2014 2015 2017 ModernizationcompletionRefinery thoughput in Russia, mmt
Gasoline and diesel Euro-4/5 production share,%Light product yield,%
15
Progress in refineries upgrade program
Light product yield improved from 54.8% to 55.3%,refining depth increased from 65.3% to 66.5%
Full transition to Euro-5 motor fuels production for theRussian market in accordance with TechnicalRegulations requirements
Commissioning of isomerization units at Kuibyshevrefinery, at Novokuybyshev refinery and at Ryazanrefinery and launching MTBE in Angarskpetrochemical company
Reconstruction of catalytic reforming unit at Syzranand Kuybyshev refineries completed
Note: (1) W/o FEPCO project; share of motor fuel and diesel fuel – w/o mini refineries
Plans for 2016
Increased production of high-margin petroleumproducts by reducing the production of fuel oil
Implementation of the import substitution program inthe area of chemicals, catalysts and additives to motorfuels
Further construction of facilities within the refinerymodernization program
Implementation of the program for efficiencyimprovement and maintaining assets
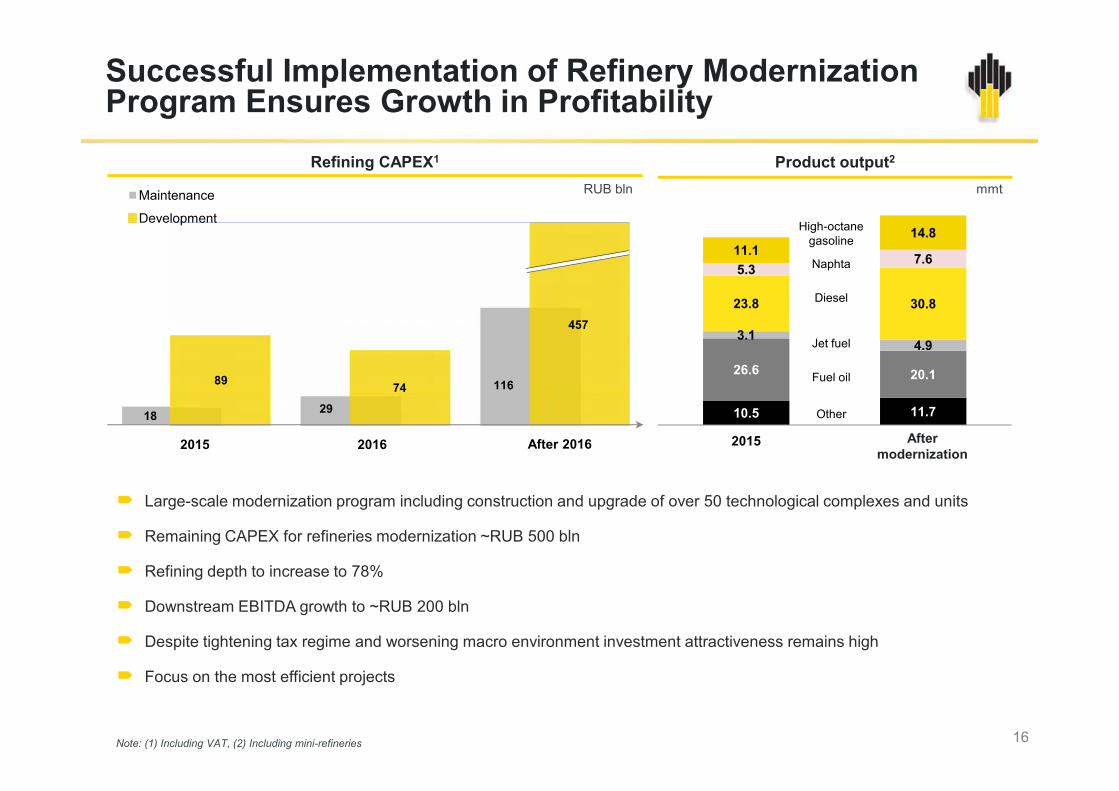
26.6 20.1
3.14.9
23.8 30.8
5.37.611.1
14.8High-octanegasoline
Naphta
Diesel
Jet fuel
Fuel oil11689 74
457
Maintenance
Development
Refining CAPEX1 Product output2
RUB bln mmt
Successful Implementation of Refinery ModernizationProgram Ensures Growth in Profitability
10.5 11.7
2015 После модернизации
Other
Large-scale modernization program including construction and upgrade of over 50 technological complexes and units
Remaining CAPEX for refineries modernization ~RUB 500 bln
Refining depth to increase to 78%
Downstream EBITDA growth to ~RUB 200 bln
Despite tightening tax regime and worsening macro environment investment attractiveness remains high
Focus on the most efficient projects
18 29
2016 After 20162015
Note: (1) Including VAT, (2) Including mini-refineries 16
Aftermodernization

Refinery Modernization Effect
Modernization effect+7.5 $/bbl
Average refining margin growth1
2.6
10.1
4.0
Tax maneuver effect-1.4 $/bbl
$/bbl
Rosneft (2014) Rosneft without modernization Rosneft with modernization
17Note: (1) Refining margins calculated assuming the following macro parameters: crude oil price of $55 per bbl of Brent and exchange rate of RUB 62,5 per USD
2.64.0
Following the modernization at Russian refineries refining depth will increase to >78%, light product yield will reach ~67%,production of motor fuels conforming technical regulations will grow to 50 mtpa
Refinery modernization and upgrade CAPEX will total c. RUB 1.1 trln (incl. VAT) of which >RUB 700 bln already financed
Worsening macro and refining margins decline following tax maneuver reduced financial options for capital-intensemodernization program. However the Company preserved almost all projects in its portfolio and continued theirimplementation within existing financial constraints

Refineries primaryrefining
vacuumblock
isomerization
catcracking
hydrotreatment
reforming alkylation coking1 hydrocra
cking MTBE
Ryazan
Angarsky
Novokuibyshevsky
Syzransky
Refinery Modernization Roadmap
Note: (1) Delayed coking or flexicoking
Kuibyshevsky
Komsomolsk
Touapsinskiy
Achinsk
Saratov
Effect Throughput Refiningdepth
Euro-5gasoline
Lightproduct
yield
Euro-5motorfuels
Euro-5gasoline
Euro-5gasoline
Refiningdepth
Lightproduct
yield
Euro-5gasoline
Construction completed Completion in 2017+ UpgradeCompletion in 2016
unit capacity 18

Crude oil sales channels
20%
70%
9% 1%
AsiaEurope and otherCIS
200835%
52%
8% 5%
Efficient Oil Marketing
Focus on optimizing logistics and maximizing netbacks
Supplies to Asian market up 120% for last 4 years; recordhigh volumes at 39.7 mmt in 2015
Further increase in supply expected to 49.5 mmt by 2020(42% of total crude oil export)
Current portfolio of LT supply contracts offers sustainablehigh-margin realization channels at the market pricingterms ensuring highly profitable resources monetization
35%
52%
8% 5%
1H 2016
19
CISDomestic
$ bln
Prepayments under LT crude oil supply contractsLong term crude oil supply contracts1
Direction Partner Average annualvolumes (mmt)² Duration
China CNPC, Transneft up to 40³ 10-27 years
Novorossiysk/Primorsk/Ust-Luga
Glencore, Vitol,Trafigura, BP 13 5 years
Germany Totsa, RTSA 11 2-3 years
Poland Orlen, GrupaLOTOS S.A. 12 3-7 years
Czech Orlen 2 3 years
Domestic market Afipsky Refinery 2 3 years
Note: (1) The list of contracts in force as of March 2016 including duration (2) Volumes for a given year may differ from average volumes (3) The number assumes potential increase ofannual supplies from 7 to 10 mmtpa
14.8
29.7
42.5 40.9
received 2013 received 2014 received 2015 repaid 2Q2016

CAPEX and HC production
Flexible Investment Program
23.8
22.3
21.8
20.3
19.0
17.0
10.1
9.5
4.3
2015 Upstream Capex: benchmarking$/boe
0
1 400
2 800
4 200
5 600
0
300
600
900
RUB bln kboed
595533
308
Note: (1) Including international and off-shore projects
Flexible investment program: quick response to changes inmacro environment
Stability of strategic objectives:
production increase with a focus on the most efficientprojects,
meeting the license and inter-governmental obligationsincluding the provision of oil and petroleum productsupplies,
preserving the market share
2016-17 Capex: new Upstream projects1 ~ RUB 620 bln,Downstream development projects ~ RUB 160 bln.
Sustaining leadership in E&P unit CAPEX
20
0
250
500
750
1000
2014 2015 2016-2017 range
Upstream (brownfields) Upstream (greenfields)Downstream (existing) Downstream (new)Other
595
CAPEXRUB bln
533
1
33.5
23.8002014 2015 H1 2016
Upstream Downtream Other HC Production
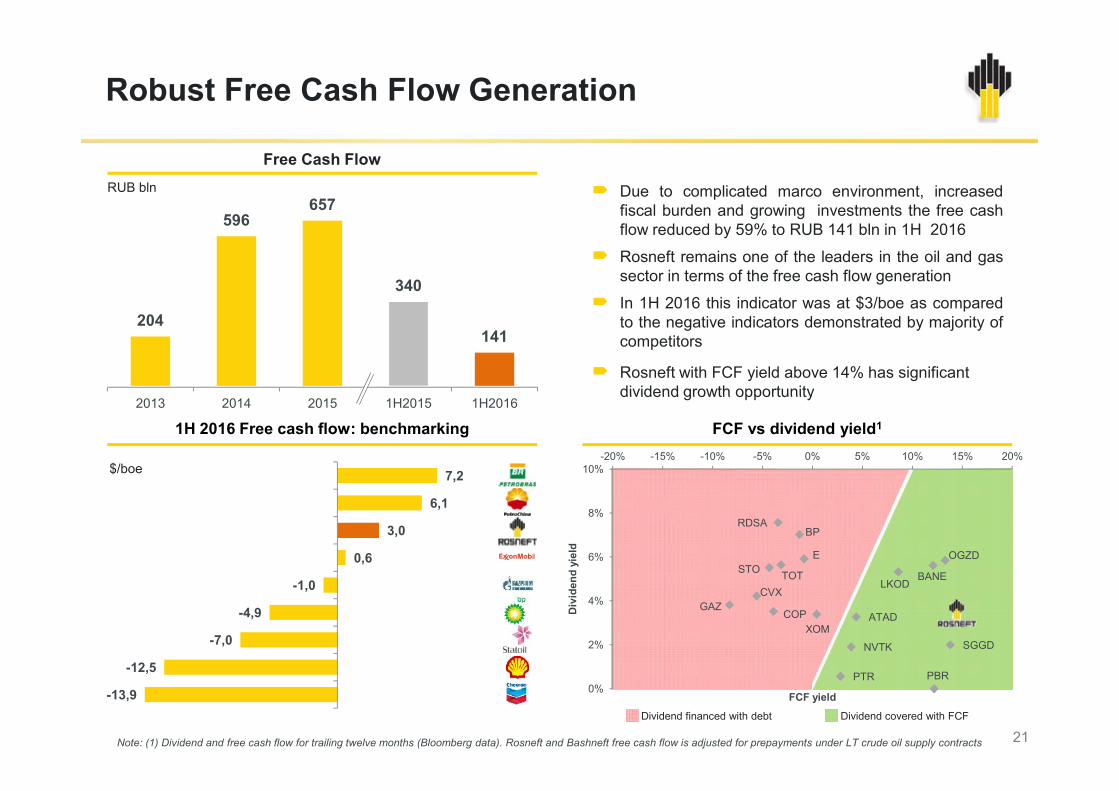
204
596657
340
141
Due to complicated marco environment, increasedfiscal burden and growing investments the free cashflow reduced by 59% to RUB 141 bln in 1H 2016
Rosneft remains one of the leaders in the oil and gassector in terms of the free cash flow generation
In 1H 2016 this indicator was at $3/boe as comparedto the negative indicators demonstrated by majority ofcompetitors
Rosneft with FCF yield above 14% has significantdividend growth opportunity
RUB bln
Free Cash Flow
Robust Free Cash Flow Generation
2013 2014 2015 1H2015 1H2016
Due to complicated marco environment, increasedfiscal burden and growing investments the free cashflow reduced by 59% to RUB 141 bln in 1H 2016
Rosneft remains one of the leaders in the oil and gassector in terms of the free cash flow generation
In 1H 2016 this indicator was at $3/boe as comparedto the negative indicators demonstrated by majority ofcompetitors
Rosneft with FCF yield above 14% has significantdividend growth opportunity
21
FCF vs dividend yield1
Dividend financed with debt Dividend covered with FCF
$/boe
1H 2016 Free cash flow: benchmarking
-13,9
-12,5
-7,0
-4,9
-1,0
0,6
3,0
6,1
7,2
SGGD
OGZD
PBR
BANELKOD
ATAD
NVTK
PTR
XOM
E
BP
TOT
RDSA
COP
STO
CVXGAZ
0%
2%
4%
6%
8%
10%-20% -15% -10% -5% 0% 5% 10% 15% 20%
Div
iden
d yi
eld
FCF yield
Note: (1) Dividend and free cash flow for trailing twelve months (Bloomberg data). Rosneft and Bashneft free cash flow is adjusted for prepayments under LT crude oil supply contracts
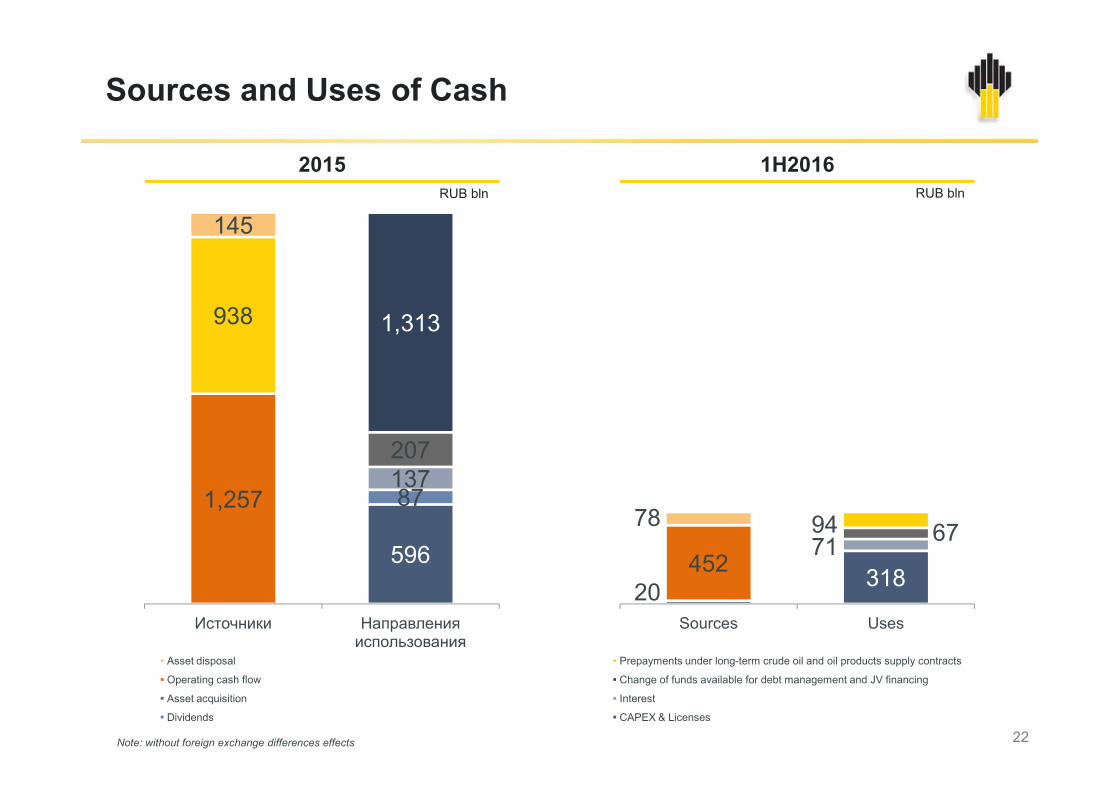
1,313938
145RUB bln
2015 1H2016RUB bln
Sources and Uses of Cash
596
87137207
1,257
Источники Направленияиспользования
Asset disposal Prepayments under long-term crude oil and oil products supply contracts
Operating cash flow Change of funds available for debt management and JV financing
Asset acquisition Interest
Dividends CAPEX & Licenses
31871 67
20452
9478
Sources Uses
22Note: without foreign exchange differences effects
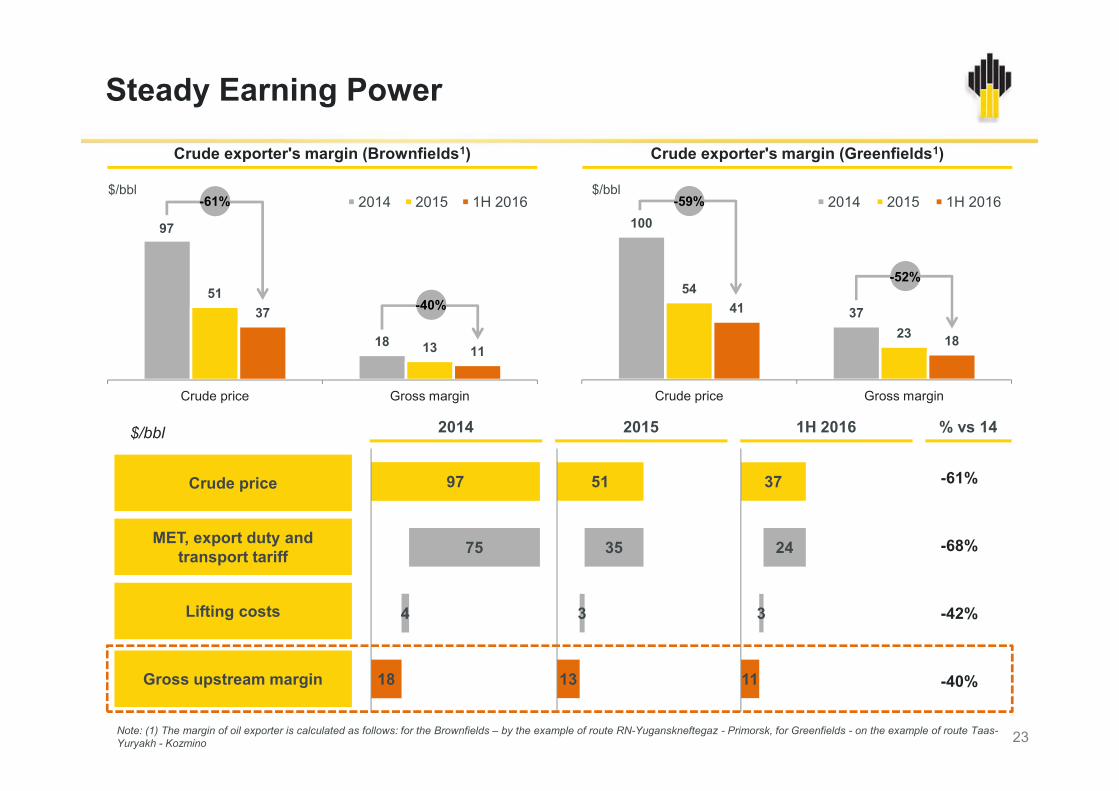
Crude exporter's margin (Brownfields1) Crude exporter's margin (Greenfields1)
$/bbl $/bbl
Steady Earning Power
100
37
54
23
41
18
Crude price Gross margin
2014 2015 1H 2016
18
51
13
37
11
Crude price Gross margin
2014 2015 1H 2016
97
-61%
-40%
-59%
-52%
23
$/bbl
Crude price
MET, export duty andtransport tariff
Lifting costs
Gross upstream margin
Note: (1) The margin of oil exporter is calculated as follows: for the Brownfields – by the example of route RN-Yuganskneftegaz - Primorsk, for Greenfields - on the example of route Taas-Yuryakh - Kozmino
Crude price Gross marginCrude price Gross margin
51
35
3
13
97
75
4
18
2014 2015 % vs 14
-61%
-68%
-42%
-40%
1H 2016
37
24
3
11
Financial Stability
39.924.5 23.2 23.9 23.4
14.4
23.0 22.4 23.6 22.3
1.7
1.2 1.1 1.21.3
0,00,20,40,60,81,01,21,41,61,8
0
10
20
30
40
50
60
70
80
Q2 2015 Q3 2015 Q4 2015 Q1 2016 Q2 2016
54.3 47.5 45.6 47.5 45.7
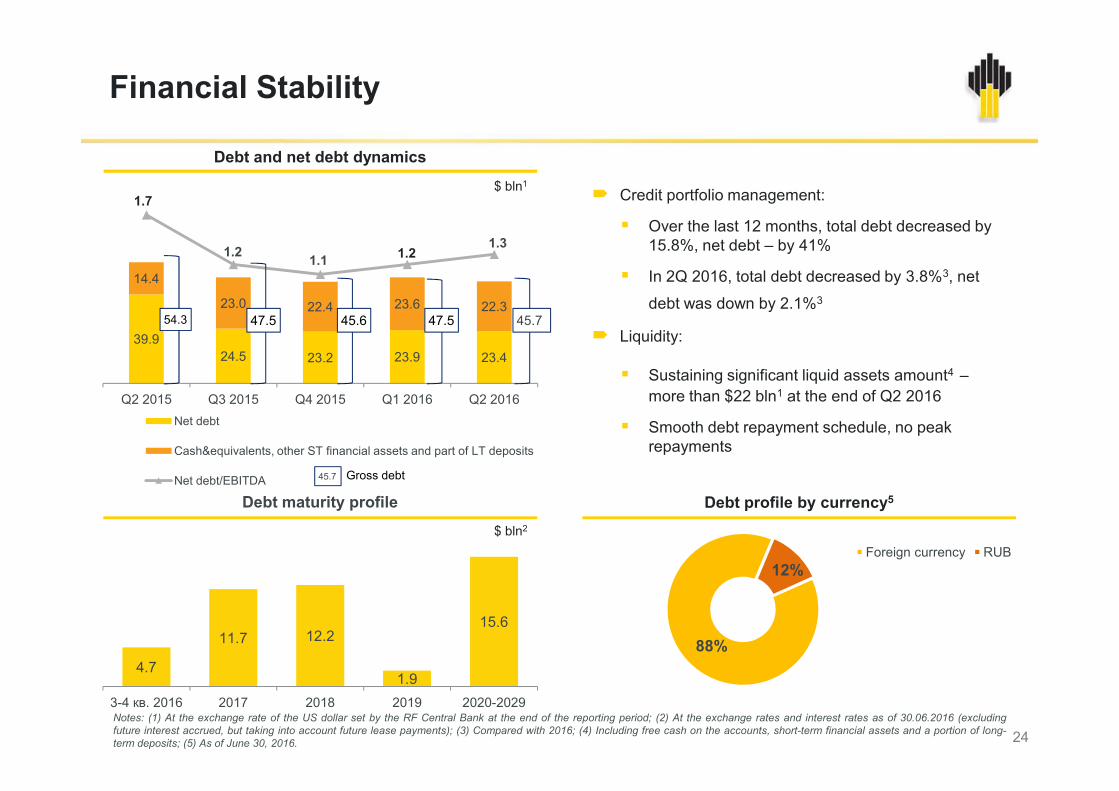
Debt and net debt dynamics
$ bln1 Credit portfolio management:
Over the last 12 months, total debt decreased by15.8%, net debt – by 41%
In 2Q 2016, total debt decreased by 3.8%3, net
debt was down by 2.1%3
Liquidity:
Sustaining significant liquid assets amount4 –more than $22 bln1 at the end of Q2 2016
Smooth debt repayment schedule, no peakrepayments
24
Q2 2015 Q3 2015 Q4 2015 Q1 2016 Q2 2016Net debt
Cash&equivalents, other ST financial assets and part of LT deposits
Net debt/EBITDA 45.7 Gross debt
Notes: (1) At the exchange rate of the US dollar set by the RF Central Bank at the end of the reporting period; (2) At the exchange rates and interest rates as of 30.06.2016 (excludingfuture interest accrued, but taking into account future lease payments); (3) Compared with 2016; (4) Including free cash on the accounts, short-term financial assets and a portion of long-term deposits; (5) As of June 30, 2016.
88%
12%Foreign currency RUB
Debt profile by currency5Debt maturity profile
4.7
11.7 12.2
1.9
15.6
3-4 кв. 2016 2017 2018 2019 2020-2029
$ bln2
Credit portfolio management:
Over the last 12 months, total debt decreased by15.8%, net debt – by 41%
In 2Q 2016, total debt decreased by 3.8%3, net
debt was down by 2.1%3
Liquidity:
Sustaining significant liquid assets amount4 –more than $22 bln1 at the end of Q2 2016
Smooth debt repayment schedule, no peakrepayments

Dividend payments and oil prices
Sustainable Dividend Payments / High Yields
Dividends paid since the IPO totaled ~ RUB 615 bln
DPS CAGR since the IPO >25%
Dividend payout ratio of no less than 25% of IFRS netincome starting 2011
RUB 11.75 per share (RUB 124.5 bln, 35% of IFRS netprofit) – dividend for 2015,+43% YoY
1,3 1,6 1,9 2,3 2,87,5 8,1
9.2*8,2
11.8
61,7
111,3 108,7
0,000,501,001,502,002,503,003,504,004,505,005,506,006,507,007,508,008,509,009,5010,0010,5011,0011,5012,0012,5013,0013,5014,0014,5015,0015,5016,0016,5017,0017,5018,0018,5019,0019,5020,0020,5021,0021,5022,0022,5023,0023,5024,0024,5025,0025,5026,0026,5027,0027,5028,0028,5029,0029,5030,0030,5031,0031,5032,0032,5033,0033,5034,0034,5035,0035,5036,0036,5037,0037,5038,0038,5039,0039,5040,0040,5041,0041,5042,0042,5043,0043,5044,0044,5045,0045,5046,0046,5047,0047,5048,0048,5049,0049,5050,0050,5051,0051,5052,0052,5053,0053,5054,0054,5055,0055,5056,0056,5057,0057,5058,0058,5059,0059,5060,0060,5061,0061,5062,0062,5063,0063,5064,0064,5065,0065,5066,0066,5067,0067,5068,0068,5069,0069,5070,0070,5071,0071,5072,0072,5073,0073,5074,0074,5075,0075,5076,0076,5077,0077,5078,0078,5079,0079,5080,0080,5081,0081,5082,0082,5083,0083,5084,0084,5085,0085,5086,0086,5087,0087,5088,0088,5089,0089,5090,0090,5091,0091,5092,0092,5093,0093,5094,0094,5095,0095,5096,0096,5097,0097,5098,0098,5099,0099,50100,00100,50101,00101,50102,00102,50103,00103,50104,00104,50105,00105,50106,00106,50107,00107,50108,00108,50109,00109,50110,00110,50111,00111,50112,00112,50113,00113,50114,00114,50115,00115,50116,00116,50117,00117,50118,00118,50119,00119,50120,00
0
2
4
6
8
10
12
14
16
18
20DPS, RUB
Brent, $/bbl
3.7
12.9
25
19.75%
69.50%
10.75%
RussianFederation
Free float BP
Rosneft shareholders2Benchmarking free cash flow yield1
*Adjusted for RUB 167 bln revaluation effect of acquired TNK-BP assetsNote: (1) Calculated using LTM free cash flow, (2) As of June 1, 2016
1,3 1,6 1,9 0,000,501,001,502,002,503,003,504,004,505,005,500
2007 2008 2009 2010 2011 2012 2013 2014 2015 2016
13% 12%8% 5% 5% 4%
-11%

• OPEX control• Managing SGA and production costsBelow inflation
• CAPEX control• Review current project portfolio to increase profitabilityOptimization Optimization of investment portfolio, supplier relationship management
Control over manageable operating expenses
Financial Priorities
• Free cash flowPositive
• Dividend payoutNot less than 25%of IFRS net profit
• Preserving financial leverage near current levels~1.3-1.4x Optimal mix of external and internal financing
Provide consistently high shareholder returns
Generate free cash flow sufficient to fulfill all obligations
26
AppendixAppendix

Indicator 2015 2014 % 1H2016 %
EBITDA, RUB bln 1,245 1,057 17.8% 621 (7.3)%
Net income, RUB blnattributable to Rosneft shareholders
355 348 2.0% 103 (45.8)%
Adjusted net income1, RUB blnattributable to Rosneft shareholders
479 395 21.0% 248 (8.8)%
Adjusted operating cash flow2, RUB bln 1,252 1,129 10.9% 449 (26.3)%
Capital expenditures, RUB bln 595 533 11.6% 308 14.5%
Key Financial Indicators
Adjusted free cash flow2, RUB bln 657 596 10.2% 141 (58.5)%
EBITDA, $ bln 20.8 29.0 (28.3)% 9.0 (23.7)%
Net income, $ blnattributable to Rosneft shareholders 6.1 9.3 (34.4)% 1.6 (54.3)%
Adjusted net income1, RUB blnattributable to Rosneft shareholders 7.9 10.3 (24,0)% 3.5 (27.1)%
Adjusted operating cash flow2, $ bln 21.9 29.7 (26.3)% 7.2 (36.8)%
Capital expenditures, $ bln 9.7 13.9 (30.2)% 4.4 (6.4)%
Adjusted free cash flow2, $ bln 12.2 15.8 (22.8)% 2.8 (58.2)%
Urals,th. RUB/bbl
3.14 3.75 (16.3)% 2,67 (18.9)%
28Note: (1) Adjusted for foreign exchange differences and other one-off effects; (2) Adjusted for prepayments under long-term oil supply contracts and operations with trading securities.

Countries of operation
Canada
Gulf of Mexico
RussiaUkraine
Belarus
Germany
Italy
China
Norway Mongolia
Turkmenistan
VNKhK
Tianjinrefinery
Upstream assets
Refineries
India
Kyrgyzstan
Geography of Operations
Armenia
Georgia
Venezuela
Italy
Brazil
VietnamAlgeria
Upstream and downstream projects in 23 countries
821 licenses for hydrocarbons production in Russia and abroad1
Largest subsoil user in Russia: oil and condensate resources of 23 bln t, gas resources of 22.8 tcm2
11 refineries in Russia and stakes in 7 refineries abroad
A wide network of retail sites: 2,557 retail sites3
Note: (1) As of 2015 year end, (2) Including foreign projects, (3) As of Dec 31, 2015, including own and leased sites
CubaIndia
Egypt
IndonesiaMozambique
29