Embed Size (px)
Citation preview
13th Int Symp on Applications of Laser Techniques to Fluid Mechanics Lisbon, Portugal, 26-29 June, 2006
Paper # 1161
PIV Measurements in an Underexpanded Hot Free Jet
Christian Chauveau1, Dmitry M. Davidenko1, Brahim Sarh1, Iskender Gökalp1,
Valery Avrashkov2, Christian Fabre3
1: Laboratoire de Combustion et Systèmes Réactifs, CNRS, Orléans, France, [email protected]
2: Moscow Aviation Institute (Technical University), Moscow, Russia, [email protected] 3: Airbus France, Toulouse, France, [email protected]
Abstract The objective of the work reported herein is to demonstrate the ability of the PIV technique to provide correct measurements of the velocity field in steady underexpanded hot free jets. A hot-gas generator capable to create jets with an initial diameter of 25 mm, total pressure up to 4 MPa, and total temperature up to 2200 K is presented together with the associated technique of stagnation conditions determination. The implementation of the PIV method is described paying attention to the choice of the PIV system components and to the seeding technique. Experimental results are presented on the observed jet structure and directly measured geometry of the Mach disk. The results on the velocity field are analyzed considering the effect of the kind of seeding particles as well as the jet stagnation conditions. Results from the experiment and numerical simulation are compared to validate the measurements of the velocity field. 1. Introduction The context of the present study is the survivability of the wing-engine propulsion system of aircrafts exposed to engine fire. Design precautions must be taken to minimize the effect on the engine nacelle in case of a combustion chamber burnthrough event. Actual international regulations for aircraft safety impose, first, the capability of the engine frame to operate under conditions of a hot-gas impact during three minutes and, second, the presence of the necessary thermal shielding of its structural elements. The demonstration of these capabilities for aircraft safety certification requires both experimental and computational effort. In this context, a joint study between AIRBUS–France, the French National Scientific Research Center (CNRS) and the Moscow Aviation Institute (MAI) is conducted. A hot-gas generator has been developed and tested at MAI providing the required range of flow parameters in the hot jet of combustion products (total pressure up to 4 MPa and total temperature up to 2200 K). One of the objectives of the joint study was the experimental characterization of the velocity field of the hot free jet. The method of Particles Image Velocimetry (PIV) was chosen for this purpose. The PIV technique is fluently applied to subsonic flows whereas PIV measurements in supersonic flows are rare in the literature. PIV was used in supersonic wind tunnels (Johé et al. 1996). In this kind of installations, the flow stagnation conditions are such that the maximum velocity never exceeds 1000 m/s even at a Mach number of 6 (Humphreys et al. 1993). Recently, PIV was applied and validated in a shock tube (Haertig et al. 2001) where a velocity of around 1500 m/s (M = 4.5) was accurately measured. PIV measurements were also conducted at ONERA (Weisgerber et al. 2001) under conditions comparable to those met in the present study in terms of flow velocity and temperature. 2. Hot-gas generator The investigated jets were obtained at the exit of a hot-gas generator, which can be viewed as a cylindrical combustion chamber with a sonic throat at its outlet. The main dimensions of the
- 1 -
13th Int Symp on Applications of Laser Techniques to Fluid Mechanics Lisbon, Portugal, 26-29 June, 2006
Paper # 1161
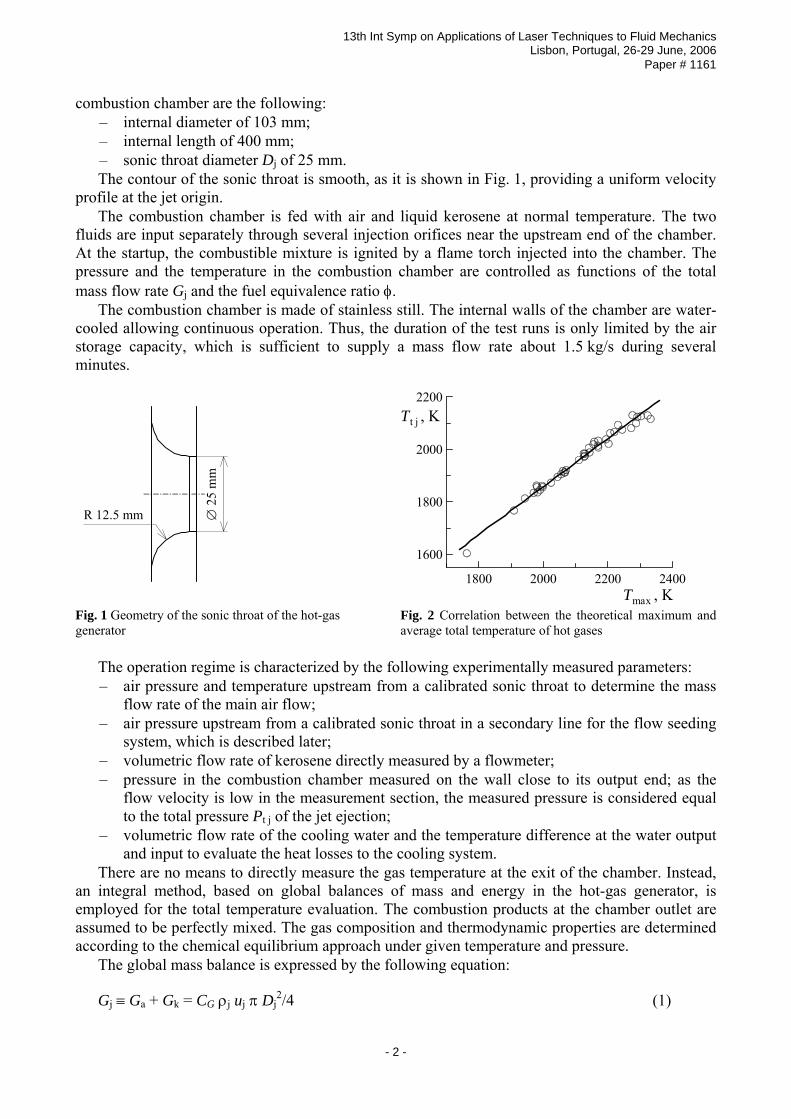
combustion chamber are the following: – internal diameter of 103 mm; – internal length of 400 mm; – sonic throat diameter Dj of 25 mm.
The contour of the sonic throat is smooth, as it is shown in Fig. 1, providing a uniform velocity profile at the jet origin. The combustion chamber is fed with air and liquid kerosene at normal temperature. The two fluids are input separately through several injection orifices near the upstream end of the chamber. At the startup, the combustible mixture is ignited by a flame torch injected into the chamber. The pressure and the temperature in the combustion chamber are controlled as functions of the total mass flow rate Gj and the fuel equivalence ratio φ. The combustion chamber is made of stainless still. The internal walls of the chamber are water-cooled allowing continuous operation. Thus, the duration of the test runs is only limited by the air storage capacity, which is sufficient to supply a mass flow rate about 1.5 kg/s during several minutes.
∅ 2
5 m
m
R 12.5 mm
Fig. 1 Geometry of the sonic throat of the hot-gas generator
1800 2000 2200 2400Tmax , K
1600
1800
2000
2200Tt j , K
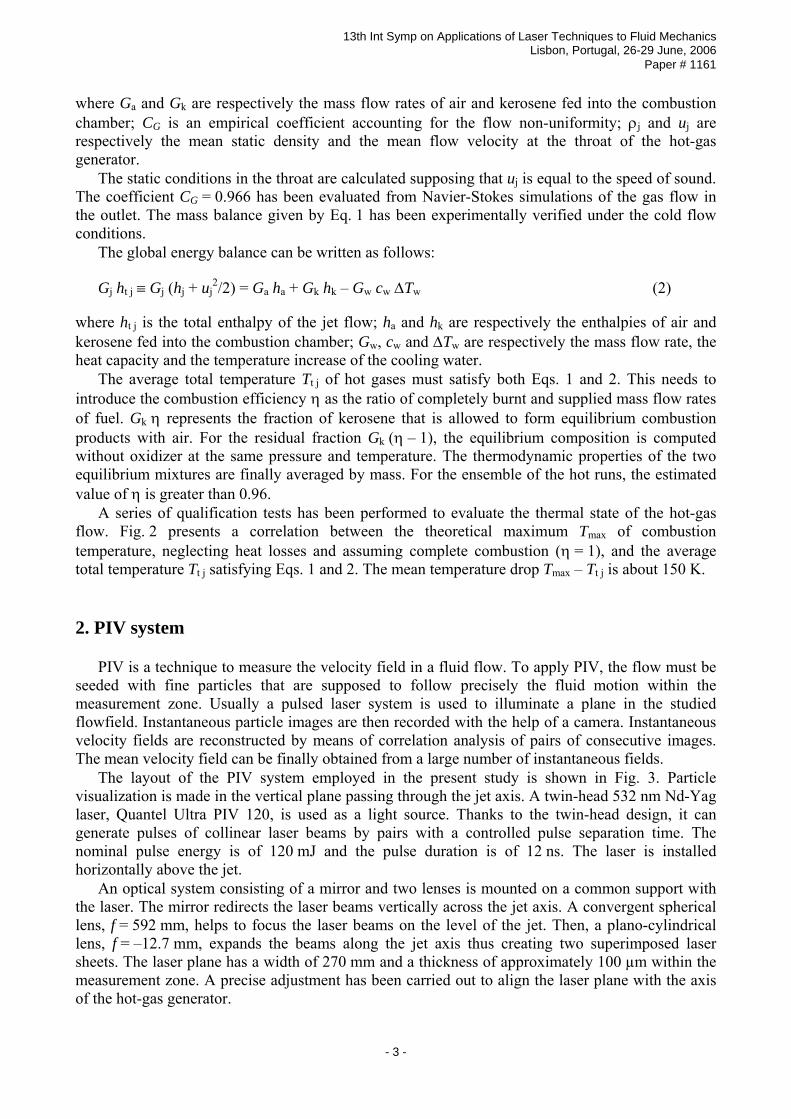
Fig. 2 Correlation between the theoretical maximum and average total temperature of hot gases
The operation regime is characterized by the following experimentally measured parameters:
– air pressure and temperature upstream from a calibrated sonic throat to determine the mass flow rate of the main air flow;
– air pressure upstream from a calibrated sonic throat in a secondary line for the flow seeding system, which is described later;
– volumetric flow rate of kerosene directly measured by a flowmeter; – pressure in the combustion chamber measured on the wall close to its output end; as the
flow velocity is low in the measurement section, the measured pressure is considered equal to the total pressure Pt j of the jet ejection;
– volumetric flow rate of the cooling water and the temperature difference at the water output and input to evaluate the heat losses to the cooling system.
There are no means to directly measure the gas temperature at the exit of the chamber. Instead, an integral method, based on global balances of mass and energy in the hot-gas generator, is employed for the total temperature evaluation. The combustion products at the chamber outlet are assumed to be perfectly mixed. The gas composition and thermodynamic properties are determined according to the chemical equilibrium approach under given temperature and pressure. The global mass balance is expressed by the following equation:
Gj ≡ Ga + Gk = CG ρj uj π Dj2/4 (1)
- 2 -
13th Int Symp on Applications of Laser Techniques to Fluid Mechanics Lisbon, Portugal, 26-29 June, 2006
Paper # 1161
where Ga and Gk are respectively the mass flow rates of air and kerosene fed into the combustion chamber; CG is an empirical coefficient accounting for the flow non-uniformity; ρj and uj are respectively the mean static density and the mean flow velocity at the throat of the hot-gas generator. The static conditions in the throat are calculated supposing that uj is equal to the speed of sound. The coefficient CG = 0.966 has been evaluated from Navier-Stokes simulations of the gas flow in the outlet. The mass balance given by Eq. 1 has been experimentally verified under the cold flow conditions. The global energy balance can be written as follows:
Gj ht j ≡ Gj (hj + uj2/2) = Ga ha + Gk hk – Gw cw ∆Tw (2)
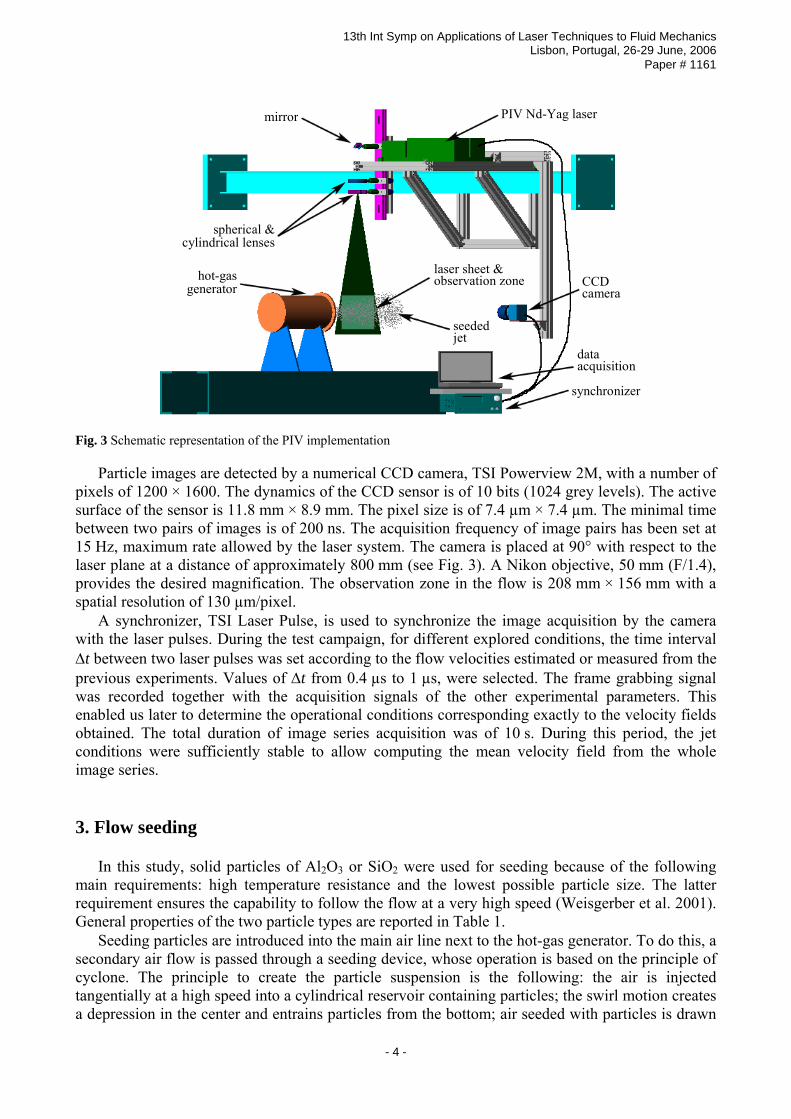
where ht j is the total enthalpy of the jet flow; ha and hk are respectively the enthalpies of air and kerosene fed into the combustion chamber; Gw, cw and ∆Tw are respectively the mass flow rate, the heat capacity and the temperature increase of the cooling water. The average total temperature Tt j of hot gases must satisfy both Eqs. 1 and 2. This needs to introduce the combustion efficiency η as the ratio of completely burnt and supplied mass flow rates of fuel. Gk η represents the fraction of kerosene that is allowed to form equilibrium combustion products with air. For the residual fraction Gk (η – 1), the equilibrium composition is computed without oxidizer at the same pressure and temperature. The thermodynamic properties of the two equilibrium mixtures are finally averaged by mass. For the ensemble of the hot runs, the estimated value of η is greater than 0.96. A series of qualification tests has been performed to evaluate the thermal state of the hot-gas flow. Fig. 2 presents a correlation between the theoretical maximum Tmax of combustion temperature, neglecting heat losses and assuming complete combustion (η = 1), and the average total temperature Tt j satisfying Eqs. 1 and 2. The mean temperature drop Tmax – Tt j is about 150 K. 2. PIV system PIV is a technique to measure the velocity field in a fluid flow. To apply PIV, the flow must be seeded with fine particles that are supposed to follow precisely the fluid motion within the measurement zone. Usually a pulsed laser system is used to illuminate a plane in the studied flowfield. Instantaneous particle images are then recorded with the help of a camera. Instantaneous velocity fields are reconstructed by means of correlation analysis of pairs of consecutive images. The mean velocity field can be finally obtained from a large number of instantaneous fields. The layout of the PIV system employed in the present study is shown in Fig. 3. Particle visualization is made in the vertical plane passing through the jet axis. A twin-head 532 nm Nd-Yag laser, Quantel Ultra PIV 120, is used as a light source. Thanks to the twin-head design, it can generate pulses of collinear laser beams by pairs with a controlled pulse separation time. The nominal pulse energy is of 120 mJ and the pulse duration is of 12 ns. The laser is installed horizontally above the jet. An optical system consisting of a mirror and two lenses is mounted on a common support with the laser. The mirror redirects the laser beams vertically across the jet axis. A convergent spherical lens, f = 592 mm, helps to focus the laser beams on the level of the jet. Then, a plano-cylindrical lens, f = –12.7 mm, expands the beams along the jet axis thus creating two superimposed laser sheets. The laser plane has a width of 270 mm and a thickness of approximately 100 µm within the measurement zone. A precise adjustment has been carried out to align the laser plane with the axis of the hot-gas generator.
- 3 -
13th Int Symp on Applications of Laser Techniques to Fluid Mechanics Lisbon, Portugal, 26-29 June, 2006
Paper # 1161
mirror PIV Nd-Yag laser
spherical &cylindrical lenses
hot-gasgenerator
laser sheet &observation zone CCD
camera
data acquisition
synchronizer
seededjet
Fig. 3 Schematic representation of the PIV implementation
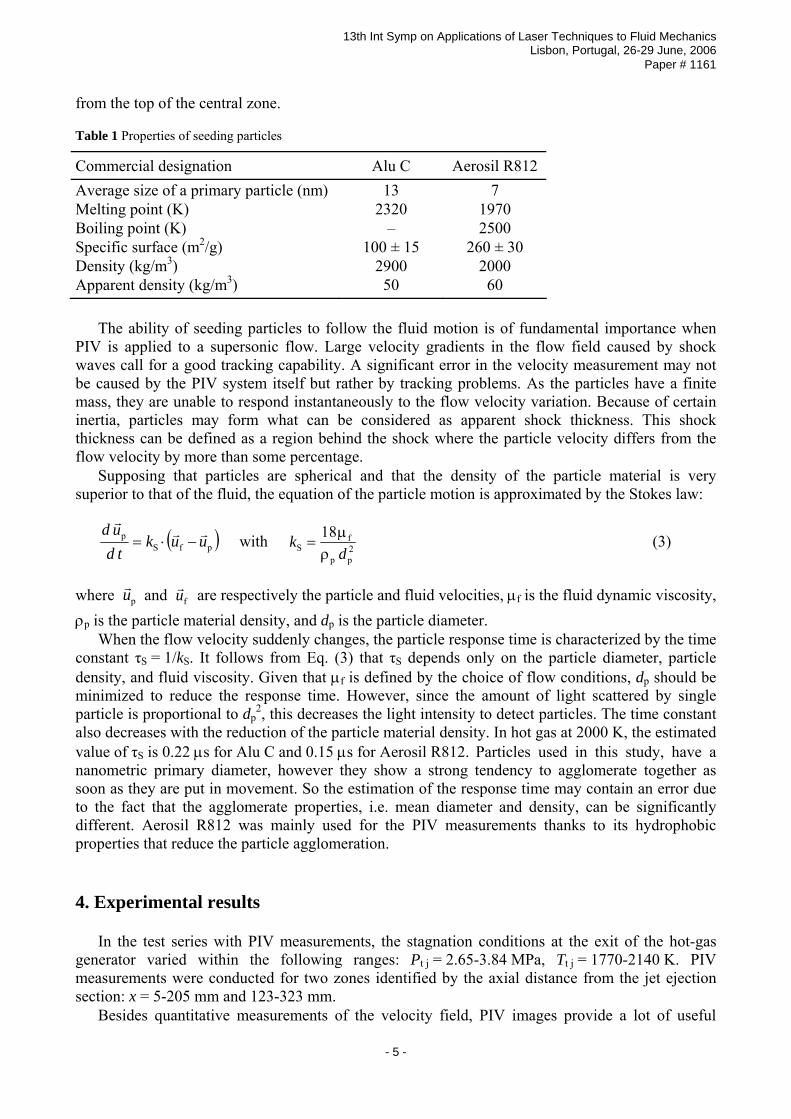
Particle images are detected by a numerical CCD camera, TSI Powerview 2M, with a number of pixels of 1200 × 1600. The dynamics of the CCD sensor is of 10 bits (1024 grey levels). The active surface of the sensor is 11.8 mm × 8.9 mm. The pixel size is of 7.4 µm × 7.4 µm. The minimal time between two pairs of images is of 200 ns. The acquisition frequency of image pairs has been set at 15 Hz, maximum rate allowed by the laser system. The camera is placed at 90° with respect to the laser plane at a distance of approximately 800 mm (see Fig. 3). A Nikon objective, 50 mm (F/1.4), provides the desired magnification. The observation zone in the flow is 208 mm × 156 mm with a spatial resolution of 130 µm/pixel. A synchronizer, TSI Laser Pulse, is used to synchronize the image acquisition by the camera with the laser pulses. During the test campaign, for different explored conditions, the time interval ∆t between two laser pulses was set according to the flow velocities estimated or measured from the previous experiments. Values of ∆t from 0.4 µs to 1 µs, were selected. The frame grabbing signal was recorded together with the acquisition signals of the other experimental parameters. This enabled us later to determine the operational conditions corresponding exactly to the velocity fields obtained. The total duration of image series acquisition was of 10 s. During this period, the jet conditions were sufficiently stable to allow computing the mean velocity field from the whole image series. 3. Flow seeding In this study, solid particles of Al2O3 or SiO2 were used for seeding because of the following main requirements: high temperature resistance and the lowest possible particle size. The latter requirement ensures the capability to follow the flow at a very high speed (Weisgerber et al. 2001). General properties of the two particle types are reported in Table 1. Seeding particles are introduced into the main air line next to the hot-gas generator. To do this, a secondary air flow is passed through a seeding device, whose operation is based on the principle of cyclone. The principle to create the particle suspension is the following: the air is injected tangentially at a high speed into a cylindrical reservoir containing particles; the swirl motion creates a depression in the center and entrains particles from the bottom; air seeded with particles is drawn
- 4 -
13th Int Symp on Applications of Laser Techniques to Fluid Mechanics Lisbon, Portugal, 26-29 June, 2006
Paper # 1161
from the top of the central zone.
Table 1 Properties of seeding particles
Commercial designation Alu C Aerosil R812 Average size of a primary particle (nm) 13 7 Melting point (K) 2320 1970 Boiling point (K) – 2500 Specific surface (m2/g) 100 ± 15 260 ± 30 Density (kg/m3) 2900 2000 Apparent density (kg/m3) 50 60 The ability of seeding particles to follow the fluid motion is of fundamental importance when PIV is applied to a supersonic flow. Large velocity gradients in the flow field caused by shock waves call for a good tracking capability. A significant error in the velocity measurement may not be caused by the PIV system itself but rather by tracking problems. As the particles have a finite mass, they are unable to respond instantaneously to the flow velocity variation. Because of certain inertia, particles may form what can be considered as apparent shock thickness. This shock thickness can be defined as a region behind the shock where the particle velocity differs from the flow velocity by more than some percentage. Supposing that particles are spherical and that the density of the particle material is very superior to that of the fluid, the equation of the particle motion is approximated by the Stokes law:
( pfSp uuktd
ud rrr
−⋅= ) with 2pp
fS
18d
kρµ
= (3)
where pur and ufr are respectively the particle and fluid velocities, µf is the fluid dynamic viscosity,
ρp is the particle material density, and dp is the particle diameter. When the flow velocity suddenly changes, the particle response time is characterized by the time constant τS = 1/kS. It follows from Eq. (3) that τS depends only on the particle diameter, particle density, and fluid viscosity. Given that µf is defined by the choice of flow conditions, dp should be minimized to reduce the response time. However, since the amount of light scattered by single particle is proportional to dp
2, this decreases the light intensity to detect particles. The time constant also decreases with the reduction of the particle material density. In hot gas at 2000 K, the estimated value of τS is 0.22 µs for Alu C and 0.15 µs for Aerosil R812. Particles used in this study, have a nanometric primary diameter, however they show a strong tendency to agglomerate together as soon as they are put in movement. So the estimation of the response time may contain an error due to the fact that the agglomerate properties, i.e. mean diameter and density, can be significantly different. Aerosil R812 was mainly used for the PIV measurements thanks to its hydrophobic properties that reduce the particle agglomeration. 4. Experimental results In the test series with PIV measurements, the stagnation conditions at the exit of the hot-gas generator varied within the following ranges: Pt j = 2.65-3.84 MPa, Tt j = 1770-2140 K. PIV measurements were conducted for two zones identified by the axial distance from the jet ejection section: x = 5-205 mm and 123-323 mm. Besides quantitative measurements of the velocity field, PIV images provide a lot of useful
- 5 -
13th Int Symp on Applications of Laser Techniques to Fluid Mechanics Lisbon, Portugal, 26-29 June, 2006
Paper # 1161
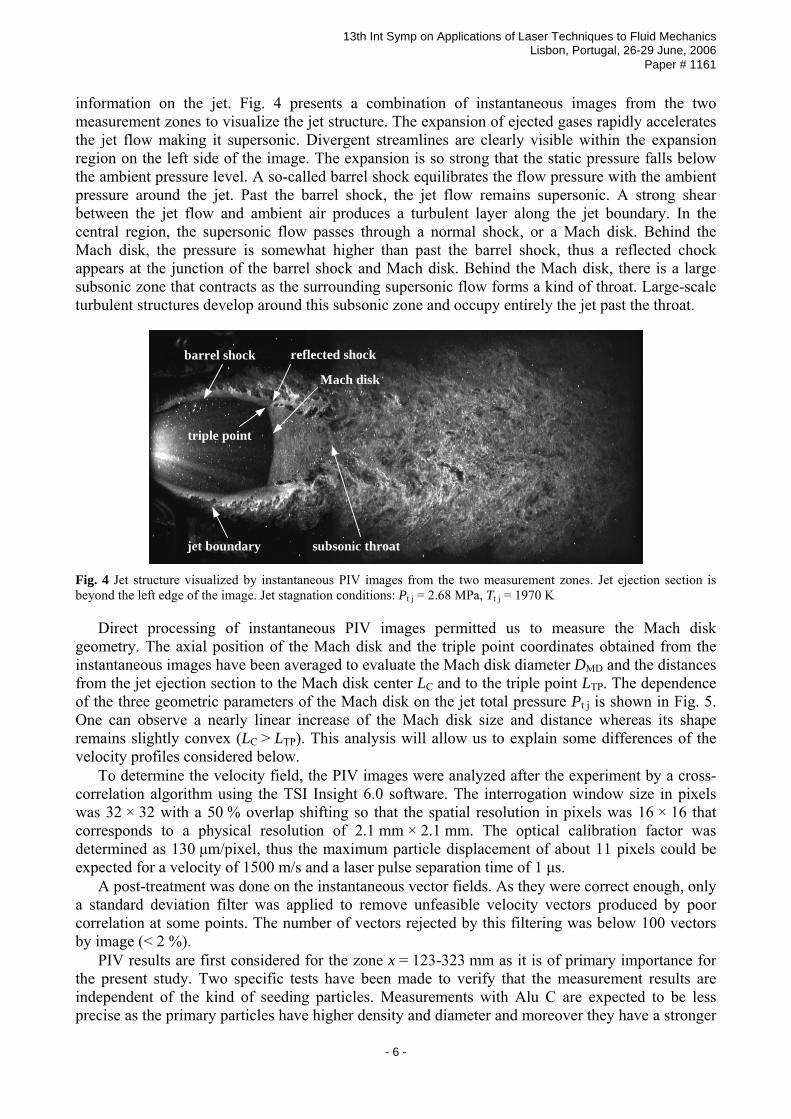
information on the jet. Fig. 4 presents a combination of instantaneous images from the two measurement zones to visualize the jet structure. The expansion of ejected gases rapidly accelerates the jet flow making it supersonic. Divergent streamlines are clearly visible within the expansion region on the left side of the image. The expansion is so strong that the static pressure falls below the ambient pressure level. A so-called barrel shock equilibrates the flow pressure with the ambient pressure around the jet. Past the barrel shock, the jet flow remains supersonic. A strong shear between the jet flow and ambient air produces a turbulent layer along the jet boundary. In the central region, the supersonic flow passes through a normal shock, or a Mach disk. Behind the Mach disk, the pressure is somewhat higher than past the barrel shock, thus a reflected chock appears at the junction of the barrel shock and Mach disk. Behind the Mach disk, there is a large subsonic zone that contracts as the surrounding supersonic flow forms a kind of throat. Large-scale turbulent structures develop around this subsonic zone and occupy entirely the jet past the throat.
Mach disk
reflected shockbarrel shock
jet boundary subsonic throat
triple point
Fig. 4 Jet structure visualized by instantaneous PIV images from the two measurement zones. Jet ejection section is beyond the left edge of the image. Jet stagnation conditions: Pt j = 2.68 MPa, Tt j = 1970 K
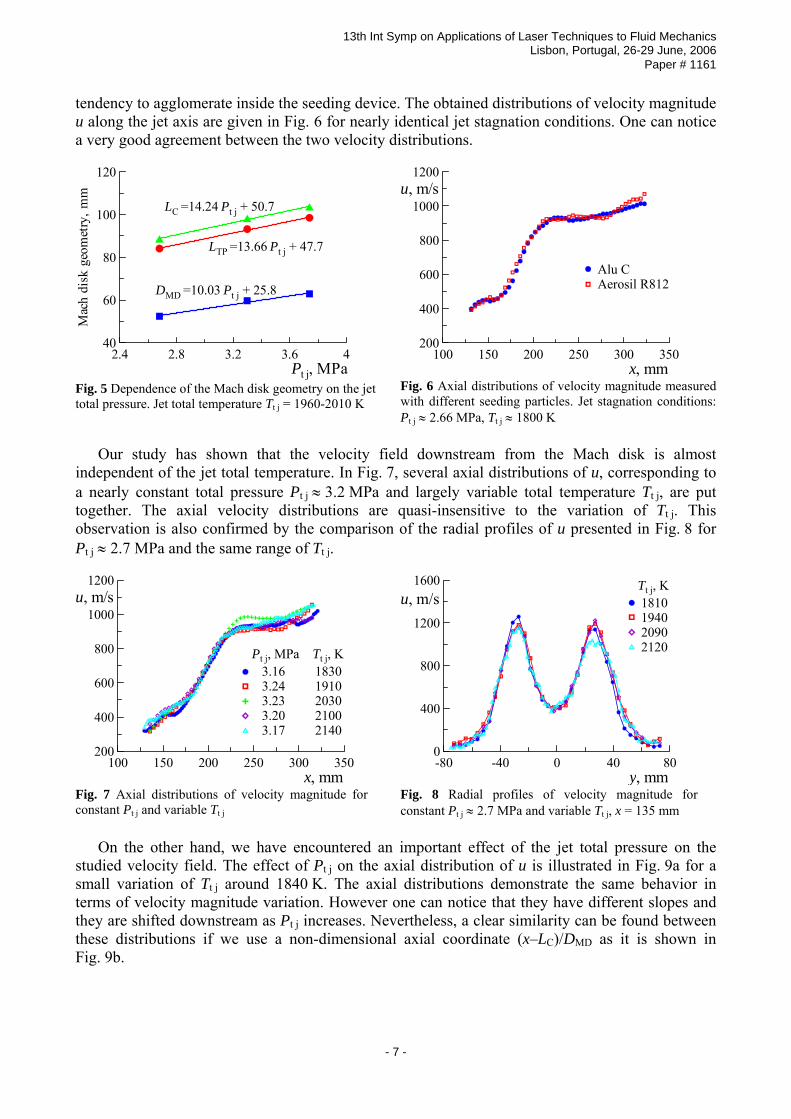
Direct processing of instantaneous PIV images permitted us to measure the Mach disk geometry. The axial position of the Mach disk and the triple point coordinates obtained from the instantaneous images have been averaged to evaluate the Mach disk diameter DMD and the distances from the jet ejection section to the Mach disk center LC and to the triple point LTP. The dependence of the three geometric parameters of the Mach disk on the jet total pressure Pt j is shown in Fig. 5. One can observe a nearly linear increase of the Mach disk size and distance whereas its shape remains slightly convex (LC > LTP). This analysis will allow us to explain some differences of the velocity profiles considered below. To determine the velocity field, the PIV images were analyzed after the experiment by a cross-correlation algorithm using the TSI Insight 6.0 software. The interrogation window size in pixels was 32 × 32 with a 50 % overlap shifting so that the spatial resolution in pixels was 16 × 16 that corresponds to a physical resolution of 2.1 mm × 2.1 mm. The optical calibration factor was determined as 130 µm/pixel, thus the maximum particle displacement of about 11 pixels could be expected for a velocity of 1500 m/s and a laser pulse separation time of 1 µs. A post-treatment was done on the instantaneous vector fields. As they were correct enough, only a standard deviation filter was applied to remove unfeasible velocity vectors produced by poor correlation at some points. The number of vectors rejected by this filtering was below 100 vectors by image (< 2 %). PIV results are first considered for the zone x = 123-323 mm as it is of primary importance for the present study. Two specific tests have been made to verify that the measurement results are independent of the kind of seeding particles. Measurements with Alu C are expected to be less precise as the primary particles have higher density and diameter and moreover they have a stronger
- 6 -
13th Int Symp on Applications of Laser Techniques to Fluid Mechanics Lisbon, Portugal, 26-29 June, 2006
Paper # 1161
tendency to agglomerate inside the seeding device. The obtained distributions of velocity magnitude u along the jet axis are given in Fig. 6 for nearly identical jet stagnation conditions. One can notice a very good agreement between the two velocity distributions.
2.4 2.8 3.2 3.6 4Pt j, MPa
40
60
80
100
120
Mac
h di
sk g
eom
etry
, mm
DMD =10.03 Pt j + 25.8
LC =14.24 Pt j + 50.7
LTP =13.66 Pt j + 47.7
Fig. 5 Dependence of the Mach disk geometry on the jet total pressure. Jet total temperature Tt j = 1960-2010 K
100 150 200 250 300 350x, mm
200
400
600
800
1000
1200u, m/s
Alu CAerosil R812
Fig. 6 Axial distributions of velocity magnitude measured with different seeding particles. Jet stagnation conditions: Pt j ≈ 2.66 MPa, Tt j ≈ 1800 K
Our study has shown that the velocity field downstream from the Mach disk is almost independent of the jet total temperature. In Fig. 7, several axial distributions of u, corresponding to a nearly constant total pressure Pt j ≈ 3.2 MPa and largely variable total temperature Tt j, are put together. The axial velocity distributions are quasi-insensitive to the variation of Tt j. This observation is also confirmed by the comparison of the radial profiles of u presented in Fig. 8 for Pt j ≈ 2.7 MPa and the same range of Tt j.
100 150 200 250 300 350x, mm
200
400
600
800
1000
1200u, m/s
Pt j, MPa Tt j, K 3.16 1830 3.24 1910 3.23 2030 3.20 2100 3.17 2140
Fig. 7 Axial distributions of velocity magnitude for constant Pt j and variable Tt j
-80 -40 0 40 80y, mm
0
400
800
1200
1600u, m/s
Tt j, K 1810 1940 2090 2120
Fig. 8 Radial profiles of velocity magnitude for constant Pt j ≈ 2.7 MPa and variable Tt j, x = 135 mm
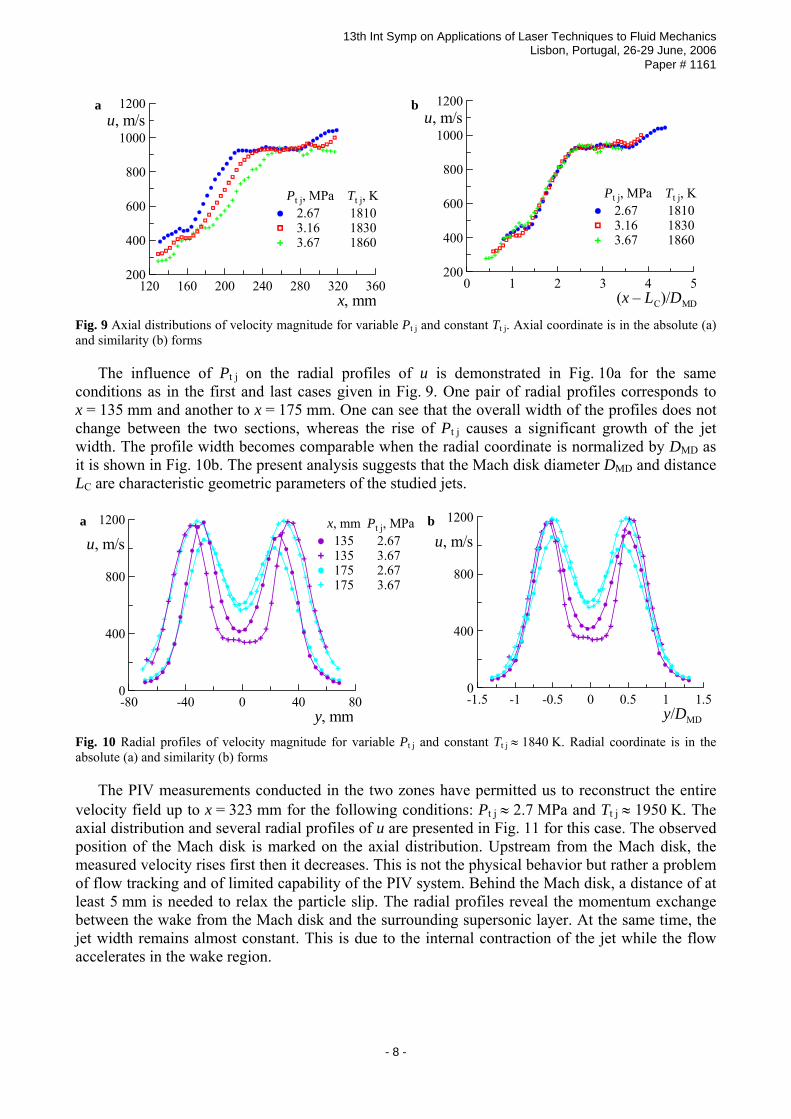
On the other hand, we have encountered an important effect of the jet total pressure on the studied velocity field. The effect of Pt j on the axial distribution of u is illustrated in Fig. 9a for a small variation of Tt j around 1840 K. The axial distributions demonstrate the same behavior in terms of velocity magnitude variation. However one can notice that they have different slopes and they are shifted downstream as Pt j increases. Nevertheless, a clear similarity can be found between these distributions if we use a non-dimensional axial coordinate (x–LC)/DMD as it is shown in Fig. 9b.
- 7 -
13th Int Symp on Applications of Laser Techniques to Fluid Mechanics Lisbon, Portugal, 26-29 June, 2006
Paper # 1161
a
120 160 200 240 280 320 360x, mm
200
400
600
800
1000
1200u, m/s
Pt j, MPa Tt j, K 2.67 1810 3.16 1830 3.67 1860
b
0 1 2 3 4 5(x – LC)/DMD
200
400
600
800
1000
1200u, m/s
Pt j, MPa Tt j, K 2.67 1810 3.16 1830 3.67 1860
Fig. 9 Axial distributions of velocity magnitude for variable Pt j and constant Tt j. Axial coordinate is in the absolute (a) and similarity (b) forms
The influence of Pt j on the radial profiles of u is demonstrated in Fig. 10a for the same conditions as in the first and last cases given in Fig. 9. One pair of radial profiles corresponds to x = 135 mm and another to x = 175 mm. One can see that the overall width of the profiles does not change between the two sections, whereas the rise of Pt j causes a significant growth of the jet width. The profile width becomes comparable when the radial coordinate is normalized by DMD as it is shown in Fig. 10b. The present analysis suggests that the Mach disk diameter DMD and distance LC are characteristic geometric parameters of the studied jets.
a
-80 -40 0 40 80y, mm
0
400
800
1200
u, m/sx, mm Pt j, MPa 135 2.67 135 3.67 175 2.67 175 3.67
b
-1.5 -1 -0.5 0 0.5 1 1.5y/DMD
0
400
800
1200
u, m/s
Fig. 10 Radial profiles of velocity magnitude for variable Pt j and constant Tt j ≈ 1840 K. Radial coordinate is in the absolute (a) and similarity (b) forms
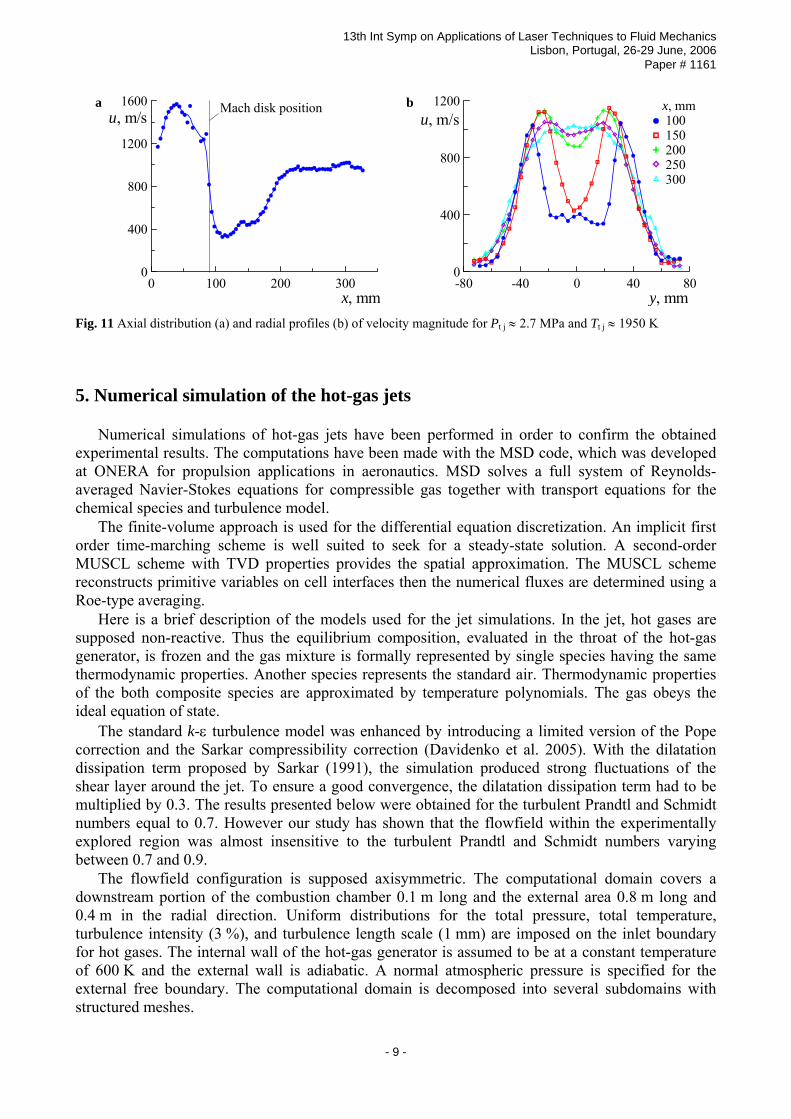
The PIV measurements conducted in the two zones have permitted us to reconstruct the entire velocity field up to x = 323 mm for the following conditions: Pt j ≈ 2.7 MPa and Tt j ≈ 1950 K. The axial distribution and several radial profiles of u are presented in Fig. 11 for this case. The observed position of the Mach disk is marked on the axial distribution. Upstream from the Mach disk, the measured velocity rises first then it decreases. This is not the physical behavior but rather a problem of flow tracking and of limited capability of the PIV system. Behind the Mach disk, a distance of at least 5 mm is needed to relax the particle slip. The radial profiles reveal the momentum exchange between the wake from the Mach disk and the surrounding supersonic layer. At the same time, the jet width remains almost constant. This is due to the internal contraction of the jet while the flow accelerates in the wake region.
- 8 -
13th Int Symp on Applications of Laser Techniques to Fluid Mechanics Lisbon, Portugal, 26-29 June, 2006
Paper # 1161
a
0 100 200 300x, mm
0
400
800
1200
1600u, m/s
Mach disk position
b
-80 -40 0 40 80y, mm
0
400
800
1200u, m/s
x, mm 100 150 200 250 300
Fig. 11 Axial distribution (a) and radial profiles (b) of velocity magnitude for Pt j ≈ 2.7 MPa and Tt j ≈ 1950 K
5. Numerical simulation of the hot-gas jets Numerical simulations of hot-gas jets have been performed in order to confirm the obtained experimental results. The computations have been made with the MSD code, which was developed at ONERA for propulsion applications in aeronautics. MSD solves a full system of Reynolds-averaged Navier-Stokes equations for compressible gas together with transport equations for the chemical species and turbulence model. The finite-volume approach is used for the differential equation discretization. An implicit first order time-marching scheme is well suited to seek for a steady-state solution. A second-order MUSCL scheme with TVD properties provides the spatial approximation. The MUSCL scheme reconstructs primitive variables on cell interfaces then the numerical fluxes are determined using a Roe-type averaging. Here is a brief description of the models used for the jet simulations. In the jet, hot gases are supposed non-reactive. Thus the equilibrium composition, evaluated in the throat of the hot-gas generator, is frozen and the gas mixture is formally represented by single species having the same thermodynamic properties. Another species represents the standard air. Thermodynamic properties of the both composite species are approximated by temperature polynomials. The gas obeys the ideal equation of state. The standard k-ε turbulence model was enhanced by introducing a limited version of the Pope correction and the Sarkar compressibility correction (Davidenko et al. 2005). With the dilatation dissipation term proposed by Sarkar (1991), the simulation produced strong fluctuations of the shear layer around the jet. To ensure a good convergence, the dilatation dissipation term had to be multiplied by 0.3. The results presented below were obtained for the turbulent Prandtl and Schmidt numbers equal to 0.7. However our study has shown that the flowfield within the experimentally explored region was almost insensitive to the turbulent Prandtl and Schmidt numbers varying between 0.7 and 0.9. The flowfield configuration is supposed axisymmetric. The computational domain covers a downstream portion of the combustion chamber 0.1 m long and the external area 0.8 m long and 0.4 m in the radial direction. Uniform distributions for the total pressure, total temperature, turbulence intensity (3 %), and turbulence length scale (1 mm) are imposed on the inlet boundary for hot gases. The internal wall of the hot-gas generator is assumed to be at a constant temperature of 600 K and the external wall is adiabatic. A normal atmospheric pressure is specified for the external free boundary. The computational domain is decomposed into several subdomains with structured meshes.
- 9 -
13th Int Symp on Applications of Laser Techniques to Fluid Mechanics Lisbon, Portugal, 26-29 June, 2006
Paper # 1161
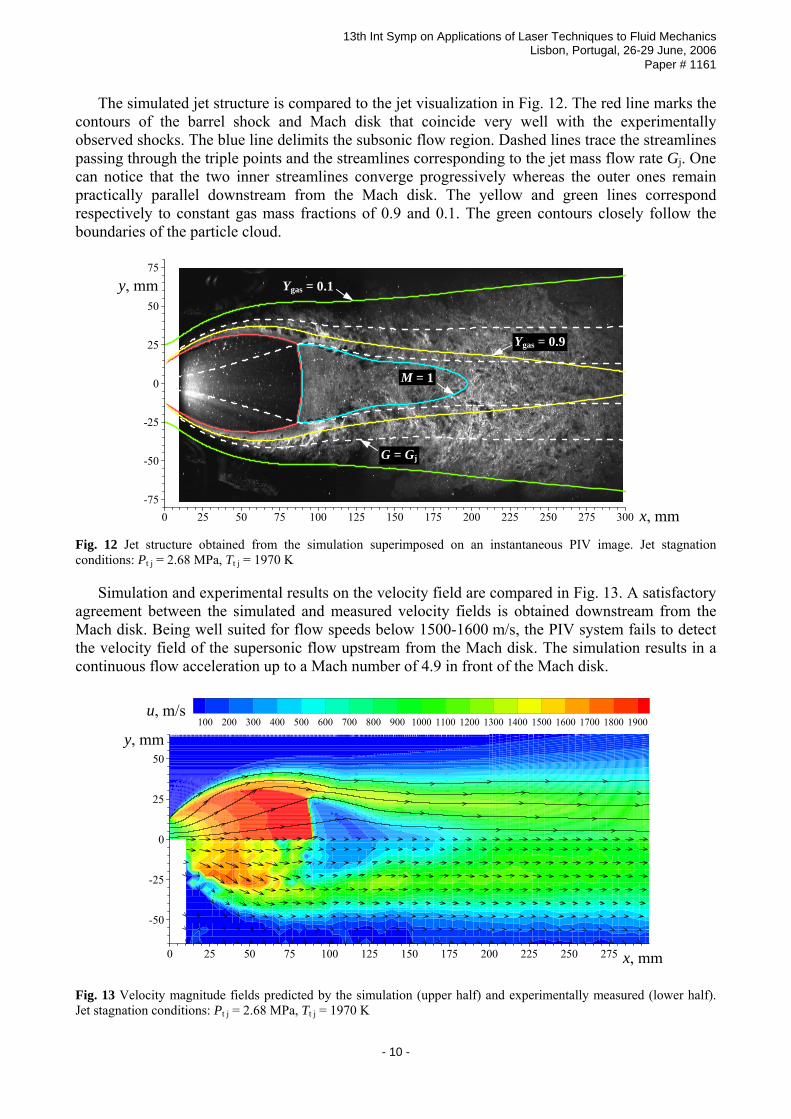
The simulated jet structure is compared to the jet visualization in Fig. 12. The red line marks the contours of the barrel shock and Mach disk that coincide very well with the experimentally observed shocks. The blue line delimits the subsonic flow region. Dashed lines trace the streamlines passing through the triple points and the streamlines corresponding to the jet mass flow rate Gj. One can notice that the two inner streamlines converge progressively whereas the outer ones remain practically parallel downstream from the Mach disk. The yellow and green lines correspond respectively to constant gas mass fractions of 0.9 and 0.1. The green contours closely follow the boundaries of the particle cloud.
0 25 50 75 100 125 150 175 200 225 250 275 300-75
-50
-25
0
25
50
75
y, mm
x, mm
Ygas = 0.1
Ygas = 0.9
M = 1
G = Gj
Fig. 12 Jet structure obtained from the simulation superimposed on an instantaneous PIV image. Jet stagnation conditions: Pt j = 2.68 MPa, Tt j = 1970 K
Simulation and experimental results on the velocity field are compared in Fig. 13. A satisfactory agreement between the simulated and measured velocity fields is obtained downstream from the Mach disk. Being well suited for flow speeds below 1500-1600 m/s, the PIV system fails to detect the velocity field of the supersonic flow upstream from the Mach disk. The simulation results in a continuous flow acceleration up to a Mach number of 4.9 in front of the Mach disk.
x, mm
y, mm
u, m/s
0 25 50 75 100 125 150 175 200 225 250 275
-50
-25
0
25
50
100 200 300 400 500 600 700 800 900 1000 1100 1200 1300 1400 1500 1600 1700 1800 1900
Fig. 13 Velocity magnitude fields predicted by the simulation (upper half) and experimentally measured (lower half). Jet stagnation conditions: Pt j = 2.68 MPa, Tt j = 1970 K
- 10 -
13th Int Symp on Applications of Laser Techniques to Fluid Mechanics Lisbon, Portugal, 26-29 June, 2006
Paper # 1161
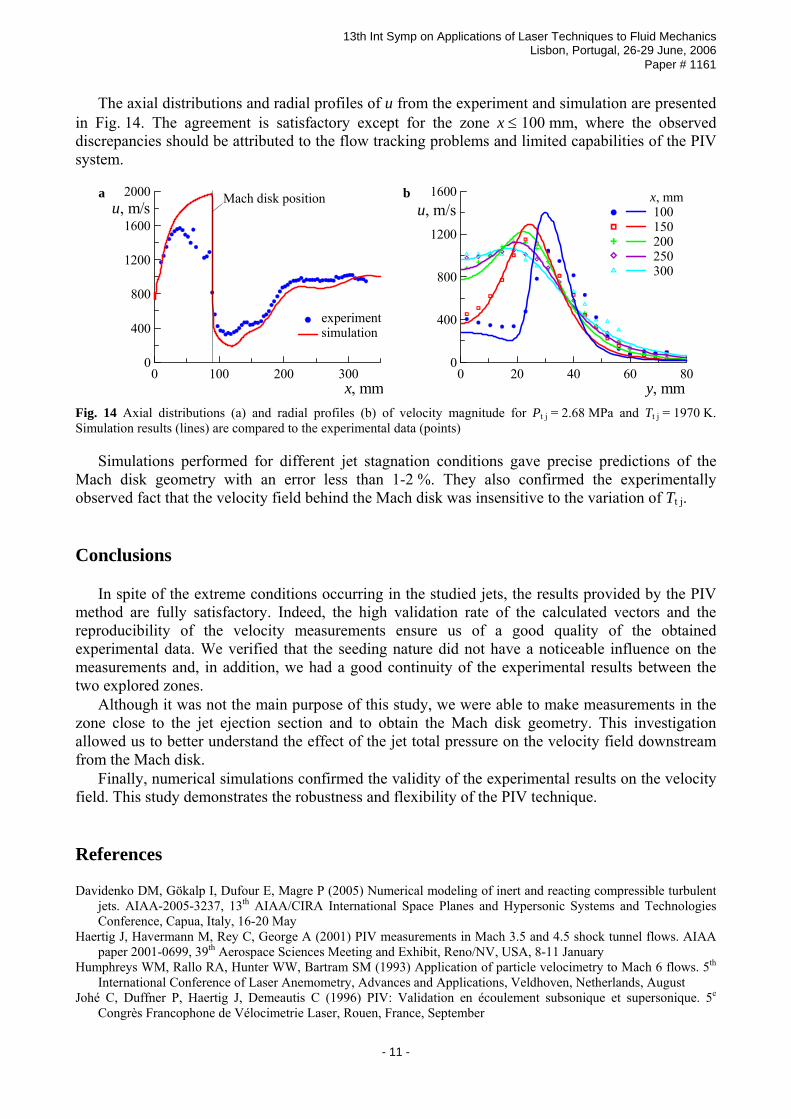
The axial distributions and radial profiles of u from the experiment and simulation are presented in Fig. 14. The agreement is satisfactory except for the zone x ≤ 100 mm, where the observed discrepancies should be attributed to the flow tracking problems and limited capabilities of the PIV system.
a
0 100 200 300x, mm
0
400
800
1200
1600
2000u, m/s
Mach disk position
experimentsimulation
b
0 20 40 60 80y, mm
0
400
800
1200
1600u, m/s
x, mm 100 150 200 250 300
Fig. 14 Axial distributions (a) and radial profiles (b) of velocity magnitude for Pt j = 2.68 MPa and Tt j = 1970 K. Simulation results (lines) are compared to the experimental data (points)
Simulations performed for different jet stagnation conditions gave precise predictions of the Mach disk geometry with an error less than 1-2 %. They also confirmed the experimentally observed fact that the velocity field behind the Mach disk was insensitive to the variation of Tt j. Conclusions In spite of the extreme conditions occurring in the studied jets, the results provided by the PIV method are fully satisfactory. Indeed, the high validation rate of the calculated vectors and the reproducibility of the velocity measurements ensure us of a good quality of the obtained experimental data. We verified that the seeding nature did not have a noticeable influence on the measurements and, in addition, we had a good continuity of the experimental results between the two explored zones. Although it was not the main purpose of this study, we were able to make measurements in the zone close to the jet ejection section and to obtain the Mach disk geometry. This investigation allowed us to better understand the effect of the jet total pressure on the velocity field downstream from the Mach disk. Finally, numerical simulations confirmed the validity of the experimental results on the velocity field. This study demonstrates the robustness and flexibility of the PIV technique. References Davidenko DM, Gökalp I, Dufour E, Magre P (2005) Numerical modeling of inert and reacting compressible turbulent
jets. AIAA-2005-3237, 13th AIAA/CIRA International Space Planes and Hypersonic Systems and Technologies Conference, Capua, Italy, 16-20 May
Haertig J, Havermann M, Rey C, George A (2001) PIV measurements in Mach 3.5 and 4.5 shock tunnel flows. AIAA paper 2001-0699, 39th Aerospace Sciences Meeting and Exhibit, Reno/NV, USA, 8-11 January
Humphreys WM, Rallo RA, Hunter WW, Bartram SM (1993) Application of particle velocimetry to Mach 6 flows. 5th International Conference of Laser Anemometry, Advances and Applications, Veldhoven, Netherlands, August
Johé C, Duffner P, Haertig J, Demeautis C (1996) PIV: Validation en écoulement subsonique et supersonique. 5e Congrès Francophone de Vélocimetrie Laser, Rouen, France, September
- 11 -

13th Int Symp on Applications of Laser Techniques to Fluid Mechanics Lisbon, Portugal, 26-29 June, 2006
Paper # 1161
Sarkar S, Lakshmanan B (1991) Application of a Reynolds stress turbulence model to the compressible shear layer. AIAA Journal 29:743-749
Weisgerber H, Martinuzzi R, Brummund U, Magre P, (2001) Mesures de vitesse par PIV dans une combustion supersonique hydrogène-air à Mach 2. 37e Colloque d’Aérodynamique Appliquée, Arcachon, France, 28-30 March
- 12 -