Embed Size (px)
Citation preview
PITTSBURGH REGIONAL ENVIRONMENTAL THREATS ANALYSIS (PRETA) REPORT
PRETA AIR: OZONE
UNIVERSITY OF PITTSBURGH GRADUATE SCHOOL OF PUBLIC HEALTHCENTER FOR HEALTHY ENVIRONMENTS AND COMMUNITIES
PITTSBURGH, PA. | AUGUST 1, 2011
2 PITTSBURGH REGIONAL ENVIRONMENTAL THREATS ANALYSIS REPORT
PRETA AIR: OZONE PREPARED BY
AUTHORSDrew Michanowicz, MPH, CPHSamantha Malone, MPH, CPHKyle Ferrar, MPHMatt Kelso, BAChuck Christen, DrPH, MEdConrad D. Volz, DrPH, MPH
Bernard D. Goldstein, MD
TECHNICAL SUPPORT
Sara Gillooly, BA
University Marketing Communications
Kelly Sjol, MBA Alison Butler, BA
TABLE OF CONTENTS
This Pittsburgh Regional Environmental Threats Analysis (PRETA) report was developed by CHEC with generous support from The Heinz Endowments.
executive summary. . . . . . . . . . . . . . . . . . . . . . . . . . . . . . . 3
recOGNiZiNG tHe eFFects
What are the effects of ozone?.. . . . . . . . . . . . . . . . . . . . . 4
What are the effects of other components of photochemical smog?.. . . . . . . . . . . . . . . . . . . . . . . . . . . . . . 5
Who is susceptible to ozone?. . . . . . . . . . . . . . . . . . . . . . . . 5
GrOuNd-level OZONe
What is ozone and where does it come from?.. . . . . . . . . . . . . . . . . . . . . . . . . . . . . . . . . . . . . . . . . . . . . . . . . . 6
What are the government standards for ozone exposure?.. . . . . . . . . . . . . . . . . . . . . . . . . . . . . . . . . . . . 14
How much ozone are we exposed to?.. . . . . . . . . . 15
PreveNtiNG OZONe eFFects aNd FOrmatiON
What are the most effective ozone control strategies?.. . . . . . . . . . . . . . . . . . . . . . . . . . . . . . . . . . . . . . . 21
What can my family and I do to limit our exposure to ozone outdoors?. . . . . . . . . . . . . . . . . 21
What about indoors?.. . . . . . . . . . . . . . . . . . . . . . . . . . . . . . . . . . 22
What are the economic benefits of avoiding ozone?.. . . . . . . . . . . . . . . . . . . . . . . . . . . . . . . . . . . . . 22
How do I know when ozone levels are high?.. . . . . . . . . . . . . . . . . . . . . . . . . . . . . . . . . . . . . . . . . . . . . . . . . . . . 23
What can my family and I do to decrease the formation of ground-level ozone?.. . . . . . . . . 23
air Quality iNdex
Where do I find additional information about ozone?.. . . . . . . . . . . . . . . . . . . . . . . . . . . . . . . . . . . . . . . . . . . . . 24
GlOssary. . . . . . . . . . . . . . . . . . . . . . . . . . . . . . . . . . . . . . . . . . . . . . . . 25
reFereNces. . . . . . . . . . . . . . . . . . . . . . . . . . . . . . . . . . . . . . . . . . . . 26
The University of Pittsburgh is an affirmative action, equal opportunity institution. Published in cooperation with the Department of University Marketing Communications. UMC78586-0811
CENTER FOR HEALTHY ENVIRONMENTS AND COMMUNITIES
The.Center.for.Healthy.Environments.and.Communities.(CHEC),.part.of.the.University.of.Pittsburgh.Graduate.School.of.Public.Health’s.Department.of.Environmental.and.Occupational.Health,.was.founded.in.2004.under.a.grant.from.The.Heinz.Endowments..CHEC’s.mission.is.to.improve.environmental.health.in.Western.Pennsylvania.through.community-based.research.
www.chec.pitt.edu
THE PURPOSE OF PRETAThe.Pittsburgh.Regional.Environmental.Threats.Analysis.(PRETA).project.puts.together.information.about.the.major.threats.to.human.health.and.the.environment.within.Southwestern.Pennsylvania..PRETA.is.intended.to.cover.the.core.public.health.functions—assessment,.policy.development,.and.assurance—and.relies.heavily.on.figures,.maps,.and.other.visuals..PRETA.is.meant.to.encourage.stakeholders.to.incorporate.scientific.analysis.and.public.values.for.sound.policy.development.and.remedial.action.against.environmental.threats..PRETA.also.is.meant.to.be.informative,.highlighting.the.populations.most.at.risk.to.those.threats..Ideally,.PRETA.will.inspire.initiatives.to.address.the.highest.risks.to.human.health.and.the.environment.in.Southwestern.Pennsylvania..The.preliminary.assessments.employed.early.in.the.project.identified.air.quality.as.the.number.one.current.environmental.threat.to.the.welfare.of.the.greater.Pittsburgh.region..This.first.of.a.series.of.reports.on.environmental.threats.to.the.region,.called.PRETA Air,.focuses.on.ground-level.ozone,.which.has.been.elevated.significantly.above.health-based.governmental.standards.in.the.summer.months..
PRETA STUDY AREA
10 Southwestern Pennsylvania counties:
Allegheny
Armstrong
Beaver
Butler
Fayette
Greene
Indiana
Lawrence
Washington
Westmoreland
PRETA AIR: OZONE 3PRETA AIR: OZONE 3
The University of Pittsburgh is an affirmative action, equal opportunity institution. Published in cooperation with the Department of University Marketing Communications. UMC78586-0811
EXECUTIVE SUMMARY
Ozone.is.a.powerful,.toxic.gas..It.is.formed.when.sunlight.acts.on.ozone-forming.chemicals,.notably.hydrocarbons.and.oxides.of.nitrogen..Major.sources.of.these.ozone.precursors.in.our.area.are.mobile.sources,.such.as.automobiles.and.trucks,.and.stationary.sources,.such.as.power.plants.and.industries..Preventing.ozone.formation.requires.a.concerted.effort.to.control.all.of.these.sources..Our.analysis.indicates.that.while.mobile.sources.are.particularly.important.for.Allegheny.County,.stationary.sources.are.the.dominant.source.of.nitrogen.oxides.for.Southwestern.Pennsylvania.
Because.of.ozone.in.our.outdoor.air,.children.in.the.Pittsburgh.region.suffer.from.asthma.attacks,.visit.hospital.emergency.rooms.more.often,.and.experience.additional.respiratory.illnesses,.just.like.children.in.any.area.of.the.country.where.ozone.levels.are.elevated.as.a.whole..Adults.also.are.susceptible,.particularly.those.with.respiratory.conditions,.who.are.more.likely.to.die.when.ozone.levels.are.high..Pollution.sources.exist.throughout.Pennsylvania,.Ohio,.West.Virginia,.and.Maryland...Many.small.stationary.emissions.sources.exist.in.major.urban.cities,.while.larger.sources.tend.to.cluster.along.major.rivers.and.in.more.rural.areas,.especially.in.the.counties.surrounding.Allegheny.County,.Pa.
Increasing.evidence.of.the.harm.caused.by.ozone.has.led.to.more.protective.outdoor.standards..The.U.S..Environmental.Protection.Agency.(EPA)’s.ongoing.review.of.the.damaging.health.effects.of.ozone.is.likely.to.further.lower.the.allowable.outdoor.ozone.level,.resulting.in.even.more.of.the.Pittsburgh.region’s.being.designated.as.having.unhealthy.air.because.of.ozone..Global.climate.change,.by.causing.warmer.days,.and.Marcellus.Shale.activities,.through.release.of.ozone-forming.chemicals,.may.contribute.further.to.the.ozone.problem.in.the.Pittsburgh.area..Geographical.areas.that.exceed.a.health-based.air.pollutant.standard,.such.as.our.region,.are.subject.to.control.measures.that.can.limit.community.growth.and.development..
Ground-level.ozone.is.not.just.an.urban.problem..Ozone-forming.chemicals.can.travel.many.miles.downwind.from.areas.that.have.heavy.automobile.traffic.and.industrial.sources.of.ozone.precursors...It.is.not.surprising.that.in.our.region,.ozone.levels.tend.to.be.highest.in.the.areas.northeast.of.Pittsburgh,.such.as.Harrison.Township,.Allegheny.County..
We.can.avoid.ozone.by.limiting.our.outdoor.activities.on.high-ozone.days,.which.are.mostly.warm.days.during.spring.and.summer..Because.sunlight.is.needed.for.ozone.formation,.ozone.levels.tend.to.be.lowest.in.the.morning.before.the.sun.is.too.high..Sensitive.populations,.such.as.children.and.older.adults.with.respiratory.conditions,.should.avoid.exercising.outdoors.beginning.midday.until.after.the.sun.goes.down..We.also.can.avoid.ozone.formation.by.supporting.pollution.control.policies.that.decrease.the.emission.precursors,.particularly.oxides.of.nitrogen,.and.by.limiting.our.personal.contribution.to.ozone.precursors,.such.as.by.driving.less.and.using.less.electrical.power..
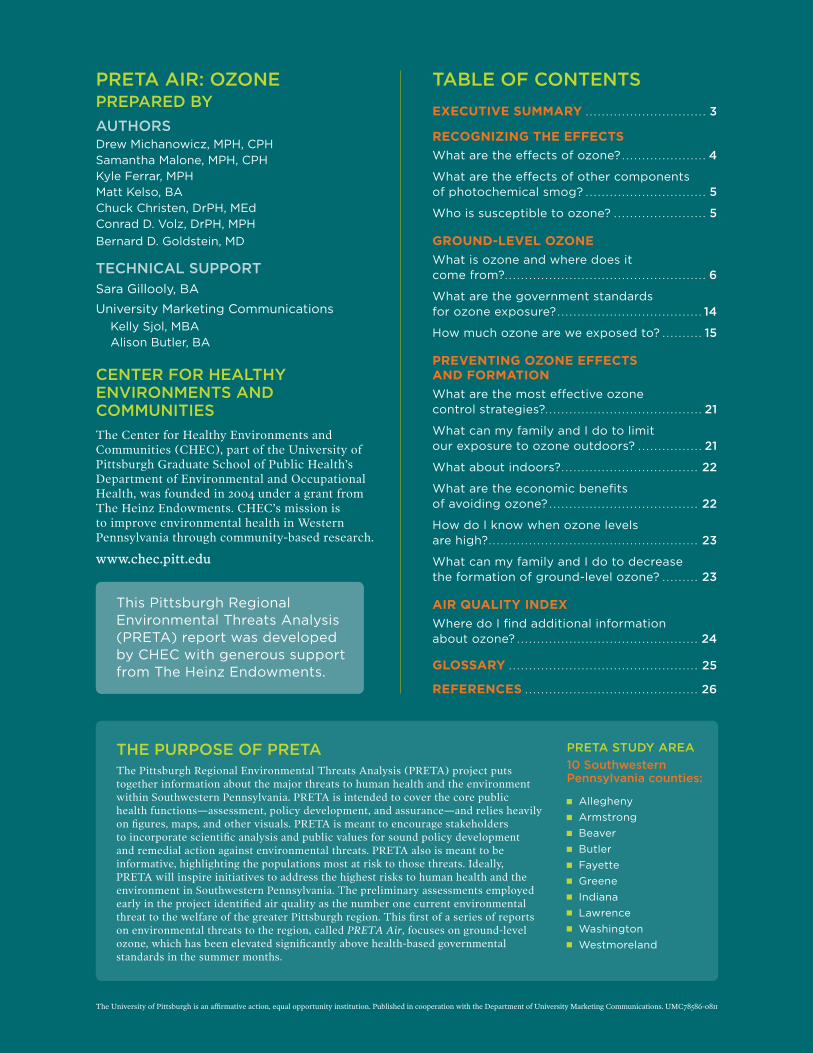
OZONE EFFECTS
Ozone is an exceptionally powerful oxidizing gas that penetrates deeply into the lung. Children particularly are at risk from ozone. The major health impacts of ozone are:
increased likelihood of asthma attacks;
decline in lung function, even among healthy athletes;
infections of the respiratory tract;
premature death; and
links to low birth weight and preterm delivery of infants.
4 PITTSBURGH REGIONAL ENVIRONMENTAL THREATS ANALYSIS REPORT
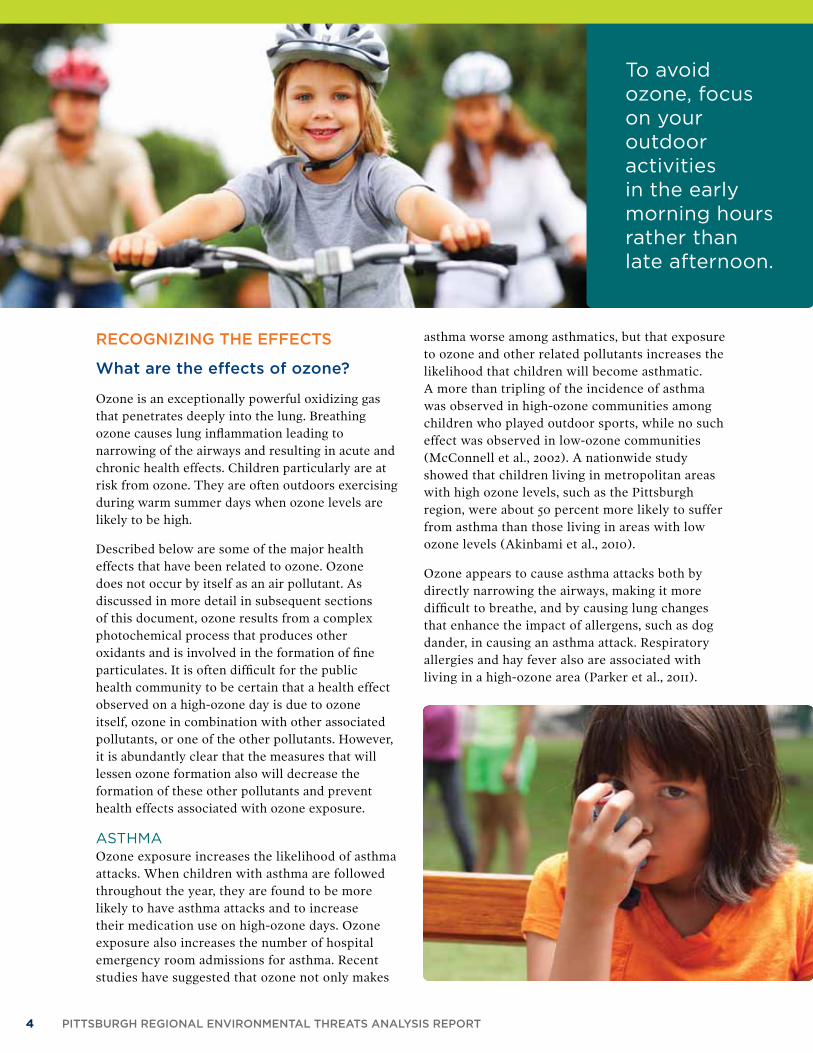
To avoid ozone, focus on your outdoor activities in the early morning hours rather than late afternoon.
RECOGNIZING THE EFFECTS
What are the effects of ozone?
Ozone.is.an.exceptionally.powerful.oxidizing.gas.that.penetrates.deeply.into.the.lung..Breathing.ozone.causes.lung.inflammation.leading.to.narrowing.of.the.airways.and.resulting.in.acute.and.chronic.health.effects..Children.particularly.are.at.risk.from.ozone..They.are.often.outdoors.exercising.during.warm.summer.days.when.ozone.levels.are.likely.to.be.high..
Described.below.are.some.of.the.major.health.effects.that.have.been.related.to.ozone..Ozone.does.not.occur.by.itself.as.an.air.pollutant..As.discussed.in.more.detail.in.subsequent.sections.of.this.document,.ozone.results.from.a.complex.photochemical.process.that.produces.other.oxidants.and.is.involved.in.the.formation.of.fine.particulates..It.is.often.difficult.for.the.public.health.community.to.be.certain.that.a.health.effect.observed.on.a.high-ozone.day.is.due.to.ozone.itself,.ozone.in.combination.with.other.associated.pollutants,.or.one.of.the.other.pollutants..However,.it.is.abundantly.clear.that.the.measures.that.will.lessen.ozone.formation.also.will.decrease.the.formation.of.these.other.pollutants.and.prevent.health.effects.associated.with.ozone.exposure.
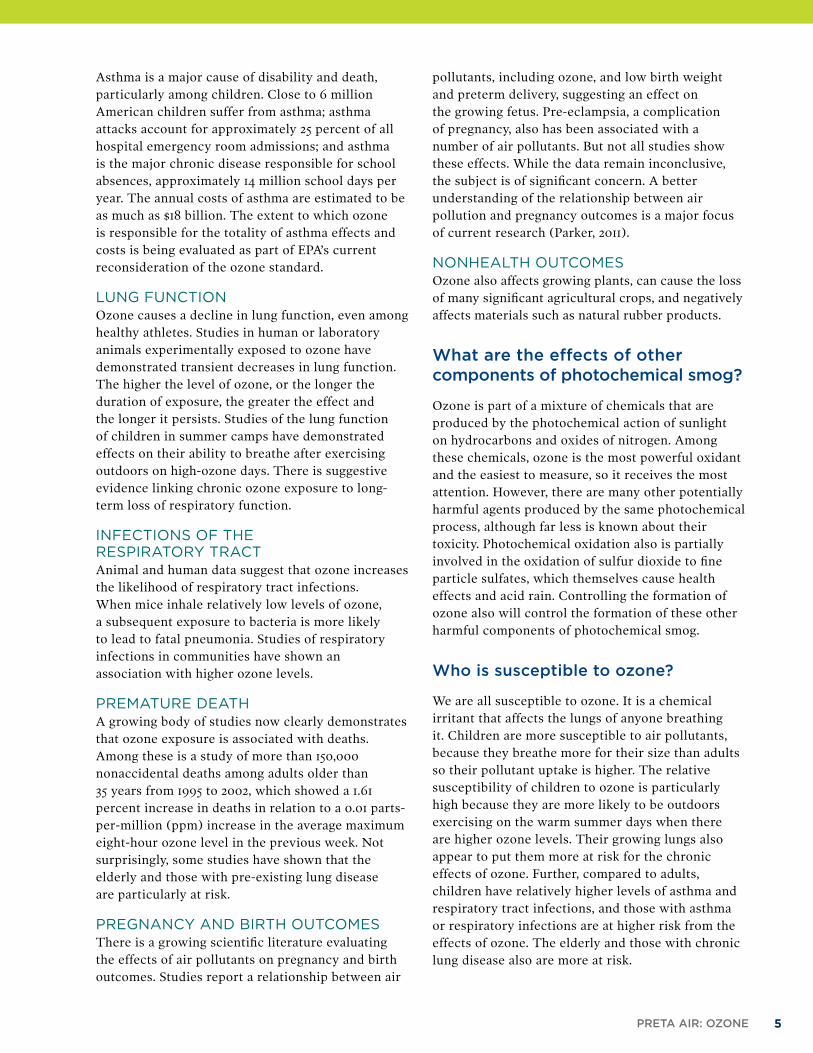
ASTHMA Ozone.exposure.increases.the.likelihood.of.asthma.attacks..When.children.with.asthma.are.followed.throughout.the.year,.they.are.found.to.be.more.likely.to.have.asthma.attacks.and.to.increase.their.medication.use.on.high-ozone.days..Ozone.exposure.also.increases.the.number.of.hospital.emergency.room.admissions.for.asthma..Recent.studies.have.suggested.that.ozone.not.only.makes.
asthma.worse.among.asthmatics,.but.that.exposure.to.ozone.and.other.related.pollutants.increases.the.likelihood.that.children.will.become.asthmatic..A.more.than.tripling.of.the.incidence.of.asthma.was.observed.in.high-ozone.communities.among.children.who.played.outdoor.sports,.while.no.such.effect.was.observed.in.low-ozone.communities.(McConnell.et.al.,.2002)..A.nationwide.study.showed.that.children.living.in.metropolitan.areas.with.high.ozone.levels,.such.as.the.Pittsburgh.region,.were.about.50.percent.more.likely.to.suffer.from.asthma.than.those.living.in.areas.with.low.ozone.levels.(Akinbami.et.al.,.2010).
Ozone.appears.to.cause.asthma.attacks.both.by.directly.narrowing.the.airways,.making.it.more.difficult.to.breathe,.and.by.causing.lung.changes.that.enhance.the.impact.of.allergens,.such.as.dog.dander,.in.causing.an.asthma.attack..Respiratory.allergies.and.hay.fever.also.are.associated.with.living.in.a.high-ozone.area.(Parker.et.al.,.2011)..
PRETA AIR: OZONE 5
Asthma.is.a.major.cause.of.disability.and.death,.particularly.among.children..Close.to.6.million.American.children.suffer.from.asthma;.asthma.attacks.account.for.approximately.25.percent.of.all.hospital.emergency.room.admissions;.and.asthma.is.the.major.chronic.disease.responsible.for.school.absences,.approximately.14.million.school.days.per.year..The.annual.costs.of.asthma.are.estimated.to.be.as.much.as.$18.billion..The.extent.to.which.ozone.is.responsible.for.the.totality.of.asthma.effects.and.costs.is.being.evaluated.as.part.of.EPA’s.current.reconsideration.of.the.ozone.standard..
LUNG FUNCTION Ozone.causes.a.decline.in.lung.function,.even.among.healthy.athletes..Studies.in.human.or.laboratory.animals.experimentally.exposed.to.ozone.have.demonstrated.transient.decreases.in.lung.function..The.higher.the.level.of.ozone,.or.the.longer.the.duration.of.exposure,.the.greater.the.effect.and.the.longer.it.persists..Studies.of.the.lung.function.of.children.in.summer.camps.have.demonstrated.effects.on.their.ability.to.breathe.after.exercising.outdoors.on.high-ozone.days..There.is.suggestive.evidence.linking.chronic.ozone.exposure.to.long-term.loss.of.respiratory.function.
INFECTIONS OF THE RESPIRATORy TRACT Animal.and.human.data.suggest.that.ozone.increases.the.likelihood.of.respiratory.tract.infections..When.mice.inhale.relatively.low.levels.of.ozone,.a.subsequent.exposure.to.bacteria.is.more.likely.to.lead.to.fatal.pneumonia..Studies.of.respiratory.infections.in.communities.have.shown.an.association.with.higher.ozone.levels.
PREMATURE DEATH A.growing.body.of.studies.now.clearly.demonstrates.that.ozone.exposure.is.associated.with.deaths..Among.these.is.a.study.of.more.than.150,000.nonaccidental.deaths.among.adults.older.than..35.years.from.1995.to.2002,.which.showed.a.1.61.percent.increase.in.deaths.in.relation.to.a.0.01.parts-per-million.(ppm).increase.in.the.average.maximum.eight-hour.ozone.level.in.the.previous.week..Not.surprisingly,.some.studies.have.shown.that.the.elderly.and.those.with.pre-existing.lung.disease..are.particularly.at.risk.
PREGNANCy AND BIRTH OUTCOMES There.is.a.growing.scientific.literature.evaluating.the.effects.of.air.pollutants.on.pregnancy.and.birth.outcomes..Studies.report.a.relationship.between.air.
pollutants,.including.ozone,.and.low.birth.weight.and.preterm.delivery,.suggesting.an.effect.on.the.growing.fetus..Pre-eclampsia,.a.complication.of.pregnancy,.also.has.been.associated.with.a.number.of.air.pollutants..But.not.all.studies.show.these.effects..While.the.data.remain.inconclusive,.the.subject.is.of.significant.concern..A.better.understanding.of.the.relationship.between.air.pollution.and.pregnancy.outcomes.is.a.major.focus.of.current.research.(Parker,.2011)..
NONHEALTH OUTCOMES Ozone.also.affects.growing.plants,.can.cause.the.loss.of.many.significant.agricultural.crops,.and.negatively.affects.materials.such.as.natural.rubber.products.
What are the effects of other components of photochemical smog?
Ozone.is.part.of.a.mixture.of.chemicals.that.are.produced.by.the.photochemical.action.of.sunlight.on.hydrocarbons.and.oxides.of.nitrogen..Among.these.chemicals,.ozone.is.the.most.powerful.oxidant.and.the.easiest.to.measure,.so.it.receives.the.most.attention..However,.there.are.many.other.potentially.harmful.agents.produced.by.the.same.photochemical.process,.although.far.less.is.known.about.their.toxicity..Photochemical.oxidation.also.is.partially.involved.in.the.oxidation.of.sulfur.dioxide.to.fine.particle.sulfates,.which.themselves.cause.health.effects.and.acid.rain..Controlling.the.formation.of.ozone.also.will.control.the.formation.of.these.other.harmful.components.of.photochemical.smog.
Who is susceptible to ozone?
We.are.all.susceptible.to.ozone..It.is.a.chemical.irritant.that.affects.the.lungs.of.anyone.breathing.it..Children.are.more.susceptible.to.air.pollutants,.because.they.breathe.more.for.their.size.than.adults.so.their.pollutant.uptake.is.higher..The.relative.susceptibility.of.children.to.ozone.is.particularly.high.because.they.are.more.likely.to.be.outdoors.exercising.on.the.warm.summer.days.when.there.are.higher.ozone.levels..Their.growing.lungs.also.appear.to.put.them.more.at.risk.for.the.chronic.effects.of.ozone..Further,.compared.to.adults,.children.have.relatively.higher.levels.of.asthma.and.respiratory.tract.infections,.and.those.with.asthma.or.respiratory.infections.are.at.higher.risk.from.the.effects.of.ozone..The.elderly.and.those.with.chronic.lung.disease.also.are.more.at.risk.
6 PITTSBURGH REGIONAL ENVIRONMENTAL THREATS ANALYSIS REPORT
GROUND-LEVEL OZONE
What is ozone and where does it come from?
Ground-level.ozone.is.a.highly.reactive.chemical.form.of.oxygen..The.oxygen.(O2).we.breathe.is.made.up.of.molecules.that.contain.two.oxygen.atoms,.while.ozone.(O3).contains.three.oxygen.atoms..Ground-level.ozone.is.produced.mainly.through.the.reaction.of.sunlight.with.oxides.of.nitrogen.and.with.hydrocarbons.in.a.complex.process.known.as.photochemical.oxidation...Ozone.is.the.most.toxic.and.thoroughly.studied..of.the.many.pollutants.produced.by.photochemical.oxidation..The.mixture.of.these.pollutants.is..often.called.photochemical.smog,.oxidant.smog,..or.just.smog.
Sources.of.the.oxides.of.nitrogen.and.of.hydrocar-bons.that.can.form.ozone.include.the.following:.
•.motor.vehicles..•.coal-fired.power.plants..•.petrochemicals.•..industrial.use.of.solvents,.paints,.and..
degreasing.agents•..off-road.engines.such.as.gasoline-powered.lawn.
and.garden.equipment
Small.levels.of.ozone.exist.in.a.natural.environment..Atmospheric.nitrogen.oxides.and.volatile.organic.compounds,.the.precursors.to.ozone,.also.can.be.formed.by.natural.processes.in.soil.and.vegetation..
Ground-level.ozone.should.be.clearly.distinguished.from.stratospheric.ozone.in.the.upper.atmosphere...Stratospheric.ozone.occurs.naturally.and.protects.us.from.the.sun’s.harmful.ultraviolet.rays..Concern.about.the.loss.of.this.stratospheric.ozone.layer.has.led.to.the.banning.of.chemicals.such.as.chlorofluorocarbons.that.can.penetrate.into.the.upper.atmosphere.and.react.with.ozone..At.the.Earth’s.surface,.or.ground.level,.rather.than.being.protective,.ozone.causes.adverse.health.effects.as.well.as.damage.to.agriculture.and.property..Scientific.understanding.of.the.photochemical.process.that.produces.ozone.has.improved.ozone.control.measures,.including.the.recognition.that.ozone.can.be.created.hundreds.of.miles.downwind.of.the.source..But.much.of.our.region.still.exceeds.the.health-based.ozone.guidelines..Ground-level.ozone.formation.occurs.mostly.during.the.summer.due.to.its.dependence.on.sunlight..The.ozone.season.in.Pennsylvania.extends.from.April.1.to.September.30,.with.June,.July,.and.August.considered.the.core.of.the.ozone.season.
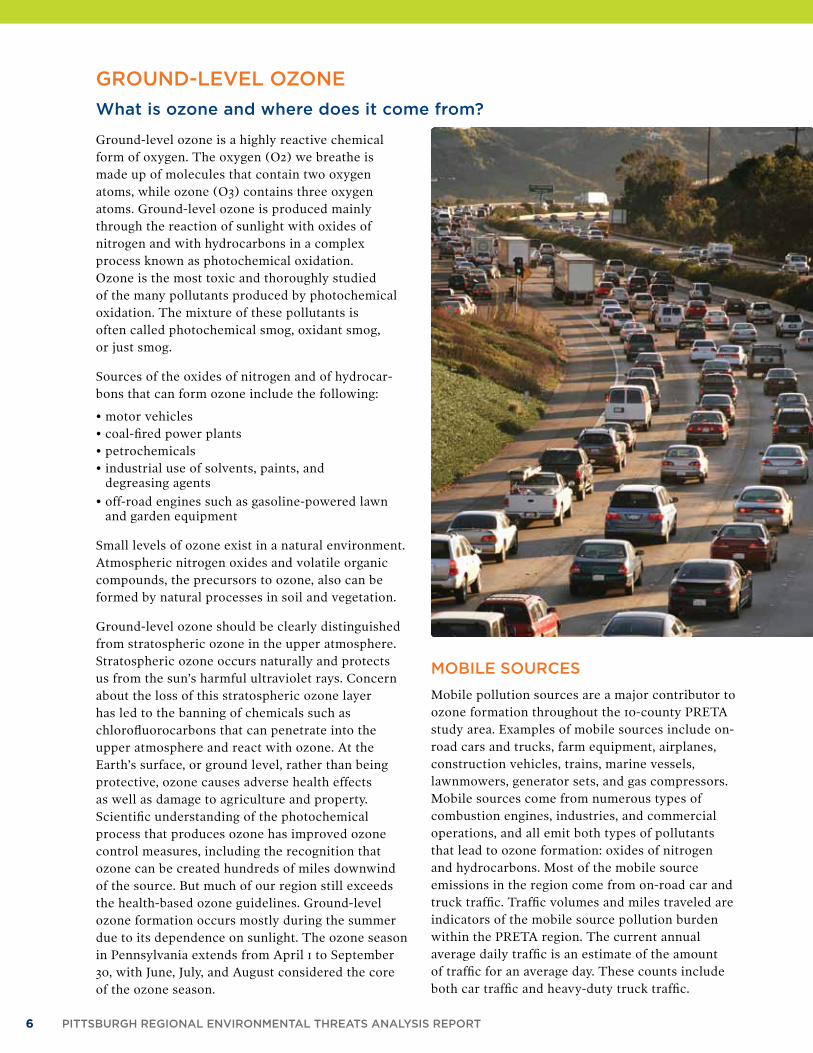
MOBILE SOURCES
Mobile.pollution.sources.are.a.major.contributor.to.ozone.formation.throughout.the.10-county.PRETA.study.area..Examples.of.mobile.sources.include.on-road.cars.and.trucks,.farm.equipment,.airplanes,.construction.vehicles,.trains,.marine.vessels,.lawnmowers,.generator.sets,.and.gas.compressors..Mobile.sources.come.from.numerous.types.of.combustion.engines,.industries,.and.commercial.operations,.and.all.emit.both.types.of.pollutants.that.lead.to.ozone.formation:.oxides.of.nitrogen.and.hydrocarbons..Most.of.the.mobile.source.emissions.in.the.region.come.from.on-road.car.and.truck.traffic..Traffic.volumes.and.miles.traveled.are.indicators.of.the.mobile.source.pollution.burden.within.the.PRETA.region..The.current.annual.average.daily.traffic.is.an.estimate.of.the.amount.of.traffic.for.an.average.day..These.counts.include.both.car.traffic.and.heavy-duty.truck.traffic.
PRETA AIR: OZONE 7
COUNTY ROAD LENGTH (miles)
TOTAL DAILY TRAFFIC
DAILY TRAFFIC PER ROADWAY
DAILYMILES
ALLEGHENY 2,181 21,950,658 8,081 19,979,301
ARMSTRONG 704 1,197,551 2,443 1,438,442
BEAVER 730 3,016,589 4,403 3,167,347
BUTLER 815 3,282,141 5,268 4,131,654
FAYETTE 897 2,190,684 3,034 2,306,194
GREENE 611 674,304 1,673 933,968
INDIANA 886 1,514,326 2,511 1,945,381
LAWRENCE 474 1,508,690 3,405 1,643,347
WASHINGTON 1,268 3,683,532 3,555 4,506,932
WESTMORELAND 1,506 6,331,716 4,255 7,747,095
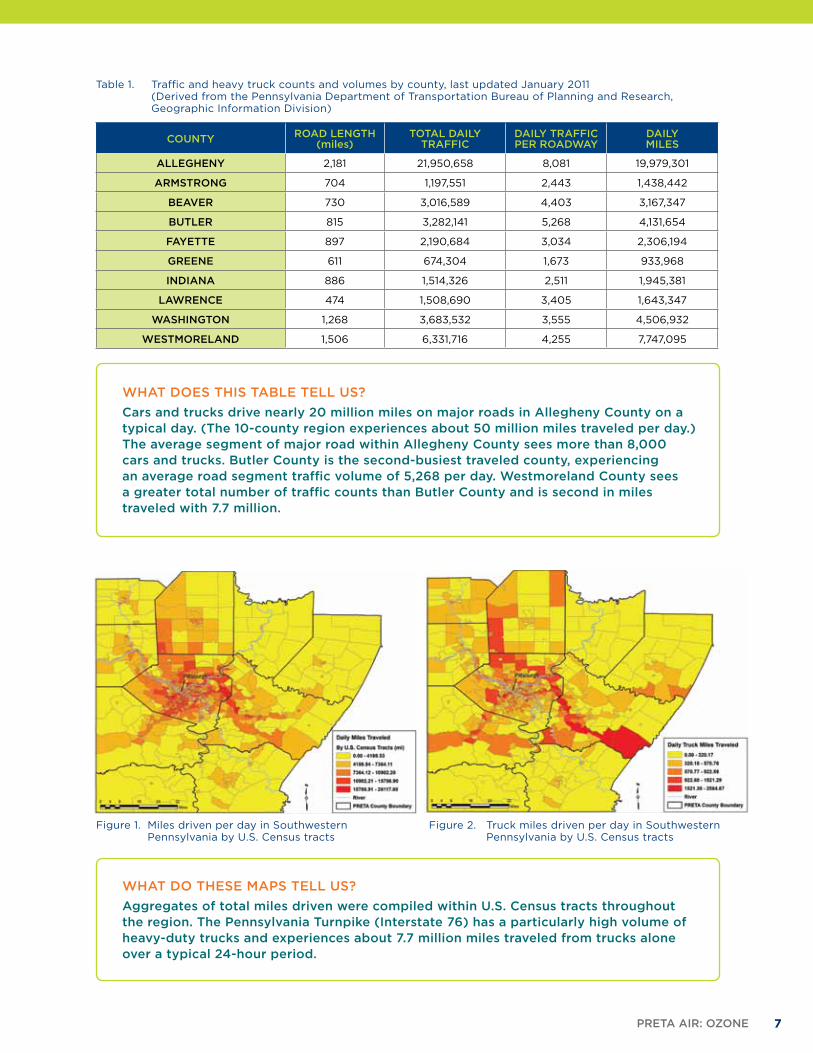
Table 1. Traffic and heavy truck counts and volumes by county, last updated January 2011 (Derived from the Pennsylvania Department of Transportation Bureau of Planning and Research, Geographic Information Division)
WHAT DO THESE MAPS TELL US?
Aggregates of total miles driven were compiled within U.S. Census tracts throughout the region. The Pennsylvania Turnpike (Interstate 76) has a particularly high volume of heavy-duty trucks and experiences about 7.7 million miles traveled from trucks alone over a typical 24-hour period.
Figure 1. Miles driven per day in Southwestern Pennsylvania by U.S. Census tracts
Figure 2. Truck miles driven per day in Southwestern Pennsylvania by U.S. Census tracts
WHAT DOES THIS TABLE TELL US?
Cars and trucks drive nearly 20 million miles on major roads in Allegheny County on a typical day. (The 10-county region experiences about 50 million miles traveled per day.) The average segment of major road within Allegheny County sees more than 8,000 cars and trucks. Butler County is the second-busiest traveled county, experiencing an average road segment traffic volume of 5,268 per day. Westmoreland County sees a greater total number of traffic counts than Butler County and is second in miles traveled with 7.7 million.
8 PITTSBURGH REGIONAL ENVIRONMENTAL THREATS ANALYSIS REPORT
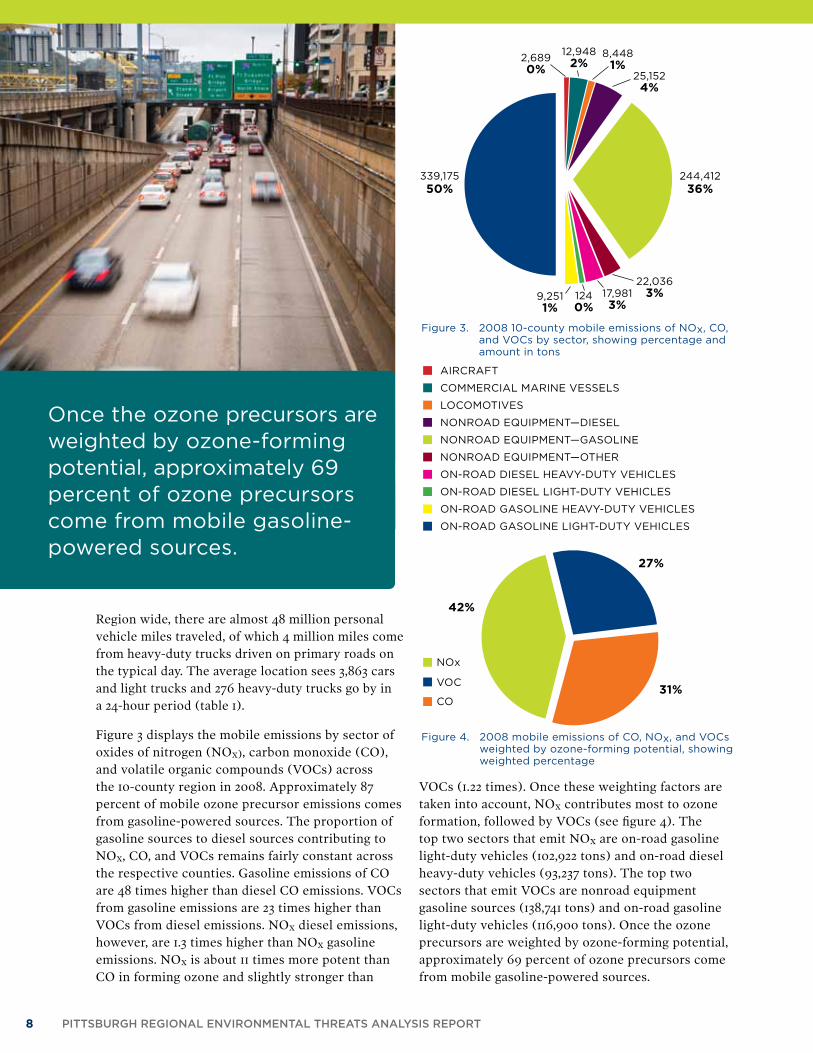
Region.wide,.there.are.almost.48.million.personal.vehicle.miles.traveled,.of.which.4.million.miles.come.from.heavy-duty.trucks.driven.on.primary.roads.on.the.typical.day..The.average.location.sees.3,863.cars.and.light.trucks.and.276.heavy-duty.trucks.go.by.in..a.24-hour.period.(table.1)...
Figure.3.displays.the.mobile.emissions.by.sector.of.oxides.of.nitrogen.(NOx),.carbon.monoxide.(CO),.and.volatile.organic.compounds.(VOCs).across.the.10-county.region.in.2008..Approximately.87.percent.of.mobile.ozone.precursor.emissions.comes.from.gasoline-powered.sources..The.proportion.of.gasoline.sources.to.diesel.sources.contributing.to.NOx,.CO,.and.VOCs.remains.fairly.constant.across.the.respective.counties..Gasoline.emissions.of.CO.are.48.times.higher.than.diesel.CO.emissions..VOCs.from.gasoline.emissions.are.23.times.higher.than.VOCs.from.diesel.emissions..NOx.diesel.emissions,.however,.are.1.3.times.higher.than.NOx.gasoline.emissions..NOx.is.about.11.times.more.potent.than.CO.in.forming.ozone.and.slightly.stronger.than.
VOCs.(1.22.times)..Once.these.weighting.factors.are.taken.into.account,.NOx.contributes.most.to.ozone.formation,.followed.by.VOCs.(see.figure.4)..The.top.two.sectors.that.emit.NOx.are.on-road.gasoline.light-duty.vehicles.(102,922.tons).and.on-road.diesel.heavy-duty.vehicles.(93,237.tons)..The.top.two.sectors.that.emit.VOCs.are.nonroad.equipment.gasoline.sources.(138,741.tons).and.on-road.gasoline.light-duty.vehicles.(116,900.tons)..Once.the.ozone.precursors.are.weighted.by.ozone-forming.potential,.approximately.69.percent.of.ozone.precursors.come.from.mobile.gasoline-powered.sources.
Once the ozone precursors are weighted by ozone-forming potential, approximately 69 percent of ozone precursors come from mobile gasoline-powered sources.
Figure 3. 2008 10-county mobile emissions of NOx, CO, and VOCs by sector, showing percentage and amount in tons
AIRCRAFT
COMMERCIAL MARINE VESSELS
LOCOMOTIVES
NONROAD EQUIPMENT—DIESEL
NONROAD EQUIPMENT—GASOLINE
NONROAD EQUIPMENT—OTHER
ON-ROAD DIESEL HEAVy-DUTy VEHICLES
ON-ROAD DIESEL LIGHT-DUTy VEHICLES
ON-ROAD GASOLINE HEAVy-DUTy VEHICLES
ON-ROAD GASOLINE LIGHT-DUTy VEHICLES
339,17550%
2,6890%
12,9482%
25,1524%
244,41236%
1240%
9,2511%
8,4481%
17,9813%
22,0363%
Figure 4. 2008 mobile emissions of CO, NOx, and VOCs weighted by ozone-forming potential, showing weighted percentage
VOC
NOx
CO
42%
27%
31%
PRETA AIR: OZONE 9
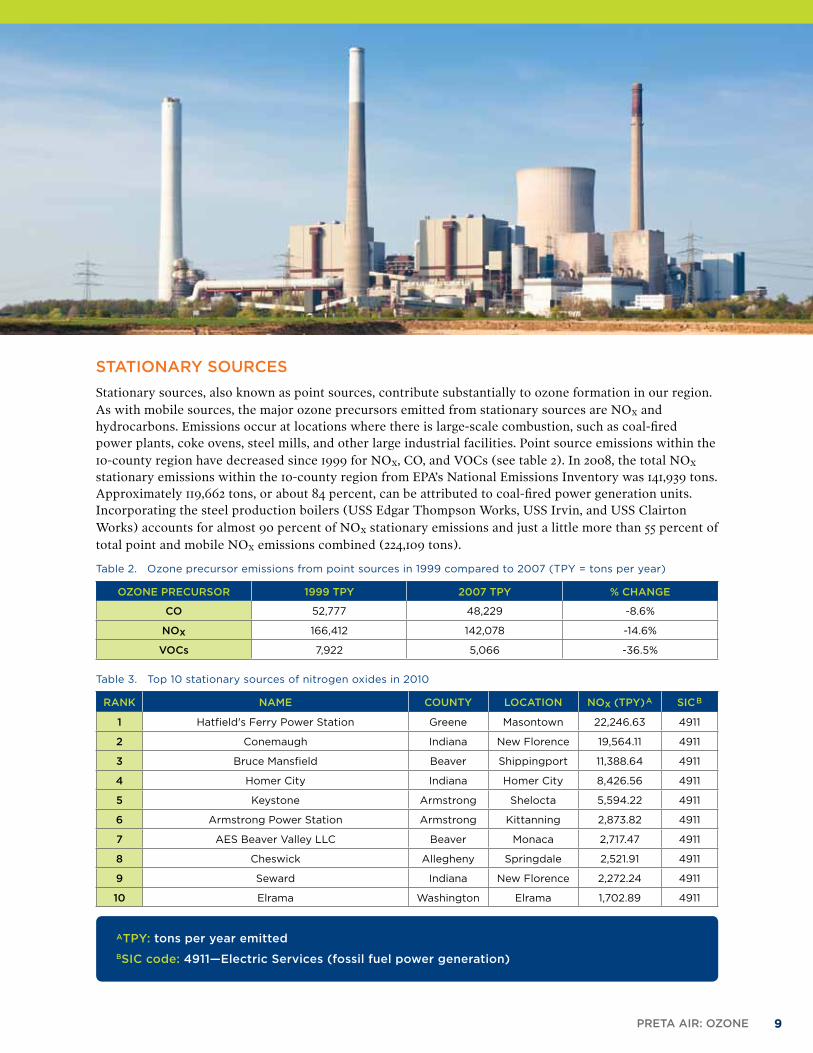
STATIONARY SOURCES
Stationary.sources,.also.known.as.point.sources,.contribute.substantially.to.ozone.formation.in.our.region...As.with.mobile.sources,.the.major.ozone.precursors.emitted.from.stationary.sources.are.NOx.and.hydrocarbons..Emissions.occur.at.locations.where.there.is.large-scale.combustion,.such.as.coal-fired.power.plants,.coke.ovens,.steel.mills,.and.other.large.industrial.facilities..Point.source.emissions.within.the.10-county.region.have.decreased.since.1999.for.NOx,.CO,.and.VOCs.(see.table.2)..In.2008,.the.total.NOx.stationary.emissions.within.the.10-county.region.from.EPA’s.National.Emissions.Inventory.was.141,939.tons..Approximately.119,662.tons,.or.about.84.percent,.can.be.attributed.to.coal-fired.power.generation.units..Incorporating.the.steel.production.boilers.(USS.Edgar.Thompson.Works,.USS.Irvin,.and.USS.Clairton.Works).accounts.for.almost.90.percent.of.NOx.stationary.emissions.and.just.a.little.more.than.55.percent.of.total.point.and.mobile.NOx.emissions.combined.(224,109.tons).
RANK NAME COUNTY LOCATION NOx (TPY) A SIC B
1 Hatfield's Ferry Power Station Greene Masontown 22,246.63 4911
2 Conemaugh Indiana New Florence 19,564.11 4911
3 Bruce Mansfield Beaver Shippingport 11,388.64 4911
4 Homer City Indiana Homer City 8,426.56 4911
5 Keystone Armstrong Shelocta 5,594.22 4911
6 Armstrong Power Station Armstrong Kittanning 2,873.82 4911
7 AES Beaver Valley LLC Beaver Monaca 2,717.47 4911
8 Cheswick Allegheny Springdale 2,521.91 4911
9 Seward Indiana New Florence 2,272.24 4911
10 Elrama Washington Elrama 1,702.89 4911
Table 3. Top 10 stationary sources of nitrogen oxides in 2010
ATPY: tons per year emitted
B SIC code: 4911—Electric Services (fossil fuel power generation)
OZONE PRECURSOR 1999 TPY 2007 TPY % CHANGE
CO 52,777 48,229 -8.6%
NOx 166,412 142,078 -14.6%
VOCs 7,922 5,066 -36.5%
Table 2. Ozone precursor emissions from point sources in 1999 compared to 2007 (TPy = tons per year)
10 PITTSBURGH REGIONAL ENVIRONMENTAL THREATS ANALYSIS REPORT
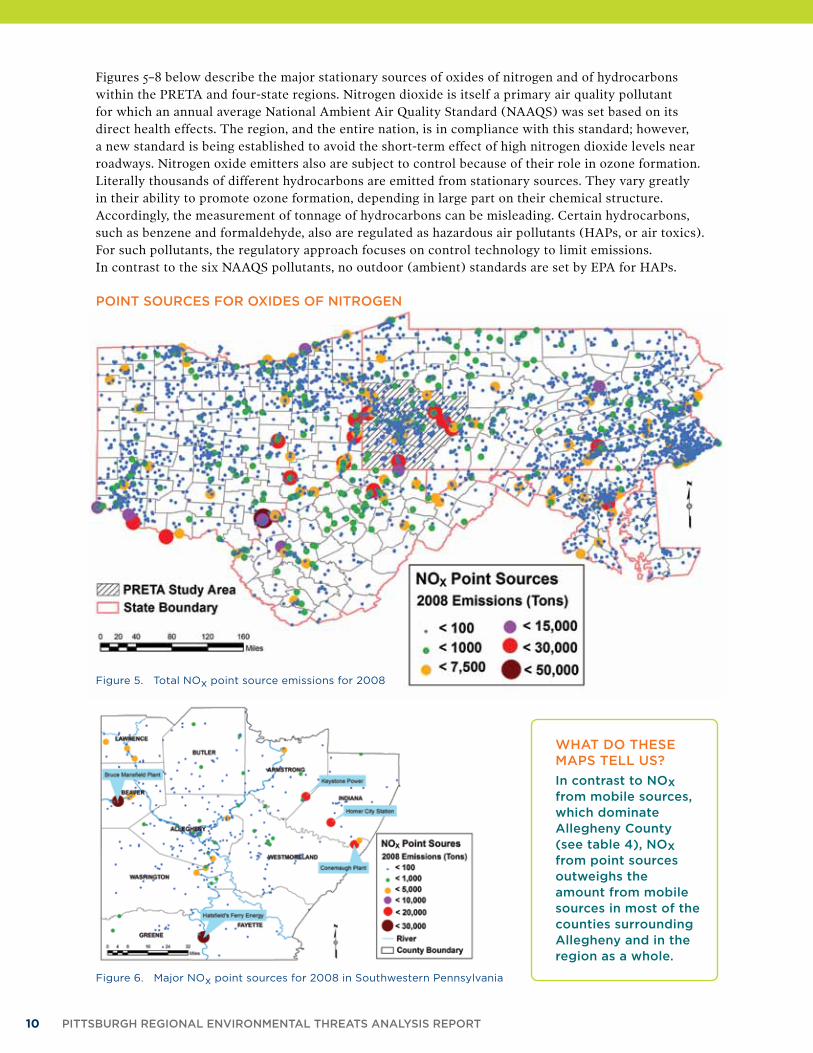
Figures.5–8.below.describe.the.major.stationary.sources.of.oxides.of.nitrogen.and.of.hydrocarbons.within.the.PRETA.and.four-state.regions..Nitrogen.dioxide.is.itself.a.primary.air.quality.pollutant.for.which.an.annual.average.National.Ambient.Air.Quality.Standard.(NAAQS).was.set.based.on.its.direct.health.effects..The.region,.and.the.entire.nation,.is.in.compliance.with.this.standard;.however,.a.new.standard.is.being.established.to.avoid.the.short-term.effect.of.high.nitrogen.dioxide.levels.near.roadways..Nitrogen.oxide.emitters.also.are.subject.to.control.because.of.their.role.in.ozone.formation..Literally.thousands.of.different.hydrocarbons.are.emitted.from.stationary.sources..They.vary.greatly.in.their.ability.to.promote.ozone.formation,.depending.in.large.part.on.their.chemical.structure..Accordingly,.the.measurement.of.tonnage.of.hydrocarbons.can.be.misleading..Certain.hydrocarbons,.such.as.benzene.and.formaldehyde,.also.are.regulated.as.hazardous.air.pollutants.(HAPs,.or.air.toxics)..For.such.pollutants,.the.regulatory.approach.focuses.on.control.technology.to.limit.emissions...In.contrast.to.the.six.NAAQS.pollutants,.no.outdoor.(ambient).standards.are.set.by.EPA.for.HAPs.
Figure 5. Total NOx point source emissions for 2008
Figure 6. Major NOx point sources for 2008 in Southwestern Pennsylvania
POINT SOURCES FOR OXIDES OF NITROGEN
WHAT DO THESE MAPS TELL US?
In contrast to NOx from mobile sources, which dominate Allegheny County (see table 4), NOx from point sources outweighs the amount from mobile sources in most of the counties surrounding Allegheny and in the region as a whole.
PRETA AIR: OZONE 11
COUNTY2002 NOx
POINT SOURCE2005 NOx
POINT SOURCE2008 NOx
POINT SOURCE
ALLEGHENY 30.6% 31.4% 31.8%
ARMSTRONG 92.2% 91.6% 90.7%
BEAVER 84.9% 84.7% 85.9%
BUTLER 32.5% 35.2% 33.8%
FAYETTE 22.6% 17.9% 9.0%
GREENE 90.8% 89.2% 91.3%
INDIANA 93.6% 93.5% 93.3%
LAWRENCE 71.0% 71.6% 69.1%
WASHINGTON 57.1% 53.8% 52.7%
WESTMORELAND 23.5% 27.4% 21.6%
10 COUNTY TOTAL 64.6% 64.4% 66.3%
WHAT DOES THIS TABLE TELL US?
NOx mostly comes from mobile sources (68.7 percent average over three time periods) in Allegheny County. But in the rest of the PRETA region, NOx overwhelmingly comes from point sources. The ratio in Armstrong county is almost 10:1 stationary, Beaver is 6:1 stationary, Greene is 10:1 stationary, and Indiana is almost 14:1. Note that ozone can be produced many miles from the source of the ozone precursors. These trends have remained relatively constant over the previous three emissions inventories, so local emissions do not tell us everything about local ozone production. Most importantly, the overall source of nitrogen oxides for the 10-county region is stationary sources by a ratio of almost two to one.
Table 4. Percentage of NOx from point sources emitted by county in 2002, 2005, and 2008
Further,.figure.5.shows.that.the.majority.of.major.NOx.sources.of.the.four-state.area.are.directly.upwind.of.the.PRETA.region.and.tend.to.follow.the.Ohio.River.Valley.(putting.Pittsburgh.downwind.of.major.sources)..The.top.10.major.point.source.emitters.of.NOx.are.fossil.fuel.power.generation.plants..Hatsfield’s.Ferry.Power.Station.in.Masontown,.Greene.County,.along.the.Monongahela.River.was.the.largest.emitter.of.NOx.last.year,.releasing.more.than.22,000.tons..Point.sources.for.VOCs.tend.to.be.clustered.in.the.more.urban.areas.(see.figures.7.and.8)..
The top 10 major point source emitters of NOx in 2008 were all coal-fired power generation plants.
12 PITTSBURGH REGIONAL ENVIRONMENTAL THREATS ANALYSIS REPORT
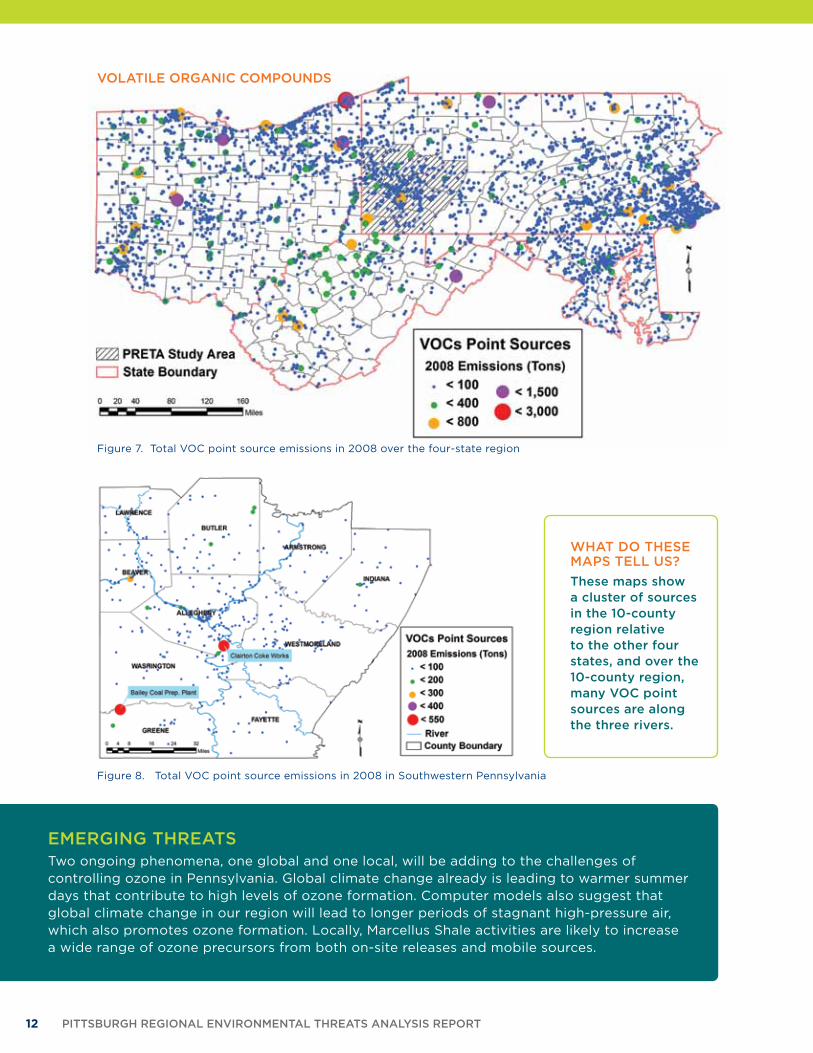
Figure 7. Total VOC point source emissions in 2008 over the four-state region
Figure 8. Total VOC point source emissions in 2008 in Southwestern Pennsylvania
VOLATILE ORGANIC COMPOUNDS
WHAT DO THESE MAPS TELL US?
These maps show a cluster of sources in the 10-county region relative to the other four states, and over the 10-county region, many VOC point sources are along the three rivers.
EMERGING THREATSTwo ongoing phenomena, one global and one local, will be adding to the challenges of controlling ozone in Pennsylvania. Global climate change already is leading to warmer summer days that contribute to high levels of ozone formation. Computer models also suggest that global climate change in our region will lead to longer periods of stagnant high-pressure air, which also promotes ozone formation. Locally, Marcellus Shale activities are likely to increase a wide range of ozone precursors from both on-site releases and mobile sources.
PRETA AIR: OZONE 13
Volatile Organic Compounds
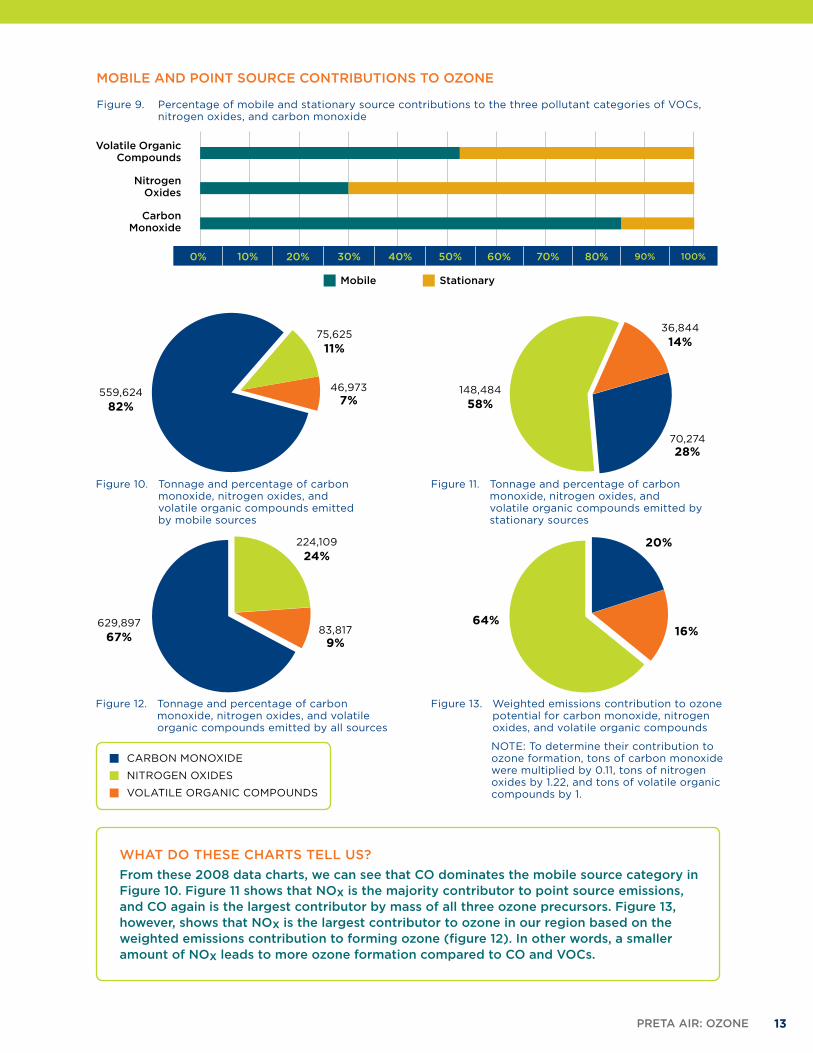
Figure 9. Percentage of mobile and stationary source contributions to the three pollutant categories of VOCs, nitrogen oxides, and carbon monoxide
0% 10% 20% 30% 40% 50% 60% 70% 80% 90% 100%
Nitrogen Oxides
Carbon Monoxide
Mobile Stationary
Figure 10. Tonnage and percentage of carbon monoxide, nitrogen oxides, and volatile organic compounds emitted by mobile sources
559,624
82%
75,625
11%
46,9737%
Figure 11. Tonnage and percentage of carbon monoxide, nitrogen oxides, and volatile organic compounds emitted by stationary sources
148,484
58%
36,844
14%
70,27428%
MOBILE AND POINT SOURCE CONTRIBUTIONS TO OZONE
CARBON MONOXIDE
NITROGEN OXIDES
VOLATILE ORGANIC COMPOUNDS
629,897
67%
224,109
24%
83,8179%
Figure 12. Tonnage and percentage of carbon monoxide, nitrogen oxides, and volatile organic compounds emitted by all sources
Figure 13. Weighted emissions contribution to ozone potential for carbon monoxide, nitrogen oxides, and volatile organic compounds
NOTE: To determine their contribution to ozone formation, tons of carbon monoxide were multiplied by 0.11, tons of nitrogen oxides by 1.22, and tons of volatile organic compounds by 1.
64%
20%
16%
WHAT DO THESE CHARTS TELL US?
From these 2008 data charts, we can see that CO dominates the mobile source category in Figure 10. Figure 11 shows that NOx is the majority contributor to point source emissions, and CO again is the largest contributor by mass of all three ozone precursors. Figure 13, however, shows that NOx is the largest contributor to ozone in our region based on the weighted emissions contribution to forming ozone (figure 12). In other words, a smaller amount of NOx leads to more ozone formation compared to CO and VOCs.
14 PITTSBURGH REGIONAL ENVIRONMENTAL THREATS ANALYSIS REPORT
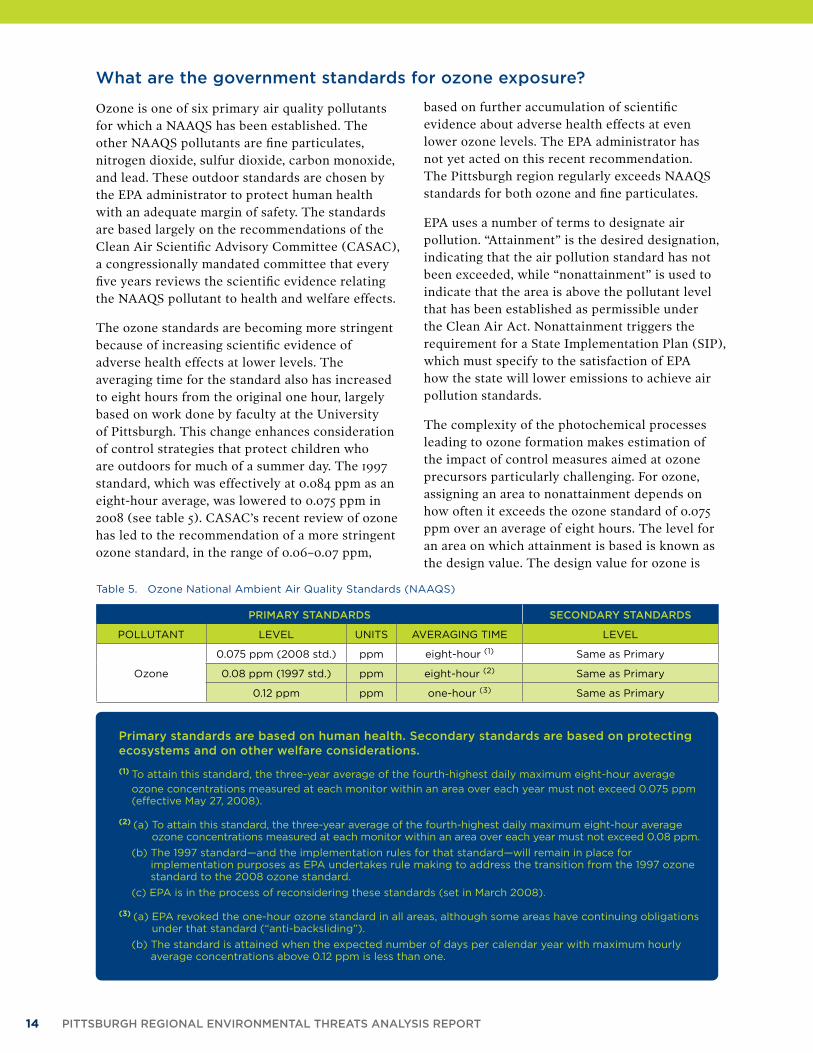
What are the government standards for ozone exposure?
Ozone.is.one.of.six.primary.air.quality.pollutants.for.which.a.NAAQS.has.been.established..The.other.NAAQS.pollutants.are.fine.particulates,.nitrogen.dioxide,.sulfur.dioxide,.carbon.monoxide,.and.lead..These.outdoor.standards.are.chosen.by.the.EPA.administrator.to.protect.human.health.with.an.adequate.margin.of.safety..The.standards.are.based.largely.on.the.recommendations.of.the.Clean.Air.Scientific.Advisory.Committee.(CASAC),.a.congressionally.mandated.committee.that.every.five.years.reviews.the.scientific.evidence.relating.the.NAAQS.pollutant.to.health.and.welfare.effects..
The.ozone.standards.are.becoming.more.stringent.because.of.increasing.scientific.evidence.of.adverse.health.effects.at.lower.levels..The.averaging.time.for.the.standard.also.has.increased.to.eight.hours.from.the.original.one.hour,.largely.based.on.work.done.by.faculty.at.the.University.of.Pittsburgh..This.change.enhances.consideration.of.control.strategies.that.protect.children.who.are.outdoors.for.much.of.a.summer.day..The.1997.standard,.which.was.effectively.at.0.084.ppm.as.an.eight-hour.average,.was.lowered.to.0.075.ppm.in.2008.(see.table.5)..CASAC’s.recent.review.of.ozone.has.led.to.the.recommendation.of.a.more.stringent.ozone.standard,.in.the.range.of.0.06–0.07.ppm,..
based.on.further.accumulation.of.scientific.evidence.about.adverse.health.effects.at.even.lower.ozone.levels..The.EPA.administrator.has.not.yet.acted.on.this.recent.recommendation..The.Pittsburgh.region.regularly.exceeds.NAAQS.standards.for.both.ozone.and.fine.particulates..
EPA.uses.a.number.of.terms.to.designate.air.pollution..“Attainment”.is.the.desired.designation,.indicating.that.the.air.pollution.standard.has.not.been.exceeded,.while.“nonattainment”.is.used.to.indicate.that.the.area.is.above.the.pollutant.level.that.has.been.established.as.permissible.under.the.Clean.Air.Act..Nonattainment.triggers.the.requirement.for.a.State.Implementation.Plan.(SIP),.which.must.specify.to.the.satisfaction.of.EPA.how.the.state.will.lower.emissions.to.achieve.air.pollution.standards.
The.complexity.of.the.photochemical.processes.leading.to.ozone.formation.makes.estimation.of.the.impact.of.control.measures.aimed.at.ozone.precursors.particularly.challenging..For.ozone,.assigning.an.area.to.nonattainment.depends.on.how.often.it.exceeds.the.ozone.standard.of.0.075.ppm.over.an.average.of.eight.hours..The.level.for.an.area.on.which.attainment.is.based.is.known.as.the.design.value..The.design.value.for.ozone.is.
PRIMARY STANDARDS SECONDARY STANDARDS
POLLUTANT LEVEL UNITS AVERAGING TIME LEVEL
Ozone
0.075 ppm (2008 std.) ppm eight-hour (1) Same as Primary
0.08 ppm (1997 std.) ppm eight-hour (2) Same as Primary
0.12 ppm ppm one-hour (3) Same as Primary
Table 5. Ozone National Ambient Air Quality Standards (NAAQS)
Primary standards are based on human health. Secondary standards are based on protecting ecosystems and on other welfare considerations.
(1) To attain this standard, the three-year average of the fourth-highest daily maximum eight-hour average
ozone concentrations measured at each monitor within an area over each year must not exceed 0.075 ppm (effective May 27, 2008).
(2) (a) To attain this standard, the three-year average of the fourth-highest daily maximum eight-hour average ozone concentrations measured at each monitor within an area over each year must not exceed 0.08 ppm.
(b) The 1997 standard—and the implementation rules for that standard—will remain in place for implementation purposes as EPA undertakes rule making to address the transition from the 1997 ozone standard to the 2008 ozone standard.
(c) EPA is in the process of reconsidering these standards (set in March 2008).
(3) (a) EPA revoked the one-hour ozone standard in all areas, although some areas have continuing obligations under that standard (“anti-backsliding”).
(b) The standard is attained when the expected number of days per calendar year with maximum hourly average concentrations above 0.12 ppm is less than one.
PRETA AIR: OZONE 15
a.formula.based.on.the.three-year.average.of.the.fourth-highest.daily.maximum.eight-hour.ozone.concentration..This.more.complex.approach.has.evolved.from.the.original.standard.that.was.based.on.the.second-highest.ozone.level..The.reason.for.the.change.is.that.the.highest.ozone.values.in.any.given.year.are.dependent.on.seasonal.weather.conditions,.which.makes.it.difficult.to.provide.a.stable.base.for.making.environmental.control.decisions.
EPA.has.developed.a.somewhat.confusing.approach.to.designating.the.extent.to.which.an.area.has.unhealthy.air.and.to.specifying.the.categories.that.require.specific.action..The.most.recent.measurements.of.ozone.show.our.region.did.not.exceed.the.1997.eight-hour.ozone.standard.of.0.08.ppm.during.the.period.2007–10.1.This.achievement.lessens.the.extent.to.which.the.Commonwealth.of.Pennsylvania.must.develop.and.submit.plans.to.EPA.for.controlling.ozone.in.the.Pittsburgh.area..However,.because.our.region.did.exceed.this.standard.before.2007,.EPA.requires.Pennsylvania.to.continue.to.carefully.monitor.ozone.levels.and.to.report.plans.to.maintain.ozone.levels.within.the.standard..More.importantly,.our.area.still.exceeds.EPA’s.2008.health-based.ozone.standard.of.0.075.ppm,.but.as.this.more.stringent.standard.has.been.held.up.by.legal.battles,.EPA.is.not.enforcing.it..Further,.consideration.of.recent.evidence.concerning.the.health.effects.of.ozone.has.led.EPA’s.scientific.advisory.process.to.recommend.an.even.stricter.standard.in.the.range.of.0.06–0.07.ppm..EPA.Administrator.Lisa.Jackson.is.now.considering.this.standard.
EPA.uses.the.term.“maintenance”.to.designate.an.area.that.has.decreased.its.level.of.pollutants.from.a.previous.designation.of.nonattainment.to.a.level.that.warrants.the.designation.of.attainment..Such.an.area.is.required.to.have.continued.monitoring.and.a.10-year.maintenance.plan.to.ensure.attainment.is.maintained..EPA.has.created.an.indicator,.labeled.the.Air.Quality.Index,.to.alert..the.public.about.healthy.to.poor.ozone.levels..(see.table.7).
How much ozone are we exposed to?
The.health-based.ozone.standard.of.0.075.ppm.for.an.eight-hour.period.is.exceeded.in.most.of.our.region.(see.figure.14)..Because.we.exceed.the.ozone.standard.and.because.of.our.population.density,.our.region.is.required.to.have.a.relatively.extensive.monitoring.station.network.for.ozone.(see.figure.15)..Monitoring.stations.measuring.ozone.are.located.throughout.the.Southwestern.Pennsylvania.region,.and.the.coverage.by.these.stations.extends.into.nearby.areas.of.Ohio.and.West.Virginia..Eight.of.the.10.PRETA.counties.maintain.air.monitoring.stations.for.ozone..Butler.and.Fayette.Counties.do.not.have.ozone.monitors..
Of.the.10.counties.in.the.PRETA.region,.six.are.in.nonattainment.for.the.eight-hour.ozone.standard..Indiana.and.Greene.counties.have.been.redesignated.for.attainment.of.the.eight-hour.ozone.standard..Lawrence.County.is.the.only.county.within.the.PRETA.region.that.has.neither.a.nonattainment.nor.maintenance.designation..for.ozone..
Because we exceed the ozone standard and because of our population density, our region is required to have a relatively extensive monitoring station network for ozone.
1..Federal.Register,.Volume.76,.Issue.104,.pp..31,237–9,.May.31,.2011..An.example.of.the.confusing.use.of.terms.is.EPA’s.statement.about.the.ozone.levels.in.the.Pittsburgh/Beaver.Valley.area:.“This.determination.of.attainment.is.not.equivalent.to.a.redesignation.to.attainment.”.Briefly.put,.an.area.such.as.Pittsburgh/Beaver.Valley.that.has.previously.exceeded.a.NAAQS.standard,.known.as.“nonattainment,”.could.be.moved.to.a.“maintenance”.category..This.maintenance.category.requires.certain.actions,.including.monitoring,.to.be.sure.that.there.is.no.backsliding.to.nonattainment..The.term.“attainment”.is.applied.to.areas.that.are.not.now.exceeding.and.have.not.in.recent.years.exceeded.the.specific.air.pollutant.standard..For.example,.our.area.is.in.attainment.for.the.carbon.monoxide.standard..
16 PITTSBURGH REGIONAL ENVIRONMENTAL THREATS ANALYSIS REPORT
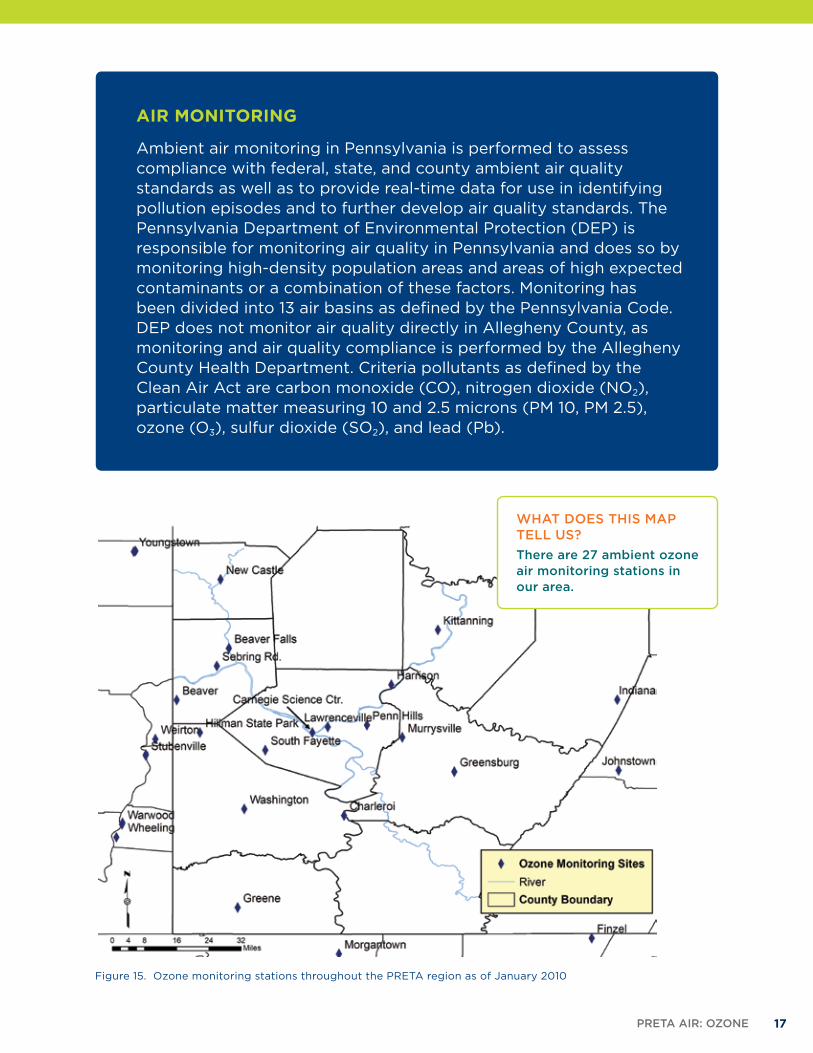
Figure 14. Eight-hour ozone areas designated for the 2008 air quality standards of 0.075 ppm as of 2010, based on 2004–06 design values. yellow-shaded counties indicate areas of nonattainment. The PRETA study area is indicated by hatched lines.
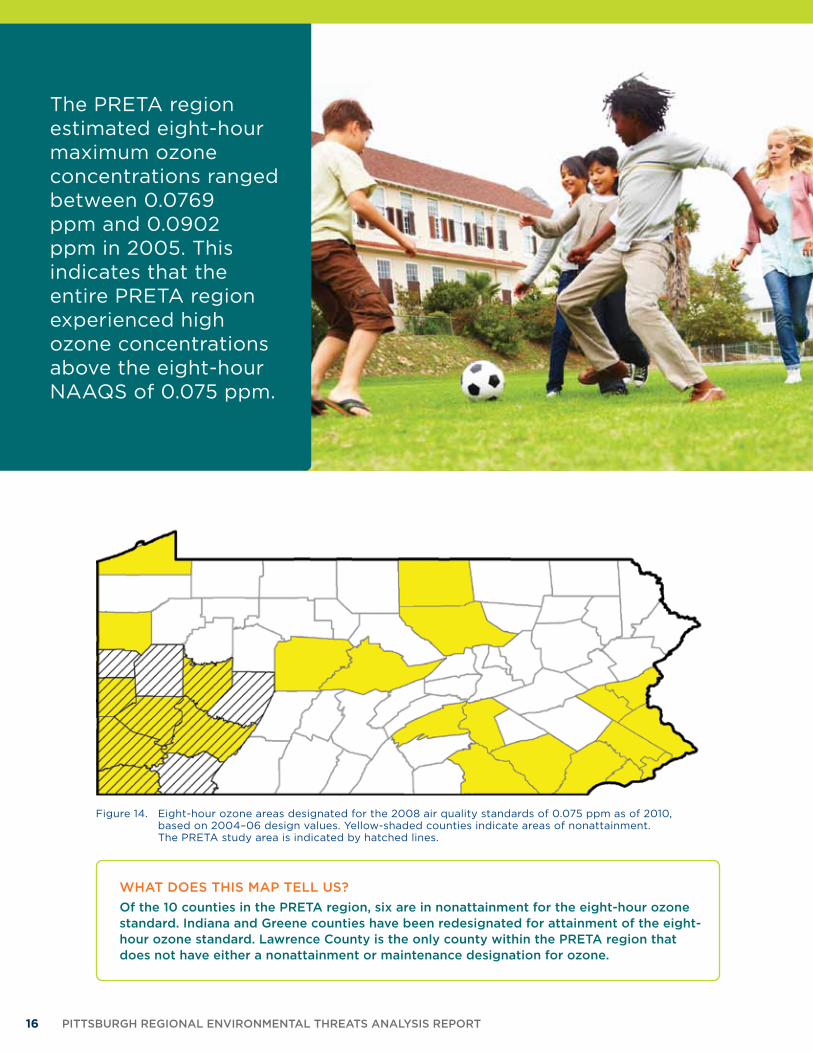
The PRETA region estimated eight-hour maximum ozone concentrations ranged between 0.0769 ppm and 0.0902 ppm in 2005. This indicates that the entire PRETA region experienced high ozone concentrations above the eight-hour NAAQS of 0.075 ppm.
WHAT DOES THIS MAP TELL US?
Of the 10 counties in the PRETA region, six are in nonattainment for the eight-hour ozone standard. Indiana and Greene counties have been redesignated for attainment of the eight-hour ozone standard. Lawrence County is the only county within the PRETA region that does not have either a nonattainment or maintenance designation for ozone.
PRETA AIR: OZONE 17
air mONitOriNG
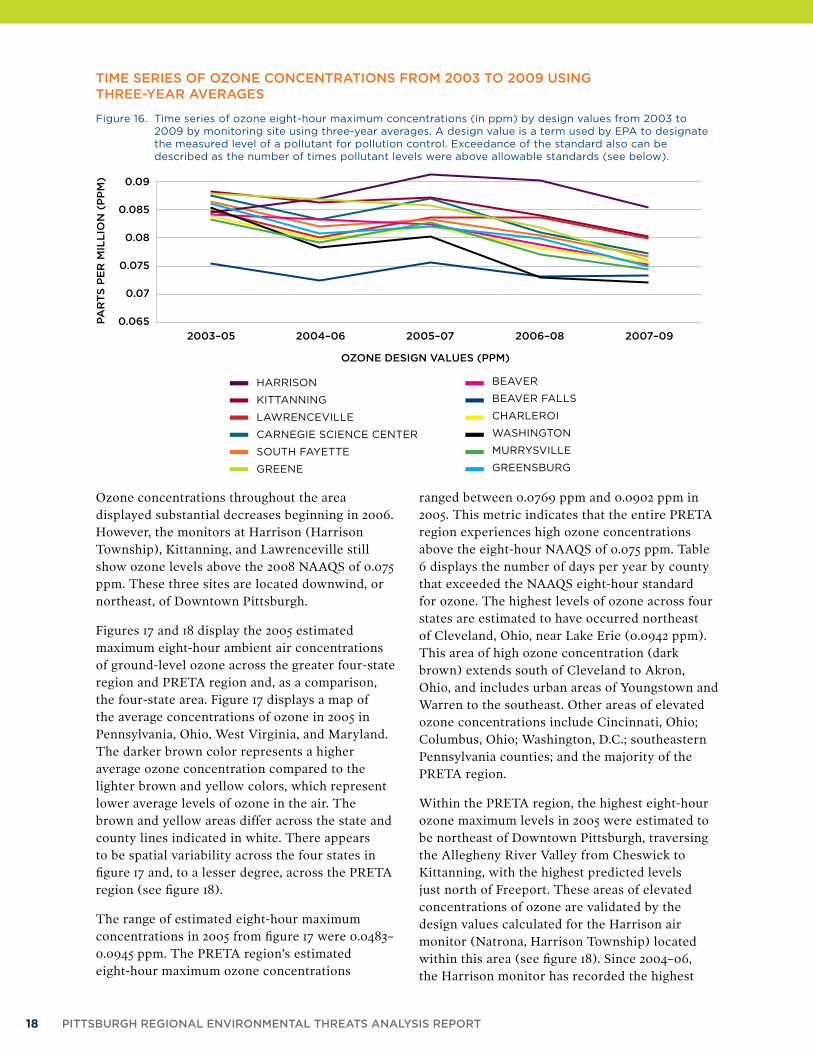
Ambient air monitoring in Pennsylvania is performed to assess compliance with federal, state, and county ambient air quality standards as well as to provide real-time data for use in identifying pollution episodes and to further develop air quality standards. The Pennsylvania Department of Environmental Protection (DEP) is responsible for monitoring air quality in Pennsylvania and does so by monitoring high-density population areas and areas of high expected contaminants or a combination of these factors. Monitoring has been divided into 13 air basins as defined by the Pennsylvania Code. DEP does not monitor air quality directly in Allegheny County, as monitoring and air quality compliance is performed by the Allegheny County Health Department. Criteria pollutants as defined by the Clean Air Act are carbon monoxide (CO), nitrogen dioxide (NO2), particulate matter measuring 10 and 2.5 microns (PM 10, PM 2.5), ozone (O3), sulfur dioxide (SO2), and lead (Pb).
WHAT DOES THIS MAP TELL US?
There are 27 ambient ozone air monitoring stations in our area.
Figure 15. Ozone monitoring stations throughout the PRETA region as of January 2010
18 PITTSBURGH REGIONAL ENVIRONMENTAL THREATS ANALYSIS REPORT
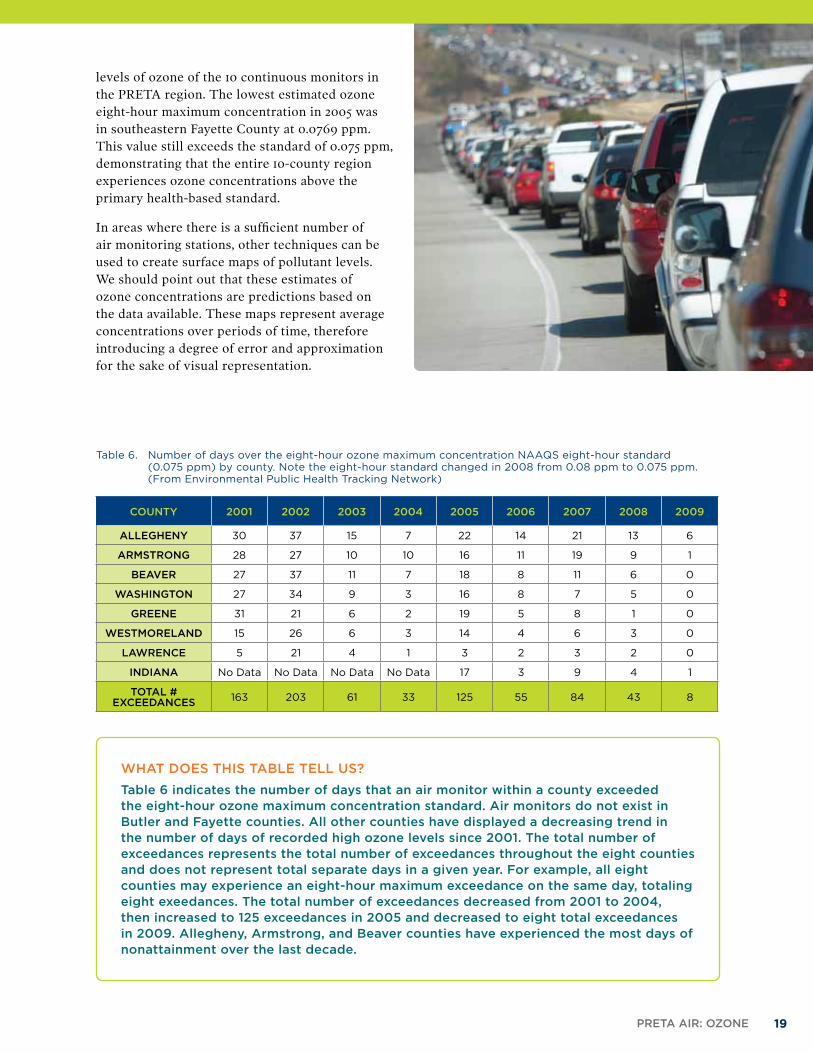
Figure 16. Time series of ozone eight-hour maximum concentrations (in ppm) by design values from 2003 to 2009 by monitoring site using three-year averages. A design value is a term used by EPA to designate the measured level of a pollutant for pollution control. Exceedance of the standard also can be described as the number of times pollutant levels were above allowable standards (see below).
Ozone.concentrations.throughout.the.area.displayed.substantial.decreases.beginning.in.2006..However,.the.monitors.at.Harrison.(Harrison.Township),.Kittanning,.and.Lawrenceville.still.show.ozone.levels.above.the.2008.NAAQS.of.0.075.ppm..These.three.sites.are.located.downwind,.or.northeast,.of.Downtown.Pittsburgh.
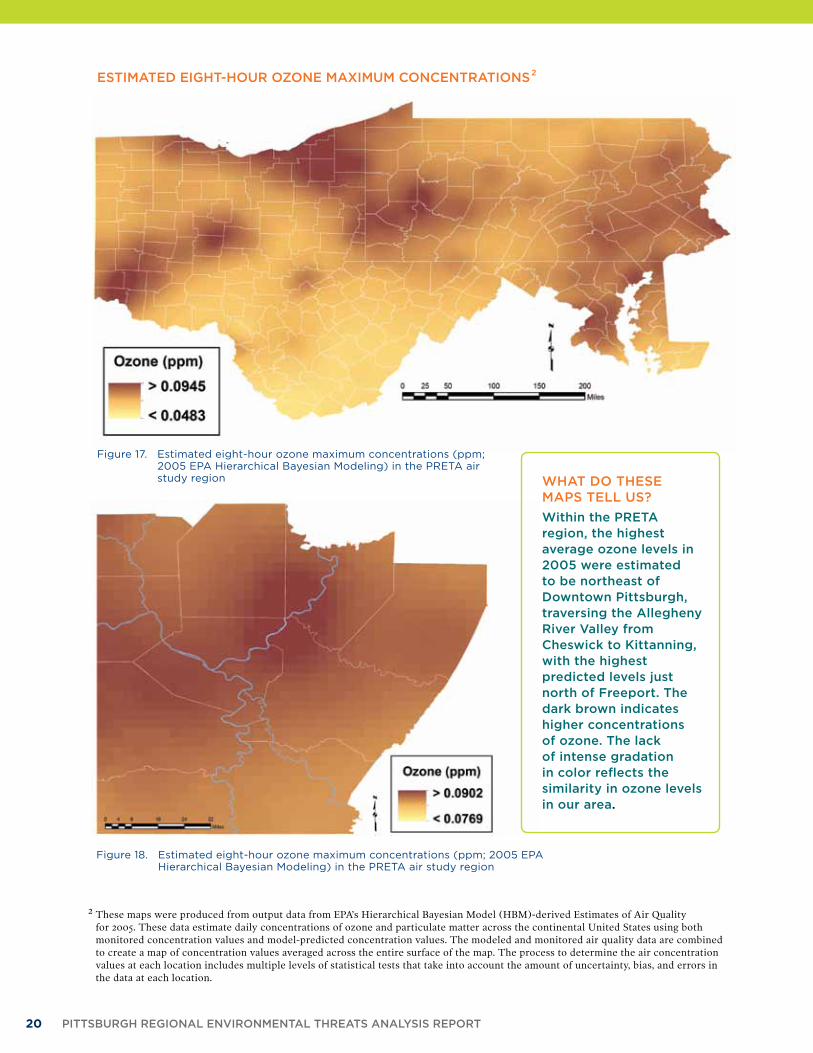
Figures.17.and.18.display.the.2005.estimated.maximum.eight-hour.ambient.air.concentrations.of.ground-level.ozone.across.the.greater.four-state.region.and.PRETA.region.and,.as.a.comparison,.the.four-state.area..Figure.17.displays.a.map.of.the.average.concentrations.of.ozone.in.2005.in.Pennsylvania,.Ohio,.West.Virginia,.and.Maryland..The.darker.brown.color.represents.a.higher.average.ozone.concentration.compared.to.the.lighter.brown.and.yellow.colors,.which.represent.lower.average.levels.of.ozone.in.the.air..The.brown.and.yellow.areas.differ.across.the.state.and.county.lines.indicated.in.white..There.appears.to.be.spatial.variability.across.the.four.states.in.figure.17.and,.to.a.lesser.degree,.across.the.PRETA.region.(see.figure.18)..
The.range.of.estimated.eight-hour.maximum.concentrations.in.2005.from.figure.17.were.0.0483–0.0945.ppm..The.PRETA.region’s.estimated.eight-hour.maximum.ozone.concentrations.
ranged.between.0.0769.ppm.and.0.0902.ppm.in.2005..This.metric.indicates.that.the.entire.PRETA.region.experiences.high.ozone.concentrations.above.the.eight-hour.NAAQS.of.0.075.ppm..Table.6.displays.the.number.of.days.per.year.by.county.that.exceeded.the.NAAQS.eight-hour.standard.for.ozone..The.highest.levels.of.ozone.across.four.states.are.estimated.to.have.occurred.northeast.of.Cleveland,.Ohio,.near.Lake.Erie.(0.0942.ppm)..This.area.of.high.ozone.concentration.(dark.brown).extends.south.of.Cleveland.to.Akron,.Ohio,.and.includes.urban.areas.of.Youngstown.and.Warren.to.the.southeast..Other.areas.of.elevated.ozone.concentrations.include.Cincinnati,.Ohio;.Columbus,.Ohio;.Washington,.D.C.;.southeastern.Pennsylvania.counties;.and.the.majority.of.the.PRETA.region.
Within.the.PRETA.region,.the.highest.eight-hour.ozone.maximum.levels.in.2005.were.estimated.to.be.northeast.of.Downtown.Pittsburgh,.traversing.the.Allegheny.River.Valley.from.Cheswick.to.Kittanning,.with.the.highest.predicted.levels.just.north.of.Freeport..These.areas.of.elevated.concentrations.of.ozone.are.validated.by.the.design.values.calculated.for.the.Harrison.air.monitor.(Natrona,.Harrison.Township).located.within.this.area.(see.figure.18)..Since.2004–06,.the.Harrison.monitor.has.recorded.the.highest.
HARRISON
KITTANNING
LAWRENCEVILLE
CARNEGIE SCIENCE CENTER
SOUTH FAyETTE
GREENE
BEAVER
BEAVER FALLS
CHARLEROI
WASHINGTON
MURRySVILLE
GREENSBURG
2003–05 2004–06 2005–07 2006–08 2007–09
0.09
0.085
0.08
0.075
0.07
0.065
OZONE DESIGN VALUES (PPM)
PA
RT
S P
ER
MIL
LIO
N (
PP
M)
TIME SERIES OF OZONE CONCENTRATIONS FROM 2003 TO 2009 USING THREE-YEAR AVERAGES
PRETA AIR: OZONE 19
levels.of.ozone.of.the.10.continuous.monitors.in.the.PRETA.region..The.lowest.estimated.ozone.eight-hour.maximum.concentration.in.2005.was.in.southeastern.Fayette.County.at.0.0769.ppm..This.value.still.exceeds.the.standard.of.0.075.ppm,.demonstrating.that.the.entire.10-county.region.experiences.ozone.concentrations.above.the.primary.health-based.standard..
In.areas.where.there.is.a.sufficient.number.of.air.monitoring.stations,.other.techniques.can.be.used.to.create.surface.maps.of.pollutant.levels..We.should.point.out.that.these.estimates.of.ozone.concentrations.are.predictions.based.on.the.data.available..These.maps.represent.average.concentrations.over.periods.of.time,.therefore.introducing.a.degree.of.error.and.approximation.for.the.sake.of.visual.representation..
COUNTY 2001 2002 2003 2004 2005 2006 2007 2008 2009
ALLEGHENY 30 37 15 7 22 14 21 13 6
ARMSTRONG 28 27 10 10 16 11 19 9 1
BEAVER 27 37 11 7 18 8 11 6 0
WASHINGTON 27 34 9 3 16 8 7 5 0
GREENE 31 21 6 2 19 5 8 1 0
WESTMORELAND 15 26 6 3 14 4 6 3 0
LAWRENCE 5 21 4 1 3 2 3 2 0
INDIANA No Data No Data No Data No Data 17 3 9 4 1
TOTAL # EXCEEDANCES 163 203 61 33 125 55 84 43 8
Table 6. Number of days over the eight-hour ozone maximum concentration NAAQS eight-hour standard (0.075 ppm) by county. Note the eight-hour standard changed in 2008 from 0.08 ppm to 0.075 ppm. (From Environmental Public Health Tracking Network)
WHAT DOES THIS TABLE TELL US?
Table 6 indicates the number of days that an air monitor within a county exceeded the eight-hour ozone maximum concentration standard. Air monitors do not exist in Butler and Fayette counties. All other counties have displayed a decreasing trend in the number of days of recorded high ozone levels since 2001. The total number of exceedances represents the total number of exceedances throughout the eight counties and does not represent total separate days in a given year. For example, all eight counties may experience an eight-hour maximum exceedance on the same day, totaling eight exeedances. The total number of exceedances decreased from 2001 to 2004, then increased to 125 exceedances in 2005 and decreased to eight total exceedances in 2009. Allegheny, Armstrong, and Beaver counties have experienced the most days of nonattainment over the last decade.
20 PITTSBURGH REGIONAL ENVIRONMENTAL THREATS ANALYSIS REPORT
2..These.maps.were.produced.from.output.data.from.EPA’s.Hierarchical.Bayesian.Model.(HBM)-derived.Estimates.of.Air.Quality.for.2005..These.data.estimate.daily.concentrations.of.ozone.and.particulate.matter.across.the.continental.United.States.using.both.monitored.concentration.values.and.model-predicted.concentration.values..The.modeled.and.monitored.air.quality.data.are.combined.to.create.a.map.of.concentration.values.averaged.across.the.entire.surface.of.the.map..The.process.to.determine.the.air.concentration.values.at.each.location.includes.multiple.levels.of.statistical.tests.that.take.into.account.the.amount.of.uncertainty,.bias,.and.errors.in.the.data.at.each.location..
Figure 17. Estimated eight-hour ozone maximum concentrations (ppm; 2005 EPA Hierarchical Bayesian Modeling) in the PRETA air study region
ESTIMATED EIGHT-HOUR OZONE MAXIMUM CONCENTRATIONS 2
Figure 18. Estimated eight-hour ozone maximum concentrations (ppm; 2005 EPA Hierarchical Bayesian Modeling) in the PRETA air study region
WHAT DO THESE MAPS TELL US?
Within the PRETA region, the highest average ozone levels in 2005 were estimated to be northeast of Downtown Pittsburgh, traversing the Allegheny River Valley from Cheswick to Kittanning, with the highest predicted levels just north of Freeport. The dark brown indicates higher concentrations of ozone. The lack of intense gradation in color reflects the similarity in ozone levels in our area.
PRETA AIR: OZONE 21
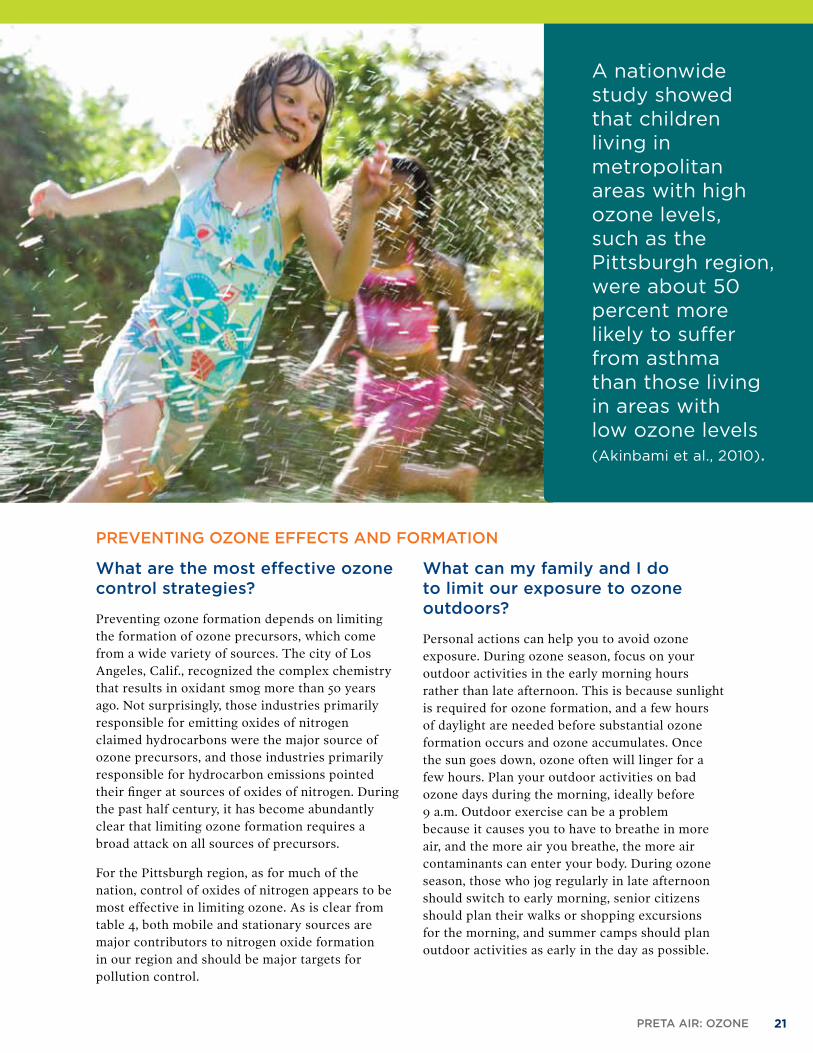
A nationwide study showed that children living in metropolitan areas with high ozone levels, such as the Pittsburgh region, were about 50 percent more likely to suffer from asthma than those living in areas with low ozone levels (Akinbami et al., 2010).
PREVENTING OZONE EFFECTS AND FORMATION
What are the most effective ozone control strategies?
Preventing.ozone.formation.depends.on.limiting.the.formation.of.ozone.precursors,.which.come.from.a.wide.variety.of.sources..The.city.of.Los.Angeles,.Calif.,.recognized.the.complex.chemistry.that.results.in.oxidant.smog.more.than.50.years.ago..Not.surprisingly,.those.industries.primarily.responsible.for.emitting.oxides.of.nitrogen.claimed.hydrocarbons.were.the.major.source.of.ozone.precursors,.and.those.industries.primarily.responsible.for.hydrocarbon.emissions.pointed.their.finger.at.sources.of.oxides.of.nitrogen..During.the.past.half.century,.it.has.become.abundantly.clear.that.limiting.ozone.formation.requires.a.broad.attack.on.all.sources.of.precursors...
For.the.Pittsburgh.region,.as.for.much.of.the.nation,.control.of.oxides.of.nitrogen.appears.to.be.most.effective.in.limiting.ozone..As.is.clear.from.table.4,.both.mobile.and.stationary.sources.are.major.contributors.to.nitrogen.oxide.formation.in.our.region.and.should.be.major.targets.for.pollution.control.
What can my family and I do to limit our exposure to ozone outdoors?
Personal.actions.can.help.you.to.avoid.ozone.exposure..During.ozone.season,.focus.on.your.outdoor.activities.in.the.early.morning.hours.rather.than.late.afternoon..This.is.because.sunlight.is.required.for.ozone.formation,.and.a.few.hours.of.daylight.are.needed.before.substantial.ozone.formation.occurs.and.ozone.accumulates..Once..the.sun.goes.down,.ozone.often.will.linger.for.a.few.hours..Plan.your.outdoor.activities.on.bad.ozone.days.during.the.morning,.ideally.before..9.a.m..Outdoor.exercise.can.be.a.problem.because.it.causes.you.to.have.to.breathe.in.more.air,.and.the.more.air.you.breathe,.the.more.air.contaminants.can.enter.your.body..During.ozone.season,.those.who.jog.regularly.in.late.afternoon.should.switch.to.early.morning,.senior.citizens.should.plan.their.walks.or.shopping.excursions.for.the.morning,.and.summer.camps.should.plan.outdoor.activities.as.early.in.the.day.as.possible..
22 PITTSBURGH REGIONAL ENVIRONMENTAL THREATS ANALYSIS REPORT
What about indoors?
The.bad.news.about.ozone.is.that.it.is.so.highly.reactive.that.very.small.amounts.can.cause.toxicity..This.same.reactivity.limits.the.ability.of.ozone.to.penetrate.or.accumulate.indoors.because.it.reacts.with.the.first.surface.it.touches..Staying.indoors.prevents.exposure.to.ozone,.although.there.are.exceptions..Exercising.on.a.stationary.bike.next.to.an.open.window.when.there.are.high.outdoor.ozone.levels.can.lead.to.significant.ozone.exposure..Other.sources.of.indoor.air.exposure.that.are.particularly.unfortunate.are.certain.“air.purifiers”.that.work.by.electrostatic.precipitation..These.can.be.a.source.of.ozone.if.they.are.not.tuned.correctly,.but.this.can.be.avoided.by.paying.close.attention.to.manufacturer.specifications.
What are the economic benefits of avoiding ozone?
The.Clean.Air.Act.does.not.permit.the.EPA.administrator.to.take.economic.considerations.into.account.in.setting.the.standard.for.ozone.or.for.the.other.primary.air.quality.pollutants.(lead,.sulfur.dioxide,.carbon.monoxide,.fine.particulates,.and.nitrogen.dioxide)..However,.economic.costs.can.be.used.to.determine.the.most.effective.way.to.meet.the.standard..Moreover,.EPA.is.required.to.calculate.the.economic.benefits.and.costs.for.each.of.its.clean.air.standards..
The.most.recent.EPA.estimate.is.that.the.annual.economic.benefit.from.meeting.the.current.0.075.ppm.standard.will.range.from.$6.4.to.$18.billion.in.the.year.2020..This.benefit.would.increase.further.if.EPA.were.to.adopt.the.more.stringent.standard.now.being.considered..Note.that.this.benefit.includes.an.estimate.for.the.decrease.in.the.health.effects.of.fine.particulates.that.would.not.be.formed.because.of.the.necessary.reduction.in.nitrogen.oxide.emissions.to.meet.the.ozone.standard..Nitrogen.oxides.also.are.a.source.of.fine.particulates..Further,.EPA.has.intentionally.omitted.two.California.areas.from.its.estimates,.as.these.heavily.polluted.areas.would.not.be.expected.to.meet.the.new.ozone.standard.in.2020.
A.number.of.health.and.economic.estimates.have.been.made.for.both.the.benefits.and.costs.of.meeting.the.ozone.standard..For.example,.EPA.scientists.estimated.for.the.2000–02.time.period.that.achieving.the.then.0.08.ppm.ozone.standard.nationally.would.result.in.an.average.yearly.decrease.of.800.premature.deaths,.4,500.hospital.and.emergency.department.admissions,.900,000.school.absences,.and.more.than.1.million.minor.restricted.activity.days..The.average.of.benefits.across.the.three.years.was.estimated.as.$4.9.or.$5.7.billion.per.year,.depending.on.the.method.used.(Hubbell.et.al.,.2005)..All.of.the.methods.used.for.predicting.total.health.effects.due.to.ozone.and.their.economic.costs,.which.in.the.past.have.given.widely.differing.numbers,.are.undergoing.intense.scrutiny.as.part.of.the.current.active.consideration.of.the.new.ozone.standard..
FACTORS LIKELY TO INCREASE FUTURE OZONE LEVELS
GLOBAL CLIMATE CHANGE
Outdoor temperature is one of the factors determining the extent of ozone formation. The anticipated temperature increase due to global warming has been calculated to add 0.001–0.002 ppm of ozone by the year 2020 and 0.002–0.007 ppm by the year 2050 (Union of Concerned Scientists). Pennsylvania is projected to be the fifth-hardest hit state in the nation. The central estimate is that if there is an increase of 0.002 ppm ozone due to climate change, in the year 2020, there will be 133,010 more occurrences of acute respiratory symptoms in Pennsylvania. The Union of Concerned Scientists projects more than $300 million in overall health care costs associated with this climate penalty in Pennsylvania in 2020.
MARCELLUS SHALE ACTIVITY
Ozone precursors are released from a variety of Marcellus Shale activities, ranging from the initial fracturing to the leakage of natural gas product. An individual site is unlikely to contribute substantially to total ozone formation, but in the aggregate, the expected development of many thousands of wells poses a significant risk that Marcellus Shale activities will contribute substantially to ozone formation in our state.
PRETA AIR: OZONE 23
How do I know when ozone levels are high?
Almost.all.major.newspapers.and.television,.radio,.and.online.weather.reports.provide.daily.information.about.air.pollution.levels..Check.these.media.sources.daily,.particularly.if.you.are.among.those.populations.most.sensitive.to.ozone..If.you.are.unable.to.access.a.report.on.air.pollution.in.your.area,.you.can.do.a.reasonably.good.job.of.predicting.high.ozone.levels..Ozone.levels.tend.to.be.highest.on.warm.summer.days.when.there.has.not.been.any.rain..For.example,.if.ozone.levels.are.elevated.today.and.it.does.not.rain.tonight,.they.will.be.elevated.each.subsequent.day.it.does.not.rain..Each.successive.day.during.which.there.is.a.warm,.high-pressure.system.tends.to.be.worse.than.the.previous.day,.because.the.ozone.precursors.continue.to.accumulate..Those.who.are.sensitive.to.ozone.toxicity.tend.to.know.when.it.is.higher.because.of.eye.irritation..This.irritation.actually.is.caused.by.other.components.of.oxidant.smog.that.accompany.ozone.formation..For.some,.the.effects.of.ozone.are.recognizable.by.a.tightness.in.the.chest.due.to.the.narrowing.of.their.airways.in.reaction.to.the.higher.levels.of.ozone.
What can my family and I do to decrease the formation of ground-level ozone?
We.all.can.contribute.to.decreasing.ozone.levels.in.our.area.by.reducing.our.use.of.automobiles,.saving.energy,.and.supporting.citizens.groups.that.advocate.for.effective.ozone.control.strategies..During.the.summertime.ozone.season,.specific.recommendations.include.the.following:
•..Use.a.push.mower.wherever.possible..When.using.a.gas-powered.mower,.wait.until.evening.
•..Wait.until.evening.to.refuel.your.car..Keep.your.car.tuned.and.tires.properly.inflated.
•..Do.not.use.charcoal.lighter.fluid.when.grilling..Use.a.charcoal.chimney.or.propane.
•..Use.air.conditioning.judiciously.and.turn..off.unnecessary.lights,.electric.appliances,..and.computers.
AIR QUALITY INDEX
EPA.has.developed.the.Air.Quality.Index.(AQI;.see.table.7).as.a.simplified.standard.approach.across.the.United.States.to.reporting.the.threat.of.major.pollutants.based.on.pollution.levels..EPA.calculates.AQI.daily,.and.the.Pittsburgh Post-Gazette.and.Pittsburgh Tribune-Review.report.it..The.AQI.value.scale.ranges.from.zero.to.500.and.is.based.on.the.levels.of.carbon.monoxide,.nitrogen.dioxide,.ozone,.sulfur.dioxide,.and.particulate.matter..An.AQI.value.of.100.or.above.is.equivalent.to.air.containing.concentrations.of.pollutants.that.are.over.their.NAAQS..
AIR QUALITY INDEX (AQI) VALUES
AIR QUALITY CONDITIONS AQI EXPLANATION AND AFFECTED POPULATIONS
0–50 GoodOverall air quality is satisfactory, and little or no health risk is expected from air pollution.
51–100 ModerateAir quality is acceptable, though for some pollutants there may be a moderate health concern for a very small number of people who are extremely sensitive to air pollution.
101–150Unhealthy for
Sensitive Groups
Sensitive groups such as children and the elderly may experience health effects from air pollution; little health risk is posed to the general public.
151–200 UnhealthyAll people may experience health effects, with more sensitive groups of people experiencing more serious health effects caused by air pollution.
201–300 Very UnhealthyHealth alert: Everyone may experience more serious health effects from air pollution.
301 and higher HazardousHealth warning of emergency conditions: The entire population is more likely to be affected.
Table 7. The Air Quality Index (AQI) is a guide for indexing air quality that is reported daily by EPA across the entire United States. AQI describes how clean or polluted the air in an area is and the associated health effects that may be experienced a few hours or days after breathing polluted air. AQI is calculated based on the concentrations of five air pollutants: ground-level ozone, particulate matter, carbon monoxide, sulfur dioxide, and nitrogen dioxide.
24 PITTSBURGH REGIONAL ENVIRONMENTAL THREATS ANALYSIS REPORT
COUNTYAQI
DATA (days)
AQI GOOD (days)
AQI MODERATE
(days)
AQI UNHEALTHY
FOR SENSITIVE GROUPS
(days)
AQI UNHEALTHY
(days)
MAXAQI
MEDIAN AQI
ALLEGHENY 306 119 153 33 1 152 55
ARMSTRONG 215 167 39 9 0 129 40
BEAVER 306 247 53 6 0 109 39
GREENE 209 176 32 1 0 122 41
INDIANA 305 260 41 4 0 119 33
LAWRENCE 306 263 41 2 0 119 35
WASHINGTON 306 223 78 5 0 114 42
WESTMORELAND 306 252 51 3 0 119 36
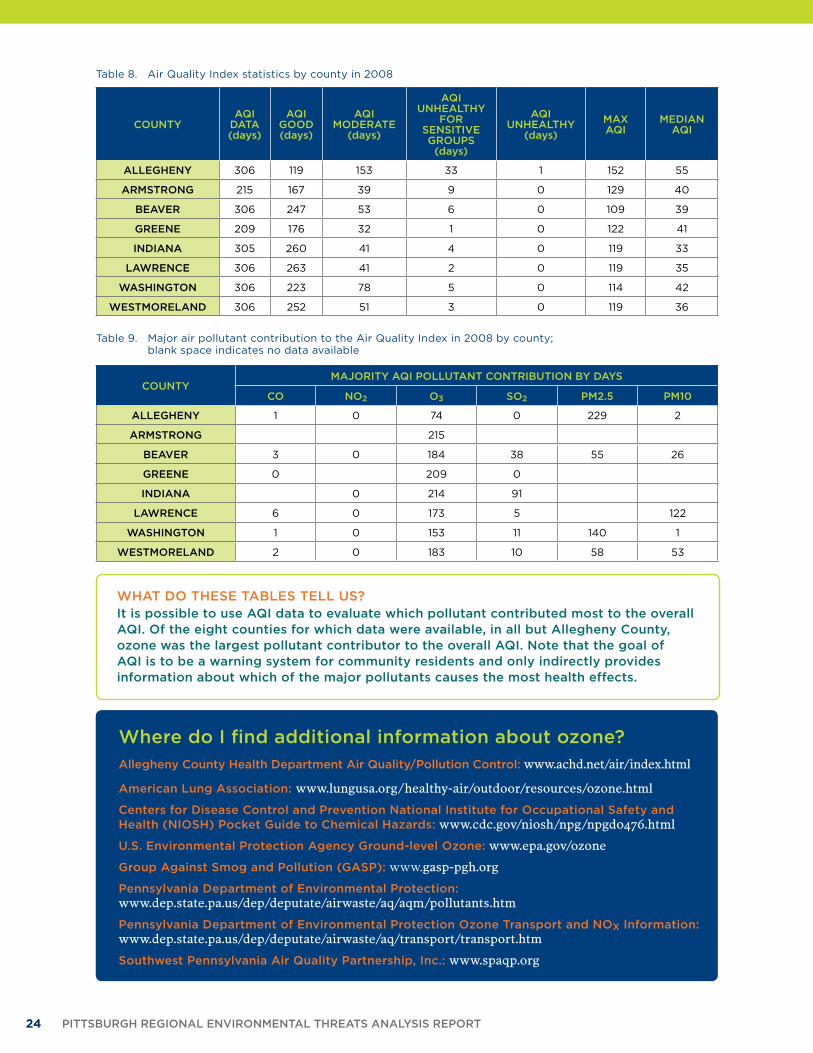
Table 8. Air Quality Index statistics by county in 2008
Where do I find additional information about ozone?Allegheny County Health Department Air Quality/Pollution Control:.www.achd.net/air/index.html
American Lung Association: www.lungusa.org/healthy-air/outdoor/resources/ozone.html
Centers for Disease Control and Prevention National Institute for Occupational Safety and Health (NIOSH) Pocket Guide to Chemical Hazards:.www.cdc.gov/niosh/npg/npgd0476.html
U.S. Environmental Protection Agency Ground-level Ozone:.www.epa.gov/ozone
Group Against Smog and Pollution (GASP):.www.gasp-pgh.org
Pennsylvania Department of Environmental Protection:..www.dep.state.pa.us/dep/deputate/airwaste/aq/aqm/pollutants.htm
Pennsylvania Department of Environmental Protection Ozone Transport and NOx Information:..www.dep.state.pa.us/dep/deputate/airwaste/aq/transport/transport.htm
Southwest Pennsylvania Air Quality Partnership, Inc.:.www.spaqp.org
COUNTYMAJORITY AQI POLLUTANT CONTRIBUTION BY DAYS
CO NO2 O3 SO2 PM2.5 PM10
ALLEGHENY 1 0 74 0 229 2
ARMSTRONG 215
BEAVER 3 0 184 38 55 26
GREENE 0 209 0
INDIANA 0 214 91
LAWRENCE 6 0 173 5 122
WASHINGTON 1 0 153 11 140 1
WESTMORELAND 2 0 183 10 58 53
Table 9. Major air pollutant contribution to the Air Quality Index in 2008 by county; blank space indicates no data available
WHAT DO THESE TABLES TELL US?It is possible to use AQI data to evaluate which pollutant contributed most to the overall AQI. Of the eight counties for which data were available, in all but Allegheny County, ozone was the largest pollutant contributor to the overall AQI. Note that the goal of AQI is to be a warning system for community residents and only indirectly provides information about which of the major pollutants causes the most health effects.
PRETA AIR: OZONE 25
GLOSSARYACID RAIN Broad.term.referring.to.a.mixture.of.wet.and.dry.deposition.from.the.atmosphere.containing.higher.than.normal.amounts.of.nitric.and.sulfuric.acids..Acid.rain.forms.as.a.result.of.both.natural.sources,.such.as.volcanoes.and.decaying.vegetation,.and.man-made.sources,.primarily.emissions.of.sulfur.dioxide.(SO2).and.oxides.of.nitrogen.(NOx).resulting.from.fossil.fuel.combustion.
AMBIENT AIR Air.found.in.the.outdoors;.the.opposite.of.indoor.air.
ATTAINMENT Desired.designation.issued.by.EPA.indicating.that.a.pollution.standard.has.not.been.exceeded.
CFCS—see Chlorofluorocarbons
CHLOROFLUOROCARBONS (CFCS) Organic.compounds.that.contain.carbon,.chlorine,.and.fluorine.and.are.used.in.a.variety.of.industrial,.commercial,.and.household.applications..They.have.been.linked.to.the.accelerated.depletion.of.ozone.in.the.Earth’s.stratosphere.
CRITERIA POLLUTANTS—see National Ambient Air Quality Standards
DESIGN VALUETerm.used.by.EPA.to.designate.the.measured.level.of.a.pollutant.for.pollution.control.or.a.level.for.an.area.on.which.attainment.is.based...See also eight-hour Ozone Standard
EIGHT-HOUR OZONE STANDARDIn.1997,.EPA.completed.an.analysis.of.the.one-hour.ozone.standard.and.adopted.a.new,.more.protective.eight-hour.standard.to.address.the.impacts.of.exposure.of.the.public.to.longer.periods.of.elevated.ozone.pollution..To.meet.the.standard,.the.three-year.average.of.the.annual.fourth-highest.daily.maximum.eight-hour.ozone.concentration.measured.at.each.monitoring.site.must.be.less.than.0.075.ppm.
EPA—see U.S. Environmental Protection Agency
GROUND-LEVEL OZONE—see Ozone
HIERARCHICAL BAYESIAN MODEL (HBM) A.model.used.by.EPA.to.interpolate.unobserved.data.values.based.on.data.that.have.been.collected.by.nearby.monitors
HYDROCARBONS.Simplest.organic.compounds,.containing.only.carbon.and.hydrogen..Hydrocarbons.can.be.gases,.liquids,.waxes,.low-melting.solids,.or.polymers..Their.main.use.is.as.a.combustible.fuel.source.
MAINTENANCE.Term.used.by.EPA.to.designate.an.area.that.has.decreased.its.pollutant.level.from.a.previous.designation.of.nonattainment.to.a.level.that.would.warrant.being.designated.as.in.attainment
NAAQS—see National Ambient Air Quality Standards
NATIONAL AMBIENT AIR QUALITY STANDARDS (NAAQS)The.Clean.Air.Act,.which.was.last.amended.in.1990,.requires.EPA.to.set.NAAQS.for.pollutants.considered.harmful.to.public.health.and.the.environment..The.six.common.NAAQS.air.pollutants,.or.“criteria.pollutants,”.are.ozone,.fine.particulates,.nitrogen.dioxide,.sulfur.dioxide,.carbon.monoxide,.and.lead..
NONATTAINMENTTerm.used.by.EPA.to.indicate.that.the.area.is.above.the.pollutant.level.that.has.been.established.as.permissible.under.certain.regulations
O3—see Ozone
OXIDANT SMOG—see Photochemical Smog
OZONE (O3) Gas.composed.of.three.oxygen.atoms..It.is.not.usually.emitted.directly.into.the.air.but.at.ground.level.and.is.created.by.a.chemical.reaction.between.oxides.of.nitrogen.(NOx).and.volatile.organic.compounds.(VOCs).in.the.presence.of.sunlight..Ozone.has.the.same.chemical.structure.whether.it.occurs.miles.above.the.earth,.called.“stratospheric.ozone,”.or.at.ground-level.and.can.be.good.or.bad,.depending.on.its.location.in.the.atmosphere.
PARTICULATE MATTER (PM) Small.particles.of.solids.and.liquids,.commonly.formed.as.by-products.of.combustion..Sometimes,.particulate.emissions.are.visible.in.the.form.of.soot.or.smoke,.because.the.particles.are.so.large..However,.most.are.not.visible,.which.is.part.of.what.makes.them.dangerous,.because.people.do.not.realize.that.the.emissions.are.occurring..Small.particles.also.are.more.dangerous.because.they.are.less.likely.to.be.trapped.in.the.mucus.linings.of.the.nose.and.throat.and.taken.deeply.into.the.lungs.
PARTS PER MILLION (PPM) Way.of.quantifying.small.concentrations
PHOTOCHEMICAL OXIDATION Chemical.reaction.influenced.or.triggered.by.light..that.removes.electrons.from.a.compound.or.part.of..a.compound
PHOTOCHEMICAL SMOG Air.pollution.containing.ozone.and.other.reactive..chemical.compounds.formed.by.the.action.of.sunlight.on.nitrogen.oxides.and.hydrocarbons,.especially.those.in.automobile.exhaust
PITTSBURGH REGIONAL ENVIRONMENTAL THREATS ANALYSIS (PRETA) Environmental.assessment.project.developed.by.the.Center.for.Healthy.Environments.and.Communities.in.the.Department.of.Environmental.and.Occupational.Health.at.the.University.of.Pittsburgh.Graduate.School.of.Public.Health,.with.generous.support.from.The.Heinz.Endowments..The.10-county.region.in.which.this.project.was.conducted.includes.the.following.counties.in.Southwestern.Pennsylvania:.Allegheny,.Armstrong,.Beaver,.Butler,.Fayette,.Greene,.Lawrence,.Indiana,.Washington,..and.Westmoreland..
(CONTINUED ON NEXT PAGE)
26 PITTSBURGH REGIONAL ENVIRONMENTAL THREATS ANALYSIS REPORT
PM—see Particulate Matter
PPM—see Parts per Million
PRECURSOR.Indication.that.a.specific.event.will.soon.take.place
PRETA—see Pittsburgh Regional Environmental Threats Analysis
PRIMARY STANDARDS Pollutant.standards.based.on.human.health
SECONDARY STANDARDS Pollutant.standards.based.on.protecting.ecosystems..and.on.other.welfare.considerations
SMOG.In.some.uses,.the.term.refers.only.to.photochemical.smog.
STRATOSPHERIC OZONE—see Ozone
TOXICITY.Degree.to.which.a.substance.can.cause.damage.to..an.organism
U.S. ENVIRONMENTAL PROTECTION AGENCY (EPA) Federal.agency.whose.mission.is.to.protect.human.health.and.the.environment
VOLATILE ORGANIC COMPOUND (VOC) Chemical.or.compound.that.contains.such.vapor.pressure.that.it.does.not.require.excessive.heat.to.vaporize.the.compound.into.a.gaseous.form
VOC—see Volatile Organic Compound
REFERENCESAKINBAMI, L.J. (2010)..The.association.between.childhood.asthma.prevalence.and.monitored.air.pollutants.in.metropolitan.areas,.United.States,.2001–2004..Environ Res.DOI:.10.1016/j.envres.2010.01.001.
CENTERS FOR DISEASE CONTROL AND PREVENTION (CDC). (2010). Query.of.National.Environmental.Public.Health.Tracking.Network:.Number.of.days.over.the.8-hour.ozone.max.concentration..Available.online:.ephtracking.cdc.gov/showQueryScreen.action.
GAUDERMAN, W.J. (2006)..Air.pollution.and.children—An.unhealthy.mix..N Engl J Med..355(1):78–9.
HUBBELL, B.J., HALLBERG, A., MCCUBBIN, D.R., AND POST, E. (2005)..Health-related.benefits.of.attaining.the.8-hour.ozone.standard..Environ Health Perspect..113(1):73–82.
MCCONNELL, R., BERHANE, K., GILLILAND, F., LONDON, S.J., ISLAM, T., GAUDERMAN, W.J., AVOL, E., MARGOLIS, H.G., AND PETERS, J.M. (2002). Asthma.in.exercising.children.exposed.to.ozone:.A.cohort.study..The Lancet,.359(9304):386–91.
McMILLAN, N.J., HOLLAND, D.M., MORARA, M., AND FENG, J. (2009). Combining.numerical.model.output.and.particulate.data.using.Bayesian.space–time.modeling..Environmetrics.21(1):48-65.
PARKER, J., AKINBAMI, L., AND WOODRUFF, T. (2009). Air.pollution.and.childhood.respiratory.allergies.in.the.United.States..Environ Health Perspect..117(1):140–7.
PARKER, J., RICH, D.Q., GLINIANAIA, S.V., LEEM, J.H., WARTENBERG, D., ET AL. (2011). The.International.Collaboration.on.Air.Pollution.and.Pregnancy.Outcomes:.Initial.Results..Environ Health Perspect..DOI:10.1289/ehp.1002725.
PENNSYLVANIA DEPARTMENT OF TRANSPORTATION (PENNDOT), BUREAU OF PLANNING AND RESEARCH, GEOGRAPHIC INFORMATION DIVISION. (2011)..PennDOT.-.Pennsylvania.Traffic.Counts.201101..Penn.State.University.Institutes.of.Energy.and.the.Environment..Downloaded.from.Pennsylvania.Spatial.Data.Access.(PASDA),.January.1,.2011:.www.pasda.psu.edu/uci/MetadataDisplay.aspx?.entry=PASDA&file=PaTraffic2011_01.xml&dataset=56.
SACKS, J.D., STANEK, L.W., LUBEN, T.J., JOHNS, D.O., BUCKLEY, B.J., BROWN, J.S., AND ROSS, M. (2011). Particulate.matter–induced.health.effects:.Who.is.susceptible?.Environ Health Perspect..119(4)..
UNION OF CONCERNED SCIENTISTS. (2011). Climate.change.and.your.health:.Rising.temperatures,.worsening.ozone.pollution..Available.online:.www.ucsusa.org/assets/documents/global_warming/climate-change-and-ozone-pollution.pdf..
U.S. ENVIRONMENTAL PROTECTION AGENCY (EPA). (2011)..Air.trends:.Design.values..Available.online:.www.epa.gov/airtrends/values.html..
U.S. EPA. (NO DATE). Counties.violating.the.primary.ground-level.ozone.standard,.2006–08..Available.online:.www.epa.gov/glo/pdfs/CountyPrimaryOzoneLevels0608.pdf.
U.S. EPA. (2011). National.Ambient.Air.Quality.Standards.(NAAQS)..Available.online:.www.epa.gov/air/criteria.html.
U.S. EPA. (2011). NAAQS.designations.of.Southwestern.Pennsylvania..EPA.Green.Book..Available.online:.www.epa.gov/oaqps001/greenbk/define.html.
U.S. EPA. (2009)..Summary.of.the.updated.Regulatory.Impact.Analysis.(RIA).for.the.reconsideration.of.the.2008.ozone.National.Ambient.Air.Quality.Standard.(NAAQS)..Available.online:.www.epa.gov/ttnecas1/regdata/RIAs/s1-supplemental_analysis_summary11-5-09.pdf..
U.S. EPA. (2011). Technology.Transfer.Network.Clearinghouse.for.Inventories.and.Emissions.Factors:.Emissions.Inventories,.Point.Source.Emissions..Available.online:.www.epa.gov/ttn/chief/eiinformation.html.
U.S. EPA. (2010). Technology.Transfer.Network,.Air.Quality.System.Data.Mart..Available.online:.www.epa.gov/ttn/airs/aqsdatamart/access.htm.
GLOSSARY (CONTINUED)
PITTSBURGH AND ITS SURROUNDING COUNTIES
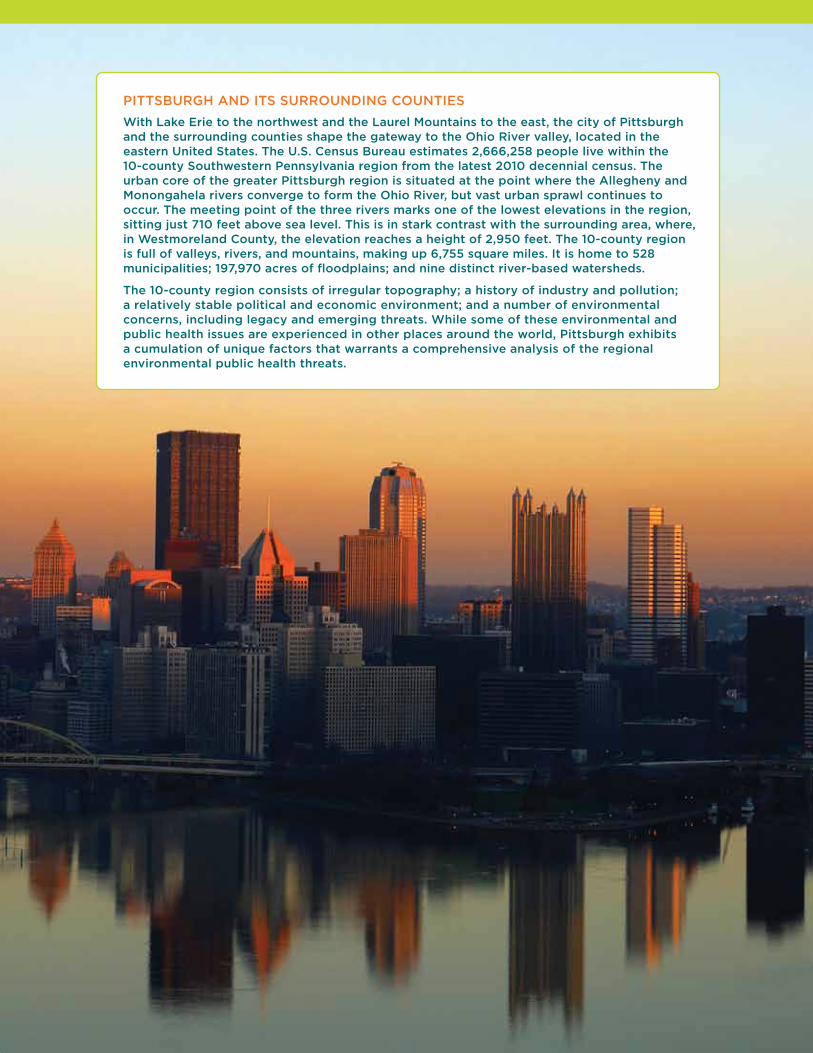
With Lake Erie to the northwest and the Laurel Mountains to the east, the city of Pittsburgh and the surrounding counties shape the gateway to the Ohio River valley, located in the eastern United States. The U.S. Census Bureau estimates 2,666,258 people live within the 10-county Southwestern Pennsylvania region from the latest 2010 decennial census. The urban core of the greater Pittsburgh region is situated at the point where the Allegheny and Monongahela rivers converge to form the Ohio River, but vast urban sprawl continues to occur. The meeting point of the three rivers marks one of the lowest elevations in the region, sitting just 710 feet above sea level. This is in stark contrast with the surrounding area, where, in Westmoreland County, the elevation reaches a height of 2,950 feet. The 10-county region is full of valleys, rivers, and mountains, making up 6,755 square miles. It is home to 528 municipalities; 197,970 acres of floodplains; and nine distinct river-based watersheds.
The 10-county region consists of irregular topography; a history of industry and pollution; a relatively stable political and economic environment; and a number of environmental concerns, including legacy and emerging threats. While some of these environmental and public health issues are experienced in other places around the world, Pittsburgh exhibits a cumulation of unique factors that warrants a comprehensive analysis of the regional environmental public health threats.
Graduate School of Public HealthDepartment of Environmental and Occupational HealthCenter for Healthy Environments and CommunitiesBridgeside Point Building, Suite 553 100 Technology DrivePittsburgh, PA 15219
Phone: 412-624-9379E-mail: [email protected]
www.chec.pitt.edu
Generous support for this report was provided by The Heinz Endowments.
Printed on Neenah Environment PC 100, which contains 100% post consumer fiber and is made with 100% Certified Renewable Energy.


![URBAN TERRA PRETA - GCSM Berlin_FH Potsdam.pdf · the area with a total area of 82.6 ha (google maps). ... Terra Preta Products Adopted from [5] Urine storage half Urine storage all](https://img.pdfslide.us/doc/110x75/603d092808a162438f12e8c2/urban-terra-preta-berlinfh-potsdampdf-the-area-with-a-total-area-of-826-ha.jpg)