Embed Size (px)
Citation preview

Do not refresh this file
Agenda
Page
[ C L I E N T N A M E ]
Do not refresh this file
NASDAQ: BONA
June 2014
CORPORATE PRESENTATION
NASDAQ: BONA
THE FOLLOWING PRESENTATION HAS BEEN APPROVED FOR
ALL AUDIENCES
WHO UNDERSTAND THE MEANING OF “FORWARD-LOOKING STATEMENTS”
The information used in this presentation has been prepared by Bona Film Group Limited (“Bona” or the “Company”). This presentation is being
provided for your information and may not be distributed, reproduced, re-distributed or passed on, directly or indirectly, to any person or published, in
whole or in part, for any purpose.
This presentation contains certain "forward-looking statements" within the meaning of Section 27A of the Securities Act of 1933, as amended, and
Section 21E of the Securities Exchange Act of 1934, as amended, and as defined in the U.S. Private Securities Litigation Reform Act of 1995. These
forward-looking statements can be identified by terminology such as "will," "expects," "anticipates," "future," "intends," "plans," "believes," "estimates"
and similar statements. All statements other than statements of historical fact in this presentation are forward-looking statements and involve certain
risks and uncertainties that could cause actual results to differ materially from those in the forward-looking statements. These forward-looking
statements are based on management's current expectations, assumptions, estimates and projections about the Company and the industry in which
the Company operates, but involve a number of unknown risks and uncertainties. Further information regarding these and other risks is included in
the Company's filings with the U.S. Securities and Exchange Commission.
The Company undertakes no obligation to update forward-looking statements to reflect subsequent occurring events or circumstances, or changes in
its expectations, except as may be required by law. Although the Company believes that the expectations expressed in these forward-looking
statements are reasonable, it cannot assure you that such expectations will turn out to be correct, and actual results may differ materially from the
anticipated results. You are urged to consider these factors carefully in evaluating the forward-looking statements contained herein and are cautioned
not to place undue reliance on such forward-looking statements, which are qualified in their entirety by these cautionary statements.
The information contained in this presentation does not constitute or form part of, nor should it be construed as, an offer for sale or subscription of or
solicitation or invitation of any offer to buy or subscribe for any securities nor shall it or any part of it form the basis of or be relied on in connection
with any contract, commitment or investment decision in relation thereto. By listening to this presentation, you acknowledge that you will be solely
responsible for your own assessment of the Company, including its business and market, and the market position, and that you will conduct your own
analysis and due diligence and be solely responsible for forming your own view of the existing and future performance of the Company’s business.
1
Do not refresh this file
Overview
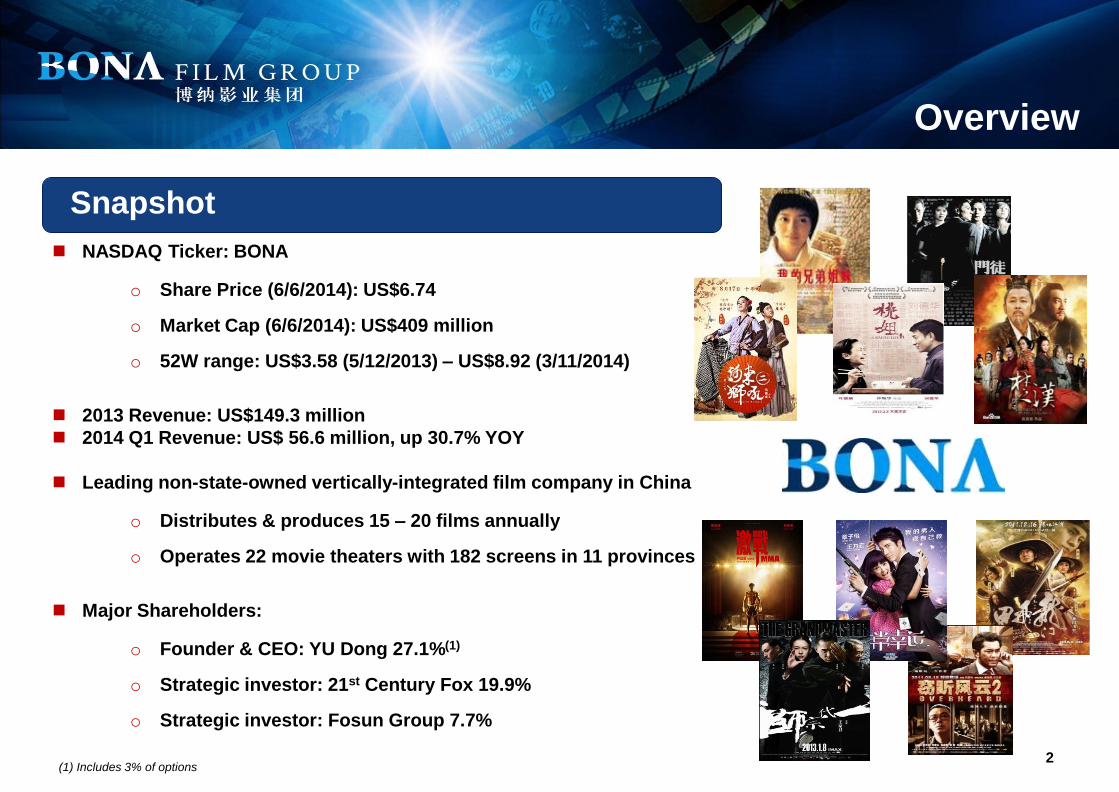
NASDAQ Ticker: BONA
o Share Price (6/6/2014): US$6.74
o Market Cap (6/6/2014): US$409 million
o 52W range: US$3.58 (5/12/2013) – US$8.92 (3/11/2014)
2013 Revenue: US$149.3 million
2014 Q1 Revenue: US$ 56.6 million, up 30.7% YOY
Leading non-state-owned vertically-integrated film company in China
o Distributes & produces 15 – 20 films annually
o Operates 22 movie theaters with 182 screens in 11 provinces
Major Shareholders:
o Founder & CEO: YU Dong 27.1%(1)
o Strategic investor: 21st Century Fox 19.9%
o Strategic investor: Fosun Group 7.7%
Snapshot
2 (1) Includes 3% of options
Do not refresh this file
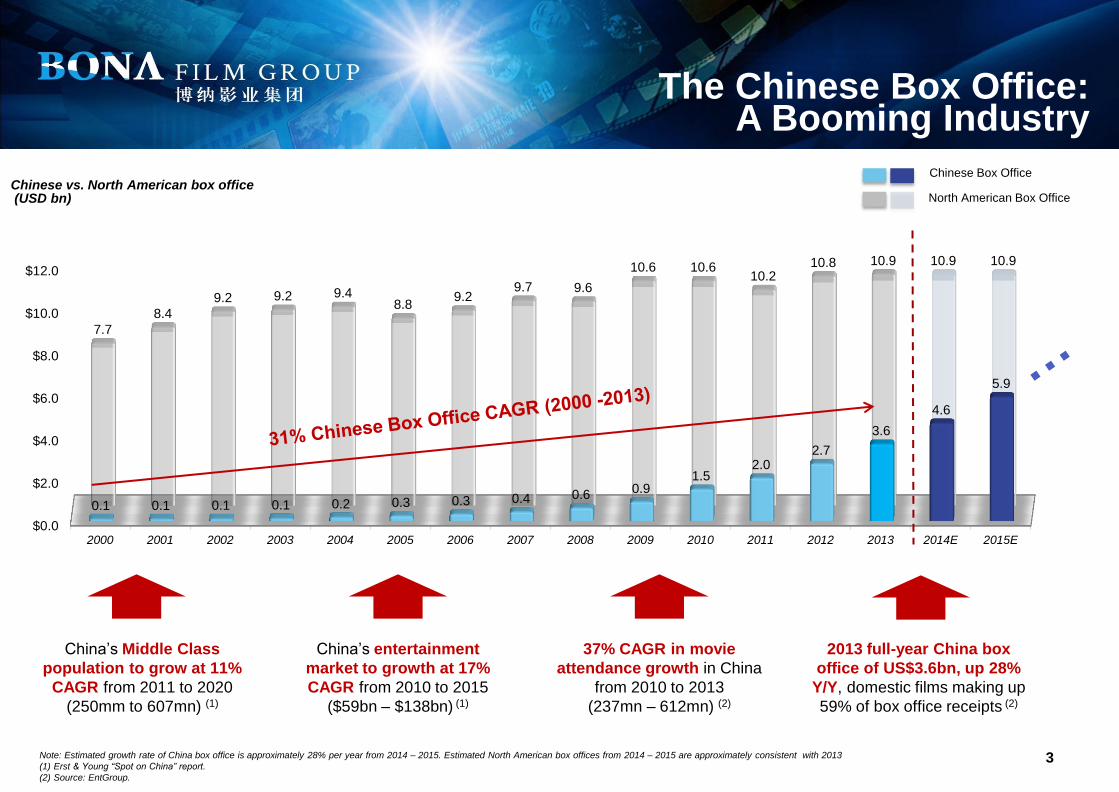
$0.0
$2.0
$4.0
$6.0
$8.0
$10.0
$12.0
2000 2001 2002 2003 2004 2005 2006 2007 2008 2009 2010 2011 2012 2013 2014E 2015E
0.1 0.1 0.1 0.1 0.2 0.3 0.3 0.4 0.6 0.9 1.5
2.0 2.7
3.6
4.6
5.9
7.7
8.4
9.2 9.2 9.4 8.8
9.2 9.7 9.6
10.6 10.6 10.2
10.8 10.9 10.9 10.9
Chinese Box Office
China’s Middle Class
population to grow at 11%
CAGR from 2011 to 2020
(250mm to 607mn) (1)
China’s entertainment
market to growth at 17%
CAGR from 2010 to 2015
($59bn – $138bn) (1)
37% CAGR in movie
attendance growth in China
from 2010 to 2013
(237mn – 612mn) (2)
2013 full-year China box
office of US$3.6bn, up 28%
Y/Y, domestic films making up
59% of box office receipts (2)
3
The Chinese Box Office: A Booming Industry
Chinese vs. North American box office (USD bn)
Note: Estimated growth rate of China box office is approximately 28% per year from 2014 – 2015. Estimated North American box offices from 2014 – 2015 are approximately consistent with 2013
(1) Erst & Young “Spot on China” report.
(2) Source: EntGroup.
North American Box Office
Do not refresh this file
4
2013 – 2014: Domestic Films Gaining Momentum
Source: EntGroup.
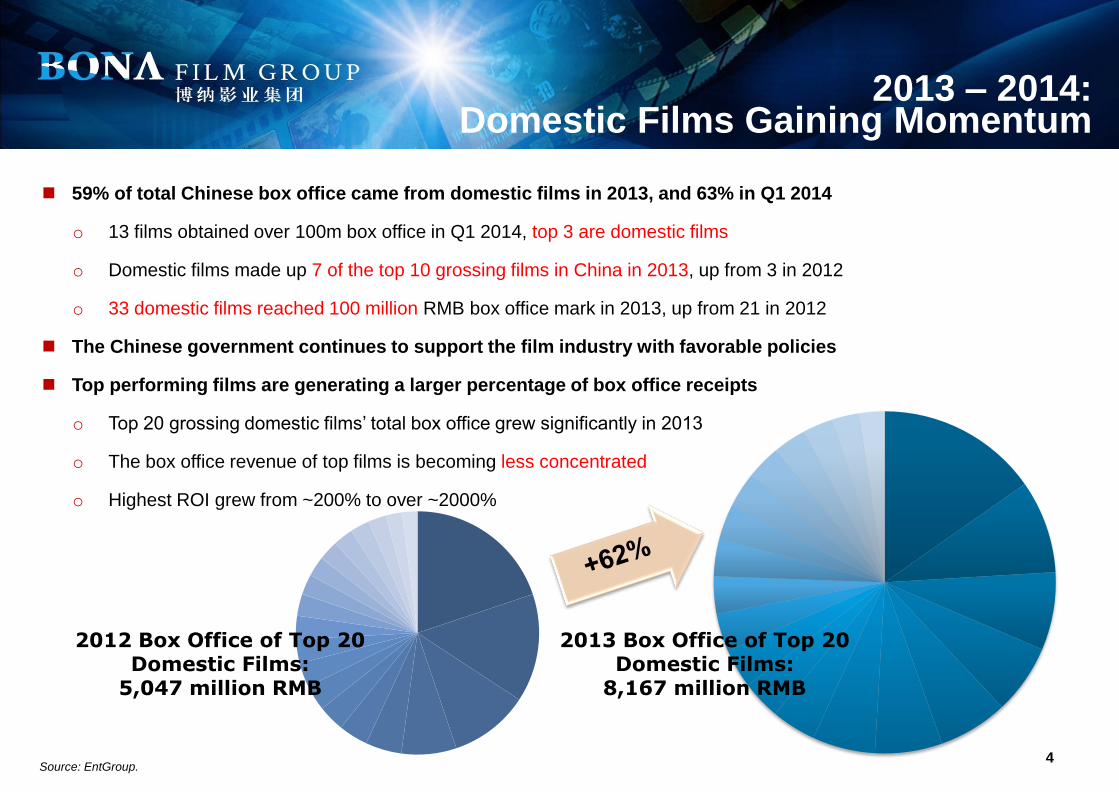
59% of total Chinese box office came from domestic films in 2013, and 63% in Q1 2014
o 13 films obtained over 100m box office in Q1 2014, top 3 are domestic films
o Domestic films made up 7 of the top 10 grossing films in China in 2013, up from 3 in 2012
o 33 domestic films reached 100 million RMB box office mark in 2013, up from 21 in 2012
The Chinese government continues to support the film industry with favorable policies
Top performing films are generating a larger percentage of box office receipts
o Top 20 grossing domestic films’ total box office grew significantly in 2013
o The box office revenue of top films is becoming less concentrated
o Highest ROI grew from ~200% to over ~2000%
2012 Box Office of Top 20 Domestic Films:
5,047 million RMB
2013 Box Office of Top 20 Domestic Films:
8,167 million RMB
Do not refresh this file
For the year ended December 31, 2012
Total box
office
(US$ bn)
Box office
per capita
(US$)
Attendance
per capita
No. screens
per million of
population
5
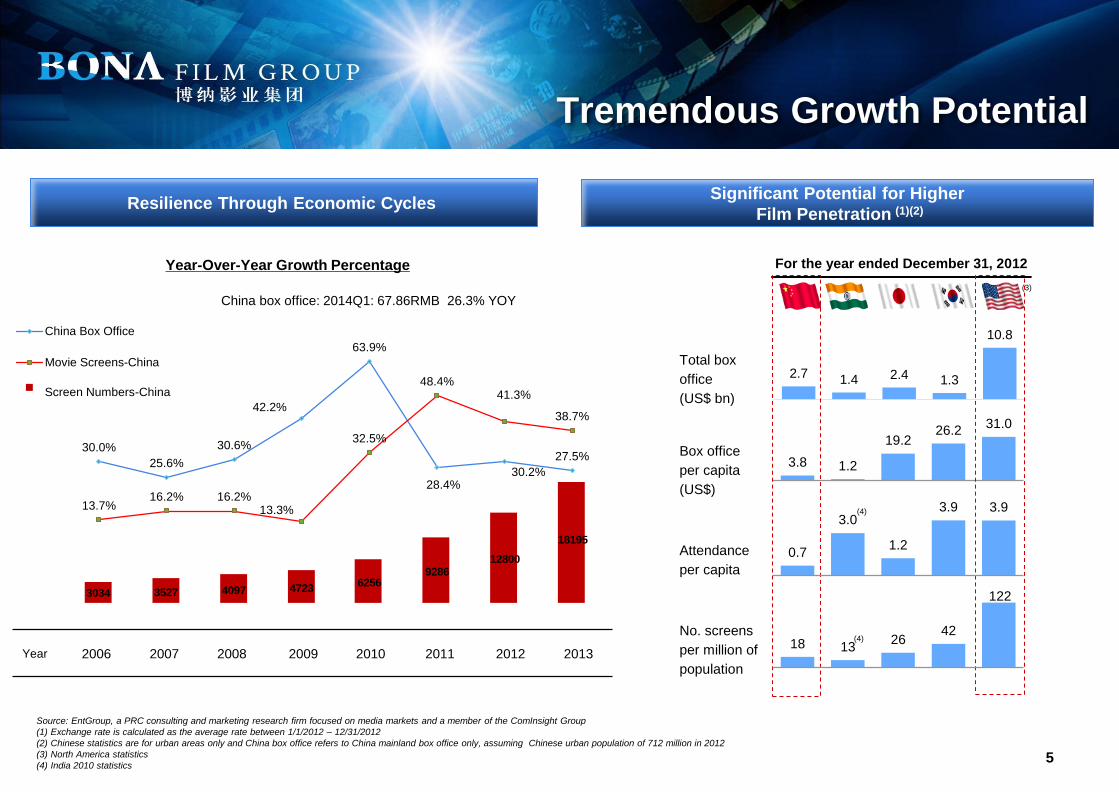
Tremendous Growth Potential
Year-Over-Year Growth Percentage
Year 2006 2007 2008 2009 2010 2011 2012 2013
2.7 1.4 2.4 1.3
10.8
3.8 1.2
19.2 26.2
31.0
Resilience Through Economic Cycles
3034 3527 4097 47236256
928612800
18195
Significant Potential for Higher
Film Penetration (1)(2)
30.0%
25.6%
30.6%
42.2%
63.9%
28.4% 30.2%
27.5%
13.7% 16.2% 16.2%
13.3%
32.5%
48.4% 41.3%
38.7%
China Box Office
Movie Screens-China
Screen Numbers-China
18 13 26
42
122
0.7
3.0
1.2
3.9 3.9 (4)
(4)
Source: EntGroup, a PRC consulting and marketing research firm focused on media markets and a member of the ComInsight Group
(1) Exchange rate is calculated as the average rate between 1/1/2012 – 12/31/2012
(2) Chinese statistics are for urban areas only and China box office refers to China mainland box office only, assuming Chinese urban population of 712 million in 2012
(3) North America statistics
(4) India 2010 statistics
(3)
China box office: 2014Q1: 67.86RMB 26.3% YOY
Do not refresh this file
Do not refresh this file
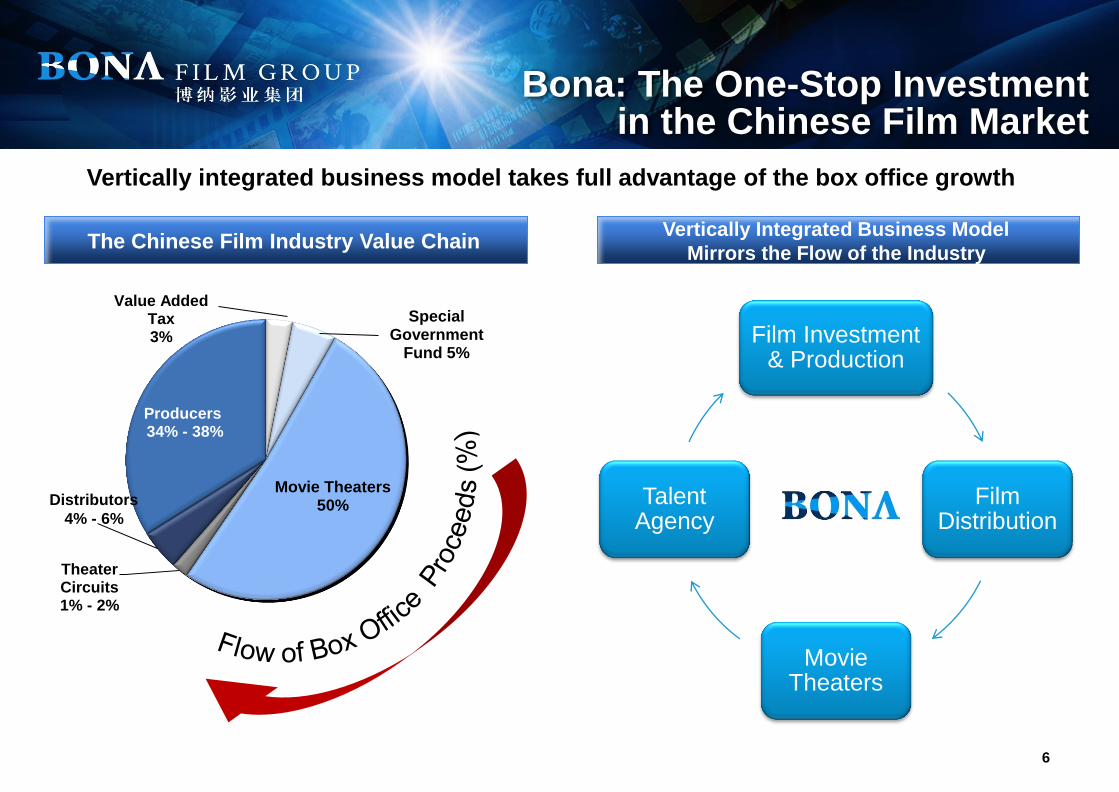
Movie Theaters 50%
Producers 34% - 38%
Distributors 4% - 6%
Theater Circuits 1% - 2%
Value Added Tax 3%
Special Government
Fund 5%
Bona: The One-Stop Investment in the Chinese Film Market
6
The Chinese Film Industry Value Chain Vertically Integrated Business Model
Mirrors the Flow of the Industry
Film
Distribution
Movie Theaters
Talent
Agency
Vertically integrated business model takes full advantage of the box office growth
Film Investment & Production
Film Distribution
Movie Theaters
Talent Agency
Do not refresh this file
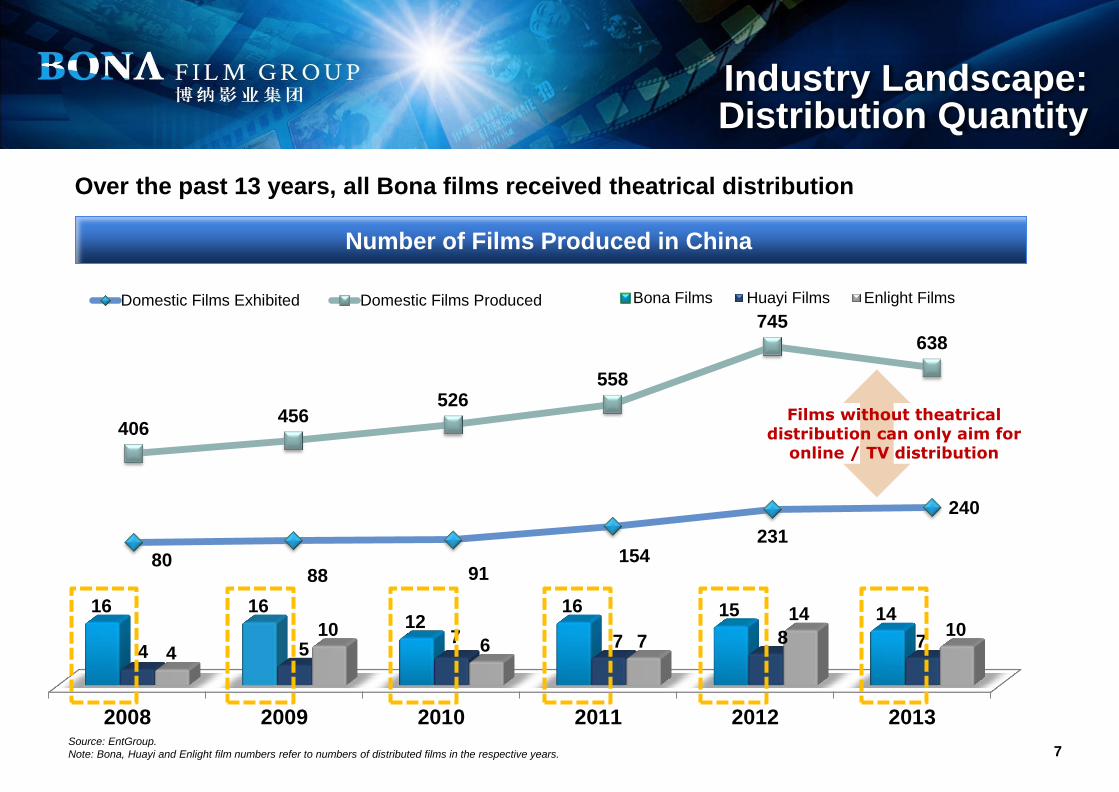
2008 2009 2010 2011 2012 2013
16 16 12
16 15 14
4 5 7 7 8 7
4
10 6 7
14 10
Bona Films Huayi Films Enlight Films
80 88 91
154 231
240
406 456
526 558
745 638
Domestic Films Exhibited Domestic Films Produced
7
Industry Landscape: Distribution Quantity
Source: EntGroup.
Note: Bona, Huayi and Enlight film numbers refer to numbers of distributed films in the respective years.
Number of Films Produced in China
Over the past 13 years, all Bona films received theatrical distribution
Films without theatrical distribution can only aim for
online / TV distribution
Do not refresh this file
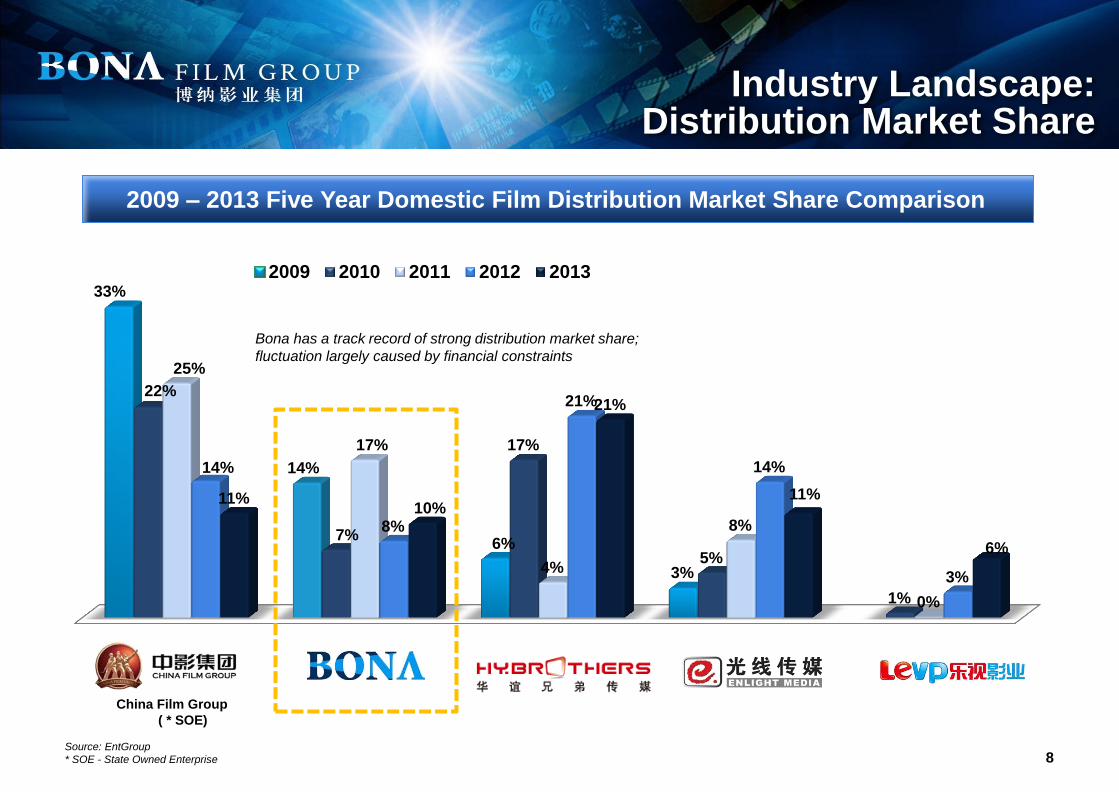
33%
14%
6%
3%
22%
7%
17%
5%
1%
25%
17%
4%
8%
0%
14%
8%
21%
14%
3%
11% 10%
21%
11%
6%
2009 2010 2011 2012 2013
Source: EntGroup
* SOE - State Owned Enterprise 8
Industry Landscape: Distribution Market Share
2009 – 2013 Five Year Domestic Film Distribution Market Share Comparison
China Film Group
( * SOE)
Bona has a track record of strong distribution market share;
fluctuation largely caused by financial constraints
Do not refresh this file
9
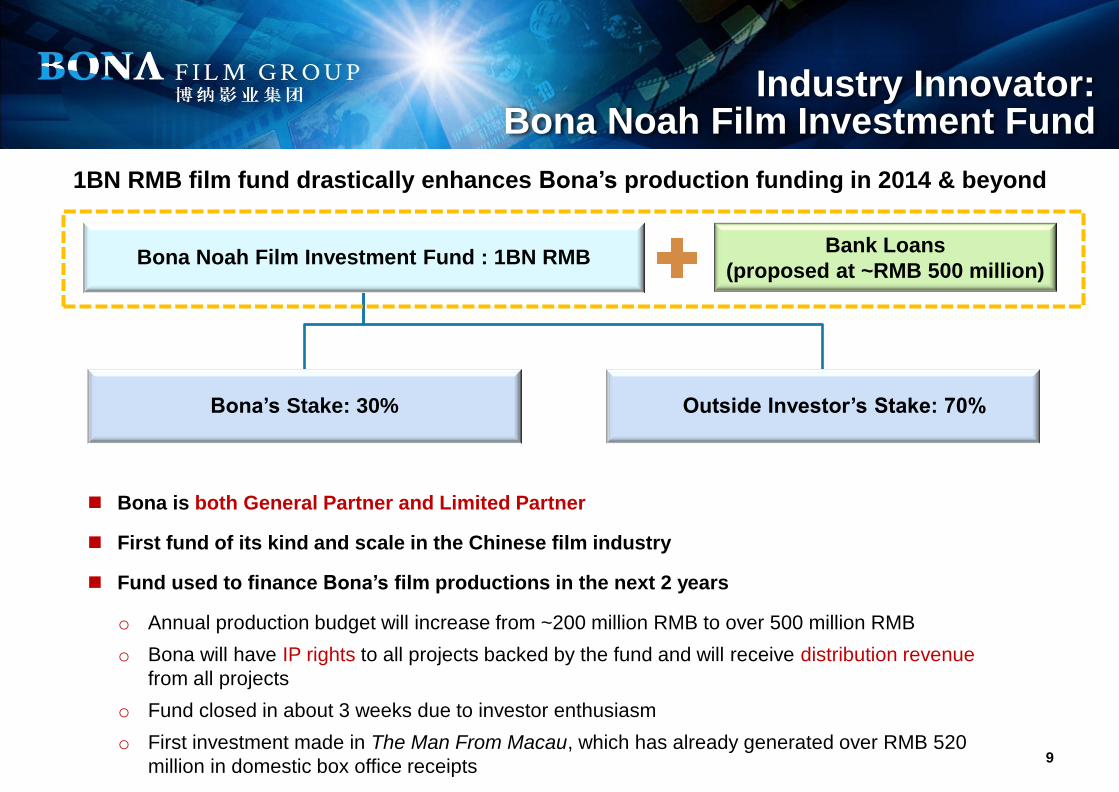
Industry Innovator: Bona Noah Film Investment Fund
1BN RMB film fund drastically enhances Bona’s production funding in 2014 & beyond
Bona Noah Film Investment Fund : 1BN RMB
Bona’s Stake: 30% Outside Investor’s Stake: 70%
Bona is both General Partner and Limited Partner
First fund of its kind and scale in the Chinese film industry
Fund used to finance Bona’s film productions in the next 2 years
o Annual production budget will increase from ~200 million RMB to over 500 million RMB
o Bona will have IP rights to all projects backed by the fund and will receive distribution revenue
from all projects
o Fund closed in about 3 weeks due to investor enthusiasm
o First investment made in The Man From Macau, which has already generated over RMB 520
million in domestic box office receipts
Bank Loans
(proposed at ~RMB 500 million)
Do not refresh this file
10
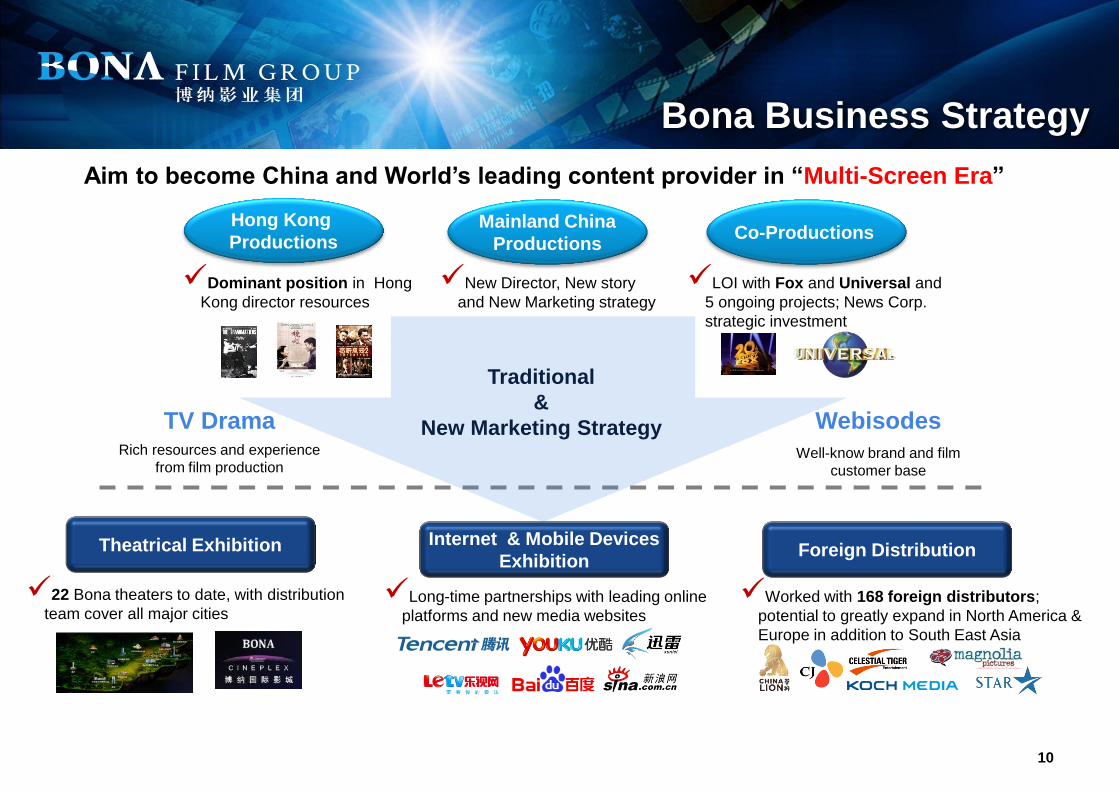
Bona Business Strategy
Hong Kong
Productions Mainland China
Productions Co-Productions
Dominant position in Hong
Kong director resources
New Director, New story
and New Marketing strategy
LOI with Fox and Universal and
5 ongoing projects; News Corp.
strategic investment
Theatrical Exhibition Internet & Mobile Devices
Exhibition Foreign Distribution
22 Bona theaters to date, with distribution
team cover all major cities Long-time partnerships with leading online
platforms and new media websites
Worked with 168 foreign distributors;
potential to greatly expand in North America &
Europe in addition to South East Asia
TV Drama
Rich resources and experience
from film production
Aim to become China and World’s leading content provider in “Multi-Screen Era”
Webisodes
Well-know brand and film
customer base
Traditional
&
New Marketing Strategy
Do not refresh this file
11
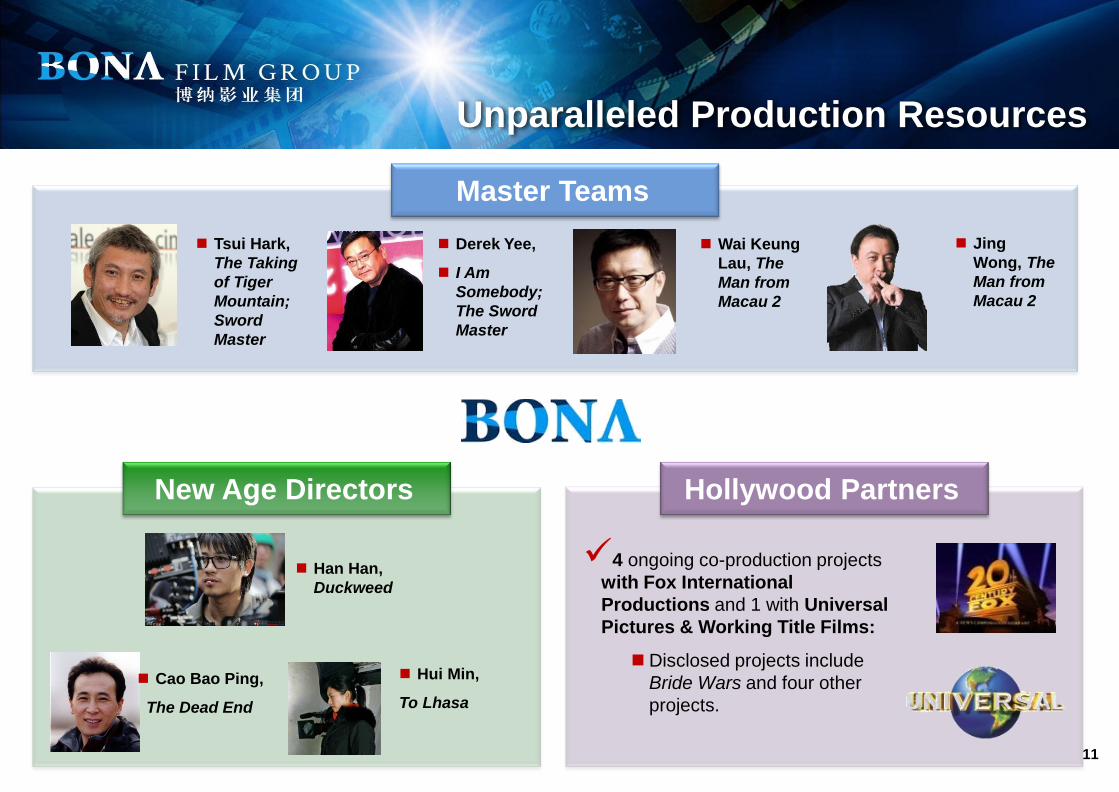
Master Teams
New Age Directors Hollywood Partners
Tsui Hark,
The Taking
of Tiger
Mountain;
Sword
Master
Derek Yee,
I Am
Somebody;
The Sword
Master
Wai Keung
Lau, The
Man from
Macau 2
Jing
Wong, The
Man from
Macau 2
4 ongoing co-production projects
with Fox International
Productions and 1 with Universal
Pictures & Working Title Films:
Disclosed projects include
Bride Wars and four other
projects.
Cao Bao Ping,
The Dead End
Hui Min,
To Lhasa
Han Han,
Duckweed
Unparalleled Production Resources
Do not refresh this file
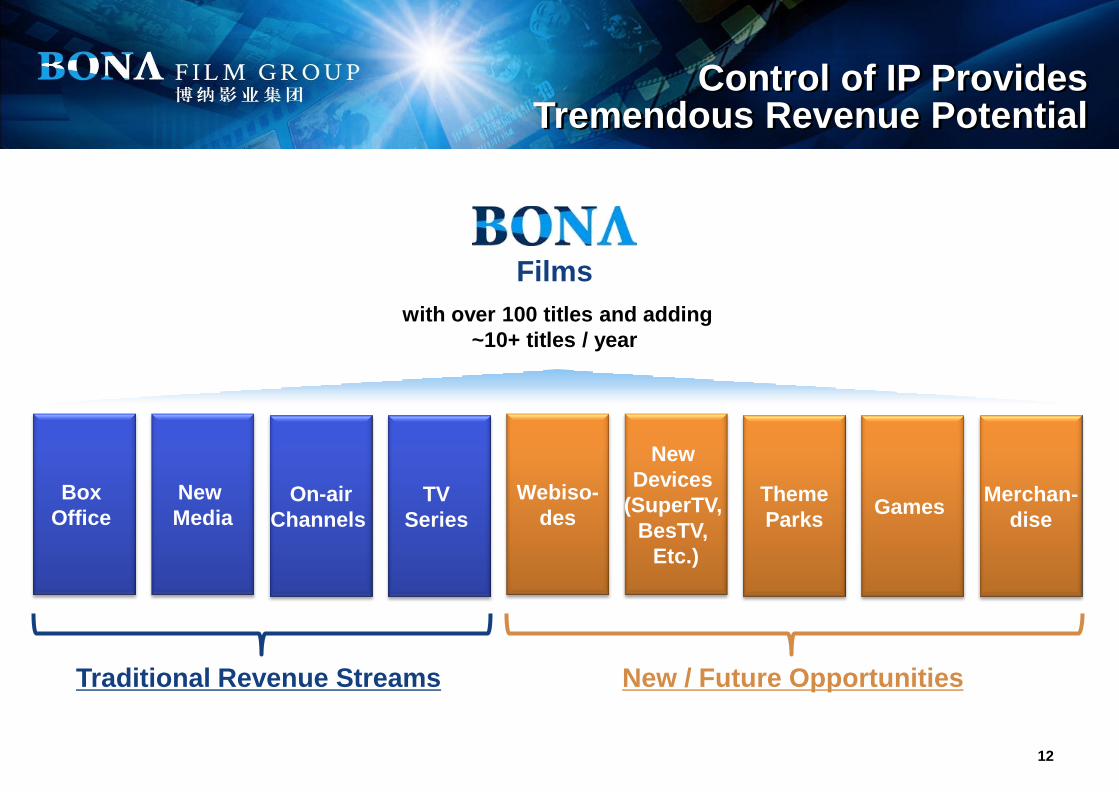
Parks
12
Films
with over 100 titles and adding
~10+ titles / year
Control of IP Provides Tremendous Revenue Potential
Box
Office
Traditional Revenue Streams
New
Media On-air
Channels
TV
Series
New
Devices
(SuperTV,
BesTV,
Etc.)
Theme
Parks Games
Merchan-
dise
New / Future Opportunities
Webiso-
des
Do not refresh this file
13
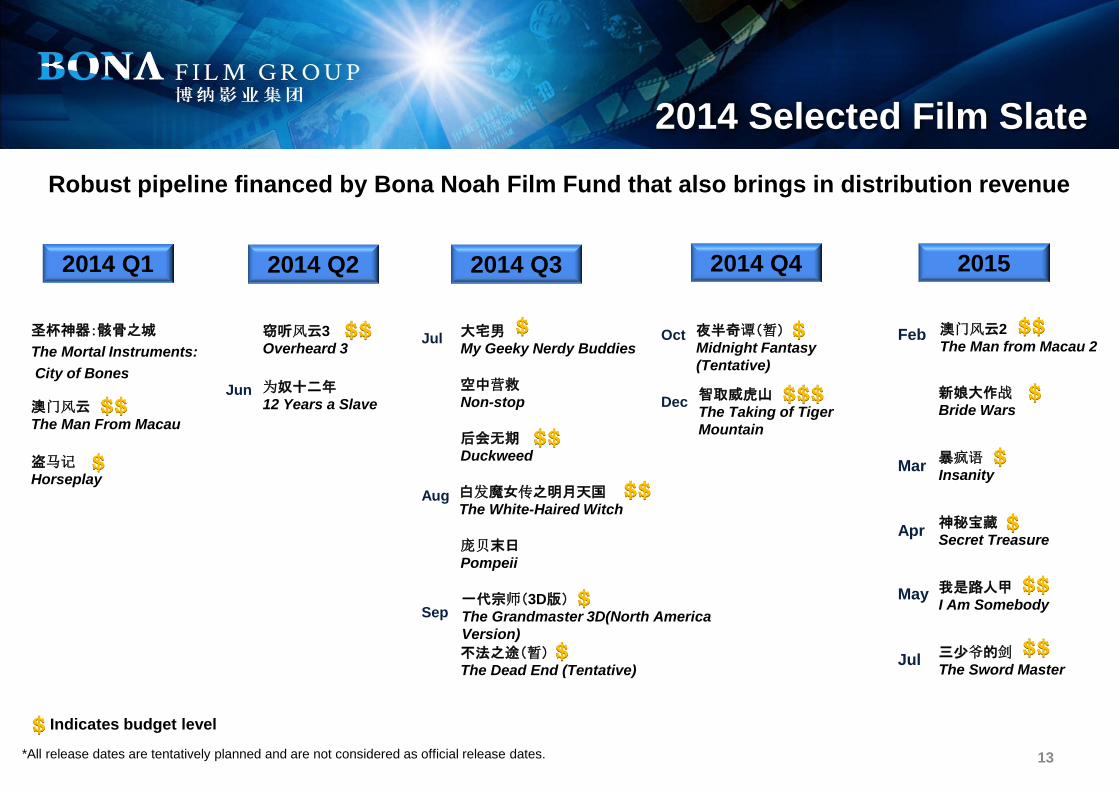
Robust pipeline financed by Bona Noah Film Fund that also brings in distribution revenue
2014 Selected Film Slate
圣杯神器:骸骨之城
The Mortal Instruments:
City of Bones
澳门风云
The Man From Macau
盗马记
Horseplay
夜半奇谭(暂)
Midnight Fantasy
(Tentative)
智取威虎山
The Taking of Tiger
Mountain
新娘大作战
Bride Wars
澳门风云2
The Man from Macau 2
暴疯语
Insanity
神秘宝藏
Secret Treasure
我是路人甲
I Am Somebody
三少爷的剑
The Sword Master
2014 Q1 2014 Q4 2015
窃听风云3
Overheard 3
为奴十二年
12 Years a Slave
2014 Q2
Jun
Feb
Apr
Mar
May
Jul
空中营救
Non-stop
大宅男
My Geeky Nerdy Buddies
后会无期
Duckweed
白发魔女传之明月天国
The White-Haired Witch
庞贝末日
Pompeii
不法之途(暂)
The Dead End (Tentative)
一代宗师(3D版)
The Grandmaster 3D(North America
Version)
2014 Q3
Jul
Aug
Sep
Oct
Dec
*All release dates are tentatively planned and are not considered as official release dates.
Indicates budget level
$
$$
$$
$$
$$
$$
$$
$
$
$
$
$
$
$$$ $
$$
$
Do not refresh this file
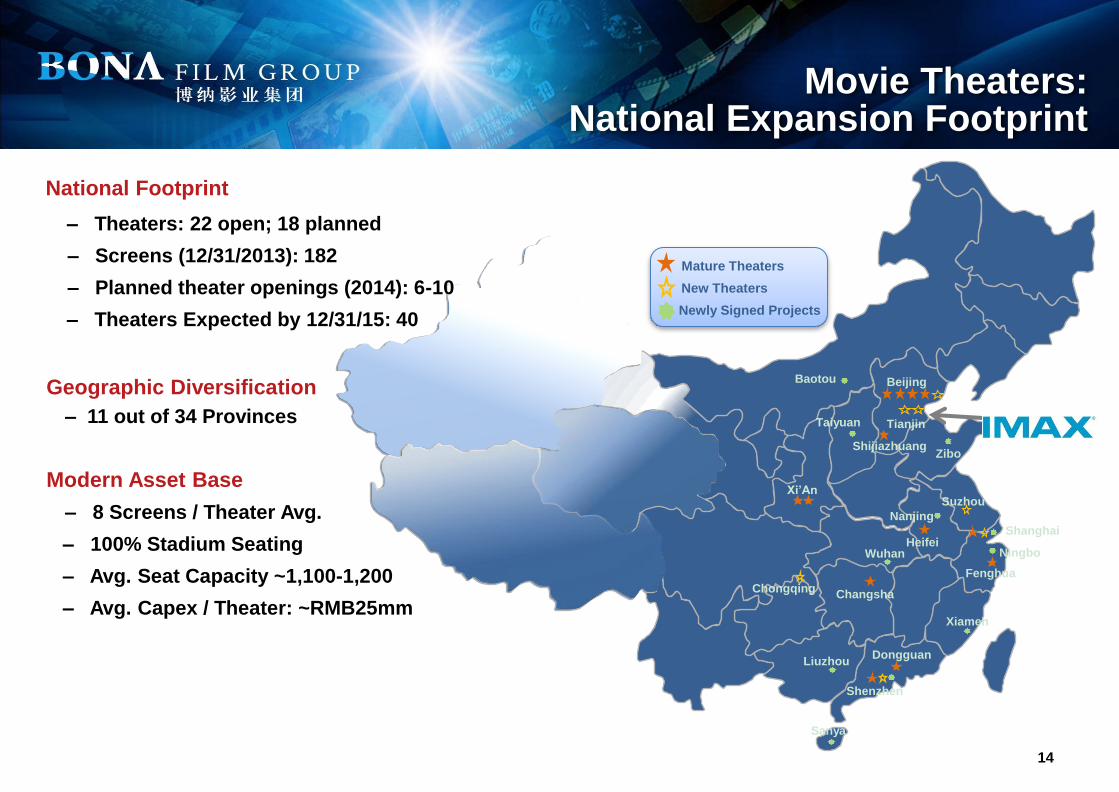
Mature Theaters
New Theaters
Newly Signed Projects
Tianjin
Shijiazhuang
Xi’An
Beijing
Chongqing
Wuhan
Changsha
Heifei Shanghai
Shenzhen
Suzhou
Taiyuan
Fenghua
Ningbo
Zibo
Dongguan Liuzhou
Sanya
Xiamen
Baotou
Nanjing
14
National Footprint
– Theaters: 22 open; 18 planned
– Screens (12/31/2013): 182
– Planned theater openings (2014): 6-10
– Theaters Expected by 12/31/15: 40
Geographic Diversification
– 11 out of 34 Provinces
Modern Asset Base
– 8 Screens / Theater Avg.
– 100% Stadium Seating
– Avg. Seat Capacity ~1,100-1,200
– Avg. Capex / Theater: ~RMB25mm
Movie Theaters: National Expansion Footprint
Do not refresh this file
15
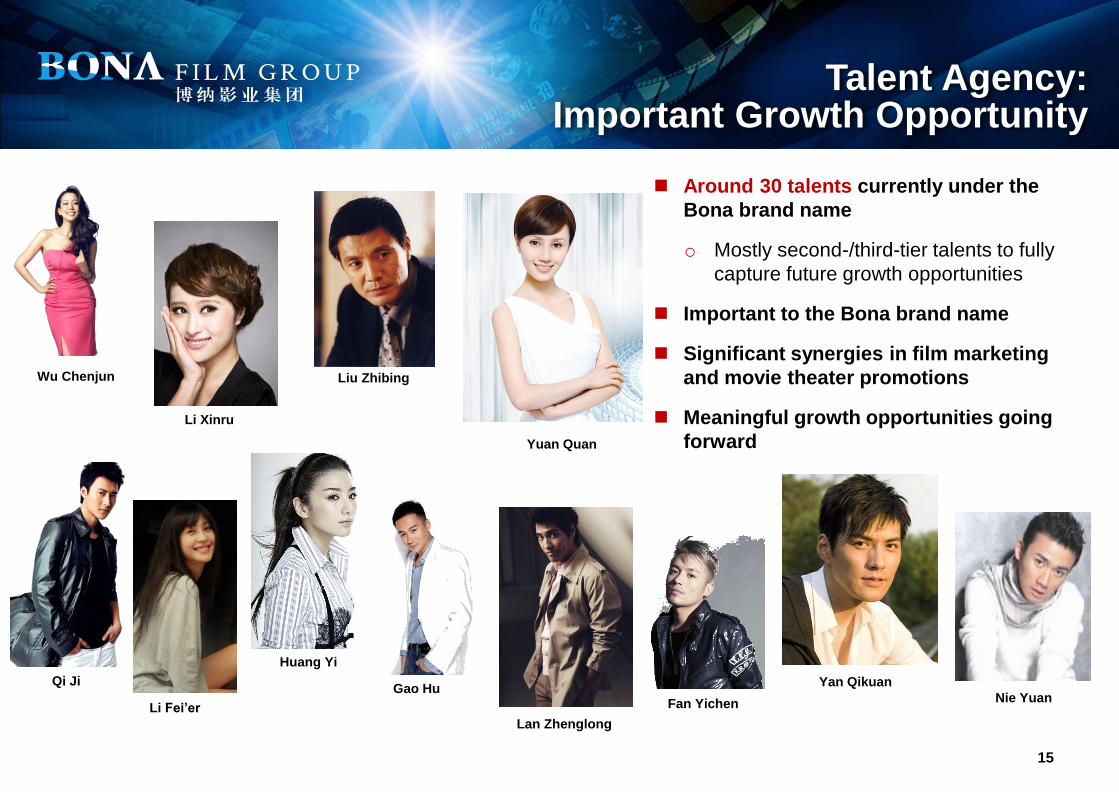
Talent Agency: Important Growth Opportunity
Yuan Quan
Gao Hu
Li Fei’er
Li Xinru
Liu Zhibing
Lan Zhenglong
Qi Ji
Wu Chenjun
Huang Yi
Around 30 talents currently under the
Bona brand name
o Mostly second-/third-tier talents to fully
capture future growth opportunities
Important to the Bona brand name
Significant synergies in film marketing
and movie theater promotions
Meaningful growth opportunities going
forward
Fan Yichen
Yan Qikuan
Nie Yuan

Do not refresh this file
Financial Overview
16
Do not refresh this file
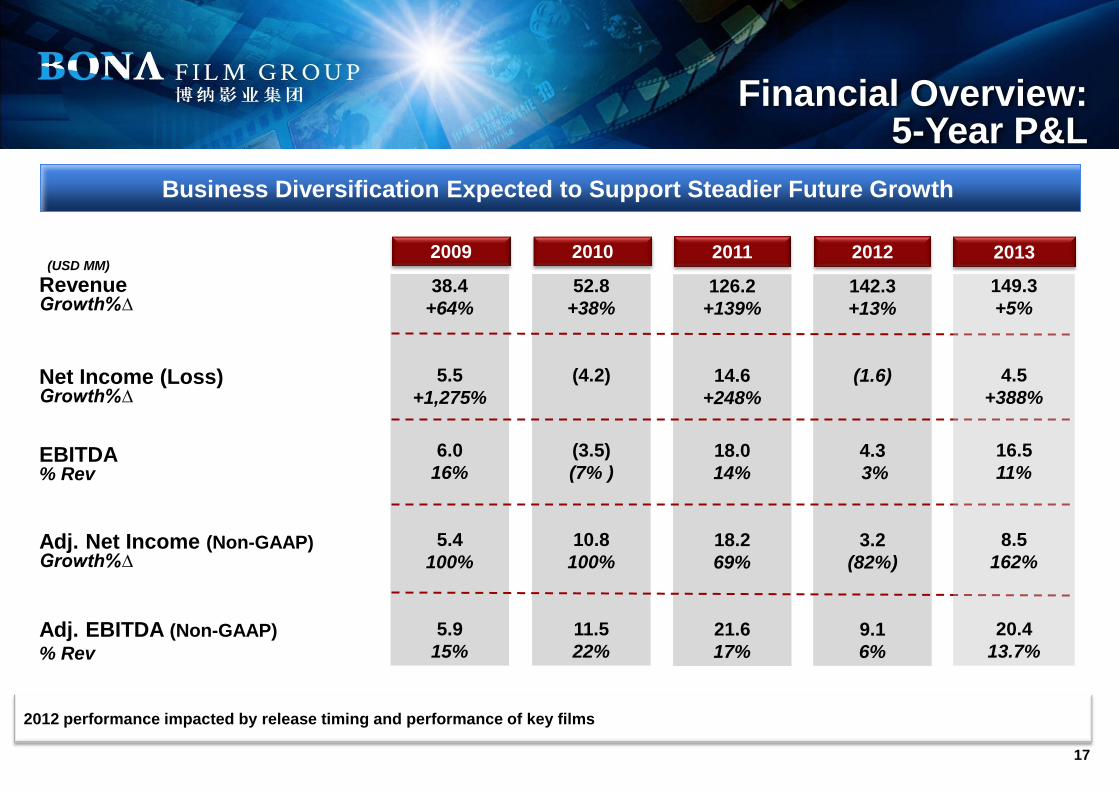
2009
38.4
+64%
5.5
+1,275%
6.0
16%
5.4
100%
5.9
15%
2012
142.3
+13%
(1.6)
4.3
3%
3.2
(82%)
9.1
6%
17
Revenue Growth%∆
Net Income (Loss) Growth%∆ EBITDA % Rev
Adj. Net Income (Non-GAAP) Growth%∆ Adj. EBITDA (Non-GAAP)
% Rev
(USD MM) 2010
52.8
+38%
(4.2)
(3.5)
(7% )
10.8
100%
11.5
22%
2011
126.2
+139%
14.6
+248%
18.0
14%
18.2
69%
21.6
17%
2012 performance impacted by release timing and performance of key films
Financial Overview: 5-Year P&L
Business Diversification Expected to Support Steadier Future Growth
2013
149.3
+5%
4.5
+388%
16.5
11%
8.5
162%
20.4
13.7%
Do not refresh this file
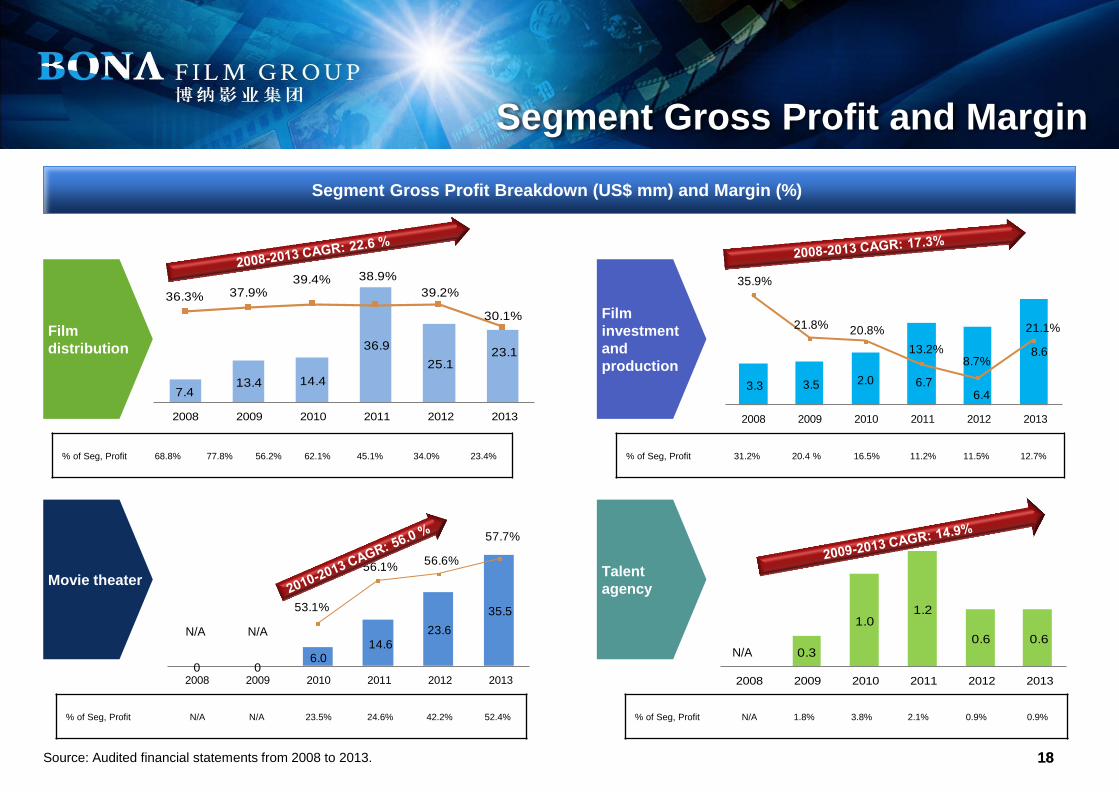
0.3
1.01.2
0.6 0.6
2008 2009 2010 2011 2012 2013
3.3 3.5 2.0 6.76.4
8.6
35.9%
21.8% 20.8%
13.2%8.7%
21.1%
2008 2009 2010 2011 2012 2013
53.1%
56.1%56.6%
57.7%
0 06.0
14.6
23.6
35.5
2008 2009 2010 2011 2012 2013
18 18
Segment Gross Profit and Margin
7.413.4 14.4
36.9
25.123.1
36.3% 37.9%39.4% 38.9%
39.2%
30.1%
2008 2009 2010 2011 2012 2013
Source: Audited financial statements from 2008 to 2013.
Segment Gross Profit Breakdown (US$ mm) and Margin (%)
Film
distribution
Film
investment
and
production
Movie theater Talent
agency
N/A
% of Seg, Profit 31.2% 20.4 % 16.5% 11.2% 11.5% 12.7%
% of Seg, Profit N/A N/A 23.5% 24.6% 42.2% 52.4% % of Seg, Profit N/A 1.8% 3.8% 2.1% 0.9% 0.9%
N/A
18
% of Seg, Profit 68.8% 77.8% 56.2% 62.1% 45.1% 34.0% 23.4%
N/A
Do not refresh this file
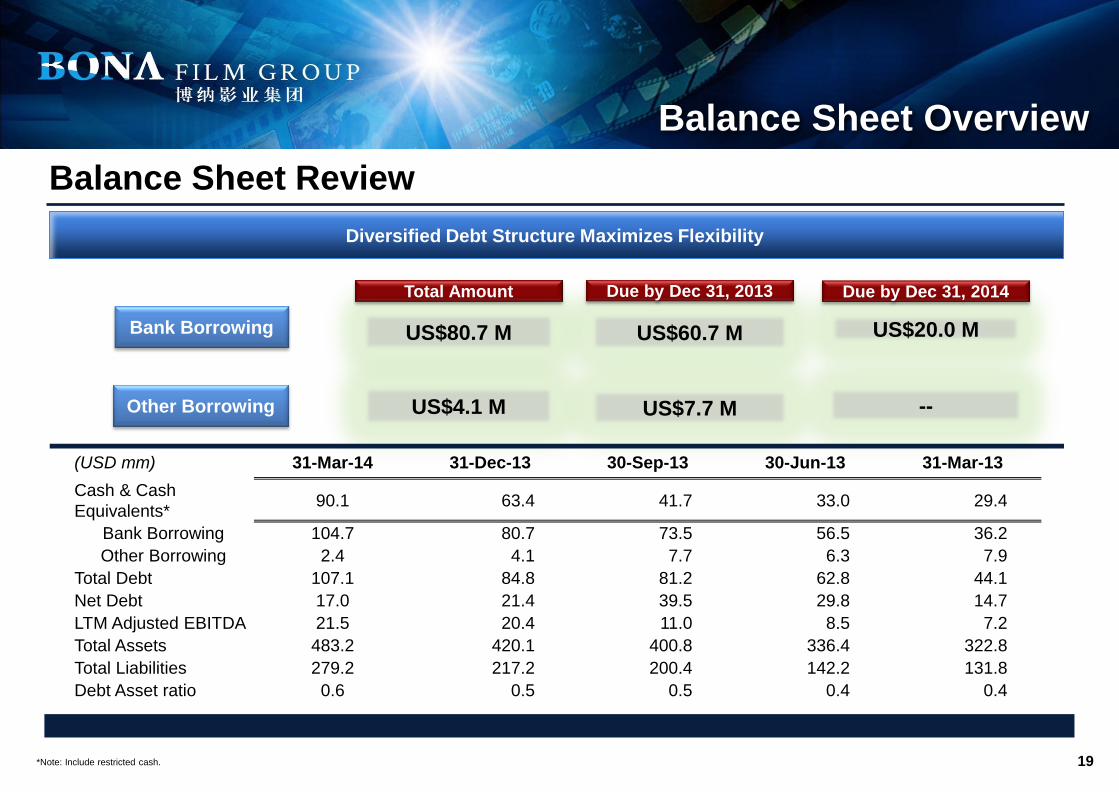
Balance Sheet Review
Balance Sheet Overview
19
Bank Borrowing US$80.7 M US$60.7 M US$20.0 M
Total Amount Due by Dec 31, 2013 Due by Dec 31, 2014
Other Borrowing US$4.1 M US$7.7 M --
(USD mm) 31-Mar-14 31-Dec-13 30-Sep-13 30-Jun-13 31-Mar-13
Cash & Cash
Equivalents* 90.1 63.4 41.7 33.0 29.4
Bank Borrowing 104.7 80.7 73.5 56.5 36.2
Other Borrowing 2.4 4.1 7.7 6.3 7.9
Total Debt 107.1 84.8 81.2 62.8 44.1
Net Debt 17.0 21.4 39.5 29.8 14.7
LTM Adjusted EBITDA 21.5 20.4 11.0 8.5 7.2
Total Assets 483.2 420.1 400.8 336.4 322.8
Total Liabilities 279.2 217.2 200.4 142.2 131.8
Debt Asset ratio 0.6 0.5 0.5 0.4 0.4
Diversified Debt Structure Maximizes Flexibility
*Note: Include restricted cash.
Do not refresh this file
20
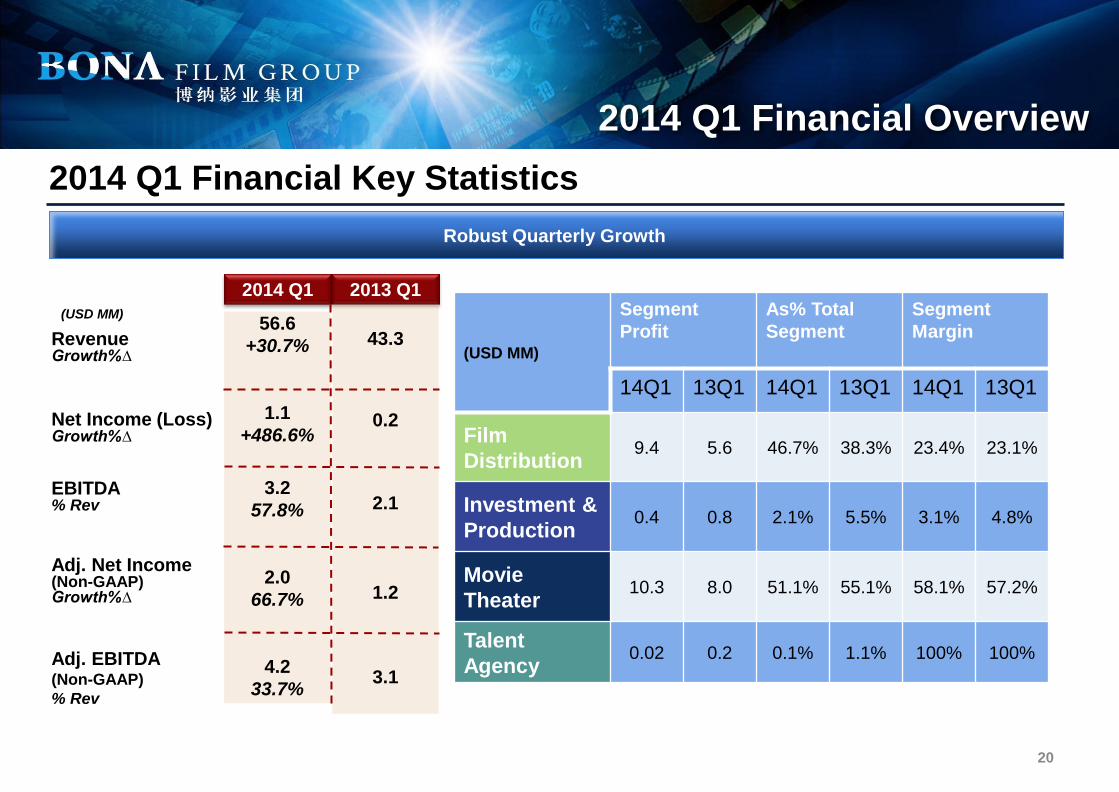
2014 Q1 Financial Overview
Revenue Growth%∆
Net Income (Loss) Growth%∆ EBITDA % Rev
Adj. Net Income (Non-GAAP) Growth%∆ Adj. EBITDA (Non-GAAP)
% Rev
(USD MM)
2014 Q1
56.6
+30.7%
1.1
+486.6%
3.2
57.8%
2.0
66.7%
4.2
33.7%
2013 Q1
43.3
0.2
2.1
1.2
3.1
(USD MM)
Segment
Profit
As% Total
Segment
Segment
Margin
14Q1 13Q1 14Q1 13Q1 14Q1 13Q1
Film
Distribution 9.4 5.6 46.7% 38.3% 23.4% 23.1%
Investment &
Production 0.4 0.8 2.1% 5.5% 3.1% 4.8%
Movie
Theater 10.3 8.0 51.1% 55.1% 58.1% 57.2%
Talent
Agency 0.02 0.2 0.1% 1.1% 100% 100%
Robust Quarterly Growth
2014 Q1 Financial Key Statistics
Do not refresh this file
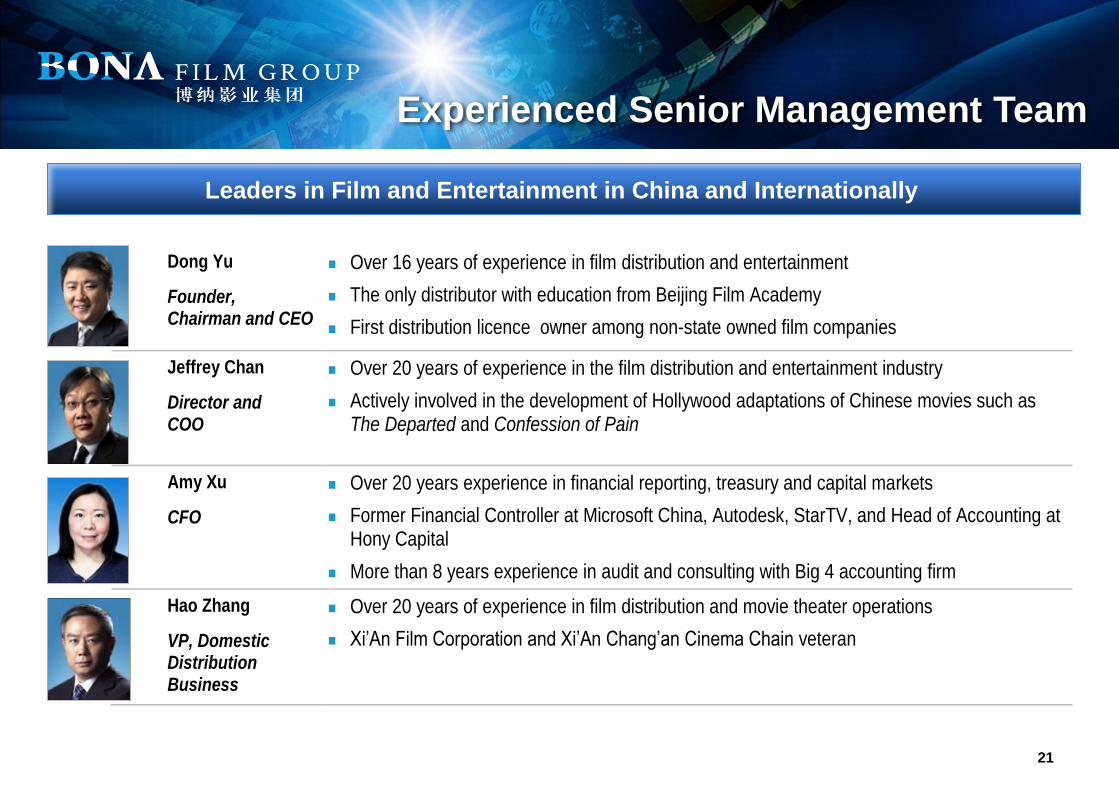
Dong Yu
Founder, Chairman and CEO
Over 16 years of experience in film distribution and entertainment
The only distributor with education from Beijing Film Academy
First distribution licence owner among non-state owned film companies
Jeffrey Chan
Director and COO
Over 20 years of experience in the film distribution and entertainment industry
Actively involved in the development of Hollywood adaptations of Chinese movies such as The Departed and Confession of Pain
Amy Xu
CFO
Over 20 years experience in financial reporting, treasury and capital markets
Former Financial Controller at Microsoft China, Autodesk, StarTV, and Head of Accounting at Hony Capital
More than 8 years experience in audit and consulting with Big 4 accounting firm
Hao Zhang
VP, Domestic Distribution Business
Over 20 years of experience in film distribution and movie theater operations
Xi’An Film Corporation and Xi’An Chang’an Cinema Chain veteran
21
Experienced Senior Management Team
Leaders in Film and Entertainment in China and Internationally
Do not refresh this file
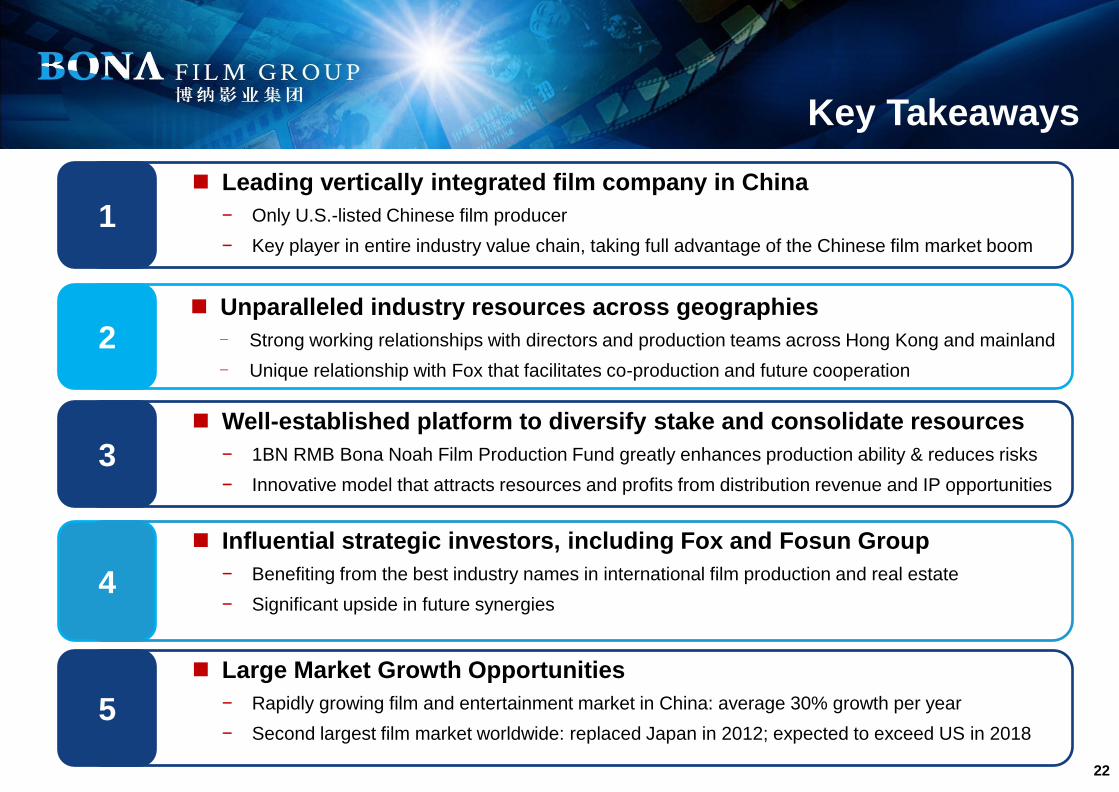
Key Takeaways
22
Leading vertically integrated film company in China
− Only U.S.-listed Chinese film producer
− Key player in entire industry value chain, taking full advantage of the Chinese film market boom
1
Unparalleled industry resources across geographies
- Strong working relationships with directors and production teams across Hong Kong and mainland
- Unique relationship with Fox that facilitates co-production and future cooperation
2
Well-established platform to diversify stake and consolidate resources
− 1BN RMB Bona Noah Film Production Fund greatly enhances production ability & reduces risks
− Innovative model that attracts resources and profits from distribution revenue and IP opportunities
3
Influential strategic investors, including Fox and Fosun Group
− Benefiting from the best industry names in international film production and real estate
− Significant upside in future synergies 4
Large Market Growth Opportunities
− Rapidly growing film and entertainment market in China: average 30% growth per year
− Second largest film market worldwide: replaced Japan in 2012; expected to exceed US in 2018 5
Do not refresh this file
23
Connect with Us!
Bona Investors WeChat Group Bona Official WeChat Group

Do not refresh this file
Agenda
Page
[ C L I E N T N A M E ]
Do not refresh this file
THANK YOU
For Additional Information, Please Contact:
Peng Li Don Markley
Bona Film Group Limited The Piacente Group
Tel: + 86-10-5928-3663 212-481-2050
Email: [email protected] Email: [email protected]