Embed Size (px)
Citation preview
0
Investor Presentation
Q2FY2018

1
DISCLAIMER
All statements, graphics, data, tables, charts, logos, names, figures and all other
information (“Contents”) contained in this document (“Material”) is prepared by GMR
Infrastructure Limited (“Company”) soley for the purpose of this Material and not
otherwise. This Material is prepared as on the date mentioned herein which is solely
intended for reporting the developments of the Company to the investors of equity
shares in the Company as on such date, the Contents of which are subject to
change without any prior notice. The Material is based upon information that we
consider reliable, but we do not represent that it is accurate or complete.
Neither the Company, its subsidiaries and associate companies (“GMR Group”), nor
any director, member, manager, officer, advisor, auditor and other persons
(“Representatives”) of the Company or the GMR Group provide any representation
or warranties as to the correctness, accuracy or completeness of the Contents and
this Material. It is not the intention of the Company to provide a complete or
comprehensive analysis or prospects of the financial or other information within the
Contents and no reliance should be placed on the fairness on the same as this
Material has not been independently verified by any person.
NONE OF THE COMPANY, THE GMR GROUP AND THE REPRESENTATIVES
OF THE COMPANY AND THE GMR GROUP ACCEPT ANY LIABILITY
WHATSOEVER FROM ANY LOSS OR DAMAGE HOWSOEVER ARISING FROM
ANY CONTENTS OR OTHERWISE ARISING OUT OF OR IN CONNECTION
WITH THIS MATERIAL.
This Material is published and available on the Company’s website
www.gmrgroup.in which is subject to the laws of India, and is soley for information
purposes only and should not be reproduced, retransmitted, republished, quoted or
distributed to any other person whether in whole or in part or for any other purpose
or otherwise.
Any reproduction, retransmission, republishing or distribution of this Material or the
Contents thereof in certain jurisdictions may be restricted by law and persons who
come into possession of this Material should observe such laws and restrictions if
any.
This Material and any discussions which follows may contain ‘forward looking
statements’ relating to the Company and the GMR Group and may include
statements relating to future results of operation, financial condition, business
prospects, plans and objectives, are based on the current beliefs, assumptions,
expectations, estimates, and projections of the directors and management of the
Company about the business, industry and markets in which the Company and the
GMR Group operates and such statements are not guarantees of future
performance, and are subject to known and unknown risks, uncertainties, and other
factors, some of which are beyond the Company’s or the GMR Group’s control and
difficult to predict, that could cause actual results, performance or achievements to
differ materially from those in the forward looking statements. Such statements are
not, and should not be construed, as a representation as to future performance or
achievements of the Company or the GMR Group. In particular, such statements
should not be regarded as a projection of future performance of the Company or the
GMR Group. It should be noted that the actual performance or achievements of the
Company and the GMR Group may vary significantly from such statements. All
forward-looking statements are not predictions and may be subject to change
without notice.
This Material is not and does not constitute any offer or invitation or
recommendation or advise to purchase, acquire or subscribe to shares and other
securities of the Company or the GMR Group and not part of this Material shall
neither form the basis of or part of any contract, commitment or investment decision
nor shall be relied upon as a basis for entering into any contract, commitment or
investment decision in relation thereto. Prospective investors in the Company or the
GMR Group should make its own investment decisions and seek professional
advice including from legal, tax or investment advisors before making an investment
decision in shares or other securities of the Company or the GMR Group.
Remember, investments are subject to risks including the risk of loss of the initial
principal amount invested; past performance is not indicative of future results.
REGULATORY AUTHORITIES IN THE UNITES STATES OF AMERICA, INDIA,
OR OTHER JURISDICTIONS, INCLUDING THE SECURITIES AND EXCHANGE
COMMISSION AND THE SECURITIES AND EXCHANGE BOARD OF INDIA
(“SEBI”), HAVE NEITHER APPROVED OR DISAPPROVED THIS MATERIAL OR
DETERMINED IF THIS MATERIAL IS TRUTHFUL OR COMPLETE. ANY
REPRESENTATION TO THE CONTRARY MAY CONSTITUTE A CRIMINAL
OFFENSE.

2
Table of Contents
Particulars Pg. No.
Institutional Framework 4 – 7
Business Overview 8 – 11
Airport Sector 12 – 16
Energy Sector 17 – 23
Urban Infrastructure & Transportation 24 – 27
Summing Up 28 – 31
Financial Analysis – Q1FY18 32 - 42

Institutional Framework

4
Visionary Leadership - Building Institution For Perpetuity…
GM Rao
Group Chairman
• Founder Chairman of the Group
• Actively guiding the group by providing
Vision & Strategy
Srinivas Bommidala
Chairman,
Airports
• Previously: MD DIAL, MD
GMR Power & Chairman
UI&H
GBS Raju
Chairman, Energy
• Previously: Chairman
Corporate & International
Business
G Kiran Kumar
Corporate
Chairman & MD
• Previously: Led bids for
Hyd and DEL airports,
Chairman Airports,
Chairman UI&H
B V N Rao
Chairman, Urban
Infra & Highways
• Previously: Corp
Chairman, Chairman
Energy
NC Sarabeswaran
• Ex-RBI’s nominee Director
on the board of Vysya Bank
R S S L N
Bhaskarudu
• Ex- MD of Maruti Udyog
Limited
S Sandilya
• Chairman - Eicher Motors
• Board Member - Parry’s
Sugar & Mastek
S Rajagopal
• Ex-Chairman & MD of Bank of
India, Indian Bank
C. R. Muralidharan
• Ex- ED of Bank of Baroda
Kameswari Vissa
• CA with 24 yrs of experience
• Board Member: L&T valves,
Madura microfin
INDEPENDENT DIRECTORSTHE GROUP HOLDING BOARD
Group has rotated its Business Chairmen across verticals as a healthy governance practice
Vikas Deep Gupta
• Partner - Corporate Finance
Group of Piramal Finance Ltd
ADDITIONAL DIRECTOR

5
• Independent panel
comprising eminent
industry leaders
• Quarterly meetings
• Brings Outside – in
view
• Advises on business
strategy and future
positioning
External advisory council ensures highest standards of Governance
and Professionalism
Dr Ram Charan
• Highly acclaimed business advisor, speaker, and author.
• For 35 years, he's worked with companies like GE, BoA, DuPont, 3M,etc.
• Retired IAS, with 30+ experience in financial services and PSUs.
• Served leadership positions- Chairman SEBI,CMD IDBI Bank, Chairman UTI
• Former MD & Chairman of SBI, Chairman of Indian Bank’s Association.
• Independent Director & interim Chairman of TATA Steel
Pradip P Shah
• Founder / Co-founding member Indocean, CRISIL and HDFC.
• Advisory roles to USAID, The World Bank and ADP
Sanjeev Aga
• Experience of 40+ yrs, Now engages in advisory/board
• Has been CEO/MD at Blow Plast / VIP Industries, Aditya Birla Nuvo, Idea.
Daljit Mirchandani
• Former Chairman Ingersoll Rand/ leadership positions with Kirloskar group.
• Serves on the advisory and statutory Board of various Companies
Dr V Sumantran
• Executive Vice-Chairman of Hinduja Automotive
• Was chief executive of TATA Motors (Cars);16-year stint with GM in Detroit
Luis Miranda
• President & CEO at IDFC alternatives.
• Now works for non-profits & also as advisor to Morgan Stanley Infra.
M Damodaran
O P Bhatt
Group Performance Advisory Council

6
Vision & Core Values
GMR Vision
“GMR Group will be an Institution in perpetuity that will build Entrepreneurial
Organizations, making a difference to Society through creation of Value”
HUMILITYWe value intellectual modesty and dislike false pride and arrogance
ENTREPRENEURSHIPWe seek opportunities – they are
everywhere
TEAMWORK & RELATIONSHIPSGoing beyond the individual-
encouraging boundary less behavior
DELIVER THE PROMISEWe value a deep sense of
responsibility and self-discipline, to meet and surpass on commitments
made
LEARNING & INNER EXCELLENCEWe cherish the life long commitment to
deepen our self awareness, explore, experiment and improve our potential
SOCIAL RESPONSIBILITYAnticipating and meeting relevant and
emerging needs of society
RESPECT FOR INDIVIDUALWe will treat others with dignity,
sensitivity and honor
Our Values and Beliefs
7
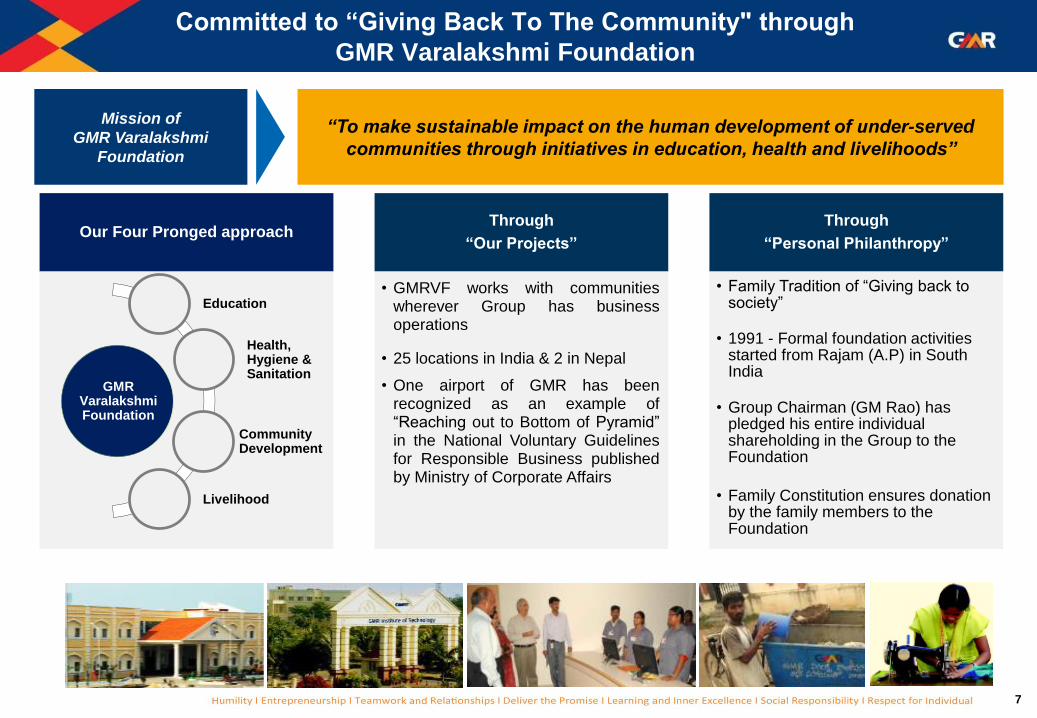
Committed to “Giving Back To The Community" through
GMR Varalakshmi Foundation
“To make sustainable impact on the human development of under-served
communities through initiatives in education, health and livelihoods”
Mission of
GMR Varalakshmi
Foundation
Our Four Pronged approachThrough
“Our Projects”
• GMRVF works with communitieswherever Group has businessoperations
• 25 locations in India & 2 in Nepal
• One airport of GMR has beenrecognized as an example of“Reaching out to Bottom of Pyramid”in the National Voluntary Guidelinesfor Responsible Business publishedby Ministry of Corporate Affairs
Through
“Personal Philanthropy”
• Family Tradition of “Giving back to society”
• 1991 - Formal foundation activities started from Rajam (A.P) in South India
• Group Chairman (GM Rao) has pledged his entire individual shareholding in the Group to the Foundation
• Family Constitution ensures donation by the family members to the Foundation
GMR VaralakshmiFoundation
Education
Health, Hygiene & Sanitation
Community Development
Livelihood

Business Overview
9
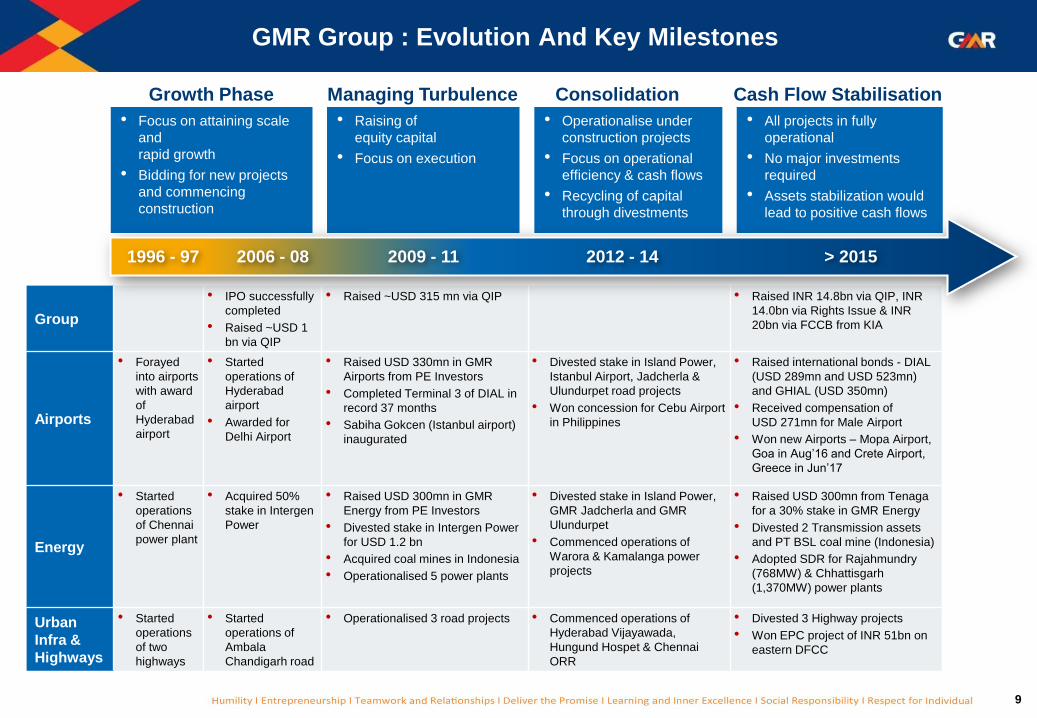
GMR Group : Evolution And Key Milestones
• Focus on attaining scale
and
rapid growth
• Bidding for new projects
and commencing
construction
• Raising of
equity capital
• Focus on execution
• Operationalise under
construction projects
• Focus on operational
efficiency & cash flows
• Recycling of capital
through divestments
• All projects in fully
operational
• No major investments
required
• Assets stabilization would
lead to positive cash flows
Managing Turbulence Cash Flow StabilisationGrowth Phase Consolidation
Group
• IPO successfully
completed
• Raised ~USD 1
bn via QIP
• Raised ~USD 315 mn via QIP • Raised INR 14.8bn via QIP, INR
14.0bn via Rights Issue & INR
20bn via FCCB from KIA
Airports
• Forayed
into airports
with award
of
Hyderabad
airport
• Started
operations of
Hyderabad
airport
• Awarded for
Delhi Airport
• Raised USD 330mn in GMR
Airports from PE Investors
• Completed Terminal 3 of DIAL in
record 37 months
• Sabiha Gokcen (Istanbul airport)
inaugurated
• Divested stake in Island Power,
Istanbul Airport, Jadcherla &
Ulundurpet road projects
• Won concession for Cebu Airport
in Philippines
• Raised international bonds - DIAL
(USD 289mn and USD 523mn)
and GHIAL (USD 350mn)
• Received compensation of
USD 271mn for Male Airport
• Won new Airports – Mopa Airport,
Goa in Aug’16 and Crete Airport,
Greece in Jun’17
Energy
• Started
operations
of Chennai
power plant
• Acquired 50%
stake in Intergen
Power
• Raised USD 300mn in GMR
Energy from PE Investors
• Divested stake in Intergen Power
for USD 1.2 bn
• Acquired coal mines in Indonesia
• Operationalised 5 power plants
• Divested stake in Island Power,
GMR Jadcherla and GMR
Ulundurpet
• Commenced operations of
Warora & Kamalanga power
projects
• Raised USD 300mn from Tenaga
for a 30% stake in GMR Energy
• Divested 2 Transmission assets
and PT BSL coal mine (Indonesia)
• Adopted SDR for Rajahmundry
(768MW) & Chhattisgarh
(1,370MW) power plants
Urban
Infra &
Highways
• Started
operations
of two
highways
• Started
operations of
Ambala
Chandigarh road
• Operationalised 3 road projects • Commenced operations of
Hyderabad Vijayawada,
Hungund Hospet & Chennai
ORR
• Divested 3 Highway projects
• Won EPC project of INR 51bn on
eastern DFCC
1996 - 97 2006 - 08 2009 - 11 2012 - 14 > 2015

10
Business Overview
AIRPORTS
~110 mn Passenger Capacity (~30 mn under development)• 2 Airports in Delhi and Hyderabad
• 1 Airport in Mopa, North Goa
• 1 Airport in Philippines : Mactan - Cebu Airport
• 1 Airport in Greece : Crete Airport
• Airport Land : 230 acres in Delhi, 1,500 acres in Hyderabad, 232 acres in Goa
ENERGY
~7,000 MW Power Generation Capacity• Coal Based : 3,350 MW
• Gas Based : ~1,400 MW
• Hydro Projects - 180 MW under construction & 1,800 MW under development
• Solar : 25 MW & Wind : 3.4 MW
• 4 Coal Mines - 2 each in India & Indonesia (Reserves - 883mn tons)
HIGHWAYS
7 Operational Projects• 4 Annuity Projects – 285 kms
• 3 Toll Projects – 315 kms
URBAN INFRASTRUCTURE
~13,800 Acres Land• 10,500 acres in Kakinada (AP) & 3,300 acres in Krishnagiri (TN)

11
Corporate Structure
Promoter & Promoter Group
61.7%
FIIs 19.4%
MF & DIIs 7.4%
Others 11.5%
Shareholding
as on Sep 30,
2017
* Includes both direct & indirect holding ** Share Purchase Agreement signed to divest 51% stake; already transferred 15% in Mar’16*** Share Purchase Agreement signed to divest 100% stake to PT GEMS
100%* 52%* 100%
GMR Infrastructure Ltd
100%*
Operational Projects Stake Operational Projects Stake Operational Projects Stake Annuity Projects Stake Projects Stake
Warora Plant (Coal) 100% Chhattisgarh Plant (Coal) 48% Tuni Anakapalli 100% Kakinada SIR 51%
Kamalanga Plant (Coal) 87% Rajahmundry Plant (Gas) 45% Tambaram Tindivanam 100% Krishnagiri SIR 100%
Kakinada Plant (Gas) 100% Chennai Plant (Diesel) 51% Pochanpalli 100%
Vemagiri Plant (Gas) 100% Wind Projects 100% Chennai ORR 90%
Solar Power Project 100%
Bajoli Holi Project 100% Ambala Chandigarh 100%
Alaknanda Project 100% Hyderabad Vijaywada 90%
Upper Karnali Project 73% Hungund Hospet ** 36%
Upper Marsyangdi Project 82%
64%
63%
40%
GMR Airports Ltd GMR Energy
Coal Mines (Indonesia)
Delhi International Airport
Goa International Airport
(Mopa)100%
PT Golden Energy Mines
(PT GEMS)
PT Barasentosa Lestari
(PT BSL) ***
Under Construction / Development
(Hydro)
Crete International Airport,
Greece
Hyderabad International
Airport
Mactan-Cebu International
Airport
Under Development Project
10%
30%
Special Investment Region
BOT (toll) Projects
GMR Highways Ltd
100%
Other Energy Assets

Airport Sector
13
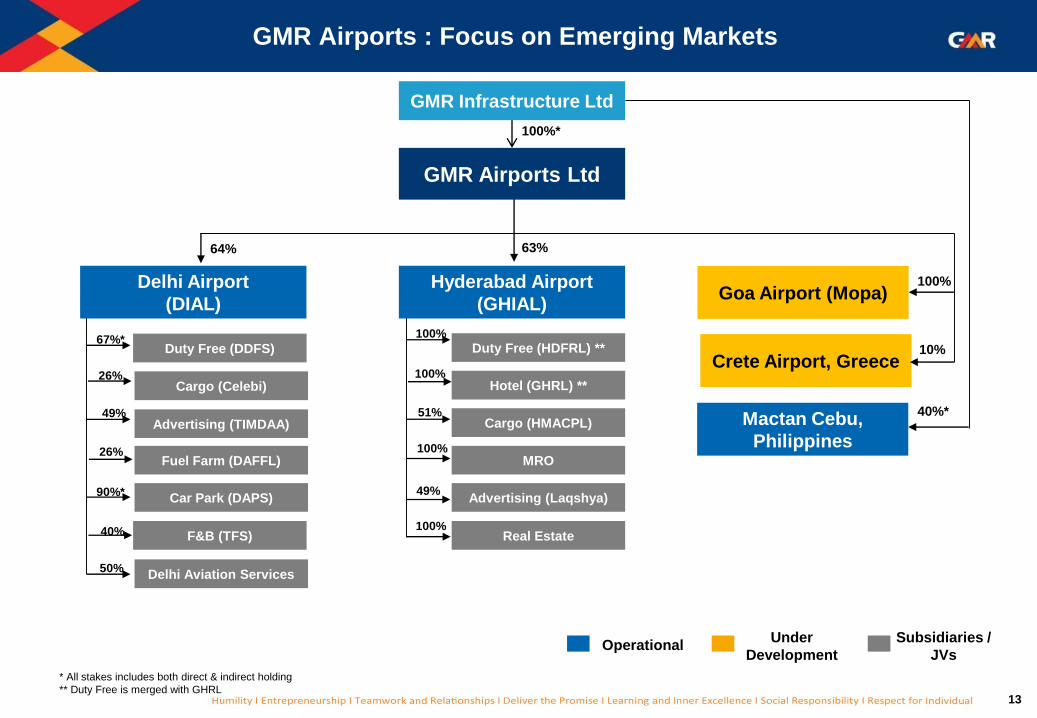
GMR Airports : Focus on Emerging Markets
GMR Infrastructure Ltd
GMR Airports Ltd
Delhi Airport
(DIAL)
Hyderabad Airport
(GHIAL)
Mactan Cebu,
Philippines
Crete Airport, Greece
Goa Airport (Mopa)
100%*
* All stakes includes both direct & indirect holding
** Duty Free is merged with GHRL
OperationalUnder
Development
Subsidiaries /
JVs
Cargo (Celebi)
Duty Free (DDFS)
Advertising (TIMDAA)
Fuel Farm (DAFFL)
Car Park (DAPS)
Delhi Aviation Services
F&B (TFS)
Duty Free (HDFRL) **
Hotel (GHRL) **
Cargo (HMACPL)
MRO
Advertising (Laqshya)
Real Estate
64%
67%*
50%
40%
90%*
26%
49%
26%
10%
63%
100%
51%
100%
100%
100%
49%
40%*
100%
14
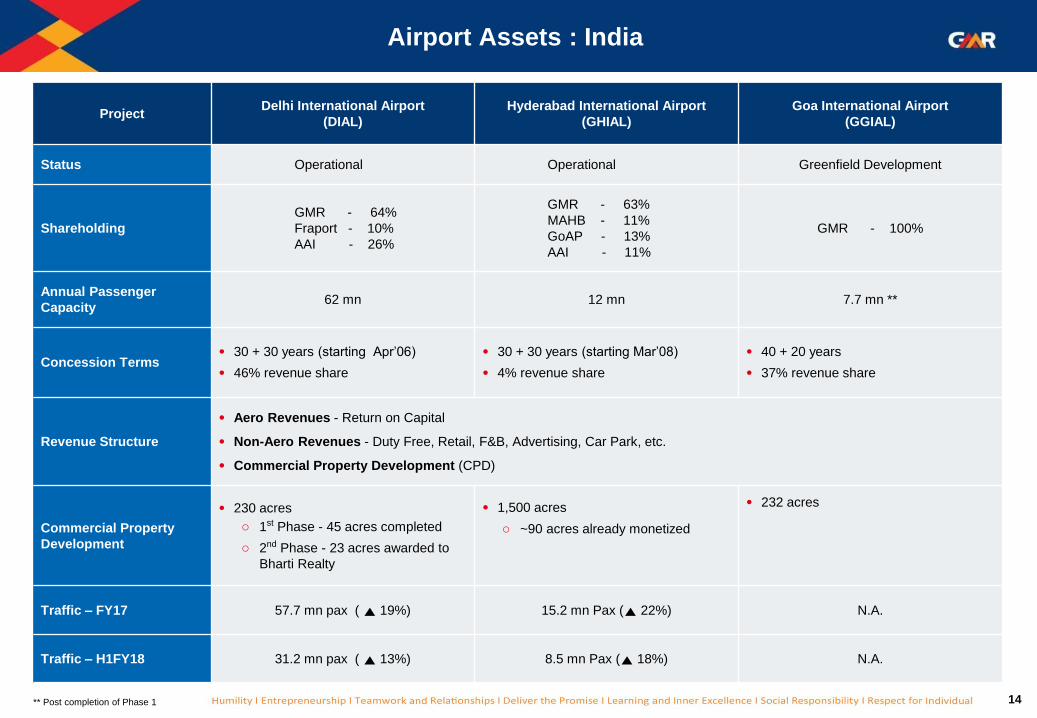
Airport Assets : India
Project Delhi International Airport
(DIAL)
Hyderabad International Airport
(GHIAL)
Goa International Airport
(GGIAL)
Status Operational Operational Greenfield Development
Shareholding
GMR - 64%
Fraport - 10%
AAI - 26%
GMR - 63%
MAHB - 11%
GoAP - 13%
AAI - 11%
GMR - 100%
Annual Passenger
Capacity62 mn 12 mn 7.7 mn **
Concession Terms• 30 + 30 years (starting Apr’06)
• 46% revenue share
• 30 + 30 years (starting Mar’08)
• 4% revenue share
• 40 + 20 years
• 37% revenue share
Revenue Structure
• Aero Revenues - Return on Capital
• Non-Aero Revenues - Duty Free, Retail, F&B, Advertising, Car Park, etc.
• Commercial Property Development (CPD)
Commercial Property
Development
• 230 acres
o 1st Phase - 45 acres completed
o 2nd Phase - 23 acres awarded to
Bharti Realty
• 1,500 acres
o ~90 acres already monetized
• 232 acres
Traffic – FY17 57.7 mn pax ( ▲ 19%) 15.2 mn Pax (▲ 22%) N.A.
Traffic – H1FY18 31.2 mn pax ( ▲ 13%) 8.5 mn Pax (▲ 18%) N.A.
** Post completion of Phase 1

15
DIAL CPD : A Promising Opportunity
• Competitive bidding - Participation from marquee international / domestic
players viz. Accor Group, Bird group, Marriot Hotels, Bharti Realty, etc.
− Developable area of ~6 msf
• Operations commenced for JW Marriott, Lemon Tree, Red Fox, Holiday
Inn, Ibis Hotel, Novotel, Pullman, etc.
− ~3,000 rooms are operational with an occupancy of ~70%
Total Land Parcel – 230 acres
230 acres of Aerotropolis Development Aerotropolis Phase - I : 45 Acres of Hospitality District
• Commercial development at airport envisages an alternate
commercial hub in NCR (as BKC in Mumbai)
• Prime and centrally located in the capital of India
• Strong preference amongst corporates to have “Delhi” address
• Multi modal connectivity including metro rail
• Awarded development rights for ~23 acres to Bharti Realty Holdings Ltd
− Bharti to develop an ‘Integrated Retail Development Project’
− Developable area of ~2.1 msf
− Upfront payment of INR 3,150 mn (including RSD, ADC, Bid
Processing Fee)
− Will receive License Fee equivalent to 20% of Revenues with
Minimum Guaranteed Payments
Aerotropolis Phase - II : 23 Acres of Retail District
Hospitality District
(45 acres)
Retail District
(23 acres)
Balance Land
(162 acres)

16
Airport Assets : Outside India
Project Mactan - Cebu International Airport, Philippines Crete International Airport, Greece
Status Brownfield Development Greenfield Development
ShareholdingGMR - 40%
Megawide - 60%
GMR - 10%
TERNA S.A. - 44%
Govt. of Greece - 46%
Annual Passenger Capacity16 mn **
(Existing : 5 mn)15 mn **
Concession Terms
• 25 years (from O&M start date)
• Project cost of USD 750mn incl. upfront fees of
USD 320mn + VAT
• 35 years (incl construction period of 5 years)
• Project cost of Euro 530mn
• GMR would be the Airport Operator
Revenue Structure
• Aero revenue based on pre-determined Passenger
Service Fee
• Non-Aero revenue from allied activities
• Aero revenue determined based on Dual Till
methodology o Inflationary increase post 3 years
Traffic – FY17 8.9 mn Pax ( ▲ 12%) 6.9 mn Pax ( ▲ 13%)
Traffic – H1FY18 5.1 mn pax ( ▲ 14%) N,A.
** Post completion of Phase 1
Energy Sector

18
GMR Energy : Strategic Partnership with Tenaga Nasional Berhad
GMR Infrastructure Ltd
GMR Energy Ltd
Kamalanga Power Plant
(Coal - 1,400MW) *
Warora Power Plant
(Coal - 600MW)
Kakinada Power Plant
(Gas - 220MW)
Gujarat Power
(Solar - 25MW)
Bajoli Holi Project
(Hydro - 180MW)
Upper Karnali Project
(Hydro - 900MW)
Upper Marsyagadi
Project (Hydro - 600MW)
Alaknanda Project
(Hydro - 300MW)
Thermal
(Coal & Gas)
Renewable
(Hydro & Solar)
Chhattisgarh Power Plant
(Coal – 1370MW)
Rajahmundry Power
Plant (Gas – 768MW)
Other Assets
Coal Mines – Indonesia
- PT GEMS
- PT BSL
Tenaga Nasional
Berhad
Private Equity
Investors
52%
18%30%
Note: All stakes includes both direct & indirect holding
* Kamalanga Power Plant includes 350MW of Unit 4 which is under development
Operational Under Construction Under Development
Vemagiri Power Plant
(Gas - 388MW)
SDR completed
Divested PTBSL
Tenaga invested USD 300mn for a 30% stake in Nov’16

19
Partnership with Tenaga provides renewed impetus to Energy Business
Tenaga has ascribed an Equity Valuation of USD 1bn (~INR 67bn) to GMR Energy Ltd.
• Partnership would be a force multiplier to create one of the most valuable company
• GMR Energy Ltd and TNB REMACO to setup JV in India for O&M of power plants
Strong synergies from the strategic partnership with Tenaga
• GMR Energy Ltd has ~80% of capacity under long-term PPAs ensuring high visibility of cash flows
Strong Visibility on Cash Flows from Operational Portfolio (~2,300 MW)
• Future growth would be driven by the development pipeline of Hydro power projects
Development Pipeline (2,330 MW) to drive future Growth
• Primary capital infusion strengthens GMR Energy Ltd’s balance sheet through reduction of corporate debt
• All convertible instruments to Private Equity players converted into equity shares
Strengthening of the Balance Sheet – Primary Investment of USD 300mn
• Opportunity to unlock value at an appropriate time
Attractiveness of GMR Energy from a value unlocking perspective

20
GMR Energy Ltd. : Thermal Power Projects
Project Warora
(Maharashtra)
Kamalanga
(Orissa)
Vemagiri
(Andhra Pradesh)
Kakinada – Barge Plant
(Andhra Pradesh)
Fuel Coal Coal Gas Gas
Ownership 100% 87% 100% 100%
Capacity 600 MW 1,050 MW 388 MW 220 MW
Project Cost INR 40 bn INR 65 bn INR 11.5 bn INR 6 bn
CoD September 2013 March 2014 January 2008 June 2010
Power Off-
take• Fully contracted long term
PPA’s
• 85% of power contracted through
long term PPA
• Plan to tie-up the remaining also
through a long term PPA
• 100% Regulated Tariff
• 23 years long term PPA (starting
Sept’06) with Andhra Pradesh &
Telangana
• 100% Merchant Tariff
Fuel Linkage• Confirmed linkage from
Coal India Ltd.• Confirmed linkage from
Coal India Ltd.
• Gas allocation from KG Basin
(not getting gas since 2012-13)
• Plant restarted post tie-up of gas
supply through the RLNG
scheme
• Gas allocation from KG Basin
(not getting gas since 2012-13)
PLF• 70% in FY17
• 71% in H1FY18
• 65% in FY17
• 62% in H1FY18
• Operated till FY12 at high PLFs
• 9% in FY17• Operated till FY12 at high PLFs
Recent
Updates
• Refinancing of project loan
completed in Feb’15
• Interest rate reduced by 110bps,
moratorium of 18 months and 15
years repayment period
• Refinancing of the project loan
completed in Jun’15
• Interest rate reduced by 100bps,
moratorium of 30 months with
16.5 years repayment period
• Debt-free plant • Debt-free plant

21
GMR Energy Ltd. : Pipeline of Hydro Power Projects
ProjectBajoli Holi
(Himachal Pradesh)
Alaknanda,
(Uttaranchal)
Upper Karnali
(Nepal)
Upper Marsyangdi
(Nepal)
Ownership 100% 100% 73% 82%
Capacity 180 MW 300 MW 900 MW 600 MW
Concession Period • 40 years from CoD• 45 years from Implementation
Agreement• 30 years from generation license
• 30 years from generation
license
Expected COD • FY19 - - -
Current Status
• Financial Closure done in Apr’13
• Lenders are IDBI Bank and L&T
Infra Finance
• NTP issued to Gammon for civil
works
• ~56% of project completed till
Sep’17
• DPR2 approved by CEA3
• Environmental Clearance
obtained
• Land fully acquired
• Registered as CDM5 Project
with UNFCC9
• CDM5 application under progress
• PDA6 signed with Govt. of Nepal
• Received consent letter from MEA
for import of power from Nepal
• JDA7 with IFC8
• Approval from Govt. of Nepal
obtained for capacity
enhancement
• CDM application under
progress
• PDA under negotiation with
Govt. of Nepal
Overview
• Under Construction
• Run of the river power facility
• Total Project Cost of INR 22bn
• Under Development
• Run of the river power facility
• To give 13% of power
generated per annum to the
state govt.
• Project on hold; stay order for
all similar projects in the
region
• Under Development
• Run of the river power facility
• Power generated to be exported
to India (net of free power
supplied to Nepal Govt.)
• Under Development
• Run of the river power facility
• On a Build – Operate – Own –
Transfer basis
• Power generated to be
exported to India (net of free
power supplied to Nepal Govt.)
Notes: 1. NEA: Nepal Electricity Authority; 2. DPR: Detailed Project Report; 3. CEA: Central Electricity Authority; 4. MoEF: Ministry of Environment and Forests. 5. CDM: Clean Development Mechanism;
6. PDA: Project Development Agreement. 7. JDA: Joint Development Agreement 8. IFC: International Finance Corporation; 9. UNFCCC: United Nations Framework Convection on Climate Change

22
Other Energy Projects
Project Raikheda
(Chhattisgarh)
Rajahmundry
(Andhra Pradesh)
Fuel Coal Gas
Ownership 48% 45%
Capacity 1,370 MW 768 MW
Project Cost INR 124 bn INR 49.4 bn
CoD • November 2015 (Unit - 1)
• March 2016 (Unit – 2) • October 2015
Power Off-take• Long term PPA with Chhattisgarh TransCo for 5% of gross
capacity• To enter into long term PPA based on sustainable gas supply
Fuel Linkage• Have Talabira and Ganeshpur coal mine
• Coal mining at Talabira started from Aug’15
• No long term gas supply contract in place
• Secured gas supply under e-RLNG scheme from Oct’15 to
Sept’16
Strategic Debt
Restructuring (SDR)
• Reason : Absence of long term Power Purchase Agreements
o Debt of INR 30 bn converted into equity - consortium
lenders acquired 52% shareholding
o Debt (post SDR) – INR 58 bn
• Reason : Absence of long term Fuel Supply Agreement and
Power Purchase Agreements
o Debt of INR 14 bn converted into equity - consortium
lenders acquired 55% shareholding
o Debt (post SDR) – INR 24 bn

23
Coal Mines
Project Talabira mine Ganeshpur mine
Mine Location Sambalpur, Odisha Latehar, Jharkhand
Upfront payment INR 540 mn INR 1,090 mn
Extractable Reserve 9 Mn Tons 92 Mn Tons
Current Status Operational mine; Mining commenced from Aug’15Under development stage
Would take 2-3 years to become operational
Project GEMS * PTBSL
Mine Location Indonesia Indonesia
Ownership 30% 100%
Resources 1.77 Bn Tons 404 Mn Tons
Reserves 640 Mn Tons 142 Mn Tons
Production – FY17 9.5 mn tons ( ▲ 9%) -
Production – H1FY18 6.0 mn tons ( ▲ 41%) -
Current StatusImprovement in international coal prices resulted in
improved realisations & profitabilityShare Purchase Agreement signed to divest 100% stake

Urban Infrastructure & Transportation

25
All 7 Projects (600 kms) are Operational
4 Projects (285 kms) are Annuity based and 3 Projects (315 kms) are Toll based
Hyderabad
Highways Projects
Chandigarh-Ambala Highway –
GACEPL (35 kms)
Tambaram-Tindivanam Highway –
GTTEPL (93 kms)
Tuni-Anakapalli Highway –
GTAEPL (59 kms)
Hyderabad-Vijaywada Highway –
GHVEPL (181 kms)
Adloor-Gundla Pochanpalli Highway –
GPEPL (103 kms)
Chennai Outer Ring –
GCORRP (30 kms)
Hungund-Hospet Highway –
GOHHHPL (99 kms)

26
Key Highlights
• Signed a Share Purchase Agreement to divest entire 51% equity stake in the Hungund Hospet project
o 15% stake has been transferred to Joint Venture partner; balance stake to be transferred post receiving all approvals
o Divestment has reduced INR 10.8 bn of debt and created INR 850mn of liquidity
• Divested remaining 26% equity stake in GMR Ulundurpet and GMR Jadcherla projects during FY17
o Stake transferred post receipt of all approvals
o Divestment created a liquidity of ~INR 1,045mn
Divestment of Road Projects in line with Asset Light, Asset Right Strategy
Highways Projects
Project NameAnnuity Based Road Projects (285 kms) Toll Based Road Projects (315 kms)
GTAEPL TTTEPL GPEPL GCORRPL GACEPL GHVEPL GOHHPL
Location Tuni-AnakapalliTambaram-
TindivanamPochampalli Chennai ORR
Ambala-
Chandigarh
Hyderabad-
Vijayawada
Hungund-
Hospet
Shareholding 100% 100% 100% 90% 100% 90% 36%
Road Length (kms) 59 93 103 30 35 181 99
CoD Dec-04 Oct-04 Mar-09 Jun-13 Nov-08 Dec-12 Nov-12/May -14
Concession Period17.5 yrs from
May-02
17.5 yrs from
May-02
20 Yrs from
Sep-0620 Yrs from Jun-10
20 Yrs from
May-06
25 Yrs from Apr-
10
19 Yrs from
Sep-10
27
Engineering, Procurement and Construction Business
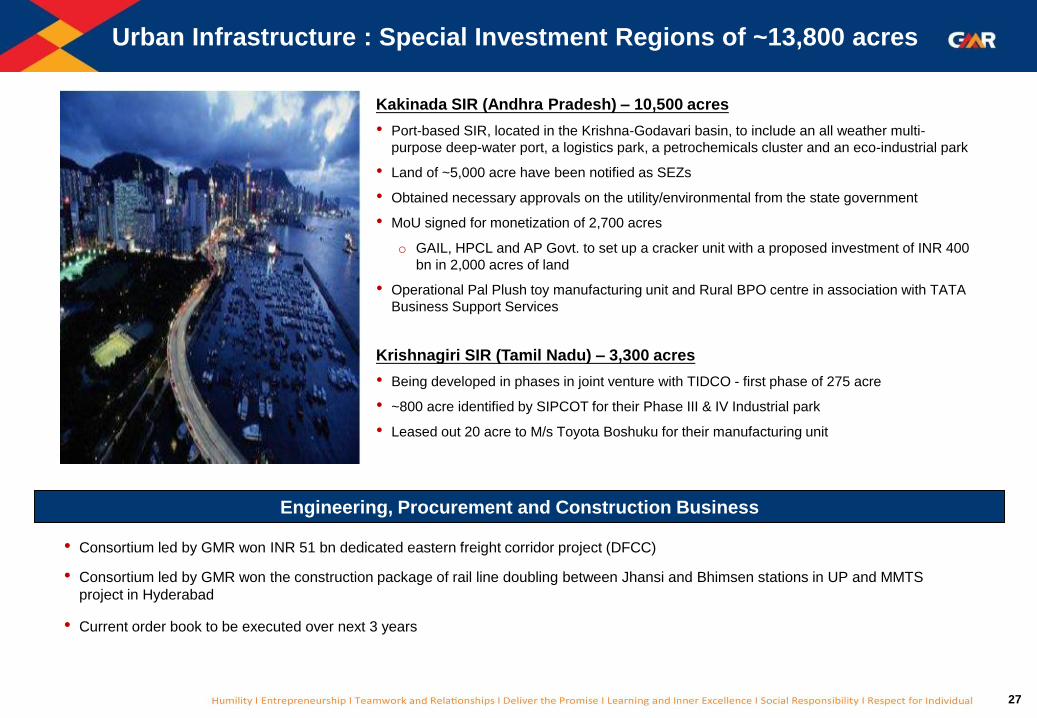
Urban Infrastructure : Special Investment Regions of ~13,800 acres
Krishnagiri SIR (Tamil Nadu) – 3,300 acres
• Being developed in phases in joint venture with TIDCO - first phase of 275 acre
• ~800 acre identified by SIPCOT for their Phase III & IV Industrial park
• Leased out 20 acre to M/s Toyota Boshuku for their manufacturing unit
Kakinada SIR (Andhra Pradesh) – 10,500 acres
• Port-based SIR, located in the Krishna-Godavari basin, to include an all weather multi-
purpose deep-water port, a logistics park, a petrochemicals cluster and an eco-industrial park
• Land of ~5,000 acre have been notified as SEZs
• Obtained necessary approvals on the utility/environmental from the state government
• MoU signed for monetization of 2,700 acres
o GAIL, HPCL and AP Govt. to set up a cracker unit with a proposed investment of INR 400
bn in 2,000 acres of land
• Operational Pal Plush toy manufacturing unit and Rural BPO centre in association with TATA
Business Support Services
• Consortium led by GMR won INR 51 bn dedicated eastern freight corridor project (DFCC)
• Consortium led by GMR won the construction package of rail line doubling between Jhansi and Bhimsen stations in UP and MMTS
project in Hyderabad
• Current order book to be executed over next 3 years

Summing Up

29
Key Highlights : Last Few Years
Particulars
‘Asset Light
Asset Right’
Approach
• Focus moved from Asset Growth to Cash Growth
• Delivered on ‘Asset Light, Asset Right’ strategy
Divestments
• Raised INR 117 bn through divestment of 8 projects
o 1 Airport: Sabiha Gocken International Airport (SGIA), Turkey
o 1 Power project: Island Power Project, Singapore
o 1 Coal Mine: Eloff & Kendall Mines (Homeland Energy Group)
o 3 Road projects: Jadcherla Expressway, Ulunderpet Expressway & Hungund Hospet Expressway
o 2 Transmission assets : Maru and Aravali
Capital Raising
• Raised INR 70 bn through Equity & Equity-linked Capital Raised
• Raised INR 48.8 bn through capital markets
o QIP of INR 14.8 bn
o Rights Issue of INR 14.0 bn
o FCCB of INR 20.0 bn
• Induction of Tenaga Nasional Berhad (Malaysia) – USD 300mn for 30% stake in GMR Energy Ltd
• Issuance of bonds for Delhi Airport : First infrastructure project to be entirely funded by USD bond
o USD 289 mn at 6.125% for 7 years (Jan 2015)
o USD 523 mn at 6.125% for 10 years (Oct 2016)
• Issuance of bond for Hyderabad Airport : Lowest US Dollar 10-year bond coupon by a Corporate High Yield Issuer from Asia
o USD 350 mn at 4.25% for 10 years (Oct 2017)
30
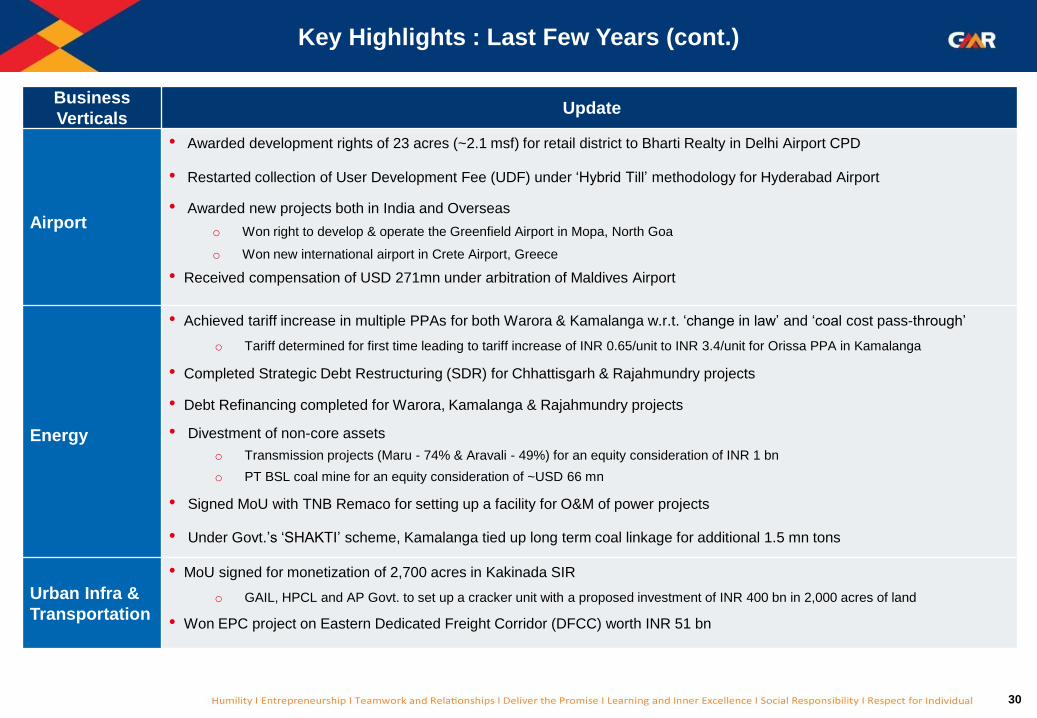
Key Highlights : Last Few Years (cont.)
Business
VerticalsUpdate
Airport
• Awarded development rights of 23 acres (~2.1 msf) for retail district to Bharti Realty in Delhi Airport CPD
• Restarted collection of User Development Fee (UDF) under ‘Hybrid Till’ methodology for Hyderabad Airport
• Awarded new projects both in India and Overseas
o Won right to develop & operate the Greenfield Airport in Mopa, North Goa
o Won new international airport in Crete Airport, Greece
• Received compensation of USD 271mn under arbitration of Maldives Airport
Energy
• Achieved tariff increase in multiple PPAs for both Warora & Kamalanga w.r.t. ‘change in law’ and ‘coal cost pass-through’
o Tariff determined for first time leading to tariff increase of INR 0.65/unit to INR 3.4/unit for Orissa PPA in Kamalanga
• Completed Strategic Debt Restructuring (SDR) for Chhattisgarh & Rajahmundry projects
• Debt Refinancing completed for Warora, Kamalanga & Rajahmundry projects
• Divestment of non-core assets
o Transmission projects (Maru - 74% & Aravali - 49%) for an equity consideration of INR 1 bn
o PT BSL coal mine for an equity consideration of ~USD 66 mn
• Signed MoU with TNB Remaco for setting up a facility for O&M of power projects
• Under Govt.’s ‘SHAKTI’ scheme, Kamalanga tied up long term coal linkage for additional 1.5 mn tons
Urban Infra &
Transportation
• MoU signed for monetization of 2,700 acres in Kakinada SIR
o GAIL, HPCL and AP Govt. to set up a cracker unit with a proposed investment of INR 400 bn in 2,000 acres of land
• Won EPC project on Eastern Dedicated Freight Corridor (DFCC) worth INR 51 bn
31
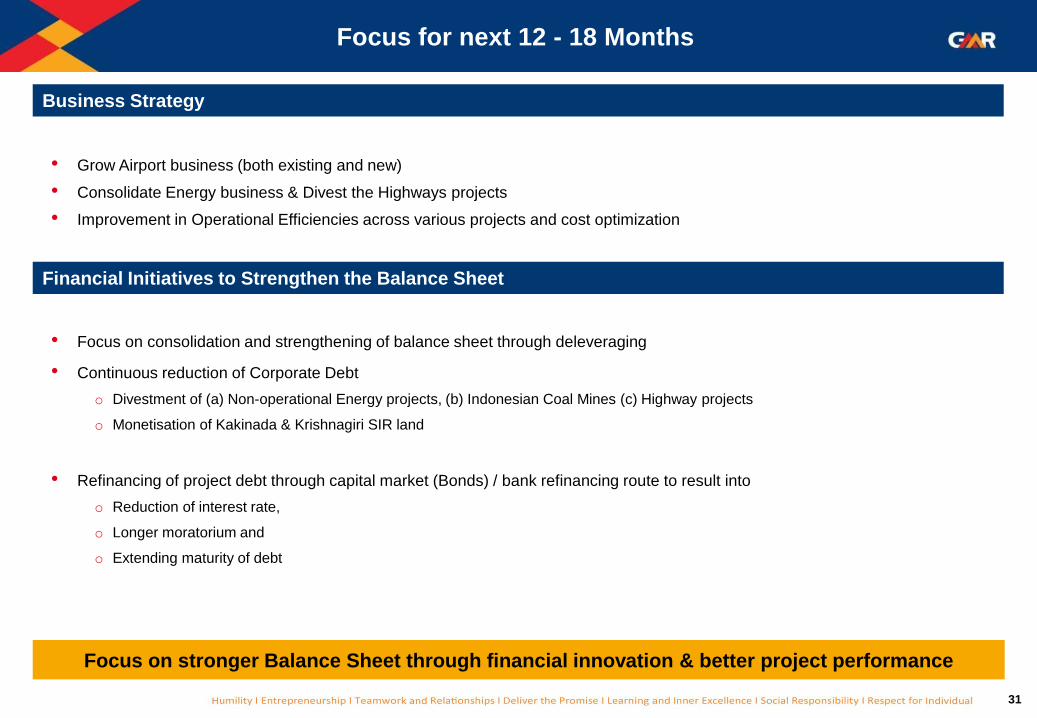
• Grow Airport business (both existing and new)
• Consolidate Energy business & Divest the Highways projects
• Improvement in Operational Efficiencies across various projects and cost optimization
• Focus on consolidation and strengthening of balance sheet through deleveraging
• Continuous reduction of Corporate Debt
o Divestment of (a) Non-operational Energy projects, (b) Indonesian Coal Mines (c) Highway projects
o Monetisation of Kakinada & Krishnagiri SIR land
• Refinancing of project debt through capital market (Bonds) / bank refinancing route to result into
o Reduction of interest rate,
o Longer moratorium and
o Extending maturity of debt
Focus for next 12 - 18 Months
Focus on stronger Balance Sheet through financial innovation & better project performance
Business Strategy
Financial Initiatives to Strengthen the Balance Sheet

Financial Analysis

33
Performance Highlights – H1FY18
Note: Financial results are presented as per Ind AS standards; Financial ratios pertain to continuing operations
• Net Revenues ▲ 12% to INR 34.1 bn; Cash Profit from operations of INR 0.94 bn for H1FY18
• Net Debt remains stable; Leverage ratios impacted due to reduction in Aero revenues in Delhi Airport
o Net Debt maintained since FY17 - INR 143 bn as on Sep’17
o Net Debt to Equity and Net Debt to EBITDA stood at 1.8x (from 1.6x in FY17) and 5.6x (from 4.4x in FY17)
respectively
Airport Sector
• Delhi Airport - Passenger traffic ▲ 13%, Gross revenues ▼ 18%, EBITDA▼ 37%
o Profitability declined on account of implementation of interim tariff order by AERA wef 7th Jul’17
o Hearings for the tariff appeals relating to 1st control period have concluded in the Appellate Tribunal and the
order has been reserved
• Hyderabad Airport - Passenger traffic ▲ 18%, Gross revenues ▲ 13%, EBITDA▲ 12%, PAT ▲ 72%
o Raised USD 350mn through an international bond issuance at a coupon of 4.25% p.a. for a tenor of 10years
o Declared dividend for second consecutive year with interim dividend of 15% for FY18
• Mactan Cebu Airport (Philippines) - Passenger traffic ▲ 14%, Gross revenues ▲ 26%, EBITDA▲ 36%, PAT ▲ 46%
o Construction of new terminal is on-stream - to commission by mid-2018
• Goa Airport – Achieved Financial Closure; Project cost of INR 19 bn; Debt : Equity of 70:30

34
Performance Highlights
Note: Financial results are presented as per Ind AS standards; Financial ratios pertain to continuing operations
Energy Sector
• Warora (600 MW) - PLF improved to 71%, Gross revenues ▲ 7%, EBITDA▲ 9%, EBITDA margins ▲ 70bps to 37%
• Kamalanga (1,050 MW) - PLF of 62%, Gross revenues was stable while EBITDA▲ 11%, Net loss ▼ 55%
o Under Govt.’s ‘SHAKTI’ scheme, Kamalanga tied up long term coal linkage for additional 1.5 mn tons
• PT GEMS (Indonesia) – Sales volume ▲ 21%, Gross revenues ▲ 49%, EBITDA▲ 218%
o Realisation ▲ 26% to USD 42.6 / ton; EBITDA/ton increased from USD 4.3 to USD 11.7
• Divestment of non-core Assets
o 100% stake divested in PT BSL (Indonesian coal mine) for equity consideration of ~USD 66mn
EPC business
• Revenues ▲ 179% to INR 4.7bn on account of pick-up in execution of DFCC project
35
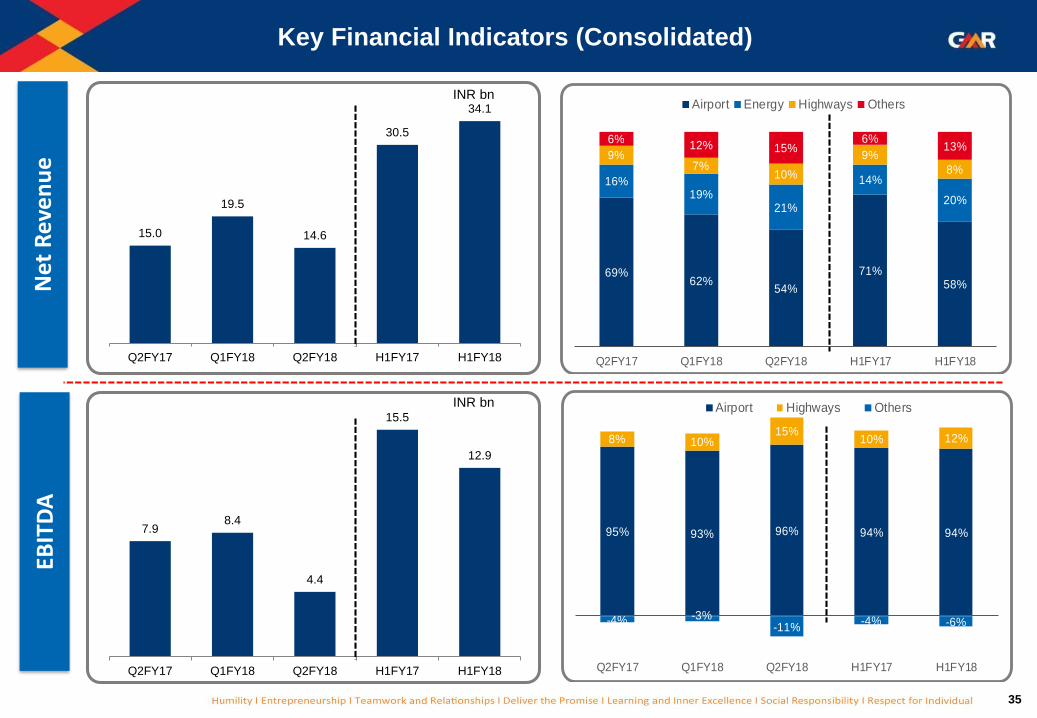
7.98.4
4.4
15.5
12.9
Q2FY17 Q1FY18 Q2FY18 H1FY17 H1FY18
15.0
19.5
14.6
30.5
34.1
Q2FY17 Q1FY18 Q2FY18 H1FY17 H1FY18
Key Financial Indicators (Consolidated)N
et R
eve
nu
eEB
ITD
A
INR bn
INR bn
69%62%
54%
71%58%
16%19%
21%
14%
20%
9%7%
10%
9%
8%
6%12% 15%
6%13%
Q2FY17 Q1FY18 Q2FY18 H1FY17 H1FY18
Airport Energy Highways Others
95% 93% 96% 94% 94%
-4% -3%-11%
-4% -6%
8% 10%15%
10% 12%
Q2FY17 Q1FY18 Q2FY18 H1FY17 H1FY18
Airport Highways Others

36
Airports Sector (Q2FY18) : Operational & Financial Highlights
Delhi Airport – Passenger Traffic grew 11% Hyderabad Airport – Passenger Traffic grew 17%
(figures in INR mn)
Implementation of interim tariff order for Delhi Airport resulted into lower profitability
Q2FY17 Q2FY18 Q2FY17 Q2FY18 Q2FY17 Q2FY18
Gross Revenues 16,881 11,760 13,472 7,331 2,749 3,058
Net Revenues 10,413 7,969 7,118 3,671 2,635 2,927
EBITDA 7,491 4,236 5,131 564 1,995 2,198
Interest 2,095 2,516 1,324 1,403 474 479
PAT 1,935 1,314 1,420 (436) 829 1,433
Airport Sector
(Consolidated)Particulars
Delhi Airport
(Standalone)
Hyderabad Airport
(Standalone)
10.2 11.4
3.74.1
13.915.5
Q2FY2017 Q2FY2018
(mn pax)Domestic International
2.93.4
0.8
0.93.7
4.4
Q2FY2017 Q2FY2018
(mn pax)Domestic International

37
Airports Sector (H1FY18) : Operational & Financial Highlights
Delhi Airport – Passenger Traffic grew 13% Hyderabad Airport – Passenger Traffic grew 18%
(figures in INR mn)
Passenger growth in Hyderabad Airport continues to be higher than industry growth of 14.5%
H1FY17 H1FY18 H1FY17 H1FY18 H1FY17 H1FY18
Gross Revenues 34,492 30,767 26,988 22,235 5,297 5,994
Net Revenues 21,666 19,953 14,380 11,677 5,079 5,739
EBITDA 14,585 12,083 9,147 5,720 3,881 4,358
Interest 4,140 4,570 2,635 2,722 979 965
PAT 4,757 3,662 2,835 786 1,459 2,511
Particulars
Airport Sector
(Consolidated)
Delhi Airport
(Standalone)
Hyderabad Airport
(Standalone)
20.4 23.0
7.38.1
27.731.2
H1FY2017 H1FY2018
(mn pax)Domestic International
5.56.7
1.7
1.87.2
8.5
H1FY2017 H1FY2018
(mn pax)Domestic International

38
Non-Aero Revenues : Continues to Witness Strong GrowthD
IAL
GH
IAL
Non-Aero Revenues
• Revenues grew 15% to INR 4.3 bn & INR 8.5 bn resp. in Q2 & H1
• Retail revenues ▲12% to INR 1.1bn in Q2; ▲10% to INR 2.3bn in H1
o Duty Free revenues in overall Retail is 75% in H1
o SPP (duty free business) stood at ~USD 10/intl. pax
• Cargo revenues ▲26% to INR 0.5bn in Q2; ▲22% to INR 1.0bn in H1
o Cargo vol. ▲14% to 0.24 mn tons in Q2; ▲15% to 0.49 mn tons in H1
• Advertisement revenues ▲29% to INR 0.4bn in Q2; ▲38% to
INR 0.8bn in H1
o Occupancy improved to 75% & 78% in Q2 & H1 resp.
Non-Aero Revenues
• Revenues grew 10% to INR 1.1bn & 15% to INR 2.1bn resp. in Q2 & H1
• Retail revenues ▲10% to INR 0.4bn in Q2 & ▲14% to INR 0.8bn
o Duty Free revenues in overall Retail is 16% in H1
o SPP (duty free business) at USD 4.8/intl. pax (▲ 10%)
• Fuel Farm revenue ▲16% to INR 0.2bn in Q2; ▲19% to INR 0.5bn in H1
o ATMs ▲11% and ▲12% in Q2 & H1 resp.
• Advertisement : Revenues ▲51% to INR 0.2bn
o Occupancy improved to 52% & 60% in Q2 & H1 resp.
o New clients from Telecom, Oil & Gas and Automobile sectors
Aero65%
Retail (incl. Duty
Free) 38%
Fuel Farm 22%
Space Rentals16%
Advt. 10%Others
15%
Non Aero35%
Gross Revenue
INR 6.0 bn
Aero58%
CPD4%
Retail (incl Duty Free)
27%
Space Rentals21%
Cargo 12%
Advt. 10%
Others31%
Non Aero38%
Gross Revenue
INR 22.2 bn
39
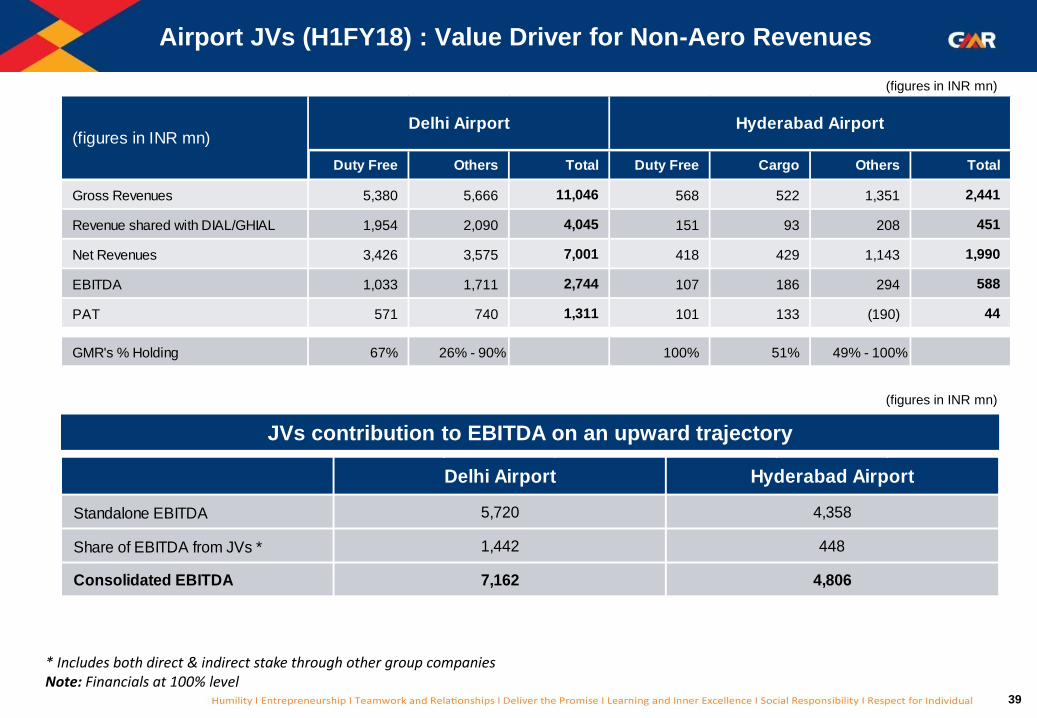
Airport JVs (H1FY18) : Value Driver for Non-Aero Revenues
* Includes both direct & indirect stake through other group companiesNote: Financials at 100% level
(figures in INR mn)
JVs contribution to EBITDA on an upward trajectory
(figures in INR mn)
Duty Free Others Total Duty Free Cargo Others Total
Gross Revenues 5,380 5,666 11,046 568 522 1,351 2,441
Revenue shared with DIAL/GHIAL 1,954 2,090 4,045 151 93 208 451
Net Revenues 3,426 3,575 7,001 418 429 1,143 1,990
EBITDA 1,033 1,711 2,744 107 186 294 588
PAT 571 740 1,311 101 133 (190) 44
GMR's % Holding 67% 26% - 90% 100% 51% 49% - 100%
(figures in INR mn)Delhi Airport Hyderabad Airport
Standalone EBITDA
Share of EBITDA from JVs *
Consolidated EBITDA
4,358
448
4,806
1,442
Delhi Airport
5,720
Hyderabad Airport
7,162

40
Energy Sector (Q2FY18) : Operational & Financial Highlights
• Warora – Profitability impacted due to low PLFs
o Low PLF in Q2FY18 due to coal shortage
o Lower Interest expenses is due to reduction in interest rate &
partial repayment of loans
• Kamalanga – Sharp reduction in net loss
o Loss reduced to Rs 330mn
o Interest cost ▼ ~14%
• GEMS – Volumes ▲ 16% in Q2FY18
o Realisation at USD 43.5 / ton ▲ 35%
o EBITDA/ton increased from USD 4.6 to USD 10.2
o PAT/ton increased from USD 0.8 to USD 6.7
(figures in INR mn)
Note: Financials at 100% level
Q2FY17 Q2FY18 Q2FY17 Q2FY18 Q2FY17 Q2FY18
Revenues 4,143 3,626 4,348 4,388 8,491 8,015
EBITDA 1,649 1,290 1,188 1,500 2,837 2,790
Interest 1,204 841 1,784 1,542 2,988 2,383
PAT 116 178 (1,295) (330) (1,179) (152)
PLF 78.0% 65.1% 56.0% 59.0%
ParticularsWarora (A) Kamalanga (B) Total (A + B)
Q2FY17 Q2FY18
Sales Vol. (mn tons) 2.7 3.2
Revenues 6,069 8,640
EBITDA 855 2,004
Interest 117 45
PAT 144 1,314
ParticularsGolden Energy Mines

41
Energy Sector (H1FY18) : Operational & Financial Highlights
(figures in INR mn)
Note: Financials at 100% level
H1FY17 H1FY18 H1FY17 H1FY18 H1FY17 H1FY18
Revenues 7,098 7,567 9,078 9,093 16,176 16,660
EBITDA 2,555 2,776 2,950 3,279 5,505 6,055
Interest 2,359 2,059 3,438 3,233 5,797 5,292
PAT (496) 239 (1,886) (846) (2,382) (607)
PLF 61.0% 70.8% 64.0% 62.0%
ParticularsWarora (A) Total (A + B)Kamalanga (B)
H1FY17 H1FY18
Sales Vol. (mn tons) 5.4 6.6
Revenues 12,265 18,276
EBITDA 1,583 5,037
Interest 184 87
PAT 245 3,410
ParticularsGolden Energy Mines
• Warora – Revenues ▲ 7% while EBITDA ▲ 9%
o PLF improves in H1FY18 to 71%
o Lower interest expenses improves PAT to INR 239mn
• Kamalanga – Net loss reduces by 55%
o Despite low PLFs, loss reduced to Rs 846mn
o Interest cost ▼ 6% to INR 3.2 bn
• GEMS – Volumes ▲ 21% in H1FY18
o Realisation at USD 42.6 / ton ▲ 26%
o EBITDA/ton increased from USD 4.3 to USD 11.7
o PAT/ton increased from USD 0.7 to USD 7.9

42
Net Debt-to-EBITDA Ratio **Gross & Net Debt (INR bn) *
Key Balance Sheet Highlights (Consolidated)
Interest Coverage RatioNet Debt (Sector-wise) *
208.565.1
143.4
Gross Debt Cash & equivalents Net Debt
Airport27%
Energy20%
Highways21%
Others1%
Corporate31%
11.56
4.44
5.58
FY16 FY17 H1FY18
1.26
1.51
1.17
FY16 FY17 H1FY18
* As on 30 Sep 2017** EBITDA has been annualised

Thank You
For further information, please visit
Website: www.gmrgroup.in or
Contact: [email protected]

Annexures
45
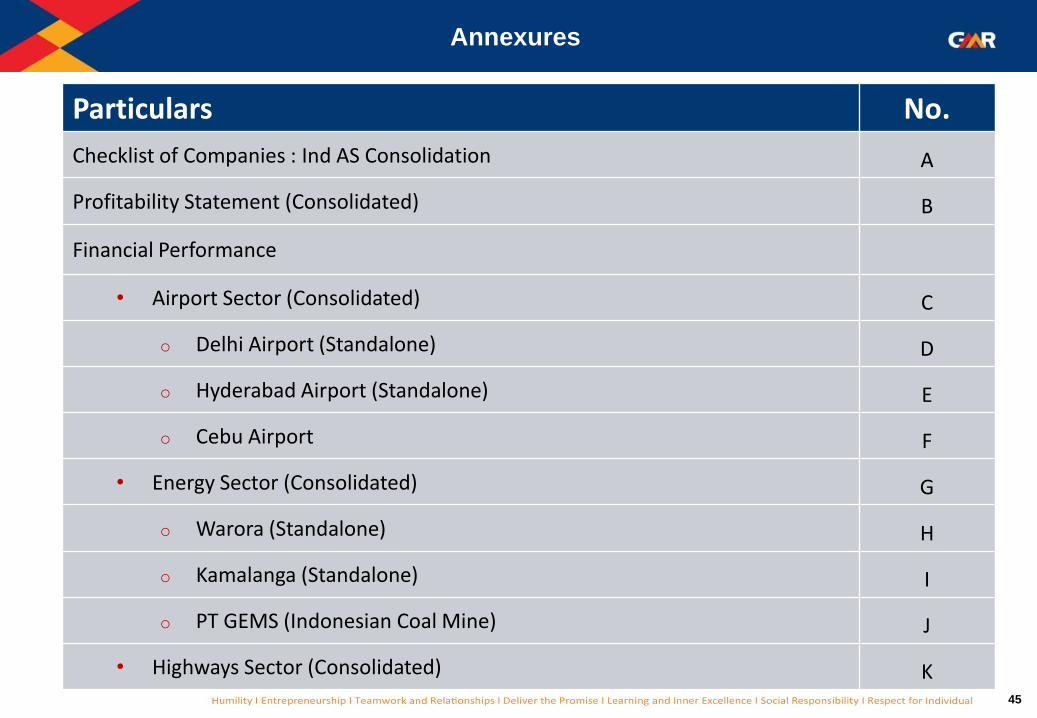
Annexures
Particulars No.
Checklist of Companies : Ind AS Consolidation A
Profitability Statement (Consolidated) B
Financial Performance
• Airport Sector (Consolidated) C
o Delhi Airport (Standalone) D
o Hyderabad Airport (Standalone) E
o Cebu Airport F
• Energy Sector (Consolidated) G
o Warora (Standalone) H
o Kamalanga (Standalone) I
o PT GEMS (Indonesian Coal Mine) J
• Highways Sector (Consolidated) K

46
Annexure A : Checklist of Companies - Ind AS Consolidation
Segment Companies H1FY17 H1FY18
Airports
Delhi Airport Yes Yes
Hyderabad Airport Yes Yes
Mactan – Cebu Airport No No
Goa Airport Yes Yes
DIAL JVs No No
GHIAL JVs No No
GMR Airports Ltd Yes Yes
Energy
GMR Energy Ltd (Standalone)
Shown as Discontinued
Operations Shown as
Associate/JV
Company
Projects under GMR Energy Ltd post
Tenaga investment
- Warora, Kamalanga, Vemagiri, Solar,
Hydro projects
Indonesian Coal Mines
Chhattisgarh
RajahmundryPre-SDR : Discontinued Ops
Post-SDR : Associate/JV Co.
HighwaysGMR Highways Ltd Yes Yes
All road projects Yes Yes
47
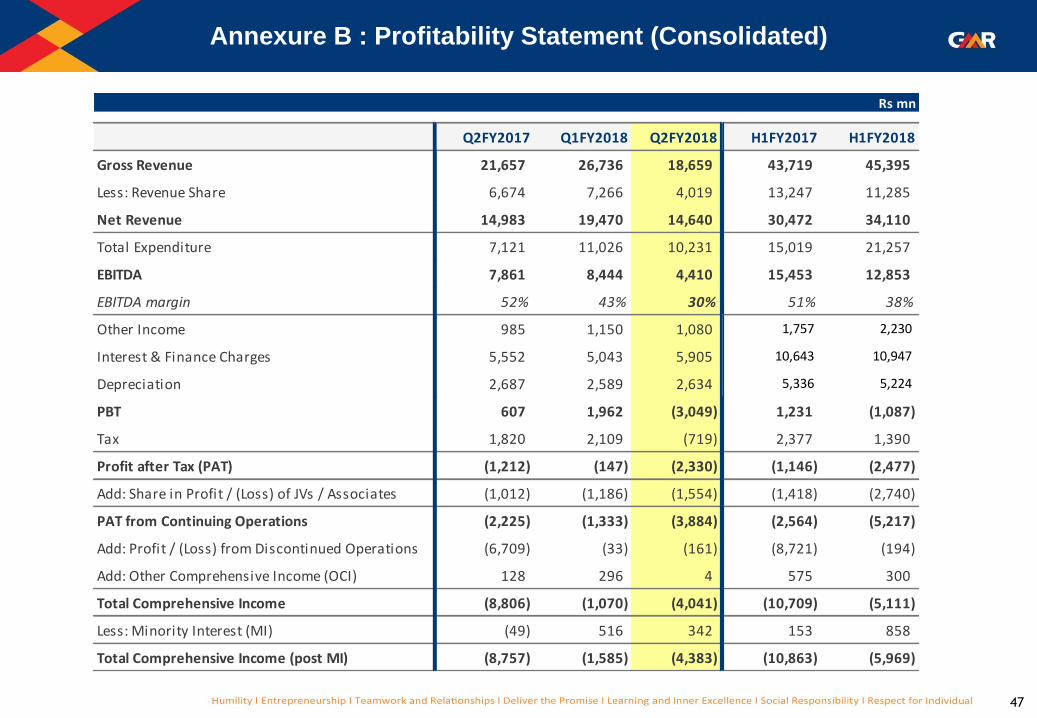
Annexure B : Profitability Statement (Consolidated)
Rs mn
Q2FY2017 Q1FY2018 Q2FY2018 H1FY2017 H1FY2018
Gross Revenue 21,657 26,736 18,659 43,719 45,395
Less: Revenue Share 6,674 7,266 4,019 13,247 11,285
Net Revenue 14,983 19,470 14,640 30,472 34,110
Total Expenditure 7,121 11,026 10,231 15,019 21,257
EBITDA 7,861 8,444 4,410 15,453 12,853
EBITDA margin 52% 43% 30% 51% 38%
Other Income 985 1,150 1,080 1,757 2,230
Interest & Finance Charges 5,552 5,043 5,905 10,643 10,947
Depreciation 2,687 2,589 2,634 5,336 5,224
PBT 607 1,962 (3,049) 1,231 (1,087)
Tax 1,820 2,109 (719) 2,377 1,390
Profit after Tax (PAT) (1,212) (147) (2,330) (1,146) (2,477)
Add: Share in Profit / (Loss) of JVs / Associates (1,012) (1,186) (1,554) (1,418) (2,740)
PAT from Continuing Operations (2,225) (1,333) (3,884) (2,564) (5,217)
Add: Profit / (Loss) from Discontinued Operations (6,709) (33) (161) (8,721) (194)
Add: Other Comprehensive Income (OCI) 128 296 4 575 300
Total Comprehensive Income (8,806) (1,070) (4,041) (10,709) (5,111)
Less: Minority Interest (MI) (49) 516 342 153 858
Total Comprehensive Income (post MI) (8,757) (1,585) (4,383) (10,863) (5,969)

48
Annexure C : Airports Sector (Consolidated)
Rs mn
Q2FY2017 Q1FY2018 Q2FY2018 H1FY2017 H1FY2018
Aero Revenue 11,144 12,029 4,672 22,168 16,701
Non Aero Revenue 5,302 6,493 6,682 11,468 13,175
CPD Rentals 435 484 407 856 891
Gross Revenue 16,881 19,007 11,760 34,492 30,767
Less: Revenue Share 6,469 7,022 3,791 12,826 10,814
Net Revenue 10,413 11,984 7,969 21,666 19,953
Operating Expenditure 2,922 4,137 3,733 7,081 7,870
EBITDA 7,491 7,847 4,236 14,585 12,083
EBITDA margin 72% 65% 53% 67% 61%
Other Income 779 798 775 1,201 1,573
Interest & Finance Charges 2,095 2,053 2,516 4,140 4,570
Depreciation 2,301 2,204 2,245 4,558 4,449
PBT 3,874 4,387 250 7,088 4,637
Tax 1,940 2,040 (1,064) 2,331 976
Profit after Tax (PAT) 1,935 2,347 1,314 4,757 3,662
Add: Share in Profit / (Loss) of JVs / Associates 298 522 345 619 867
PAT (After share in JVs/Associates) 2,233 2,869 1,660 5,377 4,529

49
Annexure D : Delhi Airport (Standalone)
Rs mn
Particulars Q2FY2017 Q1FY2018 Q2FY2018 H1FY2017 H1FY2018
Aero Revenue 9,338 10,196 2,642 18,722 12,838
Non Aero Revenue 3,720 4,238 4,293 7,444 8,531
CPD Rentals 415 470 396 822 867
Gross Revenue 13,472 14,904 7,331 26,988 22,235
Less: Revenue Share 6,354 6,898 3,660 12,607 10,558
Net Revenue 7,118 8,006 3,671 14,380 11,677
Operating Expenditure 1,987 2,850 3,107 5,234 5,957
EBITDA 5,131 5,156 564 9,147 5,720
EBITDA margin 72% 64% 15% 64% 49%
Other Income 682 578 764 1,077 1,343
Interest & Finance Charges 1,324 1,319 1,403 2,635 2,722
Depreciation 1,632 1,614 1,630 3,240 3,244
PBT 2,858 2,802 (1,705) 4,349 1,097
Tax 1,438 1,580 (1,269) 1,514 311
Profit after Tax (PAT) 1,420 1,222 (436) 2,835 786
Other Comprehensive Income (OCI) (9) (15) 490 (7) 475
Total Income (Including OCI) 1,411 1,207 54 2,828 1,261

50
Annexure E : Hyderabad Airport (Standalone)
Rs mn
Q2FY2017 Q1FY2018 Q2FY2018 H1FY2017 H1FY2018
Aero Revenue 1,786 1,865 1,999 3,447 3,864
Non Aero Revenue 963 1,072 1,058 1,850 2,130
Gross Revenue 2,749 2,936 3,058 5,297 5,994
Less: Revenue Share 114 124 131 218 255
Net Revenue 2,635 2,812 2,927 5,079 5,739
Operating Expenditure 640 653 728 1,198 1,381
EBITDA 1,995 2,159 2,198 3,881 4,358
EBITDA margin 76% 77% 75% 76% 76%
Other Income 207 267 274 275 541
Interest & Finance Charges 474 486 479 979 965
Depreciation 516 500 503 1,024 1,002
PBT 1,212 1,440 1,491 2,153 2,931
Tax 383 363 58 694 420
Profit after Tax (PAT) 829 1,078 1,433 1,459 2,511
Other Comprehensive Income (OCI) (3) (1) (2) (4) (2)
Total Income (Including OCI) 826 1,077 1,432 1,454 2,508

51
Annexure F : Cebu Airport - Financial & Operational Performance
Passenger traffic grew 14% ATMs grew 21%
(INR mn)
Note: Financials are at 100% level
3.3 3.5
1.2 1.6
4.5 5.1
H1FY2017 H1FY2018
Passengers (Mn)Domestic International
28.7 33.6
7.7
10.6 36.4
44.1
H1FY2017 H1FY2018
ATM ('000)Domestic International
Particulars Q2FY17 Q1FY18 Q2FY18 H1FY17 H1FY18
Gross Revenues 646 783 805 1,257 1,588
EBITDA 454 591 593 871 1,183
PAT 335 450 486 643 936

52
Annexure G : Energy Sector (Consolidated)
Rs mn
Q2FY2017 Q1FY2018 Q2FY2018 H1FY2017 H1FY2018
Gross Revenue 2,330 3,745 3,068 4,165 6,813
Operating Expenditure 2,549 3,697 3,341 4,444 7,037
EBITDA (219) 48 (272) (279) (224)
EBITDA margin -9% 1% -9% -7% -3%
Other Income 151 115 102 225 218
Interest & Fin Charges 897 579 591 1,468 1,170
Depreciation 108 92 103 214 195
PBT (1,072) (507) (863) (1,736) (1,371)
Taxes (30) 24 268 (42) 292
Profit after Tax (PAT) (1,042) (532) (1,131) (1,693) (1,663)
Add: Share in Profit / (Loss) of JVs / Associates (1,314) (1,748) (1,854) (2,095) (3,601)
PAT (After share in JVs/Associates) (2,356) (2,279) (2,985) (3,788) (5,264)

53
Annexure H : Warora (Standalone)
Note: Financials are at 100% level
Rs mn
Particulars Q2FY2017 Q1FY2018 Q2FY2018 H1FY2017 H1FY2018
Total Revenue 4,143 3,941 3,626 7,098 7,567
Fuel - Consumption 2,101 1,960 1,616 3,102 3,576
Other Expenses 393 495 720 1,442 1,215
EBITDA 1,649 1,485 1,290 2,555 2,776
EBITDA margin 40% 38% 36% 36% 37%
Other Income 103 97 46 157 143
Interest & Finance Charges 1,204 1,218 841 2,359 2,059
Depreciation 432 304 316 849 620
PBT 116 61 178 (496) 239
Taxes (0) (0) 0 - 0
PAT 116 61 178 (496) 239
Other Comprehensive Income (OCI) 0 0 (1) (1) (0)
Total Income (Including OCI) 116 61 177 (496) 238
54
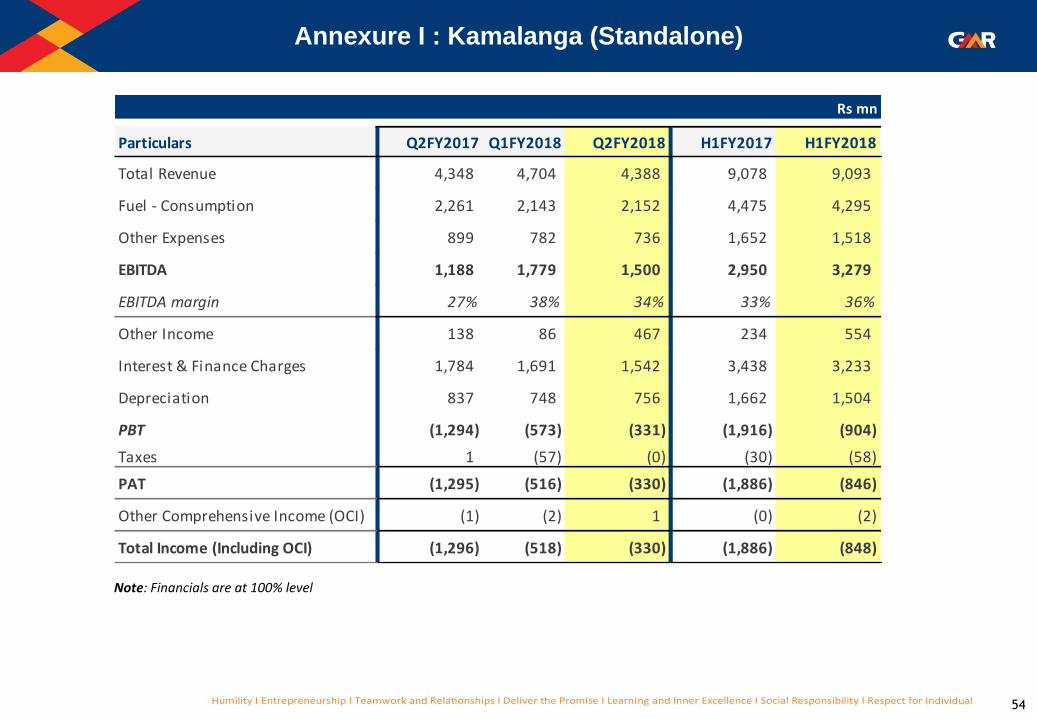
Annexure I : Kamalanga (Standalone)
Note: Financials are at 100% level
Rs mn
Particulars Q2FY2017 Q1FY2018 Q2FY2018 H1FY2017 H1FY2018
Total Revenue 4,348 4,704 4,388 9,078 9,093
Fuel - Consumption 2,261 2,143 2,152 4,475 4,295
Other Expenses 899 782 736 1,652 1,518
EBITDA 1,188 1,779 1,500 2,950 3,279
EBITDA margin 27% 38% 34% 33% 36%
Other Income 138 86 467 234 554
Interest & Finance Charges 1,784 1,691 1,542 3,438 3,233
Depreciation 837 748 756 1,662 1,504
PBT (1,294) (573) (331) (1,916) (904)
Taxes 1 (57) (0) (30) (58)
PAT (1,295) (516) (330) (1,886) (846)
Other Comprehensive Income (OCI) (1) (2) 1 (0) (2)
Total Income (Including OCI) (1,296) (518) (330) (1,886) (848)
55
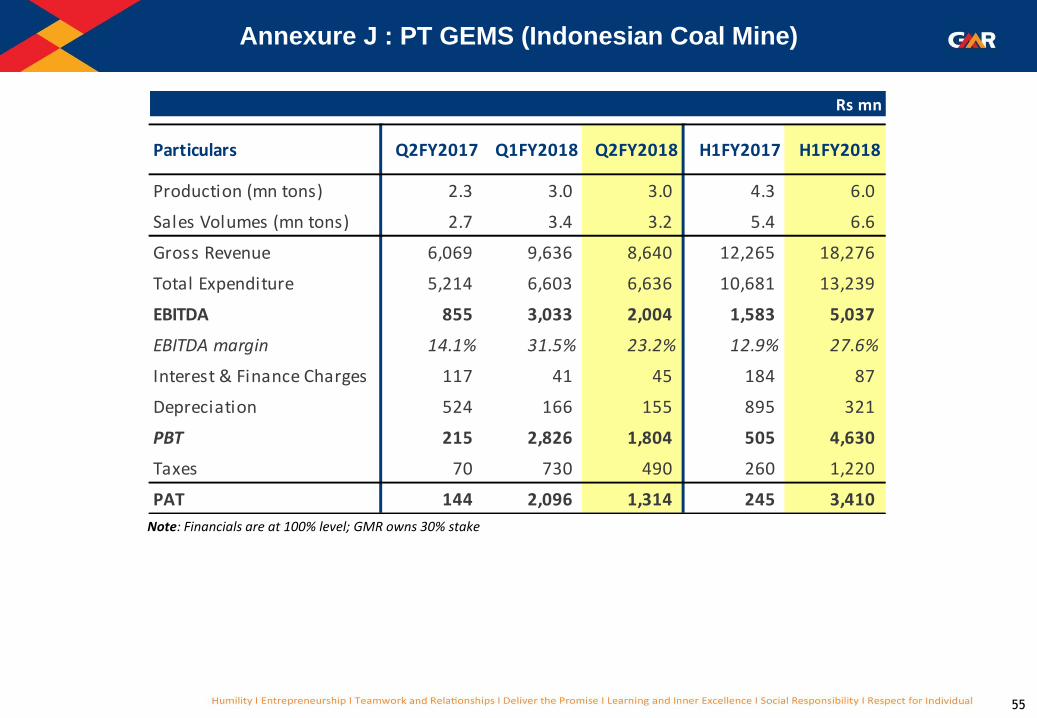
Annexure J : PT GEMS (Indonesian Coal Mine)
Note: Financials are at 100% level; GMR owns 30% stake
Rs mn
Particulars Q2FY2017 Q1FY2018 Q2FY2018 H1FY2017 H1FY2018
Production (mn tons) 2.3 3.0 3.0 4.3 6.0
Sales Volumes (mn tons) 2.7 3.4 3.2 5.4 6.6
Gross Revenue 6,069 9,636 8,640 12,265 18,276
Total Expenditure 5,214 6,603 6,636 10,681 13,239
EBITDA 855 3,033 2,004 1,583 5,037
EBITDA margin 14.1% 31.5% 23.2% 12.9% 27.6%
Interest & Finance Charges 117 41 45 184 87
Depreciation 524 166 155 895 321
PBT 215 2,826 1,804 505 4,630
Taxes 70 730 490 260 1,220
PAT 144 2,096 1,314 245 3,410

56
Annexure K : Highways Consolidated - Financial Performance
Rs mn
Q2FY2017 Q1FY2018 Q2FY2018 H1FY2017 H1FY2018
Gross Revenue 1,317 1,424 1,473 2,869 2,897
Less: Revenue Share 206 244 228 422 471
Net Revenue 1,111 1,181 1,245 2,447 2,426
Operating Expenses 462 361 571 916 932
EBITDA 649 820 674 1,531 1,494
EBITDA margin 58% 69% 54% 63% 62%
Other Income 55 52 39 119 91
Interest & Finance Charges 986 1,117 1,047 1,971 2,164
Depreciation 142 167 162 291 329
PBT (424) (412) (497) (612) (909)
Taxes 30 43 58 56 101
Profit after Tax (PAT) (455) (455) (555) (669) (1,010)
Add: Share in Profit / (Loss) of JVs / Associates - - - - -
PAT (After share in JVs/Associates) (455) (455) (555) (669) (1,010)