Embed Size (px)
Citation preview

PIRELLI SUSTAINABILITY PLAN
2017-2020 with selected targets to 2025
2 SUSTAINABILITY PLAN 2017-2020
with selected target to 2025
▬ PIRELLI SUSTAINABILITY MODEL
▬ ACHIEVEMENTS
▬ EVOLVING CONTEXT & KEY INDUSTRY TRENDS
▬ SUSTAINABILITY PLAN: RETURN ON CAPITAL
• GROWTH
• PRODUCTIVITY
• GOVERNANCE & RISK MANAGEMENT
AGENDA

3 SUSTAINABILITY PLAN 2017-2020
with selected target to 2025
PIRELLI SUSTAINABILITY MODEL
*Using Global Reporting Initiative (GRI –Standards), Comprehensive option; principles of integrated reporting contained in the Framework of the International Integrated Reporting Council (IIRC), Assurance Engagements,
ISAE 3000 – Assurance Engagement on GHG ISAE 3000; **Tool developed by the UN Global Compact and UN Principles for Responsible Investment (PRI).
GOVERNANCE MANAGEMENT SYSTEMS PLAN REPORTING*
Using the “Value Driver Model”**
to better assess and
communicate the financial impact
of sustainable strategies.
Quality
ISO 9001
IATF 16949
ISO/IEC 17025
Environment
ISO 14001
ISO 14040
ISO 14064
Labour and Social
OHSAS 18001
Standard SA8000® (Reference Std)
Group Sustainability
and Risk
Governance dept.
Country Sustainability
Managers
(CEOs)
Economic
development
Environmental
Stewardship Social
Responsibility
PIRELLI MULTI-STAKEHOLDER SUSTAINABILITY MODEL ALIGNS TO
Sustainable performance is
integrated in the Group Annual
Report:
Growth
opportunities
Productivity
Risk
management
Return on
capital
Board Committee
Sustainability
Steering Committee
Board of Directors
ISO 37001
Purchasing
Anti-Bribery
ISO 20400

4 SUSTAINABILITY PLAN 2017-2020
with selected target to 2025
*Published on Pirelli's website in multiple languages and communicated to all employees in their local language; **Member of the Tire Industry Project Group (TIP) and of the SiMPlify Project on Sustainable Mobility;
***Member of the Board; ****Campaign partner.
MAIN GROUP POLICIES*
Equal Opportunities
The Values and the
Ethical Code
Tax
Code of Conduct and Premium
Integrity Program
Antitrust and Fair Competition
Social Responsibility for
Occupational Health, Safety,
Rights and Environment
Health, Safety and Environment Human Rights
Product Stewardship
Corporate Lobbying
Green Sourcing
Personal Data Protection
Intellectual Property
Quality
Whistleblowing
European Occupational Safety and
Health Agency (EU-OSHA)****
ADVOCACY: PLAYER WITHIN MAIN INTERNATIONAL ORGANIZATIONS IMPACTING ON SUSTAINABLE DEVELOPMENT
United Nations
Global Compact
LEAD
Corporate Social
Responsibility Europe***
World Business Council
for Sustainable Development**
A COMPREHENSIVE CORPORATE POSITIONING & INTERNATIONAL
ENGAGEMENT
Key Global sustainability issues
Sustainable Natural Rubber

5 SUSTAINABILITY PLAN 2017-2020
with selected target to 2025
▬ PIRELLI SUSTAINABILITY MODEL
▬ ACHIEVEMENTS
▬ EVOLVING CONTEXT & KEY INDUSTRY TRENDS
▬ SUSTAINABILITY PLAN: RETURN ON CAPITAL
• GROWTH
• PRODUCTIVITY
• GOVERNANCE & RISK MANAGEMENT
AGENDA

6 SUSTAINABILITY PLAN 2017-2020
with selected target to 2025
2017 MAJOR ACHIEVEMENTS • Green performance revenues* 2017: 42% on total tyre revenues (vs 40% in 2016 and vs 5% in 2009)
• Issuance of new Pirelli «Sustainable Natural Rubber Policy»
• Compliance of Pirelli Purchasing Model with ISO 20400 confirmed by third party (Feb. 2018)
• Compliance of Pirelli Anti-Corruption Management System with ISO 37001 confirmed by third party (Feb. 2018)
• Pirelli awarded Global Sustainability Leader of Auto Components Industry and Gold Class Company with a score of 83 points vs.
sector average of 42** (Feb. 2018)
• Avg Rolling resistance of Pirelli car tyres reduced by -15% vs 2009
• Specific energy consumption -4% vs 2016 and -15% vs 2009
• CO2 specific emissions -4% vs 2016 and -9% vs 2009
• Specific water withdrawal -14% vs 2016 and - 62% vs 2009
• Towards «zero waste to landfill»: 93% of waste recovered in 2017 (+1% vs 2016 and +24% vs 2009)
• Renewable Energy: around 43% of purchased electricity came from renewable sources*** (+5% vs 2016)
* Figure obtained by weighing the value of sales of Green Performance tyres on the total value of sales of Group tyres. Green Performance products identify tyres that Pirelli produces throughout the world and that fall only
under rolling resistance and wet grip classes A, B, C according to the labeling parameters set by European legislation; ** Sustainability Yearbook 2018 (by RobecoSAM –Analysts for Dow Jones Sustainability indexes);
***Internal evaluation on International Energy Agency (IEA) data considering Pirelli geographical breakdown;**** Environmental, Social and Governance.
• International Stakeholder Consultations on Natural Rubber Policy
• National Stakeholder Consultations on Sustainability Plans (Russia and Argentina)
• Accident frequency index reduction: -18% vs 2016 and -83% vs 2009
• Training days per capita: 8 average days per capita
• Supplier Sustainability risk assessment; 83 ESG**** audits performed by independent party; total number of non-conformities
found on-site decreased by 16% compared to 2016

7 SUSTAINABILITY PLAN 2017-2020
with selected target to 2025
AGENDA
▬ PIRELLI SUSTAINABILITY MODEL
▬ ACHIEVEMENTS
▬ EVOLVING CONTEXT & KEY INDUSTRY TRENDS
▬ SUSTAINABILITY PLAN: RETURN ON CAPITAL
• GROWTH
• PRODUCTIVITY
• GOVERNANCE & RISK MANAGEMENT

8 SUSTAINABILITY PLAN 2017-2020
with selected target to 2025
SOCIO – DEMO
TRENDS Purchasing power growth Growing urbanization Digitalization
CAR EVOLUTION* • 10% of total sales in
2025
• 21% of Premium and
Prestige sales in 2025
• 12% of total sales in
2025**
• 30% of Premium and
Prestige sales in
2025**
• 83% of sales in
2025
• Only 1% of car sales
but 5% of miles
driven in 2025
Autonomous Connected Electric Shared
MOBILITY
EVOLUTION
Travel Urban life Transfer
• Car sharing will reduce
cars on the streets
• Autonomous driving will
increase mobility
demand including
elderly and impaired
• Thanks to
autonomous driving
capabilities, cars will
compete with trains
and planes on long
distance trips
• Higher income and
autonomous
capabilities will
increase miles driven
Commuting
• Smart-working and
multimodal transport
will reduce private
car use for daily
commuting
*Research reports, Pirelli estimate; ** From level 3 (the driver can safely turn its attention away from the driving task but still be prepared to intervene) to level 5 (fully autonomous vehicle).
EVOLVING CONTEXT & KEY INDUSTRY TRENDS

9 SUSTAINABILITY PLAN 2017-2020
with selected target to 2025
AGENDA
▬ PIRELLI SUSTAINABILITY MODEL
▬ ACHIEVEMENTS
▬ EVOLVING CONTEXT & KEY INDUSTRY TRENDS
▬ SUSTAINABILITY PLAN:
RETURN ON CAPITAL
• GROWTH
• PRODUCTIVITY
• GOVERNANCE & RISK MANAGEMENT

10 SUSTAINABILITY PLAN 2017-2020
with selected target to 2025
The Plan 2020 with selected target 2025:
• was drafted and is presented according to Pirelli Value Driver Model, with a Return on Capital
approach;
• integrates Group Industrial Plan and its High Value development strategy;
• replaces previous 2013-2017 Sustainability Plan with selected targets 2020 (vs 2009);
• maintains 2009 as base reference year to allow long-term numerical trends to be appreciated;
• impacts on 12 UN SDGs (Sustainable Development Goals 2030) set forth by the United Nations:
following slides show which SDGs are related to the targets therein described.
SUSTAINABILITY PLAN

11 SUSTAINABILITY PLAN 2017-2020
with selected target to 2025
GROWTH PRODUCTIVITY GOVERNANCE & RISK
MANAGEMENT
▬ Long-term
Strategy
▬ Product Innovation
▬ Operation Efficiency
▬ Human Capital
Governance
▬ Corporate Governance, Risk
Management
▬ Supply Chain
* Pirelli model is inspired to the Value Driver Framework of the UN-PRI (United Nations - Principles for Responsible Investment) and UN Global Compact, aimed at supporting dialogue between investors and operations on
ESG themes
RETURN ON CAPITAL
RETURN ON CAPITAL
Sustainability Plan Structure
REVENUE GROWTH COST SAVING &
AVOIDANCE
REVENUE AND REPUTATION RISK REDUCTION;
SUSTAINABILITY RISK CONTAINMENT
RETURN ON CAPITAL: PIRELLI VALUE DRIVER MODEL*

12 SUSTAINABILITY PLAN 2017-2020
with selected target to 2025
INDUSTRIAL PLAN 2017-2020 SUSTAINABILITY PLAN 2017-2020 with selected target 2025
RE
TU
RN
ON
CA
PIT
AL
HIGH VALUE FOCUS
• O.E. HOMOLOGATION PIPE LINE
• CONSUMER CENTRIC APPROACH TO
P L
INE
GR
OW
TH
C
OS
T C
OM
PE
TIT
IVE
NE
SS
• SHIFTING CAR CAPACITY TO HIGH
VALUE
TRANSFORMATION PROGRAMS
• INTEGRATED FORECASTING
• SMART MANUFACTURING & FLEXIBLE
FACTORY
• DESIGN TO COST
• ENHANCED SUPPLY CHAIN
• UPGRADING MANUFACTIRING ASSET
• Green Performance revenues 2020 for High Value Products : >65% on total revenues
• Product performance – car: noise -15%, rolling resistance -20%, wet grip +15% within 2020 vs
2009
• Raw materials: for selected segments Pirelli will double the share of renewable materials and
reduce the fossil based materials by 30% within 2025 vs 2017
• Natural Rubber value chain: implementation of Pirelli Policy, ESG risk-based approach,
traceability upstream
• Future Mobility: Cyber Technology with PIRELLI CONNESSOTM, Cyber TyreTM ,CyberTM Fleet
• Business Velo: looking to future mobility & high performance
• People: shift to digital, agile and cross-functional mindset
• Training: ≥7 man / days per employee per year
• Target Zero Workplace Accidents: Frequency Index reduction by 87% within 2020 vs 2009
• Growing investment in operational risk mitigation : double digit CAGR
• Reduce energy consumption by 19% within 2020 vs 2009
• Reduce CO2 emission by 17% within 2020 vs 2009
• Towards zero waste to landfill
• Reduce water withdrawal by 66% within 2020 vs 2009
SUSTAINABILITY LEVERS IN PIRELLI INDUSTRIAL PLAN
• PRODUCT INNOVATION

13 SUSTAINABILITY PLAN 2017-2020
with selected target to 2025
AGENDA
▬ PIRELLI SUSTAINABILITY MODEL
▬ ACHIEVEMENTS
▬ EVOLVING CONTEXT & KEY INDUSTRY TRENDS
▬ SUSTAINABILITY PLAN:
RETURN ON CAPITAL
• GROWTH
• PRODUCTIVITY
• GOVERNANCE & RISK MANAGEMENT

14 SUSTAINABILITY PLAN 2017-2020
with selected target to 2025
3.5%
Raw Materials Manufacturing Distribution Use End of Life
Global Warming Potential
0.2% 0.1% 2.5% 2.4%
3.9%
10.9%
38.3%
46.8%
GWP
WD Water Depletion
91.4%
GROWTH: ALIGNING STRATEGY TO FOOTPRINT Pirelli Carbon & Water Life Cycle Assessment

15 SUSTAINABILITY PLAN 2017-2020
with selected target to 2025
AN R&D ROADMAP
DRIVEN BY RENEWABLE* RAW MATERIALS
• INNOVATIVE NATURAL NANOFIBERS
for high performance tyres
• BIORESINS
research on new cost-effective grades
• TAILORED LIGNIN
• HIGH PERFORMANCE SILICA FROM RICE HUSK
• FUNCTIONALIZED POLYMERS
Research of innovative grades that guarantee reduced
environmental impact in terms of fuel consumption, greater
driving safety and improved production efficiency
*Renewable Natural Resources are natural resources that, after exploitation, can return to their previous stock levels by natural processes of growth or replenishment.
(source: OECD glossary definition at https://stats.oecd.org/glossary/detail.asp?ID=2290 )
AN R&D OPEN INNOVATION PLATFORM
BUILT ON A HOLISTIC MODEL
GROWTH: PRODUCT INNOVATION
Renewable Materials*
By 2025 (vs. 2017) for Specific Products Segments Pirelli aims to:
• Double the share of Renewable Raw Materials
• Reduce the Fossil-Based Materials by -30%

16 SUSTAINABILITY PLAN 2017-2020
with selected target to 2025
Electric
Autonomous
Connected
Shared
Homologation of «Green»
tyres (A-label RR), specifically
designed for electric cars
Integrated real-time analysis of
tyres and car performance, for
the safest autonomous drive
Cloud-based solutions for
fleets, enabling TCO reduction
and higher uptime of vehicles
Monitoring of tyres’ conditions,
including wear and load, via
smartphone or car electronics
TYRE HAS TO EVOLVE AS WELL
Runflat
Ultra Low Rolling Resistance
Pirelli Noise Cancelling System
Intercepting shifts in Market Expectations
GROWTH: PRODUCT INNOVATION
PIRELLI IS RESPONDING WITH SPECIFIC SOLUTIONS PRESTIGE & PREMIUM CAR EVOLVES IN 4 DIRECTIONS

17 SUSTAINABILITY PLAN 2017-2020
with selected target to 2025
Less CO2 emissions
Better living environment
Increased tyre life
Less impact on natural resources
Less rolling resistance
Less noise
Increased mileage
Less weight
* Focus on HIGH VALUE products including RIM18+ and «specialties» (Run-Flat, PNCS, Seal Inside with rim ≤ 17); ** 2017: stating year of Velo Business.
GROWTH: TYRE DEVELOPMENT
Car Moto Velo
**

18 SUSTAINABILITY PLAN 2017-2020
with selected target to 2025
PRODUCTIVITY
* Figures calculated in % by weighing the value of sales of Green Performance Products on the total value of Group sales; ** Focus on HIGH VALUE products including RIM18+ and «specialties» (Run-Flat, PNCS, Seal
Inside with rim ≤ 17)
GREEN
PERFORMANCE
REVENUES*
TOTAL RANGE
PRODUCTS 5
42 50
2009 2017 2020
+37
+8 >
• Figure calculated by applying the EU-label regulation to all tyre products sold WW
• Criteria to categorize the Green Performance products: Rolling Resistance and Wet Grip that falls ONLY in A, B, C classes
GREEN
PERFORMANCE
REVENUES
HIGH VALUE
PRODUCTS** 14
52 65
2009 2017 2020
+38
+13 >
GROWTH: GREEN PERFORMANCE REVENUES

19 SUSTAINABILITY PLAN 2017-2020
with selected target to 2025
AGENDA
▬ PIRELLI SUSTAINABILITY MODEL
▬ ACHIEVEMENTS
▬ EVOLVING CONTEXT & KEY INDUSTRY TRENDS
▬ SUSTAINABILITY PLAN:
RETURN ON CAPITAL
• GROWTH
• PRODUCTIVITY
• GOVERNANCE & RISK MANAGEMENT

20 SUSTAINABILITY PLAN 2017-2020
with selected target to 2025
PRODUCTIVITY
• Energy specific consumption in 2017 vs 2009: -15%
• Target 2020 : energy specific consumption -19% vs 2009
100 85 81
2009 2017 2020
-15 -4
ENERGY
SPECIFIC
CONSUMPTION*
2020 Target:
-19% vs 2009
-19%
* Value calculated in % and normalized on tons of produced tyres.
PRODUCTIVITY: PROCESS EFFICIENCY Energy Consumption

21 SUSTAINABILITY PLAN 2017-2020
with selected target to 2025
100 91
83
2009 2017 2020
-9 -8 CO2 SPECIFIC
EMISSION*
2020 Target:
-17% vs 2009
-17%
* Value calculated in % and normalized on tons of produced tyres; ** Internal evaluation based on Pirelli specific projects and International Energy Agency (IEA) data considering Pirelli geographical breakdown.
• CO2 specific emissions in 2017 vs 2009: -9%. Positive impacts from steam generated from biomass, and from the use of renewable electrical
energy;
• In 2017 around 43% of the electricity purchased by the Company came from renewable sources** (+5% vs 2016);
• Target 2020: CO2 specific emissions -17% vs 2009
PRODUCTIVITY: PROCESS EFFICIENCY CO2 Emissions & Renewables

22 SUSTAINABILITY PLAN 2017-2020
with selected target to 2025
PRODUCTIVITY
100
38 34
2009 2017 2020
-62
-4
WATER SPECIFIC
WITHDRAWAL*
2020 Target:
-66% vs 2009
-66%
• Water specific withdrawal in 2017 vs 2009: -62% (around 60 million cubic meters of water saved since 2009)
• Target 2020 : water specific withdrawal -66% vs 2009 (estimated 100 million cubic meters of water saved in the decade 2009-2020)
PRODUCTIVITY: PROCESS EFFICIENCY Water Withdrawal
* Value calculated in % and normalized on tons of produced tyres.

23 SUSTAINABILITY PLAN 2017-2020
with selected target to 2025
69
93 95
2009 2017 2020
+24 +2
WASTE
RECOVERY*
2020 Target:
recovery ≥95%
• Waste recovered (on total waste) in 2017 vs 2009: 93% (+24% vs. 2009)
• Target 2020 : towards no waste to landfill with a recovery rate ≥95%
PRODUCTIVITY: PROCESS EFFICIENCY Waste Recovery
* Value calculated in % and normalized on tons of produced tyres.

24 SUSTAINABILITY PLAN 2017-2020
with selected target to 2025
A Digital, Agile, Cross-functional and Responsible Mindset
supporting Pirelli long-term development
- Customer centric with
focus on products
- Trust and transparency
- Adaptiveness to respond
to changes and capture
value
- Work horizontally
- Open collaboration
- Agile to stress customer
centric and iterative
approach
- Sharing information
- Single source of truth
- Technical excellence
practices
- Flexible technology stack
CULTURE & EDUCATION WAY OF WORKING DATA & TECHNOLOGY
PRODUCTIVITY: HUMAN CAPITAL CULTURE Digital Transformation

25 SUSTAINABILITY PLAN 2017-2020
with selected target to 2025
DIALOGUE & ENGAGEMENT
• As from 2018: introduction of new “Sustainable Engagement Index” to measure employees satisfaction
OCCUPATIONAL HEALTH & SAFETY
• Safety Culture focused on reaching «Zero Accident »
• Target 2020: reduction of accident frequency index (IF) by -87% vs. 2009 (2017 Performance : -83% vs 2009)
REMUNERATION
• ESG Targets integrated in management* annual and long-term incentives
DIVERSITY
• Historically, a multi-cultural” Company: 89.5% employees work outside Italy
• 53% of Senior Management experienced at least an assignment abroad during her/his career
• Women in the Board of Directors: 29%
• Women in management positions: 21.6%
WELFARE
Group Welfare Guidelines applied throughout the Group
• 4 pillars: lifestyle, support for families, working life and working environment, leisure time
TRAINING & DEVELOPMENT
• Average training days per capita/year ≥ 7
• 90% of employees involved in at least 1 training program/year
• Focus on developing skills and competences strategically supporting digital transformation
*Applied to the generality of Group top management and executives.
PRODUCTIVITY: HUMAN CAPITAL GOVERNANCE

26 SUSTAINABILITY PLAN 2017-2020
with selected target to 2025
AGENDA
▬ PIRELLI SUSTAINABILITY MODEL
▬ ACHIEVEMENTS
▬ EVOLVING CONTEXT & KEY INDUSTRY TRENDS
▬ SUSTAINABILITY PLAN:
RETURN ON CAPITAL
• GROWTH
• PRODUCTIVITY
• GOVERNANCE & RISK MANAGEMENT

27 SUSTAINABILITY PLAN 2017-2020
with selected target to 2025
*Third Party Opinion released in February 2018 by SGS Italy S.p.A; **ESG: environmental, social, governance; ***CDP: Carbon Disclosure Project.
FOCUSING ON THE ORIGIN OF THE VALUE CHAIN
ESG assessment questionnaire Sustainability Clause
▬ >500 audits from 2009 to 2017
▬ checklist derived from SA8000®, sustainability
contractual obligations, local law
CONTRACTUAL STAGE ONSITE THIRD-PARTY AUDIT SELECTION +
QUALIFICATION/HOMOLOGATION ESG**
STEPS
ENGAGEMENT
• ESG** yearly training Campaign
• CDP*** Supply Chain 2020 target:
90% response rate of raw materials
suppliers (2017 rate: 71%)
• Joint Development Agreements on
Innovative and Renewable Raw
Materials.
• Sustainability Supplier Award
SUSTAINABLE NATURAL RUBBER POLICY
ONGOING CONSULTATION WITH
• NGOs
• Suppliers
• Customers
• Development Agencies
• Multilateral Organisations
GOVERNANCE & RISK MANAGEMENT: SUPPLY CHAIN SUSTAINABILITY
Full compliance of Purchasing Model with ISO 20400 provisions attested*
28 SUSTAINABILITY PLAN 2017-2020
with selected target to 2025
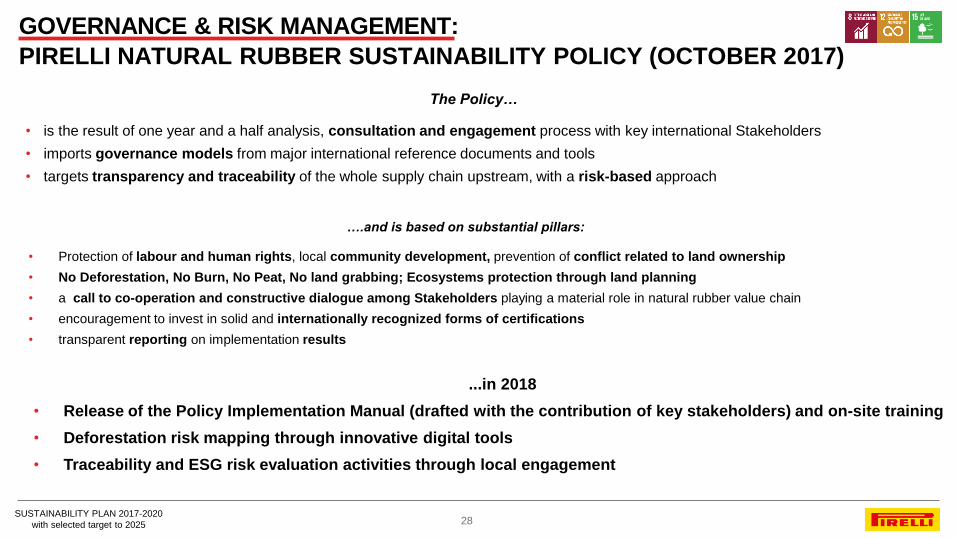
The Policy…
• is the result of one year and a half analysis, consultation and engagement process with key international Stakeholders
• imports governance models from major international reference documents and tools
• targets transparency and traceability of the whole supply chain upstream, with a risk-based approach
….and is based on substantial pillars:
• Protection of labour and human rights, local community development, prevention of conflict related to land ownership
• No Deforestation, No Burn, No Peat, No land grabbing; Ecosystems protection through land planning
• a call to co-operation and constructive dialogue among Stakeholders playing a material role in natural rubber value chain
• encouragement to invest in solid and internationally recognized forms of certifications
• transparent reporting on implementation results
...in 2018
• Release of the Policy Implementation Manual (drafted with the contribution of key stakeholders) and on-site training
• Deforestation risk mapping through innovative digital tools
• Traceability and ESG risk evaluation activities through local engagement
GOVERNANCE & RISK MANAGEMENT:
PIRELLI NATURAL RUBBER SUSTAINABILITY POLICY (OCTOBER 2017)

29 SUSTAINABILITY PLAN 2017-2020
with selected target to 2025
In line with Pirelli fundamental legacy,
traditions and entrepreneurial culture:
(i) technological know-how is to remain
owned by Pirelli and never to be
transferred to any third parties, and
(ii) Pirelli headquarters is to remain in
Milan (Italy)
Unless either resolution is approved by an
overwhelming majority representing 90% of
Pirelli shareholding
Pirelli By-Laws set forth that the corporate
governance of Pirelli is inspired to the
international best practices
One-fifth of the board is to be appointed
by minority shareholders
Internal committees are in line
with international best practices
independent directors with key role
are the majority in:
i. the Remuneration Committee;
ii. the Audit, Risks, Sustainability
and Corporate Governance
Committee;
iii. the Related-Party
Transactions Committee.
Members of the Board of Directors
are highly qualified, and have a
suitable mix of competences
Separation between the office of Chief
Executive Officer and Chairman
Pirelli Chief Executive Officer to lead top
management and ensure Pirelli business
culture continuity Half of the Board made up of
indipendent directors
Internal role of the Board of Directors
regarding the maximum number of
appointments deemed compatible with
the office as director of the Company
Appointment of a Director as
responsible of all sustainability matters
BY-LAWS BOARD OF DIRECTORS KEY PRINCIPLES
GOVERNANCE & RISK MANAGEMENT: CORPORATE GOVERNANCE (February 2018)
Leading role of Marco Tronchetti Provera in
the designation of his successor in 2020
30 SUSTAINABILITY PLAN 2017-2020
with selected target to 2025
*Some risk clusters may be trasversal to more areas
RE
PU
TA
TIO
NA
L A
ND
SU
ST
AIN
AB
ILIT
Y R
ISK
S
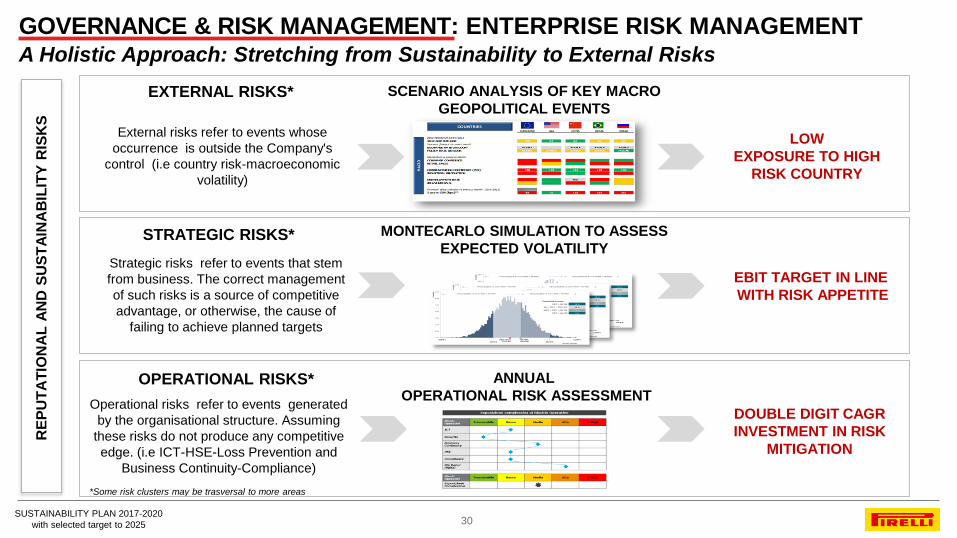
EXTERNAL RISKS*
External risks refer to events whose
occurrence is outside the Company's
control (i.e country risk-macroeconomic
volatility)
SCENARIO ANALYSIS OF KEY MACRO
GEOPOLITICAL EVENTS
LOW
EXPOSURE TO HIGH
RISK COUNTRY
Strategic risks refer to events that stem
from business. The correct management
of such risks is a source of competitive
advantage, or otherwise, the cause of
failing to achieve planned targets 0,0%
0,5%
1,0%
1,5%
2,0%
2,5%
3,0%
3,5%
Prob
abilit
y
AR PBIT [M EUR]
424 M €
74% probabilità di avere PBIT < AR PBIT 26% probabilità di avere PBIT > AR PBIT
Probabilità di avere:
PBIT < 540 M€ 19 %
540 < PBIT < 599,5 M€ 55 %
599,5 < PBIT < 660 M€ 25 %
PBIT > 660 M€ 1 %
718 M €
660 M €
PBIT atteso 572,6 M€
AR PBIT 599,5 M€
540 M €
0,0%
0,5%
1,0%
1,5%
2,0%
2,5%
3,0%
3,5%
Prob
abilit
y
AR PBIT [M EUR]
424 M €
74% probabilità di avere PBIT < AR PBIT 26% probabilità di avere PBIT > AR PBIT
Probabilità di avere:
PBIT < 540 M€ 19 %
540 < PBIT < 599,5 M€ 55 %
599,5 < PBIT < 660 M€ 25 %
PBIT > 660 M€ 1 %
718 M €
660 M €
PBIT atteso 572,6 M€
AR PBIT 599,5 M€
540 M €
EBIT TARGET IN LINE
WITH RISK APPETITE
Operational risks refer to events generated
by the organisational structure. Assuming
these risks do not produce any competitive
edge. (i.e ICT-HSE-Loss Prevention and
Business Continuity-Compliance)
MONTECARLO SIMULATION TO ASSESS
EXPECTED VOLATILITY
ANNUAL
OPERATIONAL RISK ASSESSMENT
DOUBLE DIGIT CAGR
INVESTMENT IN RISK
MITIGATION
STRATEGIC RISKS*
OPERATIONAL RISKS*
GOVERNANCE & RISK MANAGEMENT: ENTERPRISE RISK MANAGEMENT A Holistic Approach: Stretching from Sustainability to External Risks