Embed Size (px)
Citation preview
IndiaResearch
HDFC Securities Limited, Trade World, C. Wing, 1st Floor, Kamala Mills Compound, Senapati Bapat Marg,Lower Parel, Mumbai 400 013 Phone: (022) 66611700 Fax: (022) 2496 5066
Sanju VermaExecutive Director& Head - Institutional [email protected] 1859
Mukesh [email protected] 1753
June 20, 2008
Pipes & Tubes’ Sector
Pipes & Tubes’ Sector
Pipes ...Beyond the Hype
COMPANIES COVERED
Welspun Gujarat Stahl Rohren
PSL
Jindal Saw
Man Industries
Maharashtra Seamless
Ratnamani Metals & Tubes
ISMT
Pipes & TubesHDFC Securities
June 20, 2008 Page 2
FOREWORD
Worldwide, about 13 million metric tons of large diameter pipes were produced in 2007. But demand over the next few
years is expected to be about 60 million tons. Most industry observers agree that this is a strong market and will remain so
for the near future. Many mills are sold out through this year and well into the next. Ipsco and Sumitomo are reportedly sold
out through 2009. In fact, some predict that major pipeline projects could be delayed or called off because of high costs and
the difficulty of obtaining material.
So why is the market so strong? It’s not a mystery really. Energy prices are high. The rig count may have leveled off recently,
but it is still strong compared to historical levels. Oil and gas prices may drop from today’s highs. But oil is expected to
remain at or about $80 a barrel for at least the next ten years. Natural gas should hover at least at about $6-7 per million
British thermal units. Strong worldwide GDP growth is expected to support those prices, in the long run. Even if growth trails
off in Europe and North America, it should remain firm in developing and emerging markets. And with energy prices and
demand strong, massive pipeline projects are in the works around the world.
In Russia, for example, projects are underway to connect Siberia to energy markets on the Pacific Coast. China is laying
thousands of miles of pipes to connect natural gas in western provinces to coastal areas like Shanghai. In North America
alone, the Rockies Express pipeline is expected to gobble up almost 1,700 miles of pipe to run natural gas from Wyoming
to Ohio. Billions are also being spent on pipelines to transport crude from the oil sands of Western Canada to the U.S.
Midwest. The U.S. claims to be intent on cutting back dependence on supplies of foreign crude. And if it does, Canada’s oil
sands could be natural replacement. And while projects like the Rockies Express get a lot of attention, there are many
smaller projects underway that taken together will consume a lot of pipe. For example, there are five liquefied natural gas
terminals in the U.S. But there are already five more under construction. And several more will likely be built within the next
twenty years. And all of those projects will mean running steel pipe from local LNG terminals to Interstate pipelines like the
Rockies Express
Then there are also a few wild cards out there to consider. Legislation under consideration in the U.S. calls for the sequestration
of emissions like C02 by 2020. If those new restrictions are put into law, it could create demand for a whole new pipeline
infrastructure. If the laws go into effect in 2020, the pipelines would have to be in place beforehand. It’s a huge potential
market of over & above USD 200 bn approx.
We are confident that the main fundamentals behind the Pipes and Tubes sector remain ¨seamless¨. For the short to
medium term, this is reflected in the sector’s order book, which covers the sectoral activity for close to nine months. For the
longer term, one of the main drivers behind this industry is the development of hydrocarbon reserves; oil reserves represent
around 40 years of consumption and natural gas around 60 years. However, this is not a complete view of the resources: by
adding technical progress which should allow for improvements in recovery rates and discoveries in non explored zones
and non conventional oil and gas as the extra heavy oil from Canada and Venezuela, one can at least double these figures.
The development of these resources will be progressive as the time frame in energy is typically around ten years for
exploration and production projects, but also for transport infrastructure. Hence, the development of these resources will
require very high level of capital expenditure, and also great amounts of pipes and tubes.
Technical innovation is the key for the future of oil and gas development. Hence, supplying high quality and specialised
products will continue to be a differentiating factor in this industry. This is why Indian players will continue to improve their
product mix by introducing new products through ongoing investments allowing them to optimise their integrated production
process. With likely market of USD 100 bn and above for the period 2008-13E, we have raised our estimates for the coming
years based on the strength of the cycle due to ongoing investments in the sector. Along with this, companies are looking
to increase their operating leverage to further fuel growth in the energy cycle by supplying higher value added products
which will lead to higher returns and margins.
By Mukesh Agarwal
Pipes & TubesHDFC Securities
June 20, 2008 Page 3
Table of Contents
Page No.
Executive Summary .......................................................................................................................................................................... 4
Earnings Watch ................................................................................................................................................................................ 6
Comparative Valuation ..................................................................................................................................................................... 7
Swot Analysis .................................................................................................................................................................................... 8
Industry Matrix ................................................................................................................................................................................... 9
Porter’s Five Forces Model ............................................................................................................................................................. 10
Investment Case ............................................................................................................................................................................. 11
Industry Overview ............................................................................................................................................................................ 14
Overview of Global Capacities ....................................................................................................................................................... 17
Demand for API Pipe ...................................................................................................................................................................... 24
Upcoming Pipeline Investment ...................................................................................................................................................... 30
Key Future Projects ........................................................................................................................................................................ 32
API Mill Capacity ............................................................................................................................................................................. 33
Companies
Welspun Gujarat Stahl Rohren ...................................................................................................................................................... 39
PSL ................................................................................................................................................................................................. 52
Jindal Saw ...................................................................................................................................................................................... 60
Man Industries ................................................................................................................................................................................ 71
Maharashtra Seamless ................................................................................................................................................................. 80
Ratnamani Metals & Tubes ........................................................................................................................................................... 89
ISMT ................................................................................................................................................................................................ 98
Pipes & TubesHDFC Securities
June 20, 2008 Page 4
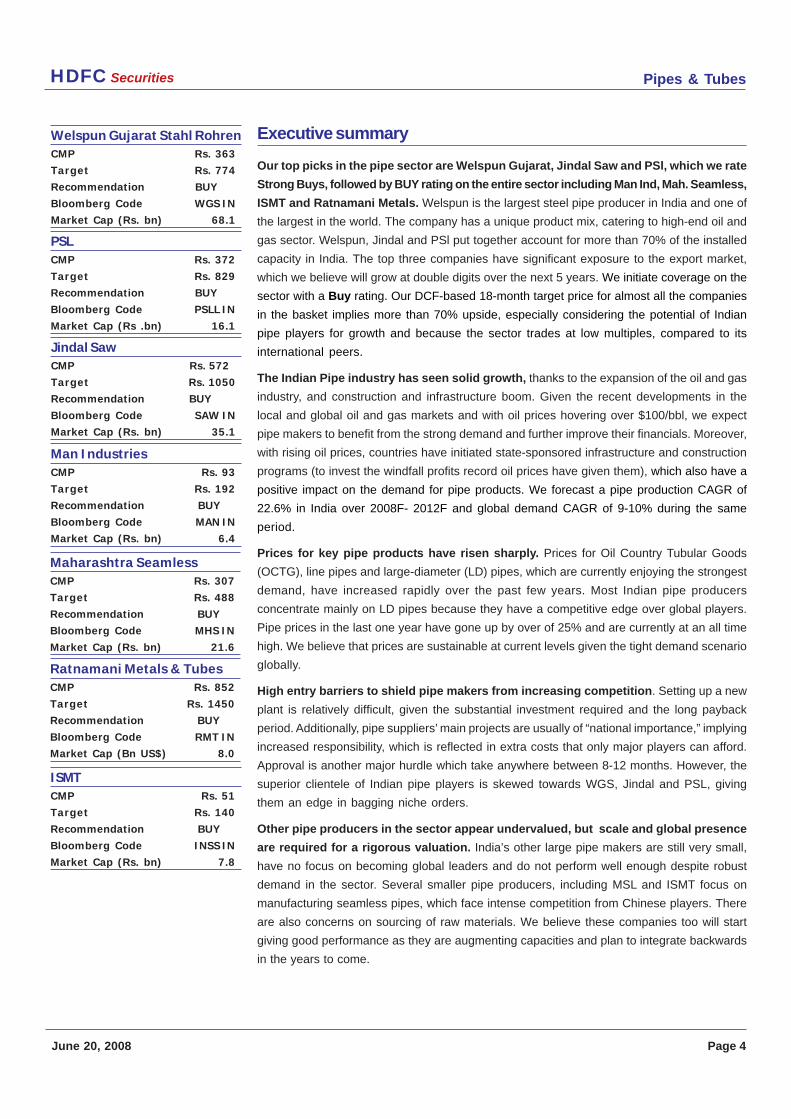
Executive summary
Our top picks in the pipe sector are Welspun Gujarat, Jindal Saw and PSl, which we rate
Strong Buys, followed by BUY rating on the entire sector including Man Ind, Mah. Seamless,
ISMT and Ratnamani Metals. Welspun is the largest steel pipe producer in India and one of
the largest in the world. The company has a unique product mix, catering to high-end oil and
gas sector. Welspun, Jindal and PSl put together account for more than 70% of the installed
capacity in India. The top three companies have significant exposure to the export market,
which we believe will grow at double digits over the next 5 years. We initiate coverage on the
sector with a Buy rating. Our DCF-based 18-month target price for almost all the companies
in the basket implies more than 70% upside, especially considering the potential of Indian
pipe players for growth and because the sector trades at low multiples, compared to its
international peers.
The Indian Pipe industry has seen solid growth, thanks to the expansion of the oil and gas
industry, and construction and infrastructure boom. Given the recent developments in the
local and global oil and gas markets and with oil prices hovering over $100/bbl, we expect
pipe makers to benefit from the strong demand and further improve their financials. Moreover,
with rising oil prices, countries have initiated state-sponsored infrastructure and construction
programs (to invest the windfall profits record oil prices have given them), which also have a
positive impact on the demand for pipe products. We forecast a pipe production CAGR of
22.6% in India over 2008F- 2012F and global demand CAGR of 9-10% during the same
period.
Prices for key pipe products have risen sharply. Prices for Oil Country Tubular Goods
(OCTG), line pipes and large-diameter (LD) pipes, which are currently enjoying the strongest
demand, have increased rapidly over the past few years. Most Indian pipe producers
concentrate mainly on LD pipes because they have a competitive edge over global players.
Pipe prices in the last one year have gone up by over of 25% and are currently at an all time
high. We believe that prices are sustainable at current levels given the tight demand scenario
globally.
High entry barriers to shield pipe makers from increasing competition. Setting up a new
plant is relatively difficult, given the substantial investment required and the long payback
period. Additionally, pipe suppliers’ main projects are usually of “national importance,” implying
increased responsibility, which is reflected in extra costs that only major players can afford.
Approval is another major hurdle which take anywhere between 8-12 months. However, the
superior clientele of Indian pipe players is skewed towards WGS, Jindal and PSL, giving
them an edge in bagging niche orders.
Other pipe producers in the sector appear undervalued, but scale and global presence
are required for a rigorous valuation. India’s other large pipe makers are still very small,
have no focus on becoming global leaders and do not perform well enough despite robust
demand in the sector. Several smaller pipe producers, including MSL and ISMT focus on
manufacturing seamless pipes, which face intense competition from Chinese players. There
are also concerns on sourcing of raw materials. We believe these companies too will start
giving good performance as they are augmenting capacities and plan to integrate backwards
in the years to come.
PSLCMP Rs. 372
Target Rs. 829
Recommendation BUY
Bloomberg Code PSLL IN
Market Cap (Rs .bn) 16.1
Jindal SawCMP Rs. 572
Target Rs. 1050
Recommendation BUY
Bloomberg Code SAW IN
Market Cap (Rs. bn) 35.1
Man IndustriesCMP Rs. 93
Target Rs. 192
Recommendation BUY
Bloomberg Code MAN IN
Market Cap (Rs. bn) 6.4
ISMTCMP Rs. 51
Target Rs. 140
Recommendation BUY
Bloomberg Code INSS IN
Market Cap (Rs. bn) 7.8
Maharashtra SeamlessCMP Rs. 307
Target Rs. 488
Recommendation BUY
Bloomberg Code MHS IN
Market Cap (Rs. bn) 21.6
Ratnamani Metals & TubesCMP Rs. 852
Target Rs. 1450
Recommendation BUY
Bloomberg Code RMT IN
Market Cap (Bn US$) 8.0
Welspun Gujarat Stahl RohrenCMP Rs. 363
Target Rs. 774
Recommendation BUY
Bloomberg Code WGS IN
Market Cap (Rs. bn) 68.1
Pipes & TubesHDFC Securities
June 20, 2008 Page 5
In our view, the main risk for the Indian pipe industry is recent government intervention in
the form of export taxes and non-availability of raw materials locally. Raw materials
account for more than 65% of the cost for most pipe manufacturers with imports a major
source for LD pipes. With no major domestic capacity (except Welspun) coming up specifically
for API grade plates, companies will have to still depend on imports to fulfill their requirements.
In case of LD pipes most of the revenues are generated from exports (more than 75%),
where the government recently imposed 10% export tax which was later withdrawn. We
believe this duty has been rolled back forever, but the pressure on government to contain
inflation may lead to reimposition of the tax in the future, impacting the profitability of companies.
In case of such an unlikely action, we believe the players will be able to pass on at least 50%
of the duty to their clients for future orders.
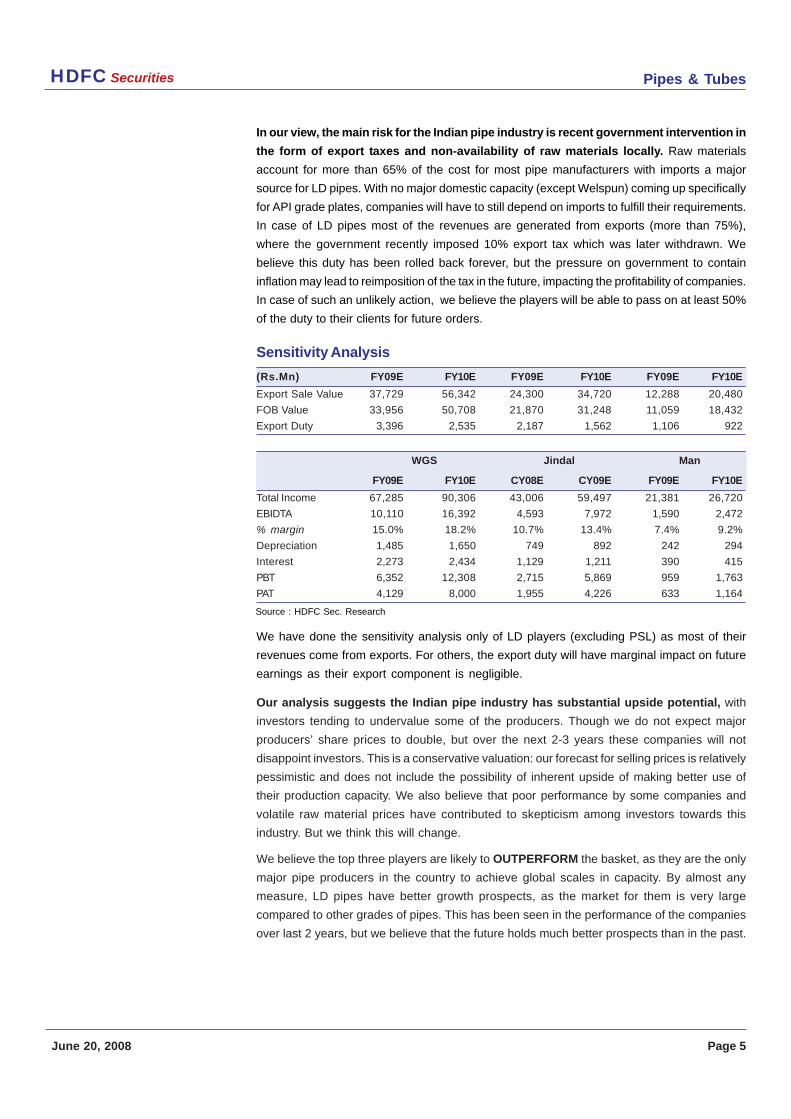
We have done the sensitivity analysis only of LD players (excluding PSL) as most of their
revenues come from exports. For others, the export duty will have marginal impact on future
earnings as their export component is negligible.
Our analysis suggests the Indian pipe industry has substantial upside potential, with
investors tending to undervalue some of the producers. Though we do not expect major
producers’ share prices to double, but over the next 2-3 years these companies will not
disappoint investors. This is a conservative valuation: our forecast for selling prices is relatively
pessimistic and does not include the possibility of inherent upside of making better use of
their production capacity. We also believe that poor performance by some companies and
volatile raw material prices have contributed to skepticism among investors towards this
industry. But we think this will change.
We believe the top three players are likely to OUTPERFORM the basket, as they are the only
major pipe producers in the country to achieve global scales in capacity. By almost any
measure, LD pipes have better growth prospects, as the market for them is very large
compared to other grades of pipes. This has been seen in the performance of the companies
over last 2 years, but we believe that the future holds much better prospects than in the past.
Sensitivity Analysis
(Rs.Mn) FY09E FY10E FY09E FY10E FY09E FY10E
Export Sale Value 37,729 56,342 24,300 34,720 12,288 20,480
FOB Value 33,956 50,708 21,870 31,248 11,059 18,432
Export Duty 3,396 2,535 2,187 1,562 1,106 922
WGS Jindal Man
FY09E FY10E CY08E CY09E FY09E FY10E
Total Income 67,285 90,306 43,006 59,497 21,381 26,720
EBIDTA 10,110 16,392 4,593 7,972 1,590 2,472
% margin 15.0% 18.2% 10.7% 13.4% 7.4% 9.2%
Depreciation 1,485 1,650 749 892 242 294
Interest 2,273 2,434 1,129 1,211 390 415
PBT 6,352 12,308 2,715 5,869 959 1,763
PAT 4,129 8,000 1,955 4,226 633 1,164
Source : HDFC Sec. Research
Pipes & TubesHDFC Securities
June 20, 2008 Page 6
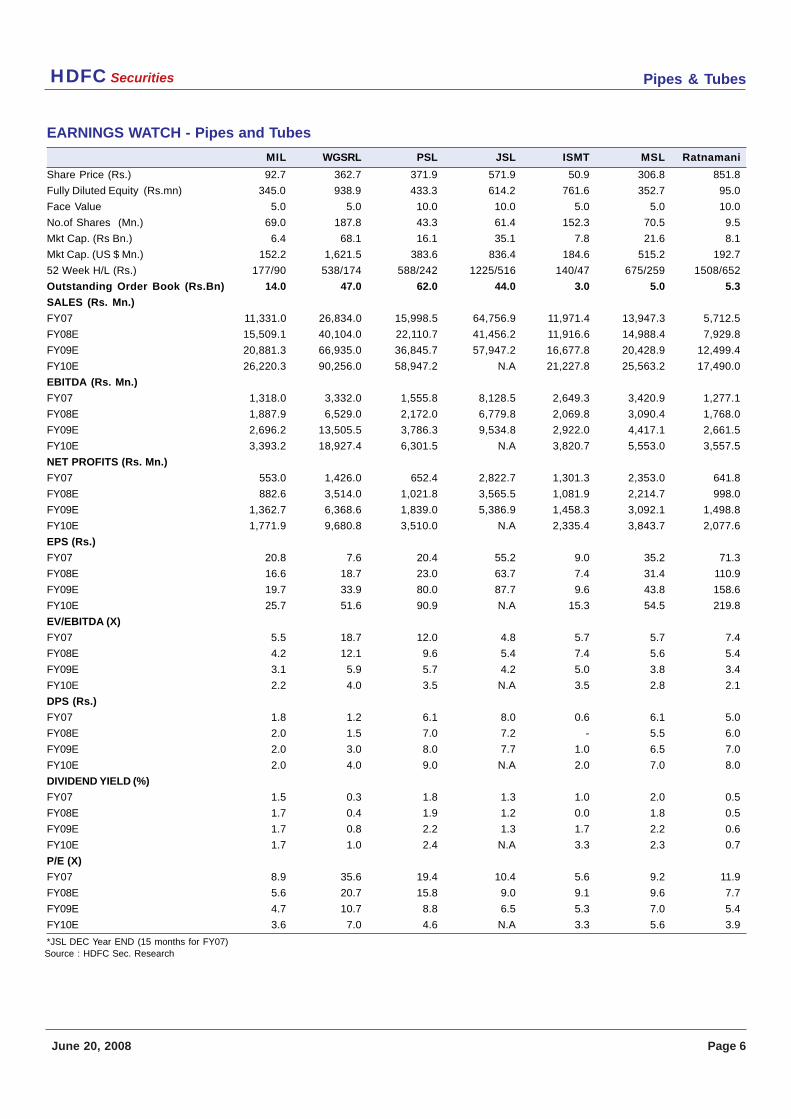
EARNINGS WATCH - Pipes and Tubes
MIL WGSRL PSL JSL ISMT MSL Ratnamani
Share Price (Rs.) 92.7 362.7 371.9 571.9 50.9 306.8 851.8
Fully Diluted Equity (Rs.mn) 345.0 938.9 433.3 614.2 761.6 352.7 95.0
Face Value 5.0 5.0 10.0 10.0 5.0 5.0 10.0
No.of Shares (Mn.) 69.0 187.8 43.3 61.4 152.3 70.5 9.5
Mkt Cap. (Rs Bn.) 6.4 68.1 16.1 35.1 7.8 21.6 8.1
Mkt Cap. (US $ Mn.) 152.2 1,621.5 383.6 836.4 184.6 515.2 192.7
52 Week H/L (Rs.) 177/90 538/174 588/242 1225/516 140/47 675/259 1508/652
Outstanding Order Book (Rs.Bn) 14.0 47.0 62.0 44.0 3.0 5.0 5.3
SALES (Rs. Mn.)
FY07 11,331.0 26,834.0 15,998.5 64,756.9 11,971.4 13,947.3 5,712.5
FY08E 15,509.1 40,104.0 22,110.7 41,456.2 11,916.6 14,988.4 7,929.8
FY09E 20,881.3 66,935.0 36,845.7 57,947.2 16,677.8 20,428.9 12,499.4
FY10E 26,220.3 90,256.0 58,947.2 N.A 21,227.8 25,563.2 17,490.0
EBITDA (Rs. Mn.)
FY07 1,318.0 3,332.0 1,555.8 8,128.5 2,649.3 3,420.9 1,277.1
FY08E 1,887.9 6,529.0 2,172.0 6,779.8 2,069.8 3,090.4 1,768.0
FY09E 2,696.2 13,505.5 3,786.3 9,534.8 2,922.0 4,417.1 2,661.5
FY10E 3,393.2 18,927.4 6,301.5 N.A 3,820.7 5,553.0 3,557.5
NET PROFITS (Rs. Mn.)
FY07 553.0 1,426.0 652.4 2,822.7 1,301.3 2,353.0 641.8
FY08E 882.6 3,514.0 1,021.8 3,565.5 1,081.9 2,214.7 998.0
FY09E 1,362.7 6,368.6 1,839.0 5,386.9 1,458.3 3,092.1 1,498.8
FY10E 1,771.9 9,680.8 3,510.0 N.A 2,335.4 3,843.7 2,077.6
EPS (Rs.)
FY07 20.8 7.6 20.4 55.2 9.0 35.2 71.3
FY08E 16.6 18.7 23.0 63.7 7.4 31.4 110.9
FY09E 19.7 33.9 80.0 87.7 9.6 43.8 158.6
FY10E 25.7 51.6 90.9 N.A 15.3 54.5 219.8
EV/EBITDA (X)
FY07 5.5 18.7 12.0 4.8 5.7 5.7 7.4
FY08E 4.2 12.1 9.6 5.4 7.4 5.6 5.4
FY09E 3.1 5.9 5.7 4.2 5.0 3.8 3.4
FY10E 2.2 4.0 3.5 N.A 3.5 2.8 2.1
DPS (Rs.)
FY07 1.8 1.2 6.1 8.0 0.6 6.1 5.0
FY08E 2.0 1.5 7.0 7.2 - 5.5 6.0
FY09E 2.0 3.0 8.0 7.7 1.0 6.5 7.0
FY10E 2.0 4.0 9.0 N.A 2.0 7.0 8.0
DIVIDEND YIELD (%)
FY07 1.5 0.3 1.8 1.3 1.0 2.0 0.5
FY08E 1.7 0.4 1.9 1.2 0.0 1.8 0.5
FY09E 1.7 0.8 2.2 1.3 1.7 2.2 0.6
FY10E 1.7 1.0 2.4 N.A 3.3 2.3 0.7
P/E (X)
FY07 8.9 35.6 19.4 10.4 5.6 9.2 11.9
FY08E 5.6 20.7 15.8 9.0 9.1 9.6 7.7
FY09E 4.7 10.7 8.8 6.5 5.3 7.0 5.4
FY10E 3.6 7.0 4.6 N.A 3.3 5.6 3.9
*JSL DEC Year END (15 months for FY07)Source : HDFC Sec. Research
Pipes & TubesHDFC Securities
June 20, 2008 Page 7
Co
mp
an
y N
am
eM
ark
et
Ca
p(B
n)
S
ale
s (B
n)
E
BIT
DA
Ma
rgin
E
V/E
BIT
DA
P
/E
Cu
rre
nt
20
07
20
08
20
09
E2
01
0E
20
07
20
08
20
09
(E)
20
10
(E)
20
07
20
08
20
09
(E)
20
10
(E)
20
07
20
08
20
09
(E)
20
10
(E)
De
ve
lop
ed
ma
rke
ts
TM
K2
94
.22
16
2.0
52
17
.88
25
3.2
12
74
.14
19
.5%
23
.1%
23
.0%
23
.2%
9.2
17
.17
6.1
95
.67
8.1
65
.17
7.0
75
.73
Ten
ari
s1
62
6.6
54
10
.97
48
4.5
35
06
.16
54
7.2
33
4.2
%3
4.2
%3
3.2
%3
2.7
%11
.62
10
.73
10
.56
9.9
31
9.0
81
7.5
81
5.8
91
5.3
1
Va
llou
rec
73
2.0
63
76
.31
41
8.4
54
32
.94
45
9.0
82
8.6
%2
4.4
%2
4.9
%2
5.6
%6
.15
7.0
76
.70
6.1
41
0.8
51
2.4
411
.70
10
.58
Gra
nt
Pri
de
co2
72
.34
84
.83
91
.50
96
.04
NA
39
.7%
40
.2%
49
.4%
NA
NA
NA
NA
NA
NA
NA
NA
NA
Tu
ba
ce
x6
5.9
74
1.0
84
8.5
85
1.0
85
1.5
91
5.0
%1
6.9
%1
8.7
%1
8.6
%11
.07
9.4
48
.09
8.0
61
7.3
911
.44
11.3
711
.63
Ste
elm
ak
ers
wit
h p
ipe
Pro
du
cti
on
Arc
elo
r M
itta
l6
41
9.6
64
09
6.7
05
28
9.8
65
42
8.8
85
57
8.2
31
8.9
%1
8.4
%1
8.0
%1
8.8
%9
.33
8.0
28
.00
7.4
51
4.1
611
.38
10
.98
9.6
7
US
Ste
el
93
0.7
66
58
.06
98
0.6
81
02
0.3
41
03
9.3
911
.2%
13
.9%
14
.2%
14
.4%
13
.25
7.6
37
.26
6.9
81
9.5
71
2.6
211
.59
13
.02
Sa
lzg
itte
r5
24
.56
62
2.0
28
00
.06
79
5.7
78
09
.41
14
.8%
12
.4%
12
.7%
12
.1%
4.1
94
.21
4.1
34
.22
9.1
38
.66
8.8
88
.99
Sa
nd
vik
78
7.5
35
31
.81
65
2.3
16
87
.75
70
0.3
62
0.7
%2
0.4
%2
0.6
%2
1.3
%7
.77
7.3
46
.89
6.5
111
.68
11.4
91
0.3
59
.91
Vo
est
alp
ine
57
5.9
43
96
.88
69
7.1
08
03
.84
83
0.8
41
8.7
%1
6.1
%1
8.1
%1
8.0
%9
.30
6.4
05
.74
5.5
511
.41
9.2
88
.87
8.3
5
Ind
ian
Pla
ye
rs
Jin
da
l S
aw
35
.13
64
.76
41
.46
57
.95
NA
12
%1
6%
16
.0%
NA
4.8
25
.45
4.2
5N
A1
0.3
68
.98
6.5
2N
A
Ra
tna
ma
ni
Me
tals
an
d T
ub
es
Ltd
.8
.09
5.7
17
.93
12
.50
17
.49
22
%2
2%
21
%2
0%
7.3
65
.43
3.3
82
.14
11.9
57
.68
5.3
73
.87
PS
L L
imit
ed
16
.11
16
.00
22
.11
36
.85
58
.95
10
%1
0%
10
%11
%11
.96
9.5
95
.71
3.5
11
9.4
01
5.7
78
.76
4.5
9
ISM
T7
.75
11.9
711
.92
16
.68
21
.23
22
%1
7%
18
%1
8%
5.6
67
.40
4.9
73
.46
5.6
59
.09
5.3
23
.32
Ma
ha
rash
tra
Se
am
less
21
.64
13
.95
14
.90
20
.43
25
.56
24
%2
1%
22
%2
2%
5.6
65
.63
3.8
02
.77
9.1
79
.63
7.0
05
.63
We
lsp
un
Gu
jara
t S
tah
l R
oh
ren
68
.10
26
.83
40
.10
66
.94
90
.26
12
%1
7%
20
%2
1%
18
.74
12
.14
5.9
24
.02
35
.57
20
.70
10
.69
7.0
3
Ma
n I
nd
ust
rie
s6
.39
11.3
31
5.5
12
0.8
92
6.2
21
2%
12
%1
3%
13
%5
.51
4.2
33
.13
2.2
38
.93
5.5
94
.69
3.6
1
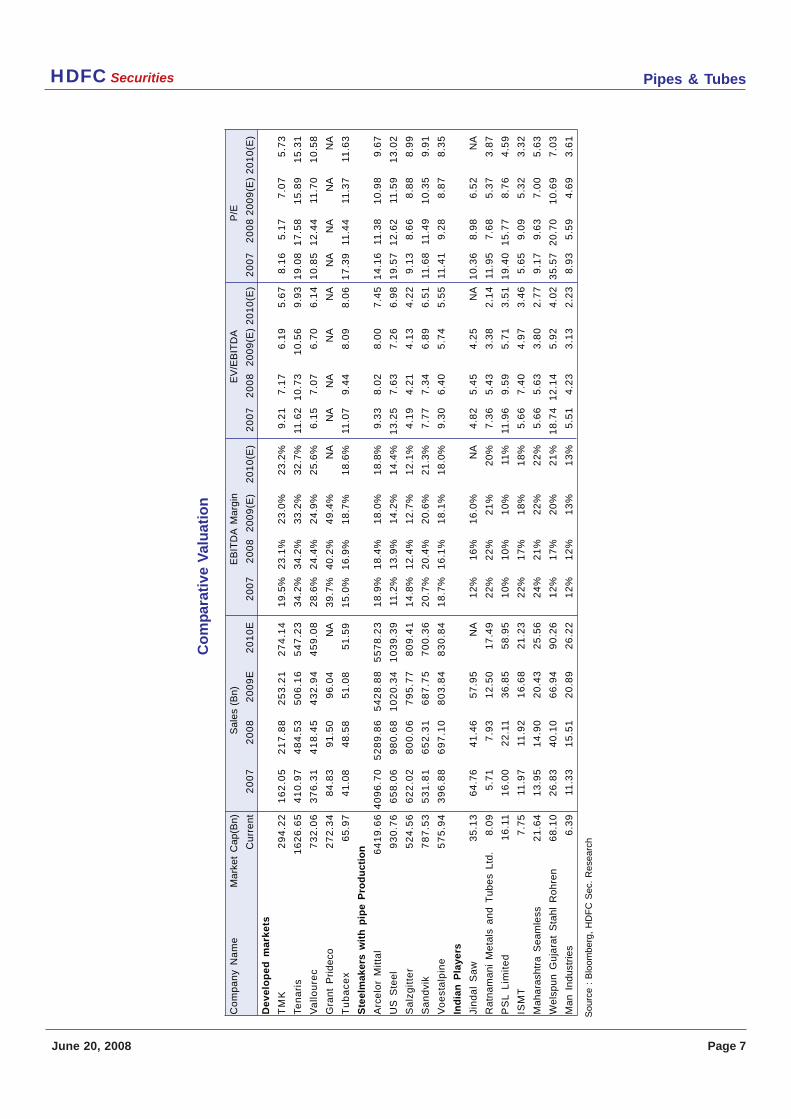
Co
mp
arat
ive
Val
uat
ion
Sou
rce
: B
loom
berg
, H
DF
C S
ec.
Res
earc
h
Pipes & TubesHDFC Securities
June 20, 2008 Page 8
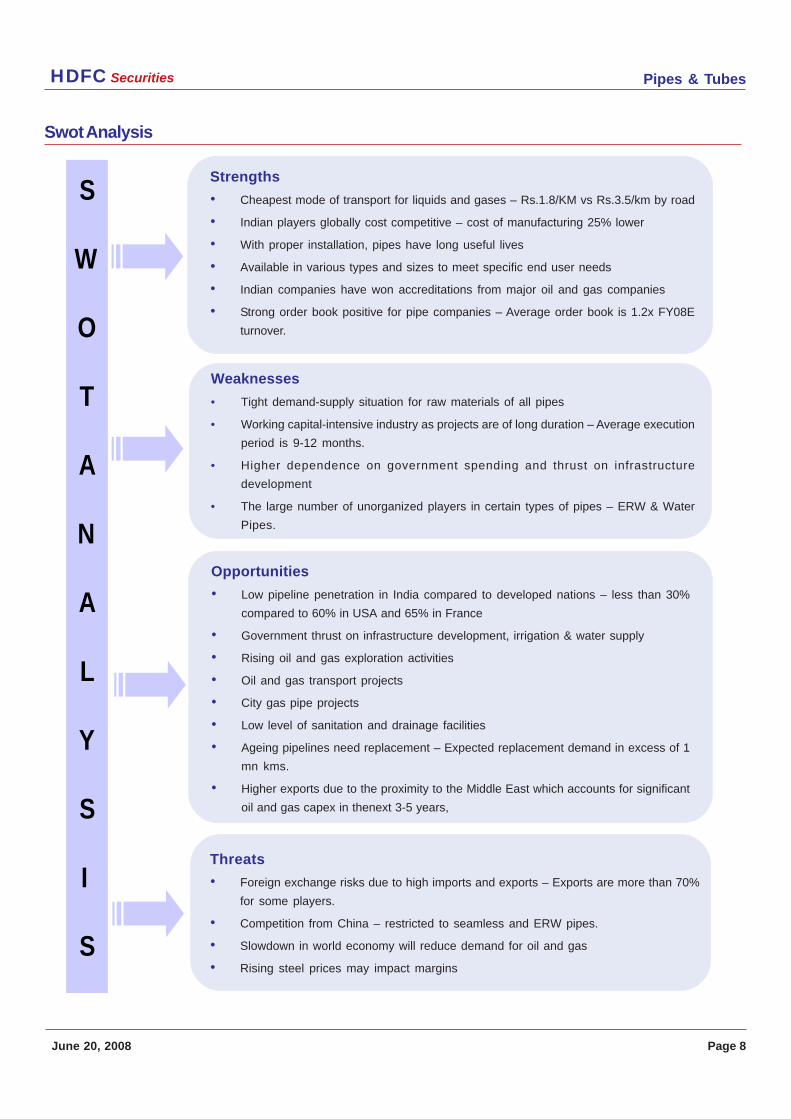
Swot Analysis
S
W
O
T
A
N
A L
Y
S I
S
Weaknesses
• Tight demand-supply situation for raw materials of all pipes
• Working capital-intensive industry as projects are of long duration – Average execution
period is 9-12 months.
• Higher dependence on government spending and thrust on infrastructure
development
• The large number of unorganized players in certain types of pipes – ERW & Water
Pipes.
Strengths
• Cheapest mode of transport for liquids and gases – Rs.1.8/KM vs Rs.3.5/km by road
• Indian players globally cost competitive – cost of manufacturing 25% lower
• With proper installation, pipes have long useful lives
• Available in various types and sizes to meet specific end user needs
• Indian companies have won accreditations from major oil and gas companies
• Strong order book positive for pipe companies – Average order book is 1.2x FY08E
turnover.
Opportunities
• Low pipeline penetration in India compared to developed nations – less than 30%
compared to 60% in USA and 65% in France
• Government thrust on infrastructure development, irrigation & water supply
• Rising oil and gas exploration activities
• Oil and gas transport projects
• City gas pipe projects
• Low level of sanitation and drainage facilities
• Ageing pipelines need replacement – Expected replacement demand in excess of 1
mn kms.
• Higher exports due to the proximity to the Middle East which accounts for significant
oil and gas capex in thenext 3-5 years,
Threats
• Foreign exchange risks due to high imports and exports – Exports are more than 70%
for some players.
• Competition from China – restricted to seamless and ERW pipes.
• Slowdown in world economy will reduce demand for oil and gas
• Rising steel prices may impact margins
Pipes & TubesHDFC Securities
June 20, 2008 Page 9
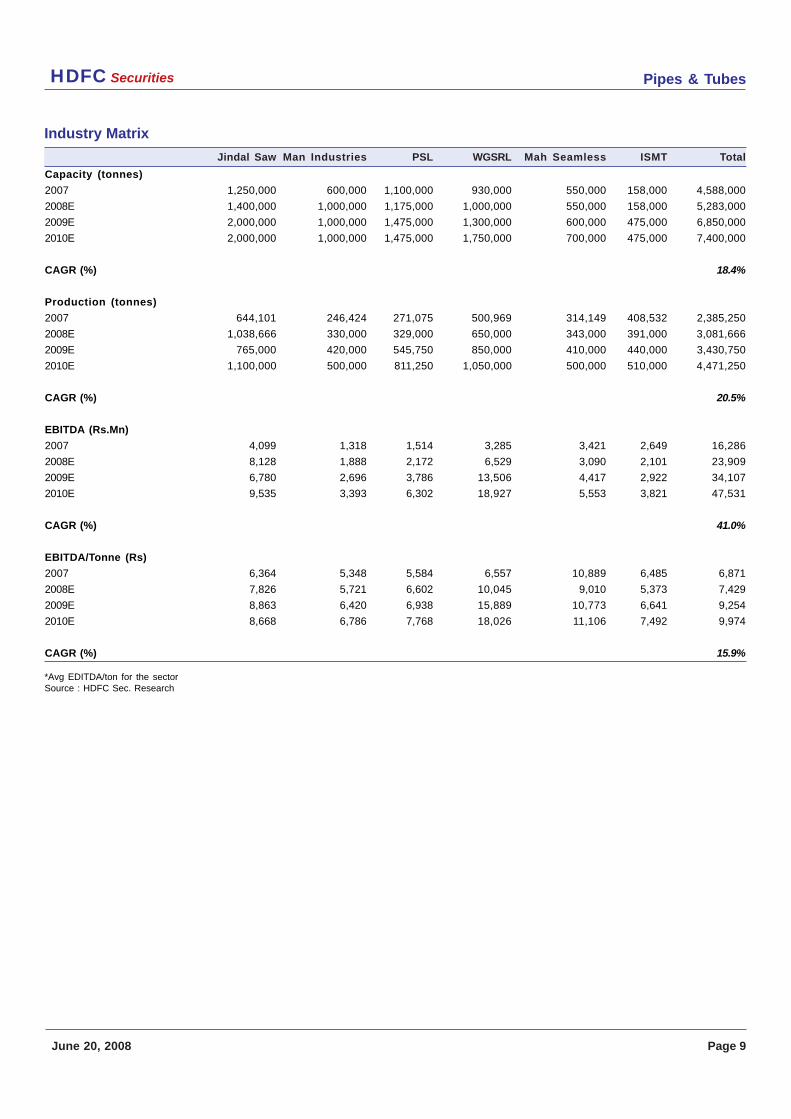
Industry Matrix
*Avg EDITDA/ton for the sector
Jindal Saw Man Industries PSL WGSRL Mah Seamless ISMT Total
Capacity (tonnes)
2007 1,250,000 600,000 1,100,000 930,000 550,000 158,000 4,588,000
2008E 1,400,000 1,000,000 1,175,000 1,000,000 550,000 158,000 5,283,000
2009E 2,000,000 1,000,000 1,475,000 1,300,000 600,000 475,000 6,850,000
2010E 2,000,000 1,000,000 1,475,000 1,750,000 700,000 475,000 7,400,000
CAGR (%) 18.4%
Production (tonnes)
2007 644,101 246,424 271,075 500,969 314,149 408,532 2,385,250
2008E 1,038,666 330,000 329,000 650,000 343,000 391,000 3,081,666
2009E 765,000 420,000 545,750 850,000 410,000 440,000 3,430,750
2010E 1,100,000 500,000 811,250 1,050,000 500,000 510,000 4,471,250
CAGR (%) 20.5%
EBITDA (Rs.Mn)
2007 4,099 1,318 1,514 3,285 3,421 2,649 16,286
2008E 8,128 1,888 2,172 6,529 3,090 2,101 23,909
2009E 6,780 2,696 3,786 13,506 4,417 2,922 34,107
2010E 9,535 3,393 6,302 18,927 5,553 3,821 47,531
CAGR (%) 41.0%
EBITDA/Tonne (Rs)
2007 6,364 5,348 5,584 6,557 10,889 6,485 6,871
2008E 7,826 5,721 6,602 10,045 9,010 5,373 7,429
2009E 8,863 6,420 6,938 15,889 10,773 6,641 9,254
2010E 8,668 6,786 7,768 18,026 11,106 7,492 9,974
CAGR (%) 15.9%
Source : HDFC Sec. Research
Pipes & TubesHDFC Securities
June 20, 2008 Page 10
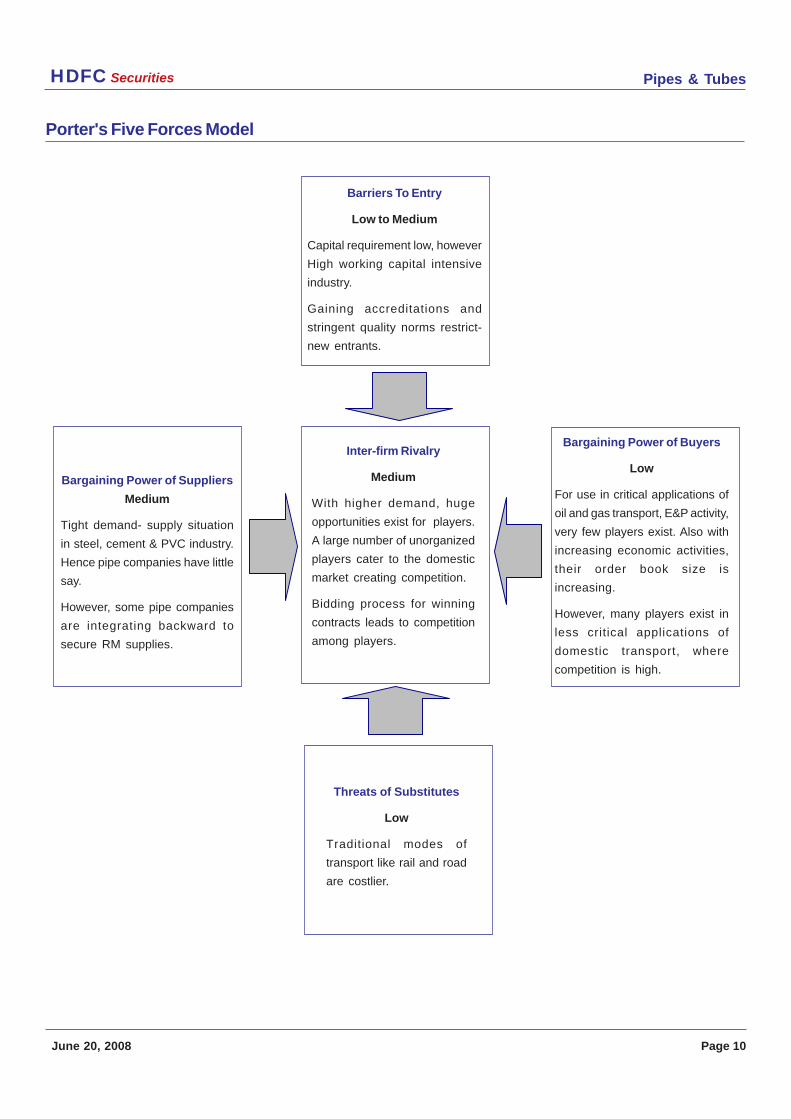
Porter's Five Forces Model
Barriers To Entry
Low to Medium
Capital requirement low, however
High working capital intensive
industry.
Gaining accreditations and
stringent quality norms restrict-
new entrants.
Bargaining Power of Suppliers
Medium
Tight demand- supply situation
in steel, cement & PVC industry.
Hence pipe companies have little
say.
However, some pipe companies
are integrating backward to
secure RM supplies.
Inter-firm Rivalry
Medium
With higher demand, huge
opportunities exist for players.
A large number of unorganized
players cater to the domestic
market creating competition.
Bidding process for winning
contracts leads to competition
among players.
Bargaining Power of Buyers
Low
For use in critical applications of
oil and gas transport, E&P activity,
very few players exist. Also with
increasing economic activities,
their order book size is
increasing.
However, many players exist in
less critical applications of
domestic transport, where
competition is high.
Threats of Substitutes
Low
Traditional modes of
transport like rail and road
are costlier.
Pipes & TubesHDFC Securities
June 20, 2008 Page 11
Investment Case
Tight Demand-Supply position
Line Pipe
We are more bullish on the line pipe segment going forward compared to the seamless
variety, mainly on account of the tight demand-supply position in the segment and the lack of
Chinese competition.
In line pipes too ERW finds applications for less than 20” needs. But as per industry estimates
more than 90% of the projects planned are of larger diameter pipes(more than 20”) where
LSAW & HSAW pipes have an edge.
The total likely installed capacity in the line pipe (large diameter) segment would be around
25 mn tons annually, based on the corresponding tonnage capacity available. The average
utilization level is around 60% of this capacity implying a production of 15 mn tons per
annum, compared to an estimated demand of 16.6 mn tons p.a. There is likely to be a tight
demand supply scenario in the line pipe segment going forward, until new capacities are
added.
The expected replacement demand for line pipes is much larger than for new pipes (approx
6-7 times). We believe, even if the companies were to add capacities going forward, demand
supply scenario is likely to be tight as more and more projects are being planned globally.
The line pipe demand would be huge and the global capacity available will still not be
enough to cater to the sort of expansion being envisaged.
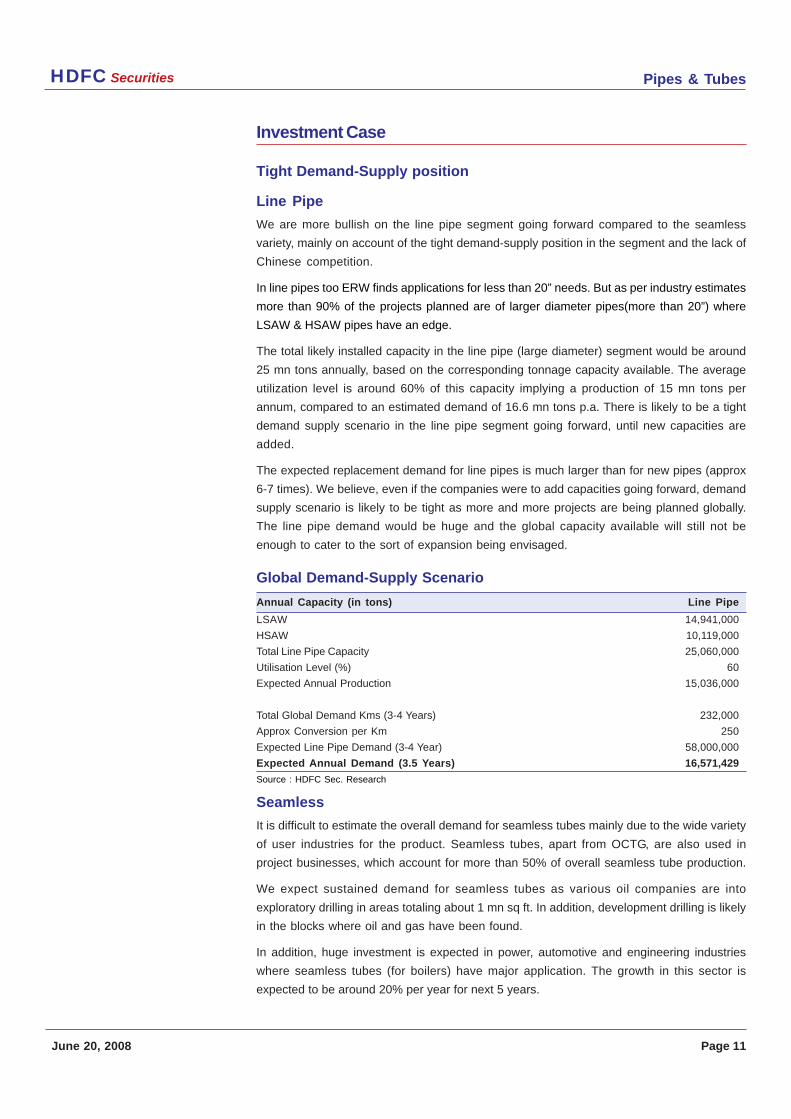
Global Demand-Supply Scenario
Annual Capacity (in tons) Line Pipe
LSAW 14,941,000
HSAW 10,119,000
Total Line Pipe Capacity 25,060,000
Utilisation Level (%) 60
Expected Annual Production 15,036,000
Total Global Demand Kms (3-4 Years) 232,000
Approx Conversion per Km 250
Expected Line Pipe Demand (3-4 Year) 58,000,000
Expected Annual Demand (3.5 Years) 16,571,429
Seamless
It is difficult to estimate the overall demand for seamless tubes mainly due to the wide variety
of user industries for the product. Seamless tubes, apart from OCTG, are also used in
project businesses, which account for more than 50% of overall seamless tube production.
We expect sustained demand for seamless tubes as various oil companies are into
exploratory drilling in areas totaling about 1 mn sq ft. In addition, development drilling is likely
in the blocks where oil and gas have been found.
In addition, huge investment is expected in power, automotive and engineering industries
where seamless tubes (for boilers) have major application. The growth in this sector is
expected to be around 20% per year for next 5 years.
Source : HDFC Sec. Research
Pipes & TubesHDFC Securities
June 20, 2008 Page 12
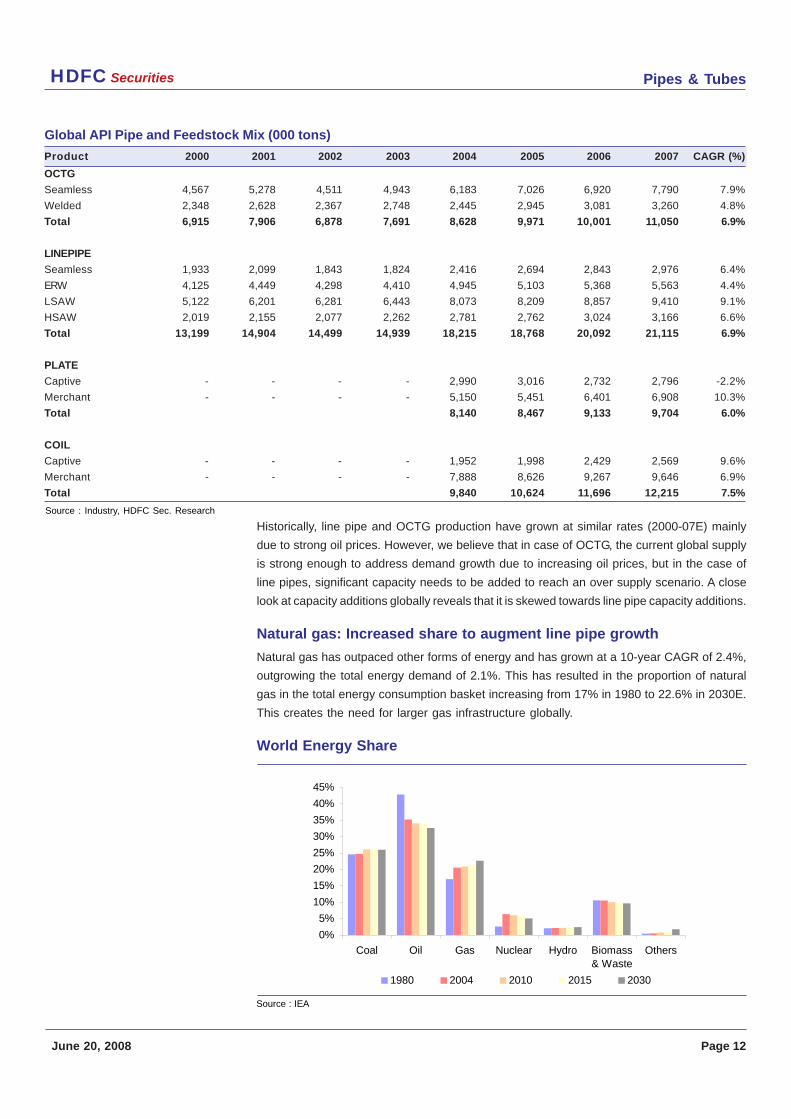
Product 2000 2001 2002 2003 2004 2005 2006 2007 CAGR (%)
OCTG
Seamless 4,567 5,278 4,511 4,943 6,183 7,026 6,920 7,790 7.9%
Welded 2,348 2,628 2,367 2,748 2,445 2,945 3,081 3,260 4.8%
Total 6,915 7,906 6,878 7,691 8,628 9,971 10,001 11,050 6.9%
LINEPIPE
Seamless 1,933 2,099 1,843 1,824 2,416 2,694 2,843 2,976 6.4%
ERW 4,125 4,449 4,298 4,410 4,945 5,103 5,368 5,563 4.4%
LSAW 5,122 6,201 6,281 6,443 8,073 8,209 8,857 9,410 9.1%
HSAW 2,019 2,155 2,077 2,262 2,781 2,762 3,024 3,166 6.6%
Total 13,199 14,904 14,499 14,939 18,215 18,768 20,092 21,115 6.9%
PLATE
Captive - - - - 2,990 3,016 2,732 2,796 -2.2%
Merchant - - - - 5,150 5,451 6,401 6,908 10.3%
Total 8,140 8,467 9,133 9,704 6.0%
COIL
Captive - - - - 1,952 1,998 2,429 2,569 9.6%
Merchant - - - - 7,888 8,626 9,267 9,646 6.9%
Total 9,840 10,624 11,696 12,215 7.5%
Global API Pipe and Feedstock Mix (000 tons)
Historically, line pipe and OCTG production have grown at similar rates (2000-07E) mainly
due to strong oil prices. However, we believe that in case of OCTG, the current global supply
is strong enough to address demand growth due to increasing oil prices, but in the case of
line pipes, significant capacity needs to be added to reach an over supply scenario. A close
look at capacity additions globally reveals that it is skewed towards line pipe capacity additions.
Natural gas: Increased share to augment line pipe growth
Natural gas has outpaced other forms of energy and has grown at a 10-year CAGR of 2.4%,
outgrowing the total energy demand of 2.1%. This has resulted in the proportion of natural
gas in the total energy consumption basket increasing from 17% in 1980 to 22.6% in 2030E.
This creates the need for larger gas infrastructure globally.
World Energy Share
Source : Industry, HDFC Sec. Research
Source : IEA
0%
5%
10%
15%
20%
25%
30%
35%
40%
45%
Coal Oil Gas Nuclear Hydro Biomass& Waste
Others
1980 2004 2010 2015 2030
Pipes & TubesHDFC Securities
June 20, 2008 Page 13
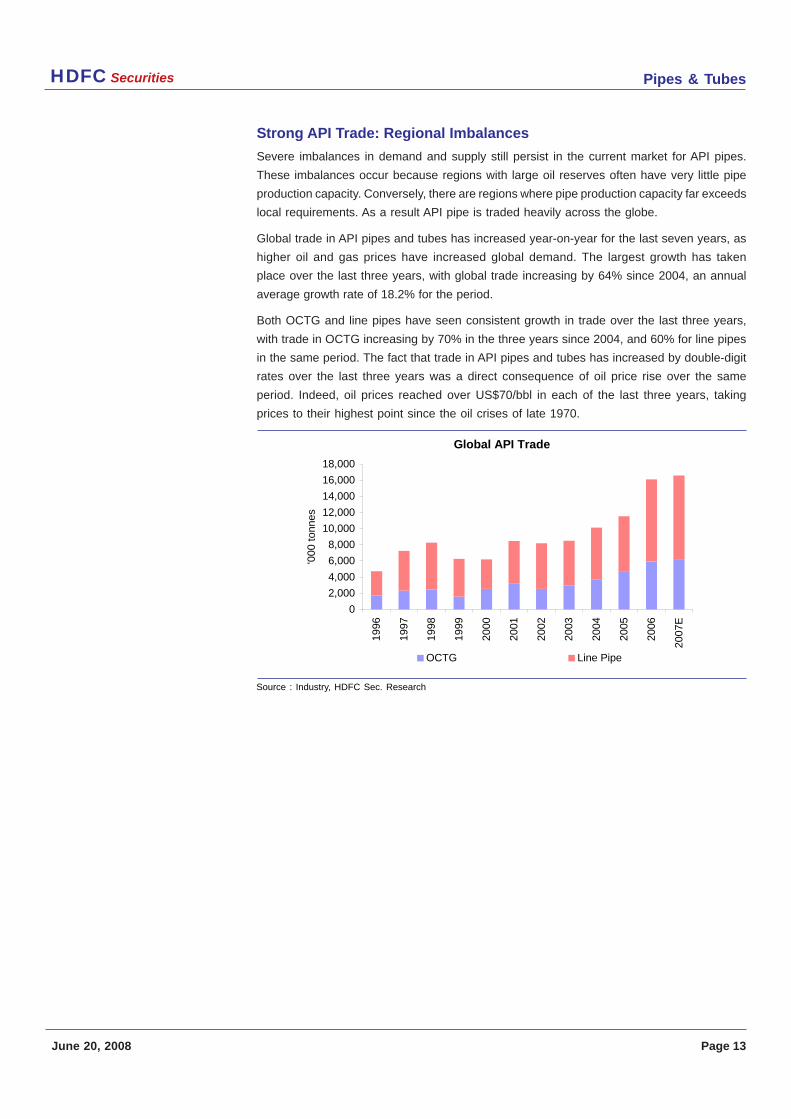
Strong API Trade: Regional Imbalances
Severe imbalances in demand and supply still persist in the current market for API pipes.
These imbalances occur because regions with large oil reserves often have very little pipe
production capacity. Conversely, there are regions where pipe production capacity far exceeds
local requirements. As a result API pipe is traded heavily across the globe.
Global trade in API pipes and tubes has increased year-on-year for the last seven years, as
higher oil and gas prices have increased global demand. The largest growth has taken
place over the last three years, with global trade increasing by 64% since 2004, an annual
average growth rate of 18.2% for the period.
Both OCTG and line pipes have seen consistent growth in trade over the last three years,
with trade in OCTG increasing by 70% in the three years since 2004, and 60% for line pipes
in the same period. The fact that trade in API pipes and tubes has increased by double-digit
rates over the last three years was a direct consequence of oil price rise over the same
period. Indeed, oil prices reached over US$70/bbl in each of the last three years, taking
prices to their highest point since the oil crises of late 1970.
Global API Trade
0
2,000
4,000
6,000
8,000
10,000
12,000
14,000
16,000
18,000
1996
1997
1998
1999
2000
2001
2002
2003
2004
2005
2006
2007
E
'000
ton
nes
OCTG Line Pipe
Source : Industry, HDFC Sec. Research
Pipes & TubesHDFC Securities
June 20, 2008 Page 14
Industry Overview
The industry classified for pipes and tubes for our study includes
• Oil Country Tubular Goods (OCTG) Seamless & ERW.
• Line Pipes (LSAW/HSAW/ERW).
• Flat-rolled steel feedstock (Plate & Coil).
The basic distinction between OCTG and line pipe is one of end-use. OCTG consists of oil
and gas well tubing and casing, as well as drill pipe. Line pipe is fabricated into pipelines for
the transportation of oil, gas, and petroleum products. Together, these two families of products
are termed “API grade” pipes, because the American Petroleum Institute provides the
internationally accepted quality benchmark for such products and awards its certification to
most producers worldwide of these pipes.
Apart from API products, pipe mills globally may also produce a portion of their output as
pipes of different quality and for differing end-uses, from structural pipe to line pipe for the
transportation of water.
API Certifications
The primary certification obtained by most API product manufacturers across different products
includes.
• API 5CT for OCTG Tubing and Casing.
• API 5D for Drill Pipes.
• API 5L for Line Pipes.
Beyond the basic API 5CT, 5D or 5L standards, there are a variety of quality grades recognised
by the market, an increasing share of which have been developed by leading manufacturers
of API tubular products. The standard grade range for both OCTG and line pipes is based on
a number denoting the yield strength in thousands of pounds per square inch (ksi). Thus,
common OCTG grades range from H-40 to P-110, while line pipes range from X42 to X80,
apart from newer higher-strength grades such as X100 and X120.
OCTG
By application, OCTG subdivides into tubing, casing and drill pipes. Most mills manufacture
both tubing and casing.
Tubing is used to conduct the extracted oil and gas to the surface after drilling, while casing
provides an outside protection cover. Hence tubing has the smaller diameter. The common
steel industry definition is to classify as tubing OCTG up to 4.5", although some offshore oil
operators see the cut-off at 5".
Casing encompasses diameters above this, extending up to around 20" for the larger-
diameter OCTG. Drill Pipe is used to transmit rotary motion to the drill bit, and is the only type
of OCTG that is reusable. It is produced by a small number of mills and accounts for well
under 5% of overall OCTG output.
For casing and tubing, welded pipe competes with seamless, offering a generally lower cost
product, despite welded OCTG’s increased acceptance by the oil industry. Seamless products
still account for approximately two-thirds of the OCTG market. Unlike casing and tubing, drill
pipe is exclusively seamless because of the much greater strength required of this product.
Pipes & TubesHDFC Securities
June 20, 2008 Page 15
Line Pipe
Small Diameter
A very approximate distinction can be made between a “small-diameter” line pipe market,
up to around 20”, and the “large-diameter” market extending from 20” up to around 80”.
Broadly speaking, the two key types of pipes most suitable for the small-diameter segment
are seamless line pipes and electro-resistance welded (ERW) line pipes. It is worth noting
that ERW is also the manufacturing method used to make welded OCTG, and in a similar
way a seamless pipe mill is likely to be active both in OCTG and line pipe manufacture. The
presence of ERW and seamless pipes begin to decrease as the diameter rises above 20”
because of constraints inherent in the manufacturing method, and also because in the
welding of these pipes, coil width sets the limit on the diameter of the pipe. Until relatively
recently, 16” was the upper limit for ERW pipes, but the increasing availability of wide coils
has prompted an upgrade in ERW diameter capabilities.
Currently, many ERW pipe mills worldwide can produce to diameters of 20”; some mills’
range extend to 24” and in two cases– JFE in Japan and Hysco (formerly known as Hyundai
Pipe) in South Korea – pipes can be produced up to 26”. To further stress upon the absence
of clear boundaries, one of the key large diameter pipe technologies, LSAW, can be used to
make pipes as small as 16”. Indeed, within a crossover band of diameters around 20” all
seamless and welded pipe techniques can compete.
Large Diameter
Most of the large diameter market for over 20” falls under two different welded pipe-
manufacturing techniques. The first of these is longitudinal submerged-arc welded (LSAW)
pipe, which uses reversing mill plate as the feedstock. The alternative is Spiral Welding
(HSAW), which gets around the limitations of coil width by welding the coil helicoidally.
LSAW pipe consists in turn of three competing technologies. By far, the most widely used to
date is the “UOE” process, denoting three major steps in the pipe’s forming, namely the
bending of the plate into a U shape, then a roughly circular section, with welding prior to the
pipe’s final expansion. The UOE process is considered the most efficient operationally, but
has relatively high capital costs and thus requires a minimum operating scale of some
500,000 tpy.
UOE thus competes as a solution with the Three-Roll-Bending Process, which is a popular
choice in some Asian and Middle Eastern countries. Roll-bending’s lower fixed costs allow
economical operation at much lower volumes than for UOE. A third, and much less widely
used alternative is Press Bending, a powerful but low-throughput process whose niche is to
be found in the manufacture of technically difficult sections of pipe.
Spiral-welded’s competitive position relative to LSAW, is in some ways akin to welded OCTG’s
to seamless. Coil-based manufacture of spiral-welded pipe can enjoy a cost advantage over
LSAW, which requires discrete plates. But for high pressure (typically offshore) applications,
LSAW pipe is generally preferred on performance grounds, but even so there is a segment
of the market, particularly for onshore oil and gas pipelines, where the two types of pipes can
compete. Even in such applications, however, the perception of some project specifiers that
spiral-welded’s larger seam area represents an increased risk will tend to offset its cost
advantage. There is no universally accepted method for measuring this risk, and regional
and company preferences will heavily influence the choice of material that is eventually used.
Pipes & TubesHDFC Securities
June 20, 2008 Page 16
LSAW vs. HSAW
So what will it be? Longitudinal welded (LSAW) or spiral welded (HSAW)? According to most
product users, LSAW is still the king. It’s made from plate, it’s thicker, and therefore can
handle the higher pressures often needed for natural gas pipelines. And many believe that
there will be more demand for natural gas than oil in the long term, especially if oil stays at
$100 a barrel.
The problem, of course, is that LSAW is much more expensive than HSAW. Let’s say
commodity plate sells on an average for about $1,400 a ton. HSAW pipe is made from hot
rolled coil, which sells for roughly $1,100 a ton.
HSAW has much thinner walls than LSAW, which increases the risk of ruptures and other
problems. But to reduce costs, some are willing to take on those added risks. And there have
also been reports that safety waivers could be approved for some new pipeline projects. By
reducing pressure requirements, the waivers may in effect allow producers to use HSAW
instead of LSAW for some pipeline projects.
HSAW also has other advantages. It can be made with a larger outside diameter than LSAW,
which means it can push more product through. And it can be made in longer sections. With
lower costs and potentially relaxed regulations, HSAW appears to be gaining traction globally.
Pipes & TubesHDFC Securities
June 20, 2008 Page 17
Overview of Global Capacities
Pipes
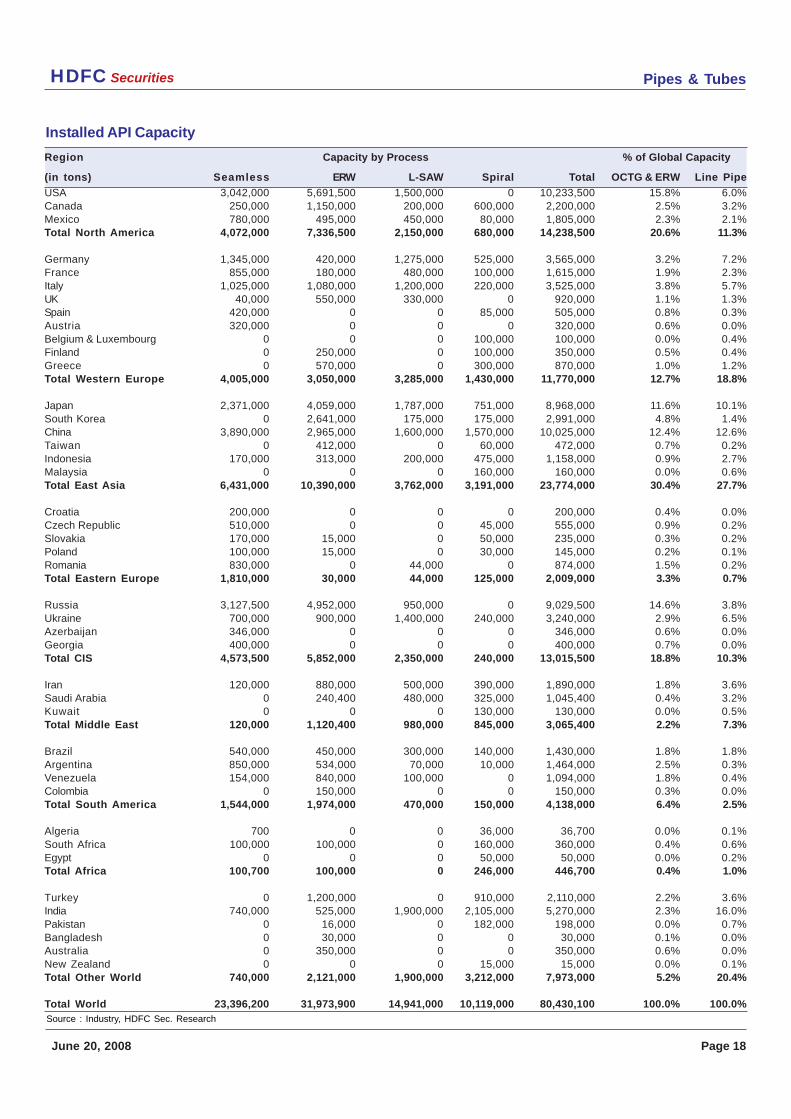
Potential capacities for API pipe production in 2007 are given in the following table and in
mill-by-mill break-up at the end. The numbers refer to total installed capacities for the
production of pipes by a given manufacturing technique, for instance seamless. These
capacities may be used for the manufacture of API or non-API grade pipes, and this output
mix will vary depending on market conditions.
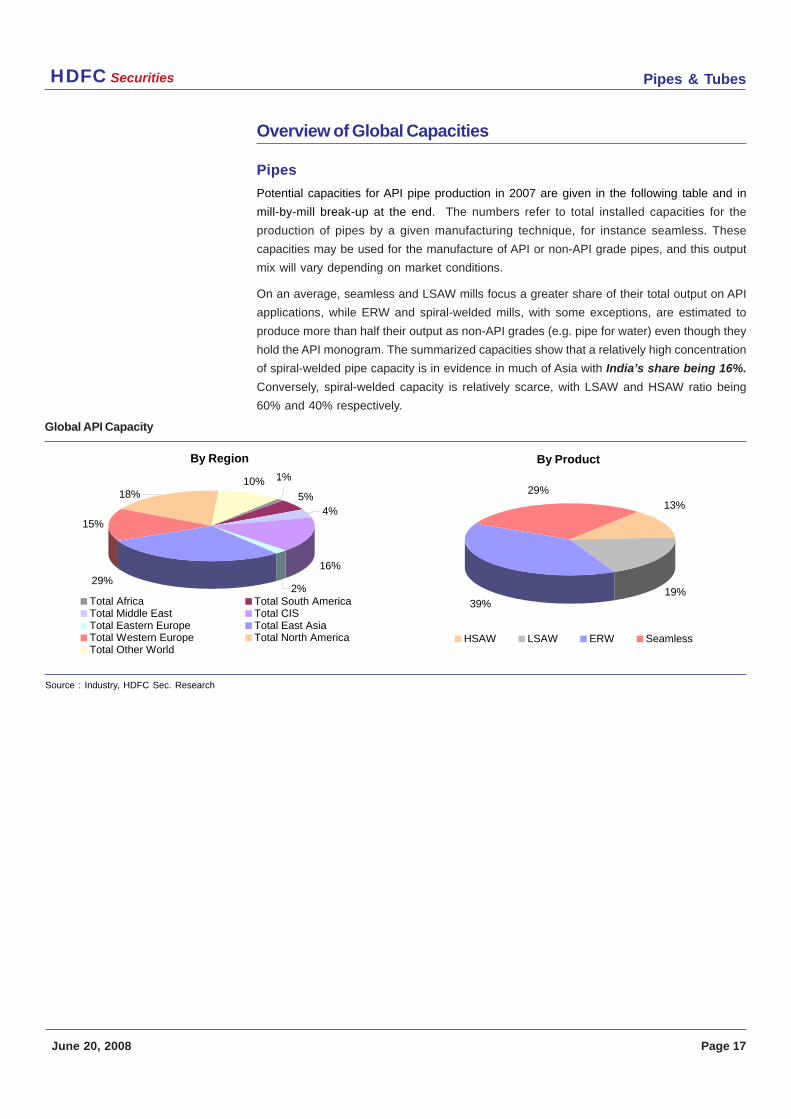
On an average, seamless and LSAW mills focus a greater share of their total output on API
applications, while ERW and spiral-welded mills, with some exceptions, are estimated to
produce more than half their output as non-API grades (e.g. pipe for water) even though they
hold the API monogram. The summarized capacities show that a relatively high concentration
of spiral-welded pipe capacity is in evidence in much of Asia with India’s share being 16%.
Conversely, spiral-welded capacity is relatively scarce, with LSAW and HSAW ratio being
60% and 40% respectively.
By Region
15%
5%
1%
4%
16%
2%
10%18%
29%
Total Africa Total South AmericaTotal Middle East Total CISTotal Eastern Europe Total East AsiaTotal Western Europe Total North AmericaTotal Other World
By Product
29%
39%
13%
19%
HSAW LSAW ERW Seamless
Global API Capacity
Source : Industry, HDFC Sec. Research
Pipes & TubesHDFC Securities
June 20, 2008 Page 18
Region Capacity by Process % of Global Capacity
(in tons) Seamless ERW L-SAW Spiral Total OCTG & ERW Line Pipe
USA 3,042,000 5,691,500 1,500,000 0 10,233,500 15.8% 6.0%Canada 250,000 1,150,000 200,000 600,000 2,200,000 2.5% 3.2%Mexico 780,000 495,000 450,000 80,000 1,805,000 2.3% 2.1%Total North America 4,072,000 7,336,500 2,150,000 680,000 14,238,500 20.6% 11.3% Germany 1,345,000 420,000 1,275,000 525,000 3,565,000 3.2% 7.2%France 855,000 180,000 480,000 100,000 1,615,000 1.9% 2.3%Italy 1,025,000 1,080,000 1,200,000 220,000 3,525,000 3.8% 5.7%UK 40,000 550,000 330,000 0 920,000 1.1% 1.3%Spain 420,000 0 0 85,000 505,000 0.8% 0.3%Austria 320,000 0 0 0 320,000 0.6% 0.0%Belgium & Luxembourg 0 0 0 100,000 100,000 0.0% 0.4%Finland 0 250,000 0 100,000 350,000 0.5% 0.4%Greece 0 570,000 0 300,000 870,000 1.0% 1.2%Total Western Europe 4,005,000 3,050,000 3,285,000 1,430,000 11,770,000 12.7% 18.8% Japan 2,371,000 4,059,000 1,787,000 751,000 8,968,000 11.6% 10.1%South Korea 0 2,641,000 175,000 175,000 2,991,000 4.8% 1.4%China 3,890,000 2,965,000 1,600,000 1,570,000 10,025,000 12.4% 12.6%Taiwan 0 412,000 0 60,000 472,000 0.7% 0.2%Indonesia 170,000 313,000 200,000 475,000 1,158,000 0.9% 2.7%Malaysia 0 0 0 160,000 160,000 0.0% 0.6%Total East Asia 6,431,000 10,390,000 3,762,000 3,191,000 23,774,000 30.4% 27.7% Croatia 200,000 0 0 0 200,000 0.4% 0.0%Czech Republic 510,000 0 0 45,000 555,000 0.9% 0.2%Slovakia 170,000 15,000 0 50,000 235,000 0.3% 0.2%Poland 100,000 15,000 0 30,000 145,000 0.2% 0.1%Romania 830,000 0 44,000 0 874,000 1.5% 0.2%Total Eastern Europe 1,810,000 30,000 44,000 125,000 2,009,000 3.3% 0.7% Russia 3,127,500 4,952,000 950,000 0 9,029,500 14.6% 3.8%Ukraine 700,000 900,000 1,400,000 240,000 3,240,000 2.9% 6.5%Azerbaijan 346,000 0 0 0 346,000 0.6% 0.0%Georgia 400,000 0 0 0 400,000 0.7% 0.0%Total CIS 4,573,500 5,852,000 2,350,000 240,000 13,015,500 18.8% 10.3% Iran 120,000 880,000 500,000 390,000 1,890,000 1.8% 3.6%Saudi Arabia 0 240,400 480,000 325,000 1,045,400 0.4% 3.2%Kuwait 0 0 0 130,000 130,000 0.0% 0.5%Total Middle East 120,000 1,120,400 980,000 845,000 3,065,400 2.2% 7.3% Brazil 540,000 450,000 300,000 140,000 1,430,000 1.8% 1.8%Argentina 850,000 534,000 70,000 10,000 1,464,000 2.5% 0.3%Venezuela 154,000 840,000 100,000 0 1,094,000 1.8% 0.4%Colombia 0 150,000 0 0 150,000 0.3% 0.0%Total South America 1,544,000 1,974,000 470,000 150,000 4,138,000 6.4% 2.5% Algeria 700 0 0 36,000 36,700 0.0% 0.1%South Africa 100,000 100,000 0 160,000 360,000 0.4% 0.6%Egypt 0 0 0 50,000 50,000 0.0% 0.2%Total Africa 100,700 100,000 0 246,000 446,700 0.4% 1.0% Turkey 0 1,200,000 0 910,000 2,110,000 2.2% 3.6%India 740,000 525,000 1,900,000 2,105,000 5,270,000 2.3% 16.0%Pakistan 0 16,000 0 182,000 198,000 0.0% 0.7%Bangladesh 0 30,000 0 0 30,000 0.1% 0.0%Australia 0 350,000 0 0 350,000 0.6% 0.0%New Zealand 0 0 0 15,000 15,000 0.0% 0.1%Total Other World 740,000 2,121,000 1,900,000 3,212,000 7,973,000 5.2% 20.4% Total World 23,396,200 31,973,900 14,941,000 10,119,000 80,430,100 100.0% 100.0%
Installed API Capacity
Source : Industry, HDFC Sec. Research
Pipes & TubesHDFC Securities
June 20, 2008 Page 19
Capacity Investments
With the exception of North America, API pipe capacity additions are more in LSAW pipes with
the product attracting the most investment. By region, the principal investments include:
North America - Expected capacity addition 1.7 mn tons
Berg Steel, part of the German Europipe, is to build a new large diameter spiral-weld
manufacturing unit in Mobile, Alabama. The new company, Berg Spiral Pipes, is due to be up
and running by mid 2008, at a cost of US$575m. The facility will have the capacity to produce
200,000tpy of 24 to 56 inch diameter pipes, with a maximum length of 80 feet.
IPSCO is set to expand its large diameter pipe mill at its Saskatchewan mill, Regina at a cost
of US$53m. Due on stream in mid 2008, capacity will be increased to 125,000tpy, and will
include a pipe forming mill and finishing equipment. At the same time, the company has also
announced its intention to increase its spiral weld capacity to 500,000tpy.
US Steel is set to form a spiral-weld producing joint venture in California. With annual
capacity expected at 300,000tpy, the new joint venture will be able to produce pipes of 24 to
64 inch diameter, with production expected to start in 2008.
It is expected that around 1 million tons of additional HSAW capacity will be added by Indian
manufactures Welspun, Man and PSL. These are all green field capacities and are expected
to start operations between mid Sept 08 and Sept 09.
Latin America - Expected capacity addition 0.7 mn tons
Tubos Soldados Atlantico (TSA), a joint venture led by Europipe, has began operating a
90,000tpy welded pipe mill in South Eastern Brazil. The joint venture between Europipe, V&M
do Brasil and Interoil is expected to increase the mill’s capacity to 180,000tpy, which will
include the production of SAW pipes.
French producer Vallourec, together with Sumitomo of Japan, is set to take part in a joint
venture in Brazil. Based in Minas Gerais state, the mill is expected to cost US$600m, and will
have the capacity to produce 600,000tpy.
Europe - Expected capacity addition 0.2 mn tons
A joint venture, Borusan Mannesmann, between Turkish company Borusan and Germany’s
Mannesmann Röhrenwerke, is installing a 50,000tpy spiral weld tube line in Albacete,
Spain. The equipment will come from a Europipe operation in Jouef, France, which was shut
down in March 2004. The mill will be transferred to Spain, where it will produce 100,000tpy, at
a cost of €15m.
In Italy, Arvedi Tubi Acciaio (ATA) plans to add 100,000tpy to its welded capacity at its Cremona
site. At a cost of €40m, the new capacity is due on line by mid 2008, and will produce 12 inch
diameter pipes.
Pipes & TubesHDFC Securities
June 20, 2008 Page 20
Asia - Expected capacity addition 0.7 mn tons
Chinese producer Shandong Lubao, a Baosteel subsidiary, is due to start building a
500,000tpy seamless pipe mill this year. The new mill, Shandong Lubao Steel Pipe, is
expected to produce OCTG and boiler pipes, among other commercial pipes, with diameter
range of 6 to 17 inches.
In Japan, Sumitomo Metal Industries (SMI) has announced plans to invest US$85m at its
Kashima works in order to prepare a system for the mass production of ultra high strength
steel pipes. Due to begin production in 2011, the company intends to supply pipes for an
increasing share of gas transportation projects.
Middle East - Expected capacity addition 1 mn tons
Jubail Energy Services Company of Saudi Arabia, is set to build the country’s first seamless
pipe plant in Al Jubail. With a planned capacity of 400,000tpy, the mill will be able to produce
pipes of 5 to 14 inch diameter. With production due to start in 2008, the plant will include a
heat treatment line, a finishing line and a coupling workshop.
Arcelor Mittal has signed a joint venture with the Bin Jarallah Group of companies in Saudi
Arabia for the construction of a seamless tube mill. With annual capacity of 500,000tpy, the
company will concentrate on OCTG products, and will have the capacity to produce 4 to 14
inch pipes. Due to start production in 2010, the project is an attempt by Arcelor Mittal to tap
into the Middle East market.
India - Expected capacity addition 1.7 mn tons
Indian Seamless Metal Tubes (ISMT) is planning a US$55m expansion project at its
Maharashtra facility. Set to increase capacity by 320,000tpy, the new capacity, expected to be
operational by the end of 2008, will make the company India’s largest producer.
Maharashtra Seamless is adding 400,000 tons of seamless capacity over the next 12-18
months. This includes the Romanian acquisition of 200,000 tons.
Jindal Saw, Welspun Gujarat, Man Inds each are adding capacity anywhere in the range of
300,000 – 400,000 tons of HSAW/LSAW, which are slated to commence operations by
H2CY08.
Pipes & TubesHDFC Securities
June 20, 2008 Page 21
Feedstock (Plate & Coil)
The American Petroleum Institute does not award a monogram to certify production of flat-
rolled feedstock (Plate & Coil) for API 5L or API 5CT pipes. The flat-rolled mills produce hot-
rolled strips or plates. A percentage of overall production will then be of API line pipe or OCTG
grade. Actual production depends on the production levels of welded pipes. As per industry
estimates, for an average configuration strip mill capable of API quality production, actual
output in these grades would typically not exceed 5% of the total gross HR coil output.
For plate mills, the assumed limits to API grade output will be the following:
• For mills known to be ideally equipped for line pipe grades (controlled rolling and
accelerated cooling), a maximum of 40% of total plate production will be the upper limit
for API grade output.
• For plate mills known to lack controlled rolling and accelerated cooling facilities, API
grade output has an upper limit of 10% of total production.
By some estimates, plate demand is expected to grow at about three percent a year. And
there aren’t many API/Heavy Plate grade plate producers globally. Driving that demand is not
only pipes and tubes but also other energy applications like drill rigs and windmills. Wind
mill towers, in particular, consume enormous amounts of plate and represent a strong
growth market.
Heavy equipment and transportation—such as railcars and barges—also account for a big
chunk of plate demand. Freight costs are spiraling in part because there does not seem to
be enough tankers out there. In South Korea, for example, most plates produced go into
shipbuilding and not into pipe markets.
And infrastructure demand in the developing world is booming. It is booming not only in
obvious places like India, China and Russia but also in Vietnam and formerly war-torn
countries such as Serbia and Croatia.
Infrastructure demand is also expected to pick up in the U.S., where the Minneapolis bridge
collapse will probably put more pressure on politicians to spend more and spend it faster.
And of course it’s not just the price of plate that is increasing. Upstream raw material costs
are also rising with global demand, especially demand from China. Iron ore prices are
expected to increase by as much as 20 percent to 30 percent over the next year. Coking coal,
scrap, alloy and electricity costs are also predicted to increase.
Mills may absorb smaller raw material increases of five percent or less. But most experts say
that if they get hit with increases of 30 percent or more, all bets are off. In fact, some argue that
the higher the cost increases, the more likely they are to be passed along to consumers.
Pipes & TubesHDFC Securities
June 20, 2008 Page 22
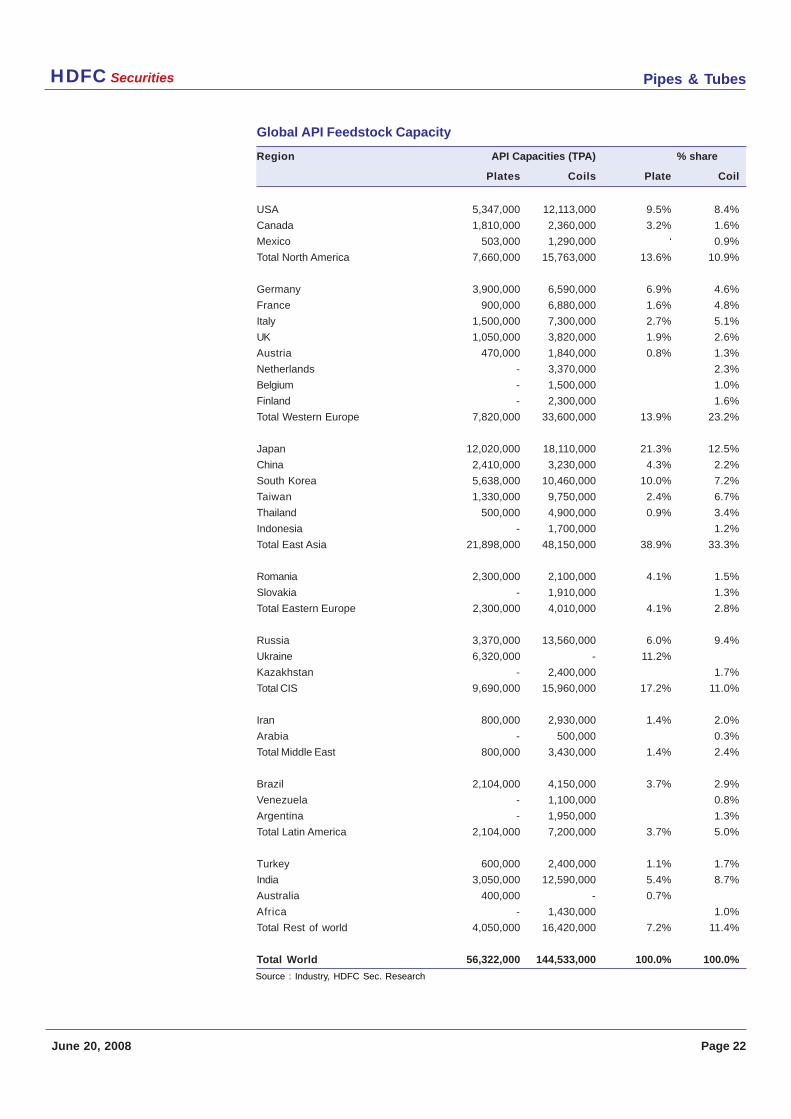
Global API Feedstock Capacity
Region API Capacities (TPA) % share
Plates Coils Plate Coil
USA 5,347,000 12,113,000 9.5% 8.4%
Canada 1,810,000 2,360,000 3.2% 1.6%
Mexico 503,000 1,290,000 ‘ 0.9%
Total North America 7,660,000 15,763,000 13.6% 10.9%
Germany 3,900,000 6,590,000 6.9% 4.6%
France 900,000 6,880,000 1.6% 4.8%
Italy 1,500,000 7,300,000 2.7% 5.1%
UK 1,050,000 3,820,000 1.9% 2.6%
Austria 470,000 1,840,000 0.8% 1.3%
Netherlands - 3,370,000 2.3%
Belgium - 1,500,000 1.0%
Finland - 2,300,000 1.6%
Total Western Europe 7,820,000 33,600,000 13.9% 23.2%
Japan 12,020,000 18,110,000 21.3% 12.5%
China 2,410,000 3,230,000 4.3% 2.2%
South Korea 5,638,000 10,460,000 10.0% 7.2%
Taiwan 1,330,000 9,750,000 2.4% 6.7%
Thailand 500,000 4,900,000 0.9% 3.4%
Indonesia - 1,700,000 1.2%
Total East Asia 21,898,000 48,150,000 38.9% 33.3%
Romania 2,300,000 2,100,000 4.1% 1.5%
Slovakia - 1,910,000 1.3%
Total Eastern Europe 2,300,000 4,010,000 4.1% 2.8%
Russia 3,370,000 13,560,000 6.0% 9.4%
Ukraine 6,320,000 - 11.2%
Kazakhstan - 2,400,000 1.7%
Total CIS 9,690,000 15,960,000 17.2% 11.0%
Iran 800,000 2,930,000 1.4% 2.0%
Arabia - 500,000 0.3%
Total Middle East 800,000 3,430,000 1.4% 2.4%
Brazil 2,104,000 4,150,000 3.7% 2.9%
Venezuela - 1,100,000 0.8%
Argentina - 1,950,000 1.3%
Total Latin America 2,104,000 7,200,000 3.7% 5.0%
Turkey 600,000 2,400,000 1.1% 1.7%
India 3,050,000 12,590,000 5.4% 8.7%
Australia 400,000 - 0.7%
Africa - 1,430,000 1.0%
Total Rest of world 4,050,000 16,420,000 7.2% 11.4%
Total World 56,322,000 144,533,000 100.0% 100.0%
Source : Industry, HDFC Sec. Research
Pipes & TubesHDFC Securities
June 20, 2008 Page 23
Plate and Coil capacity investments
Looking beyond 2007, a number of capacity developments are anticipated.
In Russia, Magnitogorsk Metallurgical Mill (MMK) is set to construct a thick plate mill. With
an intended capacity of 1.5m tpy, the company intends to target pipe producers for its thick
plate output, which is set to be operational by 2011.
Austrian steel producer Voestalpine Grobblech is to increase its clad plate capacity by a
third. The company is working with a number of pipe manufacturers, who expect rising
demand for clad plate in upcoming projects. The company’s capacity is set to increase to
30,000tpy, and is expected to be operational by 2009.
SMS Demag has won the tender to manufacture a plate mill for United Metallurgical Company,
based in Russia. The mill produces plates in sizes of 4.5 to 12.5 inches, up to X120 strength,
which will in turn be used to produce pipes of up to 56 inch diameter. The mill, which will have
a capacity of 1.2m tpy, will be operational by 2010, and will supply domestic pipe producers.
SMS Demag has also won a contract to construct a 2m tpy heavy plate mill for Chinese
producer, Minmetals Yingkou Medium Plate. The project will be based in Yinghou, Liaoning
Province and will have the capacity to produce heavy plate up to 17 inch thickness, with
production focusing on pipe grades as well as shipbuilding plate.
In the USA, Arcelor Mittal is to resume operations at its Gary plate mill. With the capacity to
produce plate up to 150 inches wide, the company announced intentions to resume
production on the back of strong demand for large diameter pipes, among other products.
South Korean steel producer Hyundai, has announced plans to produce a 8m tpy greenfield
project in Dangjin, South Korea. The first blast furnace is expected to be operational by 2010,
and with a 4m tpy capacity will supply the pipe market, among other domestic uses.
India: Jindal Steel & Power 1m ton capacity; 3.8 meters width; commercial production
began in August 2007. Essar Steel: 1.5m ton capacity; ~5 meters width; commercial production
likely to begin in 2008. Welspun Gujarat: 1.8m ton capacity; ~5 meters width; likely to go on
stream by April 2008.
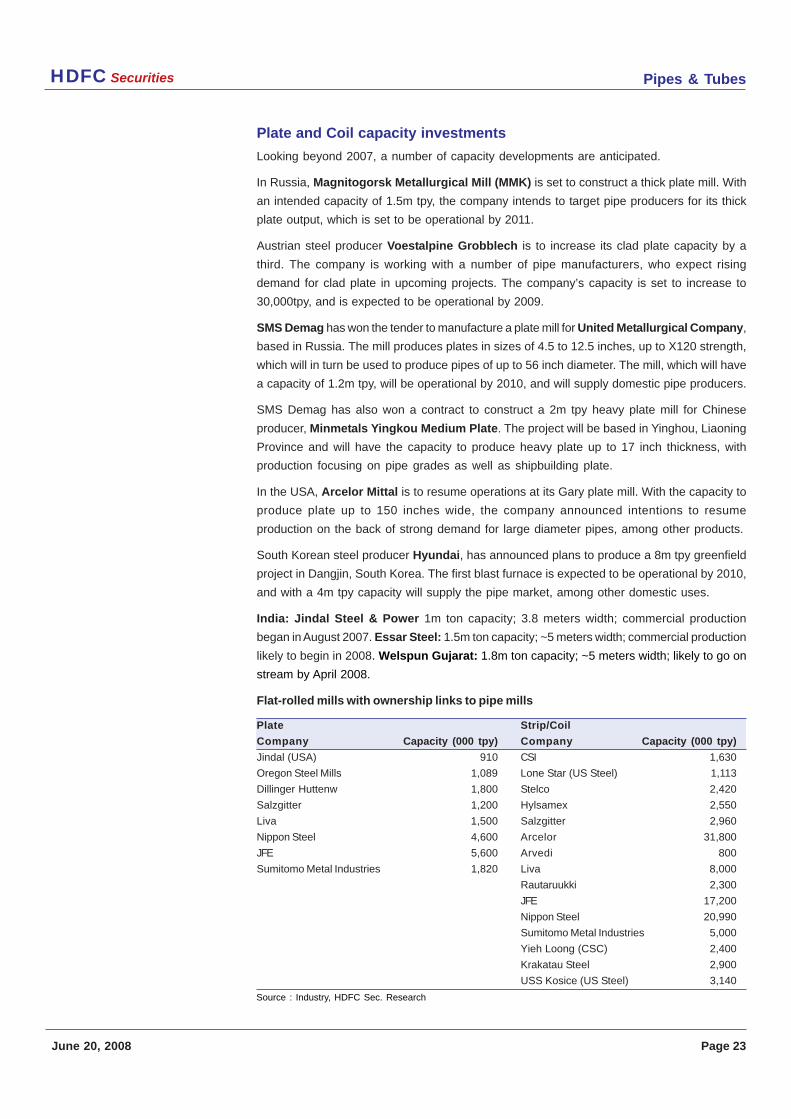
Flat-rolled mills with ownership links to pipe mills
Plate Strip/Coil
Company Capacity (000 tpy) Company Capacity (000 tpy)
Jindal (USA) 910 CSI 1,630
Oregon Steel Mills 1,089 Lone Star (US Steel) 1,113
Dillinger Huttenw 1,800 Stelco 2,420
Salzgitter 1,200 Hylsamex 2,550
Liva 1,500 Salzgitter 2,960
Nippon Steel 4,600 Arcelor 31,800
JFE 5,600 Arvedi 800
Sumitomo Metal Industries 1,820 Liva 8,000
Rautaruukki 2,300
JFE 17,200
Nippon Steel 20,990
Sumitomo Metal Industries 5,000
Yieh Loong (CSC) 2,400
Krakatau Steel 2,900
USS Kosice (US Steel) 3,140
Source : Industry, HDFC Sec. Research
Pipes & TubesHDFC Securities
June 20, 2008 Page 24
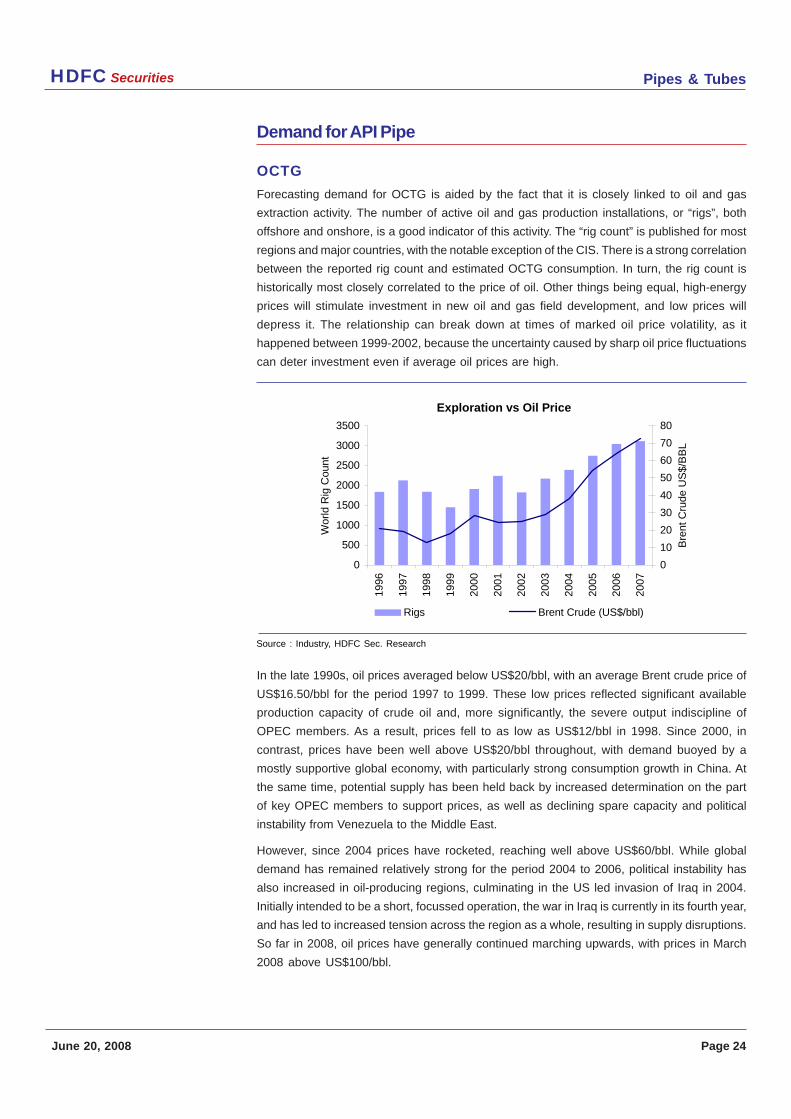
Demand for API Pipe
OCTG
Forecasting demand for OCTG is aided by the fact that it is closely linked to oil and gas
extraction activity. The number of active oil and gas production installations, or “rigs”, both
offshore and onshore, is a good indicator of this activity. The “rig count” is published for most
regions and major countries, with the notable exception of the CIS. There is a strong correlation
between the reported rig count and estimated OCTG consumption. In turn, the rig count is
historically most closely correlated to the price of oil. Other things being equal, high-energy
prices will stimulate investment in new oil and gas field development, and low prices will
depress it. The relationship can break down at times of marked oil price volatility, as it
happened between 1999-2002, because the uncertainty caused by sharp oil price fluctuations
can deter investment even if average oil prices are high.
In the late 1990s, oil prices averaged below US$20/bbl, with an average Brent crude price of
US$16.50/bbl for the period 1997 to 1999. These low prices reflected significant available
production capacity of crude oil and, more significantly, the severe output indiscipline of
OPEC members. As a result, prices fell to as low as US$12/bbl in 1998. Since 2000, in
contrast, prices have been well above US$20/bbl throughout, with demand buoyed by a
mostly supportive global economy, with particularly strong consumption growth in China. At
the same time, potential supply has been held back by increased determination on the part
of key OPEC members to support prices, as well as declining spare capacity and political
instability from Venezuela to the Middle East.
However, since 2004 prices have rocketed, reaching well above US$60/bbl. While global
demand has remained relatively strong for the period 2004 to 2006, political instability has
also increased in oil-producing regions, culminating in the US led invasion of Iraq in 2004.
Initially intended to be a short, focussed operation, the war in Iraq is currently in its fourth year,
and has led to increased tension across the region as a whole, resulting in supply disruptions.
So far in 2008, oil prices have generally continued marching upwards, with prices in March
2008 above US$100/bbl.
Exploration vs Oil Price
0
500
1000
1500
2000
2500
3000
3500
1996
1997
1998
1999
2000
2001
2002
2003
2004
2005
2006
2007
Wor
ld R
ig C
ount
0
10
20
30
40
50
60
70
80
Bre
nt C
rude
US
$/B
BL
Rigs Brent Crude (US$/bbl)
Source : Industry, HDFC Sec. Research
Pipes & TubesHDFC Securities
June 20, 2008 Page 25
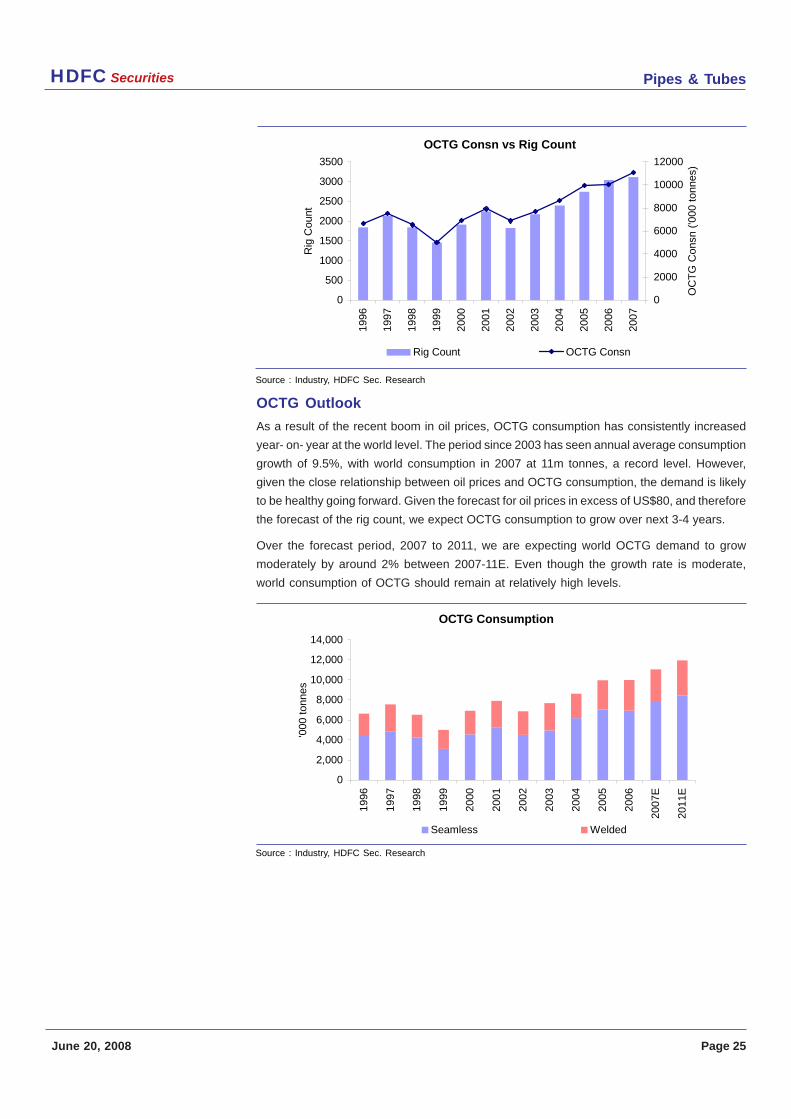
OCTG Outlook
As a result of the recent boom in oil prices, OCTG consumption has consistently increased
year- on- year at the world level. The period since 2003 has seen annual average consumption
growth of 9.5%, with world consumption in 2007 at 11m tonnes, a record level. However,
given the close relationship between oil prices and OCTG consumption, the demand is likely
to be healthy going forward. Given the forecast for oil prices in excess of US$80, and therefore
the forecast of the rig count, we expect OCTG consumption to grow over next 3-4 years.
Over the forecast period, 2007 to 2011, we are expecting world OCTG demand to grow
moderately by around 2% between 2007-11E. Even though the growth rate is moderate,
world consumption of OCTG should remain at relatively high levels.
OCTG Consn vs Rig Count
0
500
1000
1500
2000
2500
3000
3500
1996
1997
1998
1999
2000
2001
2002
2003
2004
2005
2006
2007
Rig
Cou
nt0
2000
4000
6000
8000
10000
12000
OC
TG
Con
sn (
'000
ton
nes)
Rig Count OCTG Consn
OCTG Consumption
0
2,000
4,000
6,000
8,000
10,000
12,000
14,000
1996
1997
1998
1999
2000
2001
2002
2003
2004
2005
2006
2007
E
2011
E
'000
ton
nes
Seamless Welded
Source : Industry, HDFC Sec. Research
Source : Industry, HDFC Sec. Research
Pipes & TubesHDFC Securities
June 20, 2008 Page 26
One of the competitive battlegrounds in the API pipe market is that between welded and
seamless OCTG, with the former’s advantage arising from lower average costs of
manufacturing, and the latter’s from a widespread perception that any weld in casing or
tubing (drill pipe is always seamless) would increase the risk of pipe failure. Seamless has
traditionally been the dominant product solution, but in the 1990s welded OCTG increased
its market share, owing in part to successful efforts to market the reliable performance of
welded pipe. Welded pipe’s share of the overall market for OCTG was around 30% in 2006,
having fallen from the record level of 38% seen in 1999. The share going forward most likely
will remain stable over the forecast period, with any cost advantages for welded pipe proving
insufficient to allow it to capture a substantially higher share of the market from seamless.
Regional product preferences remain entrenched, with the share of welded in the particularly
risk averse Middle East currently estimated to be only 16%, compared to almost 40% in
North America.
OCTG by Product Grade
There has undoubtedly been an underlying trend towards the customization of API pipe
qualities over the past several years, and pressure will continue for the development of
higher-performance products. Some higher-specification requirements, such as severe
pressure resistance, or low- temperature “arctic service” pipe, could however be reduced if
proportionately more exploration and production activity shifts to the (onshore) Middle East
region. However sour service pipe will be in high demand in the Middle East, owing to the
typical chemistry of crude oils in this region.
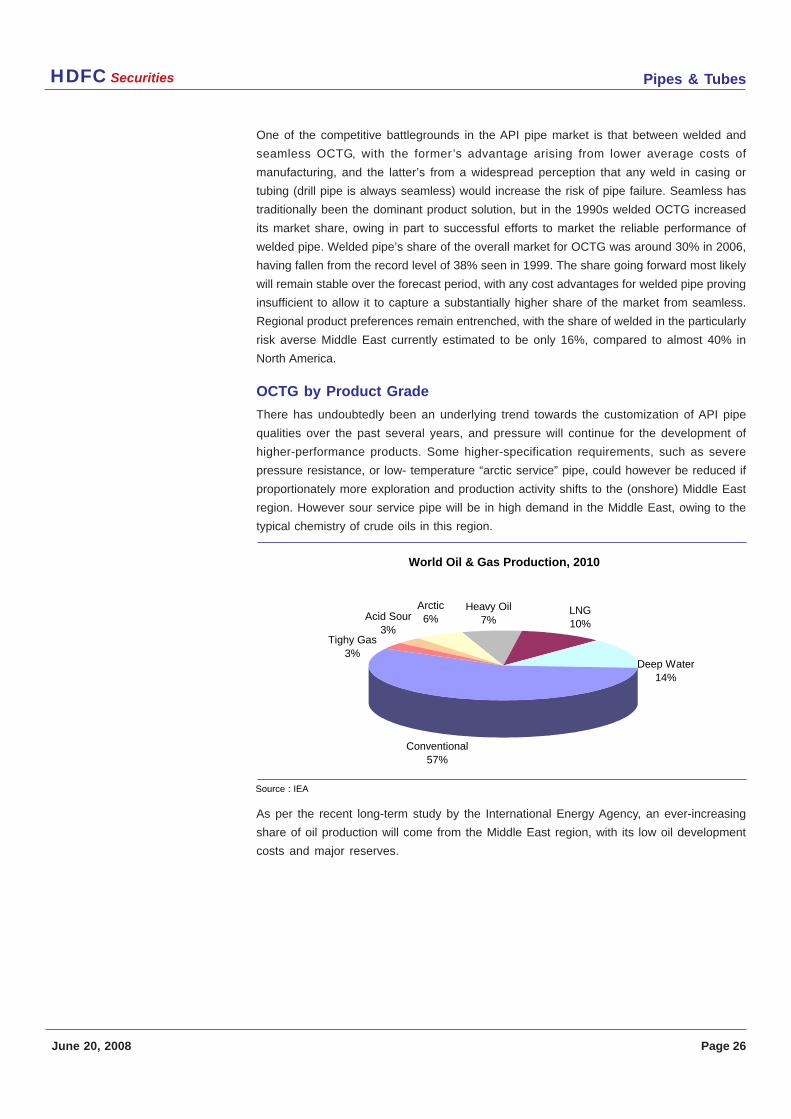
As per the recent long-term study by the International Energy Agency, an ever-increasing
share of oil production will come from the Middle East region, with its low oil development
costs and major reserves.
World Oil & Gas Production, 2010
Conventional57%
Acid Sour3%
Arctic6%
Heavy Oil7%
LNG10%
Tighy Gas3%
Deep Water14%
Source : IEA
Pipes & TubesHDFC Securities
June 20, 2008 Page 27
World Oil Supply (Million barrels per day)
2005 2010 2015 2030
North America 10 9 9 8
OECD Europe 5 4 3 2
OECD Australasia/pacific 1 1 1 0
Transition economies 11 14 15 16
China 4 4 4 3
Other Asia 3 4 3 3
Latin America 6 7 8 10
Africa 9 11 11 12
Middle East 33 36 41 55
Total 82 90 95 109
World Oil Supply (Regional share of world total)
2005 2010 2015 2030
North America 12% 11% 10% 7%
OECD Europe 6% 4% 3% 1%
OECD Australasia/pacific 1% 1% 1% 0%
Transition economies 14% 16% 15% 15%
China 4% 4% 4% 3%
Other Asia 4% 4% 4% 3%
Latin America 7% 8% 9% 9%
Africa 11% 12% 12% 11%
Middle East 41% 40% 44% 51%
Total 100% 100% 102% 100%
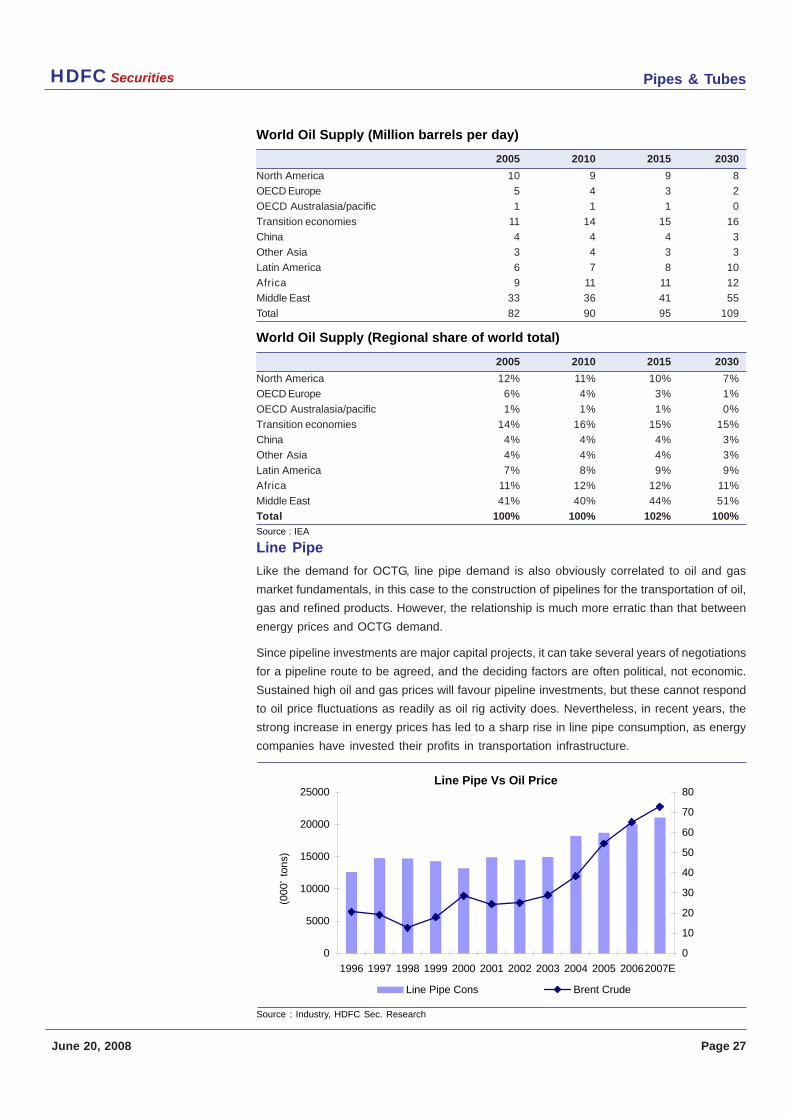
Line Pipe
Like the demand for OCTG, line pipe demand is also obviously correlated to oil and gas
market fundamentals, in this case to the construction of pipelines for the transportation of oil,
gas and refined products. However, the relationship is much more erratic than that between
energy prices and OCTG demand.
Since pipeline investments are major capital projects, it can take several years of negotiations
for a pipeline route to be agreed, and the deciding factors are often political, not economic.
Sustained high oil and gas prices will favour pipeline investments, but these cannot respond
to oil price fluctuations as readily as oil rig activity does. Nevertheless, in recent years, the
strong increase in energy prices has led to a sharp rise in line pipe consumption, as energy
companies have invested their profits in transportation infrastructure.
Line Pipe Vs Oil Price
0
5000
10000
15000
20000
25000
1996 1997 1998 1999 2000 2001 2002 2003 2004 2005 20062007E
0
10
20
30
40
50
60
70
80
Line Pipe Cons Brent Crude
Source : IEA
Source : Industry, HDFC Sec. Research
(000
’ to
ns)
Pipes & TubesHDFC Securities
June 20, 2008 Page 28
Consumption of line pipe has been rising in recent years, with an increase in construction of
pipeline projects leading the way forward. The line pipe market did suffer from a drop in
consumption in 2000, due to a corresponding fall in pipeline construction projects in 2001.
However, since this decline, construction of pipelines has been increasing year-on-year in
line with increasing oil and gas prices.
Line Pipe: Best Yet to Come
Since 2003, the total line pipe market grew at annual average rate of 10.4%, compared to an
annual average rate of 2.4% for the period 1996 to 2003. However, the fact that growth has
been strong over the last few years is not surprising given the increases in the price of oil and
gas. Indeed, line pipe consumption has in fact grown rather conservatively compared to oil
prices, which have risen by an annual average rate of 31.4% for the three years since 2003,
dwarfing the growth seen in line pipe consumption. Looking ahead, we are expecting
consumption to increase further, given the number of planned and announced pipeline
construction projects and oil above US$ 100/bbl will stimulate newer projects.
A study by analysts Douglas-Westwood titled The World Onshore Pipelines Report 2008-
2012 forecasts that $180 billion will be spent on onshore pipeline projects worldwide
through 2012. The report estimates a 16% increase in the pipeline mileage installed from
2008-2012 compared to the historic five-year period 2003-2007. Nearly 75% of this
expenditure is expected to be spent in Asia, Eastern Europe, the FSU and North America.
Almost 70% is projected to be spent on gas pipelines. Asia stands out as the largest forecast
market — by length of pipeline construction — accounting for $42 billion of forecast capital
expenditure. The status of forecast pipeline projects shows a split between planning (47%),
under construction or ordered (40%) and approved (13%).
Much of this expected growth is based on modest increases in energy consumption. The
International Energy Outlook for 2007 suggests that world demand for primary energy will
increase by an average 2.3% per year for the period 2004 to 2010, before slowing to 1.8% per
year for the period 2010 to 2015.
The longer-term outlook: strongest for gas
Although decisions on individual pipeline projects are extremely unpredictable, the economic
fundamentals point to a sustained level of pipeline investment in the coming years because
of the forecast growth in inter-regional trade in hydrocarbons. In a continuation of recent
years’ trends, the strongest prospects are for larger-diameter natural gas pipelines. The
International Energy Agency forecasts a sharp increase in the requirement for imported
natural gas in major consuming regions such as North America, Europe and China. There
are relatively few physical connections between the major regional markets, but current and
planned pipeline projects are expected to rectify this situation.
Competition for the large-diameter market: LSAW vs HSAW
Although demand prospects are in principle supportive of large-diameter line pipe as a
whole, the degree to which the two key competing pipe solutions – LSAW and spiral-welded
– can capitalise on this may differ. This, in turn, has implications for the relative fortunes
respectively of RM plate and coil as the feedstocks for each of these two types of pipes.
Pipes & TubesHDFC Securities
June 20, 2008 Page 29
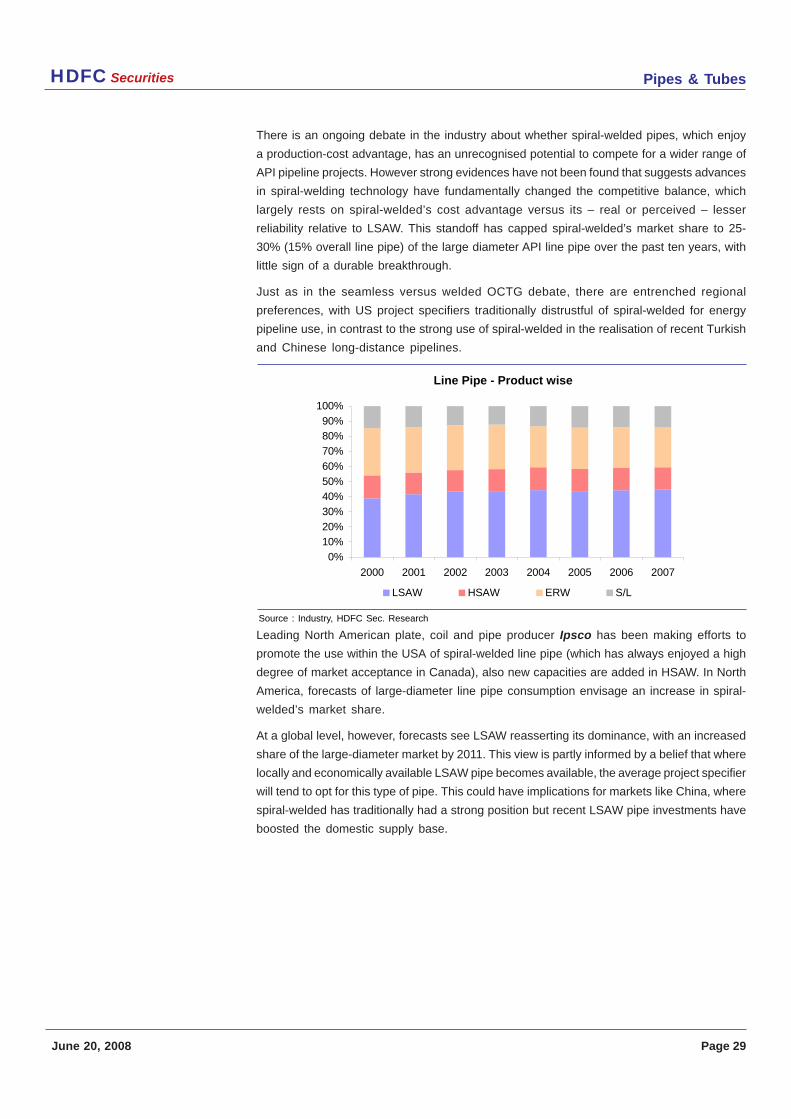
There is an ongoing debate in the industry about whether spiral-welded pipes, which enjoy
a production-cost advantage, has an unrecognised potential to compete for a wider range of
API pipeline projects. However strong evidences have not been found that suggests advances
in spiral-welding technology have fundamentally changed the competitive balance, which
largely rests on spiral-welded’s cost advantage versus its – real or perceived – lesser
reliability relative to LSAW. This standoff has capped spiral-welded’s market share to 25-
30% (15% overall line pipe) of the large diameter API line pipe over the past ten years, with
little sign of a durable breakthrough.
Just as in the seamless versus welded OCTG debate, there are entrenched regional
preferences, with US project specifiers traditionally distrustful of spiral-welded for energy
pipeline use, in contrast to the strong use of spiral-welded in the realisation of recent Turkish
and Chinese long-distance pipelines.
Leading North American plate, coil and pipe producer Ipsco has been making efforts to
promote the use within the USA of spiral-welded line pipe (which has always enjoyed a high
degree of market acceptance in Canada), also new capacities are added in HSAW. In North
America, forecasts of large-diameter line pipe consumption envisage an increase in spiral-
welded’s market share.
At a global level, however, forecasts see LSAW reasserting its dominance, with an increased
share of the large-diameter market by 2011. This view is partly informed by a belief that where
locally and economically available LSAW pipe becomes available, the average project specifier
will tend to opt for this type of pipe. This could have implications for markets like China, where
spiral-welded has traditionally had a strong position but recent LSAW pipe investments have
boosted the domestic supply base.
Line Pipe - Product wise
0%
10%
20%
30%
40%
50%
60%
70%
80%
90%
100%
2000 2001 2002 2003 2004 2005 2006 2007
LSAW HSAW ERW S/L
Source : Industry, HDFC Sec. Research
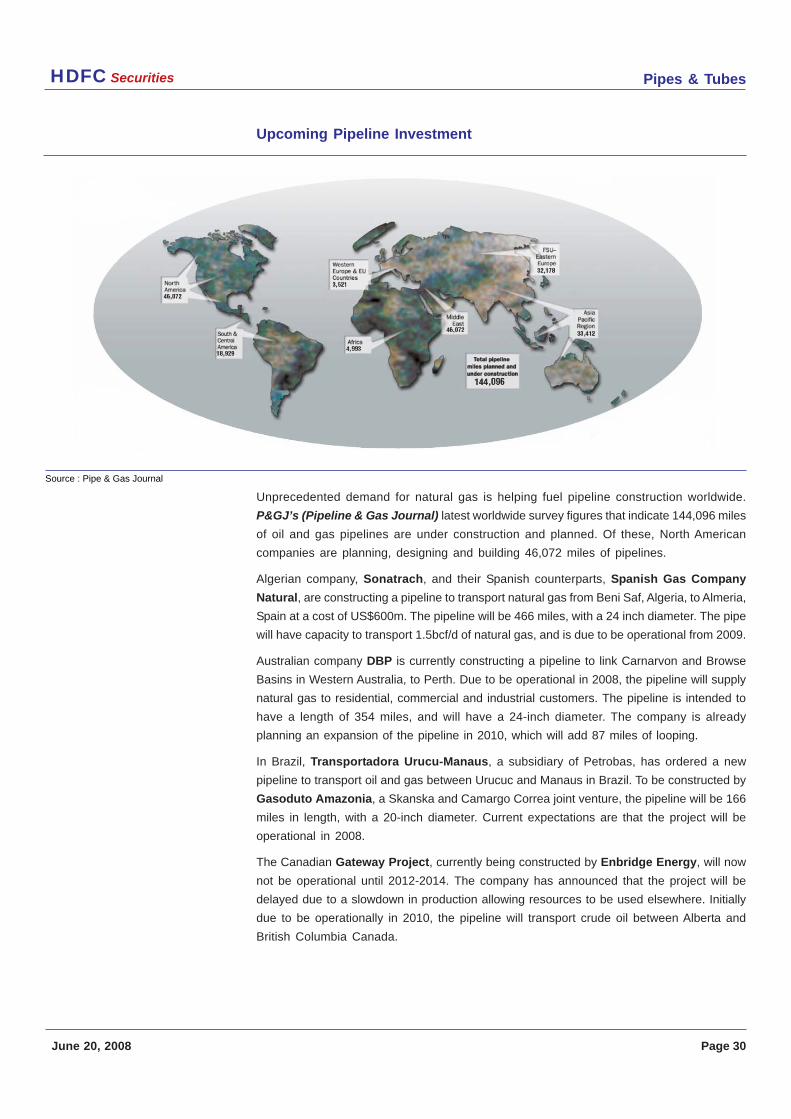
Pipes & TubesHDFC Securities
June 20, 2008 Page 30
Upcoming Pipeline Investment
Unprecedented demand for natural gas is helping fuel pipeline construction worldwide.
P&GJ’s (Pipeline & Gas Journal) latest worldwide survey figures that indicate 144,096 miles
of oil and gas pipelines are under construction and planned. Of these, North American
companies are planning, designing and building 46,072 miles of pipelines.
Algerian company, Sonatrach, and their Spanish counterparts, Spanish Gas Company
Natural, are constructing a pipeline to transport natural gas from Beni Saf, Algeria, to Almeria,
Spain at a cost of US$600m. The pipeline will be 466 miles, with a 24 inch diameter. The pipe
will have capacity to transport 1.5bcf/d of natural gas, and is due to be operational from 2009.
Australian company DBP is currently constructing a pipeline to link Carnarvon and Browse
Basins in Western Australia, to Perth. Due to be operational in 2008, the pipeline will supply
natural gas to residential, commercial and industrial customers. The pipeline is intended to
have a length of 354 miles, and will have a 24-inch diameter. The company is already
planning an expansion of the pipeline in 2010, which will add 87 miles of looping.
In Brazil, Transportadora Urucu-Manaus, a subsidiary of Petrobas, has ordered a new
pipeline to transport oil and gas between Urucuc and Manaus in Brazil. To be constructed by
Gasoduto Amazonia, a Skanska and Camargo Correa joint venture, the pipeline will be 166
miles in length, with a 20-inch diameter. Current expectations are that the project will be
operational in 2008.
The Canadian Gateway Project, currently being constructed by Enbridge Energy, will now
not be operational until 2012-2014. The company has announced that the project will be
delayed due to a slowdown in production allowing resources to be used elsewhere. Initially
due to be operationally in 2010, the pipeline will transport crude oil between Alberta and
British Columbia Canada.
Source : Pipe & Gas Journal
Pipes & TubesHDFC Securities
June 20, 2008 Page 31
Still in Canada, Kinder Morgan is planning to expand the Trans Mountain Pipeline. At a cost
of US$460m, the expansion, known as TMX-2, will consist of 308 miles of looping. The
expansion is split in two segments, the first from Edmonton to Edson, and the second from
Hargreaves to Darfield. The total expansion is set to consist of 308 miles, 157 miles at 36-
inch diameter for the first segment, and 151 miles in the second at 30/36-inch diameter. The
expansion will add 100,000b/d of capacity to the oil-transporting pipeline, and is expected to
be operational by 2009.
TransCanada is planning a further Canadian pipeline project intended to transport 435,000b/
d of crude oil. The Keystone Oil Pipeline, is expected to transport oil from Hardisty in Alberta,
Canada, to the US Midwest, Wood River and Patoka, Illinois. The pipeline, with a length of
1,845 miles and a with 30 inch diameter, is currently expected to be operational by mid 2010.
Pipelines for the transport of crude oil are not the only projects taking place in Canada. The
Pacific Trail Pipeline, a 50-50 joint venture between Galveston LNG and Pacific Northern
Gas Ltd., has been developed to transport natural gas from Kitimat, Canada, to Summit
Lake, also in Canada. At a cost of US$1.2bn, the project will be approximately 292 miles in
length, and have a diameter of 36 inches. The current expected date of completion for the
project is 2010, when it will have capacity to transport 1,000m cf/d.
Chinese company Sinopec, is planning a gas pipeline, which will carry gas from the East to
the West of the Pearl River Delta. Due to cost US$850m, the pipeline will have a length of 186
miles, with an operation date of 2010.
In Indonesia, the East Kalimantan to Central Java pipeline is being constructed. The pipeline,
with a length of 758 miles and a 42-inch diameter, will have the capacity to transport 1.1mm
cf/d of natural gas. The project is currently expected to be completed by 2010, and will run
from Kuala Badak, East Kalimantan, to Semarang, Central Java.
In Iran, the two main projects of note are the South Pars Gas Field Development Project, and
the South Pars to Gujarat pipeline. The South Pars Gas Field Development expansion
project is currently in the planning phase. It intends to take gas from the Parsian Gas Plant,
to South Pars. The project is currently intended to be 652 miles long, with a 56-inch diameter.
In Norway, Grasso AS is undertaking a pipeline connecting Karsto to Grenland. The pipeline
will transport gas, and will have a length of 287 miles, and a 24-inch diameter. The project is
expected to be operational by 2012, and will have the capacity to transport 7m bcu p/y of
natural gas, with the intention to supply gas to Scandinavian and Nordic countries.
In Russia, the Eastern Siberian Ocean Oil Pipeline will transport crude oil from Taishet, East
Siberia, to Nakhodka, Primorsky Krai, Russia. The pipeline will be 2,566 miles in length, with
a 48-inch diameter, at a cost of US$11bn. The pipeline will initially run to Taischet in 2008,
before being expanded to Nachoka on the Japan Sea. The object of the pipeline is to transport
oil from Russia to Asian and US markets.
Russia is also building a gas pipeline, connecting Russia to mainland Europe. The North
European Gas Pipeline (NEGP or Nord Stream) will extend 744 miles and have a 48-inch
diameter, running from Vyborg, Russia, to Greifswald, Northeast Germany, via the Baltic Sea.
Current predictions estimate capacity of 27.5bcm³ of natural gas, which will become
operational in 2010. The NEGP’s capacity is to reach 52bncm³ upon completion of a second
phase, due in 2013. The total cost of the project to Gazprom, the Russian gas company is
US$4.7bn.
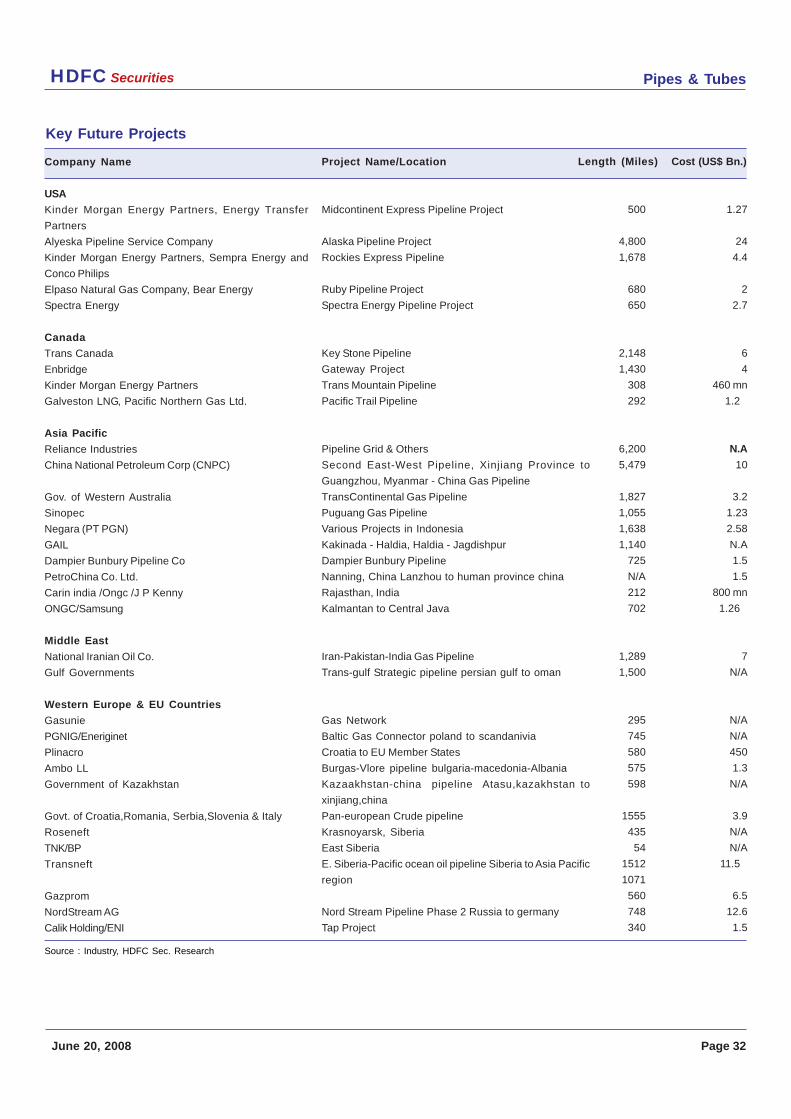
Pipes & TubesHDFC Securities
June 20, 2008 Page 32
Key Future Projects
Company Name
USA
Kinder Morgan Energy Partners, Energy Transfer
Partners
Alyeska Pipeline Service Company
Kinder Morgan Energy Partners, Sempra Energy and
Conco Philips
Elpaso Natural Gas Company, Bear Energy
Spectra Energy
Canada
Trans Canada
Enbridge
Kinder Morgan Energy Partners
Galveston LNG, Pacific Northern Gas Ltd.
Asia Pacific
Reliance Industries
China National Petroleum Corp (CNPC)
Gov. of Western Australia
Sinopec
Negara (PT PGN)
GAIL
Dampier Bunbury Pipeline Co
PetroChina Co. Ltd.
Carin india /Ongc /J P Kenny
ONGC/Samsung
Middle East
National Iranian Oil Co.
Gulf Governments
Western Europe & EU Countries
Gasunie
PGNIG/Eneriginet
Plinacro
Ambo LL
Government of Kazakhstan
Govt. of Croatia,Romania, Serbia,Slovenia & Italy
Roseneft
TNK/BP
Transneft
Gazprom
NordStream AG
Calik Holding/ENI
Project Name/Location
Midcontinent Express Pipeline Project
Alaska Pipeline Project
Rockies Express Pipeline
Ruby Pipeline Project
Spectra Energy Pipeline Project
Key Stone Pipeline
Gateway Project
Trans Mountain Pipeline
Pacific Trail Pipeline
Pipeline Grid & Others
Second East-West Pipeline, Xinjiang Province to
Guangzhou, Myanmar - China Gas Pipeline
TransContinental Gas Pipeline
Puguang Gas Pipeline
Various Projects in Indonesia
Kakinada - Haldia, Haldia - Jagdishpur
Dampier Bunbury Pipeline
Nanning, China Lanzhou to human province china
Rajasthan, India
Kalmantan to Central Java
Iran-Pakistan-India Gas Pipeline
Trans-gulf Strategic pipeline persian gulf to oman
Gas Network
Baltic Gas Connector poland to scandanivia
Croatia to EU Member States
Burgas-Vlore pipeline bulgaria-macedonia-Albania
Kazaakhstan-china pipeline Atasu,kazakhstan to
xinjiang,china
Pan-european Crude pipeline
Krasnoyarsk, Siberia
East Siberia
E. Siberia-Pacific ocean oil pipeline Siberia to Asia Pacific
region
Nord Stream Pipeline Phase 2 Russia to germany
Tap Project
Length (Miles) Cost (US$ Bn.)
500 1.27
4,800 24
1,678 4.4
680 2
650 2.7
2,148 6
1,430 4
308 460 mn
292 1.2
6,200 N.A
5,479 10
1,827 3.2
1,055 1.23
1,638 2.58
1,140 N.A
725 1.5
N/A 1.5
212 800 mn
702 1.26
1,289 7
1,500 N/A
295 N/A
745 N/A
580 450
575 1.3
598 N/A
1555 3.9
435 N/A
54 N/A
1512 11.5
1071
560 6.5
748 12.6
340 1.5
Source : Industry, HDFC Sec. Research
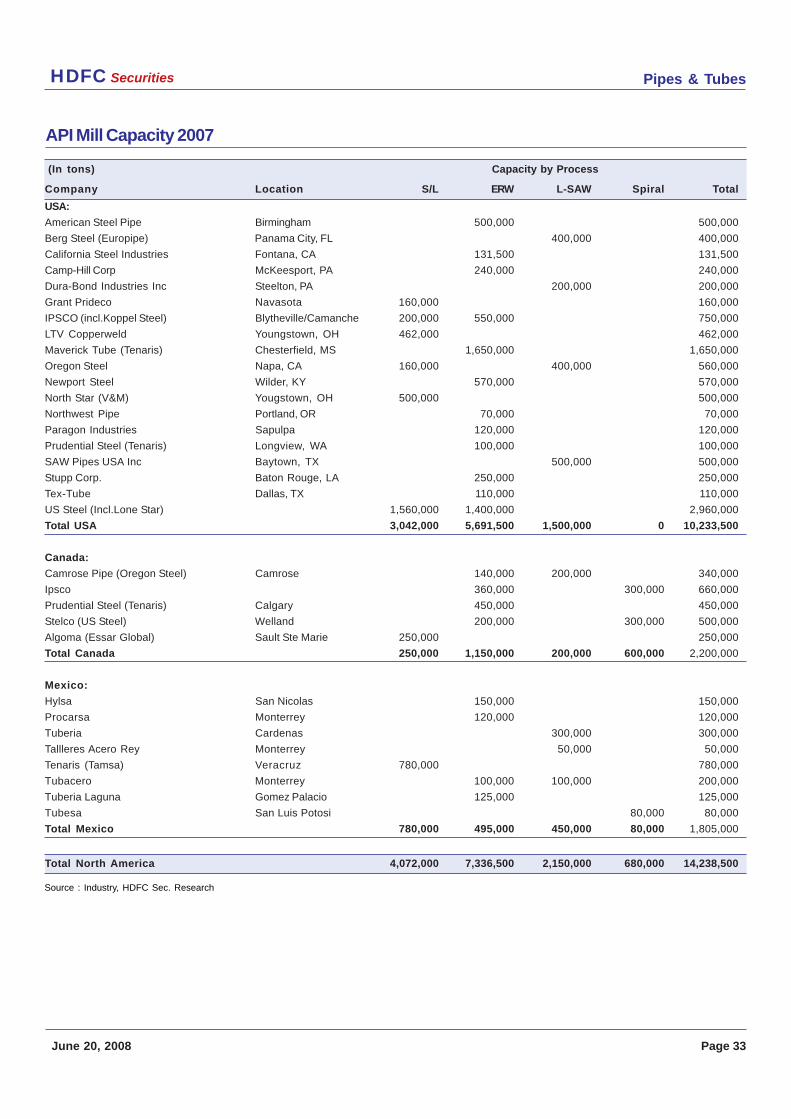
Pipes & TubesHDFC Securities
June 20, 2008 Page 33
API Mill Capacity 2007
(In tons) Capacity by Process
Company Location S/L ERW L-SAW Spiral Total
USA:
American Steel Pipe Birmingham 500,000 500,000
Berg Steel (Europipe) Panama City, FL 400,000 400,000
California Steel Industries Fontana, CA 131,500 131,500
Camp-Hill Corp McKeesport, PA 240,000 240,000
Dura-Bond Industries Inc Steelton, PA 200,000 200,000
Grant Prideco Navasota 160,000 160,000
IPSCO (incl.Koppel Steel) Blytheville/Camanche 200,000 550,000 750,000
LTV Copperweld Youngstown, OH 462,000 462,000
Maverick Tube (Tenaris) Chesterfield, MS 1,650,000 1,650,000
Oregon Steel Napa, CA 160,000 400,000 560,000
Newport Steel Wilder, KY 570,000 570,000
North Star (V&M) Yougstown, OH 500,000 500,000
Northwest Pipe Portland, OR 70,000 70,000
Paragon Industries Sapulpa 120,000 120,000
Prudential Steel (Tenaris) Longview, WA 100,000 100,000
SAW Pipes USA Inc Baytown, TX 500,000 500,000
Stupp Corp. Baton Rouge, LA 250,000 250,000
Tex-Tube Dallas, TX 110,000 110,000
US Steel (Incl.Lone Star) 1,560,000 1,400,000 2,960,000
Total USA 3,042,000 5,691,500 1,500,000 0 10,233,500
Canada:
Camrose Pipe (Oregon Steel) Camrose 140,000 200,000 340,000
Ipsco 360,000 300,000 660,000
Prudential Steel (Tenaris) Calgary 450,000 450,000
Stelco (US Steel) Welland 200,000 300,000 500,000
Algoma (Essar Global) Sault Ste Marie 250,000 250,000
Total Canada 250,000 1,150,000 200,000 600,000 2,200,000
Mexico:
Hylsa San Nicolas 150,000 150,000
Procarsa Monterrey 120,000 120,000
Tuberia Cardenas 300,000 300,000
Tallleres Acero Rey Monterrey 50,000 50,000
Tenaris (Tamsa) Veracruz 780,000 780,000
Tubacero Monterrey 100,000 100,000 200,000
Tuberia Laguna Gomez Palacio 125,000 125,000
Tubesa San Luis Potosi 80,000 80,000
Total Mexico 780,000 495,000 450,000 80,000 1,805,000
Total North America 4,072,000 7,336,500 2,150,000 680,000 14,238,500
Source : Industry, HDFC Sec. Research
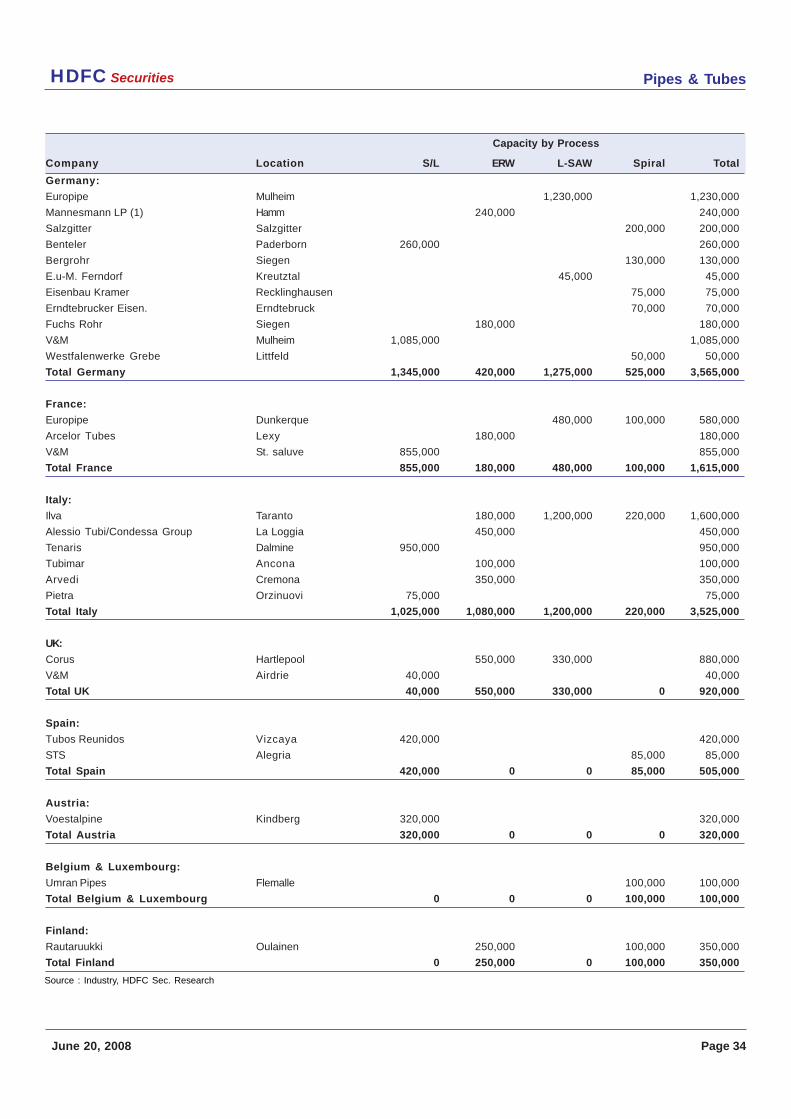
Pipes & TubesHDFC Securities
June 20, 2008 Page 34
Capacity by Process
Company Location S/L ERW L-SAW Spiral Total
Germany:
Europipe Mulheim 1,230,000 1,230,000
Mannesmann LP (1) Hamm 240,000 240,000
Salzgitter Salzgitter 200,000 200,000
Benteler Paderborn 260,000 260,000
Bergrohr Siegen 130,000 130,000
E.u-M. Ferndorf Kreutztal 45,000 45,000
Eisenbau Kramer Recklinghausen 75,000 75,000
Erndtebrucker Eisen. Erndtebruck 70,000 70,000
Fuchs Rohr Siegen 180,000 180,000
V&M Mulheim 1,085,000 1,085,000
Westfalenwerke Grebe Littfeld 50,000 50,000
Total Germany 1,345,000 420,000 1,275,000 525,000 3,565,000
France:
Europipe Dunkerque 480,000 100,000 580,000
Arcelor Tubes Lexy 180,000 180,000
V&M St. saluve 855,000 855,000
Total France 855,000 180,000 480,000 100,000 1,615,000
Italy:
Ilva Taranto 180,000 1,200,000 220,000 1,600,000
Alessio Tubi/Condessa Group La Loggia 450,000 450,000
Tenaris Dalmine 950,000 950,000
Tubimar Ancona 100,000 100,000
Arvedi Cremona 350,000 350,000
Pietra Orzinuovi 75,000 75,000
Total Italy 1,025,000 1,080,000 1,200,000 220,000 3,525,000
UK:
Corus Hartlepool 550,000 330,000 880,000
V&M Airdrie 40,000 40,000
Total UK 40,000 550,000 330,000 0 920,000
Spain:
Tubos Reunidos Vizcaya 420,000 420,000
STS Alegria 85,000 85,000
Total Spain 420,000 0 0 85,000 505,000
Austria:
Voestalpine Kindberg 320,000 320,000
Total Austria 320,000 0 0 0 320,000
Belgium & Luxembourg:
Umran Pipes Flemalle 100,000 100,000
Total Belgium & Luxembourg 0 0 0 100,000 100,000
Finland:
Rautaruukki Oulainen 250,000 100,000 350,000
Total Finland 0 250,000 0 100,000 350,000
Source : Industry, HDFC Sec. Research
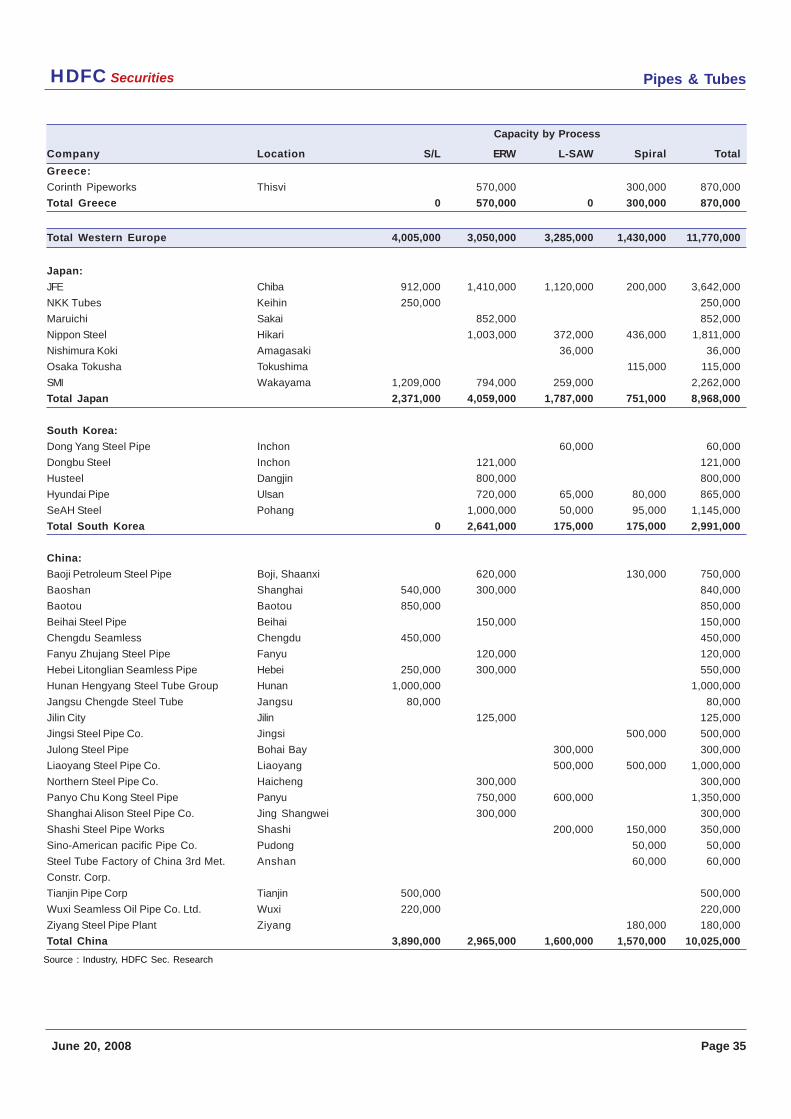
Pipes & TubesHDFC Securities
June 20, 2008 Page 35
Capacity by Process
Company Location S/L ERW L-SAW Spiral Total
Greece:
Corinth Pipeworks Thisvi 570,000 300,000 870,000
Total Greece 0 570,000 0 300,000 870,000
Total Western Europe 4,005,000 3,050,000 3,285,000 1,430,000 11,770,000
Japan:
JFE Chiba 912,000 1,410,000 1,120,000 200,000 3,642,000
NKK Tubes Keihin 250,000 250,000
Maruichi Sakai 852,000 852,000
Nippon Steel Hikari 1,003,000 372,000 436,000 1,811,000
Nishimura Koki Amagasaki 36,000 36,000
Osaka Tokusha Tokushima 115,000 115,000
SMI Wakayama 1,209,000 794,000 259,000 2,262,000
Total Japan 2,371,000 4,059,000 1,787,000 751,000 8,968,000
South Korea:
Dong Yang Steel Pipe Inchon 60,000 60,000
Dongbu Steel Inchon 121,000 121,000
Husteel Dangjin 800,000 800,000
Hyundai Pipe Ulsan 720,000 65,000 80,000 865,000
SeAH Steel Pohang 1,000,000 50,000 95,000 1,145,000
Total South Korea 0 2,641,000 175,000 175,000 2,991,000
China:
Baoji Petroleum Steel Pipe Boji, Shaanxi 620,000 130,000 750,000
Baoshan Shanghai 540,000 300,000 840,000
Baotou Baotou 850,000 850,000
Beihai Steel Pipe Beihai 150,000 150,000
Chengdu Seamless Chengdu 450,000 450,000
Fanyu Zhujang Steel Pipe Fanyu 120,000 120,000
Hebei Litonglian Seamless Pipe Hebei 250,000 300,000 550,000
Hunan Hengyang Steel Tube Group Hunan 1,000,000 1,000,000
Jangsu Chengde Steel Tube Jangsu 80,000 80,000
Jilin City Jilin 125,000 125,000
Jingsi Steel Pipe Co. Jingsi 500,000 500,000
Julong Steel Pipe Bohai Bay 300,000 300,000
Liaoyang Steel Pipe Co. Liaoyang 500,000 500,000 1,000,000
Northern Steel Pipe Co. Haicheng 300,000 300,000
Panyo Chu Kong Steel Pipe Panyu 750,000 600,000 1,350,000
Shanghai Alison Steel Pipe Co. Jing Shangwei 300,000 300,000
Shashi Steel Pipe Works Shashi 200,000 150,000 350,000
Sino-American pacific Pipe Co. Pudong 50,000 50,000
Steel Tube Factory of China 3rd Met. Anshan 60,000 60,000
Constr. Corp.
Tianjin Pipe Corp Tianjin 500,000 500,000
Wuxi Seamless Oil Pipe Co. Ltd. Wuxi 220,000 220,000
Ziyang Steel Pipe Plant Ziyang 180,000 180,000
Total China 3,890,000 2,965,000 1,600,000 1,570,000 10,025,000
Source : Industry, HDFC Sec. Research
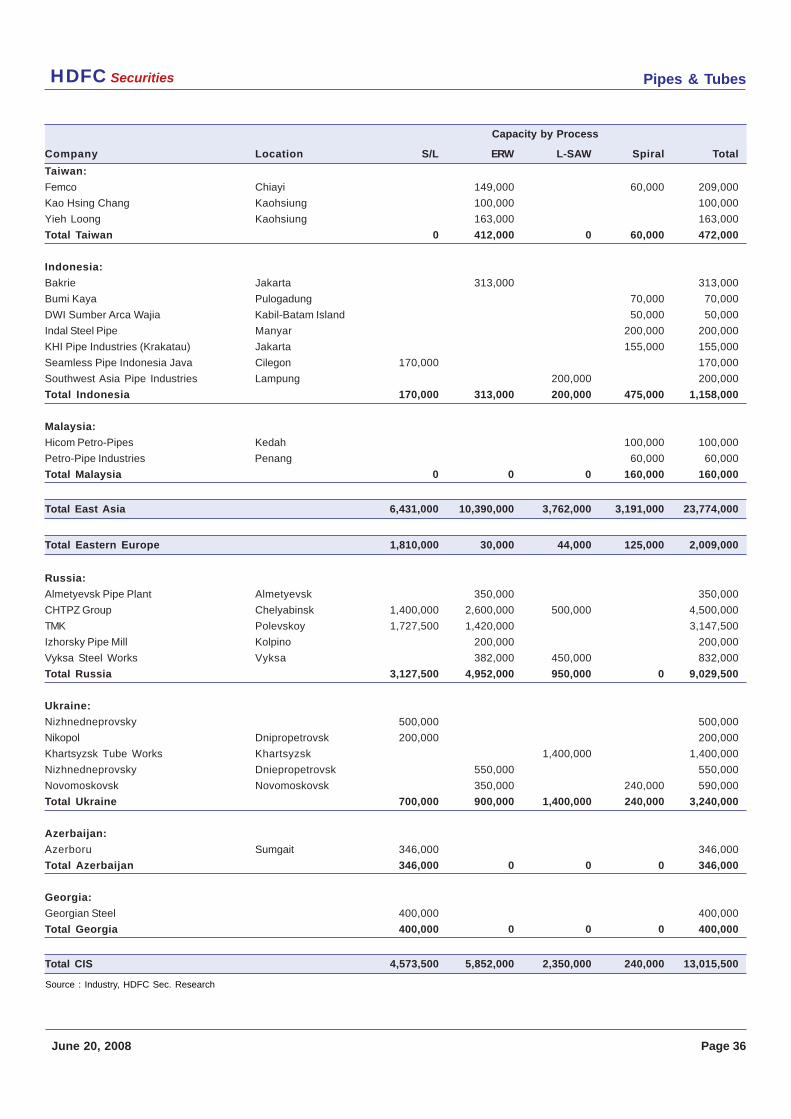
Pipes & TubesHDFC Securities
June 20, 2008 Page 36
Capacity by Process
Company Location S/L ERW L-SAW Spiral Total
Taiwan:
Femco Chiayi 149,000 60,000 209,000
Kao Hsing Chang Kaohsiung 100,000 100,000
Yieh Loong Kaohsiung 163,000 163,000
Total Taiwan 0 412,000 0 60,000 472,000
Indonesia:
Bakrie Jakarta 313,000 313,000
Bumi Kaya Pulogadung 70,000 70,000
DWI Sumber Arca Wajia Kabil-Batam Island 50,000 50,000
Indal Steel Pipe Manyar 200,000 200,000
KHI Pipe Industries (Krakatau) Jakarta 155,000 155,000
Seamless Pipe Indonesia Java Cilegon 170,000 170,000
Southwest Asia Pipe Industries Lampung 200,000 200,000
Total Indonesia 170,000 313,000 200,000 475,000 1,158,000
Malaysia:
Hicom Petro-Pipes Kedah 100,000 100,000
Petro-Pipe Industries Penang 60,000 60,000
Total Malaysia 0 0 0 160,000 160,000
Total East Asia 6,431,000 10,390,000 3,762,000 3,191,000 23,774,000
Total Eastern Europe 1,810,000 30,000 44,000 125,000 2,009,000
Russia:
Almetyevsk Pipe Plant Almetyevsk 350,000 350,000
CHTPZ Group Chelyabinsk 1,400,000 2,600,000 500,000 4,500,000
TMK Polevskoy 1,727,500 1,420,000 3,147,500
Izhorsky Pipe Mill Kolpino 200,000 200,000
Vyksa Steel Works Vyksa 382,000 450,000 832,000
Total Russia 3,127,500 4,952,000 950,000 0 9,029,500
Ukraine:
Nizhnedneprovsky 500,000 500,000
Nikopol Dnipropetrovsk 200,000 200,000
Khartsyzsk Tube Works Khartsyzsk 1,400,000 1,400,000
Nizhnedneprovsky Dniepropetrovsk 550,000 550,000
Novomoskovsk Novomoskovsk 350,000 240,000 590,000
Total Ukraine 700,000 900,000 1,400,000 240,000 3,240,000
Azerbaijan:
Azerboru Sumgait 346,000 346,000
Total Azerbaijan 346,000 0 0 0 346,000
Georgia:
Georgian Steel 400,000 400,000
Total Georgia 400,000 0 0 0 400,000
Total CIS 4,573,500 5,852,000 2,350,000 240,000 13,015,500
Source : Industry, HDFC Sec. Research
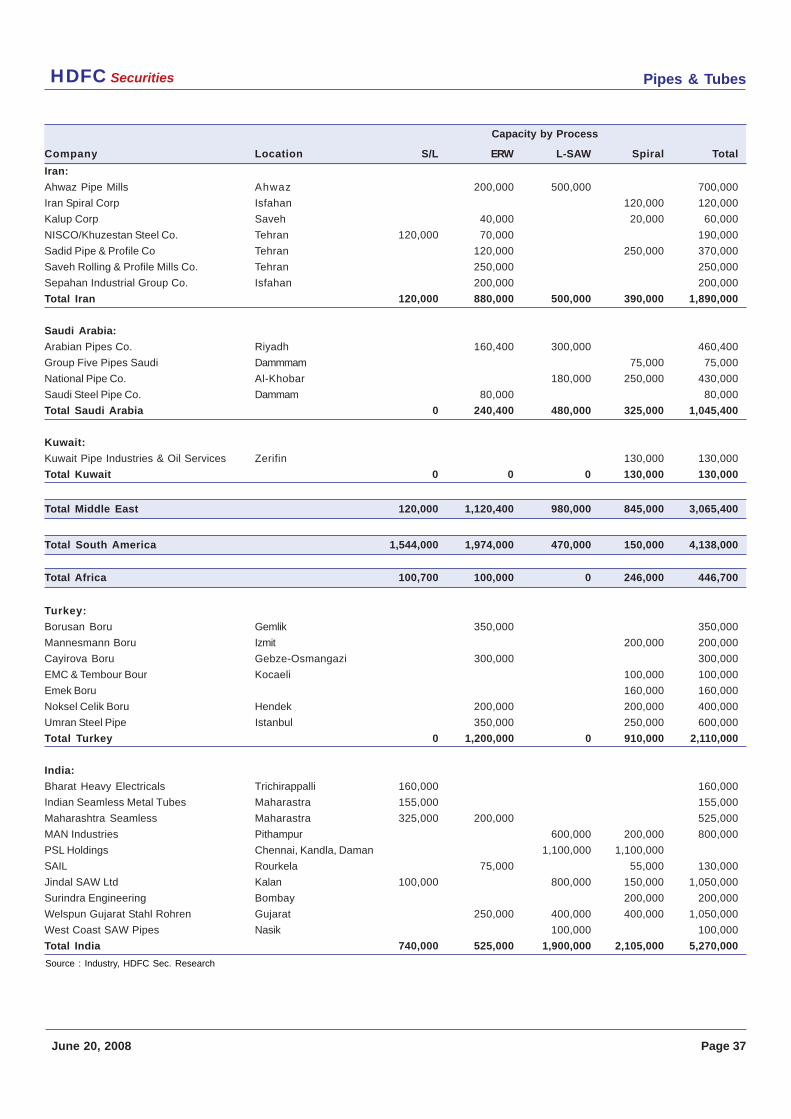
Pipes & TubesHDFC Securities
June 20, 2008 Page 37
Capacity by Process
Company Location S/L ERW L-SAW Spiral Total
Iran:
Ahwaz Pipe Mills Ahwaz 200,000 500,000 700,000
Iran Spiral Corp Isfahan 120,000 120,000
Kalup Corp Saveh 40,000 20,000 60,000
NISCO/Khuzestan Steel Co. Tehran 120,000 70,000 190,000
Sadid Pipe & Profile Co Tehran 120,000 250,000 370,000
Saveh Rolling & Profile Mills Co. Tehran 250,000 250,000
Sepahan Industrial Group Co. Isfahan 200,000 200,000
Total Iran 120,000 880,000 500,000 390,000 1,890,000
Saudi Arabia:
Arabian Pipes Co. Riyadh 160,400 300,000 460,400
Group Five Pipes Saudi Dammmam 75,000 75,000
National Pipe Co. Al-Khobar 180,000 250,000 430,000
Saudi Steel Pipe Co. Dammam 80,000 80,000
Total Saudi Arabia 0 240,400 480,000 325,000 1,045,400
Kuwait:
Kuwait Pipe Industries & Oil Services Zerifin 130,000 130,000
Total Kuwait 0 0 0 130,000 130,000
Total Middle East 120,000 1,120,400 980,000 845,000 3,065,400
Total South America 1,544,000 1,974,000 470,000 150,000 4,138,000
Total Africa 100,700 100,000 0 246,000 446,700
Turkey:
Borusan Boru Gemlik 350,000 350,000
Mannesmann Boru Izmit 200,000 200,000
Cayirova Boru Gebze-Osmangazi 300,000 300,000
EMC & Tembour Bour Kocaeli 100,000 100,000
Emek Boru 160,000 160,000
Noksel Celik Boru Hendek 200,000 200,000 400,000
Umran Steel Pipe Istanbul 350,000 250,000 600,000
Total Turkey 0 1,200,000 0 910,000 2,110,000
India:
Bharat Heavy Electricals Trichirappalli 160,000 160,000
Indian Seamless Metal Tubes Maharastra 155,000 155,000
Maharashtra Seamless Maharastra 325,000 200,000 525,000
MAN Industries Pithampur 600,000 200,000 800,000
PSL Holdings Chennai, Kandla, Daman 1,100,000 1,100,000
SAIL Rourkela 75,000 55,000 130,000
Jindal SAW Ltd Kalan 100,000 800,000 150,000 1,050,000
Surindra Engineering Bombay 200,000 200,000
Welspun Gujarat Stahl Rohren Gujarat 250,000 400,000 400,000 1,050,000
West Coast SAW Pipes Nasik 100,000 100,000
Total India 740,000 525,000 1,900,000 2,105,000 5,270,000
Source : Industry, HDFC Sec. Research
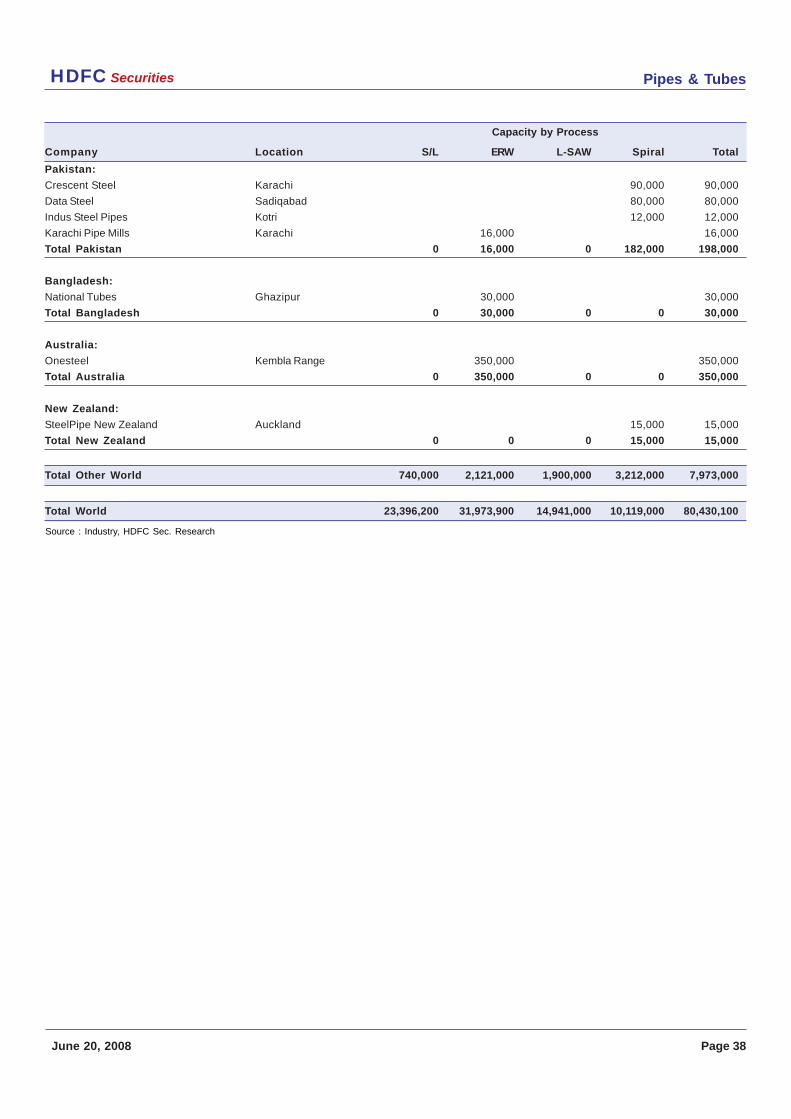
Pipes & TubesHDFC Securities
June 20, 2008 Page 38
Capacity by Process
Company Location S/L ERW L-SAW Spiral Total
Pakistan:
Crescent Steel Karachi 90,000 90,000
Data Steel Sadiqabad 80,000 80,000
Indus Steel Pipes Kotri 12,000 12,000
Karachi Pipe Mills Karachi 16,000 16,000
Total Pakistan 0 16,000 0 182,000 198,000
Bangladesh:
National Tubes Ghazipur 30,000 30,000
Total Bangladesh 0 30,000 0 0 30,000
Australia:
Onesteel Kembla Range 350,000 350,000
Total Australia 0 350,000 0 0 350,000
New Zealand:
SteelPipe New Zealand Auckland 15,000 15,000
Total New Zealand 0 0 0 15,000 15,000
Total Other World 740,000 2,121,000 1,900,000 3,212,000 7,973,000
Total World 23,396,200 31,973,900 14,941,000 10,119,000 80,430,100
Source : Industry, HDFC Sec. Research
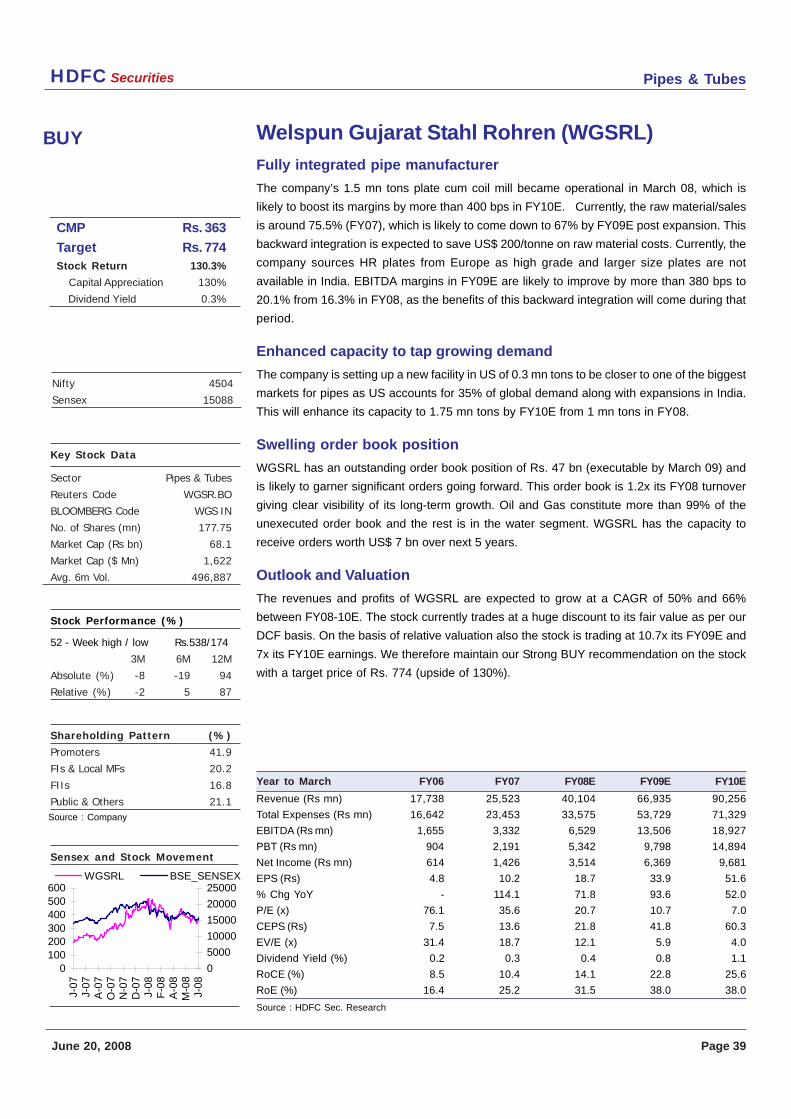
Pipes & TubesHDFC Securities
June 20, 2008 Page 39
BUY
Key Stock Data
Sector Pipes & Tubes
Reuters Code WGSR.BO
BLOOMBERG Code WGS IN
No. of Shares (mn) 177.75
Market Cap (Rs bn) 68.1
Market Cap ($ Mn) 1,622
Avg. 6m Vol. 496,887
Stock Performance (%)
52 - Week high / low Rs.538/174
3M 6M 12M
Absolute (%) -8 -19 94
Relative (%) -2 5 87
Shareholding Pattern (%)
Promoters 41.9
FIs & Local MFs 20.2
FIIs 16.8
Public & Others 21.1
Sensex and Stock Movement
Nifty 4504
Sensex 15088
Source : Company
CMP Rs. 363
Target Rs. 774Stock Return 130.3%
Capital Appreciation 130%
Dividend Yield 0.3%
Welspun Gujarat Stahl Rohren (WGSRL)
Fully integrated pipe manufacturer
The company’s 1.5 mn tons plate cum coil mill became operational in March 08, which is
likely to boost its margins by more than 400 bps in FY10E. Currently, the raw material/sales
is around 75.5% (FY07), which is likely to come down to 67% by FY09E post expansion. This
backward integration is expected to save US$ 200/tonne on raw material costs. Currently, the
company sources HR plates from Europe as high grade and larger size plates are not
available in India. EBITDA margins in FY09E are likely to improve by more than 380 bps to
20.1% from 16.3% in FY08, as the benefits of this backward integration will come during that
period.
Enhanced capacity to tap growing demand
The company is setting up a new facility in US of 0.3 mn tons to be closer to one of the biggest
markets for pipes as US accounts for 35% of global demand along with expansions in India.
This will enhance its capacity to 1.75 mn tons by FY10E from 1 mn tons in FY08.
Swelling order book position
WGSRL has an outstanding order book position of Rs. 47 bn (executable by March 09) and
is likely to garner significant orders going forward. This order book is 1.2x its FY08 turnover
giving clear visibility of its long-term growth. Oil and Gas constitute more than 99% of the
unexecuted order book and the rest is in the water segment. WGSRL has the capacity to
receive orders worth US$ 7 bn over next 5 years.
Outlook and Valuation
The revenues and profits of WGSRL are expected to grow at a CAGR of 50% and 66%
between FY08-10E. The stock currently trades at a huge discount to its fair value as per our
DCF basis. On the basis of relative valuation also the stock is trading at 10.7x its FY09E and
7x its FY10E earnings. We therefore maintain our Strong BUY recommendation on the stock
with a target price of Rs. 774 (upside of 130%).
Year to March FY06 FY07 FY08E FY09E FY10E
Revenue (Rs mn) 17,738 25,523 40,104 66,935 90,256
Total Expenses (Rs mn) 16,642 23,453 33,575 53,729 71,329
EBITDA (Rs mn) 1,655 3,332 6,529 13,506 18,927
PBT (Rs mn) 904 2,191 5,342 9,798 14,894
Net Income (Rs mn) 614 1,426 3,514 6,369 9,681
EPS (Rs) 4.8 10.2 18.7 33.9 51.6
% Chg YoY - 114.1 71.8 93.6 52.0
P/E (x) 76.1 35.6 20.7 10.7 7.0
CEPS (Rs) 7.5 13.6 21.8 41.8 60.3
EV/E (x) 31.4 18.7 12.1 5.9 4.0
Dividend Yield (%) 0.2 0.3 0.4 0.8 1.1
RoCE (%) 8.5 10.4 14.1 22.8 25.6
RoE (%) 16.4 25.2 31.5 38.0 38.0
Source : HDFC Sec. Research
0100200300400500600
J-07
J-07
A-0
7O
-07
N-0
7D
-07
J-08
F-0
8A
-08
M-0
8J-
08
0
5000
10000
15000
20000
25000WGSRL BSE_SENSEX
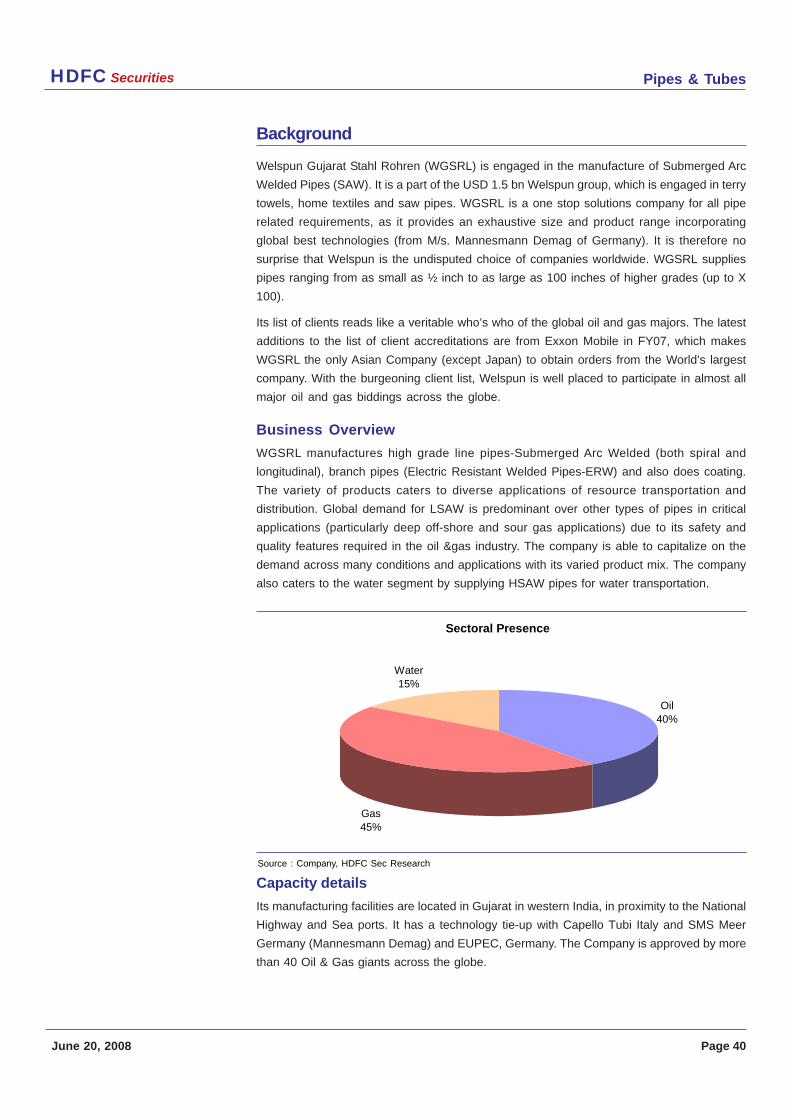
Pipes & TubesHDFC Securities
June 20, 2008 Page 40
Background
Welspun Gujarat Stahl Rohren (WGSRL) is engaged in the manufacture of Submerged Arc
Welded Pipes (SAW). It is a part of the USD 1.5 bn Welspun group, which is engaged in terry
towels, home textiles and saw pipes. WGSRL is a one stop solutions company for all pipe
related requirements, as it provides an exhaustive size and product range incorporating
global best technologies (from M/s. Mannesmann Demag of Germany). It is therefore no
surprise that Welspun is the undisputed choice of companies worldwide. WGSRL supplies
pipes ranging from as small as ½ inch to as large as 100 inches of higher grades (up to X
100).
Its list of clients reads like a veritable who’s who of the global oil and gas majors. The latest
additions to the list of client accreditations are from Exxon Mobile in FY07, which makes
WGSRL the only Asian Company (except Japan) to obtain orders from the World’s largest
company. With the burgeoning client list, Welspun is well placed to participate in almost all
major oil and gas biddings across the globe.
Business Overview
WGSRL manufactures high grade line pipes-Submerged Arc Welded (both spiral and
longitudinal), branch pipes (Electric Resistant Welded Pipes-ERW) and also does coating.
The variety of products caters to diverse applications of resource transportation and
distribution. Global demand for LSAW is predominant over other types of pipes in critical
applications (particularly deep off-shore and sour gas applications) due to its safety and
quality features required in the oil &gas industry. The company is able to capitalize on the
demand across many conditions and applications with its varied product mix. The company
also caters to the water segment by supplying HSAW pipes for water transportation.
Capacity details
Its manufacturing facilities are located in Gujarat in western India, in proximity to the National
Highway and Sea ports. It has a technology tie-up with Capello Tubi Italy and SMS Meer
Germany (Mannesmann Demag) and EUPEC, Germany. The Company is approved by more
than 40 Oil & Gas giants across the globe.
Sectoral Presence
Oil40%
Gas45%
Water15%
Source : Company, HDFC Sec Research
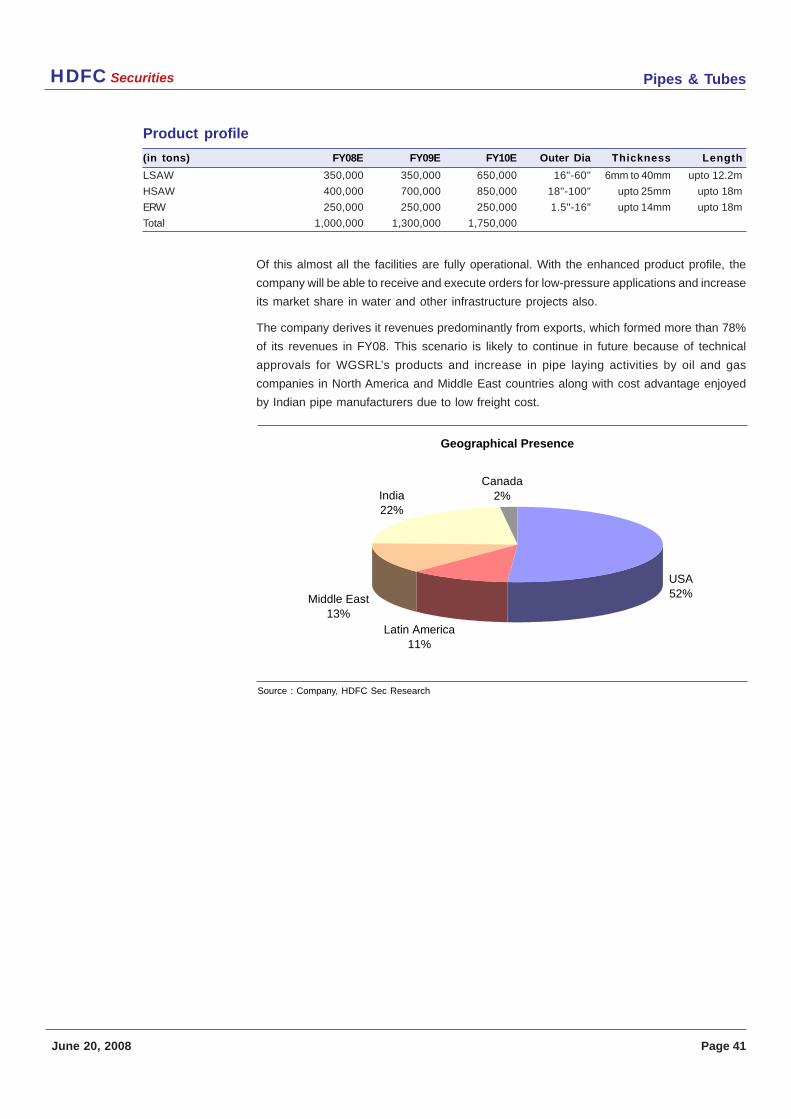
Pipes & TubesHDFC Securities
June 20, 2008 Page 41
Product profile
(in tons) FY08E FY09E FY10E Outer Dia Thickness Length
LSAW 350,000 350,000 650,000 16"-60" 6mm to 40mm upto 12.2m
HSAW 400,000 700,000 850,000 18"-100" upto 25mm upto 18m
ERW 250,000 250,000 250,000 1.5"-16" upto 14mm upto 18m
Total 1,000,000 1,300,000 1,750,000
Of this almost all the facilities are fully operational. With the enhanced product profile, the
company will be able to receive and execute orders for low-pressure applications and increase
its market share in water and other infrastructure projects also.
The company derives it revenues predominantly from exports, which formed more than 78%
of its revenues in FY08. This scenario is likely to continue in future because of technical
approvals for WGSRL’s products and increase in pipe laying activities by oil and gas
companies in North America and Middle East countries along with cost advantage enjoyed
by Indian pipe manufacturers due to low freight cost.
Geographical Presence
USA52%
Latin America11%
India22%
Canada2%
Middle East13%
Source : Company, HDFC Sec Research
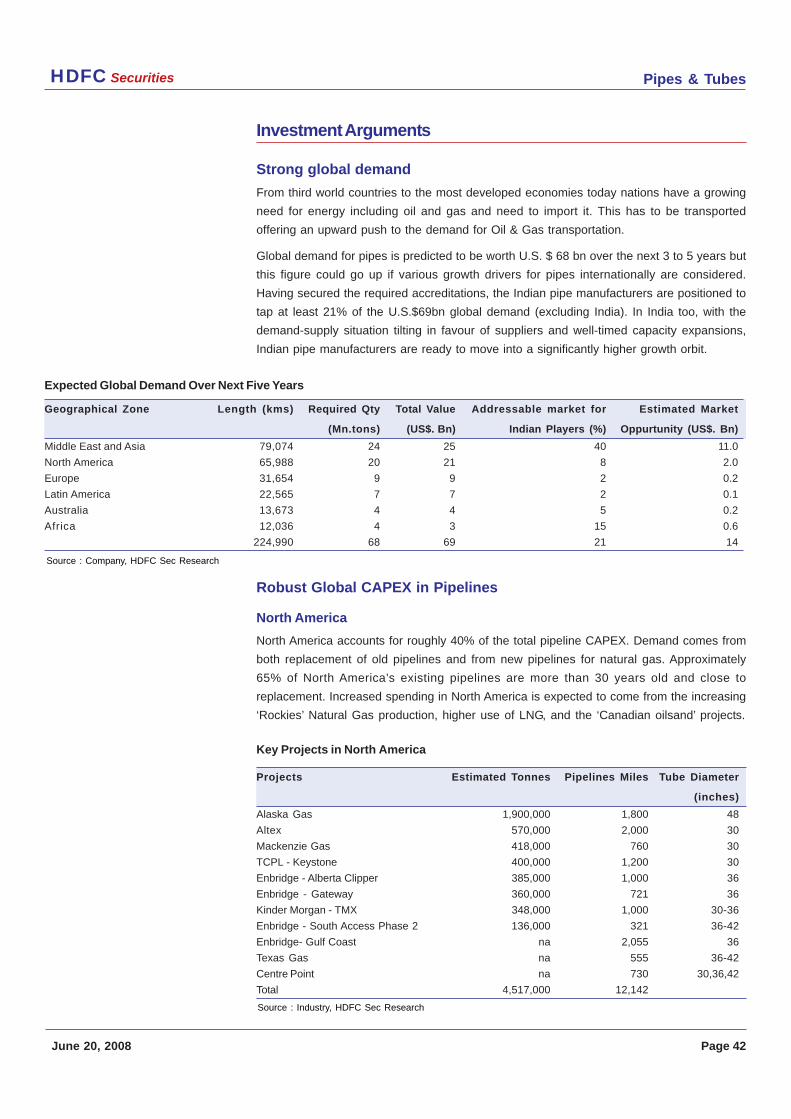
Pipes & TubesHDFC Securities
June 20, 2008 Page 42
Investment Arguments
Strong global demand
From third world countries to the most developed economies today nations have a growing
need for energy including oil and gas and need to import it. This has to be transported
offering an upward push to the demand for Oil & Gas transportation.
Global demand for pipes is predicted to be worth U.S. $ 68 bn over the next 3 to 5 years but
this figure could go up if various growth drivers for pipes internationally are considered.
Having secured the required accreditations, the Indian pipe manufacturers are positioned to
tap at least 21% of the U.S.$69bn global demand (excluding India). In India too, with the
demand-supply situation tilting in favour of suppliers and well-timed capacity expansions,
Indian pipe manufacturers are ready to move into a significantly higher growth orbit.
Expected Global Demand Over Next Five Years
Geographical Zone Length (kms) Required Qty Total Value Addressable market for Estimated Market
(Mn.tons) (US$. Bn) Indian Players (%) Oppurtunity (US$. Bn)
Middle East and Asia 79,074 24 25 40 11.0
North America 65,988 20 21 8 2.0
Europe 31,654 9 9 2 0.2
Latin America 22,565 7 7 2 0.1
Australia 13,673 4 4 5 0.2
Africa 12,036 4 3 15 0.6
224,990 68 69 21 14
Robust Global CAPEX in Pipelines
North America
North America accounts for roughly 40% of the total pipeline CAPEX. Demand comes from
both replacement of old pipelines and from new pipelines for natural gas. Approximately
65% of North America’s existing pipelines are more than 30 years old and close to
replacement. Increased spending in North America is expected to come from the increasing
‘Rockies’ Natural Gas production, higher use of LNG, and the ‘Canadian oilsand’ projects.
Key Projects in North America
Projects Estimated Tonnes Pipelines Miles Tube Diameter
(inches)
Alaska Gas 1,900,000 1,800 48
Altex 570,000 2,000 30
Mackenzie Gas 418,000 760 30
TCPL - Keystone 400,000 1,200 30
Enbridge - Alberta Clipper 385,000 1,000 36
Enbridge - Gateway 360,000 721 36
Kinder Morgan - TMX 348,000 1,000 30-36
Enbridge - South Access Phase 2 136,000 321 36-42
Enbridge- Gulf Coast na 2,055 36
Texas Gas na 555 36-42
Centre Point na 730 30,36,42
Total 4,517,000 12,142
Source : Company, HDFC Sec Research
Source : Industry, HDFC Sec Research
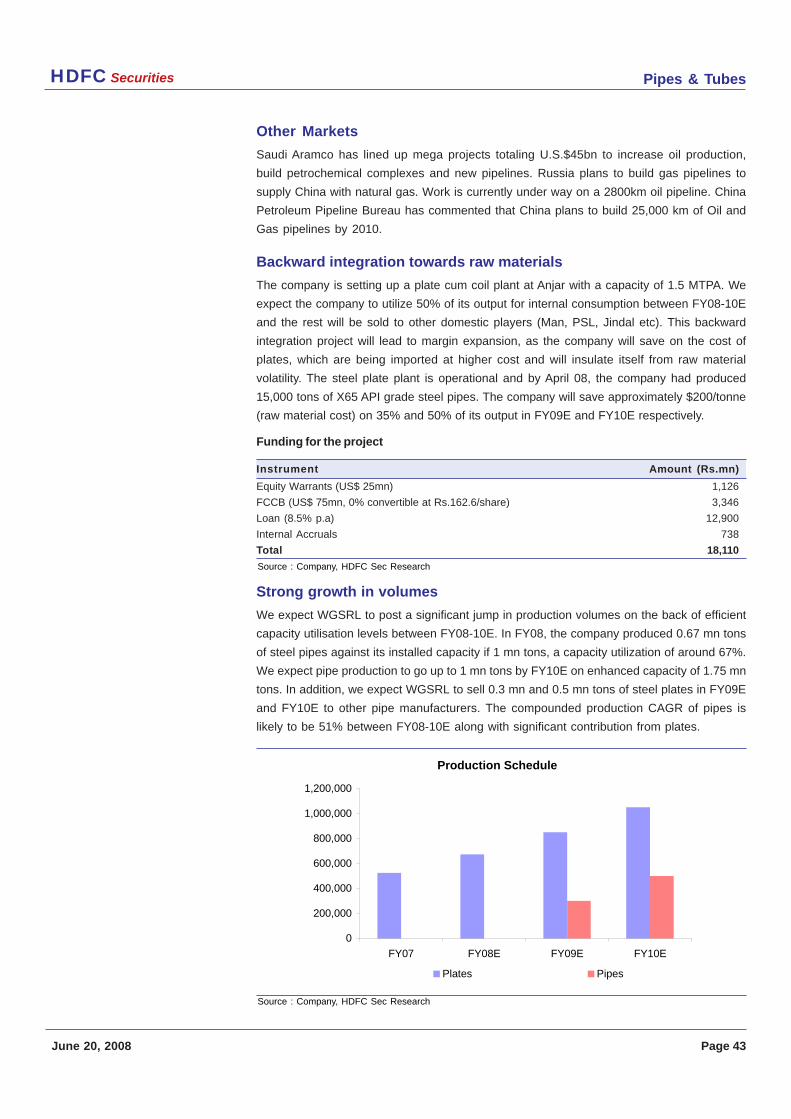
Pipes & TubesHDFC Securities
June 20, 2008 Page 43
Other Markets
Saudi Aramco has lined up mega projects totaling U.S.$45bn to increase oil production,
build petrochemical complexes and new pipelines. Russia plans to build gas pipelines to
supply China with natural gas. Work is currently under way on a 2800km oil pipeline. China
Petroleum Pipeline Bureau has commented that China plans to build 25,000 km of Oil and
Gas pipelines by 2010.
Backward integration towards raw materials
The company is setting up a plate cum coil plant at Anjar with a capacity of 1.5 MTPA. We
expect the company to utilize 50% of its output for internal consumption between FY08-10E
and the rest will be sold to other domestic players (Man, PSL, Jindal etc). This backward
integration project will lead to margin expansion, as the company will save on the cost of
plates, which are being imported at higher cost and will insulate itself from raw material
volatility. The steel plate plant is operational and by April 08, the company had produced
15,000 tons of X65 API grade steel pipes. The company will save approximately $200/tonne
(raw material cost) on 35% and 50% of its output in FY09E and FY10E respectively.
Funding for the project
Instrument Amount (Rs.mn)
Equity Warrants (US$ 25mn) 1,126
FCCB (US$ 75mn, 0% convertible at Rs.162.6/share) 3,346
Loan (8.5% p.a) 12,900
Internal Accruals 738
Total 18,110
Strong growth in volumes
We expect WGSRL to post a significant jump in production volumes on the back of efficient
capacity utilisation levels between FY08-10E. In FY08, the company produced 0.67 mn tons
of steel pipes against its installed capacity if 1 mn tons, a capacity utilization of around 67%.
We expect pipe production to go up to 1 mn tons by FY10E on enhanced capacity of 1.75 mn
tons. In addition, we expect WGSRL to sell 0.3 mn and 0.5 mn tons of steel plates in FY09E
and FY10E to other pipe manufacturers. The compounded production CAGR of pipes is
likely to be 51% between FY08-10E along with significant contribution from plates.
Production Schedule
0
200,000
400,000
600,000
800,000
1,000,000
1,200,000
FY07 FY08E FY09E FY10E
Plates Pipes
Source : Company, HDFC Sec Research
Source : Company, HDFC Sec Research
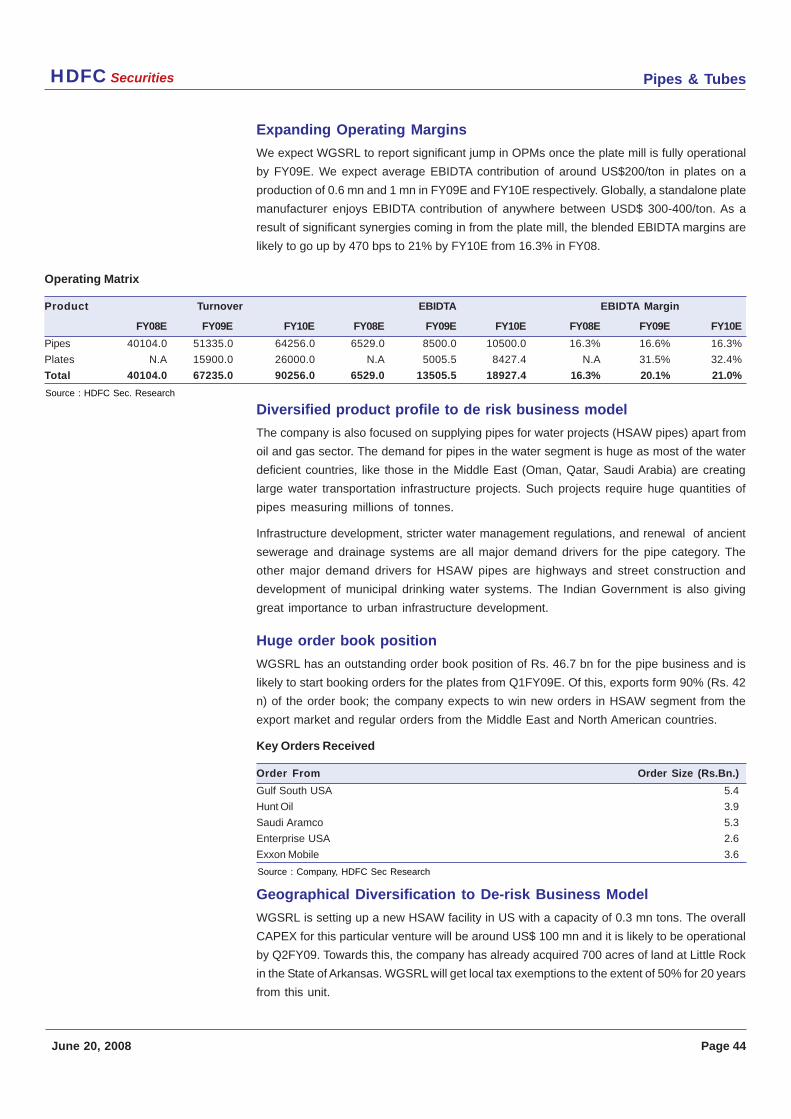
Pipes & TubesHDFC Securities
June 20, 2008 Page 44
Expanding Operating Margins
We expect WGSRL to report significant jump in OPMs once the plate mill is fully operational
by FY09E. We expect average EBIDTA contribution of around US$200/ton in plates on a
production of 0.6 mn and 1 mn in FY09E and FY10E respectively. Globally, a standalone plate
manufacturer enjoys EBIDTA contribution of anywhere between USD$ 300-400/ton. As a
result of significant synergies coming in from the plate mill, the blended EBIDTA margins are
likely to go up by 470 bps to 21% by FY10E from 16.3% in FY08.
Operating Matrix
Product Turnover EBIDTA EBIDTA Margin
FY08E FY09E FY10E FY08E FY09E FY10E FY08E FY09E FY10E
Pipes 40104.0 51335.0 64256.0 6529.0 8500.0 10500.0 16.3% 16.6% 16.3%
Plates N.A 15900.0 26000.0 N.A 5005.5 8427.4 N.A 31.5% 32.4%
Total 40104.0 67235.0 90256.0 6529.0 13505.5 18927.4 16.3% 20.1% 21.0%
Diversified product profile to de risk business model
The company is also focused on supplying pipes for water projects (HSAW pipes) apart from
oil and gas sector. The demand for pipes in the water segment is huge as most of the water
deficient countries, like those in the Middle East (Oman, Qatar, Saudi Arabia) are creating
large water transportation infrastructure projects. Such projects require huge quantities of
pipes measuring millions of tonnes.
Infrastructure development, stricter water management regulations, and renewal of ancient
sewerage and drainage systems are all major demand drivers for the pipe category. The
other major demand drivers for HSAW pipes are highways and street construction and
development of municipal drinking water systems. The Indian Government is also giving
great importance to urban infrastructure development.
Huge order book position
WGSRL has an outstanding order book position of Rs. 46.7 bn for the pipe business and is
likely to start booking orders for the plates from Q1FY09E. Of this, exports form 90% (Rs. 42
n) of the order book; the company expects to win new orders in HSAW segment from the
export market and regular orders from the Middle East and North American countries.
Key Orders Received
Order From Order Size (Rs.Bn.)
Gulf South USA 5.4
Hunt Oil 3.9
Saudi Aramco 5.3
Enterprise USA 2.6
Exxon Mobile 3.6
Geographical Diversification to De-risk Business Model
WGSRL is setting up a new HSAW facility in US with a capacity of 0.3 mn tons. The overall
CAPEX for this particular venture will be around US$ 100 mn and it is likely to be operational
by Q2FY09. Towards this, the company has already acquired 700 acres of land at Little Rock
in the State of Arkansas. WGSRL will get local tax exemptions to the extent of 50% for 20 years
from this unit.
Source : HDFC Sec. Research
Source : Company, HDFC Sec Research
Pipes & TubesHDFC Securities
June 20, 2008 Page 45
Key Concerns
Steel Cost
Steel cost is the largest cost component and thus non-availability or variations in steel prices
may affect profitability. However, the company tries to soften this by pre-booking its steel
requirements to the maximum extent.
Foreign Exchange Volatility
The foreign exchange markets, including the Rupee, have become more volatile, impacting
profitability. The company mitigates this risk by conservatively buying forward cover for the
exchange to the extent of the difference between its import and export transactions.
Execution Delay
Any delay in ramp-up of its plate mill may impact growth visibility going forward. However, we
believe that the chances of such a delay are unlikely beyond H1FY09E. Therefore for our
estimates we have taken the benefits accruing post the commencement of the plate mill only
to the extent of 40% and 60% in FY09E and FY10E respectively.
Pipes & TubesHDFC Securities
June 20, 2008 Page 46
Financial Analysis
Quarterly Earnings
Year End March 31 (Rs.Mn) Q407 Q408 Y-o-Y FY07 FY08
Net Sales 7400 12275 65.9% 26834.0 40104.0
Total Income 7447 12383 66.3% 26955.0 40290.0
Total Expenditure 6509 10312 58.4% 23549.0 33575.0
Operating Profit 891.0 1963.0 120.3% 3285.0 6529.0
EBIDTA 938.0 2071.0 120.8% 3406.0 6715.0
Interest 178 346 94.4% 739.0 801.0
PBDT 760.0 1725.0 127.0% 2667.0 5914.0
Depreciation 122 180 47.5% 476.0 572.0
PBT 638.0 1545.0 142.2% 2191.0 5342.0
Tax 223 523 134.5% 765.0 1828.0
PAT 414.0 1022.0 146.9% 1426.0 3514.0
Equity (FV = 5) 939 939 938.9 938.9
Ratios
OPM 12.8% 16.0% 320.2 12.2% 16.3%
Tax / PBT 36.0% 33.9% -217.4 34.9% 34.2%
NPM (Before EOI) 5.5% 8.3% 272.7 5.3% 8.7%
Cash EPS 2.9 6.4 120.7% 10.1 21.8
EPS 2.2 5.4 145.5% 7.6 18.7
Financial Highlights
• For Q4 FY08, WGSRL has achieved a net turnover of Rs. 12.27 bn, a growth of 65.9% over Q4 FY07 and
during FY08 the turnover went up by 49.5% to Rs. 40 bn compared to Rs. 26.8 bn in 9MFY08.
• The operating profits during the quarter were up by 120.3% y-o-y at Rs. 1.96 bn and PAT showed an increase
of 146.3% to Rs. 102.2 mn. Operating profits showed a sharp growth on the back of significant improvement
in realizations by 24% to Rs. 63,136/ton from Rs. 51,014/ton in FY07.
• OPMs increased by 395 bps to 16% in Q4 FY08 from 12% in Q4 FY07 mainly due to order execution of higher
value added HSAW and LSAW pipes. As per the our discussion with the management, the majority (75%) of
the orders executed during the quarter and the existing orders in hand are of very high value segment, where
there is less competition from domestic the players.
• During the year, the company sold 635,203 tons compared to 526,017 tons in FY07, a volume growth of 21%
for FY08. EBIDTA per ton went up during FY08 by 65% to Rs. 10,280/ton compared to Rs. 6,245/ton in FY07.
Source : Company, HDFC Sec Research
Pipes & TubesHDFC Securities
June 20, 2008 Page 47
DCF Analysis
Rm 20% Expected Returns from Market
Rf 8.5% Risk Free Rate
B 1 Beta - Assumed Higher Beta for capturing volatility
Cost of debt (Pretax) 10% Average cost of debt
Tax rate 30%
Post tax cost of debt 7%
Cost of equity 20% Re = Rf + (Rm-Rf)*B
We 43% Weights assigned as per target D/E ratio by FY08E
Wd 57%
WACC 14.4%
NPV per share 774 Assuming Terminal Growth Rate of 3% beyond 2014
Assumptions
• For additional conservatism we have not assumed any benefits from the plate plant.
The plate margins could be as high as its pipe margins (15%) but we have assumed
incremental margin benefit of only 470 bps between FY07-10E, whereas the margin
expansion can even be 1500 bps during the same period.
• The NPV calculation is based on current prices of pipes and plates. For future orders
also, prices have been kept flat or reduced to the extent of benefit due to backward
integration.
• The above NPV calculation is based on its fully diluted equity in FY09E and does not
take into account any further dilution, which may happen during the same period.
WGSRL trades at 10.7x and 7x its expected fully diluted earnings of FY09E and FY10E
respectively. Historically, the stock has traded in the P/E band of less than 15x. However, it
has re-rated significantly over the last couple of quarters on the back of significant
improvements in margins and robust profits. We believe that it should ideally trade at 20x
FY09E and 15x FY10E, given the robust momentum in earnings expected during the same
period. The fair value as per our FY10E comes to around Rs. 774. Also, other key reasons on
why this stock should command such P/E multiple are as follows.
• Strong order backlog of almost 1x FY08 turnover, giving clear visibility of its long-term
growth.
• Only Indian manufacturer to get into backward integration to decrease the volatility in
raw material prices and capture the entire value chain.
• WGSRL does not face any competition from the domestic players for more than 75% of
its order book position.
Source : HDFC Sec Research
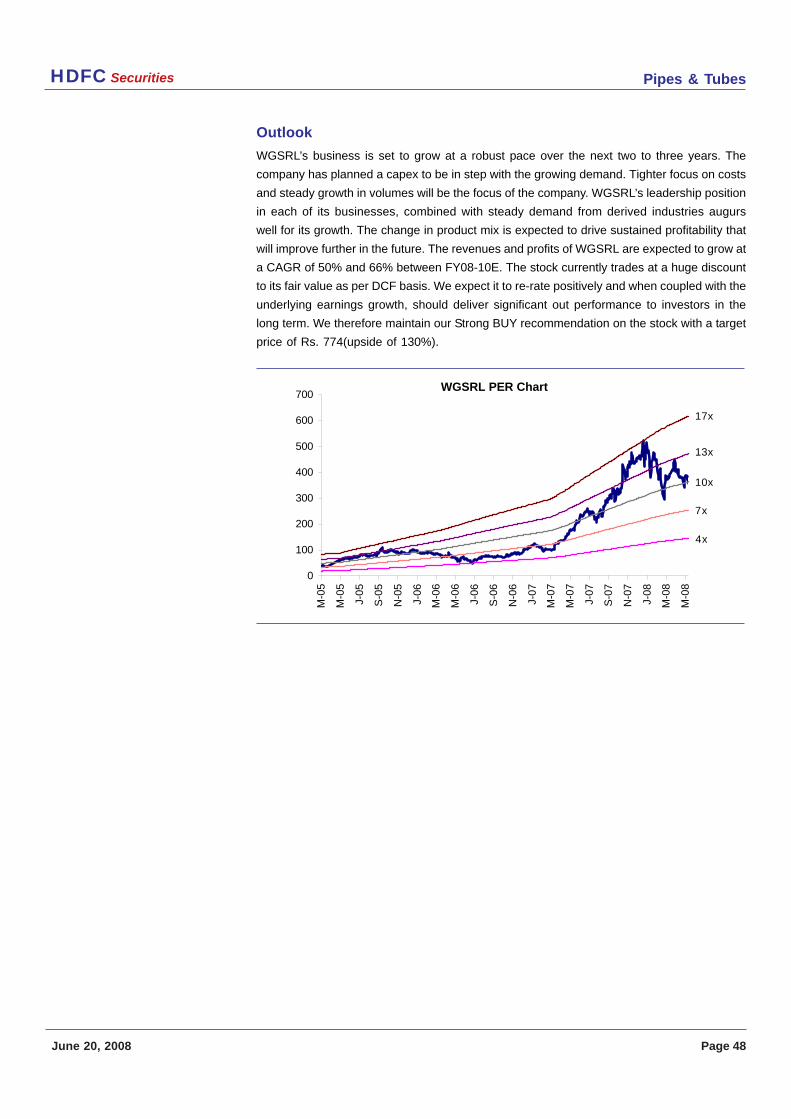
Pipes & TubesHDFC Securities
June 20, 2008 Page 48
Outlook
WGSRL’s business is set to grow at a robust pace over the next two to three years. The
company has planned a capex to be in step with the growing demand. Tighter focus on costs
and steady growth in volumes will be the focus of the company. WGSRL’s leadership position
in each of its businesses, combined with steady demand from derived industries augurs
well for its growth. The change in product mix is expected to drive sustained profitability that
will improve further in the future. The revenues and profits of WGSRL are expected to grow at
a CAGR of 50% and 66% between FY08-10E. The stock currently trades at a huge discount
to its fair value as per DCF basis. We expect it to re-rate positively and when coupled with the
underlying earnings growth, should deliver significant out performance to investors in the
long term. We therefore maintain our Strong BUY recommendation on the stock with a target
price of Rs. 774(upside of 130%).
WGSRL PER Chart
0
100
200
300
400
500
600
700
M-0
5
M-0
5
J-05
S-0
5
N-0
5
J-06
M-0
6
M-0
6
J-06
S-0
6
N-0
6
J-07
M-0
7
M-0
7
J-07
S-0
7
N-0
7
J-08
M-0
8
M-0
8
4x
7x
10x
13x
17x
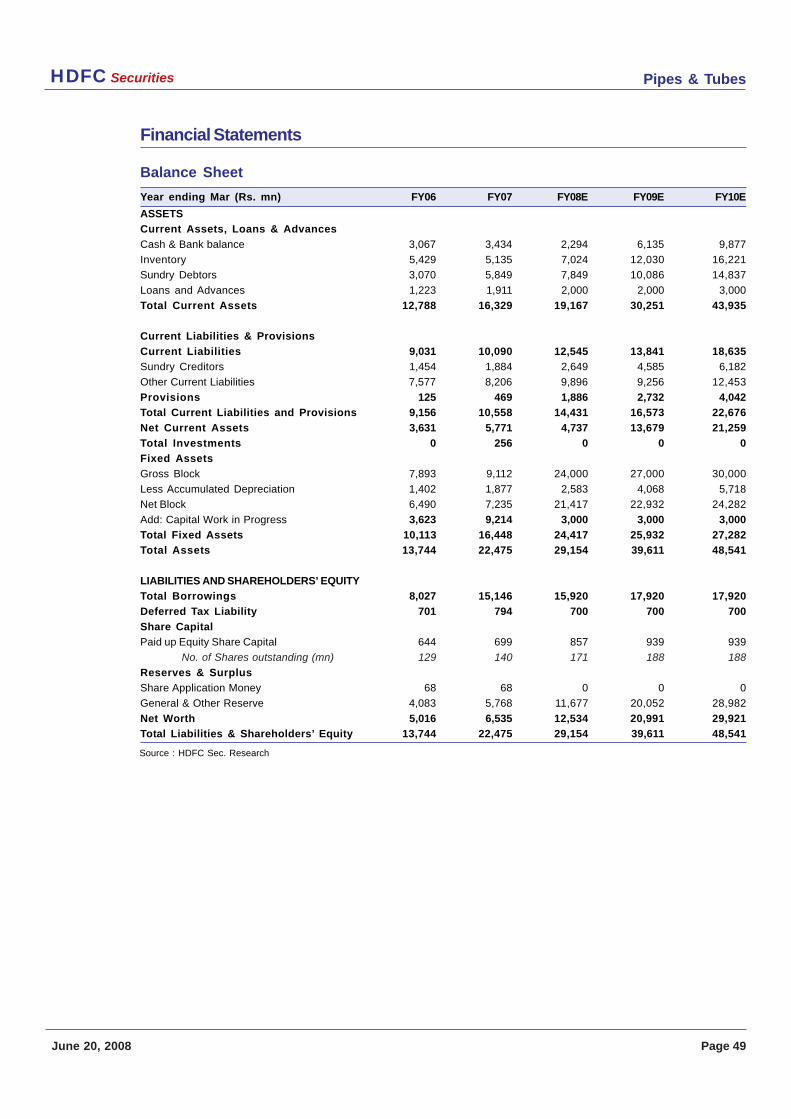
Pipes & TubesHDFC Securities
June 20, 2008 Page 49
Balance Sheet
Year ending Mar (Rs. mn) FY06 FY07 FY08E FY09E FY10E
ASSETS
Current Assets, Loans & Advances
Cash & Bank balance 3,067 3,434 2,294 6,135 9,877
Inventory 5,429 5,135 7,024 12,030 16,221
Sundry Debtors 3,070 5,849 7,849 10,086 14,837
Loans and Advances 1,223 1,911 2,000 2,000 3,000
Total Current Assets 12,788 16,329 19,167 30,251 43,935
Current Liabilities & Provisions
Current Liabilities 9,031 10,090 12,545 13,841 18,635
Sundry Creditors 1,454 1,884 2,649 4,585 6,182
Other Current Liabilities 7,577 8,206 9,896 9,256 12,453
Provisions 125 469 1,886 2,732 4,042
Total Current Liabilities and Provisions 9,156 10,558 14,431 16,573 22,676
Net Current Assets 3,631 5,771 4,737 13,679 21,259
Total Investments 0 256 0 0 0
Fixed Assets
Gross Block 7,893 9,112 24,000 27,000 30,000
Less Accumulated Depreciation 1,402 1,877 2,583 4,068 5,718
Net Block 6,490 7,235 21,417 22,932 24,282
Add: Capital Work in Progress 3,623 9,214 3,000 3,000 3,000
Total Fixed Assets 10,113 16,448 24,417 25,932 27,282
Total Assets 13,744 22,475 29,154 39,611 48,541
LIABILITIES AND SHAREHOLDERS’ EQUITY
Total Borrowings 8,027 15,146 15,920 17,920 17,920
Deferred Tax Liability 701 794 700 700 700
Share Capital
Paid up Equity Share Capital 644 699 857 939 939
No. of Shares outstanding (mn) 129 140 171 188 188
Reserves & Surplus
Share Application Money 68 68 0 0 0
General & Other Reserve 4,083 5,768 11,677 20,052 28,982
Net Worth 5,016 6,535 12,534 20,991 29,921
Total Liabilities & Shareholders’ Equity 13,744 22,475 29,154 39,611 48,541
Financial Statements
Source : HDFC Sec. Research
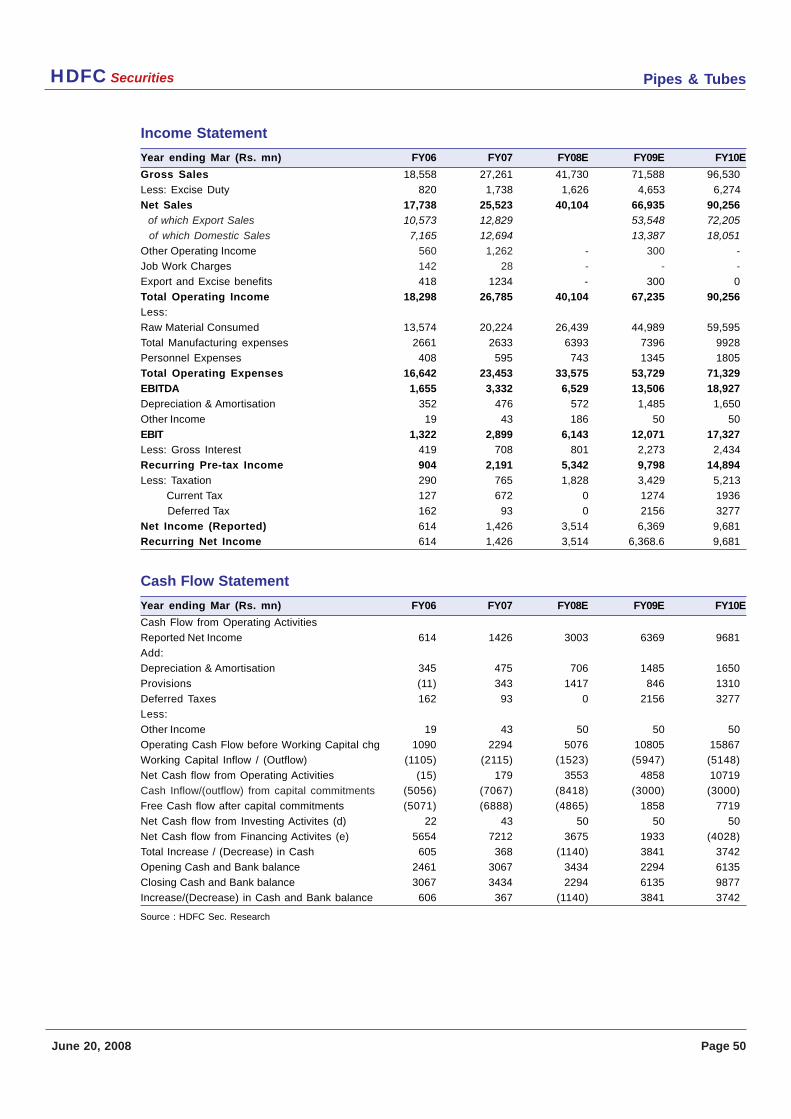
Pipes & TubesHDFC Securities
June 20, 2008 Page 50
Income Statement
Year ending Mar (Rs. mn) FY06 FY07 FY08E FY09E FY10E
Gross Sales 18,558 27,261 41,730 71,588 96,530
Less: Excise Duty 820 1,738 1,626 4,653 6,274
Net Sales 17,738 25,523 40,104 66,935 90,256
of which Export Sales 10,573 12,829 53,548 72,205
of which Domestic Sales 7,165 12,694 13,387 18,051
Other Operating Income 560 1,262 - 300 -
Job Work Charges 142 28 - - -
Export and Excise benefits 418 1234 - 300 0
Total Operating Income 18,298 26,785 40,104 67,235 90,256
Less:
Raw Material Consumed 13,574 20,224 26,439 44,989 59,595
Total Manufacturing expenses 2661 2633 6393 7396 9928
Personnel Expenses 408 595 743 1345 1805
Total Operating Expenses 16,642 23,453 33,575 53,729 71,329
EBITDA 1,655 3,332 6,529 13,506 18,927
Depreciation & Amortisation 352 476 572 1,485 1,650
Other Income 19 43 186 50 50
EBIT 1,322 2,899 6,143 12,071 17,327
Less: Gross Interest 419 708 801 2,273 2,434
Recurring Pre-tax Income 904 2,191 5,342 9,798 14,894
Less: Taxation 290 765 1,828 3,429 5,213
Current Tax 127 672 0 1274 1936
Deferred Tax 162 93 0 2156 3277
Net Income (Reported) 614 1,426 3,514 6,369 9,681
Recurring Net Income 614 1,426 3,514 6,368.6 9,681
Cash Flow Statement
Year ending Mar (Rs. mn) FY06 FY07 FY08E FY09E FY10E
Cash Flow from Operating Activities
Reported Net Income 614 1426 3003 6369 9681
Add:
Depreciation & Amortisation 345 475 706 1485 1650
Provisions (11) 343 1417 846 1310
Deferred Taxes 162 93 0 2156 3277
Less:
Other Income 19 43 50 50 50
Operating Cash Flow before Working Capital chg 1090 2294 5076 10805 15867
Working Capital Inflow / (Outflow) (1105) (2115) (1523) (5947) (5148)
Net Cash flow from Operating Activities (15) 179 3553 4858 10719
Cash Inflow/(outflow) from capital commitments (5056) (7067) (8418) (3000) (3000)
Free Cash flow after capital commitments (5071) (6888) (4865) 1858 7719
Net Cash flow from Investing Activites (d) 22 43 50 50 50
Net Cash flow from Financing Activites (e) 5654 7212 3675 1933 (4028)
Total Increase / (Decrease) in Cash 605 368 (1140) 3841 3742
Opening Cash and Bank balance 2461 3067 3434 2294 6135
Closing Cash and Bank balance 3067 3434 2294 6135 9877
Increase/(Decrease) in Cash and Bank balance 606 367 (1140) 3841 3742
Source : HDFC Sec. Research
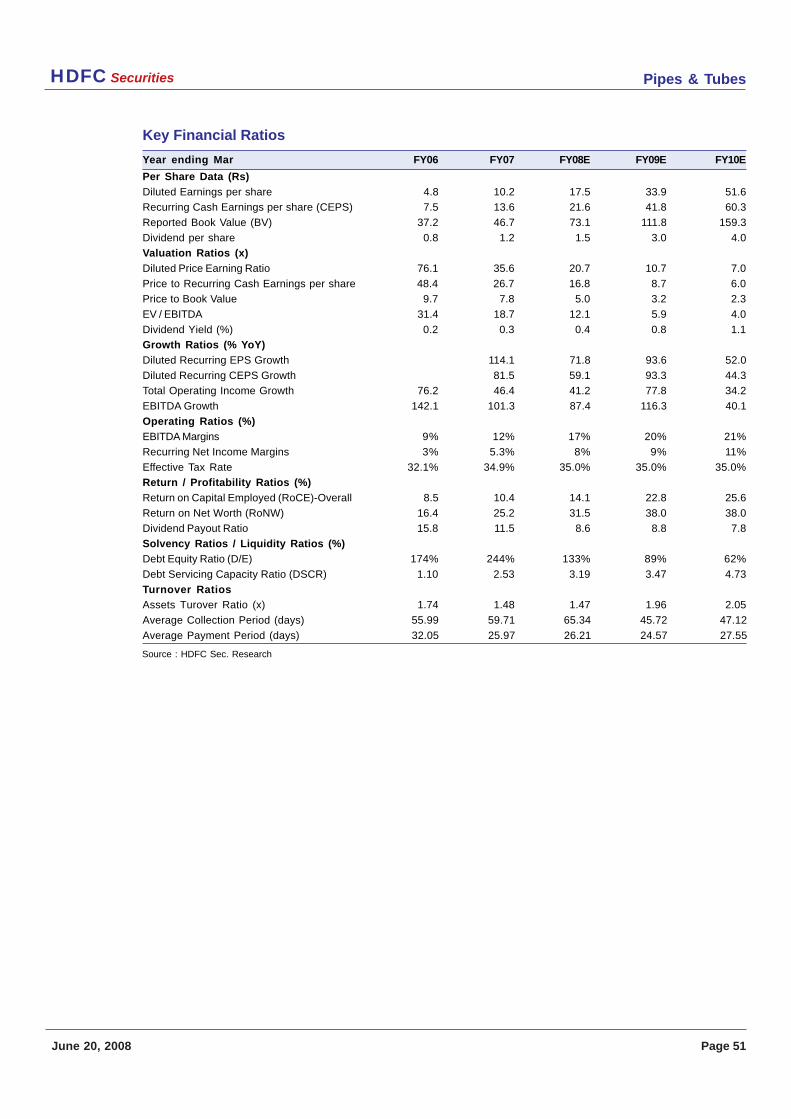
Pipes & TubesHDFC Securities
June 20, 2008 Page 51
Key Financial Ratios
Year ending Mar FY06 FY07 FY08E FY09E FY10E
Per Share Data (Rs)
Diluted Earnings per share 4.8 10.2 17.5 33.9 51.6
Recurring Cash Earnings per share (CEPS) 7.5 13.6 21.6 41.8 60.3
Reported Book Value (BV) 37.2 46.7 73.1 111.8 159.3
Dividend per share 0.8 1.2 1.5 3.0 4.0
Valuation Ratios (x)
Diluted Price Earning Ratio 76.1 35.6 20.7 10.7 7.0
Price to Recurring Cash Earnings per share 48.4 26.7 16.8 8.7 6.0
Price to Book Value 9.7 7.8 5.0 3.2 2.3
EV / EBITDA 31.4 18.7 12.1 5.9 4.0
Dividend Yield (%) 0.2 0.3 0.4 0.8 1.1
Growth Ratios (% YoY)
Diluted Recurring EPS Growth 114.1 71.8 93.6 52.0
Diluted Recurring CEPS Growth 81.5 59.1 93.3 44.3
Total Operating Income Growth 76.2 46.4 41.2 77.8 34.2
EBITDA Growth 142.1 101.3 87.4 116.3 40.1
Operating Ratios (%)
EBITDA Margins 9% 12% 17% 20% 21%
Recurring Net Income Margins 3% 5.3% 8% 9% 11%
Effective Tax Rate 32.1% 34.9% 35.0% 35.0% 35.0%
Return / Profitability Ratios (%)
Return on Capital Employed (RoCE)-Overall 8.5 10.4 14.1 22.8 25.6
Return on Net Worth (RoNW) 16.4 25.2 31.5 38.0 38.0
Dividend Payout Ratio 15.8 11.5 8.6 8.8 7.8
Solvency Ratios / Liquidity Ratios (%)
Debt Equity Ratio (D/E) 174% 244% 133% 89% 62%
Debt Servicing Capacity Ratio (DSCR) 1.10 2.53 3.19 3.47 4.73
Turnover Ratios
Assets Turover Ratio (x) 1.74 1.48 1.47 1.96 2.05
Average Collection Period (days) 55.99 59.71 65.34 45.72 47.12
Average Payment Period (days) 32.05 25.97 26.21 24.57 27.55
Source : HDFC Sec. Research
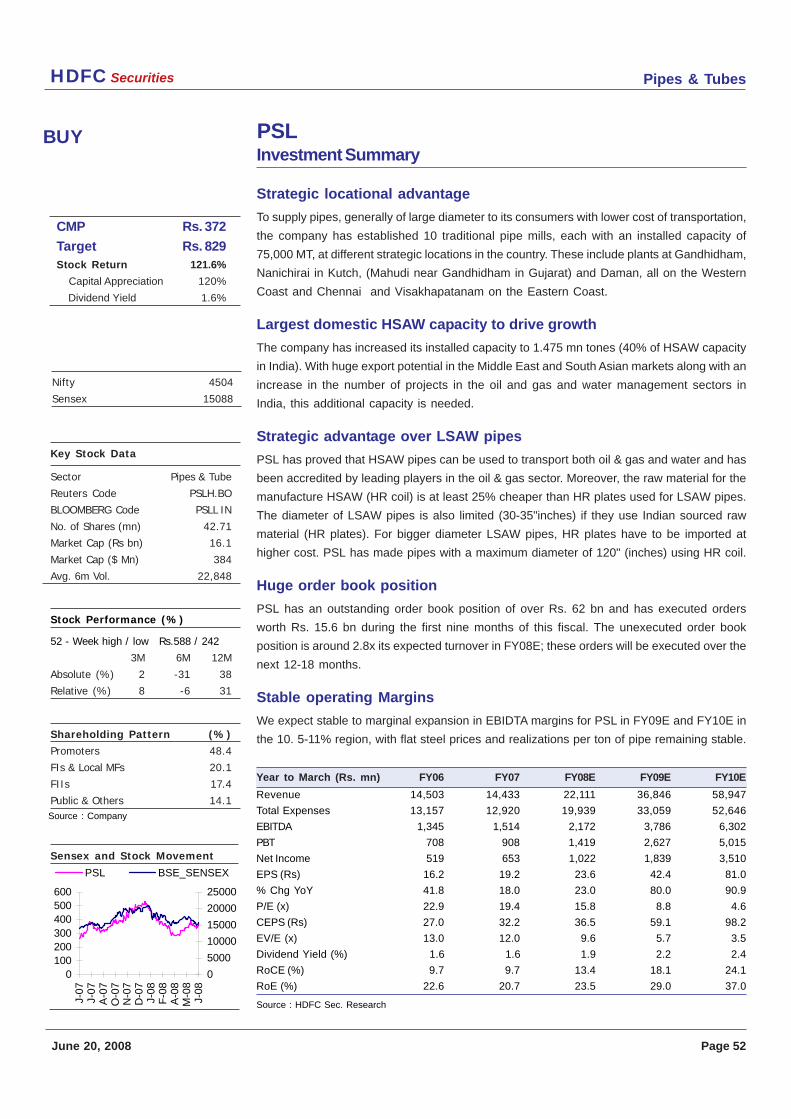
Pipes & TubesHDFC Securities
June 20, 2008 Page 52
BUY
Key Stock Data
Sector Pipes & Tube
Reuters Code PSLH.BO
BLOOMBERG Code PSLL IN
No. of Shares (mn) 42.71
Market Cap (Rs bn) 16.1
Market Cap ($ Mn) 384
Avg. 6m Vol. 22,848
Stock Performance (%)
52 - Week high / low Rs.588 / 242
3M 6M 12M
Absolute (%) 2 -31 38
Relative (%) 8 -6 31
Shareholding Pattern (%)
Promoters 48.4
FIs & Local MFs 20.1
FIIs 17.4
Public & Others 14.1
Sensex and Stock Movement
Nifty 4504
Sensex 15088
Source : Company
CMP Rs. 372
Target Rs. 829Stock Return 121.6%
Capital Appreciation 120%
Dividend Yield 1.6%
PSLInvestment Summary
Strategic locational advantage
To supply pipes, generally of large diameter to its consumers with lower cost of transportation,
the company has established 10 traditional pipe mills, each with an installed capacity of
75,000 MT, at different strategic locations in the country. These include plants at Gandhidham,
Nanichirai in Kutch, (Mahudi near Gandhidham in Gujarat) and Daman, all on the Western
Coast and Chennai and Visakhapatanam on the Eastern Coast.
Largest domestic HSAW capacity to drive growth
The company has increased its installed capacity to 1.475 mn tones (40% of HSAW capacity
in India). With huge export potential in the Middle East and South Asian markets along with an
increase in the number of projects in the oil and gas and water management sectors in
India, this additional capacity is needed.
Strategic advantage over LSAW pipes
PSL has proved that HSAW pipes can be used to transport both oil & gas and water and has
been accredited by leading players in the oil & gas sector. Moreover, the raw material for the
manufacture HSAW (HR coil) is at least 25% cheaper than HR plates used for LSAW pipes.
The diameter of LSAW pipes is also limited (30-35"inches) if they use Indian sourced raw
material (HR plates). For bigger diameter LSAW pipes, HR plates have to be imported at
higher cost. PSL has made pipes with a maximum diameter of 120" (inches) using HR coil.
Huge order book position
PSL has an outstanding order book position of over Rs. 62 bn and has executed orders
worth Rs. 15.6 bn during the first nine months of this fiscal. The unexecuted order book
position is around 2.8x its expected turnover in FY08E; these orders will be executed over the
next 12-18 months.
Stable operating Margins
We expect stable to marginal expansion in EBIDTA margins for PSL in FY09E and FY10E in
the 10. 5-11% region, with flat steel prices and realizations per ton of pipe remaining stable.
Year to March (Rs. mn) FY06 FY07 FY08E FY09E FY10E
Revenue 14,503 14,433 22,111 36,846 58,947
Total Expenses 13,157 12,920 19,939 33,059 52,646
EBITDA 1,345 1,514 2,172 3,786 6,302
PBT 708 908 1,419 2,627 5,015
Net Income 519 653 1,022 1,839 3,510
EPS (Rs) 16.2 19.2 23.6 42.4 81.0
% Chg YoY 41.8 18.0 23.0 80.0 90.9
P/E (x) 22.9 19.4 15.8 8.8 4.6
CEPS (Rs) 27.0 32.2 36.5 59.1 98.2
EV/E (x) 13.0 12.0 9.6 5.7 3.5
Dividend Yield (%) 1.6 1.6 1.9 2.2 2.4
RoCE (%) 9.7 9.7 13.4 18.1 24.1
RoE (%) 22.6 20.7 23.5 29.0 37.0
Source : HDFC Sec. Research
0100200300400500600
J-07
J-07
A-0
7O
-07
N-0
7D
-07
J-08
F-0
8A
-08
M-0
8J-
08
0
5000
10000
15000
20000
25000
PSL BSE_SENSEX
Pipes & TubesHDFC Securities
June 20, 2008 Page 53
Background
PSL (PSL) is the largest manufacturer of high-grade large diameter Helical Submerged Arc
Welded (HSAW) pipes in India. The company manufactures and supplies pipes certified to
API (American Petroleum Institute) standards for Oil, Gas and Water transmission as well as
Structural and Piling Applications for both Onshore and Offshore sectors. PSL is one of the
largest pipe manufacturers in India with 11 pipe mills strategically located along the coasts
in Chennai, Kandla and Daman with an annual capacity of 1,175,000 MT. PSL produces
pipes from 16" to 120" diameter with wall thickness from 5 mm to 25 mm. Its other business
segments include pipes coating, induction pipe bending and sacrificial anode manufacturing.
Over the years, PSL has successfully demonstrated its ability to manage multiple
assignments well on time and of high quality for both national and international customers.
Business Overview
PSL manufactures and supplies SPIRAL WELD PIPES certified by API (American Petroleum
Institute) standards for oil, gas and water transmission as well as structural and piling
applications for both onshore and offshore sectors.
Exports formed 20% of its total revenues in FY08E against more than 60% for other players
on account of higher usage of HSAW pipes in the domestic market, compared to LSAW
pipes. Going forward, this share is likely to remain constant. Demand from domestic
hydrocarbon majors and the impetus on water projects in the domestic market will utilize its
capacities and increase the domestic share of revenues for PSL.
The share of oil and gas to water projects, which stood at 70:30 in FY07 came down to 60:40
in FY08E as demand from water projects grew faster than from oil and gas. The company’s
positioning in both the sectors mitigates its risk of exposure to any particular sector.
Technical Capabilities
PSL is equipped to provide the Best in Yard Coating for large onshore and offshore projects.
The Pipe Coating Yard today provides a wide range of coating services as per international
technical specifications by leading consultants.
PSL’s expertise in Induction Pipe Bending spans over 2 decades and meets diverse high
quality requirements in accordance with ASTM, API, DIN, BS, ANSI, ASME PFI and other
international technical specifications.
Fusion Bonded Epoxy is ideally suited for protective coating on the complex surface
configuration of a reinforcing steel bar. The coating can withstand any hazardous
environmental condition.
These services give value to the pipes and offer a one-stop solution to clients’ demand.
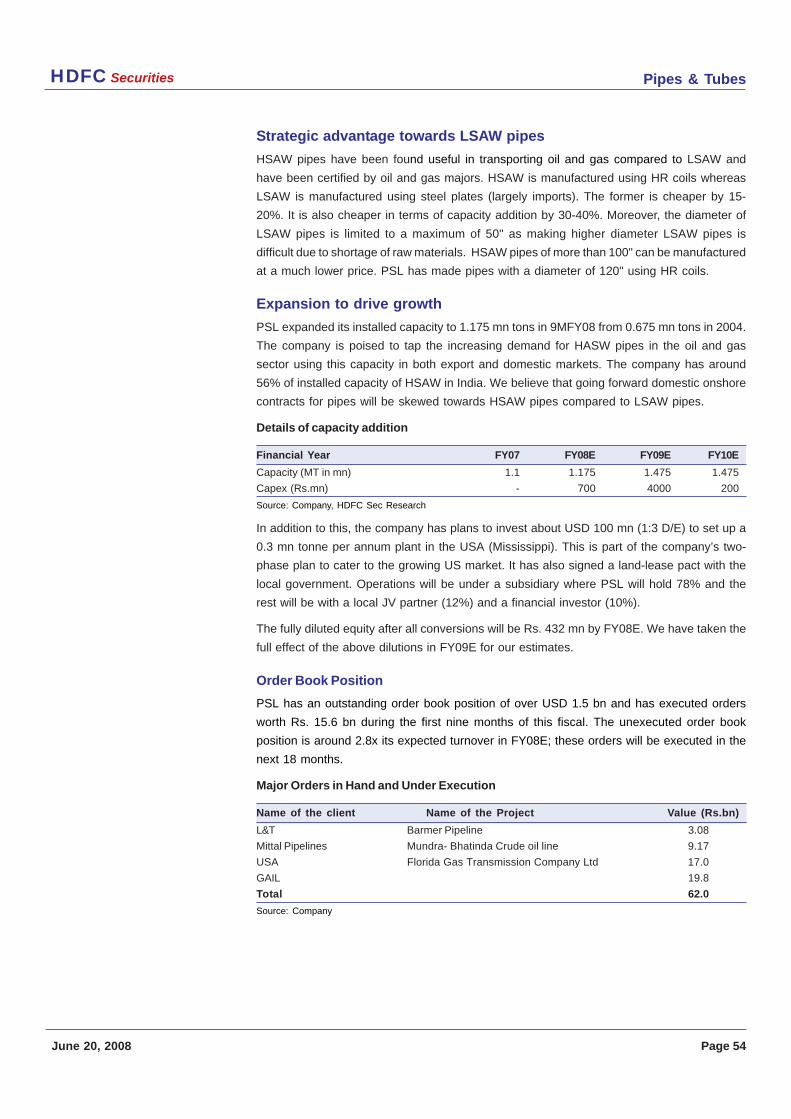
Pipes & TubesHDFC Securities
June 20, 2008 Page 54
Strategic advantage towards LSAW pipes
HSAW pipes have been found useful in transporting oil and gas compared to LSAW and
have been certified by oil and gas majors. HSAW is manufactured using HR coils whereas
LSAW is manufactured using steel plates (largely imports). The former is cheaper by 15-
20%. It is also cheaper in terms of capacity addition by 30-40%. Moreover, the diameter of
LSAW pipes is limited to a maximum of 50" as making higher diameter LSAW pipes is
difficult due to shortage of raw materials. HSAW pipes of more than 100" can be manufactured
at a much lower price. PSL has made pipes with a diameter of 120" using HR coils.
Expansion to drive growth
PSL expanded its installed capacity to 1.175 mn tons in 9MFY08 from 0.675 mn tons in 2004.
The company is poised to tap the increasing demand for HASW pipes in the oil and gas
sector using this capacity in both export and domestic markets. The company has around
56% of installed capacity of HSAW in India. We believe that going forward domestic onshore
contracts for pipes will be skewed towards HSAW pipes compared to LSAW pipes.
Details of capacity addition
Financial Year FY07 FY08E FY09E FY10E
Capacity (MT in mn) 1.1 1.175 1.475 1.475
Capex (Rs.mn) - 700 4000 200
Source: Company, HDFC Sec Research
In addition to this, the company has plans to invest about USD 100 mn (1:3 D/E) to set up a
0.3 mn tonne per annum plant in the USA (Mississippi). This is part of the company’s two-
phase plan to cater to the growing US market. It has also signed a land-lease pact with the
local government. Operations will be under a subsidiary where PSL will hold 78% and the
rest will be with a local JV partner (12%) and a financial investor (10%).
The fully diluted equity after all conversions will be Rs. 432 mn by FY08E. We have taken the
full effect of the above dilutions in FY09E for our estimates.
Order Book Position
PSL has an outstanding order book position of over USD 1.5 bn and has executed orders
worth Rs. 15.6 bn during the first nine months of this fiscal. The unexecuted order book
position is around 2.8x its expected turnover in FY08E; these orders will be executed in the
next 18 months.
Major Orders in Hand and Under Execution
Name of the client Name of the Project Value (Rs.bn)
L&T Barmer Pipeline 3.08
Mittal Pipelines Mundra- Bhatinda Crude oil line 9.17
USA Florida Gas Transmission Company Ltd 17.0
GAIL 19.8
Total 62.0
Source: Company
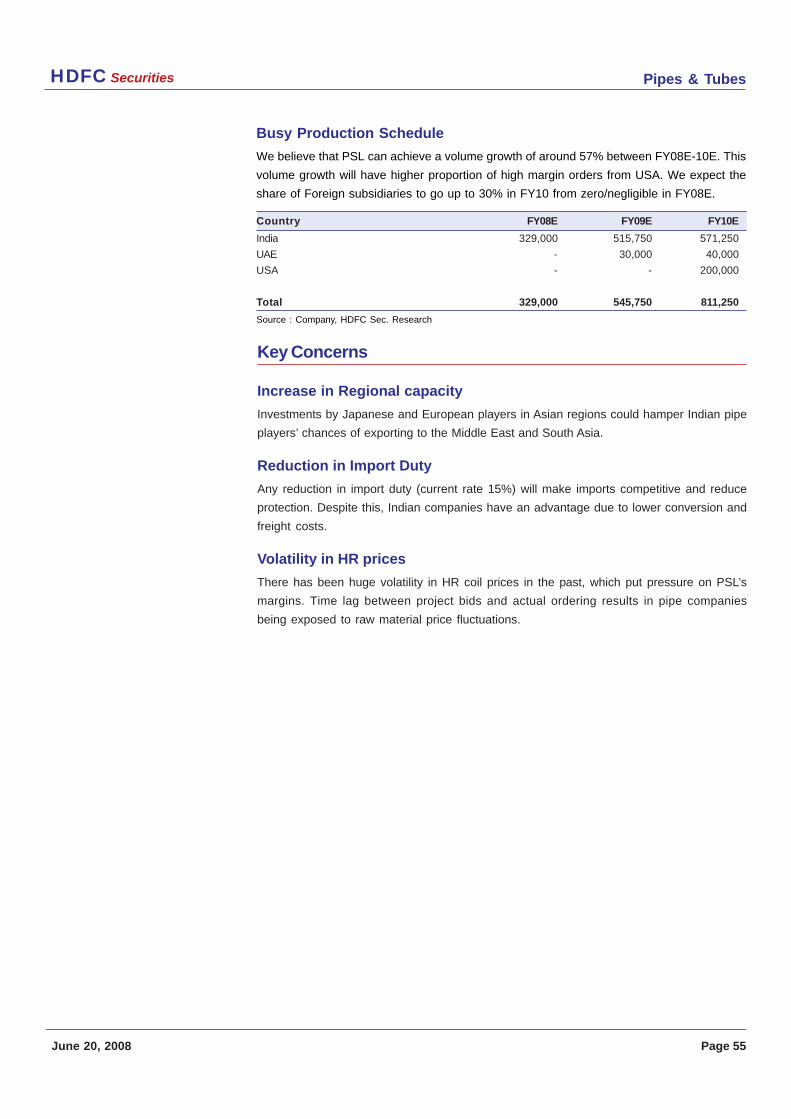
Pipes & TubesHDFC Securities
June 20, 2008 Page 55
Key Concerns
Increase in Regional capacity
Investments by Japanese and European players in Asian regions could hamper Indian pipe
players’ chances of exporting to the Middle East and South Asia.
Reduction in Import Duty
Any reduction in import duty (current rate 15%) will make imports competitive and reduce
protection. Despite this, Indian companies have an advantage due to lower conversion and
freight costs.
Volatility in HR prices
There has been huge volatility in HR coil prices in the past, which put pressure on PSL’s
margins. Time lag between project bids and actual ordering results in pipe companies
being exposed to raw material price fluctuations.
Busy Production Schedule
We believe that PSL can achieve a volume growth of around 57% between FY08E-10E. This
volume growth will have higher proportion of high margin orders from USA. We expect the
share of Foreign subsidiaries to go up to 30% in FY10 from zero/negligible in FY08E.
Country FY08E FY09E FY10E
India 329,000 515,750 571,250
UAE - 30,000 40,000
USA - - 200,000
Total 329,000 545,750 811,250
Source : Company, HDFC Sec. Research
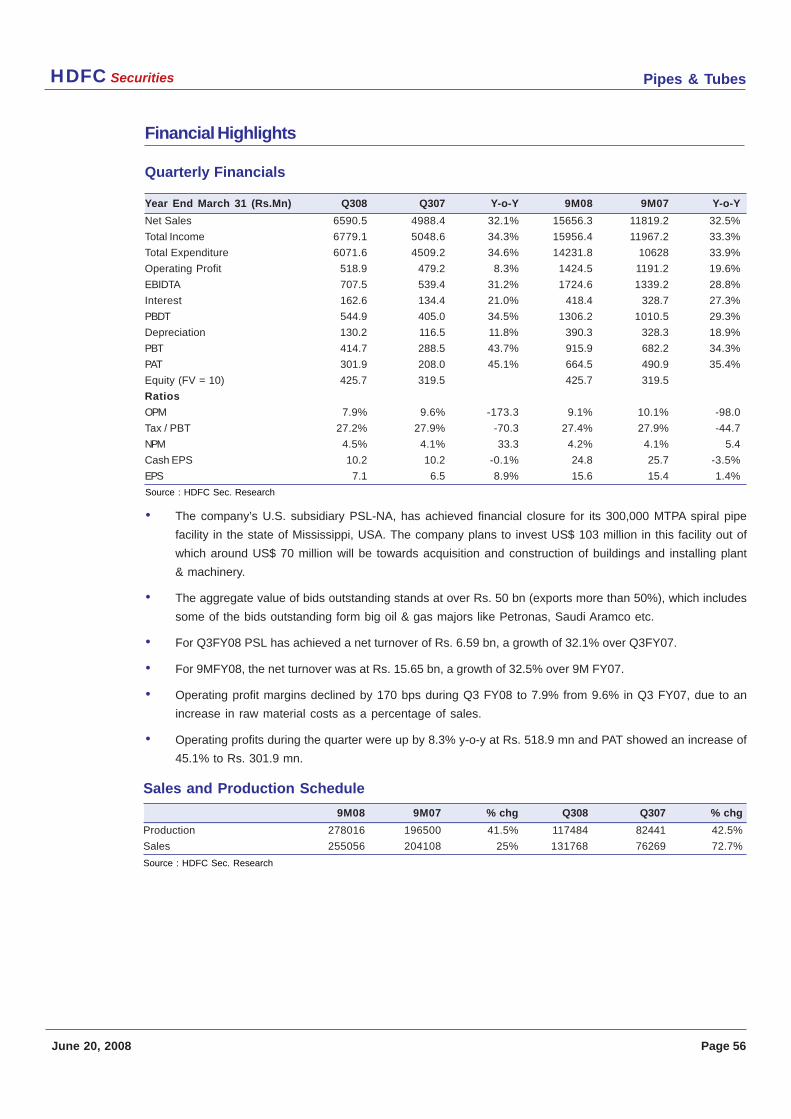
Pipes & TubesHDFC Securities
June 20, 2008 Page 56
Financial Highlights
Quarterly Financials
Year End March 31 (Rs.Mn) Q308 Q307 Y-o-Y 9M08 9M07 Y-o-Y
Net Sales 6590.5 4988.4 32.1% 15656.3 11819.2 32.5%
Total Income 6779.1 5048.6 34.3% 15956.4 11967.2 33.3%
Total Expenditure 6071.6 4509.2 34.6% 14231.8 10628 33.9%
Operating Profit 518.9 479.2 8.3% 1424.5 1191.2 19.6%
EBIDTA 707.5 539.4 31.2% 1724.6 1339.2 28.8%
Interest 162.6 134.4 21.0% 418.4 328.7 27.3%
PBDT 544.9 405.0 34.5% 1306.2 1010.5 29.3%
Depreciation 130.2 116.5 11.8% 390.3 328.3 18.9%
PBT 414.7 288.5 43.7% 915.9 682.2 34.3%
PAT 301.9 208.0 45.1% 664.5 490.9 35.4%
Equity (FV = 10) 425.7 319.5 425.7 319.5
Ratios
OPM 7.9% 9.6% -173.3 9.1% 10.1% -98.0
Tax / PBT 27.2% 27.9% -70.3 27.4% 27.9% -44.7
NPM 4.5% 4.1% 33.3 4.2% 4.1% 5.4
Cash EPS 10.2 10.2 -0.1% 24.8 25.7 -3.5%
EPS 7.1 6.5 8.9% 15.6 15.4 1.4%
• The company’s U.S. subsidiary PSL-NA, has achieved financial closure for its 300,000 MTPA spiral pipe
facility in the state of Mississippi, USA. The company plans to invest US$ 103 million in this facility out of
which around US$ 70 million will be towards acquisition and construction of buildings and installing plant
& machinery.
• The aggregate value of bids outstanding stands at over Rs. 50 bn (exports more than 50%), which includes
some of the bids outstanding form big oil & gas majors like Petronas, Saudi Aramco etc.
• For Q3FY08 PSL has achieved a net turnover of Rs. 6.59 bn, a growth of 32.1% over Q3FY07.
• For 9MFY08, the net turnover was at Rs. 15.65 bn, a growth of 32.5% over 9M FY07.
• Operating profit margins declined by 170 bps during Q3 FY08 to 7.9% from 9.6% in Q3 FY07, due to an
increase in raw material costs as a percentage of sales.
• Operating profits during the quarter were up by 8.3% y-o-y at Rs. 518.9 mn and PAT showed an increase of
45.1% to Rs. 301.9 mn.
Sales and Production Schedule
9M08 9M07 % chg Q308 Q307 % chg
Production 278016 196500 41.5% 117484 82441 42.5%
Sales 255056 204108 25% 131768 76269 72.7%
Source : HDFC Sec. Research
Source : HDFC Sec. Research
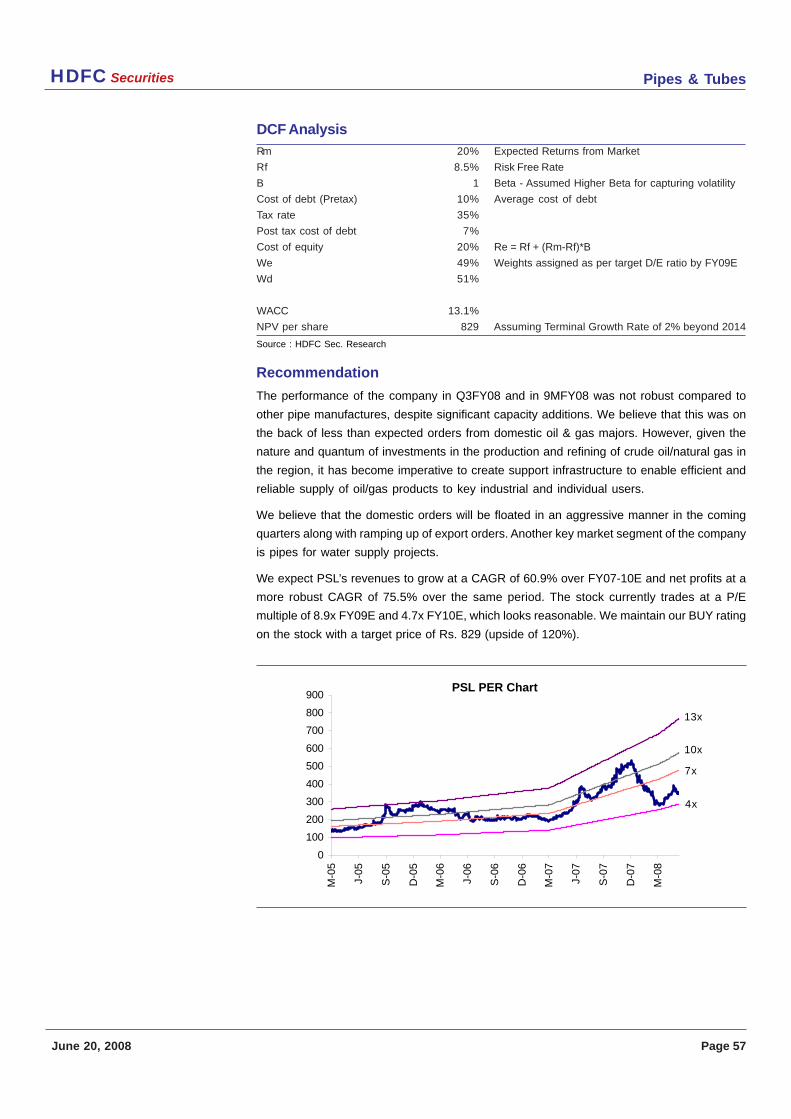
Pipes & TubesHDFC Securities
June 20, 2008 Page 57
Recommendation
The performance of the company in Q3FY08 and in 9MFY08 was not robust compared to
other pipe manufactures, despite significant capacity additions. We believe that this was on
the back of less than expected orders from domestic oil & gas majors. However, given the
nature and quantum of investments in the production and refining of crude oil/natural gas in
the region, it has become imperative to create support infrastructure to enable efficient and
reliable supply of oil/gas products to key industrial and individual users.
We believe that the domestic orders will be floated in an aggressive manner in the coming
quarters along with ramping up of export orders. Another key market segment of the company
is pipes for water supply projects.
We expect PSL’s revenues to grow at a CAGR of 60.9% over FY07-10E and net profits at a
more robust CAGR of 75.5% over the same period. The stock currently trades at a P/E
multiple of 8.9x FY09E and 4.7x FY10E, which looks reasonable. We maintain our BUY rating
on the stock with a target price of Rs. 829 (upside of 120%).
DCF Analysis
Rm 20% Expected Returns from Market
Rf 8.5% Risk Free Rate
B 1 Beta - Assumed Higher Beta for capturing volatility
Cost of debt (Pretax) 10% Average cost of debt
Tax rate 35%
Post tax cost of debt 7%
Cost of equity 20% Re = Rf + (Rm-Rf)*B
We 49% Weights assigned as per target D/E ratio by FY09E
Wd 51%
WACC 13.1%
NPV per share 829 Assuming Terminal Growth Rate of 2% beyond 2014
Source : HDFC Sec. Research
PSL PER Chart
0
100
200
300
400
500
600
700
800
900
M-0
5
J-05
S-0
5
D-0
5
M-0
6
J-06
S-0
6
D-0
6
M-0
7
J-07
S-0
7
D-0
7
M-0
8
4x
7x
10x
13x
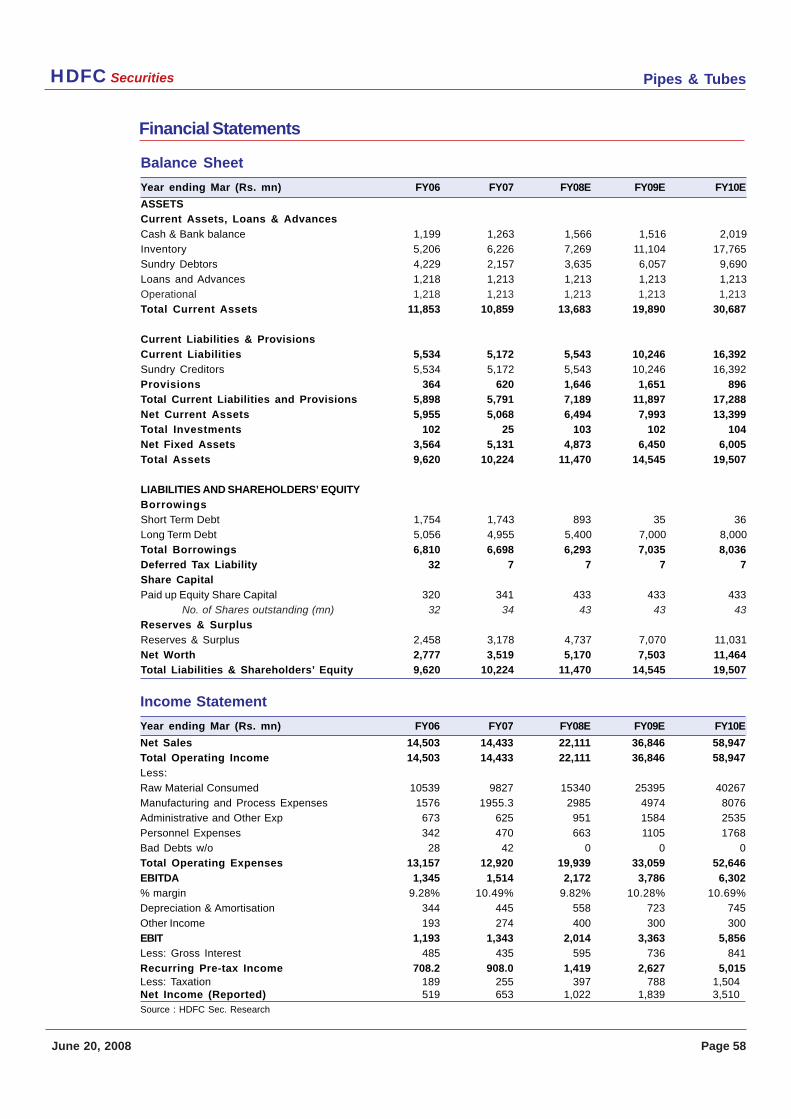
Pipes & TubesHDFC Securities
June 20, 2008 Page 58
Balance Sheet
Year ending Mar (Rs. mn) FY06 FY07 FY08E FY09E FY10E
ASSETS
Current Assets, Loans & Advances
Cash & Bank balance 1,199 1,263 1,566 1,516 2,019
Inventory 5,206 6,226 7,269 11,104 17,765
Sundry Debtors 4,229 2,157 3,635 6,057 9,690
Loans and Advances 1,218 1,213 1,213 1,213 1,213
Operational 1,218 1,213 1,213 1,213 1,213
Total Current Assets 11,853 10,859 13,683 19,890 30,687
Current Liabilities & Provisions
Current Liabilities 5,534 5,172 5,543 10,246 16,392
Sundry Creditors 5,534 5,172 5,543 10,246 16,392
Provisions 364 620 1,646 1,651 896
Total Current Liabilities and Provisions 5,898 5,791 7,189 11,897 17,288
Net Current Assets 5,955 5,068 6,494 7,993 13,399
Total Investments 102 25 103 102 104
Net Fixed Assets 3,564 5,131 4,873 6,450 6,005
Total Assets 9,620 10,224 11,470 14,545 19,507
LIABILITIES AND SHAREHOLDERS’ EQUITY
Borrowings
Short Term Debt 1,754 1,743 893 35 36
Long Term Debt 5,056 4,955 5,400 7,000 8,000
Total Borrowings 6,810 6,698 6,293 7,035 8,036
Deferred Tax Liability 32 7 7 7 7
Share Capital
Paid up Equity Share Capital 320 341 433 433 433
No. of Shares outstanding (mn) 32 34 43 43 43
Reserves & Surplus
Reserves & Surplus 2,458 3,178 4,737 7,070 11,031
Net Worth 2,777 3,519 5,170 7,503 11,464
Total Liabilities & Shareholders’ Equity 9,620 10,224 11,470 14,545 19,507
Financial Statements
Income Statement
Year ending Mar (Rs. mn) FY06 FY07 FY08E FY09E FY10E
Net Sales 14,503 14,433 22,111 36,846 58,947
Total Operating Income 14,503 14,433 22,111 36,846 58,947
Less:
Raw Material Consumed 10539 9827 15340 25395 40267
Manufacturing and Process Expenses 1576 1955.3 2985 4974 8076
Administrative and Other Exp 673 625 951 1584 2535
Personnel Expenses 342 470 663 1105 1768
Bad Debts w/o 28 42 0 0 0
Total Operating Expenses 13,157 12,920 19,939 33,059 52,646
EBITDA 1,345 1,514 2,172 3,786 6,302
% margin 9.28% 10.49% 9.82% 10.28% 10.69%
Depreciation & Amortisation 344 445 558 723 745
Other Income 193 274 400 300 300
EBIT 1,193 1,343 2,014 3,363 5,856
Less: Gross Interest 485 435 595 736 841
Recurring Pre-tax Income 708.2 908.0 1,419 2,627 5,015Less: Taxation 189 255 397 788 1,504Net Income (Reported) 519 653 1,022 1,839 3,510Source : HDFC Sec. Research
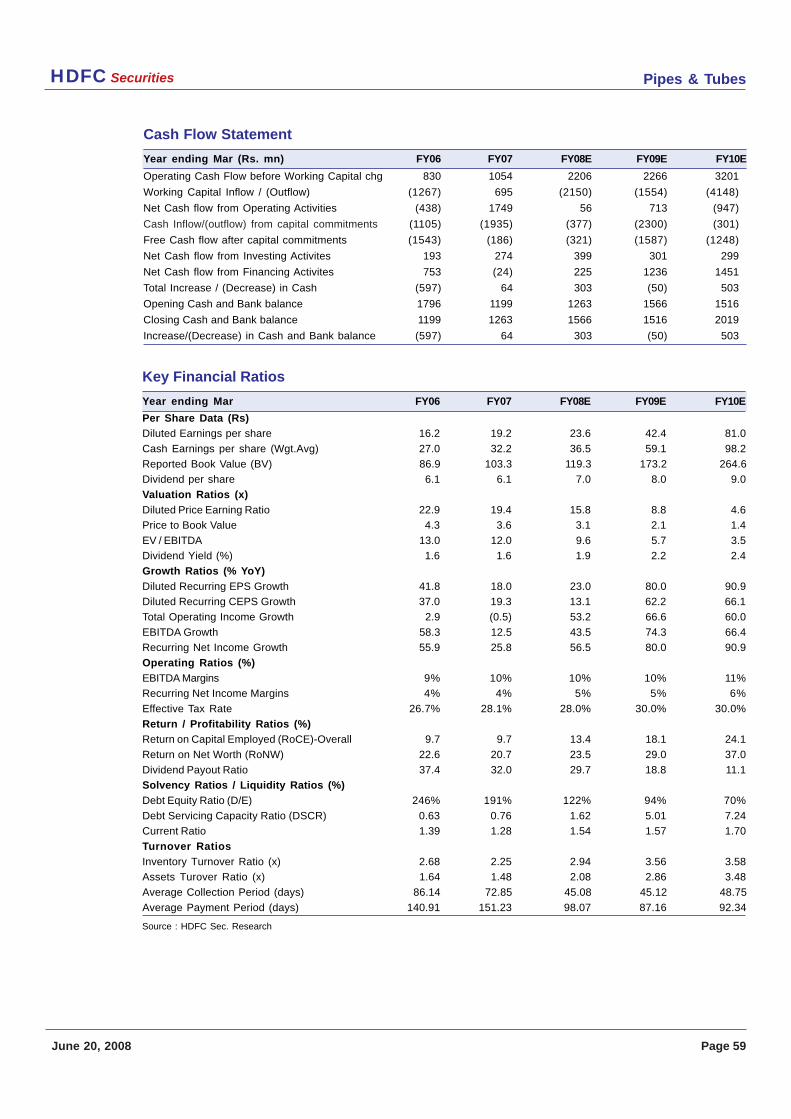
Pipes & TubesHDFC Securities
June 20, 2008 Page 59
Cash Flow Statement
Year ending Mar (Rs. mn) FY06 FY07 FY08E FY09E FY10E
Operating Cash Flow before Working Capital chg 830 1054 2206 2266 3201
Working Capital Inflow / (Outflow) (1267) 695 (2150) (1554) (4148)
Net Cash flow from Operating Activities (438) 1749 56 713 (947)
Cash Inflow/(outflow) from capital commitments (1105) (1935) (377) (2300) (301)
Free Cash flow after capital commitments (1543) (186) (321) (1587) (1248)
Net Cash flow from Investing Activites 193 274 399 301 299
Net Cash flow from Financing Activites 753 (24) 225 1236 1451
Total Increase / (Decrease) in Cash (597) 64 303 (50) 503
Opening Cash and Bank balance 1796 1199 1263 1566 1516
Closing Cash and Bank balance 1199 1263 1566 1516 2019
Increase/(Decrease) in Cash and Bank balance (597) 64 303 (50) 503
Key Financial Ratios
Year ending Mar FY06 FY07 FY08E FY09E FY10E
Per Share Data (Rs)
Diluted Earnings per share 16.2 19.2 23.6 42.4 81.0
Cash Earnings per share (Wgt.Avg) 27.0 32.2 36.5 59.1 98.2
Reported Book Value (BV) 86.9 103.3 119.3 173.2 264.6
Dividend per share 6.1 6.1 7.0 8.0 9.0
Valuation Ratios (x)
Diluted Price Earning Ratio 22.9 19.4 15.8 8.8 4.6
Price to Book Value 4.3 3.6 3.1 2.1 1.4
EV / EBITDA 13.0 12.0 9.6 5.7 3.5
Dividend Yield (%) 1.6 1.6 1.9 2.2 2.4
Growth Ratios (% YoY)
Diluted Recurring EPS Growth 41.8 18.0 23.0 80.0 90.9
Diluted Recurring CEPS Growth 37.0 19.3 13.1 62.2 66.1
Total Operating Income Growth 2.9 (0.5) 53.2 66.6 60.0
EBITDA Growth 58.3 12.5 43.5 74.3 66.4
Recurring Net Income Growth 55.9 25.8 56.5 80.0 90.9
Operating Ratios (%)
EBITDA Margins 9% 10% 10% 10% 11%
Recurring Net Income Margins 4% 4% 5% 5% 6%
Effective Tax Rate 26.7% 28.1% 28.0% 30.0% 30.0%
Return / Profitability Ratios (%)
Return on Capital Employed (RoCE)-Overall 9.7 9.7 13.4 18.1 24.1
Return on Net Worth (RoNW) 22.6 20.7 23.5 29.0 37.0
Dividend Payout Ratio 37.4 32.0 29.7 18.8 11.1
Solvency Ratios / Liquidity Ratios (%)
Debt Equity Ratio (D/E) 246% 191% 122% 94% 70%
Debt Servicing Capacity Ratio (DSCR) 0.63 0.76 1.62 5.01 7.24
Current Ratio 1.39 1.28 1.54 1.57 1.70
Turnover Ratios
Inventory Turnover Ratio (x) 2.68 2.25 2.94 3.56 3.58
Assets Turover Ratio (x) 1.64 1.48 2.08 2.86 3.48
Average Collection Period (days) 86.14 72.85 45.08 45.12 48.75
Average Payment Period (days) 140.91 151.23 98.07 87.16 92.34
Source : HDFC Sec. Research
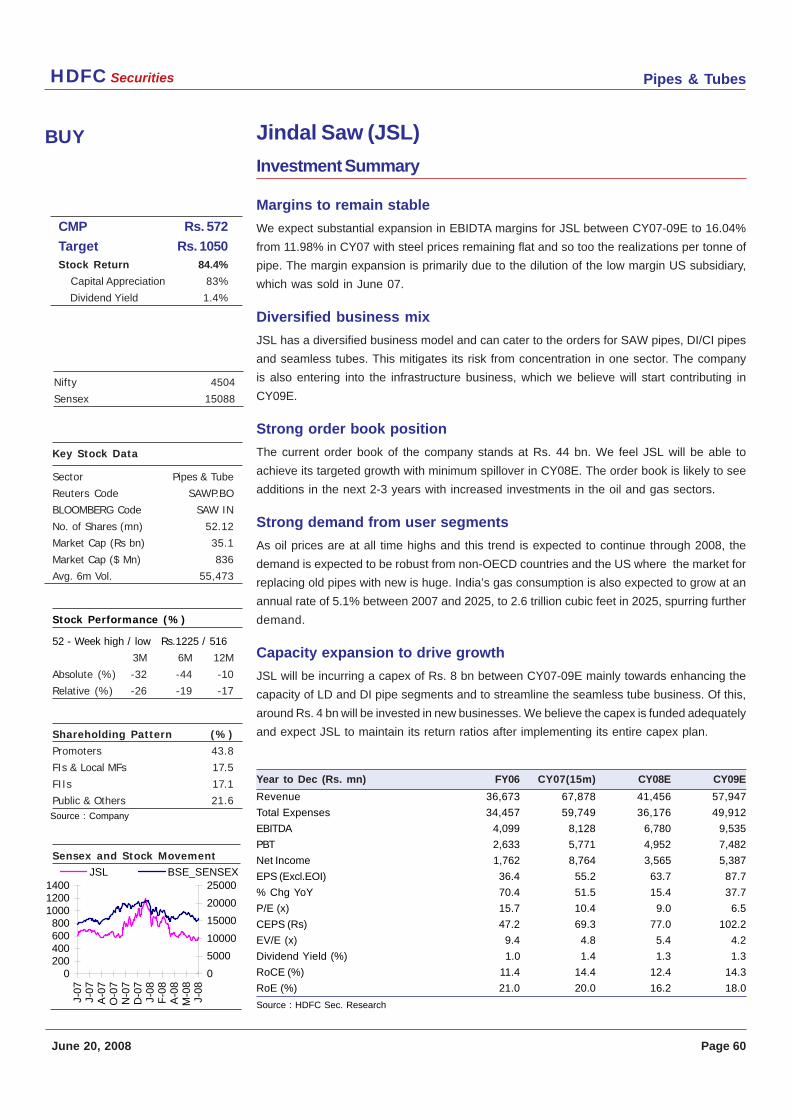
Pipes & TubesHDFC Securities
June 20, 2008 Page 60
Jindal Saw (JSL)BUY
Key Stock Data
Sector Pipes & Tube
Reuters Code SAWP.BO
BLOOMBERG Code SAW IN
No. of Shares (mn) 52.12
Market Cap (Rs bn) 35.1
Market Cap ($ Mn) 836
Avg. 6m Vol. 55,473
Stock Performance (%)
52 - Week high / low Rs.1225 / 516
3M 6M 12M
Absolute (%) -32 -44 -10
Relative (%) -26 -19 -17
Shareholding Pattern (%)
Promoters 43.8
FIs & Local MFs 17.5
FIIs 17.1
Public & Others 21.6
Sensex and Stock Movement
Nifty 4504
Sensex 15088
Source : Company
CMP Rs. 572
Target Rs. 1050Stock Return 84.4%
Capital Appreciation 83%
Dividend Yield 1.4%
Investment Summary
Margins to remain stable
We expect substantial expansion in EBIDTA margins for JSL between CY07-09E to 16.04%
from 11.98% in CY07 with steel prices remaining flat and so too the realizations per tonne of
pipe. The margin expansion is primarily due to the dilution of the low margin US subsidiary,
which was sold in June 07.
Diversified business mix
JSL has a diversified business model and can cater to the orders for SAW pipes, DI/CI pipes
and seamless tubes. This mitigates its risk from concentration in one sector. The company
is also entering into the infrastructure business, which we believe will start contributing in
CY09E.
Strong order book position
The current order book of the company stands at Rs. 44 bn. We feel JSL will be able to
achieve its targeted growth with minimum spillover in CY08E. The order book is likely to see
additions in the next 2-3 years with increased investments in the oil and gas sectors.
Strong demand from user segments
As oil prices are at all time highs and this trend is expected to continue through 2008, the
demand is expected to be robust from non-OECD countries and the US where the market for
replacing old pipes with new is huge. India’s gas consumption is also expected to grow at an
annual rate of 5.1% between 2007 and 2025, to 2.6 trillion cubic feet in 2025, spurring further
demand.
Capacity expansion to drive growth
JSL will be incurring a capex of Rs. 8 bn between CY07-09E mainly towards enhancing the
capacity of LD and DI pipe segments and to streamline the seamless tube business. Of this,
around Rs. 4 bn will be invested in new businesses. We believe the capex is funded adequately
and expect JSL to maintain its return ratios after implementing its entire capex plan.
Year to Dec (Rs. mn) FY06 CY07(15m) CY08E CY09E
Revenue 36,673 67,878 41,456 57,947
Total Expenses 34,457 59,749 36,176 49,912
EBITDA 4,099 8,128 6,780 9,535
PBT 2,633 5,771 4,952 7,482
Net Income 1,762 8,764 3,565 5,387
EPS (Excl.EOI) 36.4 55.2 63.7 87.7
% Chg YoY 70.4 51.5 15.4 37.7
P/E (x) 15.7 10.4 9.0 6.5
CEPS (Rs) 47.2 69.3 77.0 102.2
EV/E (x) 9.4 4.8 5.4 4.2
Dividend Yield (%) 1.0 1.4 1.3 1.3
RoCE (%) 11.4 14.4 12.4 14.3
RoE (%) 21.0 20.0 16.2 18.0
Source : HDFC Sec. Research
0200400600800
100012001400
J-07
J-07
A-0
7O
-07
N-0
7D
-07
J-08
F-0
8A
-08
M-0
8J-
08
0
5000
10000
15000
20000
25000JSL BSE_SENSEX
Pipes & TubesHDFC Securities
June 20, 2008 Page 61
Background
JSL was set up in 1984 for manufacturing and coating of Submerged Arc Welded pipes
(SAW Pipes). It is one of the country’s largest producers of SAW pipes, which is widely used
in the energy sector for the transportation of oil and gas. With integrated facilities at multiple
locations and an ever-expanding market , JSL has diversified from a single product company
to a multi-product one, mainly operating in four divisions.
• SAW pipes
• Seamless Tubes
• DI/CI pipes
• Ship Building/Waterways etc.
JSL has established itself as a market leader, and a global major in providing total pipe
solutions to the industry. In CY07 the company sold its US subsidiary to JSW steel and in the
process earned profits in excess of USD 200 mn. The company is now expanding its facilities
extensively in India and is also entering into new businesses to embark on a robust growth
phase over the next 2-3 years.
Capex for new businesses and expansions
JSL plans to spend around US$200 mn on its capex plan for the pipe business and around
USD 100 mn for its new businesses (contribution to subsidiary). This expansion is already
funded by:
• US$80 mn raised in FCCB issuance (25% converted; conversion price Rs675 and
convertible until June 2011) in April 2006.
• US$25 mn raised by issuing convertible warrants to promoter (all converted on 4
November 2007).
• Additional warrants issued in Q5CY07 worth USD 110 mn to be converted by September
2009 (5.33 mn shares at a price of Rs.819/share.
• Cash inflow from US divestiture (US$200 mn post tax).
The promoters’ holding in the firm post conversion of warrants will go up from the existing
40.7% to 45.8%. The dilution in equity post dilutions is as follows.
Expanding equity
Equity (Rs.Mn)
Current Equity 511
FCCB 49
Warrants 53
Fully Diluted Equity 613
Promoter Holding 45.80%
Source : Company, HDFC Sec Research
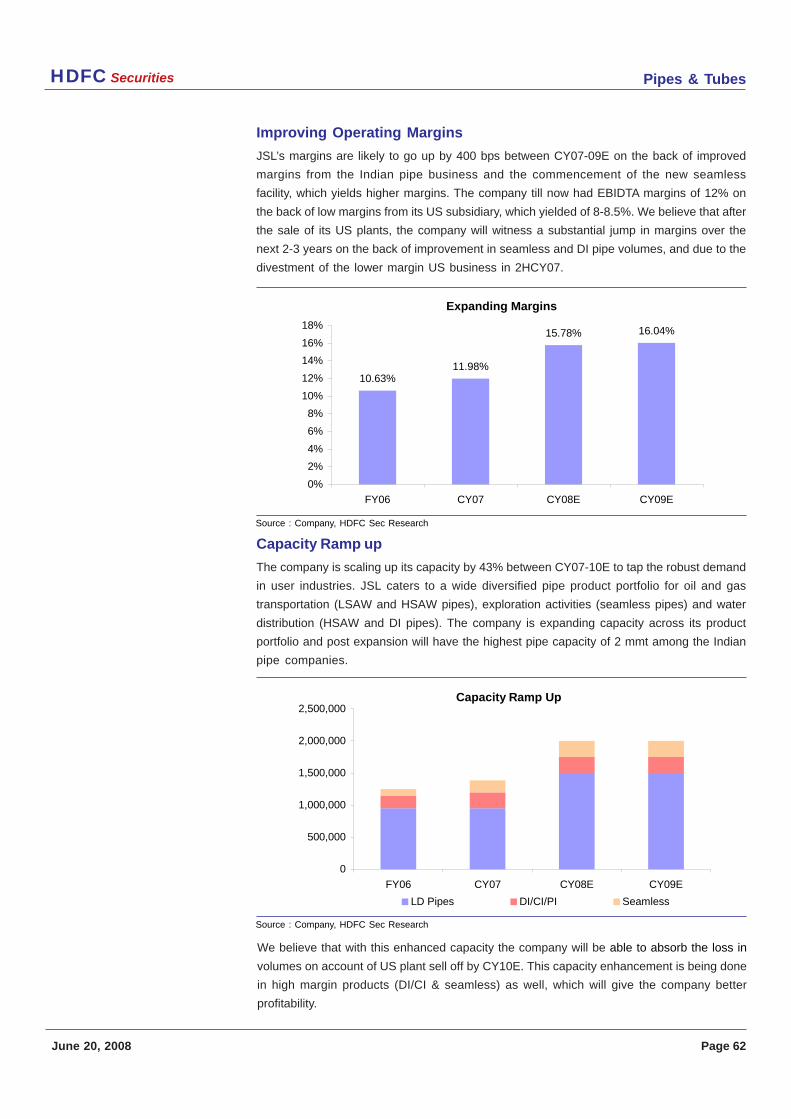
Pipes & TubesHDFC Securities
June 20, 2008 Page 62
Improving Operating Margins
JSL’s margins are likely to go up by 400 bps between CY07-09E on the back of improved
margins from the Indian pipe business and the commencement of the new seamless
facility, which yields higher margins. The company till now had EBIDTA margins of 12% on
the back of low margins from its US subsidiary, which yielded of 8-8.5%. We believe that after
the sale of its US plants, the company will witness a substantial jump in margins over the
next 2-3 years on the back of improvement in seamless and DI pipe volumes, and due to the
divestment of the lower margin US business in 2HCY07.
Capacity Ramp up
The company is scaling up its capacity by 43% between CY07-10E to tap the robust demand
in user industries. JSL caters to a wide diversified pipe product portfolio for oil and gas
transportation (LSAW and HSAW pipes), exploration activities (seamless pipes) and water
distribution (HSAW and DI pipes). The company is expanding capacity across its product
portfolio and post expansion will have the highest pipe capacity of 2 mmt among the Indian
pipe companies.
We believe that with this enhanced capacity the company will be able to absorb the loss in
volumes on account of US plant sell off by CY10E. This capacity enhancement is being done
in high margin products (DI/CI & seamless) as well, which will give the company better
profitability.
Expanding Margins
10.63%11.98%
15.78% 16.04%
0%
2%
4%
6%
8%
10%
12%
14%
16%
18%
FY06 CY07 CY08E CY09E
Capacity Ramp Up
0
500,000
1,000,000
1,500,000
2,000,000
2,500,000
FY06 CY07 CY08E CY09E
LD Pipes DI/CI/PI Seamless
Source : Company, HDFC Sec Research
Source : Company, HDFC Sec Research
Pipes & TubesHDFC Securities
June 20, 2008 Page 63
Business diversification to de-risk growth
The company recently ventured into new businesses in the infrastructure space. While the
businesses are unrelated, we believe that given the group’s expertise in identifying growth
sectors and scaling them up, it is a strong positive. The new ventures do pose a risk to
investors in terms of the business structure (as the capex in these businesses are high), but
we believe that the creation of a subsidiary level entity will not dilute interest in the parent and
therefore remains a positive. The potential value creation can be equally high, as in our view
the segments identified by the company hold growth potential.
The company plans to invest round Rs18-20bn over the next 2-3 years. The D/E ratio is
expected to be 3:1. Towards this, the company is issuing warrants to the promoters and the
total cash infusion from this is expected to be Rs. 4.6bn, which would be part of the equity
investment in the new venture.
Company Name Objective Capex (USD.Mn) Current Status EBIDTA Margin (%)
Jindal Water Infrastructure Ltd. Undertaking Water pipeline 25 Bagged one order worth 15
projects USD 85 mn
Jindal Water Ways Ltd. Charter of small ships and 45 To charter 9-10 ships by Dec-08 25
barges of 8,000-12,000 DWT
Jindal Urban Infrastructure Ltd Power & Infrastructure projects 50 Bagged one Delhi Govt.Power 15
order worth USD 30 mn
Jindal Shipyard Ltd. Manufacturing small ships 200 Planning stage. Revenues from CY10E 15
of 10,000-15,000 DWT
Jindal Railways Ltd. Wagon Fabrication 25 Planning stage. Revenues from CY10E 10
New Business Initiatives
We believe that the potential revenues from these new businesses in CY08E could be in the
range of USD 100 mn, with margins better than its existing pipe business, but we are not
factoring in any upside in our numbers from the new initiatives as more clarity is awaited on
this.
The new business ventures named above would be run as separate companies. Jindal
SAW has created a 100% owned subsidiary named Jindal ITF, which will invest in these
companies. The initial capital commitment from JSL to this subsidiary will be around USD
100 mn.
While currently the above companies would be 100% owned by Jindal ITF, the group indicated
that if needed, there could be stake sales that is financial or strategic in nature. Currently,
most of its new ventures are at a very nascent stage and plans are still being finalized.
Source : Company, HDFC Sec Research
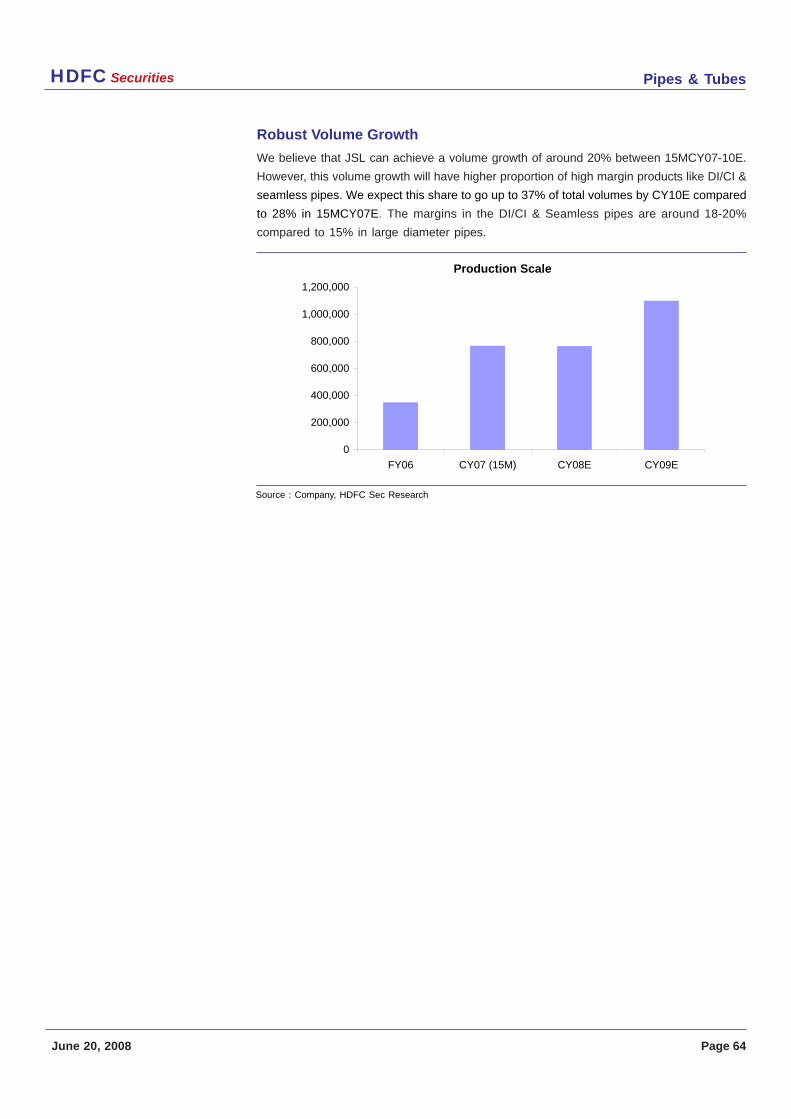
Pipes & TubesHDFC Securities
June 20, 2008 Page 64
Robust Volume Growth
We believe that JSL can achieve a volume growth of around 20% between 15MCY07-10E.
However, this volume growth will have higher proportion of high margin products like DI/CI &
seamless pipes. We expect this share to go up to 37% of total volumes by CY10E compared
to 28% in 15MCY07E. The margins in the DI/CI & Seamless pipes are around 18-20%
compared to 15% in large diameter pipes.
Production Scale
0
200,000
400,000
600,000
800,000
1,000,000
1,200,000
FY06 CY07 (15M) CY08E CY09E
Source : Company, HDFC Sec Research
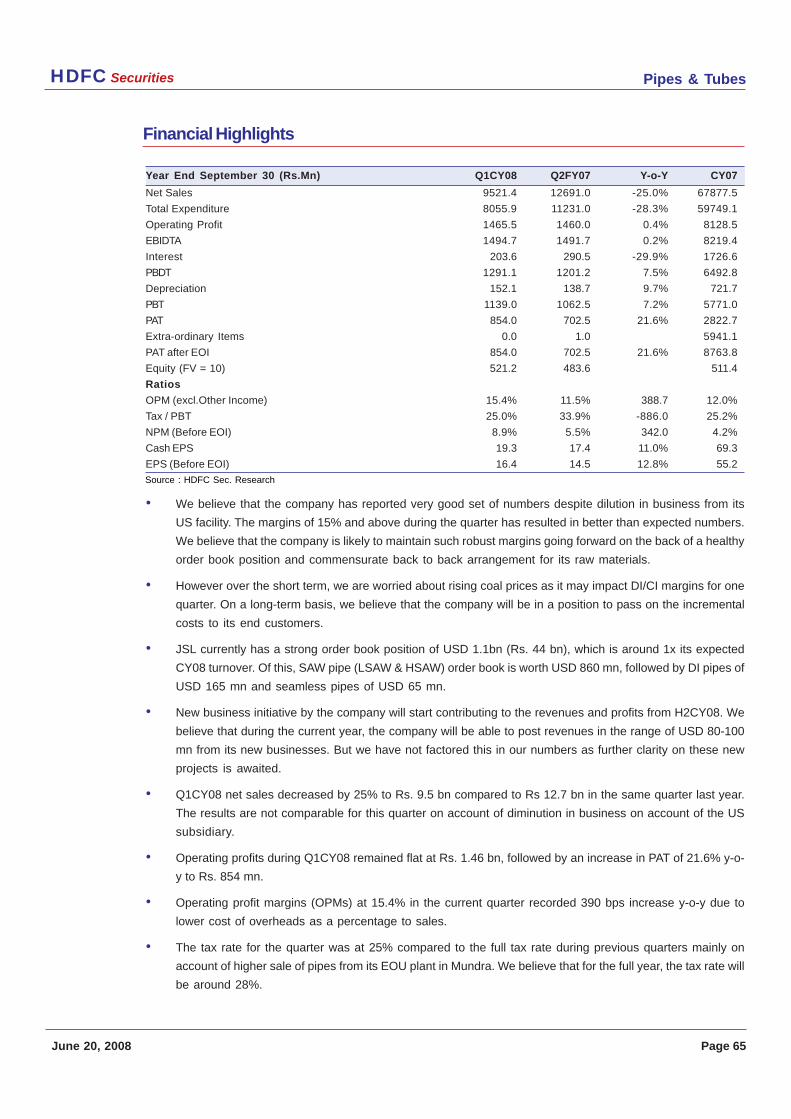
Pipes & TubesHDFC Securities
June 20, 2008 Page 65
Financial Highlights
Year End September 30 (Rs.Mn) Q1CY08 Q2FY07 Y-o-Y CY07
Net Sales 9521.4 12691.0 -25.0% 67877.5
Total Expenditure 8055.9 11231.0 -28.3% 59749.1
Operating Profit 1465.5 1460.0 0.4% 8128.5
EBIDTA 1494.7 1491.7 0.2% 8219.4
Interest 203.6 290.5 -29.9% 1726.6
PBDT 1291.1 1201.2 7.5% 6492.8
Depreciation 152.1 138.7 9.7% 721.7
PBT 1139.0 1062.5 7.2% 5771.0
PAT 854.0 702.5 21.6% 2822.7
Extra-ordinary Items 0.0 1.0 5941.1
PAT after EOI 854.0 702.5 21.6% 8763.8
Equity (FV = 10) 521.2 483.6 511.4
Ratios
OPM (excl.Other Income) 15.4% 11.5% 388.7 12.0%
Tax / PBT 25.0% 33.9% -886.0 25.2%
NPM (Before EOI) 8.9% 5.5% 342.0 4.2%
Cash EPS 19.3 17.4 11.0% 69.3
EPS (Before EOI) 16.4 14.5 12.8% 55.2
• We believe that the company has reported very good set of numbers despite dilution in business from its
US facility. The margins of 15% and above during the quarter has resulted in better than expected numbers.
We believe that the company is likely to maintain such robust margins going forward on the back of a healthy
order book position and commensurate back to back arrangement for its raw materials.
• However over the short term, we are worried about rising coal prices as it may impact DI/CI margins for one
quarter. On a long-term basis, we believe that the company will be in a position to pass on the incremental
costs to its end customers.
• JSL currently has a strong order book position of USD 1.1bn (Rs. 44 bn), which is around 1x its expected
CY08 turnover. Of this, SAW pipe (LSAW & HSAW) order book is worth USD 860 mn, followed by DI pipes of
USD 165 mn and seamless pipes of USD 65 mn.
• New business initiative by the company will start contributing to the revenues and profits from H2CY08. We
believe that during the current year, the company will be able to post revenues in the range of USD 80-100
mn from its new businesses. But we have not factored this in our numbers as further clarity on these new
projects is awaited.
• Q1CY08 net sales decreased by 25% to Rs. 9.5 bn compared to Rs 12.7 bn in the same quarter last year.
The results are not comparable for this quarter on account of diminution in business on account of the US
subsidiary.
• Operating profits during Q1CY08 remained flat at Rs. 1.46 bn, followed by an increase in PAT of 21.6% y-o-
y to Rs. 854 mn.
• Operating profit margins (OPMs) at 15.4% in the current quarter recorded 390 bps increase y-o-y due to
lower cost of overheads as a percentage to sales.
• The tax rate for the quarter was at 25% compared to the full tax rate during previous quarters mainly on
account of higher sale of pipes from its EOU plant in Mundra. We believe that for the full year, the tax rate will
be around 28%.
Source : HDFC Sec. Research
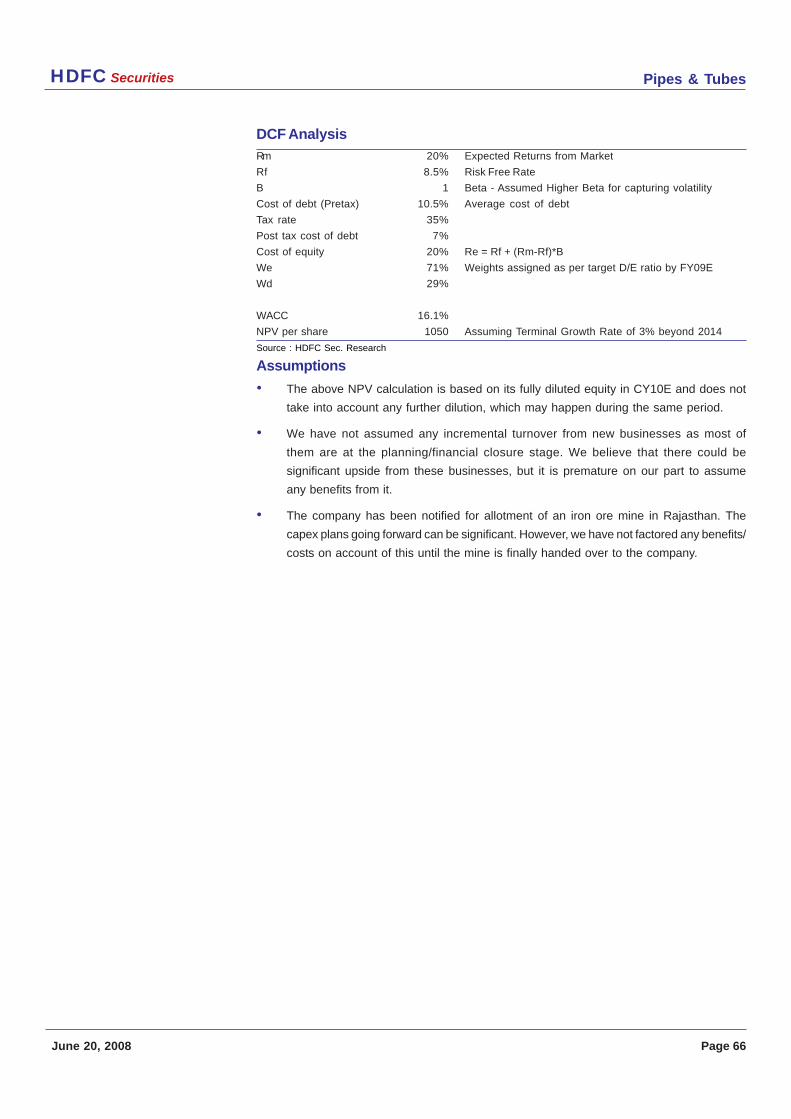
Pipes & TubesHDFC Securities
June 20, 2008 Page 66
DCF Analysis
Rm 20% Expected Returns from Market
Rf 8.5% Risk Free Rate
B 1 Beta - Assumed Higher Beta for capturing volatility
Cost of debt (Pretax) 10.5% Average cost of debt
Tax rate 35%
Post tax cost of debt 7%
Cost of equity 20% Re = Rf + (Rm-Rf)*B
We 71% Weights assigned as per target D/E ratio by FY09E
Wd 29%
WACC 16.1%
NPV per share 1050 Assuming Terminal Growth Rate of 3% beyond 2014
Assumptions
• The above NPV calculation is based on its fully diluted equity in CY10E and does not
take into account any further dilution, which may happen during the same period.
• We have not assumed any incremental turnover from new businesses as most of
them are at the planning/financial closure stage. We believe that there could be
significant upside from these businesses, but it is premature on our part to assume
any benefits from it.
• The company has been notified for allotment of an iron ore mine in Rajasthan. The
capex plans going forward can be significant. However, we have not factored any benefits/
costs on account of this until the mine is finally handed over to the company.
Source : HDFC Sec. Research
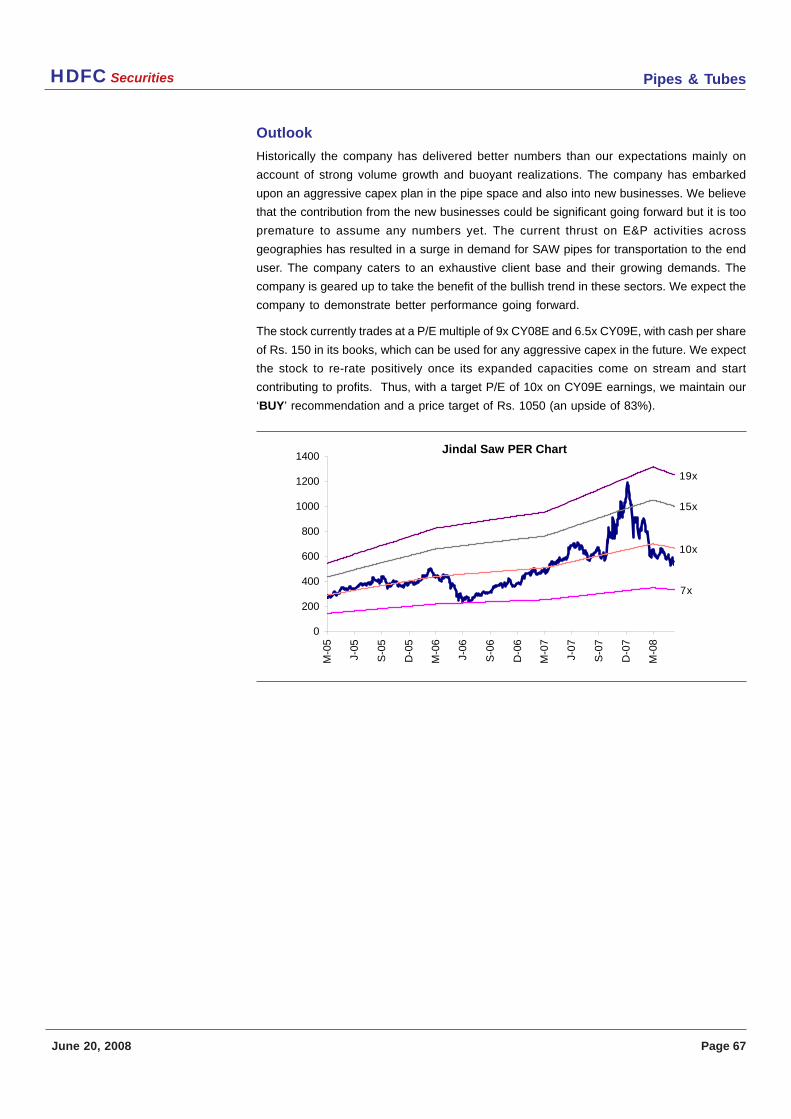
Pipes & TubesHDFC Securities
June 20, 2008 Page 67
Outlook
Historically the company has delivered better numbers than our expectations mainly on
account of strong volume growth and buoyant realizations. The company has embarked
upon an aggressive capex plan in the pipe space and also into new businesses. We believe
that the contribution from the new businesses could be significant going forward but it is too
premature to assume any numbers yet. The current thrust on E&P activities across
geographies has resulted in a surge in demand for SAW pipes for transportation to the end
user. The company caters to an exhaustive client base and their growing demands. The
company is geared up to take the benefit of the bullish trend in these sectors. We expect the
company to demonstrate better performance going forward.
The stock currently trades at a P/E multiple of 9x CY08E and 6.5x CY09E, with cash per share
of Rs. 150 in its books, which can be used for any aggressive capex in the future. We expect
the stock to re-rate positively once its expanded capacities come on stream and start
contributing to profits. Thus, with a target P/E of 10x on CY09E earnings, we maintain our
‘BUY’ recommendation and a price target of Rs. 1050 (an upside of 83%).
Jindal Saw PER Chart
0
200
400
600
800
1000
1200
1400
M-0
5
J-05
S-0
5
D-0
5
M-0
6
J-06
S-0
6
D-0
6
M-0
7
J-07
S-0
7
D-0
7
M-0
8
7x
10x
15x
19x
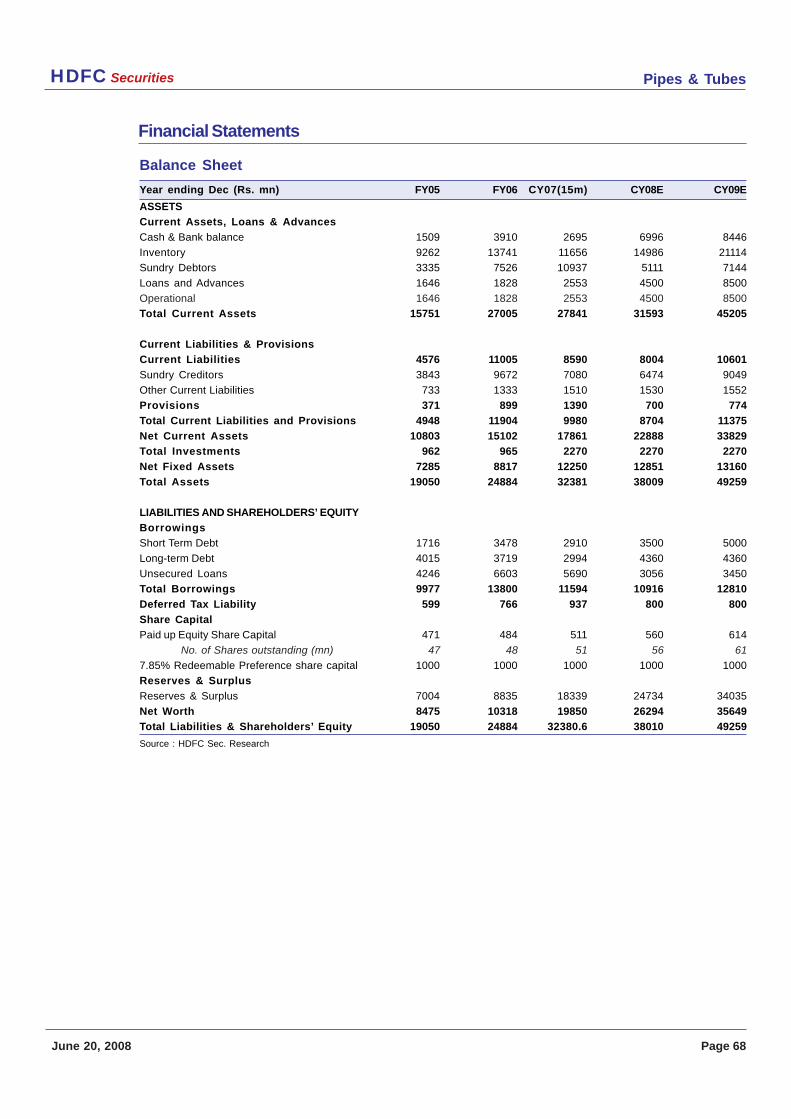
Pipes & TubesHDFC Securities
June 20, 2008 Page 68
Balance Sheet
Year ending Dec (Rs. mn) FY05 FY06 CY07(15m) CY08E CY09E
ASSETS
Current Assets, Loans & Advances
Cash & Bank balance 1509 3910 2695 6996 8446
Inventory 9262 13741 11656 14986 21114
Sundry Debtors 3335 7526 10937 5111 7144
Loans and Advances 1646 1828 2553 4500 8500
Operational 1646 1828 2553 4500 8500
Total Current Assets 15751 27005 27841 31593 45205
Current Liabilities & Provisions
Current Liabilities 4576 11005 8590 8004 10601
Sundry Creditors 3843 9672 7080 6474 9049
Other Current Liabilities 733 1333 1510 1530 1552
Provisions 371 899 1390 700 774
Total Current Liabilities and Provisions 4948 11904 9980 8704 11375
Net Current Assets 10803 15102 17861 22888 33829
Total Investments 962 965 2270 2270 2270
Net Fixed Assets 7285 8817 12250 12851 13160
Total Assets 19050 24884 32381 38009 49259
LIABILITIES AND SHAREHOLDERS’ EQUITY
Borrowings
Short Term Debt 1716 3478 2910 3500 5000
Long-term Debt 4015 3719 2994 4360 4360
Unsecured Loans 4246 6603 5690 3056 3450
Total Borrowings 9977 13800 11594 10916 12810
Deferred Tax Liability 599 766 937 800 800
Share Capital
Paid up Equity Share Capital 471 484 511 560 614
No. of Shares outstanding (mn) 47 48 51 56 61
7.85% Redeemable Preference share capital 1000 1000 1000 1000 1000
Reserves & Surplus
Reserves & Surplus 7004 8835 18339 24734 34035
Net Worth 8475 10318 19850 26294 35649
Total Liabilities & Shareholders’ Equity 19050 24884 32380.6 38010 49259
Financial Statements
Source : HDFC Sec. Research
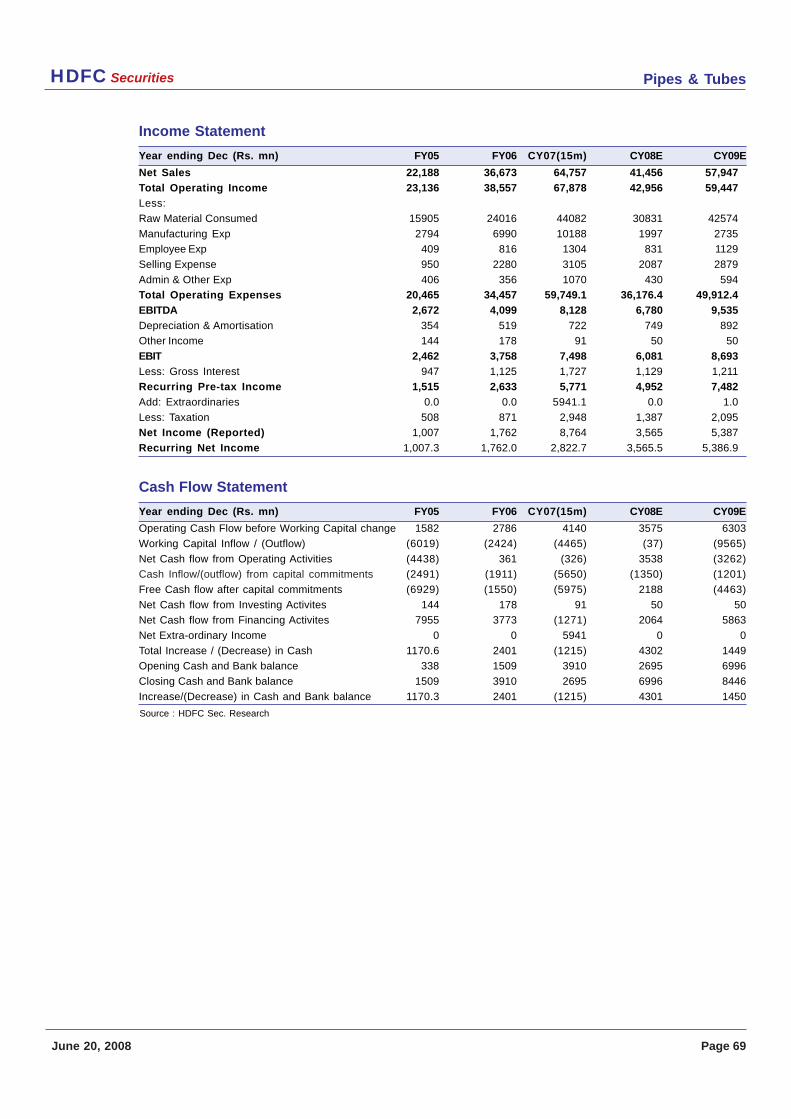
Pipes & TubesHDFC Securities
June 20, 2008 Page 69
Income Statement
Year ending Dec (Rs. mn) FY05 FY06 CY07(15m) CY08E CY09E
Net Sales 22,188 36,673 64,757 41,456 57,947
Total Operating Income 23,136 38,557 67,878 42,956 59,447
Less:
Raw Material Consumed 15905 24016 44082 30831 42574
Manufacturing Exp 2794 6990 10188 1997 2735
Employee Exp 409 816 1304 831 1129
Selling Expense 950 2280 3105 2087 2879
Admin & Other Exp 406 356 1070 430 594
Total Operating Expenses 20,465 34,457 59,749.1 36,176.4 49,912.4
EBITDA 2,672 4,099 8,128 6,780 9,535
Depreciation & Amortisation 354 519 722 749 892
Other Income 144 178 91 50 50
EBIT 2,462 3,758 7,498 6,081 8,693
Less: Gross Interest 947 1,125 1,727 1,129 1,211
Recurring Pre-tax Income 1,515 2,633 5,771 4,952 7,482
Add: Extraordinaries 0.0 0.0 5941.1 0.0 1.0
Less: Taxation 508 871 2,948 1,387 2,095
Net Income (Reported) 1,007 1,762 8,764 3,565 5,387
Recurring Net Income 1,007.3 1,762.0 2,822.7 3,565.5 5,386.9
Cash Flow Statement
Year ending Dec (Rs. mn) FY05 FY06 CY07(15m) CY08E CY09E
Operating Cash Flow before Working Capital change 1582 2786 4140 3575 6303
Working Capital Inflow / (Outflow) (6019) (2424) (4465) (37) (9565)
Net Cash flow from Operating Activities (4438) 361 (326) 3538 (3262)
Cash Inflow/(outflow) from capital commitments (2491) (1911) (5650) (1350) (1201)
Free Cash flow after capital commitments (6929) (1550) (5975) 2188 (4463)
Net Cash flow from Investing Activites 144 178 91 50 50
Net Cash flow from Financing Activites 7955 3773 (1271) 2064 5863
Net Extra-ordinary Income 0 0 5941 0 0
Total Increase / (Decrease) in Cash 1170.6 2401 (1215) 4302 1449
Opening Cash and Bank balance 338 1509 3910 2695 6996
Closing Cash and Bank balance 1509 3910 2695 6996 8446
Increase/(Decrease) in Cash and Bank balance 1170.3 2401 (1215) 4301 1450
Source : HDFC Sec. Research
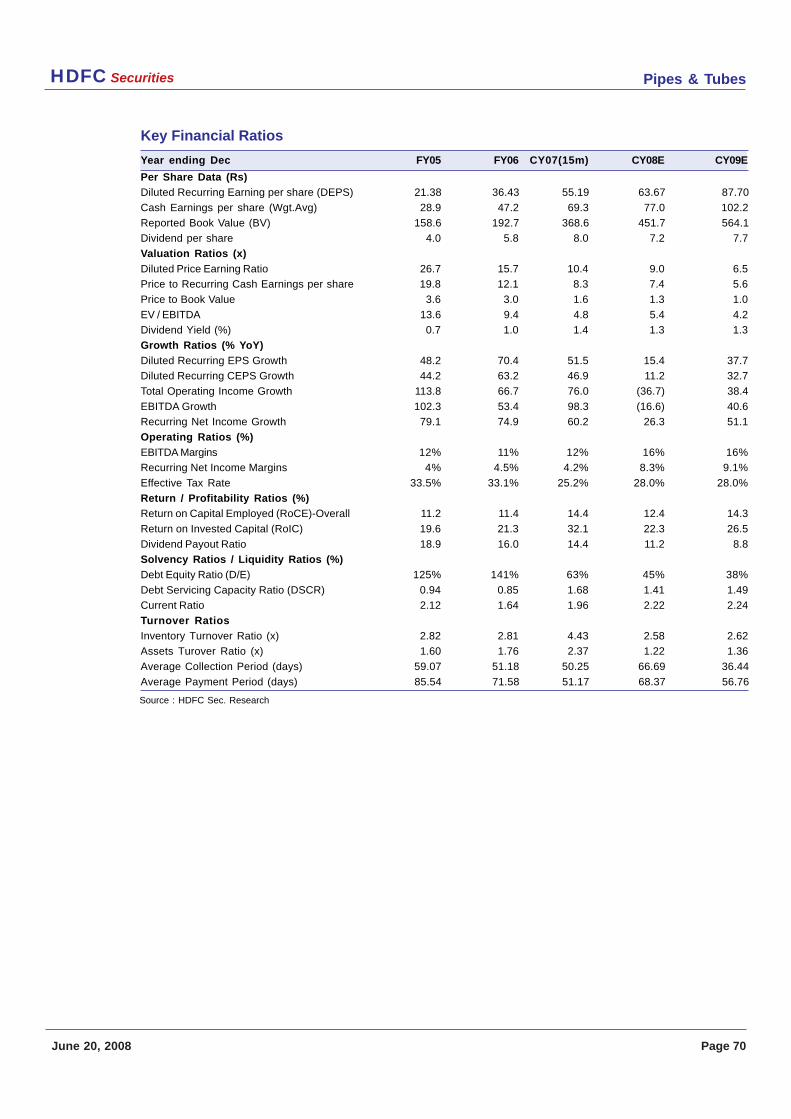
Pipes & TubesHDFC Securities
June 20, 2008 Page 70
Key Financial Ratios
Year ending Dec FY05 FY06 CY07(15m) CY08E CY09E
Per Share Data (Rs)
Diluted Recurring Earning per share (DEPS) 21.38 36.43 55.19 63.67 87.70
Cash Earnings per share (Wgt.Avg) 28.9 47.2 69.3 77.0 102.2
Reported Book Value (BV) 158.6 192.7 368.6 451.7 564.1
Dividend per share 4.0 5.8 8.0 7.2 7.7
Valuation Ratios (x)
Diluted Price Earning Ratio 26.7 15.7 10.4 9.0 6.5
Price to Recurring Cash Earnings per share 19.8 12.1 8.3 7.4 5.6
Price to Book Value 3.6 3.0 1.6 1.3 1.0
EV / EBITDA 13.6 9.4 4.8 5.4 4.2
Dividend Yield (%) 0.7 1.0 1.4 1.3 1.3
Growth Ratios (% YoY)
Diluted Recurring EPS Growth 48.2 70.4 51.5 15.4 37.7
Diluted Recurring CEPS Growth 44.2 63.2 46.9 11.2 32.7
Total Operating Income Growth 113.8 66.7 76.0 (36.7) 38.4
EBITDA Growth 102.3 53.4 98.3 (16.6) 40.6
Recurring Net Income Growth 79.1 74.9 60.2 26.3 51.1
Operating Ratios (%)
EBITDA Margins 12% 11% 12% 16% 16%
Recurring Net Income Margins 4% 4.5% 4.2% 8.3% 9.1%
Effective Tax Rate 33.5% 33.1% 25.2% 28.0% 28.0%
Return / Profitability Ratios (%)
Return on Capital Employed (RoCE)-Overall 11.2 11.4 14.4 12.4 14.3
Return on Invested Capital (RoIC) 19.6 21.3 32.1 22.3 26.5
Dividend Payout Ratio 18.9 16.0 14.4 11.2 8.8
Solvency Ratios / Liquidity Ratios (%)
Debt Equity Ratio (D/E) 125% 141% 63% 45% 38%
Debt Servicing Capacity Ratio (DSCR) 0.94 0.85 1.68 1.41 1.49
Current Ratio 2.12 1.64 1.96 2.22 2.24
Turnover Ratios
Inventory Turnover Ratio (x) 2.82 2.81 4.43 2.58 2.62
Assets Turover Ratio (x) 1.60 1.76 2.37 1.22 1.36
Average Collection Period (days) 59.07 51.18 50.25 66.69 36.44
Average Payment Period (days) 85.54 71.58 51.17 68.37 56.76
Source : HDFC Sec. Research
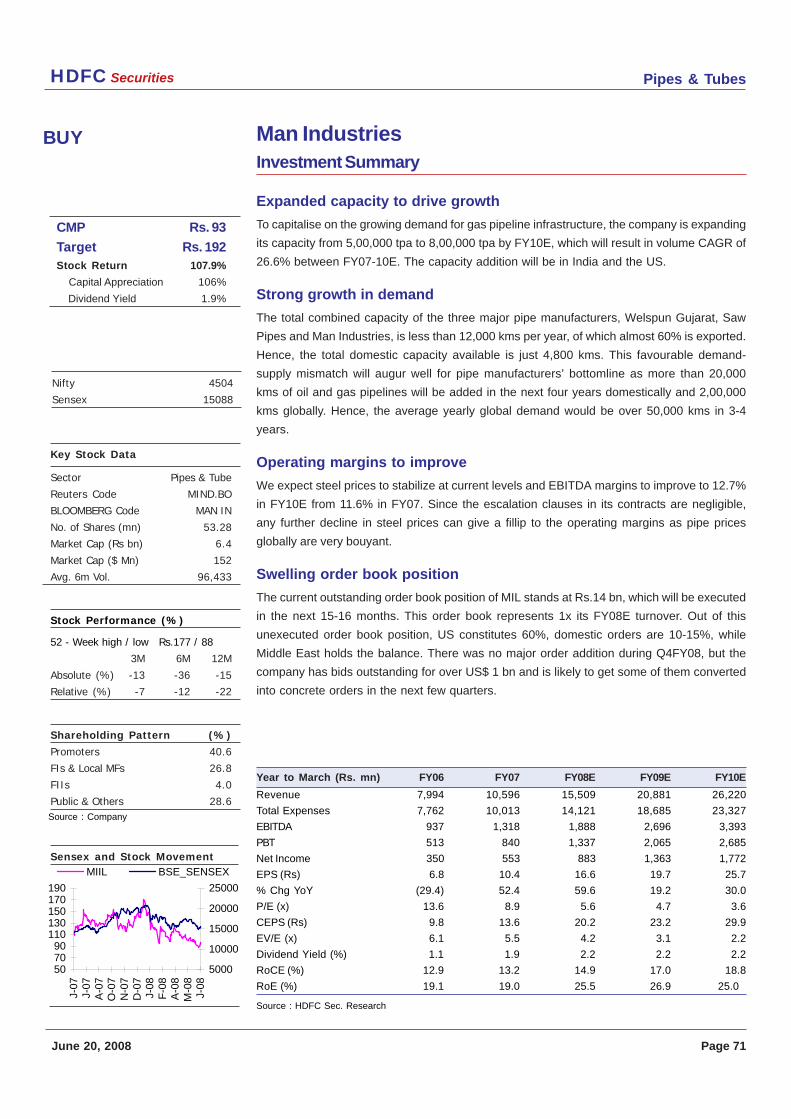
Pipes & TubesHDFC Securities
June 20, 2008 Page 71
Man IndustriesBUY
Key Stock Data
Sector Pipes & Tube
Reuters Code MIND.BO
BLOOMBERG Code MAN IN
No. of Shares (mn) 53.28
Market Cap (Rs bn) 6.4
Market Cap ($ Mn) 152
Avg. 6m Vol. 96,433
Stock Performance (%)
52 - Week high / low Rs.177 / 88
3M 6M 12M
Absolute (%) -13 -36 -15
Relative (%) -7 -12 -22
Shareholding Pattern (%)
Promoters 40.6
FIs & Local MFs 26.8
FIIs 4.0
Public & Others 28.6
Sensex and Stock Movement
Nifty 4504
Sensex 15088
Source : Company
CMP Rs. 93
Target Rs. 192Stock Return 107.9%
Capital Appreciation 106%
Dividend Yield 1.9%
Investment Summary
Expanded capacity to drive growth
To capitalise on the growing demand for gas pipeline infrastructure, the company is expanding
its capacity from 5,00,000 tpa to 8,00,000 tpa by FY10E, which will result in volume CAGR of
26.6% between FY07-10E. The capacity addition will be in India and the US.
Strong growth in demand
The total combined capacity of the three major pipe manufacturers, Welspun Gujarat, Saw
Pipes and Man Industries, is less than 12,000 kms per year, of which almost 60% is exported.
Hence, the total domestic capacity available is just 4,800 kms. This favourable demand-
supply mismatch will augur well for pipe manufacturers’ bottomline as more than 20,000
kms of oil and gas pipelines will be added in the next four years domestically and 2,00,000
kms globally. Hence, the average yearly global demand would be over 50,000 kms in 3-4
years.
Operating margins to improve
We expect steel prices to stabilize at current levels and EBITDA margins to improve to 12.7%
in FY10E from 11.6% in FY07. Since the escalation clauses in its contracts are negligible,
any further decline in steel prices can give a fillip to the operating margins as pipe prices
globally are very bouyant.
Swelling order book position
The current outstanding order book position of MIL stands at Rs.14 bn, which will be executed
in the next 15-16 months. This order book represents 1x its FY08E turnover. Out of this
unexecuted order book position, US constitutes 60%, domestic orders are 10-15%, while
Middle East holds the balance. There was no major order addition during Q4FY08, but the
company has bids outstanding for over US$ 1 bn and is likely to get some of them converted
into concrete orders in the next few quarters.
Year to March (Rs. mn) FY06 FY07 FY08E FY09E FY10E
Revenue 7,994 10,596 15,509 20,881 26,220
Total Expenses 7,762 10,013 14,121 18,685 23,327
EBITDA 937 1,318 1,888 2,696 3,393
PBT 513 840 1,337 2,065 2,685
Net Income 350 553 883 1,363 1,772
EPS (Rs) 6.8 10.4 16.6 19.7 25.7
% Chg YoY (29.4) 52.4 59.6 19.2 30.0
P/E (x) 13.6 8.9 5.6 4.7 3.6
CEPS (Rs) 9.8 13.6 20.2 23.2 29.9
EV/E (x) 6.1 5.5 4.2 3.1 2.2
Dividend Yield (%) 1.1 1.9 2.2 2.2 2.2
RoCE (%) 12.9 13.2 14.9 17.0 18.8
RoE (%) 19.1 19.0 25.5 26.9 25.0
Source : HDFC Sec. Research
507090
110130150170190
J-07
J-07
A-0
7O
-07
N-0
7D
-07
J-08
F-0
8A
-08
M-0
8J-
08
5000
10000
15000
20000
25000
MIIL BSE_SENSEX
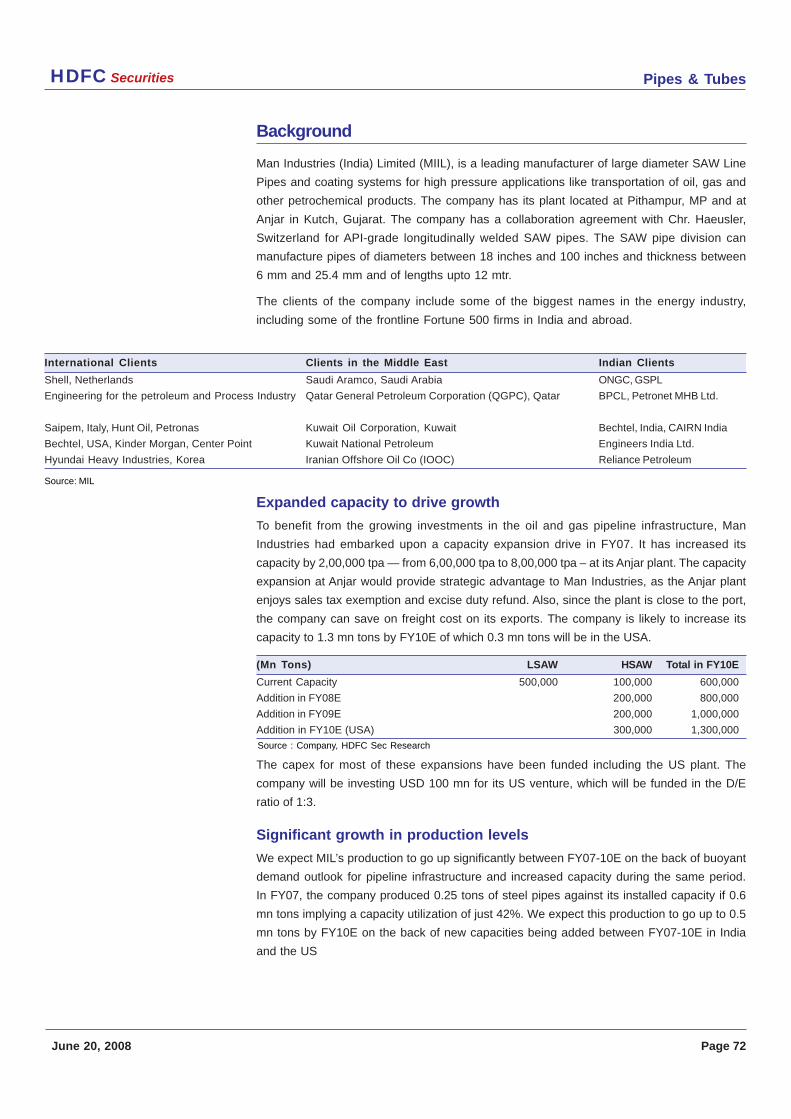
Pipes & TubesHDFC Securities
June 20, 2008 Page 72
Background
Man Industries (India) Limited (MIIL), is a leading manufacturer of large diameter SAW Line
Pipes and coating systems for high pressure applications like transportation of oil, gas and
other petrochemical products. The company has its plant located at Pithampur, MP and at
Anjar in Kutch, Gujarat. The company has a collaboration agreement with Chr. Haeusler,
Switzerland for API-grade longitudinally welded SAW pipes. The SAW pipe division can
manufacture pipes of diameters between 18 inches and 100 inches and thickness between
6 mm and 25.4 mm and of lengths upto 12 mtr.
The clients of the company include some of the biggest names in the energy industry,
including some of the frontline Fortune 500 firms in India and abroad.
International Clients Clients in the Middle East Indian Clients
Shell, Netherlands Saudi Aramco, Saudi Arabia ONGC, GSPL
Engineering for the petroleum and Process Industry Qatar General Petroleum Corporation (QGPC), Qatar BPCL, Petronet MHB Ltd.
Saipem, Italy, Hunt Oil, Petronas Kuwait Oil Corporation, Kuwait Bechtel, India, CAIRN India
Bechtel, USA, Kinder Morgan, Center Point Kuwait National Petroleum Engineers India Ltd.
Hyundai Heavy Industries, Korea Iranian Offshore Oil Co (IOOC) Reliance Petroleum
Source: MIL
Expanded capacity to drive growth
To benefit from the growing investments in the oil and gas pipeline infrastructure, Man
Industries had embarked upon a capacity expansion drive in FY07. It has increased its
capacity by 2,00,000 tpa — from 6,00,000 tpa to 8,00,000 tpa – at its Anjar plant. The capacity
expansion at Anjar would provide strategic advantage to Man Industries, as the Anjar plant
enjoys sales tax exemption and excise duty refund. Also, since the plant is close to the port,
the company can save on freight cost on its exports. The company is likely to increase its
capacity to 1.3 mn tons by FY10E of which 0.3 mn tons will be in the USA.
(Mn Tons) LSAW HSAW Total in FY10E
Current Capacity 500,000 100,000 600,000
Addition in FY08E 200,000 800,000
Addition in FY09E 200,000 1,000,000
Addition in FY10E (USA) 300,000 1,300,000
The capex for most of these expansions have been funded including the US plant. The
company will be investing USD 100 mn for its US venture, which will be funded in the D/E
ratio of 1:3.
Significant growth in production levels
We expect MIL’s production to go up significantly between FY07-10E on the back of buoyant
demand outlook for pipeline infrastructure and increased capacity during the same period.
In FY07, the company produced 0.25 tons of steel pipes against its installed capacity if 0.6
mn tons implying a capacity utilization of just 42%. We expect this production to go up to 0.5
mn tons by FY10E on the back of new capacities being added between FY07-10E in India
and the US
Source : Company, HDFC Sec Research
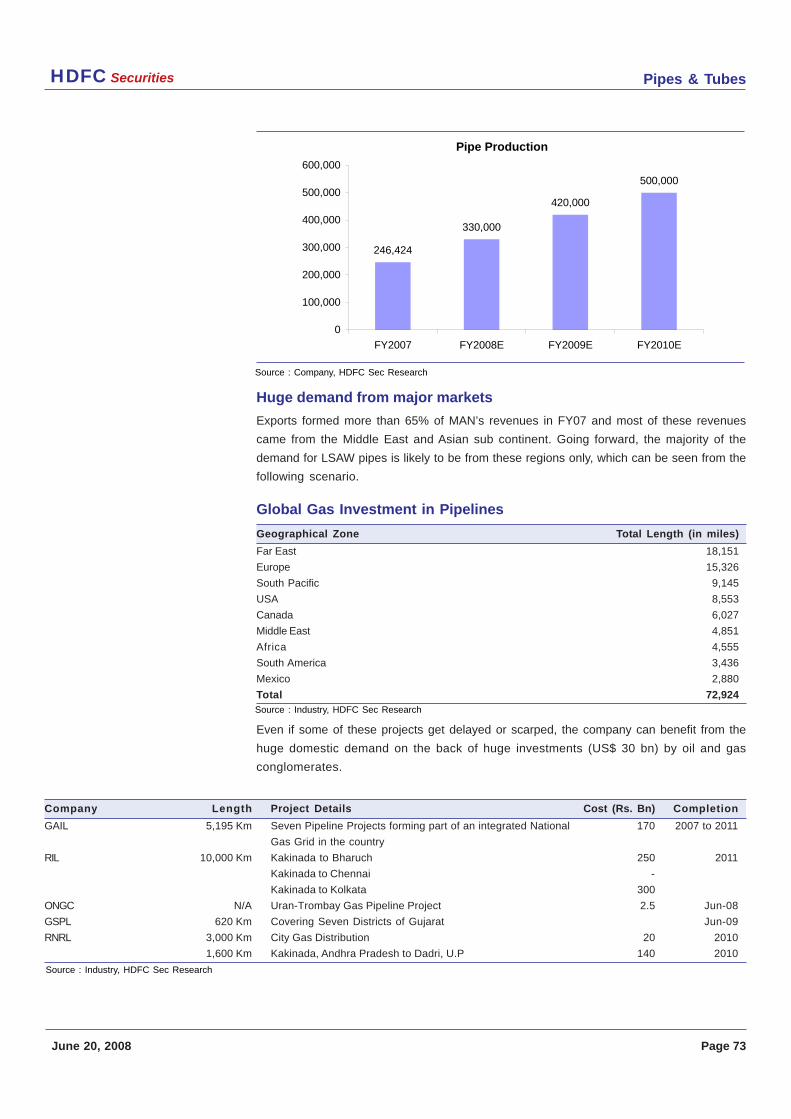
Pipes & TubesHDFC Securities
June 20, 2008 Page 73
Huge demand from major markets
Exports formed more than 65% of MAN’s revenues in FY07 and most of these revenues
came from the Middle East and Asian sub continent. Going forward, the majority of the
demand for LSAW pipes is likely to be from these regions only, which can be seen from the
following scenario.
Global Gas Investment in Pipelines
Geographical Zone Total Length (in miles)
Far East 18,151
Europe 15,326
South Pacific 9,145
USA 8,553
Canada 6,027
Middle East 4,851
Africa 4,555
South America 3,436
Mexico 2,880
Total 72,924
Even if some of these projects get delayed or scarped, the company can benefit from the
huge domestic demand on the back of huge investments (US$ 30 bn) by oil and gas
conglomerates.
Company Length Project Details Cost (Rs. Bn) Completion
GAIL 5,195 Km Seven Pipeline Projects forming part of an integrated National 170 2007 to 2011
Gas Grid in the country
RIL 10,000 Km Kakinada to Bharuch 250 2011
Kakinada to Chennai -
Kakinada to Kolkata 300
ONGC N/A Uran-Trombay Gas Pipeline Project 2.5 Jun-08
GSPL 620 Km Covering Seven Districts of Gujarat Jun-09
RNRL 3,000 Km City Gas Distribution 20 2010
1,600 Km Kakinada, Andhra Pradesh to Dadri, U.P 140 2010
Pipe Production
246,424
330,000
420,000
500,000
0
100,000
200,000
300,000
400,000
500,000
600,000
FY2007 FY2008E FY2009E FY2010E
Source : Company, HDFC Sec Research
Source : Industry, HDFC Sec Research
Source : Industry, HDFC Sec Research
Pipes & TubesHDFC Securities
June 20, 2008 Page 74
Swelling order book position
The current outstanding order book position of MIL stands at Rs.16 bn, which will be executed
in the next 15-16 months. This order book represents 1x its FY08E turnover. Out of this
unexecuted order book position, the US constitutes 60% followed by 10-15% of domestic
orders. The balance is from the Middle East. There was no major order addition during
Q3FY08. But the company has bids outstanding for over US$ 1 bn and is likely to get some
of them converted into concrete orders in the next few quarters.
New businesses
The company is entering into the real estate space on the back of past history of the promoters
of executing projects in and around Mumbai. Towards this the company has set up a subsidiary
named Man infrastructure (MIL’s Stake 51%), which will undertake various real estate projects
in India. The proposed new businesses may execute projects worth Rs.20 bn over next 3-4
years. However, we have not built in numbers from its real estate business, as it is premature.
We believe this initiative by the company may affect the overall business mix of MIL as it will
face the risk of diverting from its core business.
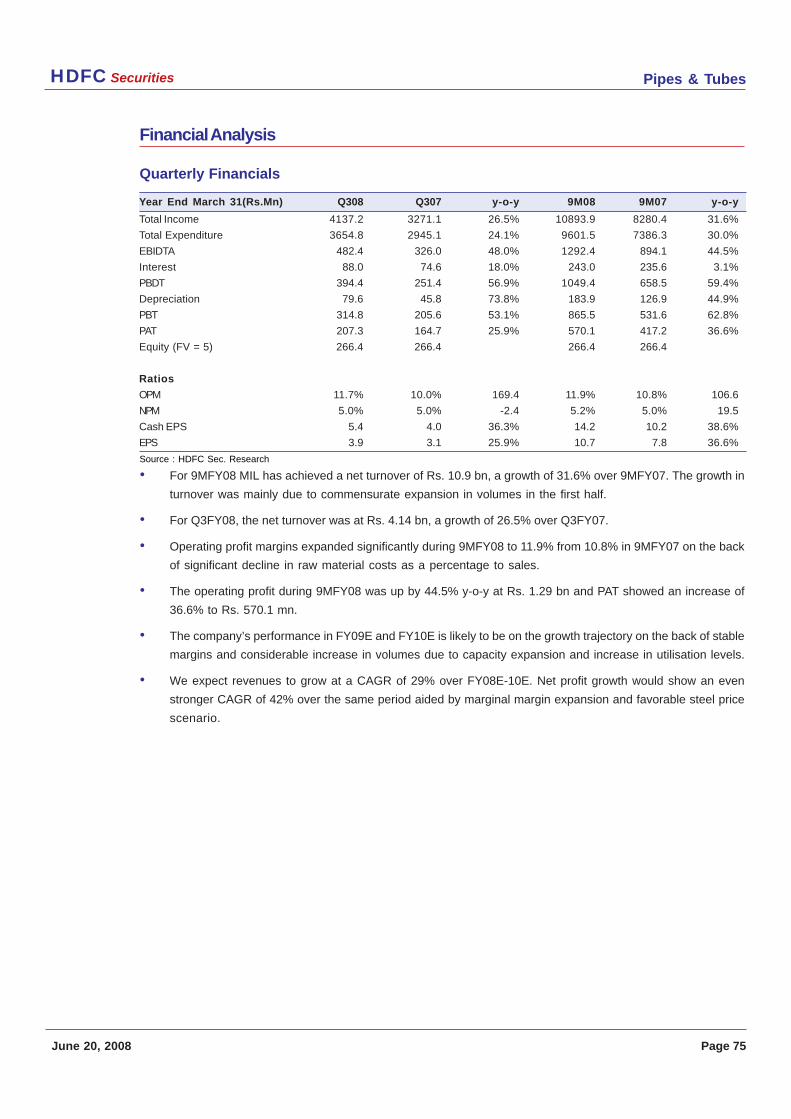
Pipes & TubesHDFC Securities
June 20, 2008 Page 75
Financial Analysis
Quarterly Financials
Year End March 31(Rs.Mn) Q308 Q307 y-o-y 9M08 9M07 y-o-y
Total Income 4137.2 3271.1 26.5% 10893.9 8280.4 31.6%
Total Expenditure 3654.8 2945.1 24.1% 9601.5 7386.3 30.0%
EBIDTA 482.4 326.0 48.0% 1292.4 894.1 44.5%
Interest 88.0 74.6 18.0% 243.0 235.6 3.1%
PBDT 394.4 251.4 56.9% 1049.4 658.5 59.4%
Depreciation 79.6 45.8 73.8% 183.9 126.9 44.9%
PBT 314.8 205.6 53.1% 865.5 531.6 62.8%
PAT 207.3 164.7 25.9% 570.1 417.2 36.6%
Equity (FV = 5) 266.4 266.4 266.4 266.4
Ratios
OPM 11.7% 10.0% 169.4 11.9% 10.8% 106.6
NPM 5.0% 5.0% -2.4 5.2% 5.0% 19.5
Cash EPS 5.4 4.0 36.3% 14.2 10.2 38.6%
EPS 3.9 3.1 25.9% 10.7 7.8 36.6%
• For 9MFY08 MIL has achieved a net turnover of Rs. 10.9 bn, a growth of 31.6% over 9MFY07. The growth in
turnover was mainly due to commensurate expansion in volumes in the first half.
• For Q3FY08, the net turnover was at Rs. 4.14 bn, a growth of 26.5% over Q3FY07.
• Operating profit margins expanded significantly during 9MFY08 to 11.9% from 10.8% in 9MFY07 on the back
of significant decline in raw material costs as a percentage to sales.
• The operating profit during 9MFY08 was up by 44.5% y-o-y at Rs. 1.29 bn and PAT showed an increase of
36.6% to Rs. 570.1 mn.
• The company’s performance in FY09E and FY10E is likely to be on the growth trajectory on the back of stable
margins and considerable increase in volumes due to capacity expansion and increase in utilisation levels.
• We expect revenues to grow at a CAGR of 29% over FY08E-10E. Net profit growth would show an even
stronger CAGR of 42% over the same period aided by marginal margin expansion and favorable steel price
scenario.
Source : HDFC Sec. Research
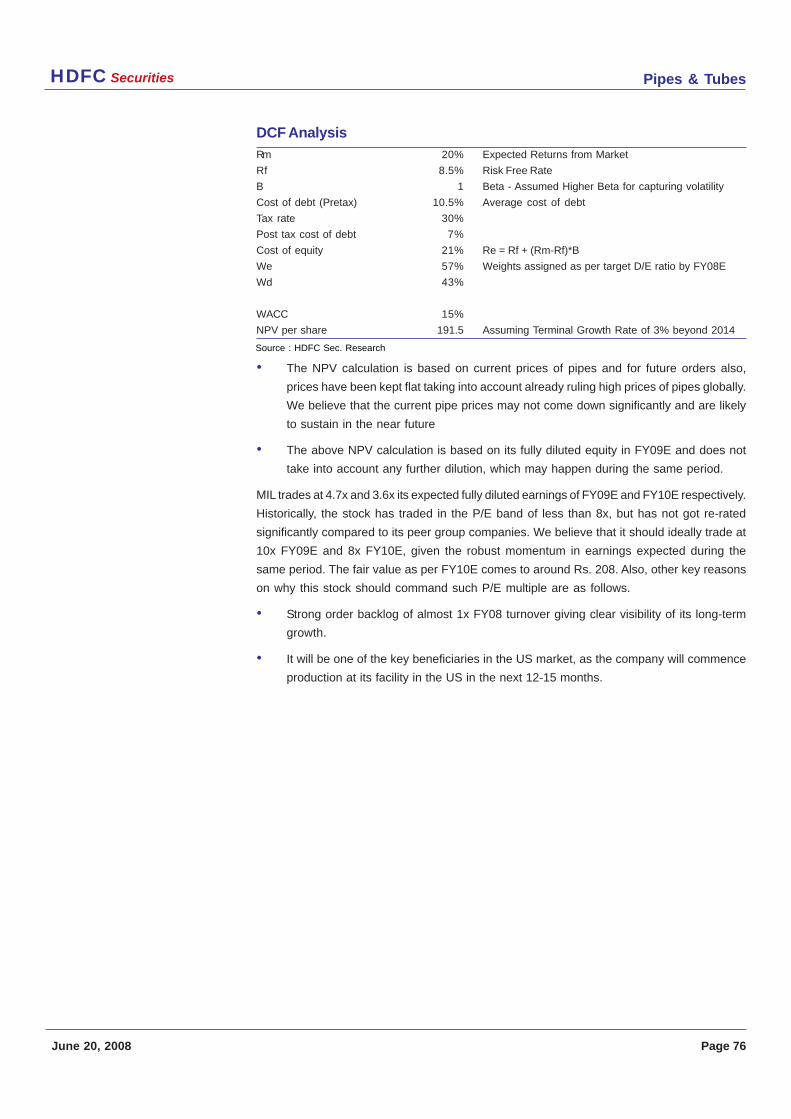
Pipes & TubesHDFC Securities
June 20, 2008 Page 76
DCF Analysis
Rm 20% Expected Returns from Market
Rf 8.5% Risk Free Rate
B 1 Beta - Assumed Higher Beta for capturing volatility
Cost of debt (Pretax) 10.5% Average cost of debt
Tax rate 30%
Post tax cost of debt 7%
Cost of equity 21% Re = Rf + (Rm-Rf)*B
We 57% Weights assigned as per target D/E ratio by FY08E
Wd 43%
WACC 15%
NPV per share 191.5 Assuming Terminal Growth Rate of 3% beyond 2014
• The NPV calculation is based on current prices of pipes and for future orders also,
prices have been kept flat taking into account already ruling high prices of pipes globally.
We believe that the current pipe prices may not come down significantly and are likely
to sustain in the near future
• The above NPV calculation is based on its fully diluted equity in FY09E and does not
take into account any further dilution, which may happen during the same period.
MIL trades at 4.7x and 3.6x its expected fully diluted earnings of FY09E and FY10E respectively.
Historically, the stock has traded in the P/E band of less than 8x, but has not got re-rated
significantly compared to its peer group companies. We believe that it should ideally trade at
10x FY09E and 8x FY10E, given the robust momentum in earnings expected during the
same period. The fair value as per FY10E comes to around Rs. 208. Also, other key reasons
on why this stock should command such P/E multiple are as follows.
• Strong order backlog of almost 1x FY08 turnover giving clear visibility of its long-term
growth.
• It will be one of the key beneficiaries in the US market, as the company will commence
production at its facility in the US in the next 12-15 months.
Source : HDFC Sec. Research
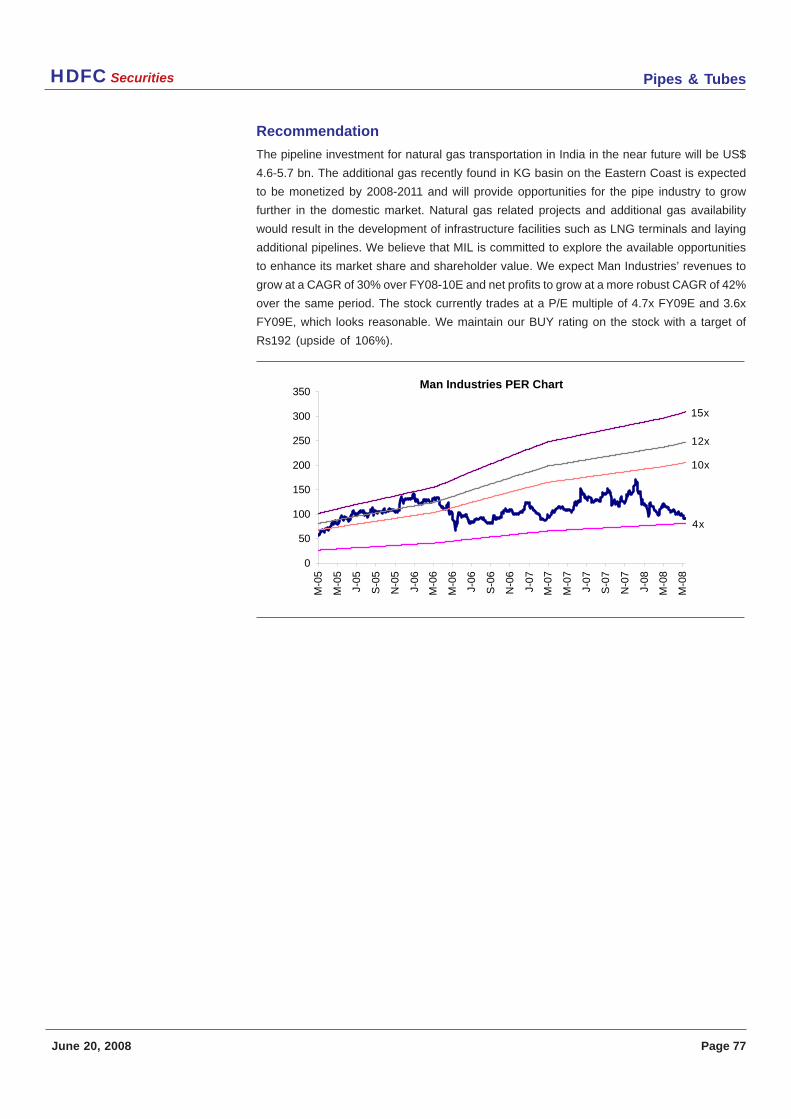
Pipes & TubesHDFC Securities
June 20, 2008 Page 77
Recommendation
The pipeline investment for natural gas transportation in India in the near future will be US$
4.6-5.7 bn. The additional gas recently found in KG basin on the Eastern Coast is expected
to be monetized by 2008-2011 and will provide opportunities for the pipe industry to grow
further in the domestic market. Natural gas related projects and additional gas availability
would result in the development of infrastructure facilities such as LNG terminals and laying
additional pipelines. We believe that MIL is committed to explore the available opportunities
to enhance its market share and shareholder value. We expect Man Industries’ revenues to
grow at a CAGR of 30% over FY08-10E and net profits to grow at a more robust CAGR of 42%
over the same period. The stock currently trades at a P/E multiple of 4.7x FY09E and 3.6x
FY09E, which looks reasonable. We maintain our BUY rating on the stock with a target of
Rs192 (upside of 106%).
Man Industries PER Chart
0
50
100
150
200
250
300
350
M-0
5
M-0
5
J-05
S-0
5
N-0
5
J-06
M-0
6
M-0
6
J-06
S-0
6
N-0
6
J-07
M-0
7
M-0
7
J-07
S-0
7
N-0
7
J-08
M-0
8
M-0
8
4x
10x
12x
15x
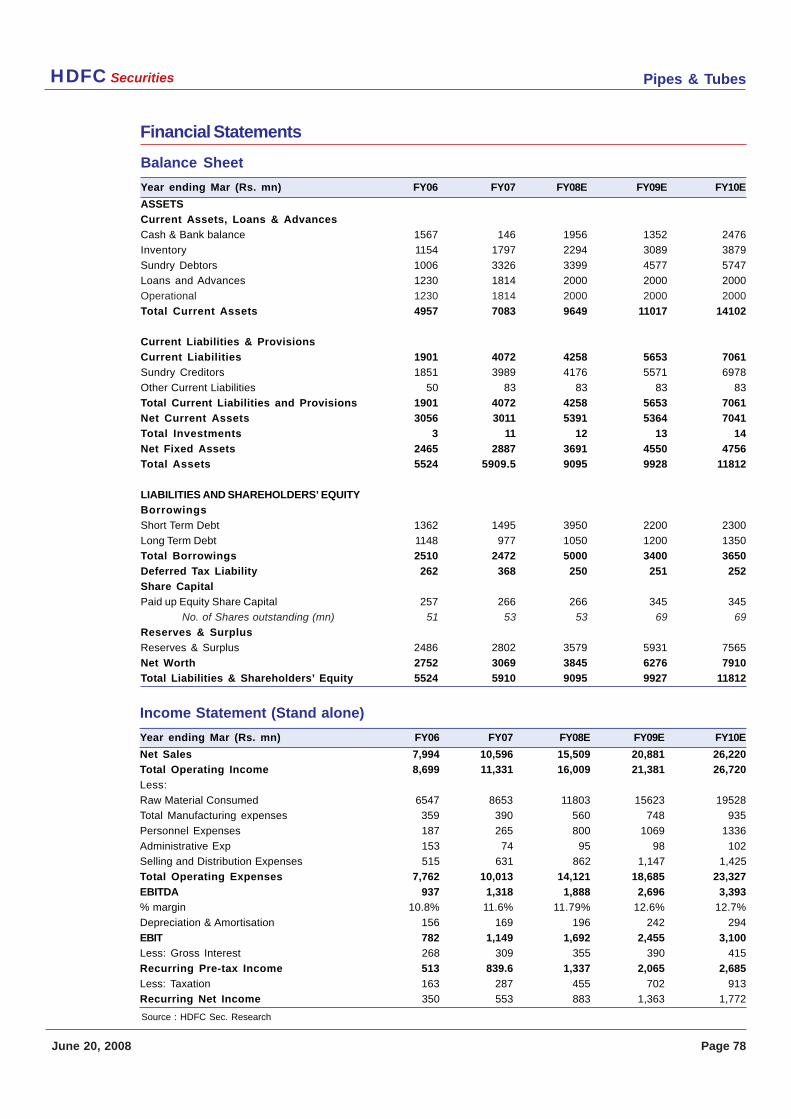
Pipes & TubesHDFC Securities
June 20, 2008 Page 78
Balance Sheet
Year ending Mar (Rs. mn) FY06 FY07 FY08E FY09E FY10E
ASSETS
Current Assets, Loans & Advances
Cash & Bank balance 1567 146 1956 1352 2476
Inventory 1154 1797 2294 3089 3879
Sundry Debtors 1006 3326 3399 4577 5747
Loans and Advances 1230 1814 2000 2000 2000
Operational 1230 1814 2000 2000 2000
Total Current Assets 4957 7083 9649 11017 14102
Current Liabilities & Provisions
Current Liabilities 1901 4072 4258 5653 7061
Sundry Creditors 1851 3989 4176 5571 6978
Other Current Liabilities 50 83 83 83 83
Total Current Liabilities and Provisions 1901 4072 4258 5653 7061
Net Current Assets 3056 3011 5391 5364 7041
Total Investments 3 11 12 13 14
Net Fixed Assets 2465 2887 3691 4550 4756
Total Assets 5524 5909.5 9095 9928 11812
LIABILITIES AND SHAREHOLDERS’ EQUITY
Borrowings
Short Term Debt 1362 1495 3950 2200 2300
Long Term Debt 1148 977 1050 1200 1350
Total Borrowings 2510 2472 5000 3400 3650
Deferred Tax Liability 262 368 250 251 252
Share Capital
Paid up Equity Share Capital 257 266 266 345 345
No. of Shares outstanding (mn) 51 53 53 69 69
Reserves & Surplus
Reserves & Surplus 2486 2802 3579 5931 7565
Net Worth 2752 3069 3845 6276 7910
Total Liabilities & Shareholders’ Equity 5524 5910 9095 9927 11812
Financial Statements
Source : HDFC Sec. Research
Income Statement (Stand alone)
Year ending Mar (Rs. mn) FY06 FY07 FY08E FY09E FY10E
Net Sales 7,994 10,596 15,509 20,881 26,220
Total Operating Income 8,699 11,331 16,009 21,381 26,720
Less:
Raw Material Consumed 6547 8653 11803 15623 19528
Total Manufacturing expenses 359 390 560 748 935
Personnel Expenses 187 265 800 1069 1336
Administrative Exp 153 74 95 98 102
Selling and Distribution Expenses 515 631 862 1,147 1,425
Total Operating Expenses 7,762 10,013 14,121 18,685 23,327
EBITDA 937 1,318 1,888 2,696 3,393
% margin 10.8% 11.6% 11.79% 12.6% 12.7%
Depreciation & Amortisation 156 169 196 242 294
EBIT 782 1,149 1,692 2,455 3,100
Less: Gross Interest 268 309 355 390 415
Recurring Pre-tax Income 513 839.6 1,337 2,065 2,685
Less: Taxation 163 287 455 702 913
Recurring Net Income 350 553 883 1,363 1,772
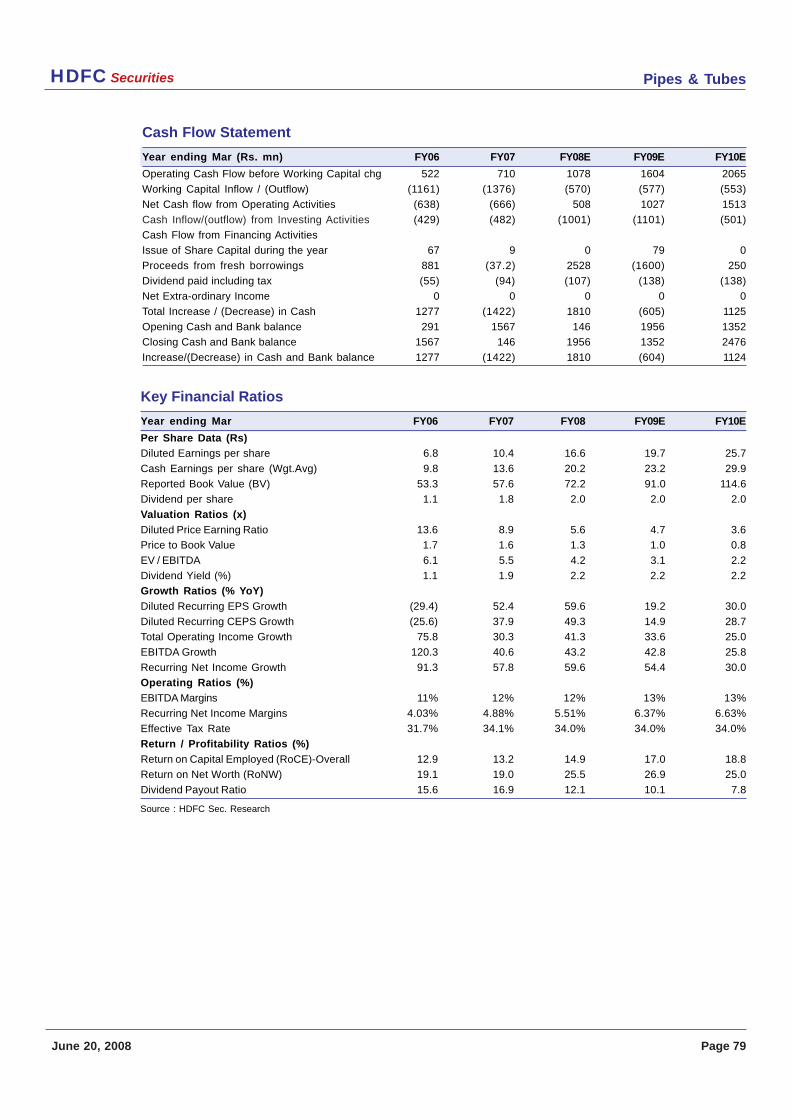
Pipes & TubesHDFC Securities
June 20, 2008 Page 79
Key Financial Ratios
Year ending Mar FY06 FY07 FY08 FY09E FY10E
Per Share Data (Rs)
Diluted Earnings per share 6.8 10.4 16.6 19.7 25.7
Cash Earnings per share (Wgt.Avg) 9.8 13.6 20.2 23.2 29.9
Reported Book Value (BV) 53.3 57.6 72.2 91.0 114.6
Dividend per share 1.1 1.8 2.0 2.0 2.0
Valuation Ratios (x)
Diluted Price Earning Ratio 13.6 8.9 5.6 4.7 3.6
Price to Book Value 1.7 1.6 1.3 1.0 0.8
EV / EBITDA 6.1 5.5 4.2 3.1 2.2
Dividend Yield (%) 1.1 1.9 2.2 2.2 2.2
Growth Ratios (% YoY)
Diluted Recurring EPS Growth (29.4) 52.4 59.6 19.2 30.0
Diluted Recurring CEPS Growth (25.6) 37.9 49.3 14.9 28.7
Total Operating Income Growth 75.8 30.3 41.3 33.6 25.0
EBITDA Growth 120.3 40.6 43.2 42.8 25.8
Recurring Net Income Growth 91.3 57.8 59.6 54.4 30.0
Operating Ratios (%)
EBITDA Margins 11% 12% 12% 13% 13%
Recurring Net Income Margins 4.03% 4.88% 5.51% 6.37% 6.63%
Effective Tax Rate 31.7% 34.1% 34.0% 34.0% 34.0%
Return / Profitability Ratios (%)
Return on Capital Employed (RoCE)-Overall 12.9 13.2 14.9 17.0 18.8
Return on Net Worth (RoNW) 19.1 19.0 25.5 26.9 25.0
Dividend Payout Ratio 15.6 16.9 12.1 10.1 7.8
Cash Flow Statement
Year ending Mar (Rs. mn) FY06 FY07 FY08E FY09E FY10E
Operating Cash Flow before Working Capital chg 522 710 1078 1604 2065
Working Capital Inflow / (Outflow) (1161) (1376) (570) (577) (553)
Net Cash flow from Operating Activities (638) (666) 508 1027 1513
Cash Inflow/(outflow) from Investing Activities (429) (482) (1001) (1101) (501)
Cash Flow from Financing Activities
Issue of Share Capital during the year 67 9 0 79 0
Proceeds from fresh borrowings 881 (37.2) 2528 (1600) 250
Dividend paid including tax (55) (94) (107) (138) (138)
Net Extra-ordinary Income 0 0 0 0 0
Total Increase / (Decrease) in Cash 1277 (1422) 1810 (605) 1125
Opening Cash and Bank balance 291 1567 146 1956 1352
Closing Cash and Bank balance 1567 146 1956 1352 2476
Increase/(Decrease) in Cash and Bank balance 1277 (1422) 1810 (604) 1124
Source : HDFC Sec. Research
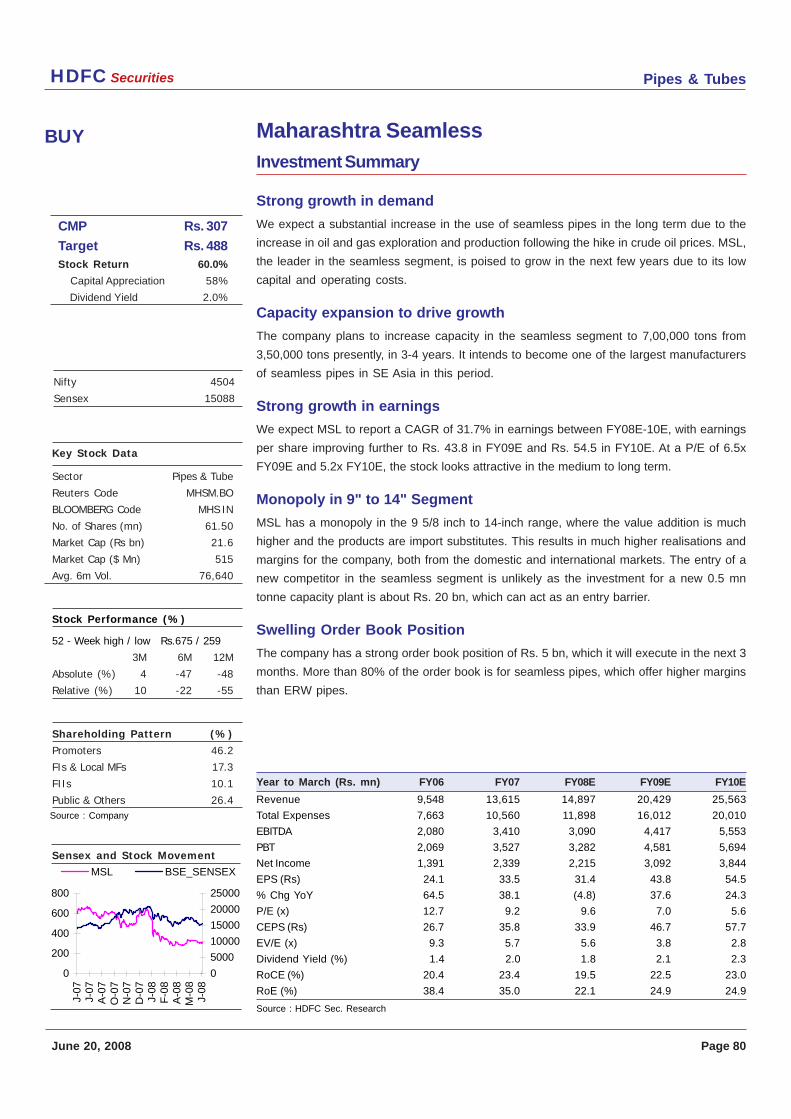
Pipes & TubesHDFC Securities
June 20, 2008 Page 80
Maharashtra SeamlessBUY
Key Stock Data
Sector Pipes & Tube
Reuters Code MHSM.BO
BLOOMBERG Code MHS IN
No. of Shares (mn) 61.50
Market Cap (Rs bn) 21.6
Market Cap ($ Mn) 515
Avg. 6m Vol. 76,640
Stock Performance (%)
52 - Week high / low Rs.675 / 259
3M 6M 12M
Absolute (%) 4 -47 -48
Relative (%) 10 -22 -55
Shareholding Pattern (%)
Promoters 46.2
FIs & Local MFs 17.3
FIIs 10.1
Public & Others 26.4
Sensex and Stock Movement
Nifty 4504
Sensex 15088
Source : Company
CMP Rs. 307
Target Rs. 488Stock Return 60.0%
Capital Appreciation 58%
Dividend Yield 2.0%
Investment Summary
Strong growth in demand
We expect a substantial increase in the use of seamless pipes in the long term due to the
increase in oil and gas exploration and production following the hike in crude oil prices. MSL,
the leader in the seamless segment, is poised to grow in the next few years due to its low
capital and operating costs.
Capacity expansion to drive growth
The company plans to increase capacity in the seamless segment to 7,00,000 tons from
3,50,000 tons presently, in 3-4 years. It intends to become one of the largest manufacturers
of seamless pipes in SE Asia in this period.
Strong growth in earnings
We expect MSL to report a CAGR of 31.7% in earnings between FY08E-10E, with earnings
per share improving further to Rs. 43.8 in FY09E and Rs. 54.5 in FY10E. At a P/E of 6.5x
FY09E and 5.2x FY10E, the stock looks attractive in the medium to long term.
Monopoly in 9" to 14" Segment
MSL has a monopoly in the 9 5/8 inch to 14-inch range, where the value addition is much
higher and the products are import substitutes. This results in much higher realisations and
margins for the company, both from the domestic and international markets. The entry of a
new competitor in the seamless segment is unlikely as the investment for a new 0.5 mn
tonne capacity plant is about Rs. 20 bn, which can act as an entry barrier.
Swelling Order Book Position
The company has a strong order book position of Rs. 5 bn, which it will execute in the next 3
months. More than 80% of the order book is for seamless pipes, which offer higher margins
than ERW pipes.
Year to March (Rs. mn) FY06 FY07 FY08E FY09E FY10E
Revenue 9,548 13,615 14,897 20,429 25,563
Total Expenses 7,663 10,560 11,898 16,012 20,010
EBITDA 2,080 3,410 3,090 4,417 5,553
PBT 2,069 3,527 3,282 4,581 5,694
Net Income 1,391 2,339 2,215 3,092 3,844
EPS (Rs) 24.1 33.5 31.4 43.8 54.5
% Chg YoY 64.5 38.1 (4.8) 37.6 24.3
P/E (x) 12.7 9.2 9.6 7.0 5.6
CEPS (Rs) 26.7 35.8 33.9 46.7 57.7
EV/E (x) 9.3 5.7 5.6 3.8 2.8
Dividend Yield (%) 1.4 2.0 1.8 2.1 2.3
RoCE (%) 20.4 23.4 19.5 22.5 23.0
RoE (%) 38.4 35.0 22.1 24.9 24.9
Source : HDFC Sec. Research
0
200
400
600
800
J-07
J-07
A-0
7O
-07
N-0
7D
-07
J-08
F-0
8A
-08
M-0
8J-
08
0
5000
10000
15000
20000
25000
MSL BSE_SENSEX
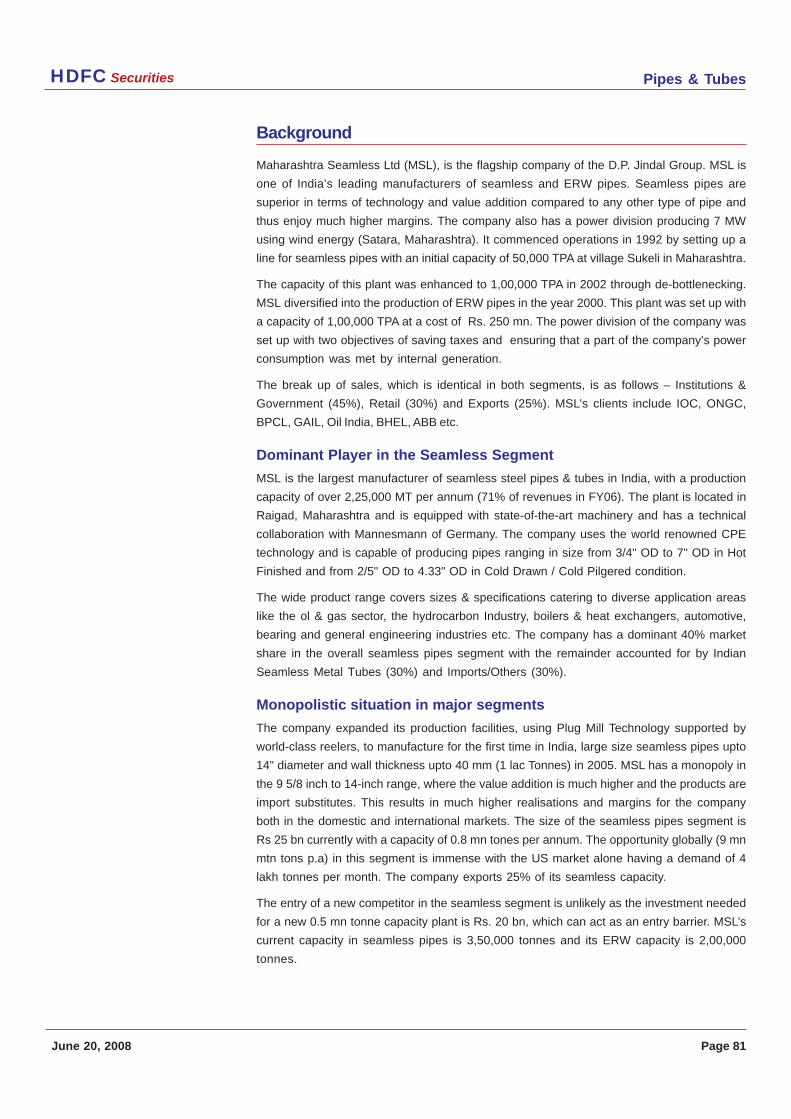
Pipes & TubesHDFC Securities
June 20, 2008 Page 81
Background
Maharashtra Seamless Ltd (MSL), is the flagship company of the D.P. Jindal Group. MSL is
one of India’s leading manufacturers of seamless and ERW pipes. Seamless pipes are
superior in terms of technology and value addition compared to any other type of pipe and
thus enjoy much higher margins. The company also has a power division producing 7 MW
using wind energy (Satara, Maharashtra). It commenced operations in 1992 by setting up a
line for seamless pipes with an initial capacity of 50,000 TPA at village Sukeli in Maharashtra.
The capacity of this plant was enhanced to 1,00,000 TPA in 2002 through de-bottlenecking.
MSL diversified into the production of ERW pipes in the year 2000. This plant was set up with
a capacity of 1,00,000 TPA at a cost of Rs. 250 mn. The power division of the company was
set up with two objectives of saving taxes and ensuring that a part of the company’s power
consumption was met by internal generation.
The break up of sales, which is identical in both segments, is as follows – Institutions &
Government (45%), Retail (30%) and Exports (25%). MSL’s clients include IOC, ONGC,
BPCL, GAIL, Oil India, BHEL, ABB etc.
Dominant Player in the Seamless Segment
MSL is the largest manufacturer of seamless steel pipes & tubes in India, with a production
capacity of over 2,25,000 MT per annum (71% of revenues in FY06). The plant is located in
Raigad, Maharashtra and is equipped with state-of-the-art machinery and has a technical
collaboration with Mannesmann of Germany. The company uses the world renowned CPE
technology and is capable of producing pipes ranging in size from 3/4" OD to 7" OD in Hot
Finished and from 2/5" OD to 4.33" OD in Cold Drawn / Cold Pilgered condition.
The wide product range covers sizes & specifications catering to diverse application areas
like the ol & gas sector, the hydrocarbon Industry, boilers & heat exchangers, automotive,
bearing and general engineering industries etc. The company has a dominant 40% market
share in the overall seamless pipes segment with the remainder accounted for by Indian
Seamless Metal Tubes (30%) and Imports/Others (30%).
Monopolistic situation in major segments
The company expanded its production facilities, using Plug Mill Technology supported by
world-class reelers, to manufacture for the first time in India, large size seamless pipes upto
14" diameter and wall thickness upto 40 mm (1 lac Tonnes) in 2005. MSL has a monopoly in
the 9 5/8 inch to 14-inch range, where the value addition is much higher and the products are
import substitutes. This results in much higher realisations and margins for the company
both in the domestic and international markets. The size of the seamless pipes segment is
Rs 25 bn currently with a capacity of 0.8 mn tones per annum. The opportunity globally (9 mn
mtn tons p.a) in this segment is immense with the US market alone having a demand of 4
lakh tonnes per month. The company exports 25% of its seamless capacity.
The entry of a new competitor in the seamless segment is unlikely as the investment needed
for a new 0.5 mn tonne capacity plant is Rs. 20 bn, which can act as an entry barrier. MSL’s
current capacity in seamless pipes is 3,50,000 tonnes and its ERW capacity is 2,00,000
tonnes.
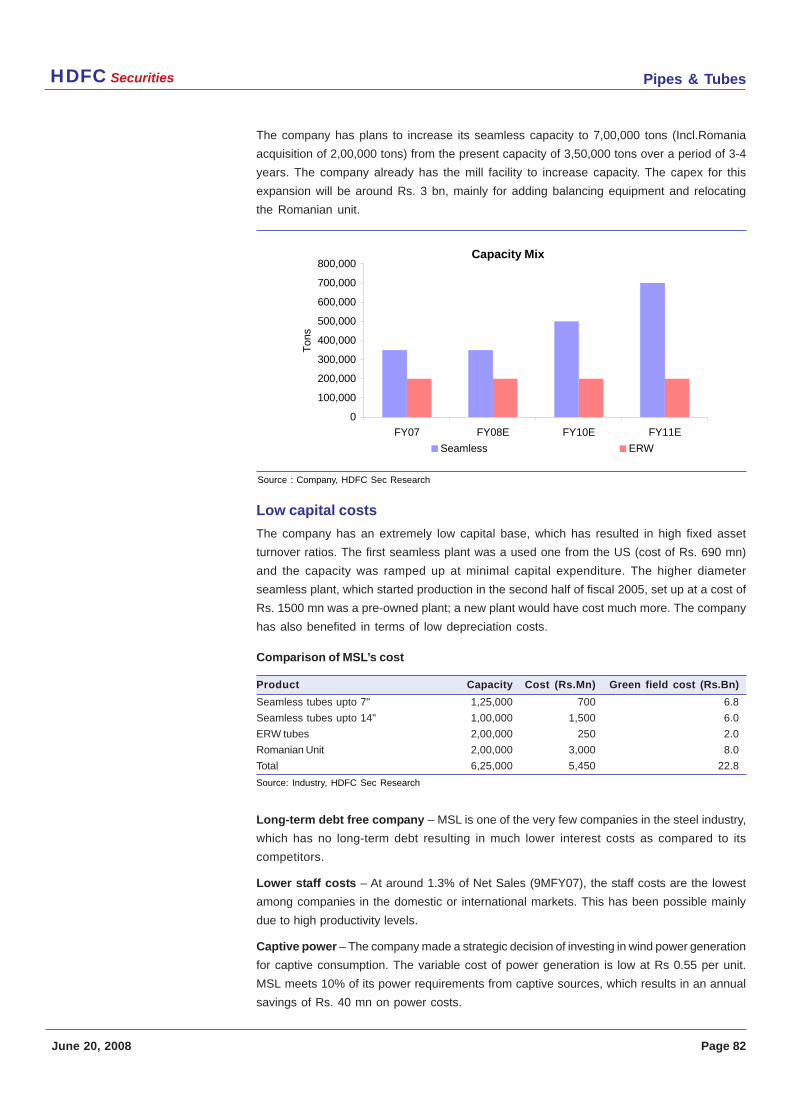
Pipes & TubesHDFC Securities
June 20, 2008 Page 82
The company has plans to increase its seamless capacity to 7,00,000 tons (Incl.Romania
acquisition of 2,00,000 tons) from the present capacity of 3,50,000 tons over a period of 3-4
years. The company already has the mill facility to increase capacity. The capex for this
expansion will be around Rs. 3 bn, mainly for adding balancing equipment and relocating
the Romanian unit.
Low capital costs
The company has an extremely low capital base, which has resulted in high fixed asset
turnover ratios. The first seamless plant was a used one from the US (cost of Rs. 690 mn)
and the capacity was ramped up at minimal capital expenditure. The higher diameter
seamless plant, which started production in the second half of fiscal 2005, set up at a cost of
Rs. 1500 mn was a pre-owned plant; a new plant would have cost much more. The company
has also benefited in terms of low depreciation costs.
Comparison of MSL’s cost
Product Capacity Cost (Rs.Mn) Green field cost (Rs.Bn)
Seamless tubes upto 7" 1,25,000 700 6.8
Seamless tubes upto 14" 1,00,000 1,500 6.0
ERW tubes 2,00,000 250 2.0
Romanian Unit 2,00,000 3,000 8.0
Total 6,25,000 5,450 22.8
Source: Industry, HDFC Sec Research
Long-term debt free company – MSL is one of the very few companies in the steel industry,
which has no long-term debt resulting in much lower interest costs as compared to its
competitors.
Lower staff costs – At around 1.3% of Net Sales (9MFY07), the staff costs are the lowest
among companies in the domestic or international markets. This has been possible mainly
due to high productivity levels.
Captive power – The company made a strategic decision of investing in wind power generation
for captive consumption. The variable cost of power generation is low at Rs 0.55 per unit.
MSL meets 10% of its power requirements from captive sources, which results in an annual
savings of Rs. 40 mn on power costs.
Capacity Mix
0
100,000
200,000
300,000
400,000
500,000
600,000
700,000
800,000
FY07 FY08E FY10E FY11E
Ton
s
Seamless ERW
Source : Company, HDFC Sec Research
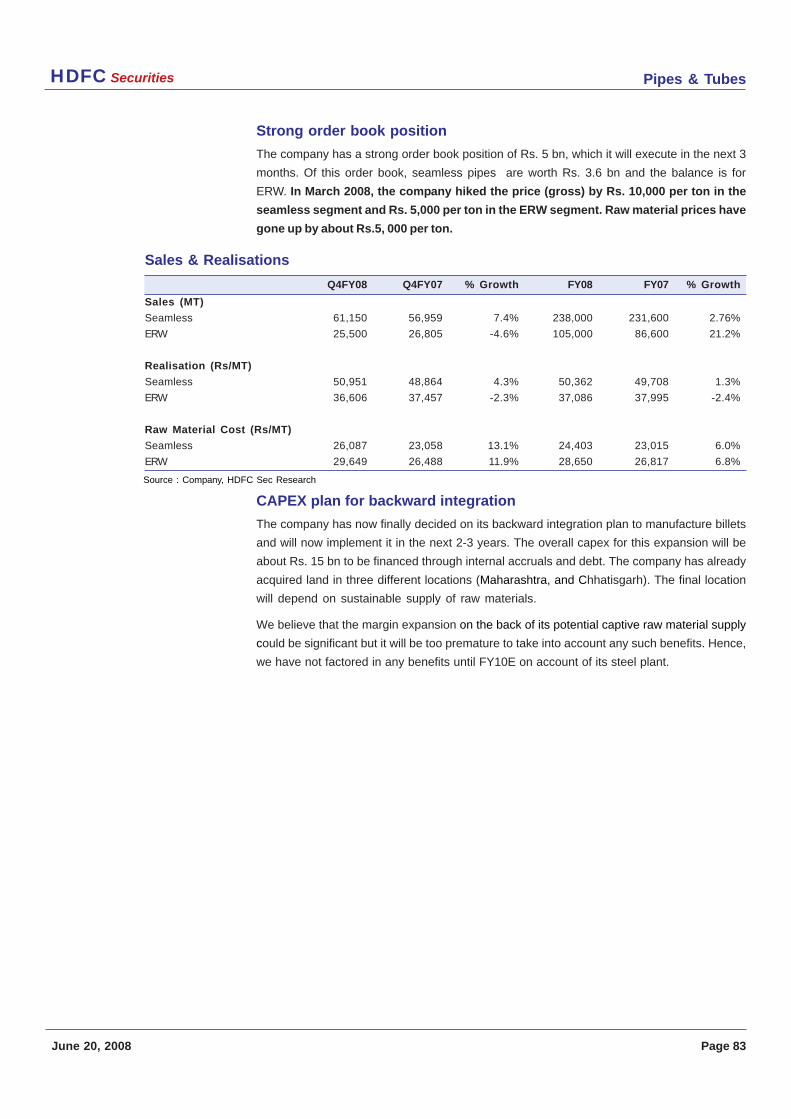
Pipes & TubesHDFC Securities
June 20, 2008 Page 83
Strong order book position
The company has a strong order book position of Rs. 5 bn, which it will execute in the next 3
months. Of this order book, seamless pipes are worth Rs. 3.6 bn and the balance is for
ERW. In March 2008, the company hiked the price (gross) by Rs. 10,000 per ton in the
seamless segment and Rs. 5,000 per ton in the ERW segment. Raw material prices have
gone up by about Rs.5, 000 per ton.
Sales & Realisations
Q4FY08 Q4FY07 % Growth FY08 FY07 % Growth
Sales (MT)
Seamless 61,150 56,959 7.4% 238,000 231,600 2.76%
ERW 25,500 26,805 -4.6% 105,000 86,600 21.2%
Realisation (Rs/MT)
Seamless 50,951 48,864 4.3% 50,362 49,708 1.3%
ERW 36,606 37,457 -2.3% 37,086 37,995 -2.4%
Raw Material Cost (Rs/MT)
Seamless 26,087 23,058 13.1% 24,403 23,015 6.0%
ERW 29,649 26,488 11.9% 28,650 26,817 6.8%
CAPEX plan for backward integration
The company has now finally decided on its backward integration plan to manufacture billets
and will now implement it in the next 2-3 years. The overall capex for this expansion will be
about Rs. 15 bn to be financed through internal accruals and debt. The company has already
acquired land in three different locations (Maharashtra, and Chhatisgarh). The final location
will depend on sustainable supply of raw materials.
We believe that the margin expansion on the back of its potential captive raw material supply
could be significant but it will be too premature to take into account any such benefits. Hence,
we have not factored in any benefits until FY10E on account of its steel plant.
Source : Company, HDFC Sec Research
Pipes & TubesHDFC Securities
June 20, 2008 Page 84
Key Concerns
Increase in raw material prices
Steel prices have been very volatile in the past owing to demand-supply concerns; MSL’s
inability to pass on the increase in raw material prices to its customers may significantly
affect its margins. However, past orders have been executed with good margins and with the
recent passing on of increased steel prices, stable margins will ensue.
Delay in backward integration
The main suppliers of raw materials in the seamless segment (round steel billets) are JSPL
and Kalyani Steel and imports are from Ukraine. In comparison, the raw material in the ERW
segment (HR coils) is more easily available. The main suppliers for HR coils are SAIL,
Jindal Vijaynagar, Ispat and Essar. As the requirement of raw materials has gone up, the
company is planning to integrate backwards to reduce the pressure on margins. This will
help the company obtain the right quantity and quality of raw materials. Any further delay in
this backward integration plan will increase the raw material risk substantially.
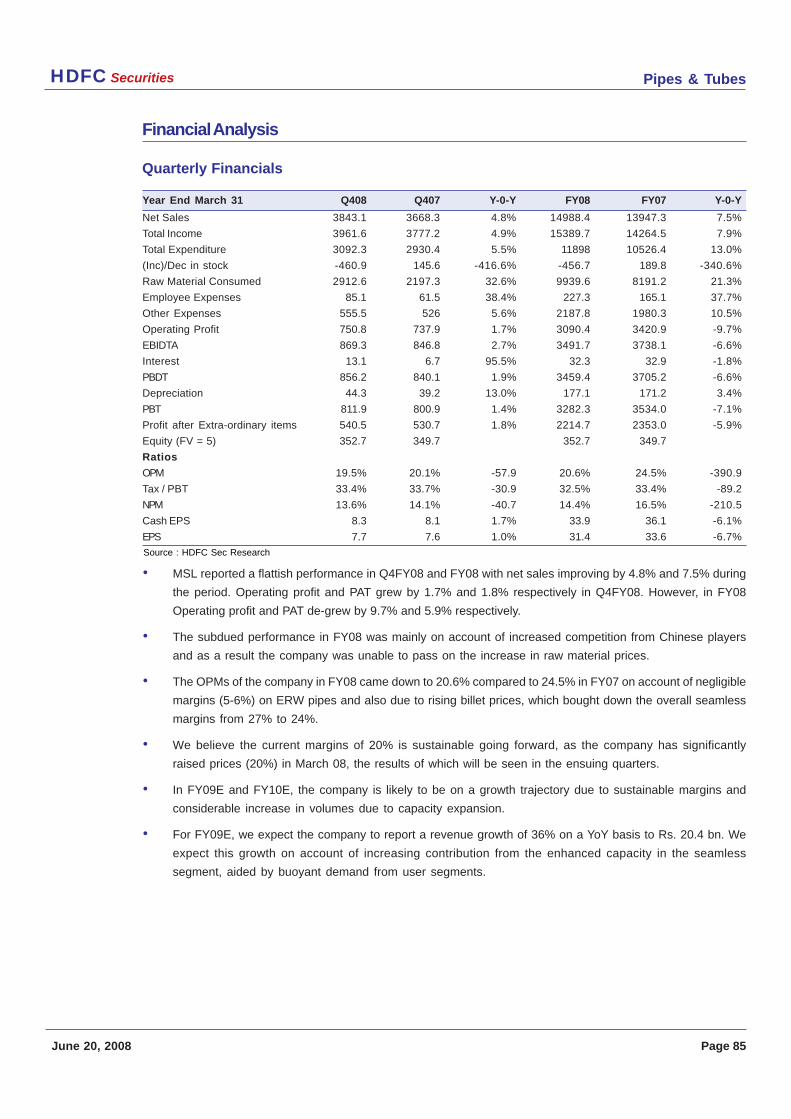
Pipes & TubesHDFC Securities
June 20, 2008 Page 85
Financial Analysis
Quarterly Financials
Year End March 31 Q408 Q407 Y-0-Y FY08 FY07 Y-0-Y
Net Sales 3843.1 3668.3 4.8% 14988.4 13947.3 7.5%
Total Income 3961.6 3777.2 4.9% 15389.7 14264.5 7.9%
Total Expenditure 3092.3 2930.4 5.5% 11898 10526.4 13.0%
(Inc)/Dec in stock -460.9 145.6 -416.6% -456.7 189.8 -340.6%
Raw Material Consumed 2912.6 2197.3 32.6% 9939.6 8191.2 21.3%
Employee Expenses 85.1 61.5 38.4% 227.3 165.1 37.7%
Other Expenses 555.5 526 5.6% 2187.8 1980.3 10.5%
Operating Profit 750.8 737.9 1.7% 3090.4 3420.9 -9.7%
EBIDTA 869.3 846.8 2.7% 3491.7 3738.1 -6.6%
Interest 13.1 6.7 95.5% 32.3 32.9 -1.8%
PBDT 856.2 840.1 1.9% 3459.4 3705.2 -6.6%
Depreciation 44.3 39.2 13.0% 177.1 171.2 3.4%
PBT 811.9 800.9 1.4% 3282.3 3534.0 -7.1%
Profit after Extra-ordinary items 540.5 530.7 1.8% 2214.7 2353.0 -5.9%
Equity (FV = 5) 352.7 349.7 352.7 349.7
Ratios
OPM 19.5% 20.1% -57.9 20.6% 24.5% -390.9
Tax / PBT 33.4% 33.7% -30.9 32.5% 33.4% -89.2
NPM 13.6% 14.1% -40.7 14.4% 16.5% -210.5
Cash EPS 8.3 8.1 1.7% 33.9 36.1 -6.1%
EPS 7.7 7.6 1.0% 31.4 33.6 -6.7%
• MSL reported a flattish performance in Q4FY08 and FY08 with net sales improving by 4.8% and 7.5% during
the period. Operating profit and PAT grew by 1.7% and 1.8% respectively in Q4FY08. However, in FY08
Operating profit and PAT de-grew by 9.7% and 5.9% respectively.
• The subdued performance in FY08 was mainly on account of increased competition from Chinese players
and as a result the company was unable to pass on the increase in raw material prices.
• The OPMs of the company in FY08 came down to 20.6% compared to 24.5% in FY07 on account of negligible
margins (5-6%) on ERW pipes and also due to rising billet prices, which bought down the overall seamless
margins from 27% to 24%.
• We believe the current margins of 20% is sustainable going forward, as the company has significantly
raised prices (20%) in March 08, the results of which will be seen in the ensuing quarters.
• In FY09E and FY10E, the company is likely to be on a growth trajectory due to sustainable margins and
considerable increase in volumes due to capacity expansion.
• For FY09E, we expect the company to report a revenue growth of 36% on a YoY basis to Rs. 20.4 bn. We
expect this growth on account of increasing contribution from the enhanced capacity in the seamless
segment, aided by buoyant demand from user segments.
Source : HDFC Sec Research
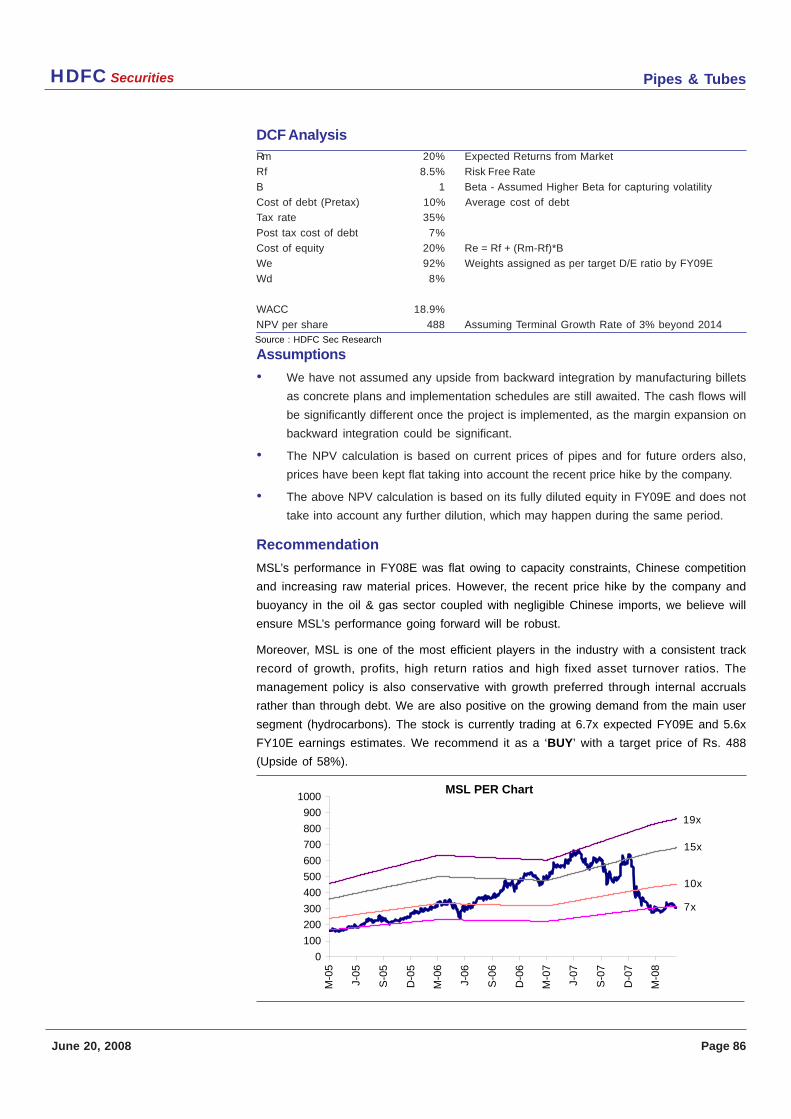
Pipes & TubesHDFC Securities
June 20, 2008 Page 86
DCF AnalysisRm 20% Expected Returns from Market
Rf 8.5% Risk Free Rate
B 1 Beta - Assumed Higher Beta for capturing volatility
Cost of debt (Pretax) 10% Average cost of debt
Tax rate 35%
Post tax cost of debt 7%
Cost of equity 20% Re = Rf + (Rm-Rf)*B
We 92% Weights assigned as per target D/E ratio by FY09E
Wd 8%
WACC 18.9%
NPV per share 488 Assuming Terminal Growth Rate of 3% beyond 2014
Assumptions
• We have not assumed any upside from backward integration by manufacturing billets
as concrete plans and implementation schedules are still awaited. The cash flows will
be significantly different once the project is implemented, as the margin expansion on
backward integration could be significant.
• The NPV calculation is based on current prices of pipes and for future orders also,
prices have been kept flat taking into account the recent price hike by the company.
• The above NPV calculation is based on its fully diluted equity in FY09E and does not
take into account any further dilution, which may happen during the same period.
Recommendation
MSL’s performance in FY08E was flat owing to capacity constraints, Chinese competition
and increasing raw material prices. However, the recent price hike by the company and
buoyancy in the oil & gas sector coupled with negligible Chinese imports, we believe will
ensure MSL’s performance going forward will be robust.
Moreover, MSL is one of the most efficient players in the industry with a consistent track
record of growth, profits, high return ratios and high fixed asset turnover ratios. The
management policy is also conservative with growth preferred through internal accruals
rather than through debt. We are also positive on the growing demand from the main user
segment (hydrocarbons). The stock is currently trading at 6.7x expected FY09E and 5.6x
FY10E earnings estimates. We recommend it as a ‘BUY’ with a target price of Rs. 488
(Upside of 58%).
MSL PER Chart
0
100
200
300
400
500
600
700
800
900
1000
M-0
5
J-05
S-0
5
D-0
5
M-0
6
J-06
S-0
6
D-0
6
M-0
7
J-07
S-0
7
D-0
7
M-0
8
7x
10x
15x
19x
Source : HDFC Sec Research
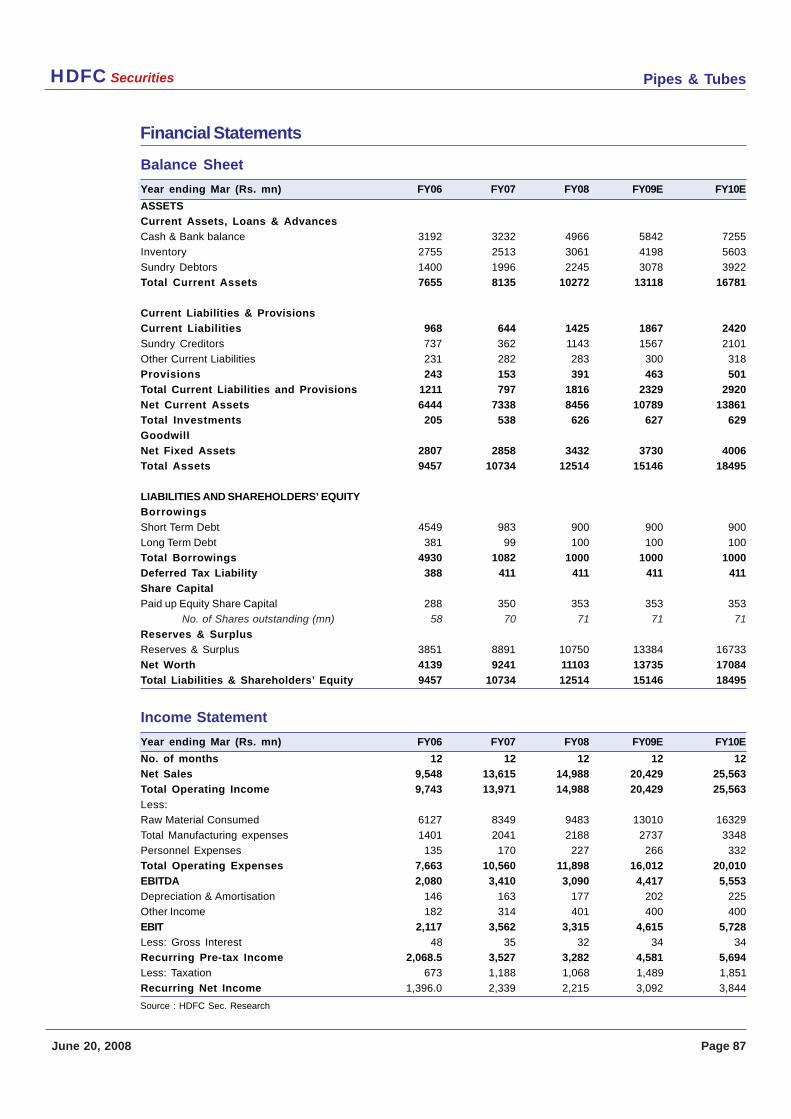
Pipes & TubesHDFC Securities
June 20, 2008 Page 87
Balance Sheet
Year ending Mar (Rs. mn) FY06 FY07 FY08 FY09E FY10E
ASSETS
Current Assets, Loans & Advances
Cash & Bank balance 3192 3232 4966 5842 7255
Inventory 2755 2513 3061 4198 5603
Sundry Debtors 1400 1996 2245 3078 3922
Total Current Assets 7655 8135 10272 13118 16781
Current Liabilities & Provisions
Current Liabilities 968 644 1425 1867 2420
Sundry Creditors 737 362 1143 1567 2101
Other Current Liabilities 231 282 283 300 318
Provisions 243 153 391 463 501
Total Current Liabilities and Provisions 1211 797 1816 2329 2920
Net Current Assets 6444 7338 8456 10789 13861
Total Investments 205 538 626 627 629
Goodwill
Net Fixed Assets 2807 2858 3432 3730 4006
Total Assets 9457 10734 12514 15146 18495
LIABILITIES AND SHAREHOLDERS’ EQUITY
Borrowings
Short Term Debt 4549 983 900 900 900
Long Term Debt 381 99 100 100 100
Total Borrowings 4930 1082 1000 1000 1000
Deferred Tax Liability 388 411 411 411 411
Share Capital
Paid up Equity Share Capital 288 350 353 353 353
No. of Shares outstanding (mn) 58 70 71 71 71
Reserves & Surplus
Reserves & Surplus 3851 8891 10750 13384 16733
Net Worth 4139 9241 11103 13735 17084
Total Liabilities & Shareholders’ Equity 9457 10734 12514 15146 18495
Financial Statements
Income Statement
Year ending Mar (Rs. mn) FY06 FY07 FY08 FY09E FY10E
No. of months 12 12 12 12 12
Net Sales 9,548 13,615 14,988 20,429 25,563
Total Operating Income 9,743 13,971 14,988 20,429 25,563
Less:
Raw Material Consumed 6127 8349 9483 13010 16329
Total Manufacturing expenses 1401 2041 2188 2737 3348
Personnel Expenses 135 170 227 266 332
Total Operating Expenses 7,663 10,560 11,898 16,012 20,010
EBITDA 2,080 3,410 3,090 4,417 5,553
Depreciation & Amortisation 146 163 177 202 225
Other Income 182 314 401 400 400
EBIT 2,117 3,562 3,315 4,615 5,728
Less: Gross Interest 48 35 32 34 34
Recurring Pre-tax Income 2,068.5 3,527 3,282 4,581 5,694
Less: Taxation 673 1,188 1,068 1,489 1,851
Recurring Net Income 1,396.0 2,339 2,215 3,092 3,844
Source : HDFC Sec. Research
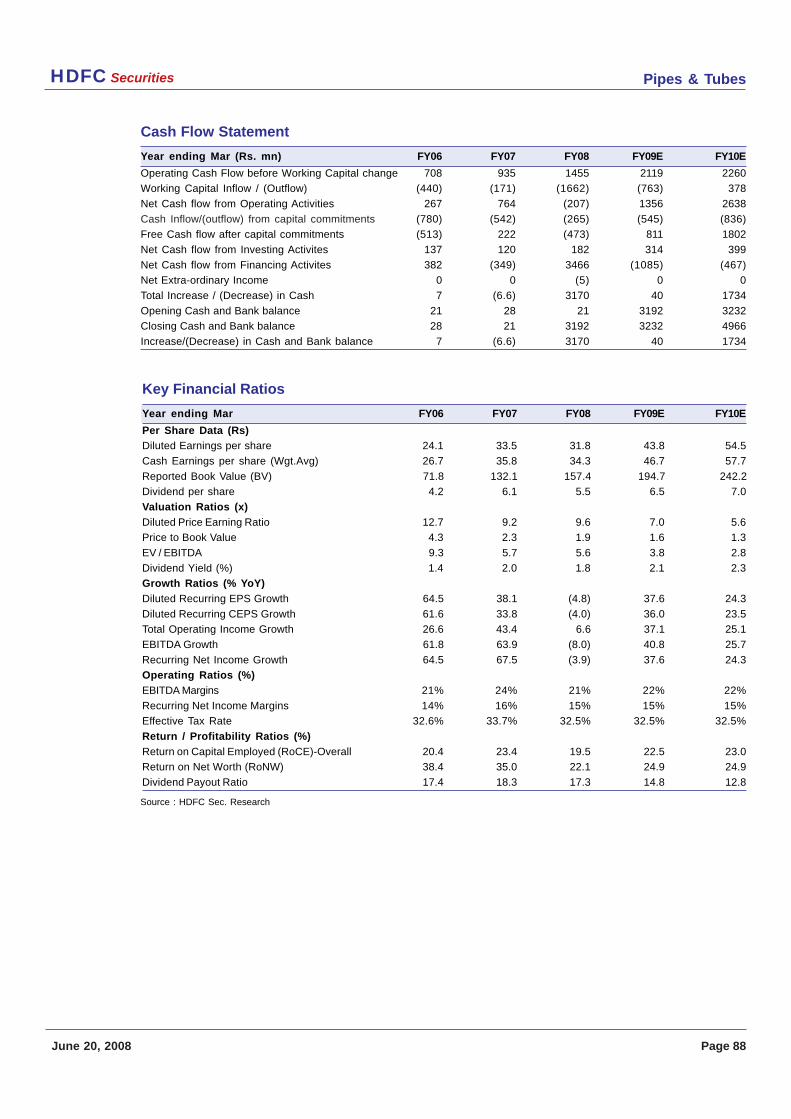
Pipes & TubesHDFC Securities
June 20, 2008 Page 88
Cash Flow Statement
Year ending Mar (Rs. mn) FY06 FY07 FY08 FY09E FY10E
Operating Cash Flow before Working Capital change 708 935 1455 2119 2260
Working Capital Inflow / (Outflow) (440) (171) (1662) (763) 378
Net Cash flow from Operating Activities 267 764 (207) 1356 2638
Cash Inflow/(outflow) from capital commitments (780) (542) (265) (545) (836)
Free Cash flow after capital commitments (513) 222 (473) 811 1802
Net Cash flow from Investing Activites 137 120 182 314 399
Net Cash flow from Financing Activites 382 (349) 3466 (1085) (467)
Net Extra-ordinary Income 0 0 (5) 0 0
Total Increase / (Decrease) in Cash 7 (6.6) 3170 40 1734
Opening Cash and Bank balance 21 28 21 3192 3232
Closing Cash and Bank balance 28 21 3192 3232 4966
Increase/(Decrease) in Cash and Bank balance 7 (6.6) 3170 40 1734
Key Financial Ratios
Year ending Mar FY06 FY07 FY08 FY09E FY10E
Per Share Data (Rs)
Diluted Earnings per share 24.1 33.5 31.8 43.8 54.5
Cash Earnings per share (Wgt.Avg) 26.7 35.8 34.3 46.7 57.7
Reported Book Value (BV) 71.8 132.1 157.4 194.7 242.2
Dividend per share 4.2 6.1 5.5 6.5 7.0
Valuation Ratios (x)
Diluted Price Earning Ratio 12.7 9.2 9.6 7.0 5.6
Price to Book Value 4.3 2.3 1.9 1.6 1.3
EV / EBITDA 9.3 5.7 5.6 3.8 2.8
Dividend Yield (%) 1.4 2.0 1.8 2.1 2.3
Growth Ratios (% YoY)
Diluted Recurring EPS Growth 64.5 38.1 (4.8) 37.6 24.3
Diluted Recurring CEPS Growth 61.6 33.8 (4.0) 36.0 23.5
Total Operating Income Growth 26.6 43.4 6.6 37.1 25.1
EBITDA Growth 61.8 63.9 (8.0) 40.8 25.7
Recurring Net Income Growth 64.5 67.5 (3.9) 37.6 24.3
Operating Ratios (%)
EBITDA Margins 21% 24% 21% 22% 22%
Recurring Net Income Margins 14% 16% 15% 15% 15%
Effective Tax Rate 32.6% 33.7% 32.5% 32.5% 32.5%
Return / Profitability Ratios (%)
Return on Capital Employed (RoCE)-Overall 20.4 23.4 19.5 22.5 23.0
Return on Net Worth (RoNW) 38.4 35.0 22.1 24.9 24.9
Dividend Payout Ratio 17.4 18.3 17.3 14.8 12.8
Source : HDFC Sec. Research

Pipes & TubesHDFC Securities
June 20, 2008 Page 89
Ratnamani Metals and TubesBUY
Key Stock Data
Sector Pipes & Tube
Reuters Code RMT.BO
BLOOMBERG Code RMT IN
No. of Shares (mn) 9.00
Market Cap (Rs bn) 8.0
Market Cap ($ Mn) 192
Avg. 6m Vol. 3,571
Stock Performance (%)
52 - Week high / low Rs.1508 / 652
3M 6M 12M
Absolute (%) -17 -41 -19
Relative (%) -11 -17 -26
Shareholding Pattern (%)
Promoters 58.8
FIs & Local MFs 4.3
FIIs 8.8
Public & Others 28.1
Sensex and Stock Movement
Nifty 4504
Sensex 15088
Source : Company
CMP Rs. 852
Target Rs. 1,450Stock Return 74.6%
Capital Appreciation 74%
Dividend Yield 0.6%
Investment Summary
Strong order book position
The company currently has an unexecuted order book position of Rs. 5.32 bn, which it has
had since April 2008. Part of the orders will be executed over a period of three to four months
and this will convert into sales by Q3FY09.
Export demand to drive growth
The company is capitalizing on the export opportunities presented by various regions around
the world. The company has a cost advantage in the Middle East and South East Asian
regions due to lower transportation costs. We expect exports to constitute 20% of the total
turnover in FY09E.
Integrated seamless tube manufacturer
The company’s mother tube (raw material for seamless tubes) steel manufacturing plant
will become operational in FY08E with a capacity of 7000 TPA for captive consumption. This
will save about Rs. 100-150 mn p.a on raw material costs. Currently, the company sources
mother tubes from Korea, China, Japan and some domestic players (Sandvik) as high
grade tubes are not available domestically. EBITDA margins in FY09E are likely to remain
stable at around 20% despite incremental contribution from low margin carbon steel tubes,
as we estimate 90% of its raw material requirement will be met by captive production.
Healthy demand from user segments
RMTL is on the approved vendor list of all the hydrocarbon majors for supply of SSTP and
CSTP. It supplies these pipes and tubes for direct (Oil majors, water sewage boards) or
indirect (EPC contractors) usage for oil and gas, engineering and water related sectors. The
company will benefit from the proposed refineries being added both in the domestic and
international markets and also from the huge investments in the power and engineering
industry.
Year to March (Rs. mn) FY06 FY07E FY08E FY09E FY10E
Revenue 3,160 5,655 7,930 12,499 17,490
Total Expenses 2,558 4,435 6,272 9,948 14,042
EBITDA 633 1,277 1,768 2,661 3,558
PBT 471 1,007 1,512 2,271 3,148
Net Income 335 642 998 1,499 2,078
EPS (Rs) 37.3 71.3 110.9 158.6 219.8
% Chg YoY 153.1 91.3 55.5 43.0 38.6
P/E (x) 22.9 11.9 7.7 5.4 3.9
CEPS (Rs) 45.5 88.6 137.3 190.5 253.2
EV/E (x) 13.6 7.4 5.4 3.4 2.1
Dividend Yield (%) 0.3 0.6 0.7 0.8 0.9
RoCE (%) 24.7 26.4 27.0 29.0 29.3
RoE (%) 50.7 57.8 53.2 45.7 39.9
Source : HDFC Sec. Research
0
500
1000
1500
2000
J-07
J-07
A-0
7S
-07
O-0
7N
-07
D-0
7J-
08F
-08
M-0
8M
-08
J-08
0
5000
10000
15000
20000
25000RMTL BSE_SENSEX
Pipes & TubesHDFC Securities
June 20, 2008 Page 90
Background
Ratnamani Metals & Tubes (RMTL), was incorporated in Sep.’83 as a small-scale industrial
undertaking and was called Ratnamani Metals & Tubes Pvt Ltd. It became a deemed public
limited company in Jul.’89. Another small-scale unit, Ratnamani Tube Industries Pvt Ltd was
also set up by the same promoters in 1985, which too became a public limited company in
Jul.’90. Ratnamani Tube Industries was amalgamated with Ratnamani Metals & Tubes in
Apr.’91 to form RMTL.
RMTL manufactures stainless steel seamless and welded pipes and tubes for various
applications. In addition, it undertakes job-work for drawing of pipes.
Business Overview
RMTL mainly manufactures and sells
Stainless Steel Tubes and Pipes (SSTP) – 43% of revenues
• Seamless
• Welded
• Mother tubes (Hot Extruded Seamless tubes) – 57% of revenues
Carbon Steel Tubes and Pipes (CSTP)
• LSAW
• Circumferential LSAW – Larger Dia LSAW Pipes
• HSAW
• ERW
SSTPs are typically used in heat exchangers, boilers, condensers, and refrigeration etc. The
major user industry segments are petrochemicals, fertilizers, refineries, chemical plants,
power plants, food processing and pharmaceuticals among others. Stainless steel has
many superior metallurgical properties and is the preferred metal in all the critical applications
involving transportation of corrosive liquids.
On the other hand CSTPs are primarily used for continuous transportation of large quantities
of oil, natural gas and water over the long distances and are more economical than other
means of transport because of the one time costs involved in laying the network and minimum
cost of operations and maintenance. Apart from the above, CS pipes also find application in.
• On shore and off shore drilling platforms
• Casing, structural pipes etc
• As project piping in large petrochemical and refinery projects.
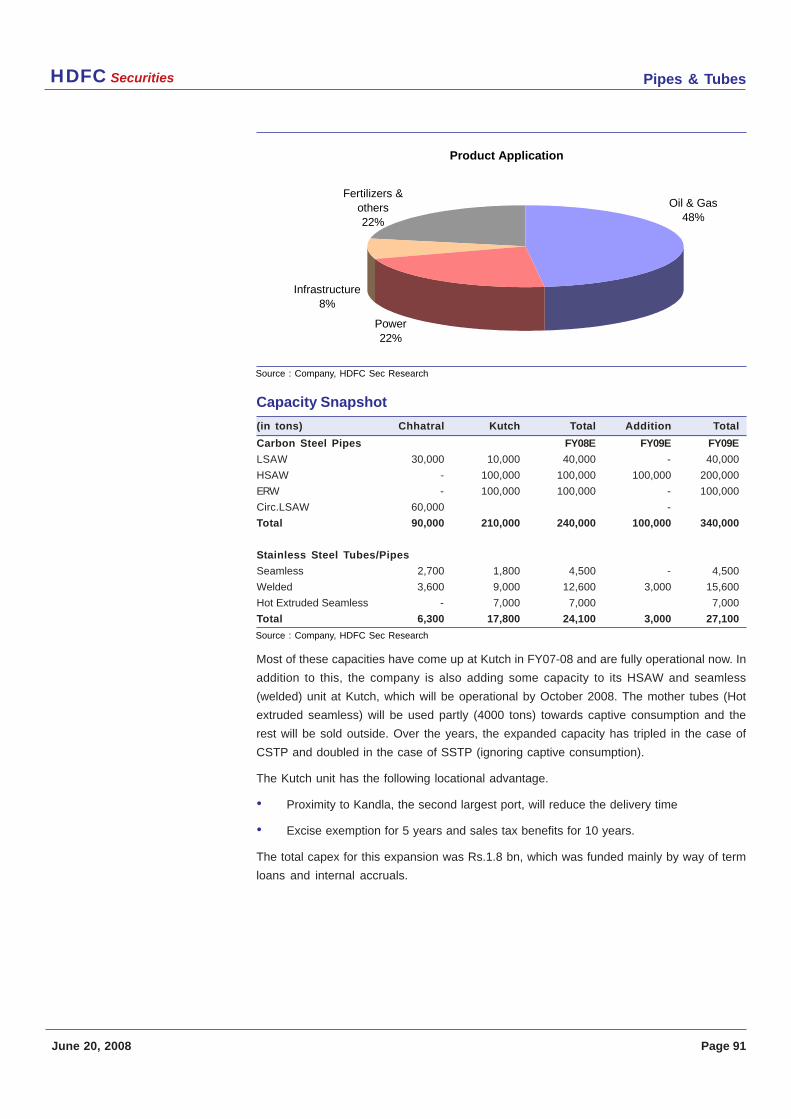
Pipes & TubesHDFC Securities
June 20, 2008 Page 91
Capacity Snapshot
(in tons) Chhatral Kutch Total Addition Total
Carbon Steel Pipes FY08E FY09E FY09E
LSAW 30,000 10,000 40,000 - 40,000
HSAW - 100,000 100,000 100,000 200,000
ERW - 100,000 100,000 - 100,000
Circ.LSAW 60,000 -
Total 90,000 210,000 240,000 100,000 340,000
Stainless Steel Tubes/Pipes
Seamless 2,700 1,800 4,500 - 4,500
Welded 3,600 9,000 12,600 3,000 15,600
Hot Extruded Seamless - 7,000 7,000 7,000
Total 6,300 17,800 24,100 3,000 27,100
Most of these capacities have come up at Kutch in FY07-08 and are fully operational now. In
addition to this, the company is also adding some capacity to its HSAW and seamless
(welded) unit at Kutch, which will be operational by October 2008. The mother tubes (Hot
extruded seamless) will be used partly (4000 tons) towards captive consumption and the
rest will be sold outside. Over the years, the expanded capacity has tripled in the case of
CSTP and doubled in the case of SSTP (ignoring captive consumption).
The Kutch unit has the following locational advantage.
• Proximity to Kandla, the second largest port, will reduce the delivery time
• Excise exemption for 5 years and sales tax benefits for 10 years.
The total capex for this expansion was Rs.1.8 bn, which was funded mainly by way of term
loans and internal accruals.
Product Application
Power22%
Infrastructure8%
Oil & Gas48%
Fertilizers & others22%
Source : Company, HDFC Sec Research
Source : Company, HDFC Sec Research
Pipes & TubesHDFC Securities
June 20, 2008 Page 92
In the domestic market, the company has a dominant position in the segments of its operations
and has the leadership status with all the major refinery and petrochemical companies.
Some of its major domestic clients include BHEL, L&T, RPL, IOC, HPCL, BPCL and GAIL etc.
The company will benefit from the proposed refineries being added both in the domestic and
international markets and also from the huge investments being incurred by power and
engineering industries.
Details of refineries being added
Company Addition (MMTPA)
IOC
Panipat 6
Paradeep 9
BPCL
Mumbai 5.1
Bina 6
HPCL
Vizag 1
Bhatinda 9
MRPL 12.4
RPL 32
Essar Oil 12
Source: Industry, HDFC Sec Estimates
USA
Toyota Tsusho Inc.
Silbo Induatries Inc.
Okaya & Co.
DOW Chemicals
Europe
Kube Stahl, Germany
TW Metals, UK
Amari Metals B.V, Netherlands
Asia
Korea Heat Exchanger, Korea
Toshiba Corporation, Japan
Petronas, Malaysia
Middle East
Belleli Saudi Heavy Inds, Saudi Arabia
Kuwait national Petroleum Co, Kuwait
Qatar Gas, Qatar
Delta Sugar Company, Egypt
Sugar and Integrated Inds Co, Egypt
Razi Petroleum, Iran
Saudi Aramco, Saudi Arabia
Equate Chemicals, Kuwait
Huge demand coming up from user segments
RMTL is on the approved vendor list of all hydrocarbon majors for supply of SSTPs and
CSTPs. It supplies these pipes and tubes for direct (Oil majors, water sewage boards) or
indirect (EPC contractors) usage for oil and gas, engineering and water related sectors.
Some of its major clients in the international markets include.
Source : Company, HDFC Sec Research
Pipes & TubesHDFC Securities
June 20, 2008 Page 93
Healthy order book position
The company currently has an outstanding order book position of Rs. 5.32 bn, which it has
had since Q3FY08. The orders will be executed over a period of three to four months and will
convert into sales by Q2FY09E. Moreover, the company has put in bids for orders of more
than Rs. 7 bn and is very optimistic in securing them.
Details of orders Amount (Rs.bn)
Stainless Steel Tubes and Pipes 3.77
Carbon Steel Tubes and Pipes 1.55
Total 5.32
Out of which
RPL (Treated as exports) 1.46
Direct Exports 1.32
Net Domestic 2.54
Total 5.320
Source: RMMTL
The company is expecting a huge contribution from the power sector going forward to its
overall order book position. We believe that going forward power will account for more than
20% to its overall product mix from marginal contribution now.
Significant operating leverage
We except RMTL to expand its capacity utilization level significantly in FY09E and FY10E. The
company that was constrained with low capacity in the past, has now added significant
capacity at the right time to capitalize on the increasing demand from user segments.
(in tons) FY07 FY08E FY09E FY10E
SSTP
Capacity 18,900 18,900 21,360 24,000
Sales 7,358 10,600 15,000 20,250
CSTP
Capacity 3,00,000 3,00,000 4,00,000 4,00,000
Sales 61,525 70,000 1,25,000 1,75,000
Source: HDFC Sec Estimates
Sustainable margins in the long run
The company has added capacity to manufacture mother tubes at its Kutch unit, which was
imported earlier from Korea, China, Japan etc. The capacity addition is of 7000 tons, out of
which around 4000 tons will be used towards in-house consumption and the balance will be
sold outside. The company will save on conversion margins due to this initiative (from billets
to mother tubes). This will add directly to its bottom line and save around Rs. 80-100 mn per
annum on raw material cost in FY09E. We expect that this savings in raw material costs will
compensate for the loss in margins on account of incremental contribution coming from low
margin carbon steel business.
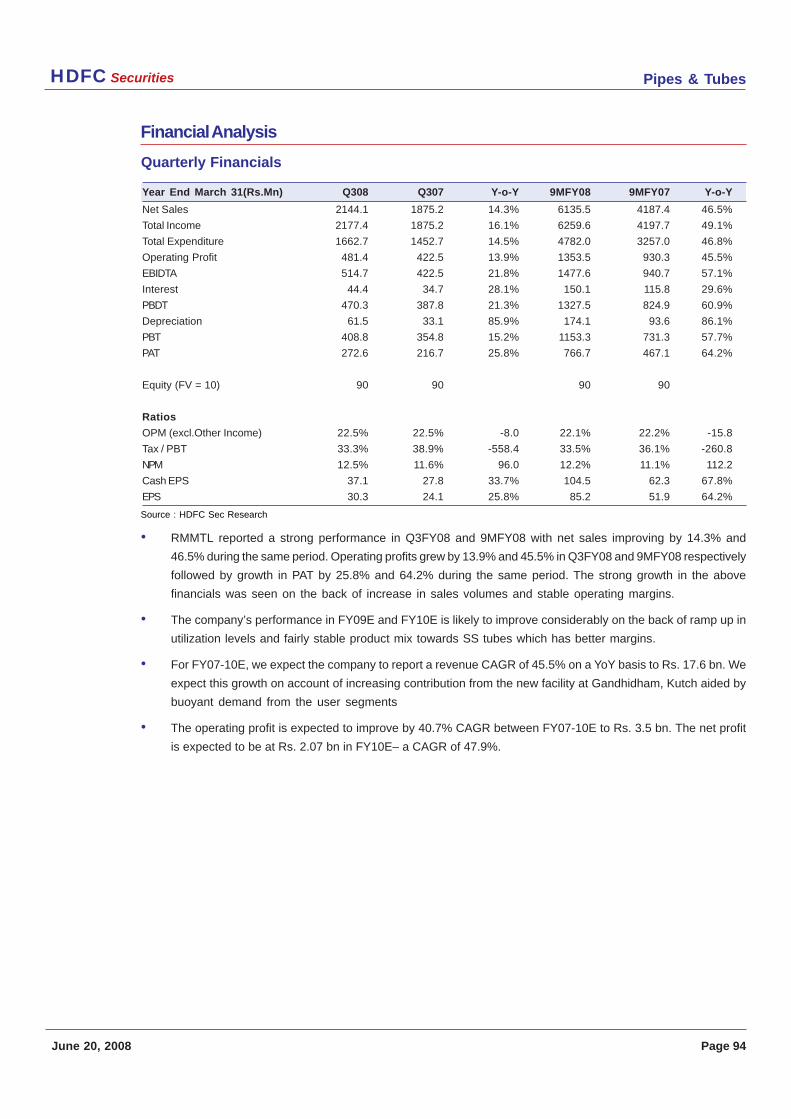
Pipes & TubesHDFC Securities
June 20, 2008 Page 94
Financial Analysis
Quarterly Financials
Year End March 31(Rs.Mn) Q308 Q307 Y-o-Y 9MFY08 9MFY07 Y-o-Y
Net Sales 2144.1 1875.2 14.3% 6135.5 4187.4 46.5%
Total Income 2177.4 1875.2 16.1% 6259.6 4197.7 49.1%
Total Expenditure 1662.7 1452.7 14.5% 4782.0 3257.0 46.8%
Operating Profit 481.4 422.5 13.9% 1353.5 930.3 45.5%
EBIDTA 514.7 422.5 21.8% 1477.6 940.7 57.1%
Interest 44.4 34.7 28.1% 150.1 115.8 29.6%
PBDT 470.3 387.8 21.3% 1327.5 824.9 60.9%
Depreciation 61.5 33.1 85.9% 174.1 93.6 86.1%
PBT 408.8 354.8 15.2% 1153.3 731.3 57.7%
PAT 272.6 216.7 25.8% 766.7 467.1 64.2%
Equity (FV = 10) 90 90 90 90
Ratios
OPM (excl.Other Income) 22.5% 22.5% -8.0 22.1% 22.2% -15.8
Tax / PBT 33.3% 38.9% -558.4 33.5% 36.1% -260.8
NPM 12.5% 11.6% 96.0 12.2% 11.1% 112.2
Cash EPS 37.1 27.8 33.7% 104.5 62.3 67.8%
EPS 30.3 24.1 25.8% 85.2 51.9 64.2%
• RMMTL reported a strong performance in Q3FY08 and 9MFY08 with net sales improving by 14.3% and
46.5% during the same period. Operating profits grew by 13.9% and 45.5% in Q3FY08 and 9MFY08 respectively
followed by growth in PAT by 25.8% and 64.2% during the same period. The strong growth in the above
financials was seen on the back of increase in sales volumes and stable operating margins.
• The company’s performance in FY09E and FY10E is likely to improve considerably on the back of ramp up in
utilization levels and fairly stable product mix towards SS tubes which has better margins.
• For FY07-10E, we expect the company to report a revenue CAGR of 45.5% on a YoY basis to Rs. 17.6 bn. We
expect this growth on account of increasing contribution from the new facility at Gandhidham, Kutch aided by
buoyant demand from the user segments
• The operating profit is expected to improve by 40.7% CAGR between FY07-10E to Rs. 3.5 bn. The net profit
is expected to be at Rs. 2.07 bn in FY10E– a CAGR of 47.9%.
Source : HDFC Sec Research
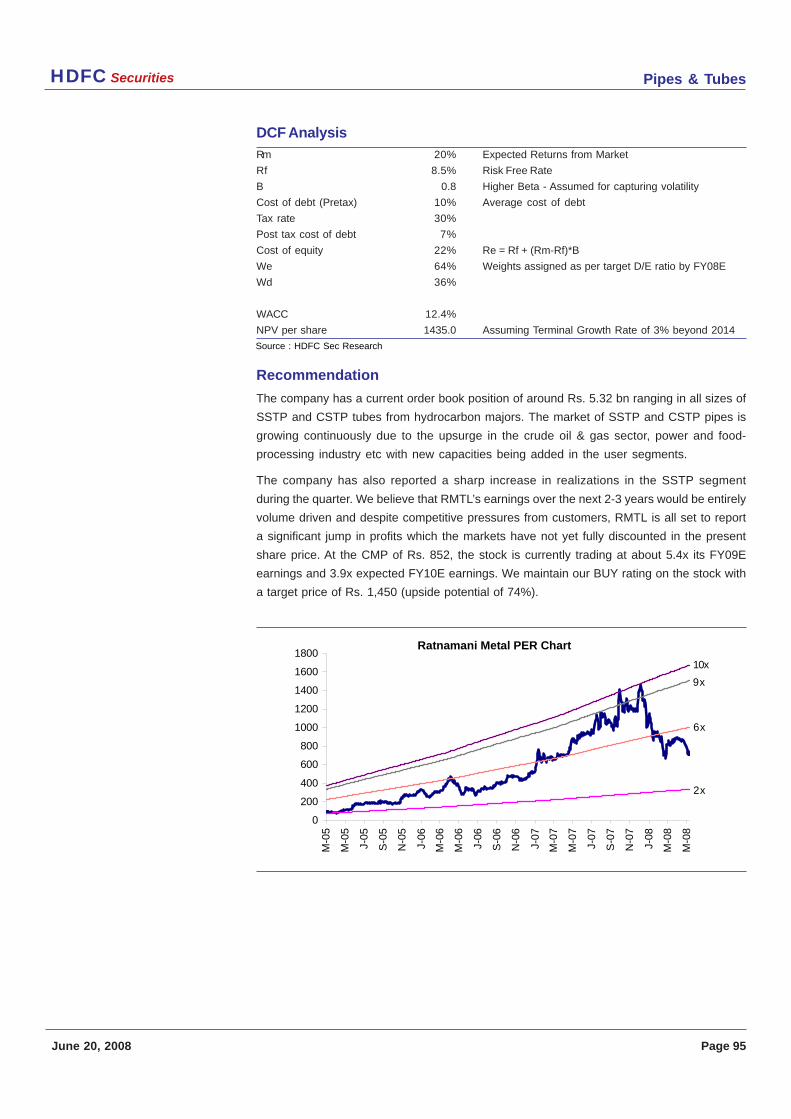
Pipes & TubesHDFC Securities
June 20, 2008 Page 95
DCF Analysis
Rm 20% Expected Returns from Market
Rf 8.5% Risk Free Rate
B 0.8 Higher Beta - Assumed for capturing volatility
Cost of debt (Pretax) 10% Average cost of debt
Tax rate 30%
Post tax cost of debt 7%
Cost of equity 22% Re = Rf + (Rm-Rf)*B
We 64% Weights assigned as per target D/E ratio by FY08E
Wd 36%
WACC 12.4%
NPV per share 1435.0 Assuming Terminal Growth Rate of 3% beyond 2014
Recommendation
The company has a current order book position of around Rs. 5.32 bn ranging in all sizes of
SSTP and CSTP tubes from hydrocarbon majors. The market of SSTP and CSTP pipes is
growing continuously due to the upsurge in the crude oil & gas sector, power and food-
processing industry etc with new capacities being added in the user segments.
The company has also reported a sharp increase in realizations in the SSTP segment
during the quarter. We believe that RMTL’s earnings over the next 2-3 years would be entirely
volume driven and despite competitive pressures from customers, RMTL is all set to report
a significant jump in profits which the markets have not yet fully discounted in the present
share price. At the CMP of Rs. 852, the stock is currently trading at about 5.4x its FY09E
earnings and 3.9x expected FY10E earnings. We maintain our BUY rating on the stock with
a target price of Rs. 1,450 (upside potential of 74%).
Ratnamani Metal PER Chart
0
200
400
600
800
1000
1200
1400
1600
1800
M-0
5
M-0
5
J-05
S-0
5
N-0
5
J-06
M-0
6
M-0
6
J-06
S-0
6
N-0
6
J-07
M-0
7
M-0
7
J-07
S-0
7
N-0
7
J-08
M-0
8
M-0
8
2x
6x
9x
10x
Source : HDFC Sec Research
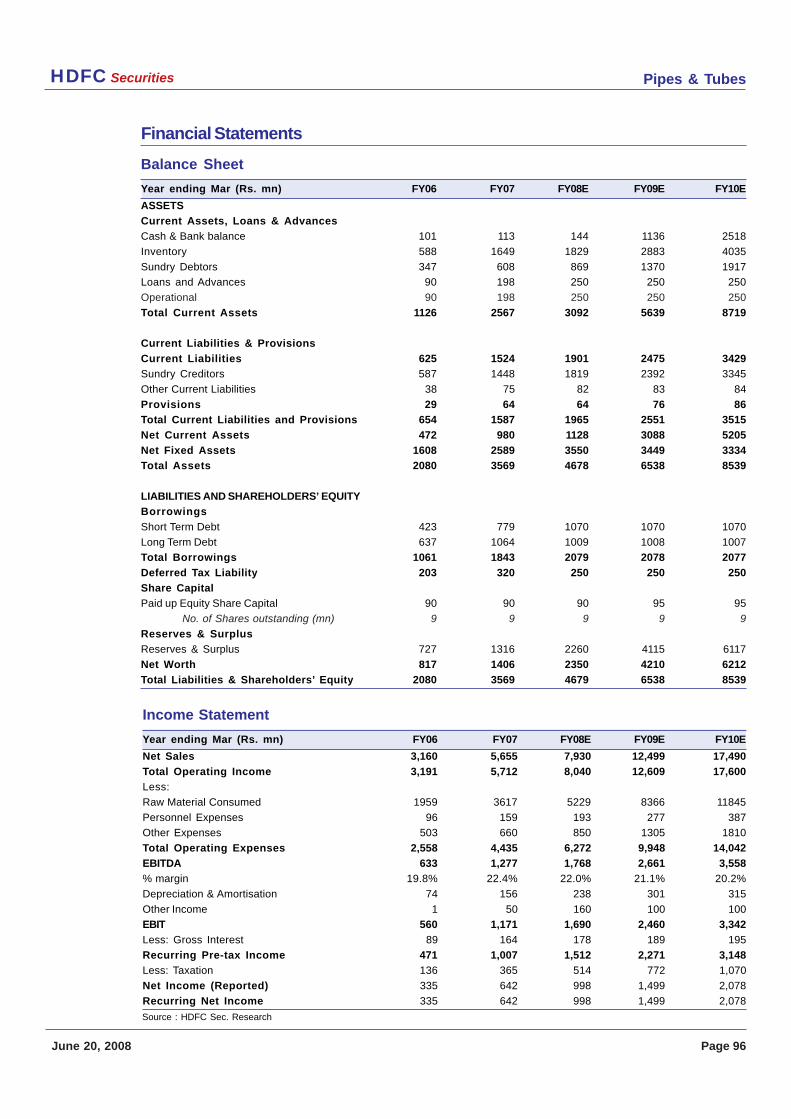
Pipes & TubesHDFC Securities
June 20, 2008 Page 96
Balance Sheet
Year ending Mar (Rs. mn) FY06 FY07 FY08E FY09E FY10E
ASSETS
Current Assets, Loans & Advances
Cash & Bank balance 101 113 144 1136 2518
Inventory 588 1649 1829 2883 4035
Sundry Debtors 347 608 869 1370 1917
Loans and Advances 90 198 250 250 250
Operational 90 198 250 250 250
Total Current Assets 1126 2567 3092 5639 8719
Current Liabilities & Provisions
Current Liabilities 625 1524 1901 2475 3429
Sundry Creditors 587 1448 1819 2392 3345
Other Current Liabilities 38 75 82 83 84
Provisions 29 64 64 76 86
Total Current Liabilities and Provisions 654 1587 1965 2551 3515
Net Current Assets 472 980 1128 3088 5205
Net Fixed Assets 1608 2589 3550 3449 3334
Total Assets 2080 3569 4678 6538 8539
LIABILITIES AND SHAREHOLDERS’ EQUITY
Borrowings
Short Term Debt 423 779 1070 1070 1070
Long Term Debt 637 1064 1009 1008 1007
Total Borrowings 1061 1843 2079 2078 2077
Deferred Tax Liability 203 320 250 250 250
Share Capital
Paid up Equity Share Capital 90 90 90 95 95
No. of Shares outstanding (mn) 9 9 9 9 9
Reserves & Surplus
Reserves & Surplus 727 1316 2260 4115 6117
Net Worth 817 1406 2350 4210 6212
Total Liabilities & Shareholders’ Equity 2080 3569 4679 6538 8539
Financial Statements
Source : HDFC Sec. Research
Income Statement
Year ending Mar (Rs. mn) FY06 FY07 FY08E FY09E FY10E
Net Sales 3,160 5,655 7,930 12,499 17,490
Total Operating Income 3,191 5,712 8,040 12,609 17,600
Less:
Raw Material Consumed 1959 3617 5229 8366 11845
Personnel Expenses 96 159 193 277 387
Other Expenses 503 660 850 1305 1810
Total Operating Expenses 2,558 4,435 6,272 9,948 14,042
EBITDA 633 1,277 1,768 2,661 3,558
% margin 19.8% 22.4% 22.0% 21.1% 20.2%
Depreciation & Amortisation 74 156 238 301 315
Other Income 1 50 160 100 100
EBIT 560 1,171 1,690 2,460 3,342
Less: Gross Interest 89 164 178 189 195
Recurring Pre-tax Income 471 1,007 1,512 2,271 3,148
Less: Taxation 136 365 514 772 1,070
Net Income (Reported) 335 642 998 1,499 2,078
Recurring Net Income 335 642 998 1,499 2,078
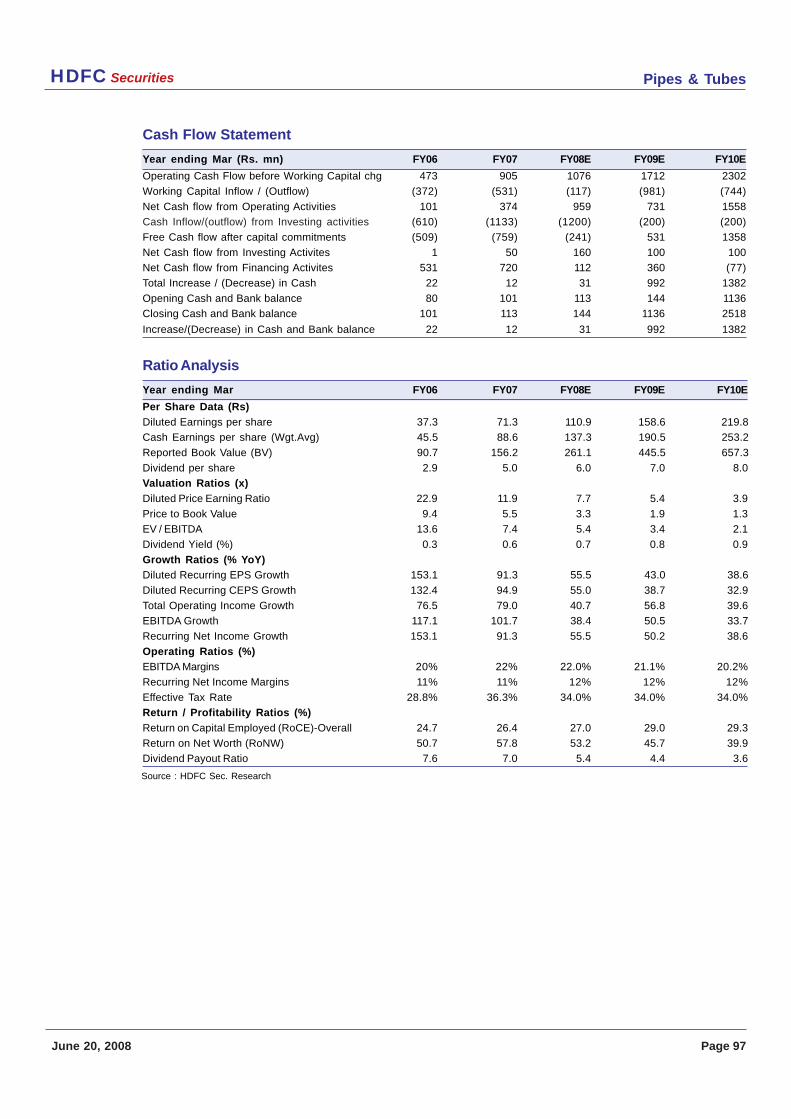
Pipes & TubesHDFC Securities
June 20, 2008 Page 97
Cash Flow Statement
Year ending Mar (Rs. mn) FY06 FY07 FY08E FY09E FY10E
Operating Cash Flow before Working Capital chg 473 905 1076 1712 2302
Working Capital Inflow / (Outflow) (372) (531) (117) (981) (744)
Net Cash flow from Operating Activities 101 374 959 731 1558
Cash Inflow/(outflow) from Investing activities (610) (1133) (1200) (200) (200)
Free Cash flow after capital commitments (509) (759) (241) 531 1358
Net Cash flow from Investing Activites 1 50 160 100 100
Net Cash flow from Financing Activites 531 720 112 360 (77)
Total Increase / (Decrease) in Cash 22 12 31 992 1382
Opening Cash and Bank balance 80 101 113 144 1136
Closing Cash and Bank balance 101 113 144 1136 2518
Increase/(Decrease) in Cash and Bank balance 22 12 31 992 1382
Ratio Analysis
Year ending Mar FY06 FY07 FY08E FY09E FY10E
Per Share Data (Rs)
Diluted Earnings per share 37.3 71.3 110.9 158.6 219.8
Cash Earnings per share (Wgt.Avg) 45.5 88.6 137.3 190.5 253.2
Reported Book Value (BV) 90.7 156.2 261.1 445.5 657.3
Dividend per share 2.9 5.0 6.0 7.0 8.0
Valuation Ratios (x)
Diluted Price Earning Ratio 22.9 11.9 7.7 5.4 3.9
Price to Book Value 9.4 5.5 3.3 1.9 1.3
EV / EBITDA 13.6 7.4 5.4 3.4 2.1
Dividend Yield (%) 0.3 0.6 0.7 0.8 0.9
Growth Ratios (% YoY)
Diluted Recurring EPS Growth 153.1 91.3 55.5 43.0 38.6
Diluted Recurring CEPS Growth 132.4 94.9 55.0 38.7 32.9
Total Operating Income Growth 76.5 79.0 40.7 56.8 39.6
EBITDA Growth 117.1 101.7 38.4 50.5 33.7
Recurring Net Income Growth 153.1 91.3 55.5 50.2 38.6
Operating Ratios (%)
EBITDA Margins 20% 22% 22.0% 21.1% 20.2%
Recurring Net Income Margins 11% 11% 12% 12% 12%
Effective Tax Rate 28.8% 36.3% 34.0% 34.0% 34.0%
Return / Profitability Ratios (%)
Return on Capital Employed (RoCE)-Overall 24.7 26.4 27.0 29.0 29.3
Return on Net Worth (RoNW) 50.7 57.8 53.2 45.7 39.9
Dividend Payout Ratio 7.6 7.0 5.4 4.4 3.6
Source : HDFC Sec. Research
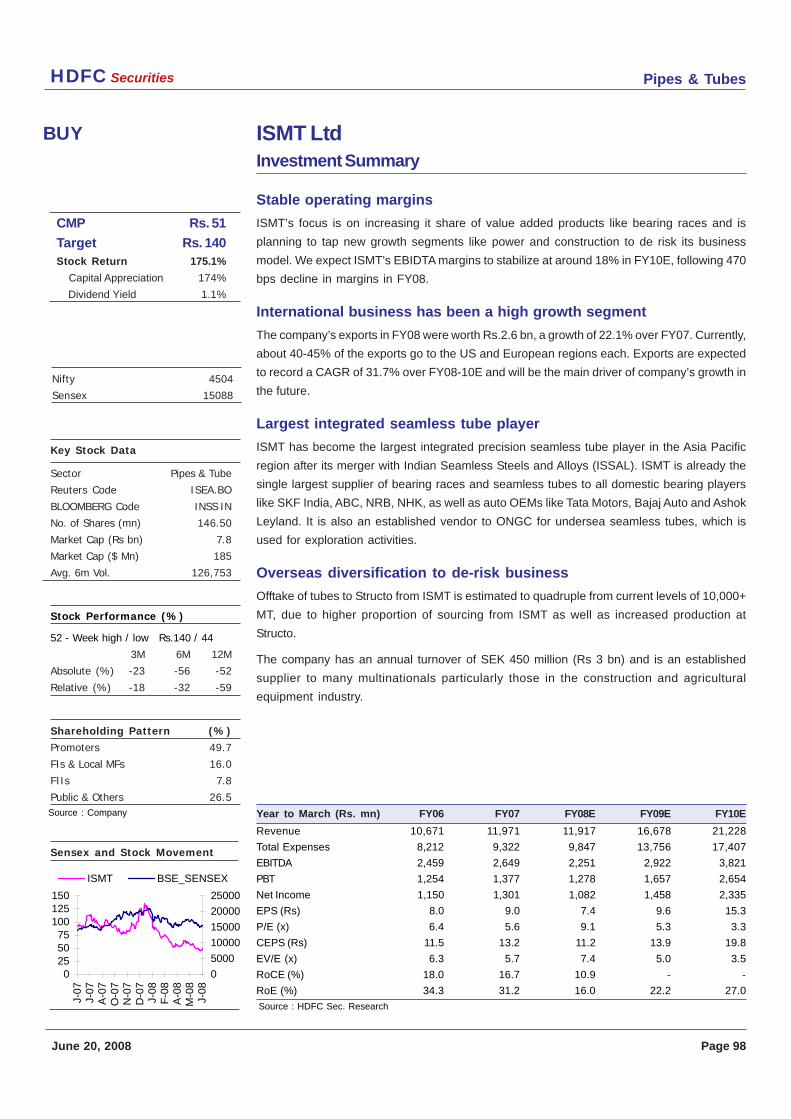
Pipes & TubesHDFC Securities
June 20, 2008 Page 98
BUY
Key Stock Data
Sector Pipes & Tube
Reuters Code ISEA.BO
BLOOMBERG Code INSS IN
No. of Shares (mn) 146.50
Market Cap (Rs bn) 7.8
Market Cap ($ Mn) 185
Avg. 6m Vol. 126,753
Stock Performance (%)
52 - Week high / low Rs.140 / 44
3M 6M 12M
Absolute (%) -23 -56 -52
Relative (%) -18 -32 -59
Shareholding Pattern (%)
Promoters 49.7
FIs & Local MFs 16.0
FIIs 7.8
Public & Others 26.5
Sensex and Stock Movement
Nifty 4504
Sensex 15088
Source : Company
CMP Rs. 51
Target Rs. 140Stock Return 175.1%
Capital Appreciation 174%
Dividend Yield 1.1%
ISMT LtdInvestment Summary
Stable operating margins
ISMT’s focus is on increasing it share of value added products like bearing races and is
planning to tap new growth segments like power and construction to de risk its business
model. We expect ISMT’s EBIDTA margins to stabilize at around 18% in FY10E, following 470
bps decline in margins in FY08.
International business has been a high growth segment
The company’s exports in FY08 were worth Rs.2.6 bn, a growth of 22.1% over FY07. Currently,
about 40-45% of the exports go to the US and European regions each. Exports are expected
to record a CAGR of 31.7% over FY08-10E and will be the main driver of company’s growth in
the future.
Largest integrated seamless tube player
ISMT has become the largest integrated precision seamless tube player in the Asia Pacific
region after its merger with Indian Seamless Steels and Alloys (ISSAL). ISMT is already the
single largest supplier of bearing races and seamless tubes to all domestic bearing players
like SKF India, ABC, NRB, NHK, as well as auto OEMs like Tata Motors, Bajaj Auto and Ashok
Leyland. It is also an established vendor to ONGC for undersea seamless tubes, which is
used for exploration activities.
Overseas diversification to de-risk business
Offtake of tubes to Structo from ISMT is estimated to quadruple from current levels of 10,000+
MT, due to higher proportion of sourcing from ISMT as well as increased production at
Structo.
The company has an annual turnover of SEK 450 million (Rs 3 bn) and is an established
supplier to many multinationals particularly those in the construction and agricultural
equipment industry.
Year to March (Rs. mn) FY06 FY07 FY08E FY09E FY10E
Revenue 10,671 11,971 11,917 16,678 21,228
Total Expenses 8,212 9,322 9,847 13,756 17,407
EBITDA 2,459 2,649 2,251 2,922 3,821
PBT 1,254 1,377 1,278 1,657 2,654
Net Income 1,150 1,301 1,082 1,458 2,335
EPS (Rs) 8.0 9.0 7.4 9.6 15.3
P/E (x) 6.4 5.6 9.1 5.3 3.3
CEPS (Rs) 11.5 13.2 11.2 13.9 19.8
EV/E (x) 6.3 5.7 7.4 5.0 3.5
RoCE (%) 18.0 16.7 10.9 - -
RoE (%) 34.3 31.2 16.0 22.2 27.0
Source : HDFC Sec. Research
0255075
100125150
J-07
J-07
A-0
7O
-07
N-0
7D
-07
J-08
F-0
8A
-08
M-0
8J-
08
0
5000
10000
15000
20000
25000
ISMT BSE_SENSEX
Pipes & TubesHDFC Securities
June 20, 2008 Page 99
Background
Indian Seamless Metal Tubes (ISMT) was promoted in 1977 by B.R.Taneja to produce
specialized seamless tubes in India. ISMT commenced production in 1980 with initial capacity
of 15,000 tons by installing and commissioning an Assel mill in technical collaboration with
Mannesman Demag Meer of Germany. Subsequently, in 1990 the production capacity was
raised to 50,000 metric tons per annum with the addition of the second Assel mill.
In 1995, ISMT promoted another company, Indian Seamless Steels and Alloys (ISSAL), to
produce alloy steel, the raw material used in the manufacture of seamless tubes, giving
ISMT better control over product quality as well as deliveries.
In April 2000, ISMT took over Kalyani Seamless Tubes (KSTL), the other major Indian
manufacturer of seamless tubes. The combined entity, emerged as not only the largest
producer of seamless tubes in India but also as one of the largest and most diversified
producers of specialized seamless tubes worldwide with - an installed capacity of 1,50,000,
metric tons of tubes per annum in the size range of 6 mm to 273 mm.
In 2005, Indian Seamless Metal Tubes Ltd and Indian Seamless Steels and Alloys were
merged and with this came into existence ISMT. Accordingly, five equity shares of ISSAL of Rs
5 each were offered in exchange for four equity shares of ISMTL having a face value of Rs 10
each. ISSAL is the main supplier of alloy steel to ISMT giving it the advantage of assured raw
material supplies throughout the year.
Business Overview
All tubes at ISMT are manufactured through the Assel Mill route. This process yields tubes of
very high dimensional accuracy and excellent concentricity, thus minimizing the requirements
of final machining. As a result, these tubes are ideal for applications such as the manufacture
of bearings, automobile parts, drill rods, hydraulic cylinders, gas cylinders, boilers, etc.
Manufacturing locations and customer profile
The company’s manufacturing units are located at three different locations in Maharashtra
the details of which are as follows.
Particulars Ahmednagar Baramati Jejuri
Background First Plant to be set up in 1980 Set up in 1996 by Kalyani, Set up in 1995
acquired by ISMT in 2000
Initial Capacity 15,000 tons N.A 1,45,000 tons
Current Capacity 65,000 tons 90,000 tons 2,50,000 tons
Product Manufactured Seamless Tubes Seamless Tubes Alloy and Bearing Steel
Size Range 6mm - 139mm 19mm - 272mm Billet sizes 32mm - 200mm
No.of equipments Two Assel Mill tube rolling Lines One piercing and one Assel mill 50 MT Electric Arc Furnace. Two
strand continuous caster and 14
stand rolling mill
User Segments High end automotive and bearing Wider range of products used in Ability to produce complex
tubes engineering, power and other metallurgies
sectors
Source: Company
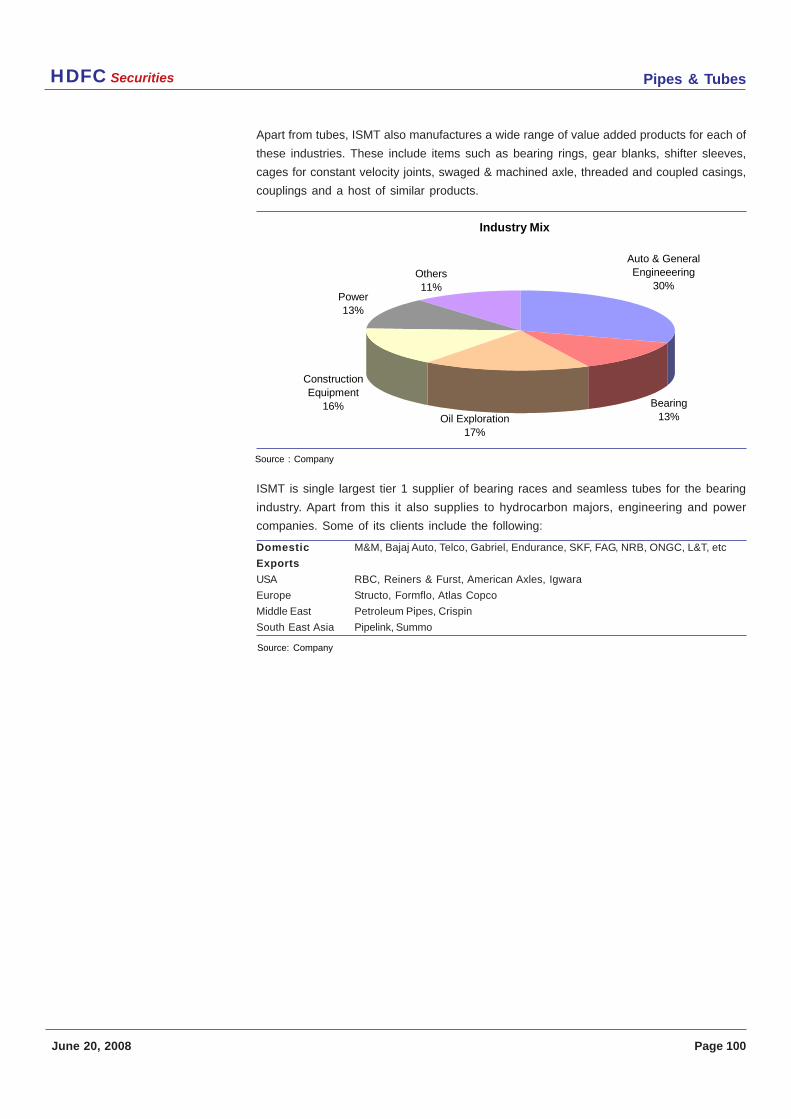
Pipes & TubesHDFC Securities
June 20, 2008 Page 100
Apart from tubes, ISMT also manufactures a wide range of value added products for each of
these industries. These include items such as bearing rings, gear blanks, shifter sleeves,
cages for constant velocity joints, swaged & machined axle, threaded and coupled casings,
couplings and a host of similar products.
ISMT is single largest tier 1 supplier of bearing races and seamless tubes for the bearing
industry. Apart from this it also supplies to hydrocarbon majors, engineering and power
companies. Some of its clients include the following:
Domestic M&M, Bajaj Auto, Telco, Gabriel, Endurance, SKF, FAG, NRB, ONGC, L&T, etc
Exports
USA RBC, Reiners & Furst, American Axles, Igwara
Europe Structo, Formflo, Atlas Copco
Middle East Petroleum Pipes, Crispin
South East Asia Pipelink, Summo
Source: Company
Industry Mix
Power13%
Construction Equipment
16%Oil Exploration
17%
Bearing13%
Auto & General Engineeering
30%Others11%
Source : Company
Pipes & TubesHDFC Securities
June 20, 2008 Page 101
Investment Summary
Merger with ISSAL to bring economies of scale
We expect that going forward the merger with ISSAL will reduce operating and other fixed
costs of the two companies. This will happen on the back of centralization of functional areas
pertaining to sales, marketing and other administrative overheads. Moreover, the yields are
likely to further improve due to increased product value addition to the overall sales mix. This
will gather momentum in FY09E and FY10E as it will enjoy benefits of a well integrated
operation right from basic input (alloy steel) to seamless tubes and other value added
products.
Sustainable operating margins
ISMT is targeting operating margins of 20% and above once the capacities for both seamless
tubes and alloy steels stabilize. The market’s buoyancy is expected to continue within higher
end value added segments like auto components, power and bearings where the company
has greater degree of pricing power.
We expect ISMT’s current EBIDTA margins of 17% and above to sustain over a longer-term
period. Margins in FY08E declined by 476 bps mainly on account of the sharp surge in raw
material prices. However in recent times, the company has taken price hikes to mitigate its
effects and current margins are likely to sustain in the near future.
Debt reduction plan to drive financial leverage
ISMT has a debt of Rs. 5.5 bn as on FY08E, which has come down by around 1.7 bn from
FY07E. The company intends to optimize this debt towards its expansion plan and is investing
Rs 2.25 bn to increase both aloy steels and seamless tubes capacity. Hence we believe that
despite its CAPEX plan, ISMT will reduce debt by Rs 1 bn over the next 2 years to Rs. 4.5 bn
in FY10E, bringing down the leverage to 0.45x in FY09E from 1x in FY08E.
Expanded capacity to drives volumes
ISMT is in the final stages of implementing its ambitious expansion plan to increase its
seamless tubes capacity from 1.55 lac tpa to 4.75 lac tpa. The company is importing the new
plant from Mannesman Demag Meer of Germany and expects the expansion to be completed
by Q2FY09, after which the benefits of the increased expansion would start flowing in.
The company is adding the desired capacity to cater significantly to the power sector (largely
imports as of now). The market size of over 100,000 MT is expected to increase 3-4 times in
the next 4-5 years. It is also the second largest segment in seamless tube industry, which is
growing at the rate of 20% per year . There is also the potential of huge replacement demand.
Strong growth in user segments
We believe that ISMT has positioned itself in very high growth sectors like oil and gas
business, engineering, bearings, auto components etc making itself a specialty tube
manufacturer. Back to back integration of its facilities would optimize benefits of value addition,
which were earlier booked in different entities. In addition to this, the company is also targeting
new segments like airbags, stabilizer bars and torsion bars for expanding its business mix.
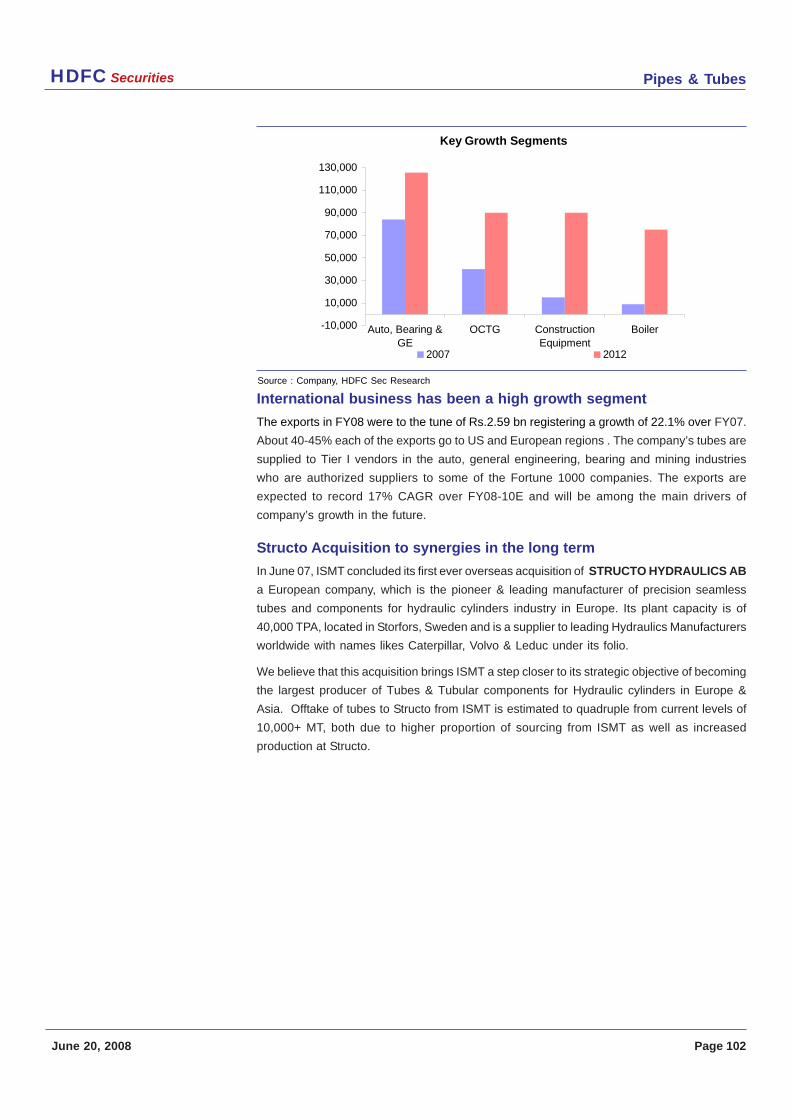
Pipes & TubesHDFC Securities
June 20, 2008 Page 102
International business has been a high growth segment
The exports in FY08 were to the tune of Rs.2.59 bn registering a growth of 22.1% over FY07.
About 40-45% each of the exports go to US and European regions . The company’s tubes are
supplied to Tier I vendors in the auto, general engineering, bearing and mining industries
who are authorized suppliers to some of the Fortune 1000 companies. The exports are
expected to record 17% CAGR over FY08-10E and will be among the main drivers of
company’s growth in the future.
Structo Acquisition to synergies in the long term
In June 07, ISMT concluded its first ever overseas acquisition of STRUCTO HYDRAULICS AB
a European company, which is the pioneer & leading manufacturer of precision seamless
tubes and components for hydraulic cylinders industry in Europe. Its plant capacity is of
40,000 TPA, located in Storfors, Sweden and is a supplier to leading Hydraulics Manufacturers
worldwide with names likes Caterpillar, Volvo & Leduc under its folio.
We believe that this acquisition brings ISMT a step closer to its strategic objective of becoming
the largest producer of Tubes & Tubular components for Hydraulic cylinders in Europe &
Asia. Offtake of tubes to Structo from ISMT is estimated to quadruple from current levels of
10,000+ MT, both due to higher proportion of sourcing from ISMT as well as increased
production at Structo.
Key Growth Segments
-10,000
10,000
30,000
50,000
70,000
90,000
110,000
130,000
Auto, Bearing &GE
OCTG ConstructionEquipment
Boiler
2007 2012
Source : Company, HDFC Sec Research
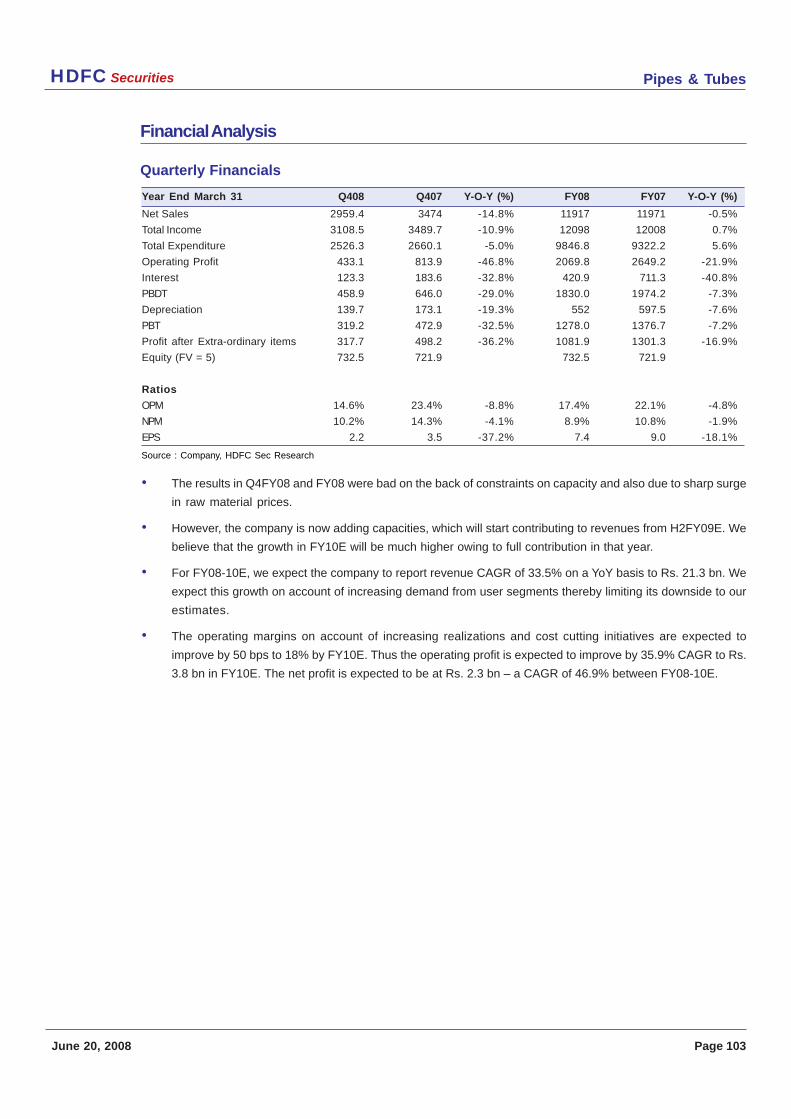
Pipes & TubesHDFC Securities
June 20, 2008 Page 103
Financial Analysis
Quarterly Financials
Year End March 31 Q408 Q407 Y-O-Y (%) FY08 FY07 Y-O-Y (%)
Net Sales 2959.4 3474 -14.8% 11917 11971 -0.5%
Total Income 3108.5 3489.7 -10.9% 12098 12008 0.7%
Total Expenditure 2526.3 2660.1 -5.0% 9846.8 9322.2 5.6%
Operating Profit 433.1 813.9 -46.8% 2069.8 2649.2 -21.9%
Interest 123.3 183.6 -32.8% 420.9 711.3 -40.8%
PBDT 458.9 646.0 -29.0% 1830.0 1974.2 -7.3%
Depreciation 139.7 173.1 -19.3% 552 597.5 -7.6%
PBT 319.2 472.9 -32.5% 1278.0 1376.7 -7.2%
Profit after Extra-ordinary items 317.7 498.2 -36.2% 1081.9 1301.3 -16.9%
Equity (FV = 5) 732.5 721.9 732.5 721.9
Ratios
OPM 14.6% 23.4% -8.8% 17.4% 22.1% -4.8%
NPM 10.2% 14.3% -4.1% 8.9% 10.8% -1.9%
EPS 2.2 3.5 -37.2% 7.4 9.0 -18.1%
• The results in Q4FY08 and FY08 were bad on the back of constraints on capacity and also due to sharp surge
in raw material prices.
• However, the company is now adding capacities, which will start contributing to revenues from H2FY09E. We
believe that the growth in FY10E will be much higher owing to full contribution in that year.
• For FY08-10E, we expect the company to report revenue CAGR of 33.5% on a YoY basis to Rs. 21.3 bn. We
expect this growth on account of increasing demand from user segments thereby limiting its downside to our
estimates.
• The operating margins on account of increasing realizations and cost cutting initiatives are expected to
improve by 50 bps to 18% by FY10E. Thus the operating profit is expected to improve by 35.9% CAGR to Rs.
3.8 bn in FY10E. The net profit is expected to be at Rs. 2.3 bn – a CAGR of 46.9% between FY08-10E.
Source : Company, HDFC Sec Research
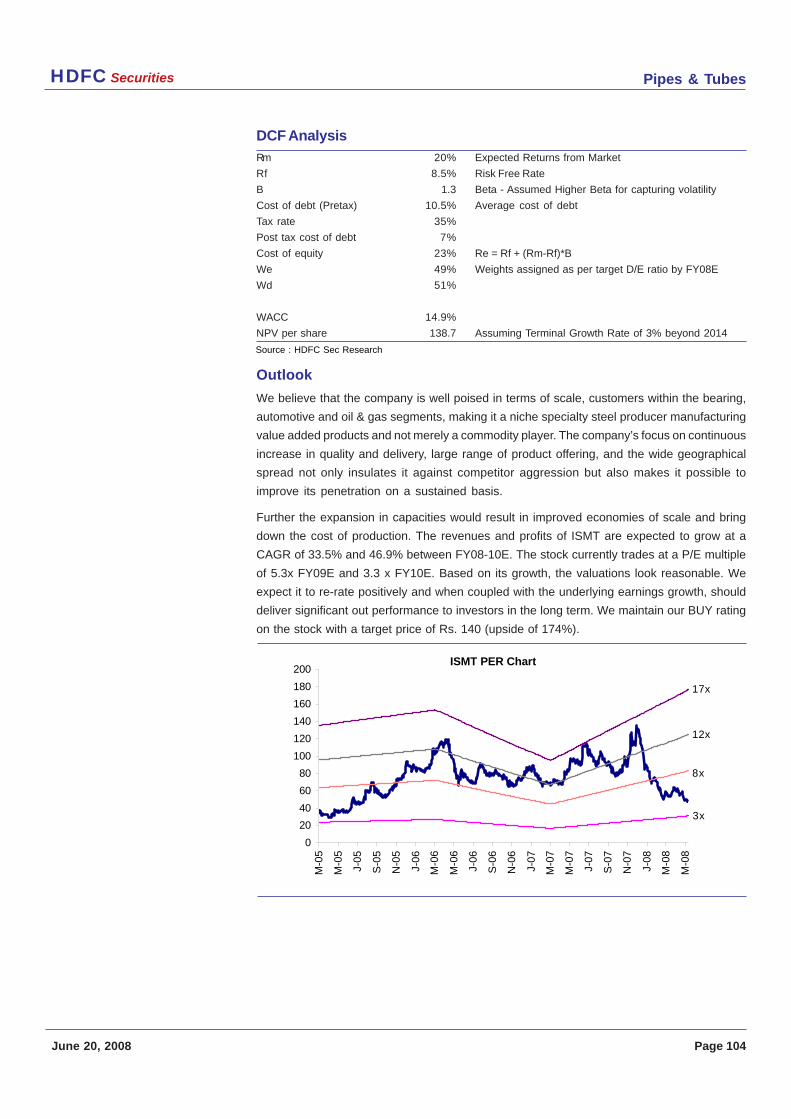
Pipes & TubesHDFC Securities
June 20, 2008 Page 104
Outlook
We believe that the company is well poised in terms of scale, customers within the bearing,
automotive and oil & gas segments, making it a niche specialty steel producer manufacturing
value added products and not merely a commodity player. The company’s focus on continuous
increase in quality and delivery, large range of product offering, and the wide geographical
spread not only insulates it against competitor aggression but also makes it possible to
improve its penetration on a sustained basis.
Further the expansion in capacities would result in improved economies of scale and bring
down the cost of production. The revenues and profits of ISMT are expected to grow at a
CAGR of 33.5% and 46.9% between FY08-10E. The stock currently trades at a P/E multiple
of 5.3x FY09E and 3.3 x FY10E. Based on its growth, the valuations look reasonable. We
expect it to re-rate positively and when coupled with the underlying earnings growth, should
deliver significant out performance to investors in the long term. We maintain our BUY rating
on the stock with a target price of Rs. 140 (upside of 174%).
DCF Analysis
Rm 20% Expected Returns from Market
Rf 8.5% Risk Free Rate
B 1.3 Beta - Assumed Higher Beta for capturing volatility
Cost of debt (Pretax) 10.5% Average cost of debt
Tax rate 35%
Post tax cost of debt 7%
Cost of equity 23% Re = Rf + (Rm-Rf)*B
We 49% Weights assigned as per target D/E ratio by FY08E
Wd 51%
WACC 14.9%
NPV per share 138.7 Assuming Terminal Growth Rate of 3% beyond 2014
ISMT PER Chart
0
20
40
60
80
100
120
140
160
180
200
M-0
5
M-0
5
J-05
S-0
5
N-0
5
J-06
M-0
6
M-0
6
J-06
S-0
6
N-0
6
J-07
M-0
7
M-0
7
J-07
S-0
7
N-0
7
J-08
M-0
8
M-0
8
3x
8x
12x
17x
Source : HDFC Sec Research
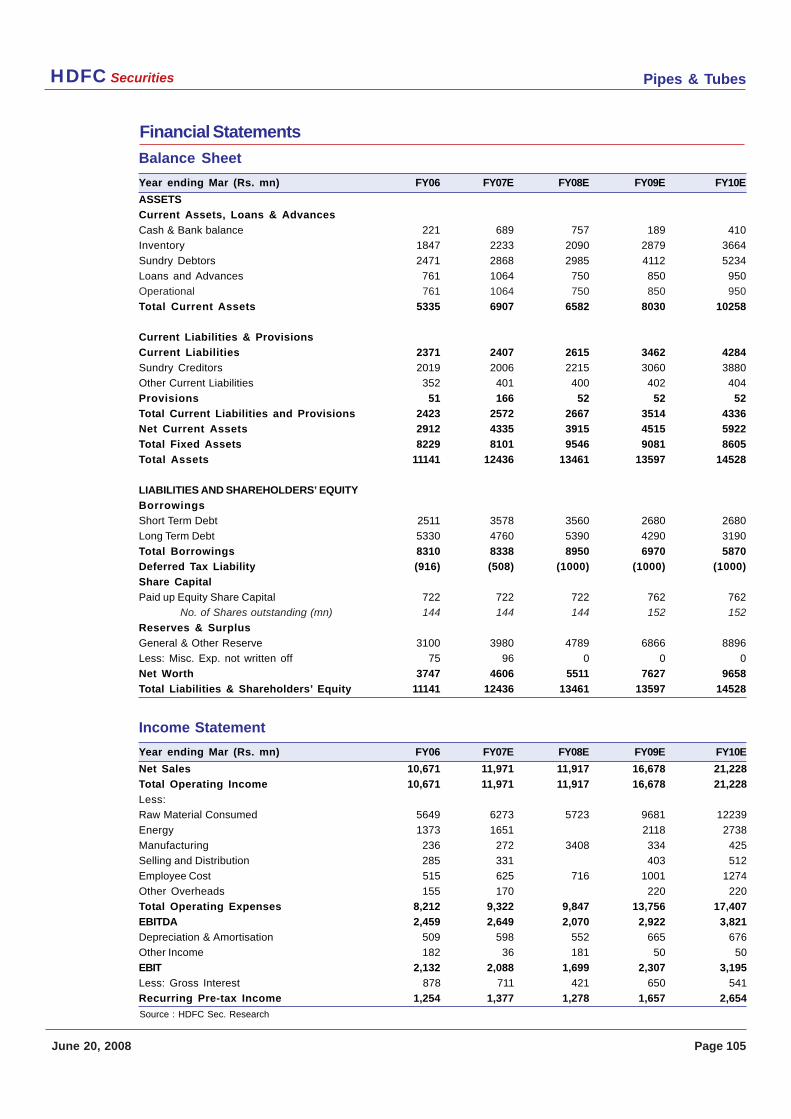
Pipes & TubesHDFC Securities
June 20, 2008 Page 105
Balance Sheet
Year ending Mar (Rs. mn) FY06 FY07E FY08E FY09E FY10E
ASSETS
Current Assets, Loans & Advances
Cash & Bank balance 221 689 757 189 410
Inventory 1847 2233 2090 2879 3664
Sundry Debtors 2471 2868 2985 4112 5234
Loans and Advances 761 1064 750 850 950
Operational 761 1064 750 850 950
Total Current Assets 5335 6907 6582 8030 10258
Current Liabilities & Provisions
Current Liabilities 2371 2407 2615 3462 4284
Sundry Creditors 2019 2006 2215 3060 3880
Other Current Liabilities 352 401 400 402 404
Provisions 51 166 52 52 52
Total Current Liabilities and Provisions 2423 2572 2667 3514 4336
Net Current Assets 2912 4335 3915 4515 5922
Total Fixed Assets 8229 8101 9546 9081 8605
Total Assets 11141 12436 13461 13597 14528
LIABILITIES AND SHAREHOLDERS’ EQUITY
Borrowings
Short Term Debt 2511 3578 3560 2680 2680
Long Term Debt 5330 4760 5390 4290 3190
Total Borrowings 8310 8338 8950 6970 5870
Deferred Tax Liability (916) (508) (1000) (1000) (1000)
Share Capital
Paid up Equity Share Capital 722 722 722 762 762
No. of Shares outstanding (mn) 144 144 144 152 152
Reserves & Surplus
General & Other Reserve 3100 3980 4789 6866 8896
Less: Misc. Exp. not written off 75 96 0 0 0
Net Worth 3747 4606 5511 7627 9658
Total Liabilities & Shareholders’ Equity 11141 12436 13461 13597 14528
Financial Statements
Income Statement
Year ending Mar (Rs. mn) FY06 FY07E FY08E FY09E FY10E
Net Sales 10,671 11,971 11,917 16,678 21,228
Total Operating Income 10,671 11,971 11,917 16,678 21,228
Less:
Raw Material Consumed 5649 6273 5723 9681 12239
Energy 1373 1651 2118 2738
Manufacturing 236 272 3408 334 425
Selling and Distribution 285 331 403 512
Employee Cost 515 625 716 1001 1274
Other Overheads 155 170 220 220
Total Operating Expenses 8,212 9,322 9,847 13,756 17,407
EBITDA 2,459 2,649 2,070 2,922 3,821
Depreciation & Amortisation 509 598 552 665 676
Other Income 182 36 181 50 50
EBIT 2,132 2,088 1,699 2,307 3,195
Less: Gross Interest 878 711 421 650 541
Recurring Pre-tax Income 1,254 1,377 1,278 1,657 2,654
Source : HDFC Sec. Research
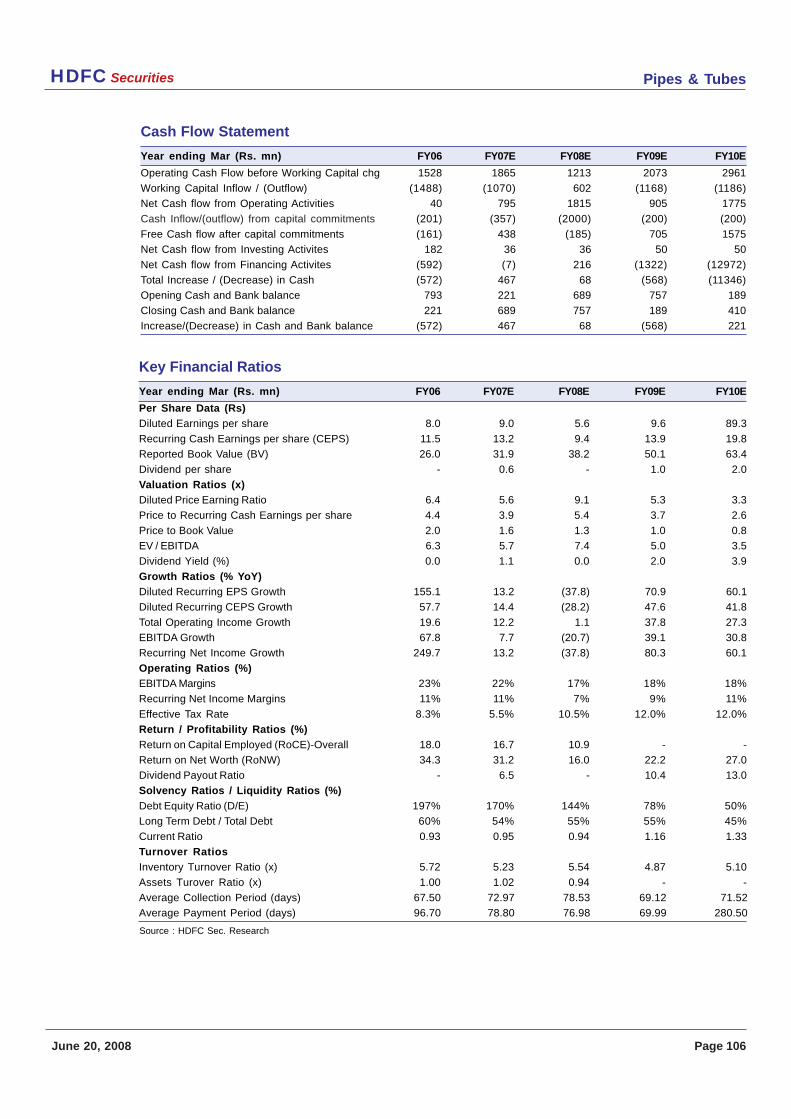
Pipes & TubesHDFC Securities
June 20, 2008 Page 106
Cash Flow Statement
Year ending Mar (Rs. mn) FY06 FY07E FY08E FY09E FY10E
Operating Cash Flow before Working Capital chg 1528 1865 1213 2073 2961
Working Capital Inflow / (Outflow) (1488) (1070) 602 (1168) (1186)
Net Cash flow from Operating Activities 40 795 1815 905 1775
Cash Inflow/(outflow) from capital commitments (201) (357) (2000) (200) (200)
Free Cash flow after capital commitments (161) 438 (185) 705 1575
Net Cash flow from Investing Activites 182 36 36 50 50
Net Cash flow from Financing Activites (592) (7) 216 (1322) (12972)
Total Increase / (Decrease) in Cash (572) 467 68 (568) (11346)
Opening Cash and Bank balance 793 221 689 757 189
Closing Cash and Bank balance 221 689 757 189 410
Increase/(Decrease) in Cash and Bank balance (572) 467 68 (568) 221
Key Financial Ratios
Year ending Mar (Rs. mn) FY06 FY07E FY08E FY09E FY10E
Per Share Data (Rs)
Diluted Earnings per share 8.0 9.0 5.6 9.6 89.3
Recurring Cash Earnings per share (CEPS) 11.5 13.2 9.4 13.9 19.8
Reported Book Value (BV) 26.0 31.9 38.2 50.1 63.4
Dividend per share - 0.6 - 1.0 2.0
Valuation Ratios (x)
Diluted Price Earning Ratio 6.4 5.6 9.1 5.3 3.3
Price to Recurring Cash Earnings per share 4.4 3.9 5.4 3.7 2.6
Price to Book Value 2.0 1.6 1.3 1.0 0.8
EV / EBITDA 6.3 5.7 7.4 5.0 3.5
Dividend Yield (%) 0.0 1.1 0.0 2.0 3.9
Growth Ratios (% YoY)
Diluted Recurring EPS Growth 155.1 13.2 (37.8) 70.9 60.1
Diluted Recurring CEPS Growth 57.7 14.4 (28.2) 47.6 41.8
Total Operating Income Growth 19.6 12.2 1.1 37.8 27.3
EBITDA Growth 67.8 7.7 (20.7) 39.1 30.8
Recurring Net Income Growth 249.7 13.2 (37.8) 80.3 60.1
Operating Ratios (%)
EBITDA Margins 23% 22% 17% 18% 18%
Recurring Net Income Margins 11% 11% 7% 9% 11%
Effective Tax Rate 8.3% 5.5% 10.5% 12.0% 12.0%
Return / Profitability Ratios (%)
Return on Capital Employed (RoCE)-Overall 18.0 16.7 10.9 - -
Return on Net Worth (RoNW) 34.3 31.2 16.0 22.2 27.0
Dividend Payout Ratio - 6.5 - 10.4 13.0
Solvency Ratios / Liquidity Ratios (%)
Debt Equity Ratio (D/E) 197% 170% 144% 78% 50%
Long Term Debt / Total Debt 60% 54% 55% 55% 45%
Current Ratio 0.93 0.95 0.94 1.16 1.33
Turnover Ratios
Inventory Turnover Ratio (x) 5.72 5.23 5.54 4.87 5.10
Assets Turover Ratio (x) 1.00 1.02 0.94 - -
Average Collection Period (days) 67.50 72.97 78.53 69.12 71.52
Average Payment Period (days) 96.70 78.80 76.98 69.99 280.50
Source : HDFC Sec. Research
Pipes & TubesHDFC Securities
June 20, 2008 Page 107
RATING SYSTEMBUY = Expected to outperform the BSE Sensex by 15% or more over a 12 months’ time frame.MO = Market Outperformer - Expected to outperform the BSE Sensex by 10% or more over a 12 months’ time frame.MP = Market Performer - Expected to be a neutral performer relative to the BSE Sensex over a 12 months’ time frame.MU = Market Underperformer - Expected to underperform the BSE Sensex by 10% or more over a 12 months’ time frame.SELL = Expected to underperform the BSE Sensex by 15% or more over a 12 months’ time frame
Disclaimer : This report has been prepared by HDFC Securities Ltd and is meant for sole use by the recipient and not for circulation. The information and opinionscontained herein have been compiled or arrived at, based upon information obtained in good faith from sources believed to be reliable. Such information has notbeen independently verified and no guaranty, representation of warranty, express or implied, is made as to its accuracy, completeness or correctness. All suchinformation and opinions are subject to change without notice. This document is for information purposes only. Descriptions of any company or companies or theirsecurities mentioned herein are not intended to be complete and this document is not, and should not be construed as an offer or solicitation of an offer, to buyor sell any securities or other financial instruments.
This report is not directed to, or intended for display, downloading, printing, reproducing or for distribution to or use by, any person or entity who is a citizen or residentor located in any locality, state, country or other jurisdiction where such distribution, publication, reproduction, availability or use would be contrary to law orregulation or what would subject HDFC Securities Ltd or its affiliates to any registration or licensing requirement within such jurisdiction.
If this report is inadvertently send or has reached any individual in such country, especially, USA, the same may be ignored and brought to the attention of thesender. This document may not be reproduced, distributed or published for any purposes with out prior written approval of HDFC Securities Ltd .
Foreign currencies denominated securities, wherever mentioned, are subject to exchange rate fluctuations, which could have an adverse effect on their value orprice, or the income derived from them. In addition, investors in securities such as ADRs, the values of which are influenced by foreign currencies effectivelyassume currency risk.
It should not be considered to be taken as an offer to sell or a solicitation to buy any security. HDFC Securities Ltd may from time to time solicit from, or performbroking, or other services for, any company mentioned in this mail and/or its attachments.
HDFC Securities Ltd, its directors, analysts or employees do not take any responsibility, financial or otherwise, of the losses or the damages sustained due to theinvestments made or any action taken on basis of this report, including but not restricted to, fluctuation in the prices of shares and bonds, changes in the currencyrates, diminution in the NAVs, reduction in the dividend or income, etc.
HDFC Securities Ltd and other group companies, its directors, associates, employees may have various positions in any of the stocks, securities and financialinstruments dealt in the report, or may make sell or purchase or other deals in these securities from time to time or may deal in other securities of the companies/ organisations described in this report.