Embed Size (px)
Citation preview
© 2013 Iron Mountain Incorporated. All rights reserved. Iron Mountain and the design of the mountain are registered trademarks of Iron Mountain Incorporated.
All other trademarks and registered trademarks are the property of their respective owners.
March 2015
Durable Fundamentals and Differentiated Business Model Deliver Enhanced Returns
2
Safe Harbor Language
Safe Harbor Statement Under the Private Securities Litigation Reform Act of 1995: This presentation contains certain forward-looking statements within the meaning of the Private Securities Litigation Reform Act of 1995 and other securities laws and is subject to the safe-harbor created by such Act. Forward-looking statements include our financial performance outlook and statements regarding our operations, economic performance, financial condition, goals, beliefs, future growth strategies, investment objectives, plans and current expectations, and the anticipated benefits of our conversion to a real estate investment trust for federal income tax purposes, including the opportunity to create value by acquiring leased space, our potential for a broadened investor base and enhanced valuations and the estimated range of our remaining special distribution and our ordinary dividends. These forward-looking statements are subject to various known and unknown risks, uncertainties and other factors. When we use words such as "believes," "expects," "anticipates," "estimates" or similar expressions, we are making forward-looking statements. You should not rely upon forward-looking statements except as statements of our present intentions and of our present expectations, which may or may not occur. Although we believe that our forward-looking statements are based on reasonable assumptions, our expected results may not be achieved, and actual results may differ materially from our expectations. Important factors that could cause actual results to differ from our other expectations include, among others: (i) our expected ordinary dividends may be materially different from our estimates; (ii) the cost to comply with current and future laws, regulations and customer demands relating to privacy issues; (iii) the impact of litigation or disputes that may arise in connection with incidents in which we fail to protect our customers' information; (iv) changes in the price for our storage and information management services relative to the cost of providing such storage and information management services; (v) changes in customer preferences and demand for our storage and information management services; (vi) the adoption of alternative technologies and shifts by our customers to storage of data through non-paper based technologies; (vii) the cost or potential liabilities associated with real estate necessary for our business; (viii) the performance of business partners upon whom we depend for technical assistance or management expertise outside the U.S.; (ix) changes in the political and economic environments in the countries in which our international subsidiaries operate; (x) claims that our technology violates the intellectual property rights of a third party; (xi) changes in the cost of our debt; (xii) the impact of alternative, more attractive investments on dividends; (xiii) our ability to qualify or remain qualified for taxation as a real estate investment trust (“REIT”); (xiv) our ability or inability to complete acquisitions on satisfactory terms and to integrate acquired companies efficiently; (xv) other trends in competitive or economic conditions affecting our financial condition or results of operations not presently contemplated; and (xvi) other risks described more fully in our filings with the Securities and Exchange Commission, including under the caption “Risk Factors” in our periodic reports, or incorporated therein. Except as required by law, we undertake no obligation to release publicly the result of any revision to these forward-looking statements that may be made to reflect events or circumstances after the date hereof or to reflect the occurrence of unanticipated events.
3
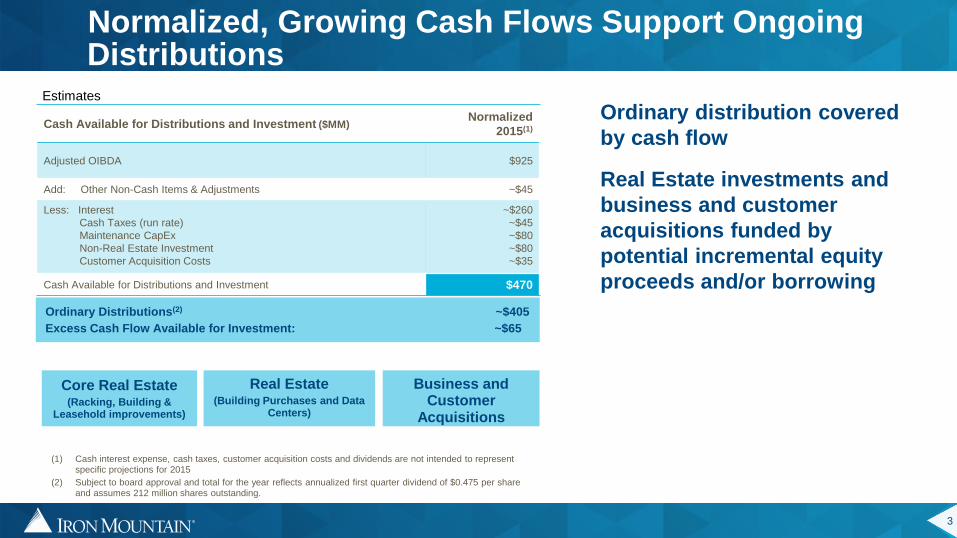
Ordinary distribution covered
by cash flow
Real Estate investments and
business and customer
acquisitions funded by
potential incremental equity
proceeds and/or borrowing
Cash Available for Distributions and Investment ($MM) Normalized
2015(1)
Adjusted OIBDA $925
Add: Other Non-Cash Items & Adjustments ~$45
Less: Interest
Cash Taxes (run rate)
Maintenance CapEx
Non-Real Estate Investment
Customer Acquisition Costs
~$260
~$45
~$80
~$80
~$35
Cash Available for Distributions and Investment $470
Normalized, Growing Cash Flows Support Ongoing Distributions
Ordinary Distributions(2) ~$405
Excess Cash Flow Available for Investment: ~$65
(1) Cash interest expense, cash taxes, customer acquisition costs and dividends are not intended to represent specific projections for 2015
(2) Subject to board approval and total for the year reflects annualized first quarter dividend of $0.475 per share and assumes 212 million shares outstanding.
Real Estate (Building Purchases and Data
Centers)
Business and Customer
Acquisitions
Core Real Estate (Racking, Building &
Leasehold improvements)
Estimates
4
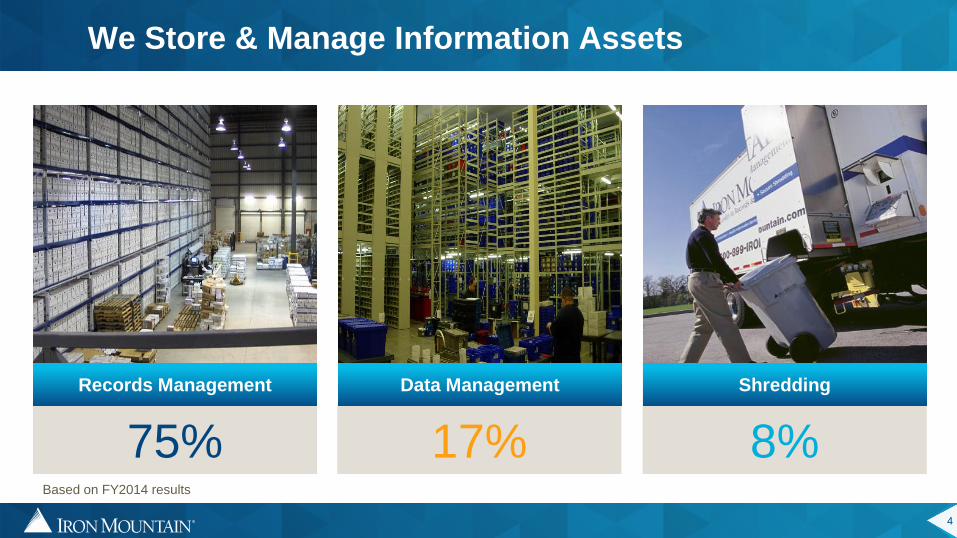
We Store & Manage Information Assets
75% 17% 8%
Records Management Data Management Shredding
Based on FY2014 results
5
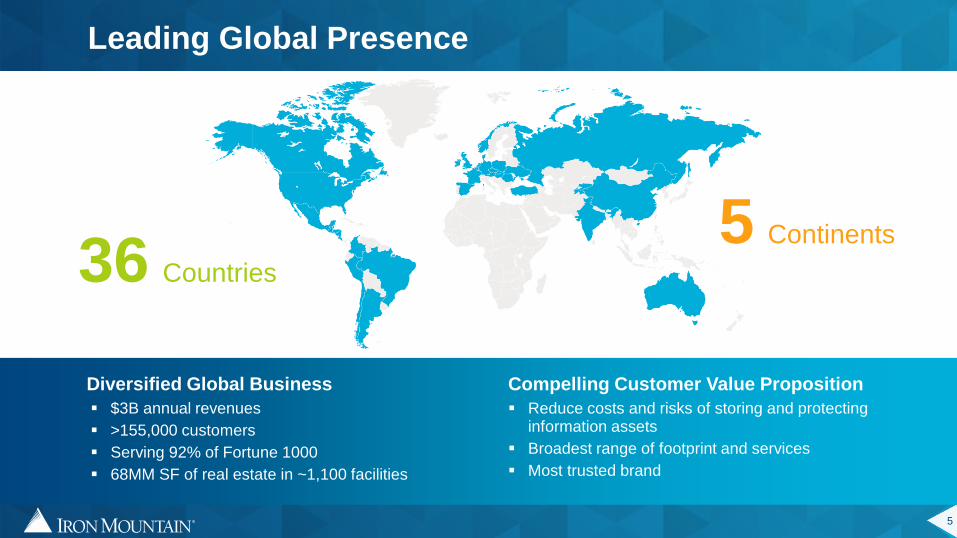
Diversified Global Business
$3B annual revenues
>155,000 customers
Serving 92% of Fortune 1000
68MM SF of real estate in ~1,100 facilities
Compelling Customer Value Proposition
Reduce costs and risks of storing and protecting information assets
Broadest range of footprint and services
Most trusted brand
Leading Global Presence
36 Countries
5 Continents
6
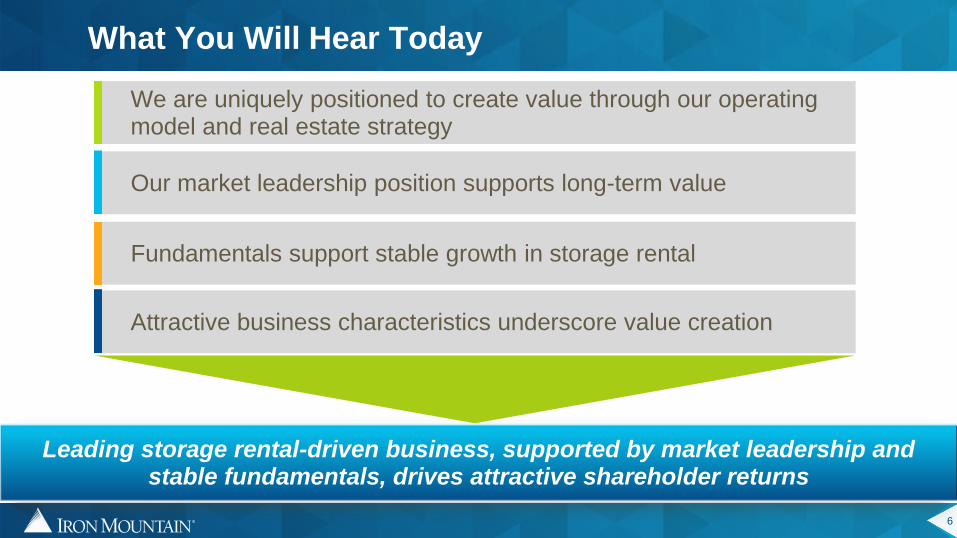
What You Will Hear Today
We are uniquely positioned to create value through our operating model and real estate strategy
Our market leadership position supports long-term value
Fundamentals support stable growth in storage rental
Leading storage rental-driven business, supported by market leadership and stable fundamentals, drives attractive shareholder returns
Attractive business characteristics underscore value creation
7
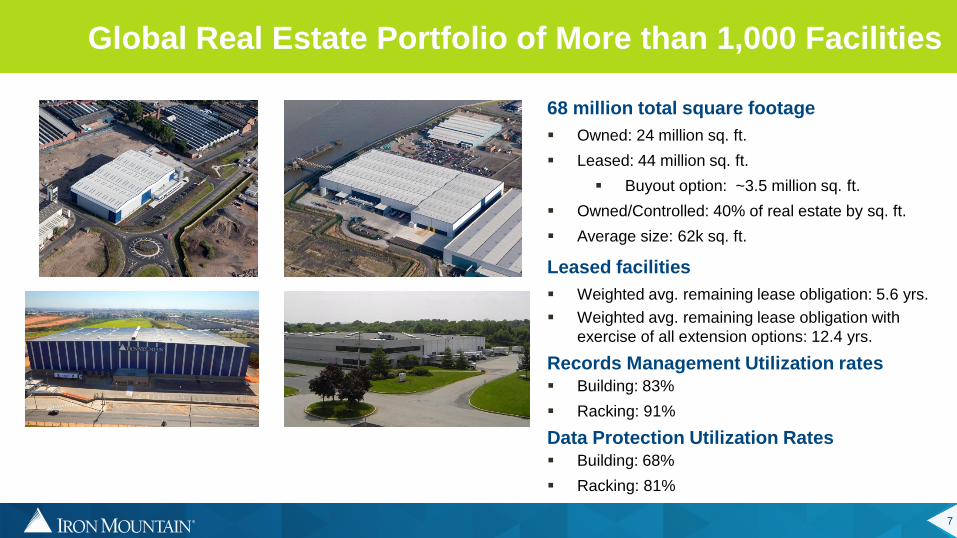
Global Real Estate Portfolio of More than 1,000 Facilities
68 million total square footage
Owned: 24 million sq. ft.
Leased: 44 million sq. ft.
Buyout option: ~3.5 million sq. ft.
Owned/Controlled: 40% of real estate by sq. ft.
Average size: 62k sq. ft.
Leased facilities
Weighted avg. remaining lease obligation: 5.6 yrs.
Weighted avg. remaining lease obligation with
exercise of all extension options: 12.4 yrs.
Records Management Utilization rates Building: 83%
Racking: 91%
Data Protection Utilization Rates
Building: 68%
Racking: 81%
8
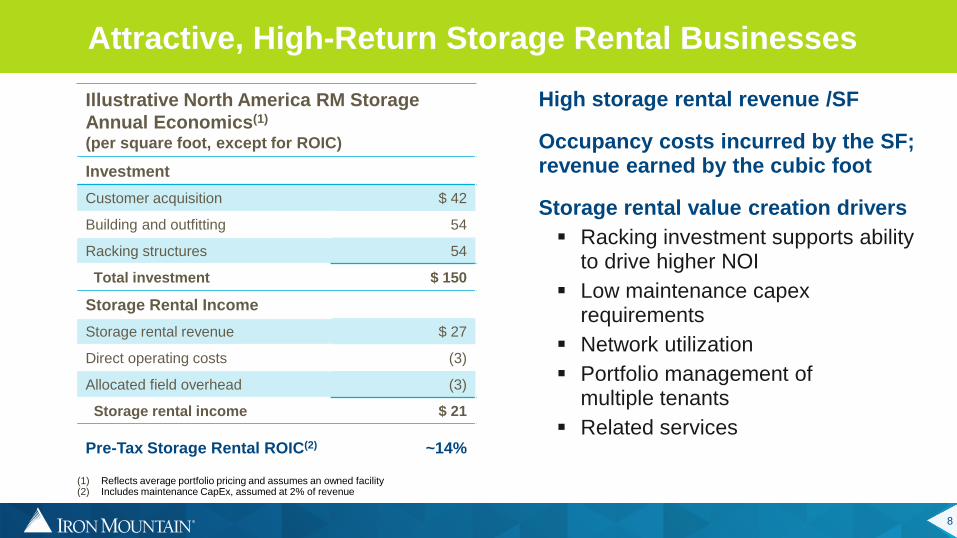
Illustrative North America RM Storage
Annual Economics(1) (per square foot, except for ROIC)
Investment
Customer acquisition $ 42
Building and outfitting 54
Racking structures 54
Total investment $ 150
Storage Rental Income
Storage rental revenue $ 27
Direct operating costs (3)
Allocated field overhead (3)
Storage rental income $ 21
Pre-Tax Storage Rental ROIC(2) ~14%
Attractive, High-Return Storage Rental Businesses
(1) Reflects average portfolio pricing and assumes an owned facility (2) Includes maintenance CapEx, assumed at 2% of revenue
High storage rental revenue /SF
Occupancy costs incurred by the SF; revenue earned by the cubic foot
Storage rental value creation drivers
Racking investment supports ability to drive higher NOI
Low maintenance capex requirements
Network utilization
Portfolio management of multiple tenants
Related services
9
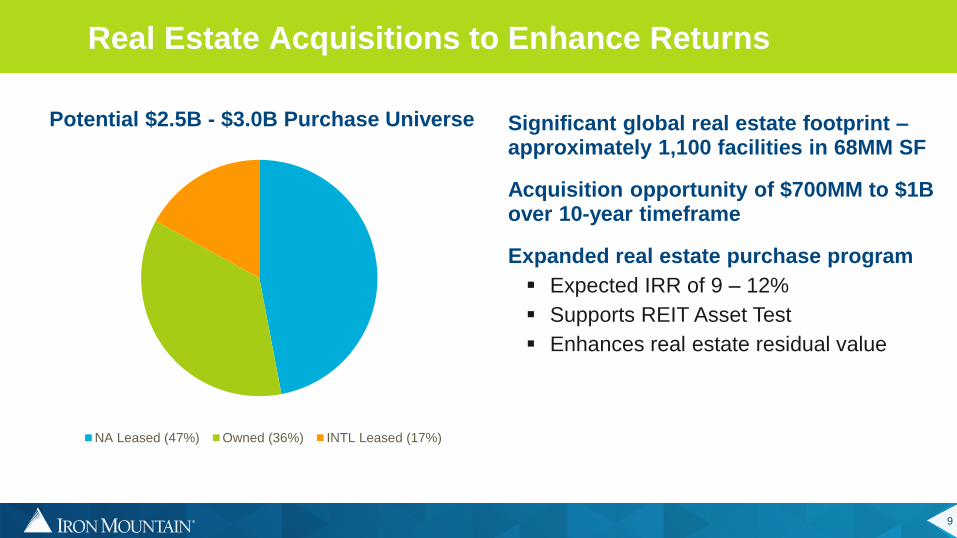
NA Leased (47%) Owned (36%) INTL Leased (17%)
Significant global real estate footprint – approximately 1,100 facilities in 68MM SF
Acquisition opportunity of $700MM to $1B over 10-year timeframe
Expanded real estate purchase program
Expected IRR of 9 – 12%
Supports REIT Asset Test
Enhances real estate residual value
Real Estate Acquisitions to Enhance Returns
Potential $2.5B - $3.0B Purchase Universe
10
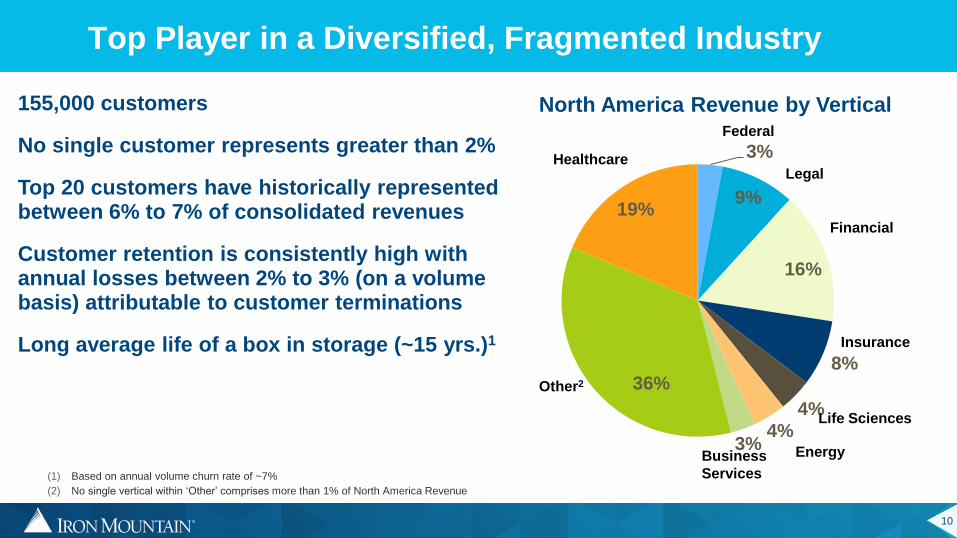
3%
9%
16%
8%
4%
4% 3%
36%
19%
North America Revenue by Vertical
Other2
Insurance
Financial
Healthcare
Federal
Legal
Energy Business
Services
Life Sciences
Top Player in a Diversified, Fragmented Industry
(1) Based on annual volume churn rate of ~7%
(2) No single vertical within ‘Other’ comprises more than 1% of North America Revenue
155,000 customers
No single customer represents greater than 2%
Top 20 customers have historically represented between 6% to 7% of consolidated revenues
Customer retention is consistently high with annual losses between 2% to 3% (on a volume basis) attributable to customer terminations
Long average life of a box in storage (~15 yrs.)1
11
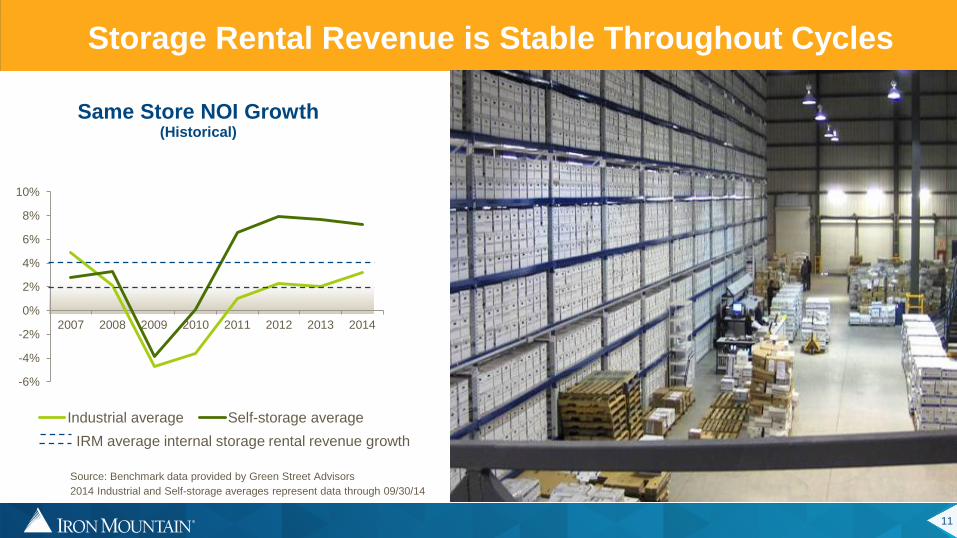
-6%
-4%
-2%
0%
2%
4%
6%
8%
10%
2007 2008 2009 2010 2011 2012 2013 2014
Same Store NOI Growth (Historical)
Industrial average Self-storage average
Storage Rental Revenue is Stable Throughout Cycles
Source: Benchmark data provided by Green Street Advisors
2014 Industrial and Self-storage averages represent data through 09/30/14
IRM average internal storage rental revenue growth
12
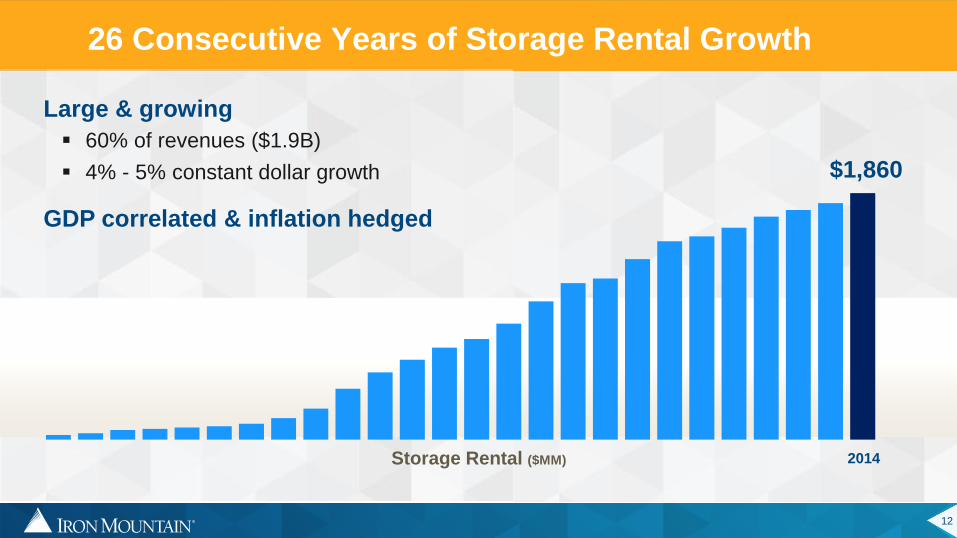
Large & growing
60% of revenues ($1.9B)
4% - 5% constant dollar growth
GDP correlated & inflation hedged
26 Consecutive Years of Storage Rental Growth
2014
$1,860
Storage Rental ($MM)
13
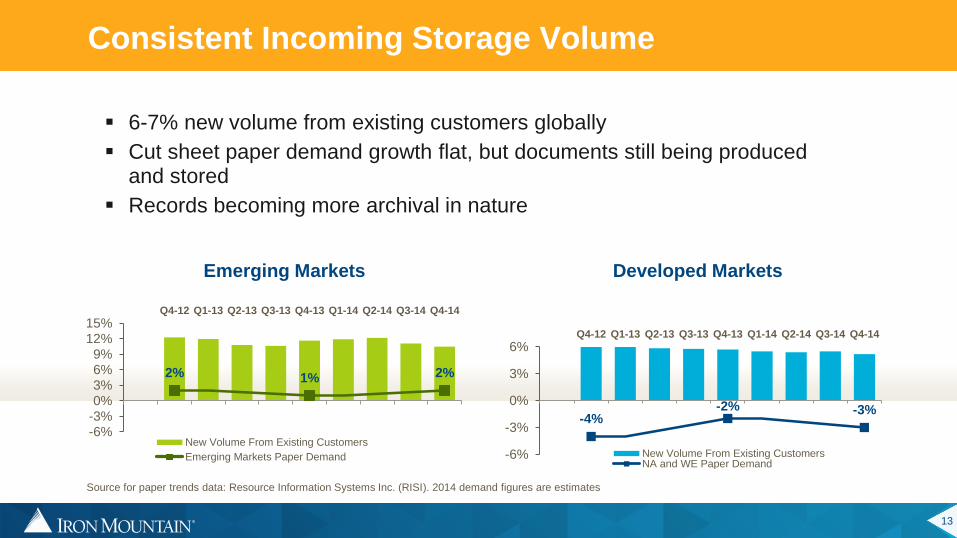
Consistent Incoming Storage Volume
6-7% new volume from existing customers globally
Cut sheet paper demand growth flat, but documents still being produced and stored
Records becoming more archival in nature
-4% -2% -3%
-6%
-3%
0%
3%
6%Q4-12 Q1-13 Q2-13 Q3-13 Q4-13 Q1-14 Q2-14 Q3-14 Q4-14
New Volume From Existing CustomersNA and WE Paper Demand
2% 1% 2%
-6%-3%0%3%6%9%
12%15%
Q4-12 Q1-13 Q2-13 Q3-13 Q4-13 Q1-14 Q2-14 Q3-14 Q4-14
New Volume From Existing Customers
Emerging Markets Paper Demand
Developed Markets Emerging Markets
Source for paper trends data: Resource Information Systems Inc. (RISI). 2014 demand figures are estimates
14
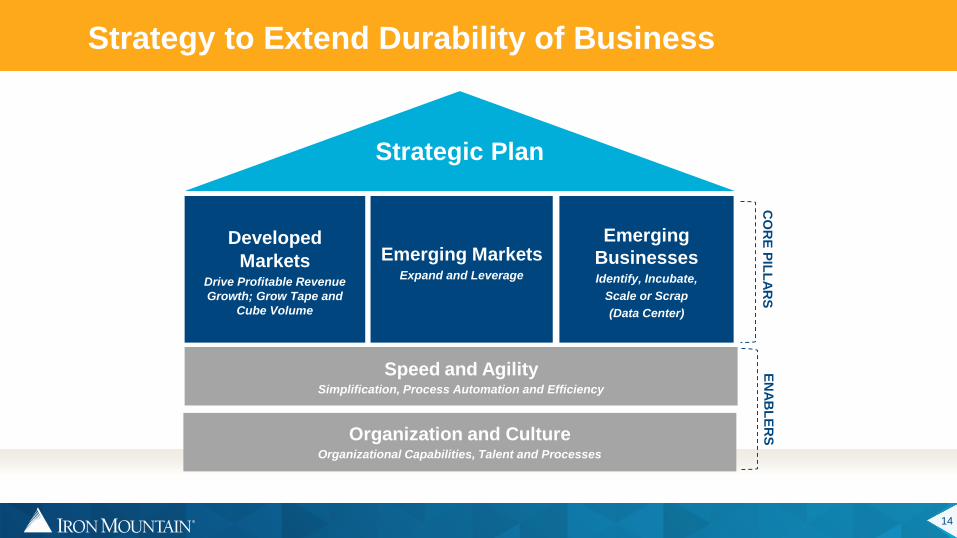
Strategy to Extend Durability of Business
Speed and Agility Simplification, Process Automation and Efficiency
Developed
Markets Drive Profitable Revenue
Growth; Grow Tape and
Cube Volume
Strategic Plan
Emerging Markets Expand and Leverage
Emerging
Businesses Identify, Incubate,
Scale or Scrap
(Data Center)
Organization and Culture Organizational Capabilities, Talent and Processes
CO
RE
PIL
LA
RS
E
NA
BL
ER
S
15
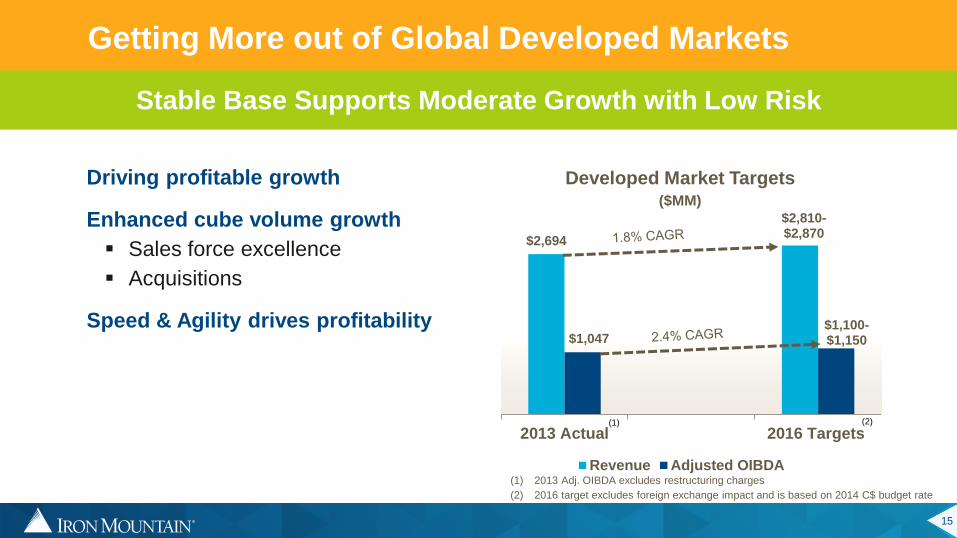
$2,694
$2,810-$2,870
$1,047 $1,100- $1,150
2013 Actual 2016 Targets
Revenue Adjusted OIBDA
Developed Market Targets ($MM)
Driving profitable growth
Enhanced cube volume growth
Sales force excellence
Acquisitions
Speed & Agility drives profitability
Getting More out of Global Developed Markets
Stable Base Supports Moderate Growth with Low Risk
(1) 2013 Adj. OIBDA excludes restructuring charges
(2) 2016 target excludes foreign exchange impact and is based on 2014 C$ budget rate
(1) (2)
16
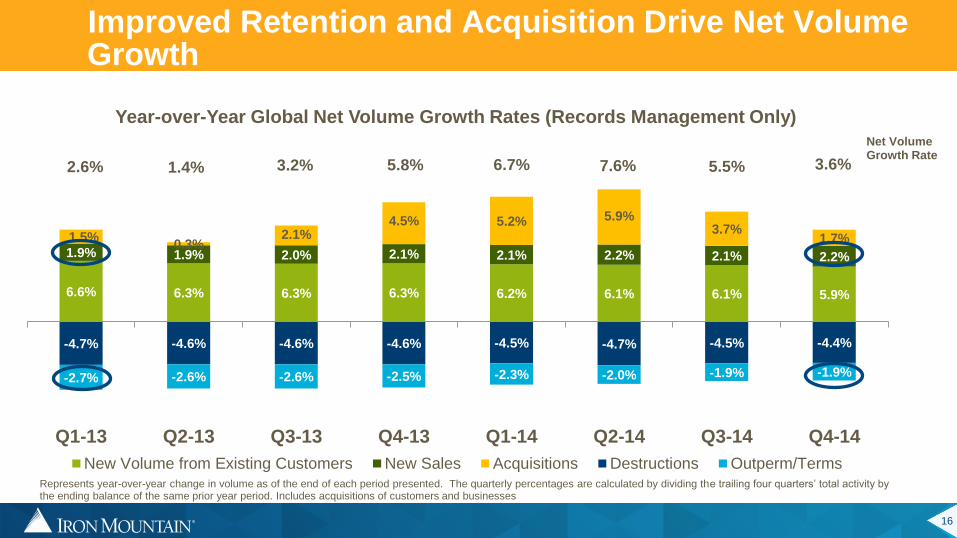
Improved Retention and Acquisition Drive Net Volume Growth
6.6% 6.3% 6.3% 6.3% 6.2% 6.1% 6.1% 5.9%
1.9% 1.9% 2.0% 2.1% 2.1% 2.2% 2.1% 2.2%
1.5% 0.3%
2.1% 4.5% 5.2% 5.9%
3.7% 1.7%
-4.7% -4.6% -4.6% -4.6% -4.5% -4.7% -4.5% -4.4%
-2.7% -2.6% -2.6% -2.5% -2.3% -2.0% -1.9% -1.9%
2.6% 1.4% 3.2% 5.8% 6.7% 7.6% 5.5% 3.6%
Q1-13 Q2-13 Q3-13 Q4-13 Q1-14 Q2-14 Q3-14 Q4-14
New Volume from Existing Customers New Sales Acquisitions Destructions Outperm/Terms
Year-over-Year Global Net Volume Growth Rates (Records Management Only)
Net Volume Growth Rate
Represents year-over-year change in volume as of the end of each period presented. The quarterly percentages are calculated by dividing the trailing four quarters’ total activity by the ending balance of the same prior year period. Includes acquisitions of customers and businesses
17
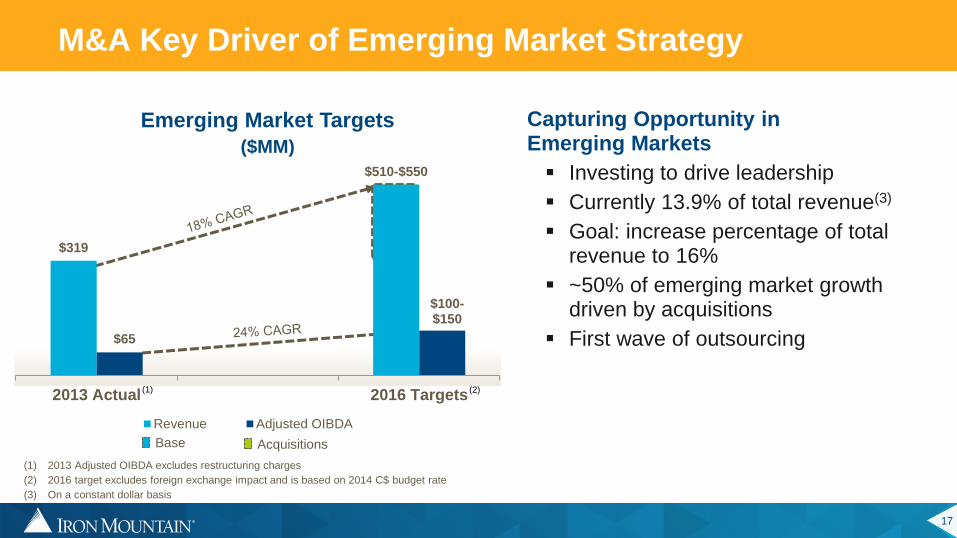
Capturing Opportunity in Emerging Markets
Investing to drive leadership
Currently 13.9% of total revenue(3)
Goal: increase percentage of total revenue to 16%
~50% of emerging market growth driven by acquisitions
First wave of outsourcing
M&A Key Driver of Emerging Market Strategy
Emerging Market Targets
($MM)
100-120
Base
90-110
Acquisitions
(1) 2013 Adjusted OIBDA excludes restructuring charges
(2) 2016 target excludes foreign exchange impact and is based on 2014 C$ budget rate
(3) On a constant dollar basis
(1) (2)
$319
$510-$550
$65
$100- $150
2013 Actual 2016 Targets
Revenue Adjusted OIBDA
18
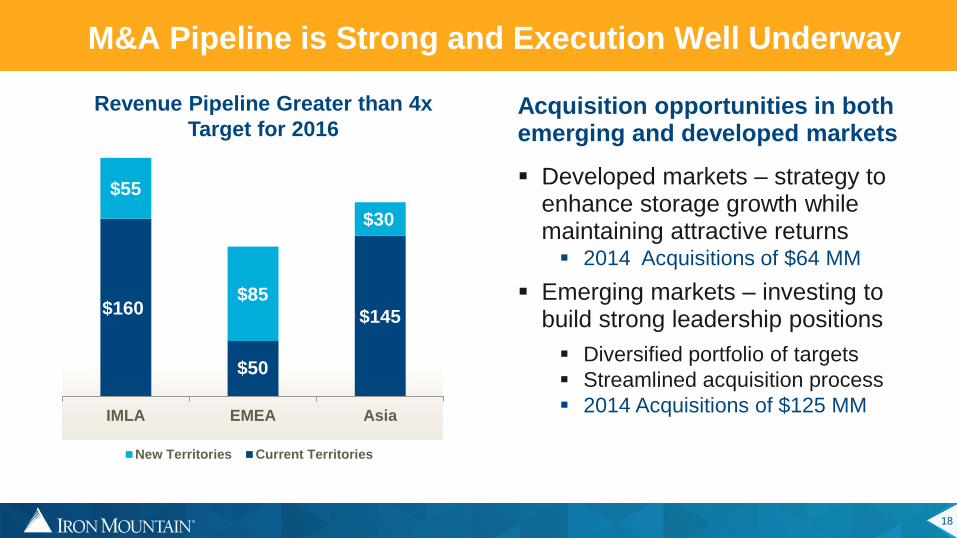
$160
$50
$145
$55
$85
$30
IMLA EMEA Asia
New Territories Current Territories
Acquisition opportunities in both emerging and developed markets
Developed markets – strategy to enhance storage growth while maintaining attractive returns 2014 Acquisitions of $64 MM
Emerging markets – investing to build strong leadership positions
Diversified portfolio of targets
Streamlined acquisition process
2014 Acquisitions of $125 MM
M&A Pipeline is Strong and Execution Well Underway
Revenue Pipeline Greater than 4x
Target for 2016
19
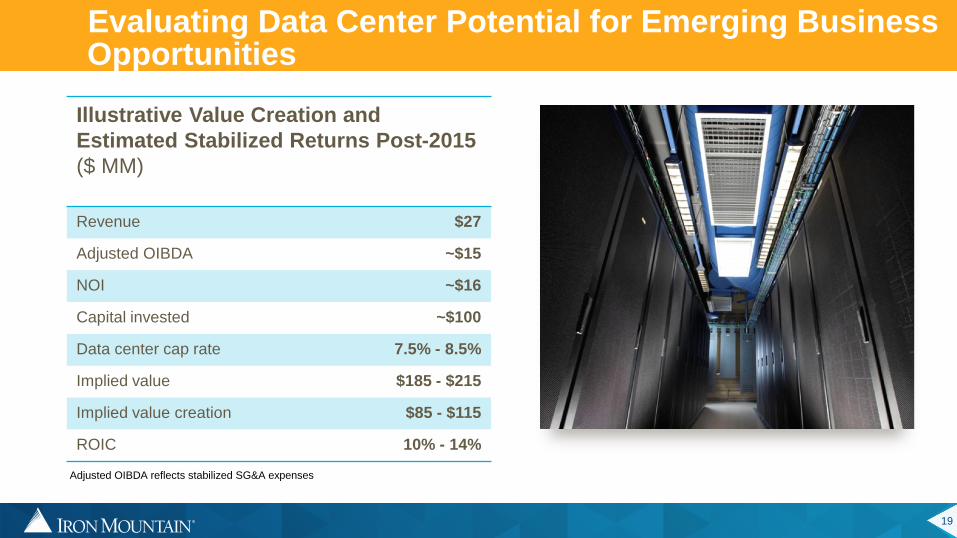
Evaluating Data Center Potential for Emerging Business Opportunities
Illustrative Value Creation and
Estimated Stabilized Returns Post-2015
($ MM)
Revenue $27
Adjusted OIBDA ~$15
NOI ~$16
Capital invested ~$100
Data center cap rate 7.5% - 8.5%
Implied value $185 - $215
Implied value creation $85 - $115
ROIC 10% - 14%
Adjusted OIBDA reflects stabilized SG&A expenses
20
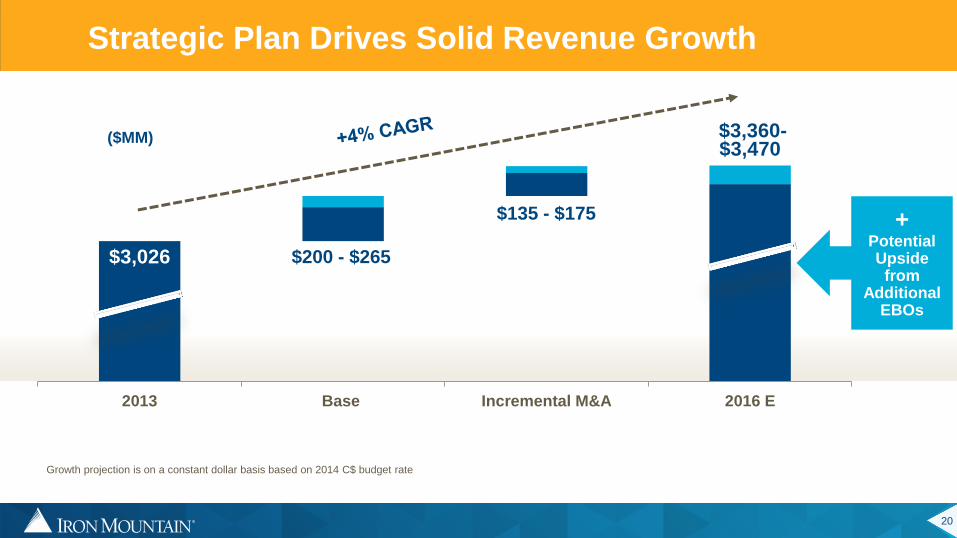
$3,026
$3,360- $3,470
$2,200
$2,400
$2,600
$2,800
$3,000
$3,200
$3,400
$3,600
2013 Base Incremental M&A 2016 E
Strategic Plan Drives Solid Revenue Growth
($MM)
$200 - $265
$135 - $175 + Potential
Upside from EBOs
+ Potential Upside
from Additional
EBOs
Growth projection is on a constant dollar basis based on 2014 C$ budget rate
21
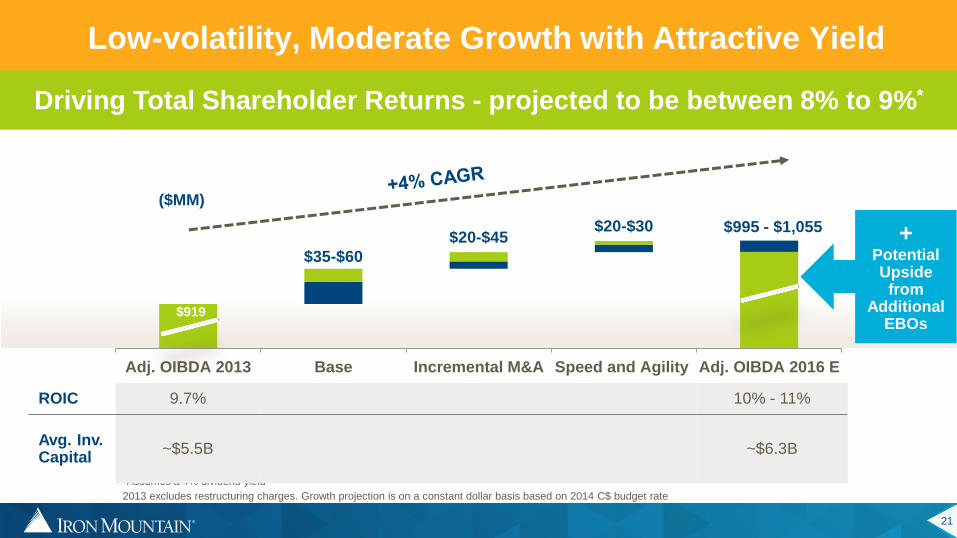
Low-volatility, Moderate Growth with Attractive Yield
$919
$35-$60
$20-$45 $20-$30 $995 - $1,055
Adj. OIBDA 2013 Base Incremental M&A Speed and Agility Adj. OIBDA 2016 E
*Assumes a 4% dividend yield
2013 excludes restructuring charges. Growth projection is on a constant dollar basis based on 2014 C$ budget rate
ROIC 9.7% 10% - 11%
Avg. Inv. Capital
~$5.5B ~$6.3B
($MM)
Driving Total Shareholder Returns - projected to be between 8% to 9%*
+ Potential Upside from
EBOs
+ Potential Upside
from Additional
EBOs
22
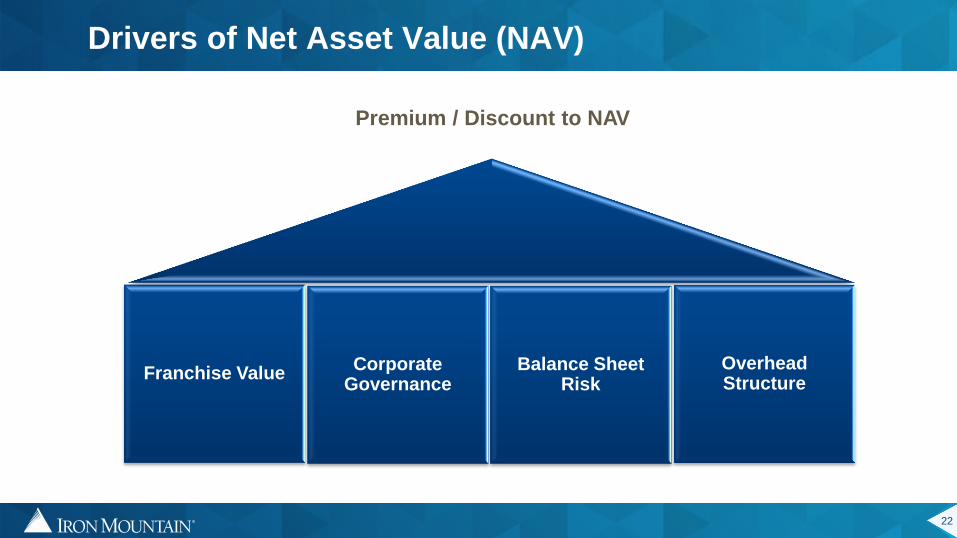
Drivers of Net Asset Value (NAV)
Corporate Governance
Balance Sheet Risk
Franchise Value
Premium / Discount to NAV
Overhead Structure
23
Significant Franchise Value Supports Enhanced Valuation
Solid track record of enhancing shareholder value
Share buybacks, pursuing REIT conversion, dividend enhancement
Most expansive global platform
Difficult and expensive to replicate
Strong international expansion opportunity
Attractive real estate characteristics
Low turnover costs
Low maintenance capex
High retention, low volatility
Formal corporate responsibility program and inclusion in SRI Indexes
24
Strong Corporate Governance Profile
Demonstrated responsiveness to investors
Non-staggered, independent Board with significant investment
No antitakeover provisions
Low potential conflicts of interest
25
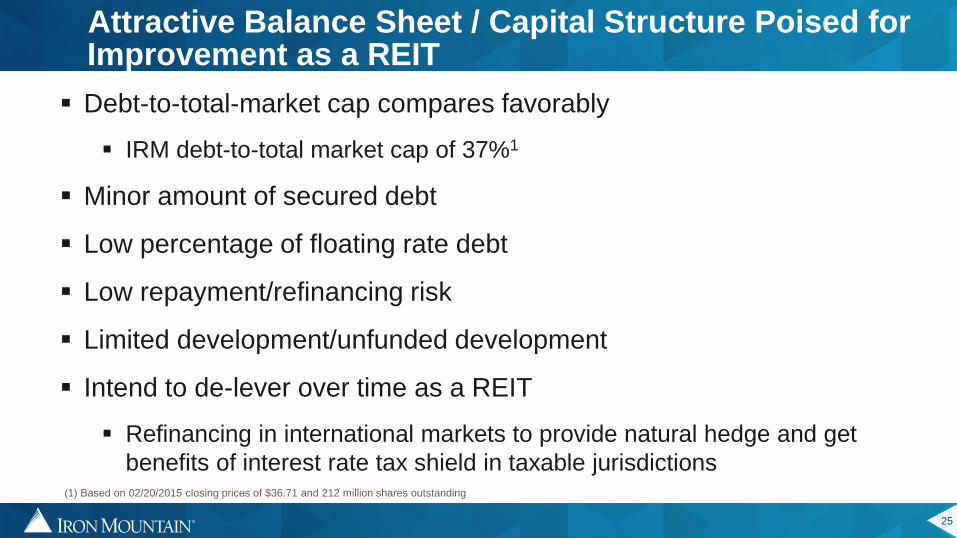
Attractive Balance Sheet / Capital Structure Poised for Improvement as a REIT
Debt-to-total-market cap compares favorably
IRM debt-to-total market cap of 37%1
Minor amount of secured debt
Low percentage of floating rate debt
Low repayment/refinancing risk
Limited development/unfunded development
Intend to de-lever over time as a REIT
Refinancing in international markets to provide natural hedge and get
benefits of interest rate tax shield in taxable jurisdictions (1) Based on 02/20/2015 closing prices of $36.71 and 212 million shares outstanding
26
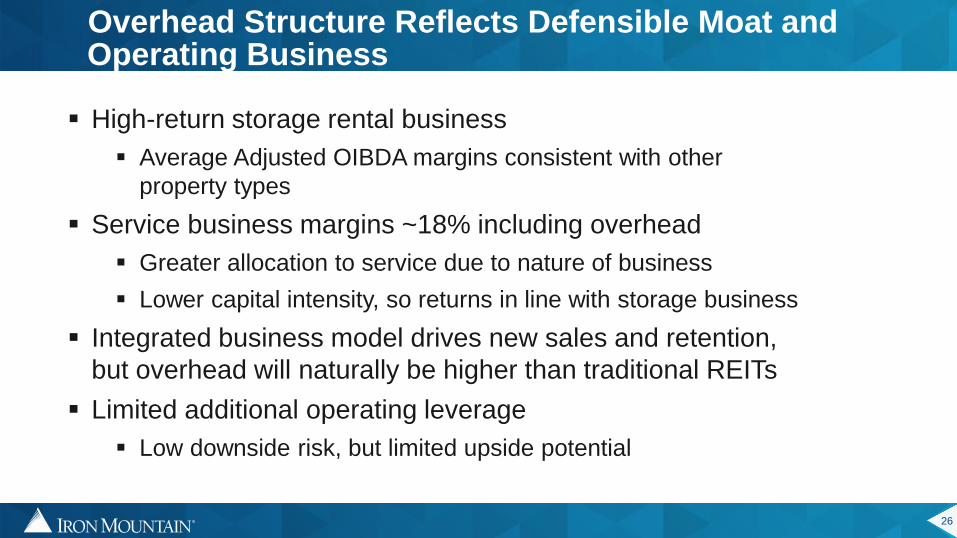
Overhead Structure Reflects Defensible Moat and Operating Business
High-return storage rental business
Average Adjusted OIBDA margins consistent with other
property types
Service business margins ~18% including overhead
Greater allocation to service due to nature of business
Lower capital intensity, so returns in line with storage business
Integrated business model drives new sales and retention,
but overhead will naturally be higher than traditional REITs
Limited additional operating leverage
Low downside risk, but limited upside potential
27
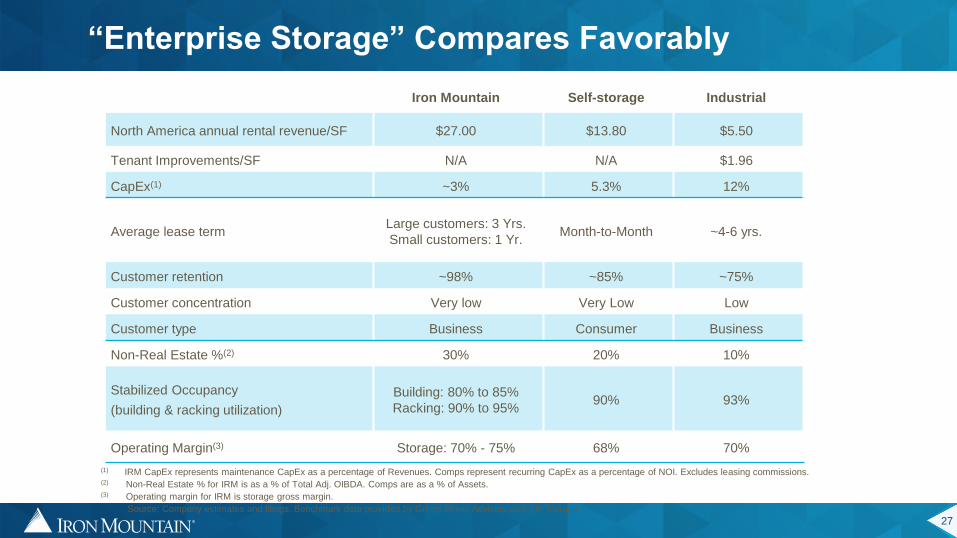
“Enterprise Storage” Compares Favorably
Iron Mountain Self-storage Industrial
North America annual rental revenue/SF $27.00 $13.80 $5.50
Tenant Improvements/SF N/A N/A $1.96
CapEx(1) ~3% 5.3% 12%
Average lease term Large customers: 3 Yrs.
Small customers: 1 Yr. Month-to-Month ~4-6 yrs.
Customer retention ~98% ~85% ~75%
Customer concentration Very low Very Low Low
Customer type Business Consumer Business
Non-Real Estate %(2) 30% 20% 10%
Stabilized Occupancy
(building & racking utilization)
Building: 80% to 85%
Racking: 90% to 95% 90% 93%
Operating Margin(3) Storage: 70% - 75% 68% 70%
(1) IRM CapEx represents maintenance CapEx as a percentage of Revenues. Comps represent recurring CapEx as a percentage of NOI. Excludes leasing commissions. (2) Non-Real Estate % for IRM is as a % of Total Adj. OIBDA. Comps are as a % of Assets. (3) Operating margin for IRM is storage gross margin.
Source: Company estimates and filings. Benchmark data provided by Green Street Advisors and J.P. Morgan
28
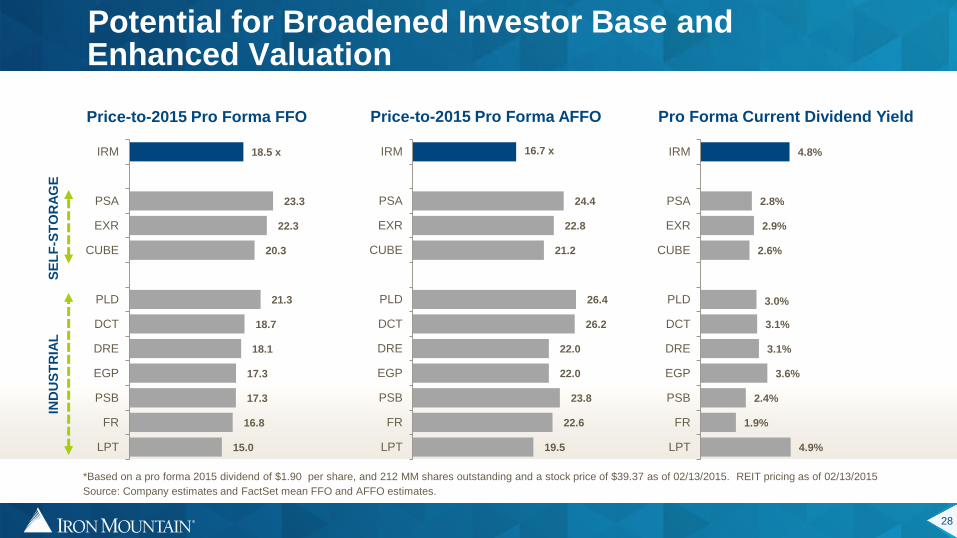
Potential for Broadened Investor Base and Enhanced Valuation
15.0
16.8
17.3
17.3
18.1
18.7
21.3
20.3
22.3
23.3
18.5 x
LPT
FR
PSB
EGP
DRE
DCT
PLD
CUBE
EXR
PSA
IRM
Price-to-2015 Pro Forma FFO
4.9%
1.9%
2.4%
3.6%
3.1%
3.1%
3.0%
2.6%
2.9%
2.8%
4.8%
LPT
FR
PSB
EGP
DRE
DCT
PLD
CUBE
EXR
PSA
IRM
Pro Forma Current Dividend Yield
*Based on a pro forma 2015 dividend of $1.90 per share, and 212 MM shares outstanding and a stock price of $39.37 as of 02/13/2015. REIT pricing as of 02/13/2015
Source: Company estimates and FactSet mean FFO and AFFO estimates.
19.5
22.6
23.8
22.0
22.0
26.2
26.4
21.2
22.8
24.4
16.7 x
LPT
FR
PSB
EGP
DRE
DCT
PLD
CUBE
EXR
PSA
IRM
Price-to-2015 Pro Forma AFFO
SE
LF
-ST
OR
AG
E
IND
US
TR
IAL
29
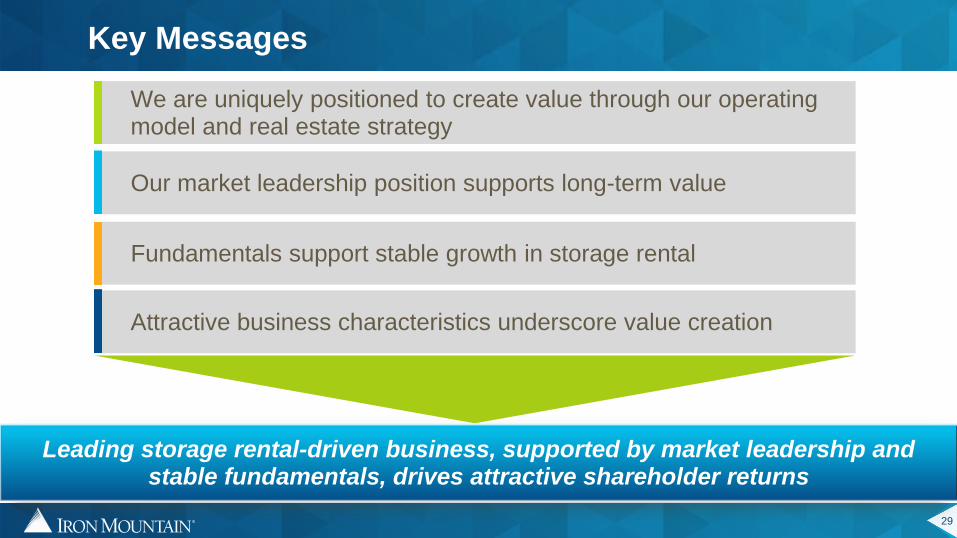
Key Messages
We are uniquely positioned to create value through our operating model and real estate strategy
Our market leadership position supports long-term value
Fundamentals support stable growth in storage rental
Leading storage rental-driven business, supported by market leadership and stable fundamentals, drives attractive shareholder returns
Attractive business characteristics underscore value creation

30
Questions?

© 2015 Iron Mountain Incorporated. All rights reserved. Iron Mountain and the design of the mountain are registered trademarks of Iron Mountain Incorporated.
All other trademarks and registered trademarks are the property of their respective owners.
Appendix
32
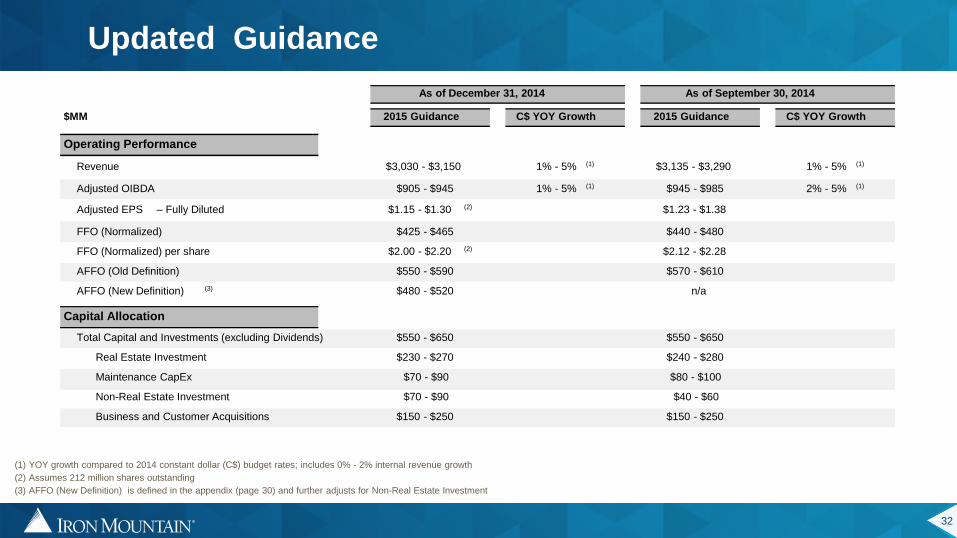
Updated Guidance
$MM 2015 Guidance C$ YOY Growth 2015 Guidance C$ YOY Growth
Operating Performance
Revenue $3,030 - $3,150 1% - 5% (1) $3,135 - $3,290 1% - 5% (1)
Adjusted OIBDA $905 - $945 1% - 5% (1) $945 - $985 2% - 5% (1)
Adjusted EPS – Fully Diluted $1.15 - $1.30 (2) $1.23 - $1.38
FFO (Normalized) $425 - $465 $440 - $480
FFO (Normalized) per share $2.00 - $2.20 (2) $2.12 - $2.28
AFFO (Old Definition) $550 - $590 $570 - $610
AFFO (New Definition) (3) $480 - $520 n/a
Capital Allocation
Total Capital and Investments (excluding Dividends) $550 - $650 $550 - $650
Real Estate Investment $230 - $270 $240 - $280
Maintenance CapEx $70 - $90 $80 - $100
Non-Real Estate Investment $70 - $90 $40 - $60
Business and Customer Acquisitions $150 - $250 $150 - $250
As of December 31, 2014 As of September 30, 2014
(1) YOY growth compared to 2014 constant dollar (C$) budget rates; includes 0% - 2% internal revenue growth
(2) Assumes 212 million shares outstanding
(3) AFFO (New Definition) is defined in the appendix (page 30) and further adjusts for Non-Real Estate Investment
33
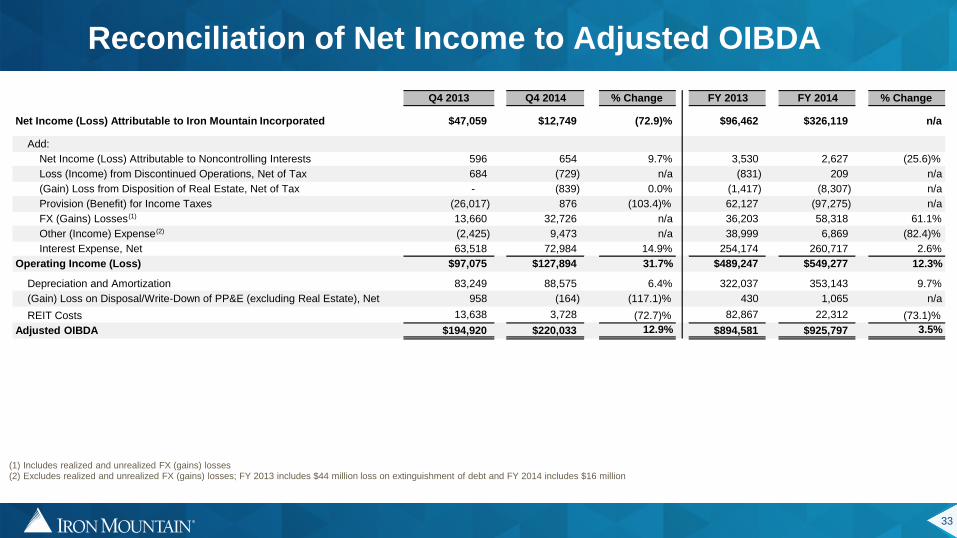
Reconciliation of Net Income to Adjusted OIBDA
Q4 2013 Q4 2014 % Change FY 2013 FY 2014 % Change
Net Income (Loss) Attributable to Iron Mountain Incorporated $47,059 $12,749 (72.9)% $96,462 $326,119 n/a
Add:
Net Income (Loss) Attributable to Noncontrolling Interests 596 654 9.7% 3,530 2,627 (25.6)%
Loss (Income) from Discontinued Operations, Net of Tax 684 (729) n/a (831) 209 n/a
(Gain) Loss from Disposition of Real Estate, Net of Tax - (839) 0.0% (1,417) (8,307) n/a
Provision (Benefit) for Income Taxes (26,017) 876 (103.4)% 62,127 (97,275) n/a
FX (Gains) Losses (1) 13,660 32,726 n/a 36,203 58,318 61.1%
Other (Income) Expense (2) (2,425) 9,473 n/a 38,999 6,869 (82.4)%
Interest Expense, Net 63,518 72,984 14.9% 254,174 260,717 2.6%
Operating Income (Loss) $97,075 $127,894 31.7% $489,247 $549,277 12.3%
Depreciation and Amortization 83,249 88,575 6.4% 322,037 353,143 9.7%
(Gain) Loss on Disposal/Write-Down of PP&E (excluding Real Estate), Net 958 (164) (117.1)% 430 1,065 n/a
REIT Costs 13,638 3,728 (72.7)% 82,867 22,312 (73.1)%
Adjusted OIBDA $194,920 $220,033 12.9% $894,581 $925,797 3.5%
(1) Includes realized and unrealized FX (gains) losses (2) Excludes realized and unrealized FX (gains) losses; FY 2013 includes $44 million loss on extinguishment of debt and FY 2014 includes $16 million