Embed Size (px)
Citation preview

Use, duplication or disclosure of this document or any of the information or images contained herein
is subject to the restrictions on the title page of this document. COPYRIGHT ©2016 MDA 1
A Global Communications and Information Company
Use, duplication or disclosure of this document or any of the information or images contained herein is subject to the restrictions on the title page of this document. COPYRIGHT ©2014 MDA
Pipeline Integrity Monitoring
1

Use, duplication or disclosure of this document or any of the information or images contained herein
is subject to the restrictions on the title page of this document. COPYRIGHT ©2016 MDA
Business Types
Business Offering
Space-based missions
Ground-based Integrated Information Solutions
Geospatial Services
• SAR and Optical Imaging Satellites• Communications Satellites• Space Robotics• Space-based subsystems
• SAR real-time mil-spec’d airborne• SAR satellite processors many missions• Imaging satellite ground stations• UAV systems
• Operation of RADARSAT-2• 30+ RADARSAT-2 Stations worldwide• Data distributor for all major satellites• Value added information products
Corporate Overview
2
Use, duplication or disclosure of this document or any of the information or images contained herein
is subject to the restrictions on the title page of this document. COPYRIGHT ©2016 MDA
MDA is a global company serving clients worldwide
3
MacDonald, Dettwiler and Associates, Ltd (MDA)• Founded in 1969 – built on system engineering · 2015 Revenue: CAD$2.1B• Employees: ~4800 · Offices, customers and projects around the world

Use, duplication or disclosure of this document or any of the information or images contained herein
is subject to the restrictions on the title page of this document. COPYRIGHT ©2016 MDAUse, duplication or disclosure of this document or any of the information or images contained herein is subject to the restrictions on the title page of this document. COPYRIGHT ©2014 MDA
Operational Solutions
MDA Pipeline Integrity Monitoring
4

Use, duplication or disclosure of this document or any of the information or images contained herein
is subject to the restrictions on the title page of this document. COPYRIGHT ©2016 MDA
Pipeline upheaval buckling
from subsidence
Satellite Data Allows Operators To See Pipeline Problems
Oil Leaks to Surface
Slope failure & landslidesGas Explosion from Ground
Movement
5
Slope failure & landslides
Landslides
SoCal Gas
blogs.agu.org
Global News
Image © DigitalGlobe 2015
USGS

Use, duplication or disclosure of this document or any of the information or images contained herein
is subject to the restrictions on the title page of this document. COPYRIGHT ©2016 MDA
Pipeline Integrity – GeoHazard Risk Impact
Health, Safety and Environment
• Health & Safety
• Loss of life
• Water and air quality
• Wildlife, agriculture, vegetation
Pipeline
Integrity
GeoHazard
Risks
Field Operations
• Oil leaks to surface
• Pipeline Stress
• ROW encroachment
• Shutdown, repair, remediation
Legal & Social License
• Regulatory non-compliance
• Litigation
• Community impact
• Investor impact
Financial Results
• Cost to repair damage
• Remediation and restoration costs
• Reduced revenue from shutdown
• Legal costs
6

Use, duplication or disclosure of this document or any of the information or images contained herein
is subject to the restrictions on the title page of this document. COPYRIGHT ©2016 MDA
InSAR compares two images taken at separate times to calculate
the change in distance from the satellite to ground objects.
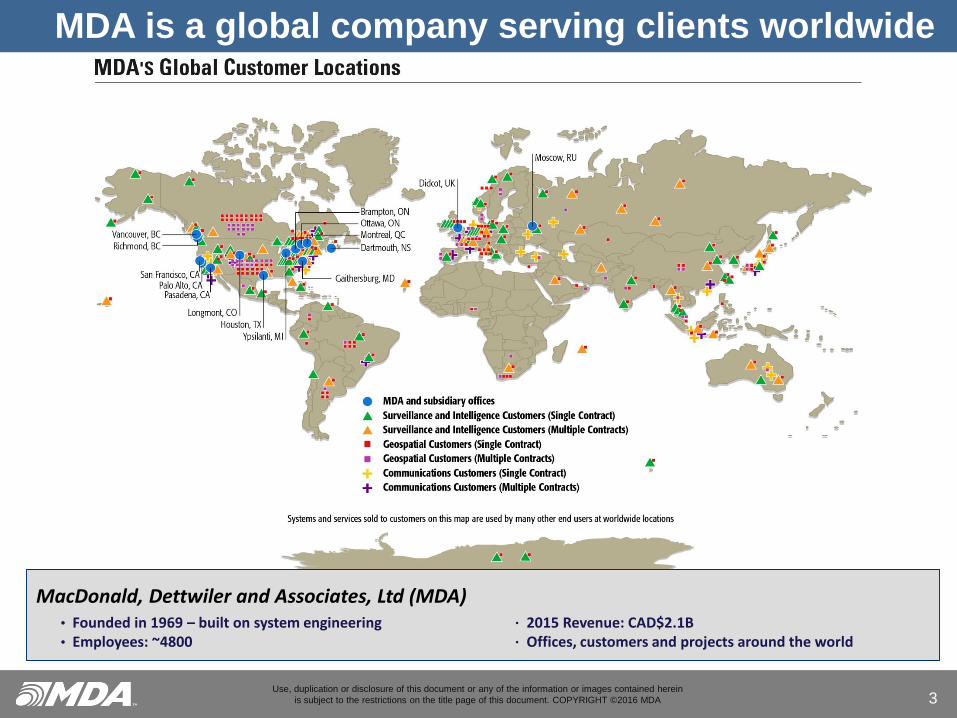
What is InSAR Surface Movement Monitoring?
7
InSAR can measure movement of a few millimeters using SAR phase information.
Use, duplication or disclosure of this document or any of the information or images contained herein
is subject to the restrictions on the title page of this document. COPYRIGHT ©2016 MDA
An interferogram is created by plotting
the phase change of each pixel. This is a
contour map with each fringe equal to
2.8 cm for C-Band RADARSAT-2.
A deformation map is created to show
total uplift or subsidence over a large area.
In some cases only point targets (rocks, infrastructure,
corner reflectors) can be detected if vegetation hides
the earth surface.
A time series of measurements is provided for each
surface pixel providing a temporal view of motion.
What is InSAR Surface Movement Monitoring?
8

Use, duplication or disclosure of this document or any of the information or images contained herein
is subject to the restrictions on the title page of this document. COPYRIGHT ©2016 MDA
Phase and amplitude change analysis
9
Analysis of the phase change of each
pixel over time provides a time series of
surface movement measurements with
mm accuracy.
Phase Change Analysis (InSAR)
A series of SAR
images collected with
the same viewing
geometry is used to
perform either phase
change or amplitude
change analysis.
SAR data stackAnalysis of the amplitude change of each
pixel information about the appearance or
disappearance of objects and features.
Amplitude Change Analysis
Changes at different times
New or missing objects
Time

Use, duplication or disclosure of this document or any of the information or images contained herein
is subject to the restrictions on the title page of this document. COPYRIGHT ©2016 MDA
Generate Flood Alerts Monitor Flood Progress
Measure Ground Subsidence
MDA has been providing satellite information products to the oil and gas industry for over 20 years.
• InSAR based surface movement monitoring can measure mm level subsidence and slope movement
• Amplitude Change Detection (ACD) detects significant surface changes for flood, oil spill, and encroachment monitoring
Satellite Information Services for Pipeline Integrity
Measure Slope Creep Detect Potential Strain
Detect Oil Spills
Detect LandslidesTrack Changes Over Time Locate Stable Terrain
Detect Unstable Slopes Detect ROW EncroachmentMeasure Motion Near Faults
10
Burgmann et al., 2014

Use, duplication or disclosure of this document or any of the information or images contained herein
is subject to the restrictions on the title page of this document. COPYRIGHT ©2016 MDA
“Pipeline Monitoring Using Advanced SAR Techniques”
MDA completed a detailed study for Canadian Space Agency in 2016• Scientific Authority: Alberta Geological Survey• Partner: Simon Fraser University – Department of Earth Sciences• Partner: BGC Engineering Inc.
Results published in a paper: “Monitoring Landslides along Pipeline Corridors Using a Combined Satellite-Based InSAR and Geomechanical Modelling Approach,” Sharma et al., 2016.
Canadian Space Agency Pipeline Study
Measure Slope Creep Detect Landslides Track Changes Over TimeLocate Stable Terrain Detect Unstable Slopes
11

Use, duplication or disclosure of this document or any of the information or images contained herein
is subject to the restrictions on the title page of this document. COPYRIGHT ©2016 MDA
+6cm/year
-6 cm/year
N
Downslope motion
PipelineROW
Case Study:
Central British Columbia Slope
• Pipeline ROW traverses a slow moving
landslide on a slope above the Fraser River
• Monthly InSAR analysis measures the
movement of the slope
• Measurements are confirmed with more than a
dozen GPS measurements
• InSAR measurements vs GPS
• Cover a much greater spatial extent
• Provide a much larger number of
measurements
• Provide high density creating a spatial view
• Spatial data visualization provides a much
clearer understanding of the geohazard than
GPS points
• Areal extent of the motion is well defined in
the InSAR
Benefit: Informed decisions can be made to
investigate further, or take preventative action such as
slope stabilization or moving a section of pipeline to
stable terrain.1 km
Risk of pipeline damage from landslide can be seen early as slope creep
0cm
12
After Sharma et al., 2016

Use, duplication or disclosure of this document or any of the information or images contained herein
is subject to the restrictions on the title page of this document. COPYRIGHT ©2016 MDA
Geomechanical model of slope movement
13
Case Study: Central British Columbia Slope
• A geomechanical model was created integrating GPS, inclinometer, InSAR data
• The model identified 7 sub-blocks whose motion was consistent with GPS and InSAR data
• The model shows a major shear surface at 110m depth is in agreement with the inclinometer data
Sharma et al., 2016

Use, duplication or disclosure of this document or any of the information or images contained herein
is subject to the restrictions on the title page of this document. COPYRIGHT ©2016 MDA
Gradient of Ground Movement(cm/year/meter)
-6 cm/yr
N
PipelineROW
Case Study: Central British Columbia Slope
• Sharp differential deformation is a particular concern due to localized high strain on the pipeline
• Spatial analysis of the surface movement gradient helps visualize potential strain zones
Benefit: Action can be taken to deploy additional instrumentation, inspect for damage, or reduce stress to minimize risk of
pipeline damage.
1 km
See potential strain: gradient of ground movement
0cm
Potential Strain
Potential Strain
14
Downslope motion
Ground Movement(cm/year) 6 cm/yr
After Sharmaet al., 2016

Use, duplication or disclosure of this document or any of the information or images contained herein
is subject to the restrictions on the title page of this document. COPYRIGHT ©2016 MDA
+2 cm-2 cm
5.5 km
5.6
km
Pipeline ROW
Agricultural
fields
Agricultural
fields
Agricultural
fields
DigitalGlobe / Google EarthDigitalGlobe / Google Earth
Case Study: Beatton River, BC April 2015-16
• Wide area assessment of slope motion and stable
terrain
• Optical satellite data confirms landslide on one detected
unstable slope
Benefit: Early detection of movement provides the lead time to
take preventative action.
Locate unstable slopes and stable terrain
15

Use, duplication or disclosure of this document or any of the information or images contained herein
is subject to the restrictions on the title page of this document. COPYRIGHT ©2016 MDA
Detect pipeline strain from surface subsidence
Case Study: Pipeline crossing a subsidence zone
• Pipeline crossing a zone of subsidence caused by enhanced oil
recovery operations in Belridge, California
• Cumulative subsidence was measured to be 2.5 meters over
about 11 years
• The upheaval buckling of a pipeline occurred (red line below)
just following a large increase in the velocity of ground
subsidence
Benefit: Action can be taken to deploy additional instrumentation,
inspect for damage, or reduce stress to reduce risk of pipeline
damage.
16
C-Core

Use, duplication or disclosure of this document or any of the information or images contained herein
is subject to the restrictions on the title page of this document. COPYRIGHT ©2016 MDA
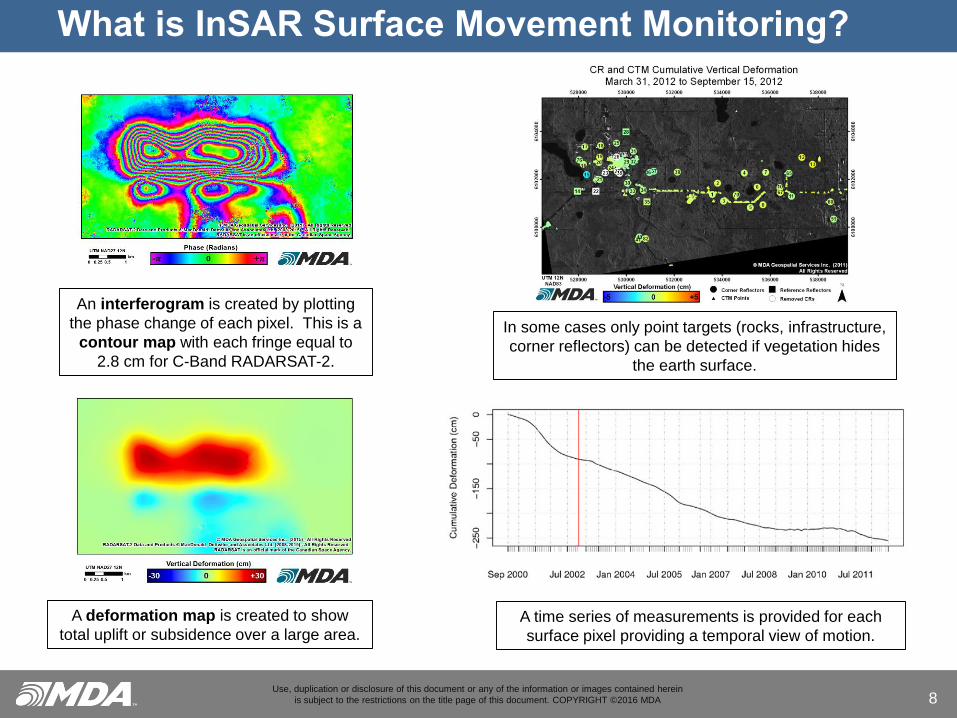
Detect Landslides in Remote Regions
2015/09/26 2015/10/20
Slide first detected with
Change Detection
shadow
Beatton
River
shadow
Beatton
River
landslide
river
blocked
river width
(& water level)
increased
θ = 47.03◦
1 km
Case Study: Beatton River, Alberta, October 2015
• October landslide was first detected with change detection
• River width increase also detected due to river blockage (flood type event)
• Air photos from October 22, 2015 confirm a landslide
17
Use, duplication or disclosure of this document or any of the information or images contained herein
is subject to the restrictions on the title page of this document. COPYRIGHT ©2016 MDA
Energeticcity.ca
Google Earth 2015/06/26Image © DigitalGlobe 2015
Google Earth 2015/06/26
Image © DigitalGlobe 2015
Landslide Area
Landslide Event
250 m
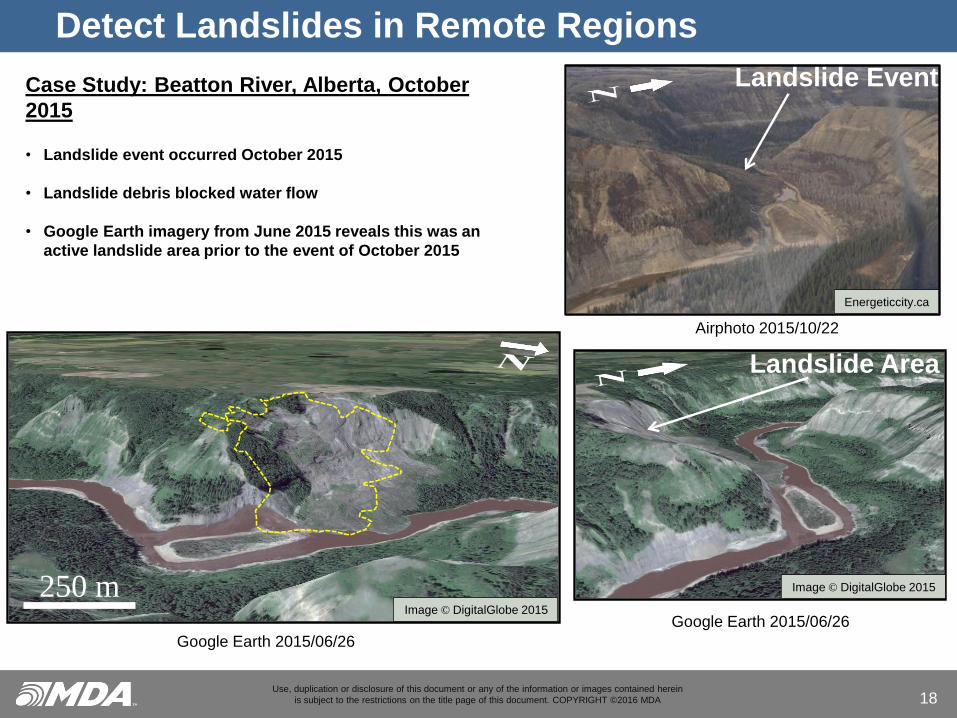
Detect Landslides in Remote Regions
Case Study: Beatton River, Alberta, October
2015
• Landslide event occurred October 2015
• Landslide debris blocked water flow
• Google Earth imagery from June 2015 reveals this was an
active landslide area prior to the event of October 2015
18
Airphoto 2015/10/22

Use, duplication or disclosure of this document or any of the information or images contained herein
is subject to the restrictions on the title page of this document. COPYRIGHT ©2016 MDA
Case Study: Beatton River, Alberta, October 2015
After the detection of the landslide, Amplitude Change Detection
separated persistent changes into five time periods, with most
activity occurring in three time periods:
a) Small precursor slides in April
b) Main October slide
c) Follow on slides in November
19
Separating Persistent Changes in Time
Separating changes in time
Nov 2015 – Jan 2016 = Follow on slides
Aug - Oct 2015 = Main slide event
May – July 2015
Feb – April 2015 = Small early slides
Nov 2014 – Jan 2015
Time
Landslide detection
© MDA Geospatial Services Inc. (2016) – All Rights Reserved.

Use, duplication or disclosure of this document or any of the information or images contained herein
is subject to the restrictions on the title page of this document. COPYRIGHT ©2016 MDA
Case Study: Pipeline ROW, Alberta, July 2015
• Discovered by operator July 15, 2015
• Later analysis shows Amplitude Change Detection (ACD)
on a pair of RADARSAT-2 images detects a corresponding
change in a July 10, 2015 image
Benefit: Earlier detection and shutdown may reduce the spill
volume, clean up costs and impact to environment.
Detect Oil on Ground
20
RADARSAT-2 image before the spill
RADARSAT-2 image July 10, 2015 after the spill
Change Detection productwith spill detected
Aerial Photo
400 m
GLOBAL NEWS

Use, duplication or disclosure of this document or any of the information or images contained herein
is subject to the restrictions on the title page of this document. COPYRIGHT ©2016 MDA
Detect encroachment activities on/near ROW
21
RADARSAT-2 image before activity RADARSAT-2 image after activity Change Detection product with oil spill and activity on ROW detected
Ground Truth Aerial Photo
Case Study: Pipeline ROW, Alberta, July 2015
• Change Detection shows vehicles and equipment
on ROW
• Also detected are changes to the land surface
from digging and earth moving activities.
Benefit: Early detection of encroachment of ROW or
activity near ROW allows investigation and preventative
measures.
• “Blue is new / Red has fled”
400 m
GARRETT BARRY / FORT MCMURRAY TODAY

Use, duplication or disclosure of this document or any of the information or images contained herein
is subject to the restrictions on the title page of this document. COPYRIGHT ©2016 MDA
Obtain flood detection alerts and progress monitoring
22
© MDA Geospatial Services Inc. (2016) – All Rights Reserved.
SAR imagery easily detects flat surface of water
• Change detection shows difference before and during a flood
• Regular monitoring shows progress of the flood
• Wide areas can be monitored to produce flood alerts

Use, duplication or disclosure of this document or any of the information or images contained herein
is subject to the restrictions on the title page of this document. COPYRIGHT ©2016 MDA
InSAR Features
Validation of Operational Surface Movement Measurement at an Enhanced Oil Recovery Field , MD Henschel, B Deschamps, R Rahmoune, and M Sulaimani –Petroleum Development Oman, GRSG, 15 December 2014.
1. Wide Area Coverage
• SAR imagery can ranges from 18 km wide
scenes to over 150 km wide.
2. High Measurement Density
• Each pixel is a potential measurement.
Typical pixel spacing of 3 m
3. High Accuracy
• Accuracy against GPS has been shown to
be 5 mm or better
4. Frequent measurements
• Measurements can be provided every 24
days or better
5. Vertical + E-W Horizontal Motion Available
• Measurements can be line of sight to
satellite or separate vertical + E-W
horizontal
6. Day/Night and all weather reliability
• Image acquisition occurs in all weather
regardless of clouds, rain or darkness.
23
Use, duplication or disclosure of this document or any of the information or images contained herein
is subject to the restrictions on the title page of this document. COPYRIGHT ©2016 MDA
Benefits
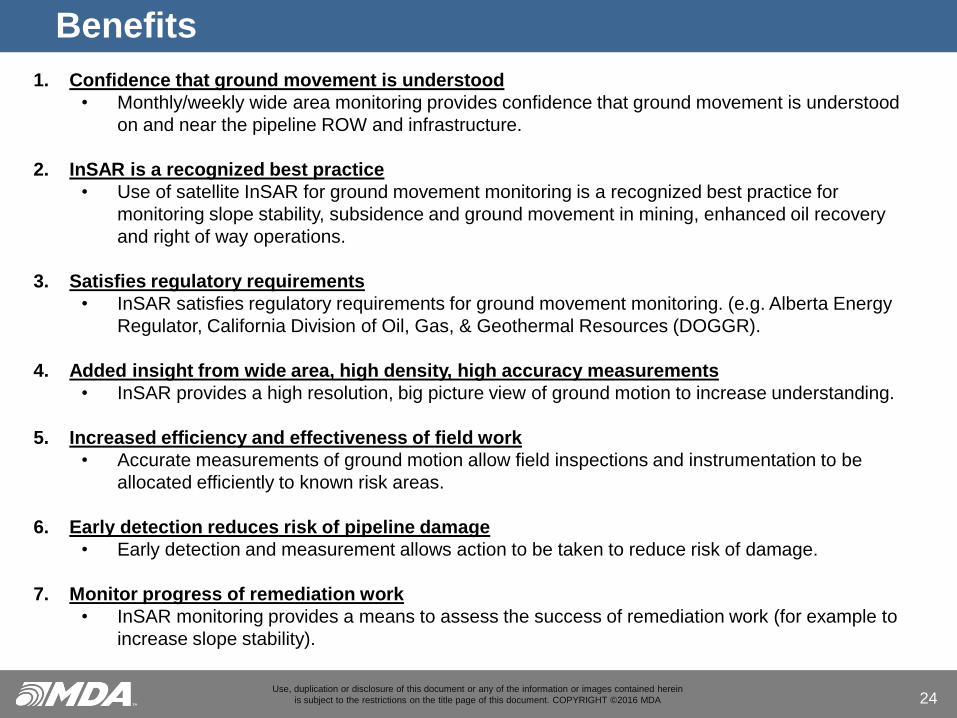
1. Confidence that ground movement is understood
• Monthly/weekly wide area monitoring provides confidence that ground movement is understood
on and near the pipeline ROW and infrastructure.
2. InSAR is a recognized best practice
• Use of satellite InSAR for ground movement monitoring is a recognized best practice for
monitoring slope stability, subsidence and ground movement in mining, enhanced oil recovery
and right of way operations.
3. Satisfies regulatory requirements
• InSAR satisfies regulatory requirements for ground movement monitoring. (e.g. Alberta Energy
Regulator, California Division of Oil, Gas, & Geothermal Resources (DOGGR).
4. Added insight from wide area, high density, high accuracy measurements
• InSAR provides a high resolution, big picture view of ground motion to increase understanding.
5. Increased efficiency and effectiveness of field work
• Accurate measurements of ground motion allow field inspections and instrumentation to be
allocated efficiently to known risk areas.
6. Early detection reduces risk of pipeline damage
• Early detection and measurement allows action to be taken to reduce risk of damage.
7. Monitor progress of remediation work
• InSAR monitoring provides a means to assess the success of remediation work (for example to
increase slope stability).
24

Use, duplication or disclosure of this document or any of the information or images contained herein
is subject to the restrictions on the title page of this document. COPYRIGHT ©2016 MDA
Generate Flood Alerts Monitor Flood Progress
Measure Ground Subsidence
Satellite Information Services for Pipeline Integrity
Measure Slope Creep Detect Potential Strain
Detect Oil Spills
Detect LandslidesTrack Changes Over Time Locate Stable Terrain
Detect Unstable Slopes Detect ROW EncroachmentMeasure Motion Near Faults
25
Burgmann et al., 2014
Thank you for your time.
Questions?

Use, duplication or disclosure of this document or any of the information or images contained herein
is subject to the restrictions on the title page of this document. COPYRIGHT ©2016 MDA
Image Credits and Disclaimer LanguageRESTRICTION ON USE, PUBLICATION OR DISCLOSURE OF PROPRIETARY CONTENT
This presentation includes content that is proprietary to MacDonald, Dettwiler and Associates Ltd. (“MDA”), its subsidiaries, and third parties. Do not disclose, use, or duplicate this document or of any of its content.
MDA provides this presentation for general information purposes only, and this presentation does not constitute an offer, promise, warranty or guarantee of performance. MDA and its licensors do not authorize, and disclaim all liability for, any actions taken in reliance on this presentation.
The products depicted are subject to change, and are not necessarily production representative. Actual results may vary depending on certain events or conditions.
COPYRIGHT © 2016 MacDonald, Dettwiler and Associates Ltd., and third parties. All rights reserved.
RADARSAT-2 Data and Products © MacDonald, Dettwiler and Associates Ltd (year of acquisition or range of years to span entire presentation). All Rights Reserved. RADARSAT is an official mark of the Canadian Space Agency. Page(s) 8-12, 14-16, 18, 20-23, 26.
RADARSAT Data © Canadian Space Agency/Agence Spatiale Canadienne (2014-2015). All Rights Reserved. Page(s) 8-12, 14, 18, 20-23, 26.
GENERAL ACKNOWLEDGEMENTSCertain images contained in this document are property of third parties:
P. 5 Image of Landslide (top left) COPYRIGHT © USGS 1998. All rights reserved. From http://geologycafe.com/fieldtrips/anzar_road.html
P. 5 Image of Slope failure (top center) COPYRIGHT © blogs.agu.org. All rights reserved. From blogs.agu.org
P. 5 (top right) & 16 Image of Buckled pipeline COPYRIGHT © C-Core. All rights reserved. From http://ntl.bts.gov/lib/46000/46300/46316/FilGet.pdf and http://citeseerx.ist.psu.edu/viewdoc/download?doi=10.1.1.250.5780&rep=rep1&type=pdf
P. 5 Image of Gas Explosion (bottom left) COPYRIGHT © Twitter. All rights reserved. From Twitter
P. 5 and 19 Images of slope failure COPYRIGHT © DigitalGlobe. All rights reserved. From Google Earth Pro.
P. 5 Image of Oil Leak COPYRIGHT © Global News 2015. All rights reserved. . From http://globalnews.ca/news/2116785/nexen-to-provide-update-on-northern-alberta-pipeline-spill/
P. 10, 17 and 26 Image of Motion near faults COPYRIGHT © Burgmann, et al., 2104 All rights reserved. From “Final Technical Report Time-dependent creep of the Calaveras fault from 18-years of InSAR, GPS and repeating earthquakes”.
P. 12, 13, 14 Image of Slope movement COPYRIGHT © Sharma et al, 2016. All rights reserved. From “Monitoring Landslides Along Pipeline Corridors Using a Combined Satellite-Based InSAR and Geomechanical Modelling Approach”
P. 15 Image of Landslide COPYRIGHT © DigitalGlobe 2015. All rights reserved. From Google Earth Pro
P. 19 Photo of Landslide and river COPYRIGHT © Energeticcity.ca. All rights reserved. From http://energeticcity.ca/2015/10/update-on-beatton-river-landslide/
P. 21 Image of Lake and oil spill COPYRIGHT © Global News 2015. All rights reserved. From http://globalnews.ca/news/2116785/nexen-to-provide-update-on-northern-alberta-pipeline-spill/
P. 22 Image of Lake and oil spill COPYRIGHT © Garrett Barry / Fort McMurray Today 2015. All rights reserved. From http://www.edmontonjournal.com/Nexen+responds+suspension+pipeline+licences/11327409/story.html
26