Embed Size (px)
Citation preview

PINEMAPThe Pine Integrated Network:
Education, Mitigation and Adaptation Project
Current innovations and opportunities in forest management and productivity Rotura, New Zealand, April 6-8th
Jason G. VogelUniversity of Florida
School of Forest Resources and Conservation
$20,000,000
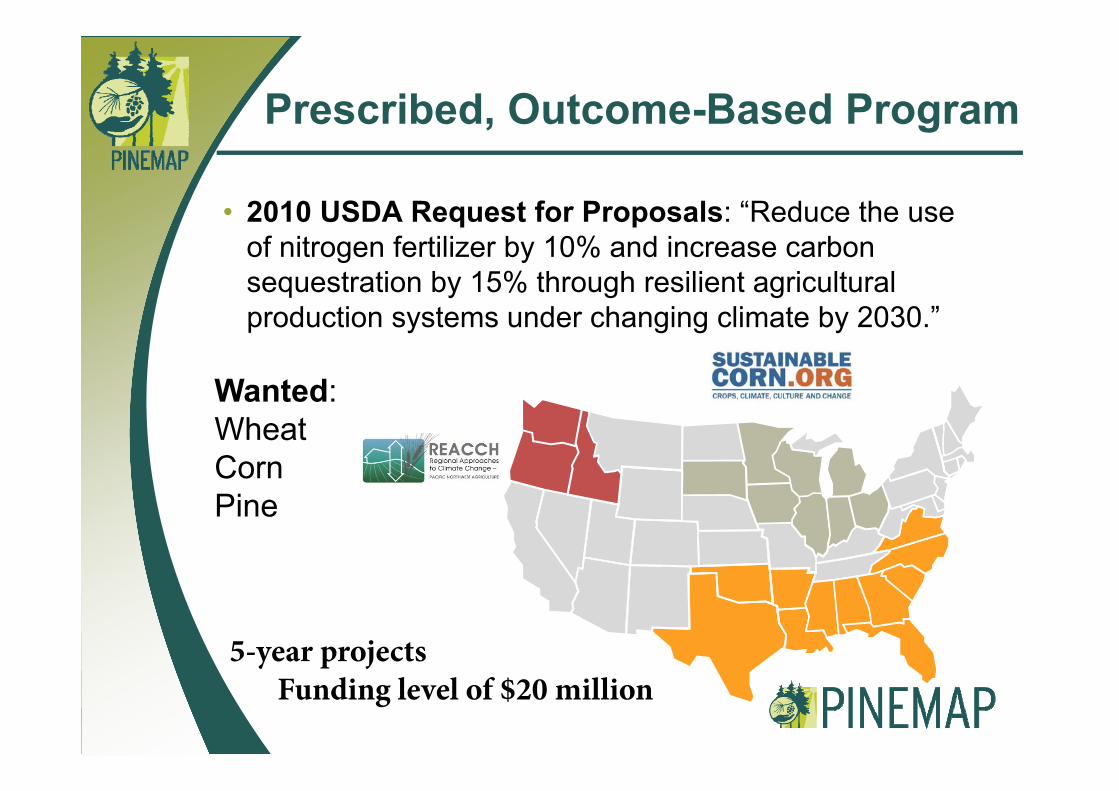
Prescribed, Outcome-Based Program
• 2010 USDA Request for Proposals: “Reduce the use of nitrogen fertilizer by 10% and increase carbon sequestration by 15% through resilient agricultural production systems under changing climate by 2030.”
Wanted:WheatCornPine
5-year projectsFunding level of $20 million

PINEMAP leveraged existing University-Industry cooperatives
Research Cooperative Host University (year founded)
Cooperative Forest Genetics Research Program
University of Florida(1953)
Cooperative Tree Improvement ProgramNorth Carolina State University
(1955)
Forest Biology Research CooperativeUniversity of Florida
(1996)Forest Modeling Research Cooperative Virginia Polytechnic Univ. (1979)
Forest Productivity CooperativeVirginia Polytechnic Univ. / NC State
Univ. (1969)Plantation Management Research Cooperative
University of Georgia (1975)
Southern Forest Resource Assessment Consortium
North Carolina State University (1994)
Western Gulf Forest Tree Improvement Program
Texas A&M Univ. / Texas Forest Service (1969)
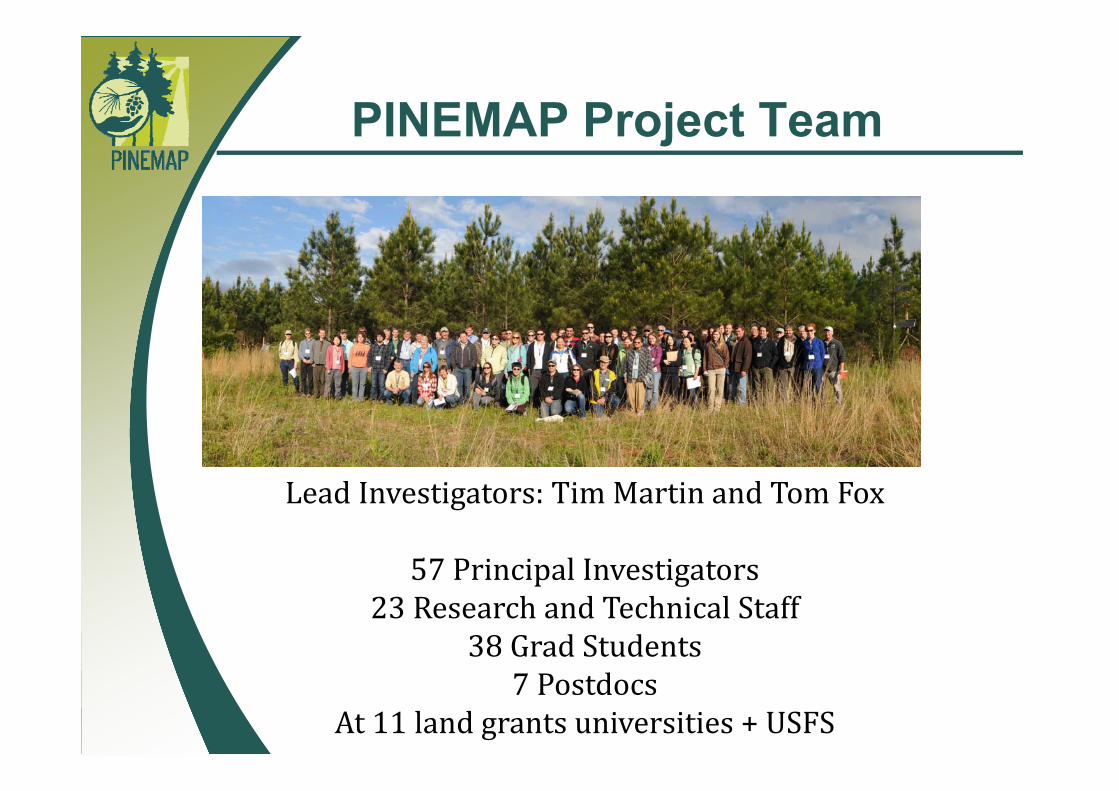
PINEMAP Project Team
LeadInvestigators:TimMartinandTomFox
57PrincipalInvestigators23ResearchandTechnicalStaff
38GradStudents7Postdocs
At11landgrantsuniversities+USFS

Focused on large landownersand pine plantations
9%
55%
45% Public
Private Corporate
Private Non‐Corporate /NIPF
Percentage by ownership class

Research Needs of Target Landowners
ResearchImportant/
Very important
Changes in forest growth and productivity 92%Changes in timber supply 79%Changes in land values and land use options 70%Changes in forest management risk associated with the intensity, severity, or magnitude of forest insect or disease outbreaks
64%
Changes in abundance and ranges of invasive species 49%Changes in forest management risk associated with intensity, severity, or magnitude of forest fires
44%
Changes in phenology 41%Changes in forest management risk associated with extreme weather events (heavy winds, lightning, hurricanes, drought)
34%
Question:Pleaseratetheimportancetoyourorganizationofresearchonthefollowingpotentialimpactsofclimatevariabilityandclimatechange.

PINEMAP Approach
• Synthesizegrowthandgeneticsdatafromexistingcooperativeresearch.
• Incorporatethisdataintoexistingmodelsofpinefunction.
• Investigatekeyuncertaintiesregardingclimateandmanagementeffectsonecosystemcarboncycling(e.g.wateravailabilityxfertilization)
• Providethisinformationtoprofessionalforestersinauseableformat.

Synthesis and experimental networks
• TierI:~700siteswithpreviouslyunshareddata.
• TierII:123sites/450plotswithnewly‐measuredCandnutrientpooldata
• TierIII:FourexperimentalsitesmanipulatingH2Oandnutrientavailabilityatintensivelymonitoredsites
• Baselines+modelparameterizationandvalidation
Tier III site
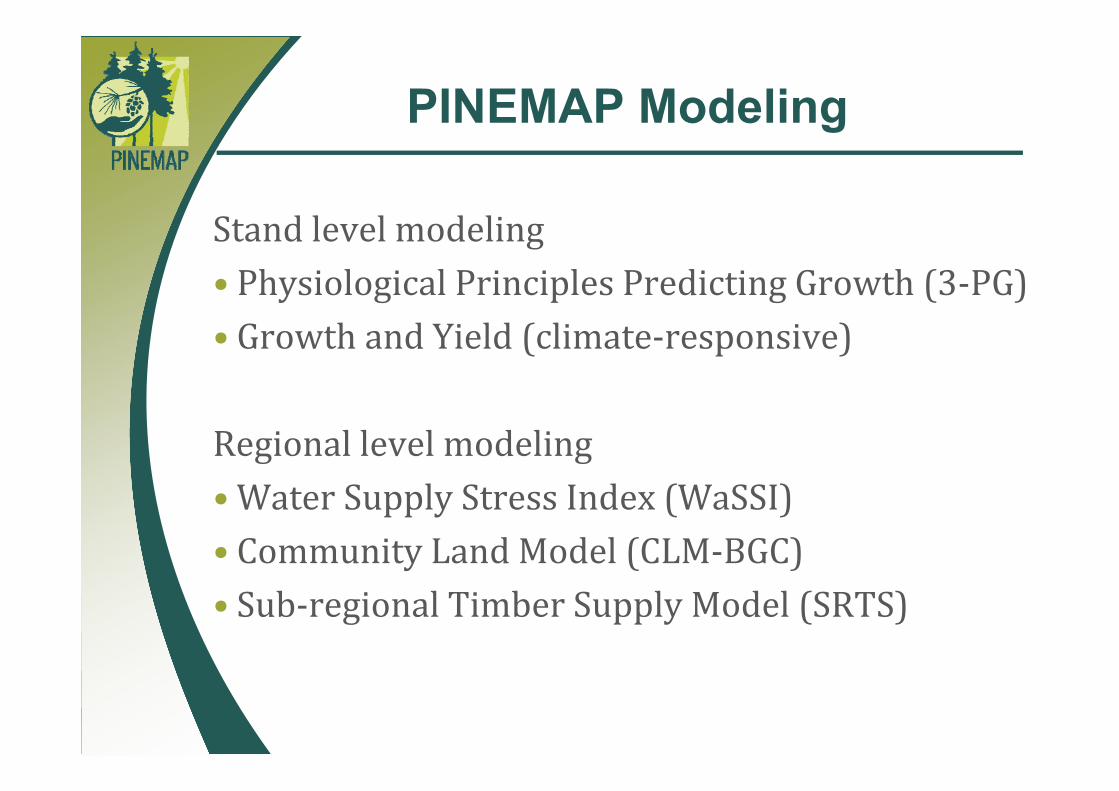
PINEMAP Modeling
Standlevelmodeling• PhysiologicalPrinciplesPredictingGrowth(3‐PG)• GrowthandYield(climate‐responsive)
Regionallevelmodeling•WaterSupplyStressIndex(WaSSI)• CommunityLandModel(CLM‐BGC)• Sub‐regionalTimberSupplyModel(SRTS)

Decision Support System (DSS)http://pinemapdss.org
• PrimaryoutletforPINEMAPtoolsandresourcestohelpusersidentifyopportunities andmitigaterisk associatedwithchangingandvariableclimate
• Intendedforprofessionalforesters

Steps in developing DSS
Climate Data
Forestry ModelsInterface
Design Forestry Research
What questions do we want to answer?
How can we properly answer questions?
Slides courtesy of the State Climate Office of NC

Iterative process of DSS development
WorkshopsPrototype
Association Meetings
Focus Group
Polling
Survey
Interviews
Online User Feedback
Professional forestersExtensionResearchPINEMAP DSS
Southeast Climate Consortium multi-feedback loop model:
Slides courtesy of the State Climate Office of NC

Climate Model Projections
• Averageof20GlobalClimateModels(GCMs)
Slide courtesy of Dr. Adrienne Wootten, South Central CSC
• OutputgeneratedforaHigh(8.5)andLow(4.5)RepresentativeCO2ConcentrationPathway(RCP)
To 2100

Climate-Related DSS Output
Precipitation:• SummerPrecipitation
Temperature:• NumberofDayswithMinTempBelowCertainThresholds
• SummerTemperature
Drought:• SummerDrynessIndex
Ratioofsummergrowingdegreedaystosummerprecipitation

Three‐Map Layout
Lowest Likely Outcome Highest Likely Outcome
Multi‐Model Mean
Average Result from 20
Downscaled Global Climate
Models
Standard Deviations Below the
Multi‐Model Mean
Standard Deviations Above the
Multi‐Model Mean
Model Spread(95% of all Guidance)
Slides courtesy of the State Climate Office of NC

Time Series Plot
Summarizesmodelprojectionsforallfuturetimeslicesandemissionsscenariosatasinglelocation.
Now
End of Century
Historical(1986 to 2005) 2020 to 2039 2040 to 2059 2060 to 2079 2080 to 2099
RCP 4.5
RCP 8.5
Highest Temperature Outcome(right map)
Lowest Temperature Outcome(left map)
Slides courtesy of the State Climate Office of NC

Summer Temperature
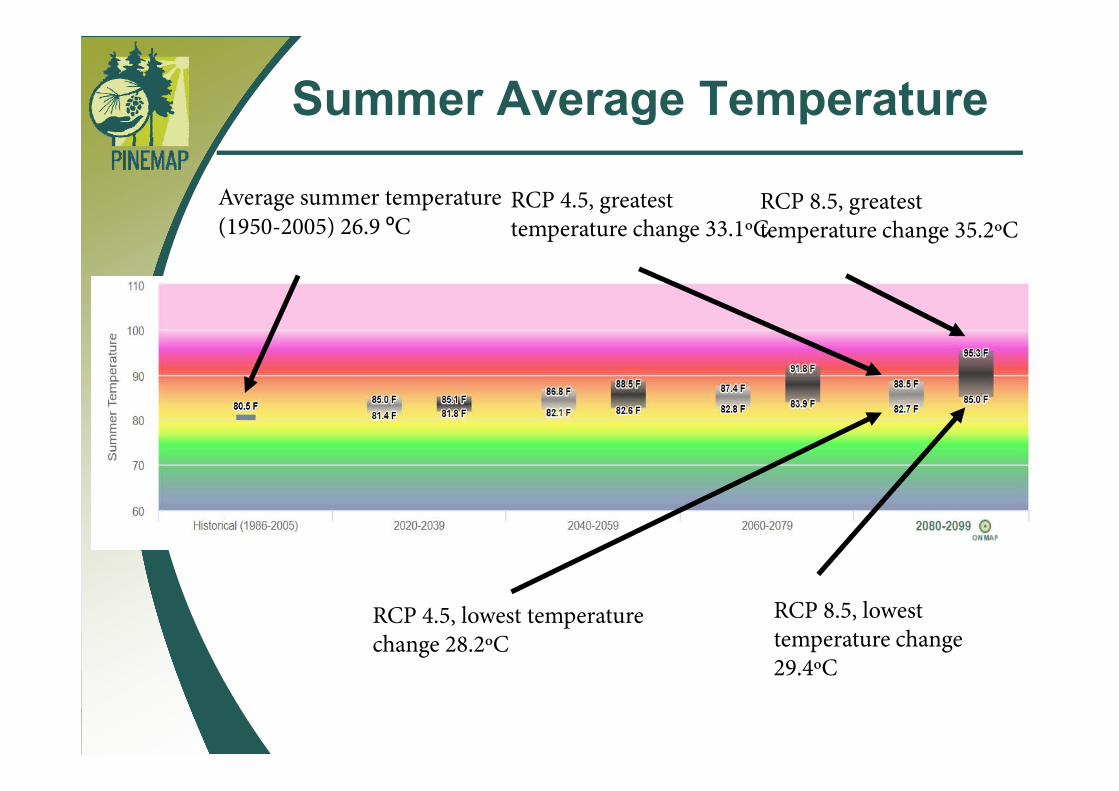
Summer Average Temperature
RCP 8.5, lowest temperature change 29.4ºC
RCP 8.5, greatest temperature change 35.2ºC
Average summer temperature (1950-2005) 26.9 ºC
RCP 4.5, lowest temperature change 28.2ºC
RCP 4.5, greatest temperature change 33.1ºC

Summer Dryness Index

Biological/Ecosystem Service Outputs of DSS
•SeedlingDeployment(DynamicHardinessZones)– Cold‐TolerantMarketsforNurseries– SourceRangesforGreaterProductivity
•NetPrimaryProduction(3‐Pg)•WateryieldandGrossEcosystemProduction(WaSSI model)–Climatedrivenchangesinyield–Currentlynotconnectedtomanagement

Deploying seedlings to the north in the future
Early Insights: Carbon
•ModelssuggestedthatCO2 fertilizationandwarmingincoldregionswillincreasecarbonsequestrationbytargeted15%amountoutto2030(Gonzalez‐Benecke2017).

Net Primary Production

Scientific Insights: Nitrogen
NitrogenCycling•BrianStrahm,TomFoxandJayRaymondhadanongoingprojectthatsuggestedslowreleaseNfertilizerscouldreduceNlossesandimproveNefficiency(Raymondetal.2016).
•Ongoingresearchisdeterminingwhetherthesefertilizersresultinincreasedproductivity.

•FertilizationdecreasesNPPsensitivitytoreducedmoisture(Willetal.2015;Maggardetal.2017)
•NetecosystemproductionwasalsoincreasedbyfertilizationbecauseofincreasedNPPandsuppressedsoilrespiration (Bracho etal.inpress).
Scientific Insights: Climate Sensitivity x Management

Questions from Dr. Clinton
•Wereprojectgoalsachieved(ornot)…?
•Whatispossibleintermsofimpactsduringandafterthelifeoftheproject?

Achievement of goals
• Developedaccessibletoolforassessingplantationproductivitypotentialthroughdata‐modelintegration.
• Reduceduncertaintyinhowclimatechangemightaffectplantationproductivity.
• NitrogencyclingresearchsuggestspathwaysforreducingNlosses.

Ongoing User Activity with DSS
• GoogleAnalyticsTrackinginteractionwithDSS
~50-75 users per month during 2017
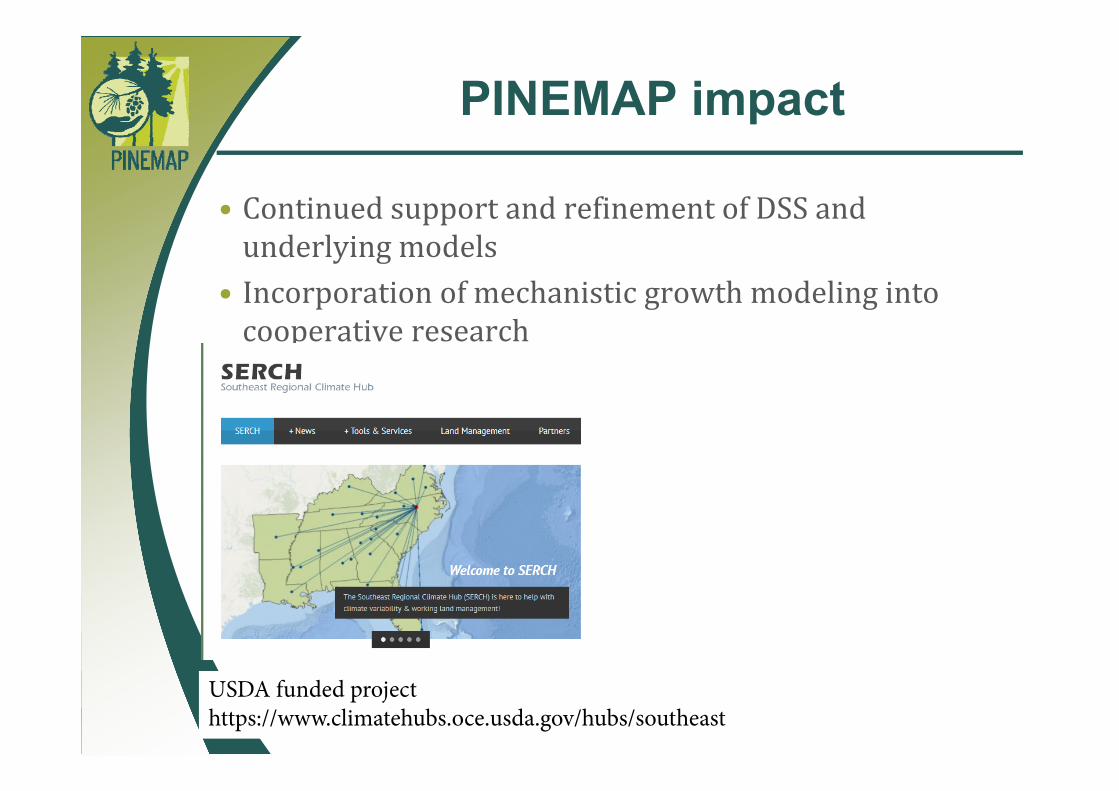
PINEMAP impact
• ContinuedsupportandrefinementofDSSandunderlyingmodels
• Incorporationofmechanisticgrowthmodelingintocooperativeresearch
USDA funded projecthttps://www.climatehubs.oce.usda.gov/hubs/southeast

PINEMAP Goals
Tocreate,synthesize,anddisseminatethenecessaryknowledgetoenablesouthernforestlandowners• toharnesspineplantationproductivitytomitigateatmosphericCO2,
• tomoreefficientlyutilizenitrogenandotherfertilizerinputs,
• andtoadapttheirforestmanagementapproachestoincreaseresilienceinthefaceofachangingclimate.

Ongoing PINEMAP Outreach
• SoutheastRegionalClimateHubwillbecentraltosupportingDSSefforts
• 30‐yearoutcomegoals,5‐yearproject
• Dataandtools• Outreachandeducationalresources
• Networkcoordination• CooperativeadvisoryboardconsistingofcoopdirectorswilladviseSERCHonoutreachneedsofcorporatecommunity
USDA funded projecthttps://www.climatehubs.oce.usda.gov/hubs/southeast

Integrative Research Focused on Outcomes
• DecisionSupportSystemdevelopment– Seeddeploymenttooldevelopment– Regionalmodelingruns:3‐PG,WaSSI,
• Regionalmeasurements:ecosystemCfluxes;sapflow;soilrespiration
• Genotypingandgenediscovery• ProjectLearningTreeeducationalmoduledevelopment• Outreach/Extension/TechTransfer– Corporate– Non‐corporate
• Integratingmodelingwitheconomicanalysis
![Imperata brasiliensis, I. cylindrica - InvasiveK115 Sand pine scrub K116 Subtropical pine forest SAF COVER TYPES [38]: 69 Sand pine 70 Longleaf pine 71 Longleaf pine-scrub oak 74 Cabbage](https://img.pdfslide.us/doc/110x75/5e50a01de48dec6cdb2ff813/imperata-brasiliensis-i-cylindrica-invasive-k115-sand-pine-scrub-k116-subtropical.jpg)