Embed Size (px)
Citation preview

Pinch analysis of Billerud Karlsborg, a partly integrated pulp and paper mill Master’s Thesis within the Sustainable Energy Systems programme
LINA ERIKSSON & SIMON HERMANSSON Department of Energy and Environment Division of Heat and Power Technology CHALMERS UNIVERSITY OF TECHNOLOGY Göteborg, Sweden 2010


MASTER’S THESIS
Pinch analysis of Billerud Karlsborg, a partly integrated pulp and paper mill
Master’s Thesis within the Sustainable Energy Systems programme
LINA ERIKSSON & SIMON HERMANSSON
SUPERVISORS
Elin Svensson
Monika Resin
EXAMINER
Thore Berntsson
Department of Energy and Environment Division of Heat and Power Technology
CHALMERS UNIVERSITY OF TECHNOLOGY
Göteborg, Sweden 2010

Pinch analysis of Billerud Karlsborg, a partly integrated pulp and paper mill
Master’s Thesis within the Sustainable Energy Systems programme LINA ERIKSSON & SIMON HERMANSSON
© LINA ERIKSSON, SIMON HERMANSSON, 2010
Department of Energy and Environment Division of Heat and Power Technology Chalmers University of Technology SE-412 96 Göteborg Sweden Telephone: + 46 (0)31-772 1000 Cover: Picture of Billerud Karlsborg pulp and paper mill. Chalmers Reproservice Göteborg, Sweden 2010

Pinch analysis of Billerud Karlsborg, a partly integrated pulp and paper mill
Master’s Thesis in the Sustainable Energy Systems programme LINA ERIKSSON & SIMON HERMANSSON Department of Energy and Environment Division of Heat and Power Technology Chalmers University of Technology
ABSTRACT
The awareness of climate change together with limited resources of fossil fuels are driving forces for energy efficiency improvements and a shift towards renewable resources. For energy intensive industry like the pulp and paper industry, the incentives are even stronger. A useful tool for identifying potential for energy savings at an existing site is pinch analysis.
Presented in this thesis is a pinch analysis of Billerud Karlsborg, a partly integrated pulp and paper mill. The plant’s potential for energy savings has been evaluated using information and data collected at the mill. The aim has been to identify the potential for energy efficiency improvements, focusing on possibilities to save steam.
The potential for energy savings at Billerud Karlsborg has been identified to 18.5 MW, which accounts for 12% of the present steam demand. Parts of this can be achieved through replacing steam with hot effluents from the bleaching and evaporation plant, when fulfilling heating demands.
Two retrofit proposals are presented, one were fewer changes are made and one which is more comprehensive. The latter is an extension of the first. In the light retrofit, 5.8 MW of steam is saved through utilization of hot effluents. The cost for this retrofit is 0.13 M€ per MW of saved steam. In the rigorous retrofit further steam savings are achieved through improvements in the hot and warm water system summing up to a total of 11 MW. The cost for this retrofit is 0.14 M€ per MW of saved steam.
Key words: Pinch analysis, partly integrated pulp and paper mill, retrofit, steam savings
I
II
En pinchanalys av Billerud Karlsborg, ett delvis integrerat pappers- och massabruk Examensarbete inom masterprogrammet Sustainable Energy Systems LINA ERIKSSON & SIMON HERMANSSON Institutionen för Energi och Miljö Avdelningen för Värmeteknik och maskinlära Chalmers tekniska högskola
SAMMANFATTNING
Ökad medvetenhet om klimatförändringar tillsammans med begränsade tillgångar på fossila bränslen, ger incitament till att öka energieffektiviteten och övergå till förnyelsebara råvaror. Detta gäller i allra högsta grad den energiintensiva industrin, dit pappers- och massaproduktion hör. Ett användbart verktyg för att identifiera potentialen för energibesparingar på en befintlig anläggning är pinchanalys.
I detta examensarbete har en pinchanalys utförts på Billeruds delvis integrerade pappers- och massabruk i Karlsborg. Energibesparingspotentialen har utvärderats med hjälp av information och data insamlad på bruket. Målet har varit att öka effektiviteten med fokus på ångbesparingar.
Potentialen för energibesparingar på Billerud Karlsborg har fastställts till 18.5 MW, vilket motsvarar 12% av dagens ånganvändning. Delar av detta kan uppnås genom att använda varmt spillvatten från blekeriet och indunstningen istället för ånga för att tillgodose värmebehov.
Två förbättringsförslag har lagts fram, ett enkelt och ett mer omfattande, där det senare bygger på det första. I det enkla förslaget kan 5.8 MW ånga sparas genom att ersätta ånganvändare med varma strömmar som idag går till avlopp. Kostnaden för denna uppgradering är 0.13 M€ per MW sparad ånga. I det mer omfattande förslaget åstadkoms ytterligare ångbesparingar genom förbättringar i het- och varmvattensystemet. Totalt sparas då 11 MW ånga. Kostnaden för denna ombyggnad är 0.14 M€ per MW sparad ånga.
Nyckelord: Pinchanalys, delvis integrerat pappers- och massabruk, ångbesparingar

Contents ABSTRACT I
SAMMANFATTNING II
CONTENTS III
PREFACE VII
NOTATIONS VIII
1 INTRODUCTION 1
1.1 Objective 1
1.2 Problem analysis 1
1.3 Method 2
1.4 Limitations 2
2 PINCH ANALYSIS 3
2.1 Theory 3
2.2 Pro PI 5
3 PULP AND PAPER PRODUCTION 7
3.1 Fibre line 7
3.2 Chemical recovery line 8
3.3 Paper production 8
4 STUDIED MILL 9
4.1 Fibre line 9
4.2 TM3, PM2 and BM1 9
4.3 Chemical recovery line 11
4.4 Steam system 12
4.5 Water system 13
5 METHODOLOGY 15
5.1 Data collection 15 5.1.1 Measurements 15 5.1.2 Other data inputs 15
5.2 Evaluation and representation of data 15 5.2.1 HWWS 16 5.2.2 TM3 and PM2 16 5.2.3 Stream representation 16 5.2.4 Analysis 17
5.3 Economic parameters 18
III

6 RESULTS 19
6.1 Production 19
6.2 Water balance 19
6.3 Heating and cooling demand 21
6.4 Pinch violations 23
7 RETROFIT SUGGESTIONS 25
7.1 Retrofit light 25
7.2 Retrofit rigorous 26
8 WAYS TO UTILIZE THE SURPLUS 33
8.1 Biorefinery 33
8.2 Low pressure turbine 33
8.3 Bark savings 33
8.4 District heating 33
9 ECONOMIC EVALUATION 35
9.1 Retrofit light 35
9.2 Retrofit rigorous 35
9.3 Bark savings 36
10 DISCUSSION 37
10.1 Observations regarding the mill 37 10.1.1 TM3 and PM2 37 10.1.2 Bleaching plant/O2 bleaching 37 10.1.3 Digester section 38 10.1.4 HWWS 38
10.2 Uncertainties/sources of error 38 10.2.1 Consequences of a changed pinch temperature 38 10.2.2 Proposals 39
11 CONCLUSIONS 41
12 FURTHER WORK 43
13 REFERENCES 45
14 APPENDIX 47
14.1 Appendix 1 – Stream data 47
14.2 Appendix 2 – Steam users 49
IV

14.3 Appendix 3 – Heat exchangers in retrofit light 50
14.4 Appendix 4- Heat exchangers in retrofit rigorous 51
V

VI

Preface In this master’s thesis a partly integrated pulp and paper mill, Billerud Karlsborg, has been studied using pinch analysis. The work has been carried out in cooperation between the Division of Heat and Power Technology at Chalmers University of Technology and Billerud. The mill is situated in the north of Sweden, just outside Kalix, and the objective has been to identify the potential for energy savings.
We would like to express our gratitude towards our examiner Thore Berntsson, our supervisor at Billerud Monika Resin, our supervisor at Chalmers Elin Svensson and our external adviser Erik Axelsson, for their useful inputs and support. We would also like to thank the entire staff at Billerud Karlsborg, their knowledge and help was essential for this work. Special thanks to Peter Carlsson for always taking time and patiently answering our numerous questions.
Once again we would like to thank Monika Resin for all the help during our time in Kalix and for taking care of us in the best possible way.
Finally, we would like to stress that the entire thesis work, ranging from data gathering to evaluation and writing, has been carried out in fruitful cooperation between the two students.
Göteborg, April 2010
Lina Eriksson and Simon Hermansson
VII

VIII
Notations A Area [m2] BM1 Karlsborg’s coating machine CC Composite curve CCW Chemically cleaned water HE Hot effluent HP High pressure steam, 60 bar HW Hot water HWWS Hot and warm water system HX Heat exchanger GCC Grand composite curve h1 Heat transfer coefficient stream 1 [kW/(m2·K)] h2 Heat transfer coefficient stream 2 [kW/(m2·K)] LP Low pressure steam, 4 bar MP Medium pressure steam, 10 bar PM2 Karlsborg’s paper machine Q Heat duty [W] RW Raw water TM3 Karlsborg’s pulp dryer U Total heat transfer coefficient [kW/(m2·K)] WW Warm water ΔTc Temperature differences on cold side [K] ΔTh Temperature differences on hot side [K] ΔTlm Logarithmic mean temperature differences [K] ΔTmin Minimum temperature difference [K]

1 Introduction Climate change and CO2 emissions are topics frequently discussed today, both by media and leading politicians. It is becoming more and more of a global issue how future energy demand is going to be met and how long the use of fossil fuels can continue. Not only are these resources limited but their emissions also contribute to the anthropogenic global warming. These issues together with increasing energy prices and security of supply are driving forces behind development of renewable energy production and improvements in energy efficiency.
Pulp and paper production is an energy intensive industry and in Sweden it stands for about 45% of the industry’s energy demand (Wadman, 2009). Extensive research aiming at improved energy efficiency and increased heat integration of the process has been done during the past decades and is still in progress. A chemical market pulp mill with optimized energy consumption could achieve a surplus of energy which can be utilized to produce electricity or to reduce the amount of fuel needed. Optimized energy consumption could hence lead to extra revenue and provide means for reducing off-site emissions. An integrated chemical pulp and paper mill needs to import energy, since the paper machine is a large consumer. However, energy savings within the mill still leads to economical savings as well as decreased environmental impact.
Billerud Karlsborg is a partly integrated pulp and paper mill situated in Kalix municipality. At the plant, pulp is manufactured using the Kraft process, which is a widely used chemical method. The annual production is 300 000 tons of pulp and paper (40% pulp and 60% paper) (Billerud, 2008). A cogeneration plant produces electricity from steam in a back-pressure turbine. The mill was first built in 1929, but the main parts which are used today were built in the early 80’s. Continuous energy improvements have been made ever since, but as new theories and research have developed it is of interest to investigate the potential for process integration and energy savings. Pinch analysis provides a good tool for this investigation and will be used at the plant for the first time. The basic concept of pinch analysis is further described in section 2.1.
1.1 Objective The main objective of this thesis is to identify potential energy savings at Billerud Karlsborg. Valuable energy can be saved in the form of steam and/or water at high temperatures. After the theoretical potential has been identified, suggestions can be made on how to reduce energy demand in practice, or alternatively, how energy at higher temperatures could be liberated. The objective also includes estimating costs for achieving energy savings in practice
Little has been written in the literature about partly integrated pulp and paper mills using the Kraft process. Therefore, another objective of this thesis is to contribute with knowledge about the energy situation in such a mill.
1.2 Problem analysis The energy analysis is carried out on a real mill, which means that a large part of the work is to gather data. To simplify the data collection it is crucial to first identify the
1

streams that are important for the analysis, namely the streams that are heat exchanged throughout the process. For these streams the parameters flow, density, heat capacity, start and target temperature need to be known. It is also vital to obtain an overview of the entire mill showing all operations and streams to understand how they are interconnected. This overview should be used to determine which streams that have certain requirements on temperature, so called hard targets. The other streams, which do not have specific requirements have so called soft targets. The hot streams with soft targets should be cooled to the lowest possible temperature, maximizing the energy output.
According to Axelsson (2006), it is generally important to keep the following in mind when collecting data:
• Distinguish between true steam users and heat demand • Distinguish between cooling demand and hot streams that could be utilized • Distinguish between process raw water demand and cooling water • Search for heat sources that are not used today
1.3 Method To fulfill the thesis objective, a literature study followed by data gathering and evaluation is done. The literature study includes pulp and paper production, the theory of pinch analysis and previous work within the thesis field. Collection of data is carried out during two stays at Billerud Karlsborg. During these stays, it is important to get familiar with the process and gather all required data. The collection is followed by an evaluation using pinch analysis, which provides information of the current energy situation. Based on the analysis, two different retrofits are proposed. Finally, the costs for increased need of heat exchanger area is quantified and compared between the different proposals. For details about data collection and evaluation, refer to chapter 5.1.
1.4 Limitations The study is carried out for a winter case and the situation during summer is of course different. In summer, the steam demand will decrease because of increased ambient temperatures. Therefore this study is not representative for the whole year.
Karlsborg’s evaporation plant was recently rebuilt with e.g. a totally integrated stripper. No investigation of further integration or upgrading of the evaporation plant is therefore carried out in this study.
When costs for heat exchangers are evaluated, piping also needs to be taken into account. Costs are not based on actual pipe lengths, but rather on rough estimates. Other costs like increased need for pump capacity are neglected.
No investigation of possible incomes through e.g. bark savings from decreased steam demand or from exporting heat to a district heating network was made. To analyse these options, more information regarding yearly variations in bark boiler, steam system and demand of heating and cooling in general are required.
2

2 Pinch analysis Performing an energy analysis of an industrial plant could intuitively feel like an overwhelming task. There are many units and streams that need to be analyzed and the work soon becomes complex. However, pinch analysis provides a methodology to systematically carry out energy analysis for both grass root design and retrofit cases.
The development of pinch analysis started in the 1970’s at ETH Zurich and Leeds University and was immediately recognized for its simplicity. Further research was done by professor Linnhoff at Manchester Institute of Science and Technology. (Kemp, 2007)
2.1 Theory This section only covers the basics of pinch theory, for further information refer to Kemp (2007), where most of the information in this section is originally from. The initial step in a pinch analysis is to identify hot and cold streams within the studied plant. Whether the stream is classified as hot or cold has nothing to do with its absolute temperature, but instead the demand of heating or cooling. Hence, hot streams need cooling and cold streams need heating. Heat capacity, flow, start and target temperatures need to be known for every stream in order to create composite curves. For each stream the required load is calculated. By merging loads in hot streams over different temperature intervals, the hot composite curve (CC) is created. Likewise the cold composite curve is a summation of the cold streams. The overlap of hot and cold composite curves represents possible heat recovery. External heating and cooling is required for the rest. An example of composite curves can be seen in Figure 1.
Figure 1. Example of composite curves, the solid line represents the cold composite curve and the dashed line the hot.
The shortest distance between hot and cold curves is decided by the minimum temperature difference (ΔTmin) allowed during heat exchange. At this point the pinch is situated. For a given ΔTmin, the possible heat recovery as well as the minimum heating and cooling duty can be found from the composite curves.
Above the pinch temperature there is a deficit of heat and below there is a surplus. Thus the pinch temperature can be characterized as the point through which there is
3

no transfer of heat. When minimizing the heating and cooling duties, there are three golden rules one should bear in mind. Breaking one of these is considered as a pinch violation and will give a non optimal energy usage. The rules are as follows:
• Do not cool above the pinch • Do not heat below the pinch • Do not transfer heat across the pinch
Cooling above the pinch will lead to an increase in the requirement of hot utility, just like heating below the pinch will lead to an increase of cold utility. Transferring heat through the pinch will increase the demand for both hot and cold utility. In Figure 2 the situation is illustrated.
Figure 2. Illustration of possible pinch violations.
Another way to represent the heating and cooling demand is to merge the hot and cold composite curves into one, the grand composite curve (GCC). In this curve the temperatures are adjusted into shifted temperatures, which mean that hot streams are lowered with ΔTmin/2 and cold streams lifted with ΔTmin/2. An advantage with the GCC is that it shows at what temperature the heating and cooling demands occur. This means that it is easier to find possibilities for heat integration and use of waste heat. In Figure 3 an example of a GCC is shown.
4

Figure 3. Example of a grand composite curve.
In a retrofit situation it is convenient to compare minimum hot and cold duties with actual values to get an estimate for the potential energy savings. By identifying and eliminating pinch violations in the current heat exchanger network, the actual duty can be lowered. If all violations are eliminated, a maximum energy recovery network is established. However this is seldom economically feasible since it requires a lot of piping and new heat exchanger area.
2.2 Pro PI A useful tool when carrying out a pinch analysis is the software Pro PI, an add-in for Microsoft Excel developed by Chalmers Industriteknik AB. The program easily creates composite and grand composite curves from stream data. It also provides the minimum hot and cold utility as well as the pinch temperature. In addition, Pro PI can be used to design heat exchanger networks and find pinch violations in existing network designs.
5

6

3 Pulp and paper production Production of pulp and paper consists of several steps. Different techniques are used and a first sub division of mills can be done based on whether mechanical, thermo-mechanical or chemical means are used to process tree fibres. Since Billerud Karlsborg is a chemical mill using the Kraft process, this technique will be described in the following section.
In the Kraft process a mixture of sodium hydroxide and sodium sulfide (together called white liquor) is used to delignify the cellulose. The main steps in the process are wood chipping, digestion, bleaching, evaporation and recovery of chemicals. A schematic overview of the process is shown in Figure 4.
Figure 4. A general overview of a Kraft process. Solid lines represent the fibre line and dashed lines represent the recovery cycle.
3.1 Fibre line The equipments for processing wood into pulp are together called the fibre line. In a drum, the logs are debarked by mechanical means. Bark is separated and used as fuel in a bark boiler, which produce high pressure steam. The next step is to chip the logs into wood chips, which in turn are preheated to remove air in the first digester section. During the impregnation step, the chips are mixed with white liquor. Subsequent delignification occurs in the cooking step where the reactions mainly occur. Finally the pressure in the digester is lowered, which leads to rapid evaporation and hence a pressure increase. The fibres are hereby depolymerized and lignin mixed with used cooking chemicals (together called black liquor) are removed in several washing steps. In the screening process, the pulp is separated from knots and incompletely cooked fibres. (Theliander, 2001)
In order to decrease the remaining lignin content, the pulp is prebleached with oxygen. After this a number of bleaching steps follow with e.g. hydrogen peroxide, chlorine dioxide and caustic soda. In a pulp mill, the pulp is dried and exported to a paper mill while in an integrated mill, it is pumped to storage and used to produce paper onsite. (Theliander, 2001)
7

3.2 Chemical recovery line The black liquor leaving the fibre line has a high water content, which has to be lowered in a multistage evaporator before combustion. Condensates from the evaporator effects are transferred to a stripper for cleaning. The combustion of highly concentrated black liquor is carried out in a recovery boiler, which produces high pressure steam. In the bottom of the recovery boiler, the chemicals from the black liquor form a smelt. The smelt is dissolved in weak white liquor giving a mixture called green liquor, which is mixed with calcium hydroxide to regenerate white liquor in the causticization step. In the reaction, calcium carbonate is formed and this is brought to the lime kiln where calcium hydroxide is regenerated. (Theliander, 2001)
3.3 Paper production A paper machine consists of three different sections - wet end, press section and dry end. At the wet end, pulp is diluted with water before it is distributed via the head box onto a woven wire mesh, which moves on a continuous belt. Water is drained from the pulp resulting in a dry content of about 20% at the end of the belt. The dry content is further increased to 35-50% in the press section, where rollers are used to remove water. In the subsequent dry end, steam heated cylinders are usually used to obtain a final dry content of 90-95%. (Persson, 1996)
When water is drained off the pulp, the fibres are forced together and hydrogen bonds are formed. How close the fibres are brought together influence the number of hydrogen bonds that can be formed and hence the strength of the paper (Persson, 1996).
8

4 Studied mill Billerud Karlsborg is a partly integrated pulp and paper mill situated outside Kalix in northern Sweden. The mill dates back to the beginning of the 20:th century and today it consists of a pulp line, a paper machine, a coating machine and a drying machine for market pulp. Karlsborg is one of Europe’s leading suppliers of white sack paper, but white kraft paper and bleached long fibre sulphate pulp are also produced. The annual production capacity is 170 000 tons of market pulp and 130 000 tons of kraft and sack paper. (Billerud, 2008)
4.1 Fibre line The raw material used is primarily softwood which is chipped in the wood room. Prior to chipping the logs are sprayed with warm water in order to remove dirt and ice and to facilitate the subsequent debarking. This water together with water used to remove gravel and stones, run in a closed loop within the wood room. It is heated by water from the hot water tank to about 35˚C. Bark is collected from the debarking step and after the following drying process, it is used as fuel in the bark boiler.
In the digester section the wood chips are boiled in eight batch boilers. The digesting cycle consist of chip filling, liquor filling, heating, liquor change, cooling and bottom blowing. The cooking liquor is a mixture of white liquor, which has been preheated with steam, and black liquor from an accumulator. After the digester has been filled with chips and liquor, the batch is heated to about 170˚C through circulation of liquor in a steam heated heat exchanger. The batch is held at this temperature for a specified time before the cooking liquor is changed and displaced with weaker liquor. Cooling of the batch is established with cooling liquor which displaces the weak liquor. The displaced liquors, both from cooking and liquor change, are cooled prior to storage and the major parts are sent to the evaporation plant. However, some of the liquor is reused directly in the digesting cycle. Since the eight digesters operate in different stages of the cooking cycle at a given time, many of the heat exchangers in this section work in a discontinuous manner.
After digesting, the pulp is strained and washed in several steps before it is prebleached with oxygen and bleached in the sequence OD(EPO)(DE)D. In the bleaching plant hot water is used for washing and heating in between the bleaching steps. From this section there are a number of different hot effluents that are sent to drain. (Hoffner, 2008)
4.2 TM3, PM2 and BM1 Pulp is stored and sent either to the paper machine (PM2) or the pulp dryer (TM3). At present around 40% of the pulp is used to produce paper while the rest is dried and exported. The pulp dryer normally uses low pressure (LP) steam but at higher production speed, medium pressure (MP) steam must be used. For this study, only LP steam has been considered. Heat in the wet air leaving the dryer is recovered in three steps. In the first step (1) heat is transferred from air leaving the dryer to air going into it. After this the wet air heats circulation water (2) used in the ventilation of the machine hall and in the third step it heats chemically cleaned water (CCW) used as spray water (3). The circulation water is heated further with steam (4) before heating
9

incoming air (5). Air going to the middle-roof is also heated with steam (6). This is done in order to obtain a temperature of the roof that is high enough to avoid condensation. A schematic overview of the heat recovery system in the pulp drier is shown in Figure 5. (Carlsson, 2010)
Figure 5. The pulp dryer’s wet air heat recovery system.
In the paper mill there is a paper machine which produces bleached sack and kraft paper. There is also a coating machine (BM1) which is used both for paper produced internally and externally. The paper machine has 54 drying cylinders which uses LP steam. Wet air leaving the paper machine heats ingoing air to the dryer (1) and air going into the machine hall (2). During winter, steam batteries are used as a complement to heat the fresh air (3). Preheated air is mixed with fresh air in an intake air unit (4) giving a mixture at 20˚C, which enters the machine hall. Air going into the dryer is heated further with steam (5) to obtain the required temperature. In Figure 6 an overview of the air system in the paper mill can be seen. (Persson, 2010)
10

Figure 6. The paper mill’s wet air heat recovery system.
4.3 Chemical recovery line The evaporation plant consists of seven effects and it was rebuilt in 2003. Steam from the last effect is used for warm water production in five surface condensers. Condensates leaving the surface condensers as well as condensate leaving the sixth effect are hot effluents that are sent to drain. Dirty condensate from digesting and evaporation are stripped in an integrated stripper. Volatile gases are hereby separated and later burnt in a separate boiler for destruction. The condensate is sent to drain.
The highly concentrated black liquor is burnt in a recovery boiler, which is primarily a chemical reactor. The recovery boiler produces steam and plays an important role in the hot and warm water system through the production of warm water in the scrubber and smelt dissolver. The later is in addition used for heating boiler make up water.
From the evaporation plant, soaps are extracted and acidified into tall oil. By an external company tall oil is further converted into beck oil, which is used to fire the lime kiln. Fuel oil is used as back-up in case of low levels of beck oil. (Hoffner, 2010)
11

4.4 Steam system The steam network is divided into three levels:
• High pressure steam 60 bar • Medium pressure steam 10 bar • Low pressure steam 4 bar
High pressure (HP) steam is produced in a recovery boiler and a combined bark and oil boiler. The recovery boiler is designed for a HP steam production of about 180 MW. It cannot handle rapid changes in steam demand and is therefore run as a base load. The process steam demand varies with season but also on an hourly basis due to the batch-wise digesters. An accumulator can handle some of the instant changes but the rest needs to be covered by the combined bark and oil boiler. This boiler can manage rapid changes in steam output and it has a production capacity of about 100 MW if fired with oil solely or 60 MW if fired with bark. It is possible to co-fire bark and oil, but only at certain ratios. It is desirable to fire with bark, which partly needs to be purchased externally to meet the present demand. Because of the inflexibility of the recovery boiler, the combined boiler has to run on at least the minimum load 20 MW even during summer, which often results in an overproduction of steam. During winter oil must be used to a larger extent to cover the heat demand, but there is no overproduction of steam. (Hoffner, 2010)
The recovery boiler is equipped with a scrubber that cools the outgoing flue gases, whereas the combined bark and oil boiler is not. In addition to these two boilers, there is a destruction boiler fired with the stripped off volatile gases producing about 3-5 t/h of MP steam. (Brännström, 2010)
About 90% of the plant’s total energy demand is covered by bark and black liquor (Billerud, 2008). In 2006 a new back-pressure turbine of 40 MW was installed which at present is delivering some 30 MW of power. The produced electricity covers about 65% of the mill´s total electricity demand. From the turbine steam can be extracted at 30, 10 or 4 bar. The 30 bar system is used for accumulating steam that could be used for loading the 10 or 4 bar steam boxes. There are also letdown valves to reduce the pressure from 60 bar to either 30, 10 or 4 bar. In order to get rid of excess steam, a dump condenser and atmospheric vents are available on the 4 bar system. In Figure 7, an overview of the steam system is shown. (Brännström, 2010)
The steam users divided per section is available in Appendix 2.
12

Figure 7. Illustration of the steam system at Billerud Karlsborg.
4.5 Water system Within the plant, water is used for many purposes - cooling, heating, washing, dilution and transportation. The water is taken from the nearby situated Kalix River and the inlet temperature varies considerably with the season. The water is treated in two steps before it is used, mechanical cleaning followed by chemical cleaning. Only boiler make-up water and water used in pulp and paper dryers are cleaned in both steps.
In the hot and warm water system (HWWS) there are two tanks. During winter the warm water tank is held at 48˚C and the hot water tank at 68˚C. Utility steam is not used for heating water in the HWWS, since process streams cooling demand is sufficient to keep up the temperatures. The main producers of warm water are the surface condensers in the evaporation plant and the scrubber in the recovery boiler. Warm water is used in the bleaching plant, but the largest part of it is used for producing hot water. The main source for producing hot water is cooling of liquor and blow steam condensate. The hot water is used in the bleaching plant, the wood yard and the washing section.
Besides the warm and hot water system there is one system for makeup water and one for the chemically cleaned water used in the pulp and paper dryers. An overview of the water cleaning at Billerud Karlsborg can be seen in Figure 8. (Wikström, 2009)
13

Figure 8. The water cleaning system at Billerud Karlsborg including raw water, chemically cleaned water and boiler makeup water.
14

5 Methodology A large part of the work has been to collect data to investigate the existing situation at the mill. The main data collection was carried out during two stays at Billerud Karlsborg. After gaining an overview of the mill, streams of importance were identified and used as a basis for a pinch analysis and further evaluation.
5.1 Data collection The studied time period was 20th–28th of February 2009 and could hence be characterized as a winter case. This period was chosen since it has a rather stable production of both pulp and paper. Also, previous energy studies at the mill have used data from this period. At Karlsborg, continuously measured data is stored in an information system, which is connected to the user interface Aspen Process Explorer. Through this software, data was exported to Microsoft Excel. For a given measured value, variations over the studied period were investigated. If the variations were acceptable, daily average values were used for the analysis. However in the digester section many measurements varied a lot over time due to the batch-wise digestion. For simplicity, the heat exchangers in question were modelled as continuous with the average heating demand as the discontinuous ones.
5.1.1 Measurements Some of the required data was not continuously measured or possible to find through mass- or heat balances. Therefore it was necessary to perform measurements onsite. Since temperatures are easier and more time-efficient to measure than flows, these measurements were preferred. All data was measured between the 11th and 22nd of January 2010 under as close to normal conditions as possible. Temperatures inside pipes were measured with an IR thermometer called Optris MiniSightPlus. For stack temperatures, a thermometer called Testo 925 was used. All flows were measured with an ultrasound portable liquid flowmeter named GE Panametrics PT878.
5.1.2 Other data inputs It was not possible to find all the missing data through measurements. In these cases specifications from drawings, printouts from the controller screens, internal reports and estimations from engineers onsite were used.
5.2 Evaluation and representation of data Temperatures and flows for both sides of each heat exchanger were found, using available data in mass and heat balances. In case of non-consistency between data, a judgement of reliability had to be done.
15

5.2.1 HWWS For the hot and warm water system, a balance was created based on previous work by Larsson (2008) at ÅF. His model was updated with gathered data and theoretical temperatures in the hot and warm water tank were obtained. These temperatures were used in the pinch analysis to represent the process demand for warm and hot water.
5.2.2 TM3 and PM2 In the paper machine and pulp dryer, continuous measurements on flows and temperatures of air were scarce. Since some of the existing measurements were not reliable, specified design values were used to a large extent in the analysis. In the pulp dryer some temperatures were taken from the controller screen and used together with heat exchanger duties in heat balances to obtain the rest of the required information.
5.2.3 Stream representation From gathered information, stream data for the pinch analysis was extracted. The streams used within the analysis can be seen in Appendix 1. Some streams could be lumped together instead of being separate. One example is the production of hot and warm water, which was represented as just two cold streams. This was done in order to model the actual demand and not the present way of fulfilling it. The process cooling demand, which is provided by the hot and warm water production, is represented by individual hot streams.
Hard targets on temperatures were identified and soft targets were adjusted to maximize energy output. One example of a soft target is the exit temperature of hot effluents, such as waste water going to drain. For these streams the target temperature is not fixed to a certain value and can therefore be chosen more freely. For the analysis 37˚C was used as target temperature of the hot effluents to give a rough estimation of the heat they contain. The calculated cooling demand is however not a true demand, but rather a potential heat source. The hot effluents with their duty can be seen in Table 5.
As mentioned in section 2.1, it is convenient to work with shifted temperatures in pinch analysis. Depending on the fluid, streams are assigned individual minimum allowed temperature differences (ΔTmin), which are used to obtain shifted temperatures. In this work, values for ΔTmin as well as heat transfer coefficients (h) were assigned in accordance with previous studies (Axelsson, 2008) and are shown in Table 1.
16

Table 1. Minimum temperature difference and heat transfer coefficients for different fluids.
Fluid ΔTmin/2 h K kW/(m2·K)Clean water 2.5 3 Contaminated water 3.5 1 Live steam 0.5 8 Contaminated steam 2 6 Steam with NCG* 4 4 Air 8 0.1
* Non-condensable gases
For all steam users it was investigated whether it was possible to replace the steam with other means of heating. When a replacement was impossible the demand was represented as a cold stream at the steam condensation temperature instead of at the temperature where the demand actually occurs. This was done to clearly distinguish true steam users from the rest of the heating demand. One example where steam is irreplaceable is in the boiler make up water system. Parts of the heating need to be done with steam to keep the right pressure in the tank and to regulate the solubility of carbon dioxide and oxygen in the water. The discontinuous heaters were also represented as true steam users since it is hard to achieve the same heating with other means.
Some steam users have been excluded from the analysis all together, like steam for soot and bottom blowing the boilers. The dump condenser and the atmospheric vents were also excluded because this usage is unwanted. For a detailed overview of the steam users, see Appendix 2.
For simplicity, the scrubber of the recovery boiler has been excluded from the analysis since the present situation was accepted without changes. In discussion with Billerud Karlsborg it was decided to not investigate a scrubber in the bark boiler (Bränström, 2010).
5.2.4 Analysis From stream data, the process composite curve was obtained. At the point with the minimum temperature difference, the pinch temperature was situated. When identifying pinch violations, temperatures of streams entering and leaving each heat exchanger were compared to the pinch temperature. In order to do this for all heat exchangers, the HWWS balance was needed. Heating above and cooling below the pinch are violations as well as transferring heat from one side of the pinch to the other.
Heat exchangers that are not pinch violations in themselves can lead to increased steam demand due to an unnecessarily high temperature difference between streams. A useful tool for identifying such heat exchangers is the composite curves. The hot composite curve shows the highest temperature at which the process can supply heat. Steam savings can be identified since steam used below this temperature is replaceable with internal heat exchange.
17

Based on the analysis of pinch violations and the composite curves, two retrofit suggestions were created. Each retrofit includes steam savings potential as well as an economic evaluation.
5.3 Economic parameters Costs of the retrofit options were calculated based on the needed heat exchanger area. This area was found using equation (1)-(3) with the duty (Q), the logarithmic mean temperature differences between streams being heat exchanged (ΔTlm) and their individual heat transfer coefficients (h1 2). (Sinnott, 2009) ,h
1 1 1
∆∆ ∆
l ∆
(1)
n ∆ (2)
∆ (3)
In some heat exchangers it was possible to extend an existing area, but for most of them a completely new unit was required. The existing heat exchanger area was calculated with the same equations and hence not based on specifications. The influence of changes in flows through the existing heat exchanger was neglected. Costs of equipment were taken from previous studies (Persson, 2009) of similar mills and are shown in Table 2.
The cost of piping was roughly calculated, without known distances, since the scope of this study was to give an estimation of the cost. It was assumed that the piping would cost 50% of the heat exchanger cost in accordance with recent studies. (Axelsson, 2006)
Table 2. Costs of building new and extended heat exchangers.
Type Heat exchanger cost Area cost € (base cost) €/m2 New water/water 38014 369 steam/water 38014 380 Extended water/water 9503 369 steam/water 9503 380
18

6 Results In this section an overview of the present energy situation at the mill is presented. Heat exchange which lead to a non-optimal energy usage, so called pinch violations, are also listed.
6.1 Production The average production for the paper machine, pulp dryer and coating machine is presented in Table 3. For the studied period, the relation between produced pulp and paper is 45% / 55%.
Table 3. Average production 20th–28th of February 2009 for the mill’s different units.
Production ton/24h
PM2 374 TM3 453 BM1 66
6.2 Water balance The current balance of hot and warm water production can be seen in Figure 9. Flows and temperatures are shown for all streams and heat duty for all heat exchangers. Temperatures obtained from the balance were used as input to stream data and when identifying pinch violations. It is worth noting that the production of hot and warm water is entirely covered by the cooling demand of hot streams, thus no live steam is used. Water is also used as hot streams for producing CCW in three different heat exchangers. This will of course result in lower temperatures in both hot and warm water tanks. The balanced temperatures in these are 69˚C and 51˚C, respectively. As mentioned in section 4.3, these temperatures should be 68˚C and 48˚C according to measurements. The differences are explained by the fact that heat losses have not been taken into account.
19

Figu
re 9
. Hot
and
war
m w
ater
bal
ance
for B
iller
ud K
arls
borg
.
20

6.3 Heating and cooling demand Within the mill there are a large number of heat exchangers that supply heating or cooling to process streams. From gathered information, the identified heating and cooling demand have been represented as hot and cold streams with start and target temperatures. These streams are summarized in Appendix 1 and in total there are 27 cold and 35 hot streams.
The process pinch temperature is 148˚C, when streams are assigned the ΔTmin given in Table 1. This means that the mill in total has a deficit of heat above 148˚C and a surplus below. Hence, it is necessary to add heat above the pinch and the theoretical minimum heat needed is referred to as the minimum hot utility. Below the pinch, the minimum need for cooling is called the minimum cold utility. The results are summarized in Table 4.
Table 4. Results from the pinch analysis.
Pinch temperature 148˚C Minimum hot utility 135.4 MW Minimum cold utility 49.7 MW
The minimum cold utility is overestimated, since some of the hot streams target temperatures are soft targets. This implies that they in fact do not need to be cooled to this extent. In total the way these streams have been represented give an extra requirement for cooling of 52.2 MW. The extra cooling should be seen more like a potential heat source than a cooling demand. It is not obvious how this addition influences the minimum cold utility. It depends on to what degree cooling demands can be covered by requirements for heating. The hot streams, also known as hot effluents, are shown in Table 5 together with their duty.
Table 5. The hot effluents with their duty.
Stream Tstart Ttarget Q # Name °C °C MW H3 Condensate from stripper* 91 37 5.9 H11 Strain reject 47 37 0.3 H12 Spillway overflow 48 37 1.3 H13 Washing effluent 47 37 0.3 H14 Effluent D0 63 37 28.6 H15 Effluent EOP 55 37 5.2 H16 Effluent bleaching plant 56 37 1.5 H17 Effluent bleaching plant 50 37 0.6 H22 B-Condensate 76 37 4.3 H23 C-Condensate 61 37 4.2 Total 52.2
* This stream is first heat exchanged with ingoing condensate to stripper and then sent to drain at 91°C.
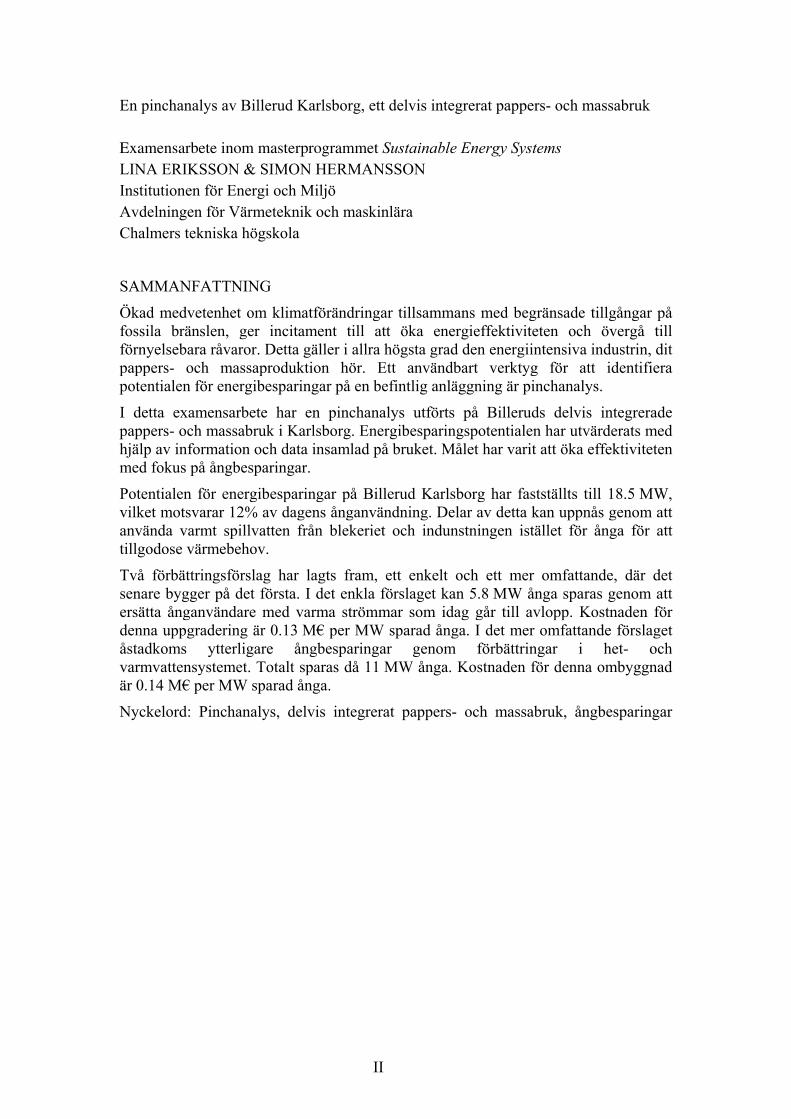
In the composite curves, shown in Figure 10, the pinch is situated at the minimum temperature difference between the curves. The levels of 4 and 10 bar steam as well as the surface condensers are shown in the figure. The internal heat exchange is illustrated by the overlap of the hot and cold curve. However it is not possible to make
21
use of internal heat exchange above the temperature of LP steam since the cold streams at this temperature have to be heated with steam for different reasons.
In a theoretical case with optimal heat exchange between the curves, the hot curve should be able to provide all heat except for the process steam demand. Achieving this for a retrofit design would require far too many new heat exchangers than what is profitable.
Figure 10. Composite curves for the process.
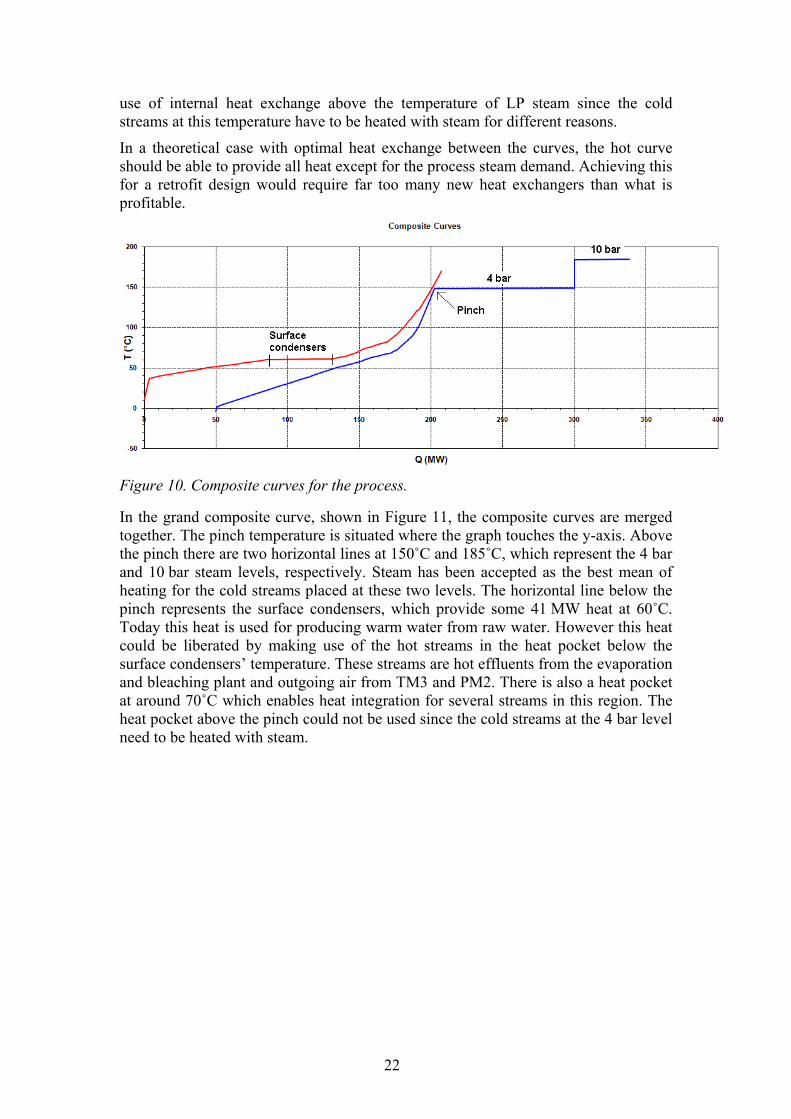
In the grand composite curve, shown in Figure 11, the composite curves are merged together. The pinch temperature is situated where the graph touches the y-axis. Above the pinch there are two horizontal lines at 150˚C and 185˚C, which represent the 4 bar and 10 bar steam levels, respectively. Steam has been accepted as the best mean of heating for the cold streams placed at these two levels. The horizontal line below the pinch represents the surface condensers, which provide some 41 MW heat at 60˚C. Today this heat is used for producing warm water from raw water. However this heat could be liberated by making use of the hot streams in the heat pocket below the surface condensers’ temperature. These streams are hot effluents from the evaporation and bleaching plant and outgoing air from TM3 and PM2. There is also a heat pocket at around 70˚C which enables heat integration for several streams in this region. The heat pocket above the pinch could not be used since the cold streams at the 4 bar level need to be heated with steam.
22

Figure 11. Grand composite curve for the process.
6.4 Pinch violations In the existing heat exchanger network the heating and cooling demand is larger than what the process requires as a minimum. The difference between the present steam demand and the minimum demand for hot utility is due to pinch violations i.e. non optimal heat exchange. Table 6 shows the minimum hot utility, actual steam demand and resulting pinch violations for the plant. Through finding and solving these violations it is possible to achieve steam savings adding up to 12% of the present steam demand. Since the savings are within the range of the bark boilers maximum and minimum load (60-20 MW) it would be possible to achieve the entire steam savings. However it is not possible to achieve these steam savings during the summer half-year, since the bark boiler must run on at least minimum load.
Table 6. Theoretic potential for steam savings.
Present steam demand 153.9 MW Minimum hot utility 135.4 MW Pinch violations 18.5 MW
Heating above and cooling below the pinch are violations as well as transferring heat from one side of the pinch to the other. When identifying pinch violations the temperatures of streams entering and leaving each heat exchanger were compared to the pinch temperature. Both sides of all heat exchangers must be completely known. The pinch violations are presented in Table 7. All violations are because of heating below the pinch.
23

Table 7. List of identified pinch violations.
Hot Stream Cold Stream Reason Q # Name # Name MW LP Steam 4 bar C1 E1 filtrate Heating below 1.6 LP Steam 4 bar C2 E2 filtrate Heating below 1.0 LP Steam 4 bar C3 E2 filtrate Heating below 1.3 LP Steam 4 bar C4 D0 filtrate Heating below 2.6 LP Steam 4 bar C6 White water for TM3 & PM2 Heating below 2.1 LP Steam 4 bar C14 Local heating - TM3 Heating below 1.2 LP Steam 4 bar C15 Local heating Heating below 1.0 LP Steam 4 bar C16 Local heating Heating below 2.5 LP Steam 4 bar C19 White water for PM2 Heating below 1.8 LP Steam 4 bar C24 Air to ceiling - TM3 Heating below 1.1 LP Steam 4 bar C26 Air to machine hall - PM2 Heating below 0.6 LP Steam 4 bar C27 Air to dryer - PM2 Heating below 1.6 Total 18.5
24

7 Retrofit suggestions When doing a retrofit of an existing heat exchanger network, it is not feasible to eliminate all pinch violations since it would become too costly. Instead the cost of the changes must be evaluated on basis of the savings they achieve.
In this section two retrofit proposals are presented, one with smaller changes (retrofit light) and one which is more extensive (retrofit rigorous). Both of them focus on eliminating steam users below the pinch temperature. This could be achieved through making use of drains at high temperatures or by heat exchanging streams differently in the network. One major difference between the proposals is that the light retrofit only focuses on steam users that do not affect the HWWS, while the rigorous proposal involves this part as well.
No changes were made in the heat recovery system in TM3 and PM2 due to problems in finding reliable data. Estimating savings based on this data would not be fair and therefore only a discussion was done for these parts, see section 10.1.
7.1 Retrofit light In the light retrofit, the main focus has been to save as much steam as possible without interfering with the HWWS. When one starts to make changes in the HWWS it soon becomes complicated and the aim with the light proposal is to make simple changes. Four of the pinch violations in Table 7 were possible to replace under these restrictions. This retrofit will result in steam savings of 5.8 MW, which is 4% of the present steam demand and 32% of the pinch violations. In Table 8 the streams together with their new paired hot stream and the resulting steam savings are presented.
Table 8. Steam savings in retrofit light.
Cold stream New hot stream Steam saved # Name # Name MW C2 E2 filtrate H3 Condensate f stripper 1.0 C3 E2 filtrate H3 Condensate f stripper 1.3 C6 White water for TM3 & PM2 H22 B condensate 2.1 C19 White water for PM2* H18 Condensate cooling TM3 1.5 Total 5.8
* 0.4 MW of steam is still needed.
In this proposal the heating of some cold streams with steam are replaced with cooling of condensate and hot effluents from the evaporation plant. From the latter, both condensate from stripper and B-condensate are currently sent to drain and these are streams with soft temperature targets. Figure 12 illustrates the way the cold streams are heated in the existing network and Figure 13 displays the retrofit proposal. The yellow boxes illustrate LP steam heaters and the grey boxes liquid/liquid heat exchangers.
25

Figure 12. Part of the existing heat exchanger network which is affected by retrofit light.
Figure 13. The new heat exchanger network in retrofit light.
The proposed new heat exchangers are all of water/water type. One heater is needed to be kept for top heating. The changes made in the heat exchanger network are described in detail in Appendix 3.
The replacement of steam with condensate in production of white water for PM2 will require a new mean for heating CCW in TM3. Hence, these changes are coupled and could not be carried out separately.
7.2 Retrofit rigorous The rigorous retrofit suggests improvements that save more energy than the light one. The changes from the light case are incorporated in the rigorous case, but steam savings that affect the HWWS are also included. Heat is extracted from the HWWS when steam users are replaced and this loss has to be compensated by other means of heating. The replaced steam users are shown in Table 9. In total it is possible to save approximately twice as much steam as in the light case, about 11 MW. This corresponds to 7% of the present steam demand and 60% of the pinch violations.
26

Table 9. Steam savings in retrofit rigorous.
Cold stream New hot stream Steam saved # Name # Name MW C1 E1 filtrate H1 Liquor cooling 1.6 C2 E2 filtrate H3 Condensate f stripper 1.0 C3 E2 filtrate H3 Condensate f stripper 1.3 C4 D0 filtrate HW Hot water 2.6 C6 White water for TM3 & PM2 H22 B condensate 2.1 C15 Local heating H6 Digester liquor 1.0 C19 White water for PM2* H18 Condensate cooling TM3 1.5 Total 11.0
* 0.4 MW of steam is still needed.
On top of the changes made in the light proposal, seven additional units are modified or built. These changes enable steam savings by establishing a network where internal heat exchange is utilized to a greater extent. This is accomplished through a decrease in temperature differences in the heat exchangers.
The rigorous retrofit makes use of a D0 effluent with soft temperature target in the bleaching plant which currently is sent to drain. Heat from cooling three different liquors is used for better heat integration. The existing network affected by this proposal is shown in Figure 14 and an illustration of the changes is presented in Figure 15. For detailed descriptions of the new heat exchangers, refer to Appendix 4. The water streams are shown
27

Figure 14. Part of the existing heat exchanger network which is affected by retrofit rigorous.
28

Figure 15. The new heat exchanger network in retrofit rigorous.
When replacing a heat exchanger in the HWWS it is important that the new network still can achieve the same temperatures in the hot and warm water tank. For this reason, some of the heat exchangers in the rigorous proposal depend on each other and should not be modified independently. The new HWWS is shown in Figure 16.
29

30
Figu
re 1
6. R
etro
fitte
d ho
t and
war
m w
ater
bal
ance
for B
iller
ud K
arls
borg
.

During the study of the HWWS it was investigated whether it was possible to extract more heat from the digester liquor before it enters in the system, see Figure 17. This is of interest since it could lead to further possibilities for heat integration. Given that temperatures of the boiler make up water are fixed in the subsequent heat exchanger 1226, a minimum temperature of the intermediate water stream is obtained (93°C). The temperature lift from 51°C to 93°C requires that 8.5 MW is exchanged in liquor cooler 1147. The temperature of the cooled liquor is a hard target and thus, the inlet temperature must be at least 119°C. However this is the limiting case and in the proposal this temperature is slightly higher. Therefore it would be possible to extract more heat at high temperature, which could partly cover other steam demands like district heating. This option has not been investigated, but instead the available heat is used for hot water production. To release more heat from the digester liquor prior to cooling, an option would be to preheat the warm water by other means. This would have lowered the required duty in 1147 and hence the inlet digester liquor. This alternative was not investigated since it most likely requires too many new units to be profitable.
Figure 17. The part of HWWS where liquor cooler 1147 is heat exchanged with warm water and the subsequent heat exchanger 1226.
31

32

8 Ways to utilize the surplus The main focus in this study has been to accomplish energy savings and not to find the best way to utilize a potential surplus. There is however several different options which could be interesting. These will be discussed briefly in this section and the option of district heating will be given some extra attention.
8.1 Biorefinery One option which has not been mentioned in this study is biorefinery. This is an umbrella term for simultaneous production of refined products using biomass as raw material. The steam and/or heat surplus from the pulp and paper production could be utilized within this production, thereby improving the energy efficiency and the new products can give an extra source of income.
8.2 Low pressure turbine Another alternative is to build a low pressure turbine which can produce electricity from the excess of LP steam. To be able to evaluate this option, it would be necessary to investigate the steam savings potential in a summer case.
8.3 Bark savings Instead of utilizing the steam surplus, one could decrease the steam production and thereby save oil and bark. During summer the possibility to save steam is limited since the bark boiler has to run at least on its minimum load. The influence decreased steam production would have on the steam system in general and bark boiler in particular would need to be analysed further.
8.4 District heating Instead of making changes that save steam in the existing system, an option would be to liberate hot streams and use them to produce district heating. For this option no calculations have been done, instead it is discussed on a conceptual level.
The easiest way to obtain hot streams is to utilize hot effluents like condensate from the evaporation and bleaching plant. The available hot effluents are listed in Table 5. However with these streams it would be necessary to heat with additional steam in order to reach the required temperature.
In the HWWS there is one hot stream which could provide enough heat to produce district heating without need for additional steam. This is the liquor which is cooled in heat exchanger 1147. However the water which provides this cooling is used for heating purposes in the subsequent heat exchanger 1226 which gives restrictions. The situation is described in section 7.2, page 31. If the hot liquor was replaced with a hot effluent, the water would not reach a high enough temperature and steam would have to be used here, jeopardizing the benefits of the change.
33

Implementing one of the proposals does not mean that the concept of district heating not could be used. Of course the steam surplus could be used to supply heat directly to a district heating network. This option gives more flexibility compared to heat exchanging district heating direct with process streams.
34

9 Economic evaluation Both proposals were evaluated in economic terms and the costs were based on the increased need for heat exchanger area. Finally the costs are put in a relation to an example with bark savings.
9.1 Retrofit light For the retrofit light option it is possible to make use of one existing heat exchanger. The others are built with condensing steam as heating medium and could therefore not be utilized. Costs for new heat exchangers, costs including piping and costs per unit saved steam are shown in Table 10. The total cost with piping included is 759 000 € and the resulting cost per saved steam is 130 000 €/MW.
Table 10. Costs for implementing the retrofit light proposal.
Streams
Area needed
Existing area
Heat exchanger cost
Cost with piping
Cost per MW steam
# # m2 m2 €·105 €·105 €·105/MW C2 H3 161 0.97 1.46 1.49 C3 H3 281 1.42 2.12 1.62 C6 H22 346 1.66 2.49 1.19 C11 H22 105 0.77 1.15 C19 H18 63 22 0.25 0.37 0.25 Total 955 22 5.06 7.59 1.30*
*The total cost for all heat exchangers including piping divided by total steam savings.
9.2 Retrofit rigorous In the rigorous proposal some of the changes included heat exchangers that were of water/water type. This meant that it was possible to extend the existing area instead of building a new unit. Table 11 shows the outcome of the economic evaluation. The costs for new heat exchangers including piping is 1 580 000 € and the resulting cost per saved steam is 143 000 €/MW. This cost is only slightly higher than for the light proposal, since it was possible to make use of existing equipment to a larger extent in the rigorous retrofit.
35

Table 11. Costs for implementing the retrofit rigorous proposal.
Streams
Area needed
Existingarea
Heat exchanger cost
Cost with piping
Cost per MW steam
# # m2 m2 €·105 €·105 €·105/MW C1 H1 312 172 0.61 0.91 0.56 C2 H3 161 0.97 1.46 1.49 C3 H3 281 1.42 2.12 1.62 C4 HW 265 1.36 2.03 0.78 C6 H22 346 1.66 2.49 1.19 C11 H22 105 0.77 1.15 C12 HW 284 269 0.15 0.22 C15 H6 36 0.51 0.77 0.80 C19 H18 63 22 0.25 0.37 0.25 WW H14 412 1.90 2.85 HW H9 545 313 0.95 1.43 Total 2807 776 10.5 15.8 1.43*
*The total cost for all heat exchangers including piping divided by total steam savings.
9.3 Bark savings In order to put the costs into a context, a rough estimation of the economic value of the potential bark savings was carried out. This does not imply that saving bark is the best alternative, it is just one way to quantify the value of the saved steam.
It is assumed that the bark boiler has an efficiency of 80%, operates 8000 hours per year and that the price of bark is 20 €/MWh (Axelsson, 2010). For simplicity it was assumed that any decreased use of the bark boiler leads to a decreased use of bark only, not oil. In reality oil would of course be saved, which would lead to greater savings. Hence, these calculations just give rough estimation of the potential savings. The resulting decrease in electricity production due to decreased steam production is taken into account. An electricity price of 49 €/MWh (Axelsson, 2010) is used together with a turbine efficiency of 10% to evaluate the loss of income from electricity sales. Further it is assumed that steam can be saved throughout 2/3 of the year, since the bark boiler runs close to its minimum load during summer. With these assumptions the savings will be 107 000 €/(MW·year) and hence the pay-back-period will be less than 16 months for both proposals.
36

10 Discussion From the composite curves it is evident that there is enough heat to cover all heating demand below 148°C. To achieve this in the existing network, a lot of changes would be required and it would not be economically feasible. The two options presented give steam savings of 5.8 MW and 11.0 MW respectively.
In the rigorous retrofit the specific cost of steam savings are higher than in the light version. Some changes in the rigorous retrofit do not in themselves save steam, but they are necessary since heat at higher temperatures is released. The heat can in turn replace steam elsewhere. The suggestions do not contradict each other, the rigorous is rather an extension of the light one. Which one to implement depends on to what level steam savings are desired and how large investment that is possible.
10.1 Observations regarding the mill From the two visits at Karlsborg and the analysis, some observations regarding the mill have been made. These are presented in the following sections.
10.1.1 TM3 and PM2 Within the paper machine there is a lack of information regarding how the heat recovery from wet air works. If a complete review were to be made of the ventilation in PM2, one would surely find possibilities for improvements. The steam batteries which are used during winter should be redundant if the system is built in a better way. Using a system like the one used in TM3, with a fluid transferring heat between the in- and outgoing air, would improve flexibility towards outdoor temperature. At present there are large amount of energy leaving with the outgoing air due to its humidity.
10.1.2 Bleaching plant/O2 bleaching The bleaching plant is the largest user of hot water and it is of interest to compare this usage with other similar mills to get an indication of the efficiency. FRAM (Future Resource Adapted pulp Mill) was a national Swedish research program carried out between 2003 and 2005 (FRAM, 2005). Within the program, model mills representing average Scandinavian mills were simulated. None of the modelled mills were of the same type as Karlsborg. Instead the comparison was made to an integrated fine paper mill and a bleached market pulp mill, since these two resemble Karlsborg best.
The steam consumption in the beaching plant at Karlsborg is slightly higher than the bleached market pulp mill, while it is nearly three times as high as the integrated fine paper mill. The steam usage in the oxygen bleaching step is considerably higher at Karlsborg than the two type mills. All together this indicates that there is a potential for energy savings and that there are reasons to investigate Karlsborg’s bleaching plant more thoroughly. At present, filters are used to wash the pulp between the bleaching stages and the temperature is varied between the steps. Using presses when washing the pulp and keeping the temperature at a more even level are two ways of lowering the demand for steam and hot water and thus improving the energy efficiency.
37

10.1.3 Digester section The batch digesters complicate heat integration in this section. The heating and cooling demand vary with time and it becomes more complex to heat exchange cold and hot streams with each other. One way to smoothen out these variations is to accumulate the hot and cold streams within tanks. However this would make the system more complex and also slower since it would take more time to obtain the required temperature. The implementation would also have a substantial investment cost.
10.1.4 HWWS It would be possible to reach a higher temperature in the hot water tank if heat exchanger 1302 was used to produce hot water instead of warm water. In this heat exchanger, terpentine condenses at 80°C, which is sufficient for hot water production and the relocation would result in a raised temperature in the hot water tank. This in turn would lead to lowered steam demand in the subsequent users. Since the steam savings rather is due to changing stream data than solving pinch violations, this option was not included in the proposals. If implementing this idea, the current condenser will need to be replaced by a new unit because of the large change in flows.
10.2 Uncertainties/sources of error This study is based on a large amount of data from different sources and there are many uncertainties. To a large extent, temperatures and flows were taken from continuous measurements at Karlsborg. In some cases information was available for both sides of a heat exchanger, but the calculated duty could differ largely between the two. One could suspect that these differences stem from malfunctioning gauges and engineers on-site were asked to judge the reliability. There is always a risk that instruments used for continuous measurements display an incorrect value. Since a double-check was not possible for a majority of the data, it is hard to validate the values.
Uncertainties are larger for data with origin from single measurements, since they only represent sample points taken during a short time span. For this data it is not possible to look at trends and judge if the values are representative. Data estimated from other available information is even less certain and representative. One example is the amount of steam used to heat incoming fresh air in the paper machine, which had to be estimated from seasonal variations in steam usage. This seasonal variation is only partly due to the steam batteries that heat incoming air. Since the steam usage is assumed to be rather low, the effect on the total analysis is rather small.
10.2.1 Consequences of a changed pinch temperature Looking at the GCC, one could conclude that streams which are important for the location of the pinch are the LP steam temperature and the surface condensers temperature. If the loads in one of these streams would change significantly because of e.g. incorrect measurements, the pinch temperature could also change.
38

In the analysis streams were assigned a minimum temperature difference in accordance with previous studies. The values influence how tightly streams can be heat exchanged and hence the minimum requirement for hot and cold utility. Therefore ∆Tmin was increased until the pinch temperature shifted. The new GCC with a 60% increased value of ∆Tmin is shown in Figure 18. This increase meant that ∆Tmin was raised from 0.5°C to 0.8°C for live steam and from 2°C to 3.6°C for the surface condensers.
Figure 18. GCC with a 60% increase in ∆Tmin/2.
Due to the shape of the GCC, ∆Tmin will not influence the demand to any larger extent. The minimum hot utility will increase from 135.4 MW to 136.8 MW and hence the potential for steam savings will decrease with 1.4 MW.
With the new pinch temperature, few of the previously identified pinch violations will still be true. Almost all steam users have loads above the pinch and are therefore no longer pinch violations. The hot effluents however, are no longer completely below the pinch so they will give pinch violations instead. Since the retrofit proposals mainly focus on replacing steam usage with hot effluents, the same approach can still be used to eliminate violations. From a pinch theory point of view it will be the cooling requirement of the hot effluents that is replaced by heating demands, but the actual changes in the network will be the same. The approach used in this work is therefore rather sound, and will give steam savings even with a great change in pinch temperature. With the new set of ∆Tmin some proposed modifications in the network may however need adjustments in order to achieve the requirements on temperature difference between the hot and cold side.
10.2.2 Proposals One must keep in mind the uncertainties connected with data gathering when proposing changes and not always be strict on targets. The cooling demand for liquor is not completely met when E1 filtrate is used for cooling instead of warm water in heat exchanger 3212 in the rigorous proposal. This is accepted since the duty of the old heat exchanger is taken from three individual measurements, and they vary quite much. Further, the temperature of the liquor only changes about 1°C compared to the original case.
The existing area according to specifications of heat exchanger 1156 was two thirds of the area obtained from calculations. For consistency the existing area was calculated
39

and not taken from specifications. This is since the possible error within these calculations would be evenly distributed between new and old area enabling a fair comparison of the options based on cost.
The classification of fluids in the heat exchangers was quite rough since only a few heat transfer coefficient were used in the study. The areas obtained from calculations depend to a large extent on the heat transfer coefficients used. As an example, in heat exchanger 1135 the overall heat transfer coefficient decreases from 3 W/(m2·K) to 0.75 W/(m2·K) when the fluid on one side is changed from water to an effluent from the bleaching plant, EOP. This results in a large increase in needed area even though the temperature difference between the streams rise. How correct this is depends on how dirty the effluent is and a more selective choice of heat transfer coefficients would result in better estimates.
In the proposals the energy content of the hot effluents plays an important role. The target temperature for these streams was set to 37°C without any further investigation on possible limitations due to subsequent cleaning. However heat is not extracted all the way down to this target, so the suggested use should be possible. Before implementing these changes a more thorough investigation would be required.
40

11 Conclusions The theoretical potential for energy savings at Billerud Karlsborg has been identified to 18.4 MW. In order to achieve all these savings, many new heat exchangers and a lot of piping would be required. Therefore two suggested cases that save parts of the theoretical potential have been put forward. In one case with a few simple changes, 5.8 MW steam is saved to a total cost of 0.80 M€ giving a cost of 0.13 M€/MW. In the second case with rigorous changes, 11.0 MW steam is saved to a total cost of 1.6 M€ giving 0.14 M€/ MW. Both these investments have a pay-back period shorter than 16 months if one decreases the load in the bark boiler to as large extent as possible and hereby achieve bark savings.
The analysis shows that there are great potentials for energy savings within the mill. The heat surplus could be used for bark savings, within a biorefinery, in a low pressure turbine or to produce district heating.
41

42

12 Further work It is evident that the hot effluents could contribute to increased energy efficiency and it is therefore of interest to map and measure the current temperatures and flows. How streams are mixed is of importance for the energy content. Hence, streams of different temperature should be kept separate to maximize the possible energy output. Mixing occurs at present both of the liquid effluents and of air in the heat recovery systems. Further inspections could surely identify possible improvements. How far the hot effluents can be cooled is also of interest to investigate since they contain a lot of heat.
For the paper machine a deeper study of the heat recovery system and its function ought to enable energy savings. The humid air from both the pulp and paper dryer contain large amounts of energy which potentially could be utilized in a better way and hereby reduce steam demand. Deeper investigations could show how much.
The data which has been collected during this study could be used for further investigations. There are a number of different tools and methods which is used to obtain more accurate and detailed information about the mill. One such tool, which could be useful for optimizing the design of the HWWS is the concept of tank curves. This method was developed by Nordman and it proposes a way of finding the optimal temperature level in the tanks from an energy savings point of view. The data collected for this study can be evaluated with this method and give interesting results and guidance on how to obtain excess heat at higher temperatures. (Nordman, 2006)
Advanced composite curves is another method developed at the division of Heat and Power Technology. The advantage with these curves compared to ordinary composite curves is that they display where existing heaters and coolers are placed in the network. This means that they give a chance to identify temperature levels where excess heat could be extracted and also heat recovery projects that are economically feasible and that reduce the complexity. (Nordman, 2002)
Within the bleaching plant there is a potential for energy savings through improvements of the steam and hot water usage. Ways of obtaining a more even temperature between the washing steps should be investigated as well as the possibility to changing the washing equipment from filters to presses.
43

44

13 References Axelsson, E. (2008): Energy Export Opportunities from Kraft Pulp and Paper Mills and Resulting Reductions in Global CO2 Emissions, PhD thesis, Department of Energy and Environment, Chalmers University of Technology, Göteborg, Sweden, pp. 23-33
Axelsson, E., Harvey, S. (2010): Scenarios for assessing profitability and carbon balances of energy investments in industry, ISBN: 978-91-978585-0-2, Chalmers University of Technology, Göteborg, Sweden, pp.32-33
Axelsson, E., Olsson, M., Berntsson, T. (2006): Heat integration opportunities in average Scandinavian Kraft pulp mills: A pinch analysis of model mills. Nordic Pulp & Paper Research Journal, Vol. 21 No.4, pp.466-475
Billerud (2008): Vår verksamhet och vår miljöpåverkan under 2008 (Our work and environmental impact 2008), internal report Billerud AB, Solna
Brännström, M. (2010), Billerud Karlsborg, Personal communication, + 46 923 663 38 Carlsson, P. (2009-2010), Billerud Karlsborg, Personal communication, +46 923 662 35
FRAM (2005): FRAM Final report: Model mills and system analysis, FRAM Report No. 70, STFI (nowadays called Innventia), Stockholm
Hoffner, N. (2008), Processbeskrivning av verksamheten vid Billerud Karlsborg AB (Description of the process at Billerud Karlsborg AB), internal report Billerud AB, Karlsborg
Kemp, I. C. (2007): Pinch Analysis and Process Integration- A Users Guide on Process Integration for the Efficient Use of Energy, Second Edition, Butterworth-Heinemann, Oxford, UK, pp. 1-40
Larsson, B. (2008): Sekundärvärmebalans, Billerud Karlsborg (Secondary heat balance, Billerud Karlsborg), report, ÅF, Stockholm, +46 10-505 75 09
Nordman, R., Berntsson, T.(2002): New Pinch Technology Based HEN Analysis Methodologies for Cost-Effective Analysis, Canadian Journal of Chemical Engineering, Vol. 79, No. 4, pp. 655-662.
Nordman, R., Berntsson, T.(2006): Design of kraft pulp mill hot and warm water systems – A new method that maximizes excess heat, Applied Thermal Engineering, Vol. 26, No. 4, pp 363-373
Persson, J., Berntsson, T. (2009) Influence of seasonal variations on energy-saving opportunities in a pulp mill, Energy, Vol. 34, No. 10, pp. 170-1714
Persson, K.-E. (1996): Papperstillverkning (Paper manufacturing), Skogsindustrins utbildning i Markaryd AB, SUM AB, Markaryd. Sweden, pp. 38-44, 168-216
Persson, R. (2010), Billerud Karlsborg, Personal communication, +46 923 661 36 Sinnott, R., Towler, G. (2009): Chemical engineering design, Fifth Edition, Butterworth-Heinemann, Oxford, UK, pp. 817-838
45

Theliander, H., Paulsson, M., Brelid, H. (2001): Introduktion till Massa- och pappersframställning (Introduction to Pulp and paper production), Student literature Chalmers, Chalmers University of technology, Department of Forest Products and Chemical Engineering, Göteborg, Sweden, pp. 87-104, 131-176, 209-242
Wadman, M. (2009): Industrins årliga energianvändning 2007 (Energy use in manufacturing industry 2007), Report on Swedish official statistics, Statistics Sweden, Örebro, Sweden, http://www.scb.se/Statistik/EN/EN0113/2007A01a /EN0113_2007A01a_SM_EN23SM0901.pdf, 2009-10-29, pp. 4
Wikström, K. (2009), Billerud Karlsborg, Personal communication, +46 73 040 40 57
46

14 Appendix 14.1 Appendix 1 – Stream data
Hot streams Stream HX Tstart Ttarget Q ΔTmin/2 # Name with °C °C MW °C H1 Liquor cooling C9 78 74 2.2 3.5 H2 Liquor cooling C9 90 83 1.0 3.5 H3 Condensate from stripper C5 115 37 8.5 3.5 H4 Surface condensers C8 61 60 41.0 2.0 H5 Smelt dissolver C8/C12 65 50 7.7 2.0 H6 Digester liquor C7/C9 170 91 25.4 3.5 H7 Gas cooling C8 66 51 1.5 4.0 H8 Blow steam condensate C9 91 56 13.6 3.5 H9 Liquor cooling C9 83 71 7.5 3.5 H10 Terpentine condenser C8 81 80 2.4 2.0 H11 Strain reject HE 47 37 0.3 3.5 H12 Spillway overflow HE 48 37 1.3 3.5 H13 Washing effluent HE 47 37 0.3 3.5 H14 Effluent D0 HE 63 37 28.6 3.5 H15 Effluent EOP HE 55 37 5.2 3.5 H16 Effluent bleaching plant HE 56 37 1.5 3.5 H17 Effluent bleaching plant HE 50 37 0.6 3.5 H18 Condensate cooling TM3 C11 150 86 1.5 3.5 H19 Trimcondenser C9 100 99 0.4 2.0 H20 MeOH partial condenser C9 69 61 0.3 2.0 H21 MeOH gas cooler C8 61 34 0.05 2.0 H22 B-Condensate HE 76 37 4.3 3.5 H23 C-Condensate HE 61 37 4.2 3.5 H24 Flash steam - FW tank C12 122 121 0.9 0.5 H25 Flash steam cond - PM2 C20 110 109 0.4 2.0 H26 Flash steam cond - BM1 C21 84 83 0.2 2.0 H27 Scrubber water C10 65 10 6.8 2.5 H28 Air from dryer - TM3 C25/C14 100 69 1.8 8.0 H29 Air from dryer - TM3 C14/C22 69 60 7.5 8.0 H30 Air from dryer - TM3 C22/HE 60 50 5.2 8.0 H31 Air from dryer - TM3 HE 50 40 3.1 8.0 H32 Heat to fresh air - TM3 C23 72 36 3.6 3.5 H33 Air from dryer - PM2 C27/C26 80 59 1.8 8.0 H34 Air from dryer - PM2 C26 59 50 9.5 8.0 H35 Air from dryer - PM2 HE 50 40 7.1 8.0
47

Cold streams
Stream HX Tstart Ttarget Q ΔTmin/2 # Name with °C °C MW °C C1 E1 filtrate LP 63 68 1.6 3.5 C2 E2 filtrate LP 67 82 1.0 3.5 C3 E2 filtrate LP 59 75 1.3 3.5 C4 D0 filtrate LP 65 73 2.6 3.5 C5 Condensate to stripper H3 75 103 2.6 3.5 C6 White water for TM3 & PM2 LP 50 57 2.1 3.5 C7 Wash liquor H6 85 150 15.0 3.5 C8 WW production * 2 51 53.4 2.5 C9 HW production * 51 69 22.6 2.5 C10 CCW production - PM2 H27 2 60 6.8 2.5 C11 CCW production - TM3 H18 2 55 1.5 2.5
C12 Boiler make up water
C8/H5/C9/ H24
2
88
14.9
2.5
C13 Evaporator (4 bar) LP 148 149 43.7 0.5 C14 Local heating - TM3 H29/H28/LP 36 72 5.5 3.5 C15 Local heating LP 76 95 1.0 2.5 C16 Local heating LP 70 90 2.5 2.5 C17 LP steam (4 bar) rest LP 148 149 0.5 C18 MP steam (10 bar) rest MP 184 185 0.5 C19 White water for PM2 LP 57 85 1.8 3.5 C20 Spray water - PM2 H25 25 54 0.4 2.5 C21 Water heating - BM1 H26 4 30 0.2 2.5 C22 Spray water - TM3 H29/H30 2 40 5.0 2.5 C23 Air to machine hall - TM3 H32 -3 31 3.6 8.0 C24 Air to ceiling - TM3 LP 31 54 1.1 8.0 C25 Air to dryer - TM3 H28 42 80 1.1 8.0 C26 Air to machine hall - PM2 H34/H33/LP -3 39 2.4 8.0 C27 Air to dryer - PM2 H33/LP 28 95 2.7 8.0
* For WW and HW production, refer to Figure 9.
48

14.2 Appendix 2 – Steam users Section Pressure Load
bar MW Digester section 10 31.7Digester section 4 10.1TM3 4 18.2O2-bleaching 10 3.7O2-bleaching 4 0.1Bleaching plant 4 6.5PM2 and BM1 4 23.1PM2 and BM1 10 2.5Evaporation plant 4 43.7Methanol column 4 0.5ClO2- bleaching 4 1.2Make up water tank 4 9.1Local heating 4 3.5
Total 154.1Excluded in the analysis Let down valves and dump condenser 4 1.8Recovery boiler soot steam 30 6.8Recovery boiler bottom blowing steam 60 1.2Bark boiler soot steam 10 0.5Recovery boiler bottom blowing steam 60 0.3
Total 10.6Total steam consumption 164.6
49

14.3 Appendix 3 – Heat exchangers in retrofit light The changes made in the heat exchanger network for the light case are described in detail below:
• In one E2 filtrate heating, white water is being heated from 67°C to 82°C for reuse within the bleaching plant. It is today carried out in a recently built heat exchanger called 3218. The suggestion is to replace the steam with the hot stream coming out from the stripper. This stream is first heat exchanged with the ingoing stripper stream, but currently sent to drain at a temperature of 91°C. If these two streams are instead heat exchanged, 1 MW steam could be saved.
• In another E2 filtrate heating, white water in the bleaching plant is being heated from 59°C to 75°C. The heat exchanger used is called 3219 and it has also been recently installed. As hot stream, it is proposed to once again use the stripper condensate since it contains enough heat at appropriate temperatures. HX 3218 and HX 3219 are situated closed to each other, which will reduce the need for piping. This proposal gives steam savings of 1.3 MW.
• White water for transporting pulp from storage to the pulp dryer and the paper machine is heated from 50°C to 57°C. This is done by HX 2111, which is suspected for steam leakage (Carlsson, 2010). A hot effluent from the evaporation, B condensate, is proposed to be used giving savings of 2.1 MW.
• The part of white water which is to be used for transporting pulp to the paper machine is further heated from 57°C to 85°C in HX 41-01-35. About 80% of the steam demand could be replaced by a condensate requiring cooling in TM3. This stream is today heat exchanged with CCW production for TM3. In the proposal the need for CCW production is instead covered by rests from the B condensate stream. The outlet temperature of CCW is 55°C in the original case, but with the proposed change it only reaches 51°C because the temperature difference on the hot side reaches its minimum. The temperature is a soft target, but lowering it will have consequences on the demand in HX 2111 (Carlsson, 2010). Two new heat exchangers need to be built when implementing this idea, but since B condensate is used in both of them, the need for piping is decreased.
50

14.4 Appendix 4- Heat exchangers in retrofit rigorous The new heat exchangers which are not included in the light case are described below:
• In HX 3217, E1 filtrate is heated from 63°C to 68°C. The heat exchanger is situated in the bleaching plant and it is new. Liquor cooler 3212 is at present used for producing hot water while the liquor is being cooled from 78°C to 74°C. If this cooling demand is instead covered by E1 filtrate, there is no longer any need for adding steam to 3217, which will save 1.6 MW. The cold stream will not provide enough cooling capacity, resulting in a slightly higher temperature of the liquor than what is measured. Due to uncertainties regarding measurements and only a slight temperature increase, this change is accepted. See further information in section 10.2.2.
• The D0 filtrate is currently heated in HX 3203 by LP steam, which is mixed into the stream and thereby the temperature is raised from 65°C to 73°C. It is suggested to replace the steam mixer with a heat exchanger using hot water produced in the digesting section. This would result in 2.6 MW steam savings.
• Local heating water for offices, workshops etc. is heated from 76°C to 95°C in HX 21-0136. Stream H6, digester liquor, is suggested to be used as hot stream, which will give savings of magnitude 1 MW. A consequence of this change is that the subsequent HX 1226 in the HWWS will need increased area because of decreased ΔTmin.
The new heat exchangers will change the situation in the HWWS balance and some adjustments were made in order to fulfill the existing heating demand. Two changes are needed and they are both related to HX 1156:
• In HX 1156 liquor is cooled from 83°C to 71°C. The heat exchanger cannot currently provide enough cooling capacity for using warm water solely as the inlet stream. Instead a mixture of raw and warm water is used. Hot water from this heat exchanger is currently added to the tank at 54°C, a temperature which could be raised to 66°C by doing the following:
o Preheating the raw water with D0 effluent in a new heat exchanger prior to mixing, thereby increasing the temperature into 1156 from 2°C to 57°C.
o Enlarging the heat transfer area in HX 1156 to provide enough cooling capacity.
51

52