Embed Size (px)
Citation preview

A Parallelized Iterative Improvement Approach to Area Optimization for LUT-Based Technology Mapping
Gai Liu and Zhiru Zhang
Computer Systems LabElectrical and Computer Engineering
Cornell University
PIMap
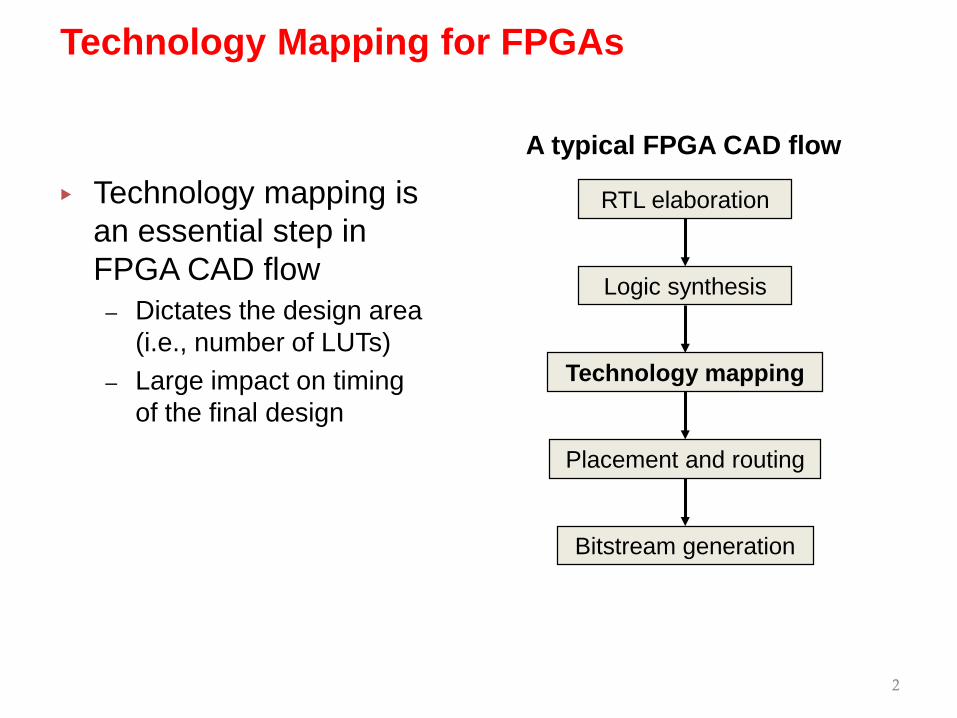
▸ Technology mapping is an essential step in FPGA CAD flow
– Dictates the design area (i.e., number of LUTs)
– Large impact on timing of the final design
Technology Mapping for FPGAs
RTL elaboration
Logic synthesis
Technology mapping
Placement and routing
Bitstream generation
2
A typical FPGA CAD flow

▸ Cover a gate-level logic network using LUTs
– K-input LUT (k-LUT) can implement any k-input 1-output combinational logic network
3
Technology Mapping for FPGAs
i3 i5i1 i2
o1
o2
o4
o3
i4
▸ Cover a gate-level logic network using LUTs
– K-input LUT (k-LUT) can implement any k-input 1-output combinational logic network
3
Technology Mapping for FPGAs
i3 i5i1 i2
o1
o2
o4
o3
i4

▸ Cover a gate-level logic network using LUTs
– K-input LUT (k-LUT) can implement any k-input 1-output combinational logic network
– This work focuses on combinational circuit
3
Technology Mapping for FPGAs
i3 i5i1 i2
o1
o2
o4
o3
i4

▸ Cover a gate-level logic network using LUTs
– K-input LUT (k-LUT) can implement any k-input 1-output combinational logic network
– This work focuses on combinational circuit
▸ Quality metrics for technology mapping
– Area: number of LUTs needed– Depth: longest path from PI to
PO in # of LUTs
3
Technology Mapping for FPGAs
i3 i5i1 i2
o1
o2
o4
o3
i4

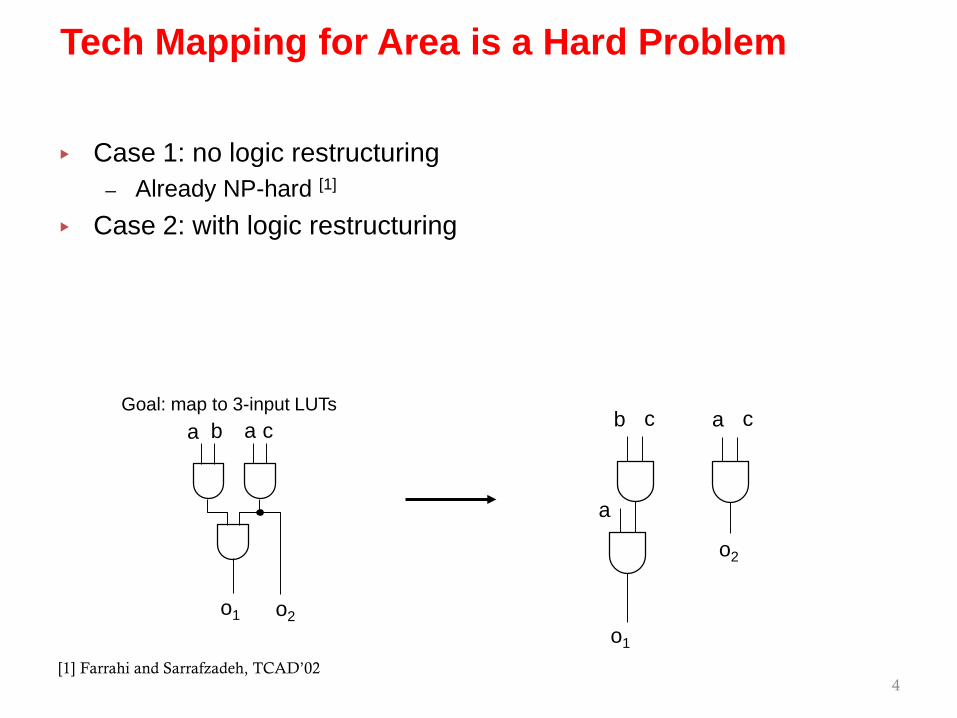
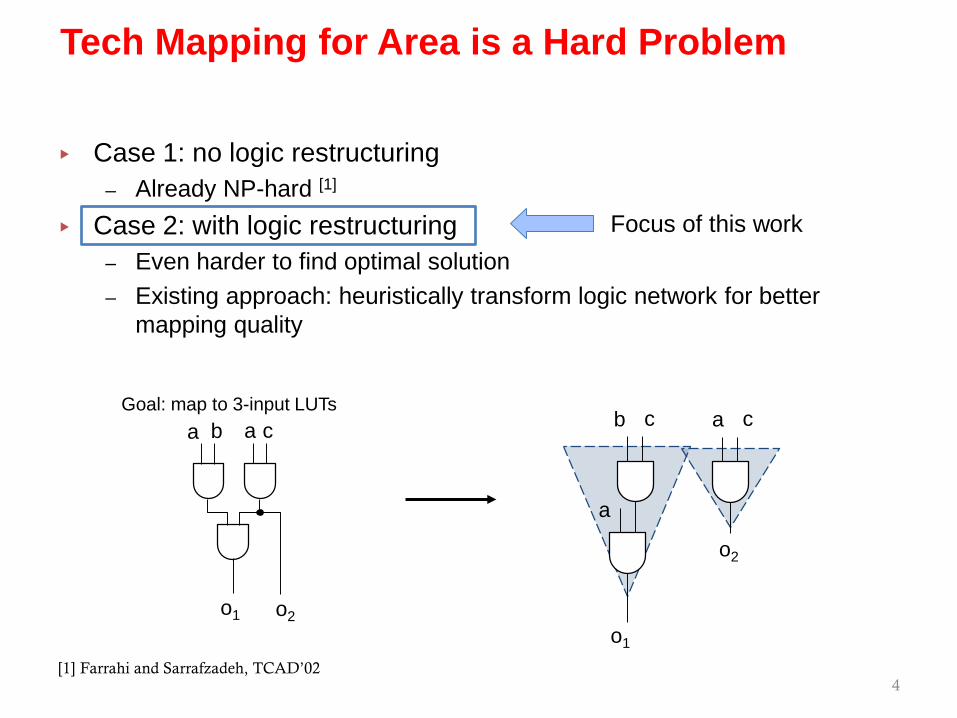
▸ Case 1: no logic restructuring
4
Tech Mapping for Area is a Hard Problem

▸ Case 1: no logic restructuring
4
Tech Mapping for Area is a Hard Problem
ca b
o1 o2
Goal: map to 3-input LUTsa

▸ Case 1: no logic restructuring
4
Tech Mapping for Area is a Hard Problem
ca b
o1 o2
Goal: map to 3-input LUTsa

▸ Case 1: no logic restructuring– Already NP-hard [1]
4
Tech Mapping for Area is a Hard Problem
ca b
o1 o2
Goal: map to 3-input LUTsa
[1] Farrahi and Sarrafzadeh, TCAD’02
▸ Case 1: no logic restructuring– Already NP-hard [1]
▸ Case 2: with logic restructuring
4
Tech Mapping for Area is a Hard Problem
ca b
o1 o2
Goal: map to 3-input LUTsa a c
o2
b c
a
o1
[1] Farrahi and Sarrafzadeh, TCAD’02

▸ Case 1: no logic restructuring– Already NP-hard [1]
▸ Case 2: with logic restructuring
4
Tech Mapping for Area is a Hard Problem
ca b
o1 o2
Goal: map to 3-input LUTsa a c
o2
b c
a
o1
[1] Farrahi and Sarrafzadeh, TCAD’02
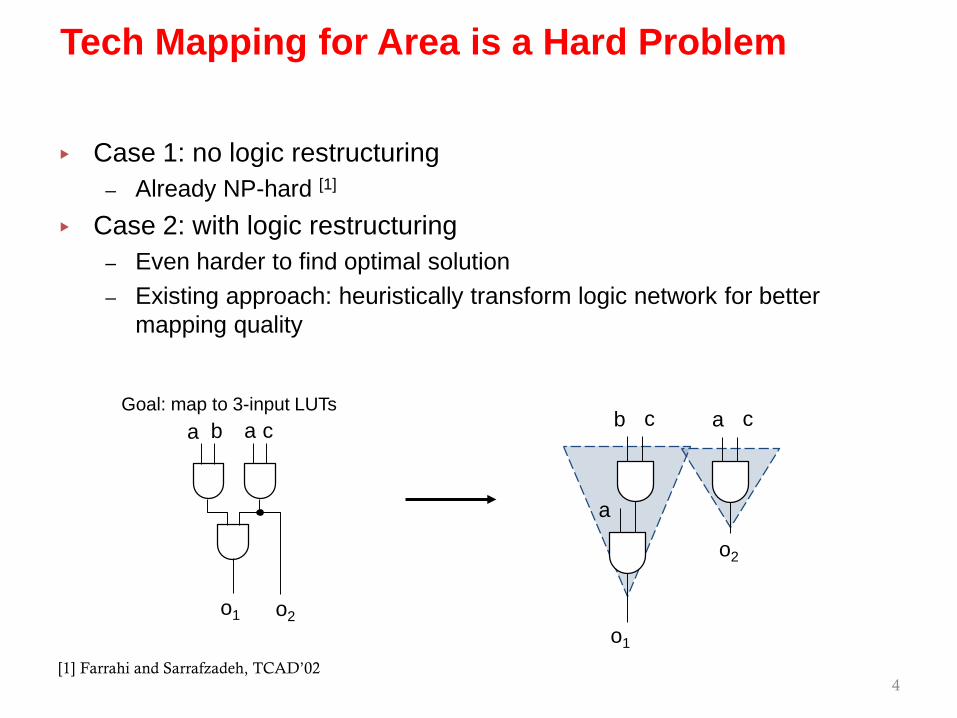
▸ Case 1: no logic restructuring– Already NP-hard [1]
▸ Case 2: with logic restructuring– Even harder to find optimal solution– Existing approach: heuristically transform logic network for better
mapping quality
4
Tech Mapping for Area is a Hard Problem
ca b
o1 o2
Goal: map to 3-input LUTsa a c
o2
b c
a
o1
[1] Farrahi and Sarrafzadeh, TCAD’02
▸ Case 1: no logic restructuring– Already NP-hard [1]
▸ Case 2: with logic restructuring– Even harder to find optimal solution– Existing approach: heuristically transform logic network for better
mapping quality
4
Tech Mapping for Area is a Hard Problem
ca b
o1 o2
Goal: map to 3-input LUTsa
Focus of this work
a c
o2
b c
a
o1
[1] Farrahi and Sarrafzadeh, TCAD’02

5
Representative Academic Mappers
Chortle
DAGMap
FlowMap
CutMapDAOMap
K and LIMap
ABC Map
Exact synthesis
0.3
0.4
0.5
0.6
0.7
0.8
0.9
1
1990 1994 1998 2002 2006 2010 2014 2018
Nor
mal
ized
are
a
Year
Chortle: Francis, et al., DAC’90DAGMap: Chen, et al., DT’92FlowMap: Cong and Ding, TCAD’94
CutMap: Cong and Hwang, FPGA’95DAOMap: Chen and Cong, ICCAD’04K and L: Kao and Lai, TDAES’05
Imap: Manohararajah, et al., TCAD’06ABC Map: Mishchenko, et al., TCAD’07Exact synthesis: Haaswijk, et al., ASPDAC’17
Average area reduction for a set of MCNC benchmarks

6
Representative Academic Mappers
Chortle
DAGMap
FlowMap
CutMapDAOMap
K and LIMap
ABC Map
Exact synthesis
0.3
0.4
0.5
0.6
0.7
0.8
0.9
1
1990 1994 1998 2002 2006 2010 2014 2018
Nor
mal
ized
are
a
Year
Chortle: Francis, et al., DAC’90DAGMap: Chen, et al., DT’92FlowMap: Cong and Ding, TCAD’94
CutMap: Cong and Hwang, FPGA’95DAOMap: Chen and Cong, ICCAD’04K and L: Kao and Lai, TDAES’05
Imap: Manohararajah, et al., TCAD’06ABC Map: Mishchenko, et al., TCAD’07Exact synthesis: Haaswijk, et al., ASPDAC’17
Average area reduction for a set of MCNC benchmarks
7
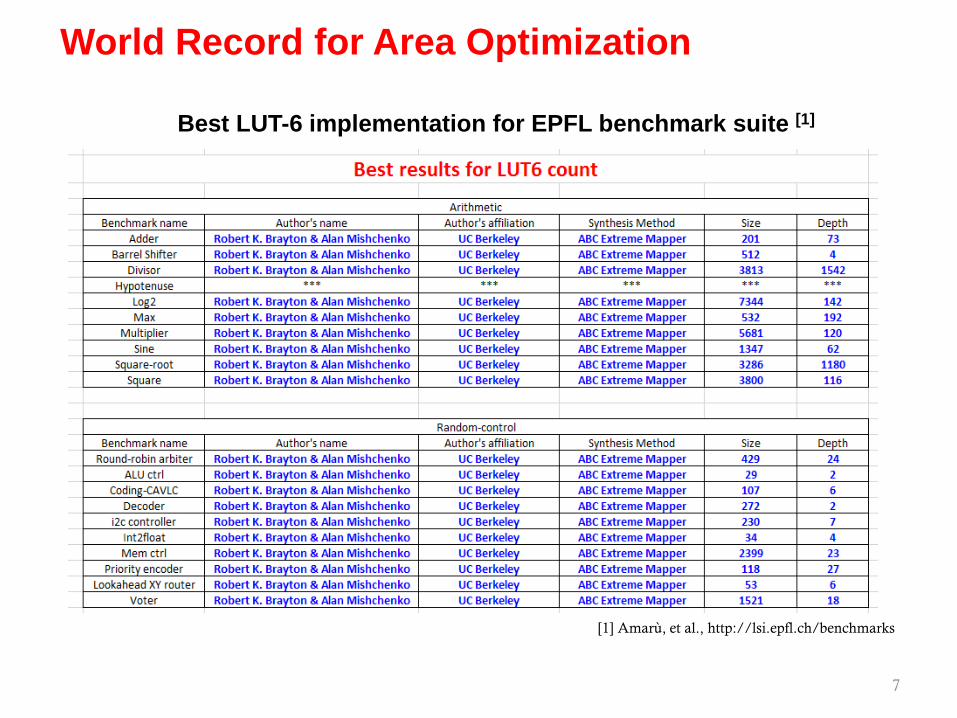
World Record for Area Optimization
Best LUT-6 implementation for EPFL benchmark suite [1]
[1] Amarù, et al., http://lsi.epfl.ch/benchmarks
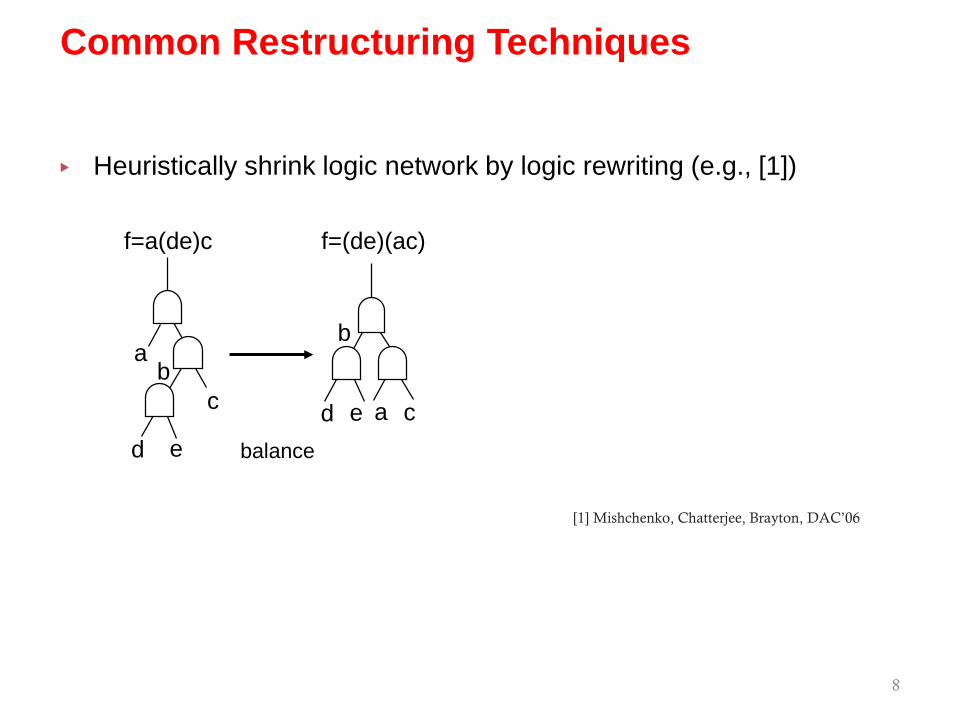
▸ Heuristically shrink logic network by logic rewriting (e.g., [1])
8
Common Restructuring Techniques
ab
c
d e
b
d e cabalance
[1] Mishchenko, Chatterjee, Brayton, DAC’06
f=a(de)c f=(de)(ac)

▸ Heuristically shrink logic network by logic rewriting (e.g., [1])
8
Common Restructuring Techniques
ab
c
d e
b
d e cabalance
a ca b b c
a
rewrite
[1] Mishchenko, Chatterjee, Brayton, DAC’06
f=a(de)c g=(ab)(ac) g=abcf=(de)(ac)

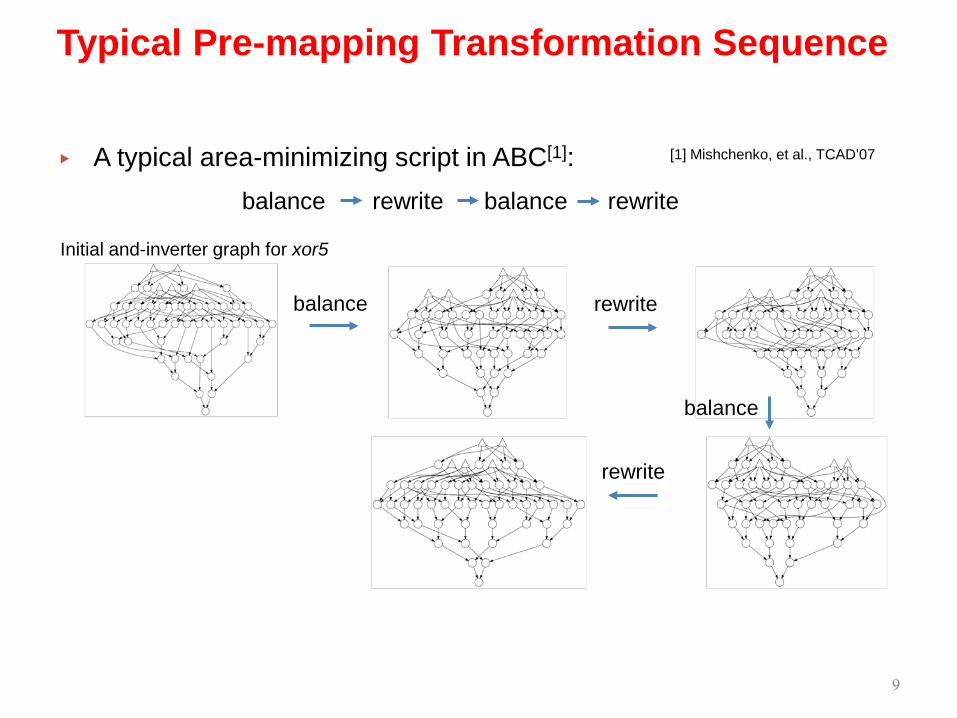
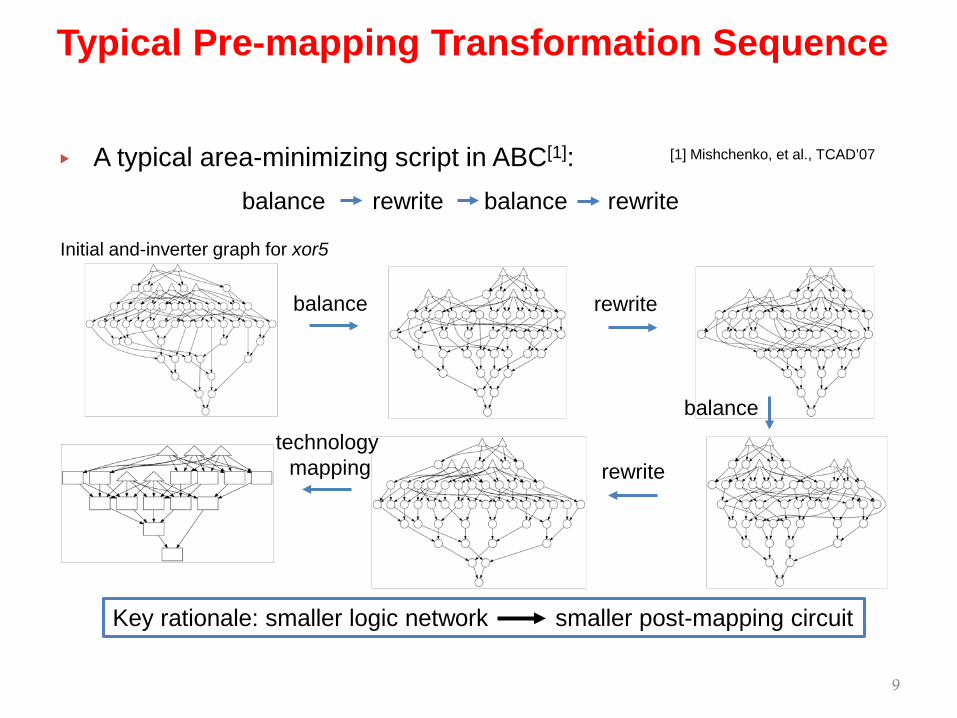
▸ A typical area-minimizing script in ABC[1]:
9
Typical Pre-mapping Transformation Sequence
balance rewrite balance rewrite
[1] Mishchenko, et al., TCAD’07

▸ A typical area-minimizing script in ABC[1]:
9
Typical Pre-mapping Transformation Sequence
Initial and-inverter graph for xor5
balance rewrite balance rewrite
[1] Mishchenko, et al., TCAD’07
▸ A typical area-minimizing script in ABC[1]:
9
Typical Pre-mapping Transformation Sequence
Initial and-inverter graph for xor5
balance rewrite balance rewrite
balance rewrite
balance
rewrite
[1] Mishchenko, et al., TCAD’07

▸ A typical area-minimizing script in ABC[1]:
9
Typical Pre-mapping Transformation Sequence
Initial and-inverter graph for xor5
balance rewrite balance rewrite
balance rewrite
balance
rewritetechnology
mapping
[1] Mishchenko, et al., TCAD’07
▸ A typical area-minimizing script in ABC[1]:
9
Typical Pre-mapping Transformation Sequence
Initial and-inverter graph for xor5
balance rewrite balance rewrite
balance rewrite
balance
rewritetechnology
mapping
[1] Mishchenko, et al., TCAD’07
Key rationale: smaller logic network smaller post-mapping circuit

10
Study of (Mis)Correlation
Key rationale of previous techniques: smaller logic network smaller post-mapping circuit
10
Study of (Mis)Correlation
Key rationale of previous techniques: ?smaller logic network smaller post-mapping circuit

10
Study of (Mis)Correlation
0.20.30.40.50.60.70.80.9
1
0 50 100 150 200 250 300 350 400
Nor
mal
ized
Nod
e Co
unt
Iteration
Gate Count
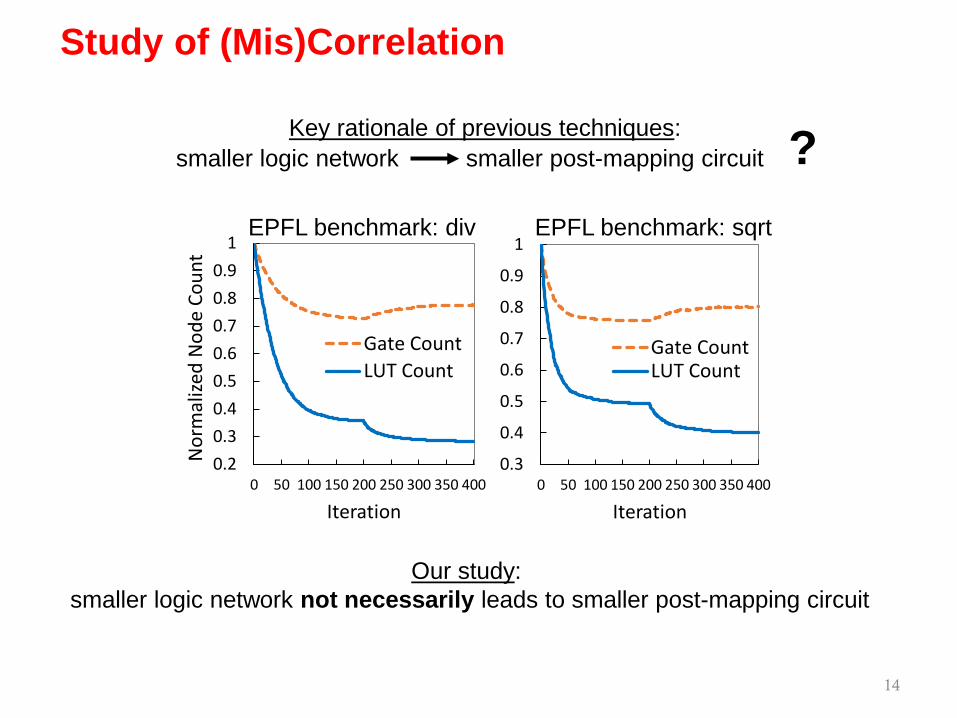
Methodology: generate sequence of equivalent designs
with varying gate/LUT count
Key rationale of previous techniques: ?EPFL benchmark: div
smaller logic network smaller post-mapping circuit

11
Study of (Mis)Correlation
0.20.30.40.50.60.70.80.9
1
0 50 100 150 200 250 300 350 400
Nor
mal
ized
Nod
e Co
unt
Iteration
Gate CountLUT Count
EPFL benchmark: div
Methodology: generate sequence of equivalent designs
with varying gate/LUT count
Key rationale of previous techniques: ?smaller logic network smaller post-mapping circuit

12
Study of (Mis)Correlation
0.20.30.40.50.60.70.80.9
1
0 50 100 150 200 250 300 350 400
Nor
mal
ized
Nod
e Co
unt
Iteration
Gate CountLUT Count
EPFL benchmark: div
Methodology: generate sequence of equivalent designs
with varying gate/LUT count
Key rationale of previous techniques: ?smaller logic network smaller post-mapping circuit

13
Study of (Mis)Correlation
0.20.30.40.50.60.70.80.9
1
0 50 100 150 200 250 300 350 400
Nor
mal
ized
Nod
e Co
unt
Iteration
Gate CountLUT Count
EPFL benchmark: div
Methodology: generate sequence of equivalent designs
with varying gate/LUT count
Key rationale of previous techniques: ?smaller logic network smaller post-mapping circuit

14
Study of (Mis)Correlation
0.20.30.40.50.60.70.80.9
1
0 50 100 150 200 250 300 350 400
Nor
mal
ized
Nod
e Co
unt
Iteration
Gate CountLUT Count
0.3
0.4
0.5
0.6
0.7
0.8
0.9
1
0 50 100 150 200 250 300 350 400
Iteration
Gate CountLUT Count
EPFL benchmark: div EPFL benchmark: sqrt
Key rationale of previous techniques: ?smaller logic network smaller post-mapping circuit
14
Study of (Mis)Correlation
0.20.30.40.50.60.70.80.9
1
0 50 100 150 200 250 300 350 400
Nor
mal
ized
Nod
e Co
unt
Iteration
Gate CountLUT Count
0.3
0.4
0.5
0.6
0.7
0.8
0.9
1
0 50 100 150 200 250 300 350 400
Iteration
Gate CountLUT Count
Our study: smaller logic network not necessarily leads to smaller post-mapping circuit
EPFL benchmark: div EPFL benchmark: sqrt
Key rationale of previous techniques: ?smaller logic network smaller post-mapping circuit
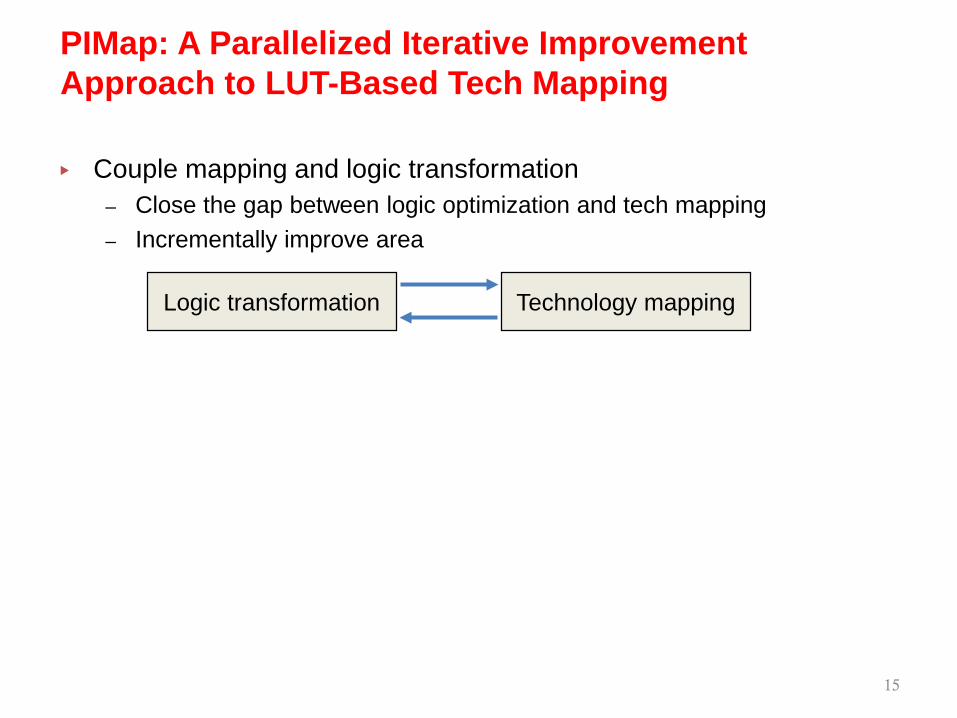
▸ Couple mapping and logic transformation– Close the gap between logic optimization and tech mapping– Incrementally improve area
PIMap: A Parallelized Iterative Improvement Approach to LUT-Based Tech Mapping
15
Logic transformation Technology mapping
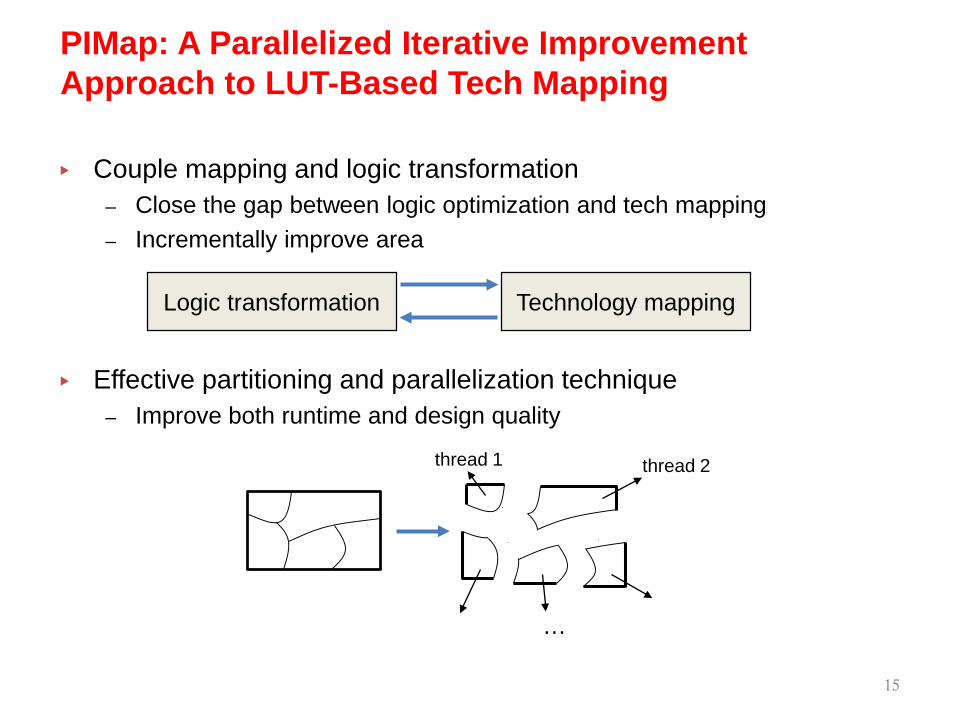
▸ Couple mapping and logic transformation– Close the gap between logic optimization and tech mapping– Incrementally improve area
▸ Effective partitioning and parallelization technique– Improve both runtime and design quality
PIMap: A Parallelized Iterative Improvement Approach to LUT-Based Tech Mapping
15
thread 1 thread 2
…
Logic transformation Technology mapping

16
PIMap Technique: Iterative Area Minimization
Intuition: use mapping result to guide randomly proposed logic
transformations
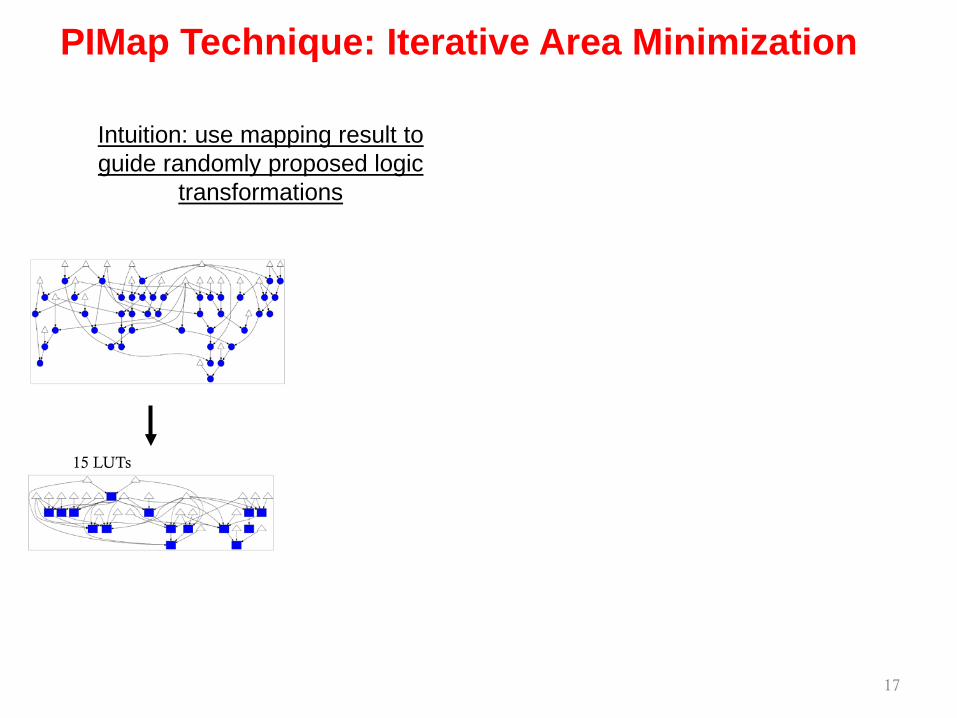
17
PIMap Technique: Iterative Area Minimization
15 LUTs
Intuition: use mapping result to guide randomly proposed logic
transformations
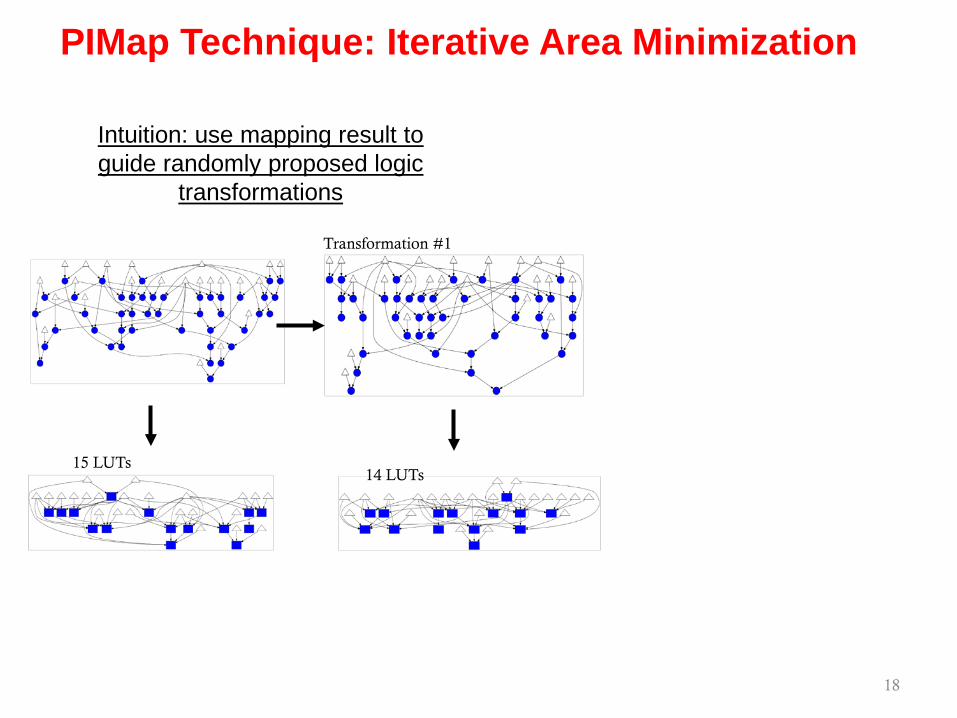
18
PIMap Technique: Iterative Area Minimization
15 LUTs
Transformation #1
14 LUTs
Intuition: use mapping result to guide randomly proposed logic
transformations

19
PIMap Technique: Iterative Area Minimization
15 LUTs
Transformation #1
14 LUTs
[1] Hastings, Biometrika’70
Metropolis-Hastings algorithm[1]: Accept current transformation if 𝑟𝑟𝑟𝑟𝑟𝑟𝑟𝑟 0,1 < exp(−𝛾𝛾 𝑁𝑁𝐿𝐿𝐿𝐿𝐿𝐿_𝑛𝑛𝑛𝑛𝑛𝑛
𝑁𝑁𝐿𝐿𝐿𝐿𝐿𝐿_𝑜𝑜𝑜𝑜𝑜𝑜)
Intuition: use mapping result to guide randomly proposed logic
transformations

20
PIMap Technique: Iterative Area Minimization
15 LUTs
Transformation #1 Transformation #2
14 LUTs 14 LUTs
[1] Hastings, Biometrika’70
Metropolis-Hastings algorithm[1]: Accept current transformation if 𝑟𝑟𝑟𝑟𝑟𝑟𝑟𝑟 0,1 < exp(−𝛾𝛾 𝑁𝑁𝐿𝐿𝐿𝐿𝐿𝐿_𝑛𝑛𝑛𝑛𝑛𝑛
𝑁𝑁𝐿𝐿𝐿𝐿𝐿𝐿_𝑜𝑜𝑜𝑜𝑜𝑜)
Intuition: use mapping result to guide randomly proposed logic
transformations

21
PIMap Technique: Iterative Area Minimization
15 LUTs
Transformation #1 Transformation #2
14 LUTs 14 LUTs
[1] Hastings, Biometrika’70
Metropolis-Hastings algorithm[1]: Accept current transformation if 𝑟𝑟𝑟𝑟𝑟𝑟𝑟𝑟 0,1 < exp(−𝛾𝛾 𝑁𝑁𝐿𝐿𝐿𝐿𝐿𝐿_𝑛𝑛𝑛𝑛𝑛𝑛
𝑁𝑁𝐿𝐿𝐿𝐿𝐿𝐿_𝑜𝑜𝑜𝑜𝑜𝑜)
Intuition: use mapping result to guide randomly proposed logic
transformations

22
PIMap Technique: Iterative Area Minimization
15 LUTs
Transformation #1 Transformation #2
…
14 LUTs 14 LUTs
[1] Hastings, Biometrika’70
Metropolis-Hastings algorithm[1]: Accept current transformation if 𝑟𝑟𝑟𝑟𝑟𝑟𝑟𝑟 0,1 < exp(−𝛾𝛾 𝑁𝑁𝐿𝐿𝐿𝐿𝐿𝐿_𝑛𝑛𝑛𝑛𝑛𝑛
𝑁𝑁𝐿𝐿𝐿𝐿𝐿𝐿_𝑜𝑜𝑜𝑜𝑜𝑜)
Intuition: use mapping result to guide randomly proposed logic
transformations

▸ No circuit partitioning– Long runtime per trial– Easily stuck at local minimum
Partitioning Schemes
3300
3400
3500
3600
3700
3800
3900
0 5 10 15 20 25 30 35 40
LUT
Cou
ntTrial
No partition
23
EPFL design: div

▸ No circuit partitioning– Long runtime per trial– Easily stuck at local minimum
▸ Fine-grained partition– Similar concept to exact synthesis– Fast runtime per trial– Slow progress overall
Partitioning Schemes
3300
3400
3500
3600
3700
3800
3900
0 5 10 15 20 25 30 35 40
LUT
Cou
ntTrial
No partition16 partitions, 5 LUTs/partition
24
EPFL design: div

▸ No circuit partitioning– Long runtime per trial– Easily stuck at local minimum
▸ Fine-grained partition– Similar concept to exact synthesis– Fast runtime per trial– Slow progress overall
▸ Coarse-grained partition– Balance runtime and solution quality– Repartition between trials to further
improve quality
Partitioning Schemes
3300
3400
3500
3600
3700
3800
3900
0 5 10 15 20 25 30 35 40
LUT
Cou
ntTrial
No partition16 partitions, 5 LUTs/partition16 partitions, 100 LUTs/partition
25
EPFL design: div

26
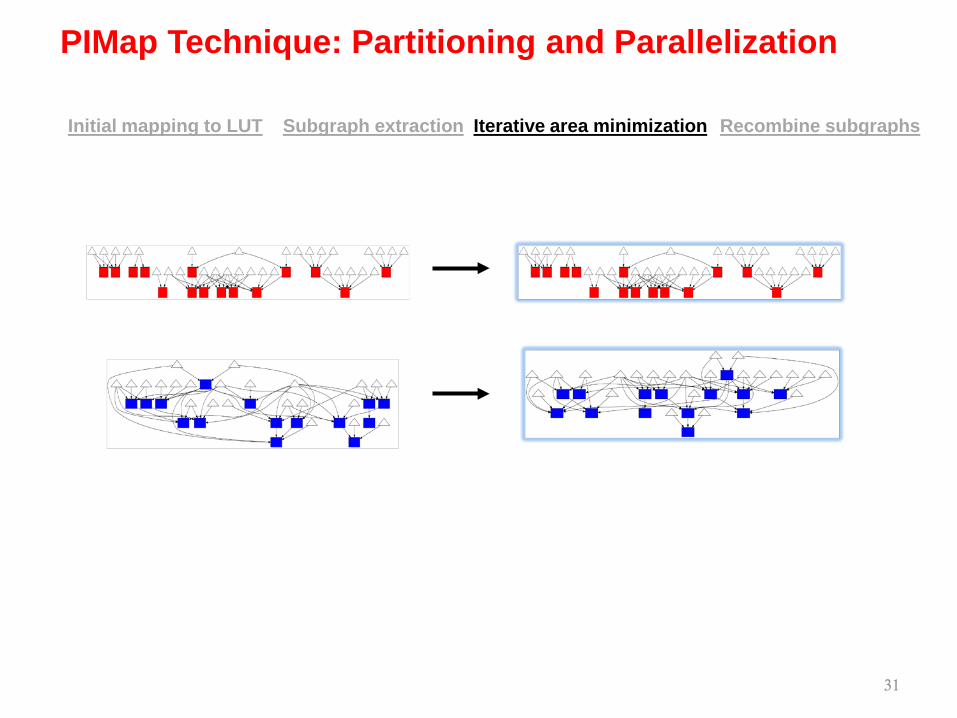
PIMap Technique: Partitioning and Parallelization
Iterative area minimizationSubgraph extraction Recombine subgraphsInitial mapping to LUT
AIG of design b9 Mapped netlist
34 LUTs
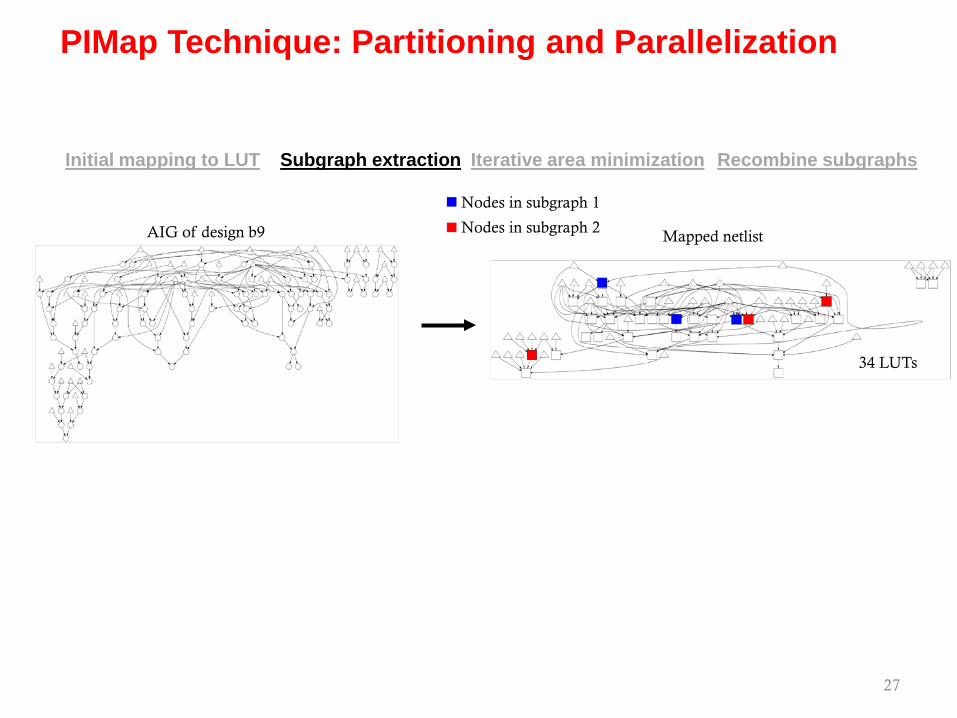
27
Iterative area minimizationSubgraph extraction Recombine subgraphsInitial mapping to LUT
AIG of design b9 Mapped netlist
34 LUTs
Nodes in subgraph 1
Nodes in subgraph 2
PIMap Technique: Partitioning and Parallelization

28
Iterative area minimizationSubgraph extraction Recombine subgraphsInitial mapping to LUT
AIG of design b9 Mapped netlist
34 LUTs
Nodes in subgraph 1
Nodes in subgraph 2
PIMap Technique: Partitioning and Parallelization

29
Iterative area minimizationSubgraph extraction Recombine subgraphsInitial mapping to LUT
AIG of design b9 Mapped netlist
34 LUTs
Nodes in subgraph 1
Nodes in subgraph 2
PIMap Technique: Partitioning and Parallelization

30
15 LUTs15 LUTs
Iterative area minimizationSubgraph extraction Recombine subgraphsInitial mapping to LUT
AIG of design b9 Mapped netlist
34 LUTs
Nodes in subgraph 1
Nodes in subgraph 2
Subgraph 1 Subgraph 2
PIMap Technique: Partitioning and Parallelization
31
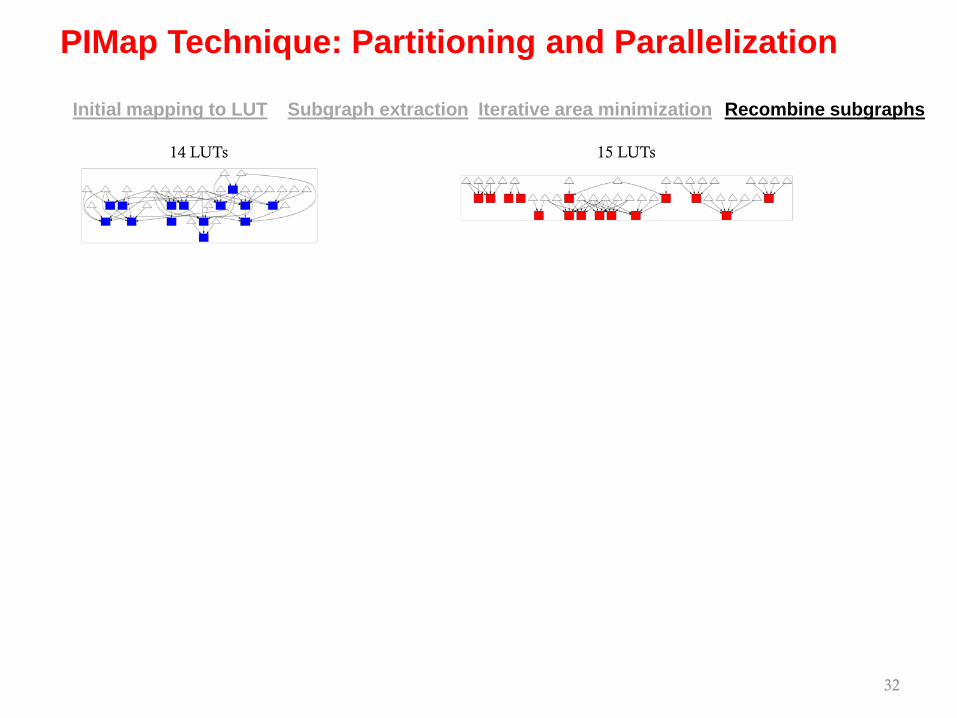
Iterative area minimizationSubgraph extraction Recombine subgraphsInitial mapping to LUT
PIMap Technique: Partitioning and Parallelization
32
14 LUTs 15 LUTs
Iterative area minimizationSubgraph extraction Recombine subgraphsInitial mapping to LUT
PIMap Technique: Partitioning and Parallelization

33
14 LUTs 15 LUTs
Iterative area minimizationSubgraph extraction Recombine subgraphsInitial mapping to LUT
PIMap Technique: Partitioning and Parallelization

34
14 LUTs 15 LUTs
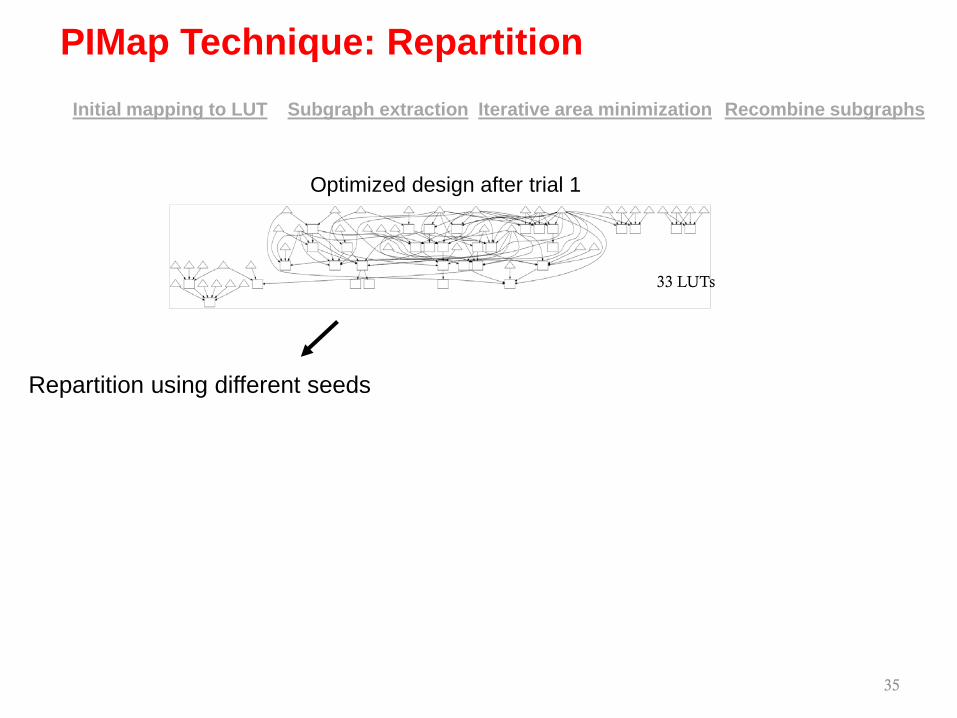
Iterative area minimizationSubgraph extraction Recombine subgraphsInitial mapping to LUT
33 LUTs
PIMap Technique: Partitioning and Parallelization
35
Iterative area minimizationSubgraph extraction Recombine subgraphsInitial mapping to LUT
Repartition using different seeds
33 LUTs
Optimized design after trial 1
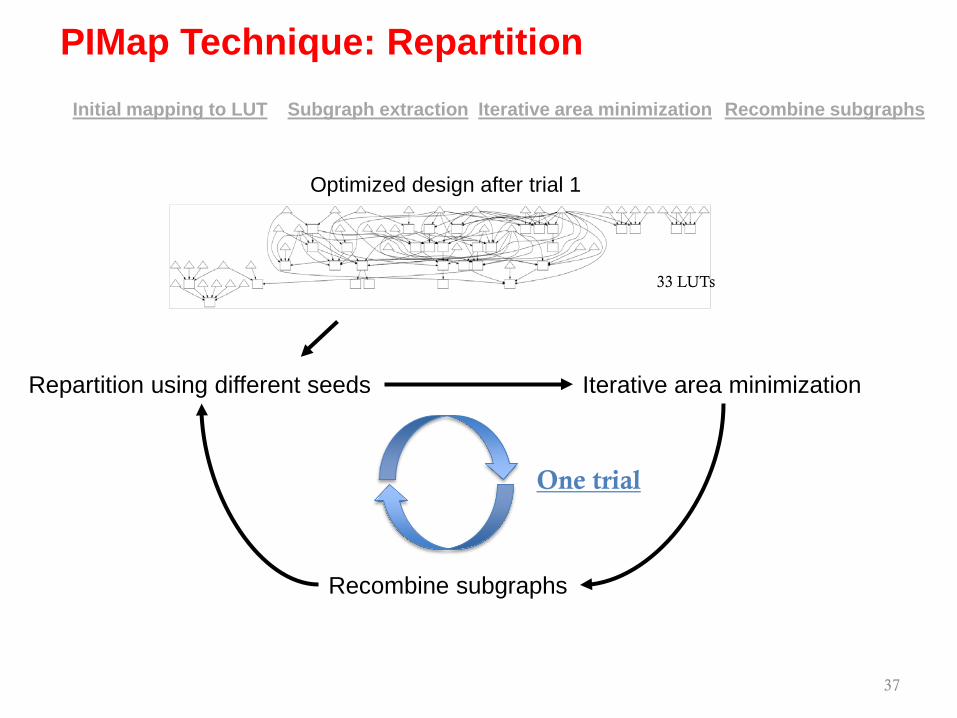
PIMap Technique: Repartition
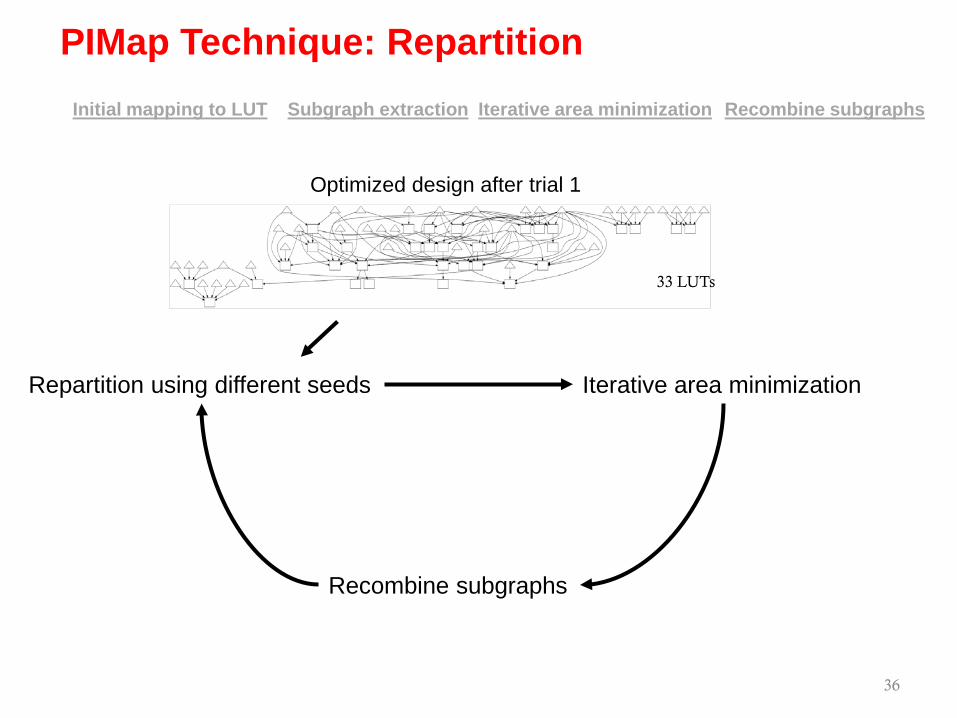
36
Iterative area minimizationSubgraph extraction Recombine subgraphsInitial mapping to LUT
Repartition using different seeds Iterative area minimization
33 LUTs
Optimized design after trial 1
Recombine subgraphs
PIMap Technique: Repartition
37
Iterative area minimizationSubgraph extraction Recombine subgraphsInitial mapping to LUT
One trial
Repartition using different seeds Iterative area minimization
33 LUTs
Optimized design after trial 1
Recombine subgraphs
PIMap Technique: Repartition

38
PIMap Overall Flow
Design C1908 from the MCNC benchmark suite5 trials in total
Observations:1. Partition boundaries vary between trials
Uncover better structure2. Overall network structure differ significantly between trials
Discover a wide range of designs

Experimental Setup
39
ABC’s tech mapper
ABC’s logic transformations:
balance, rewrite, refactor
Iterative area minimization
routine
Subgraph extraction and parallelization
control
PIMap toolchain
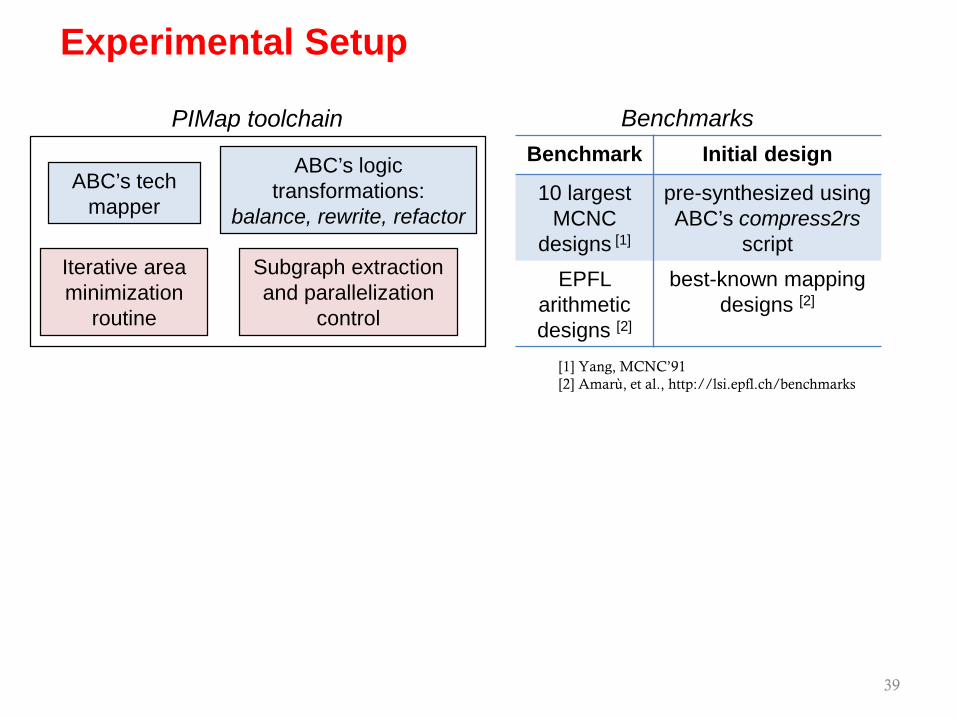
Experimental Setup
39
ABC’s tech mapper
ABC’s logic transformations:
balance, rewrite, refactor
Benchmark Initial design
10 largest MCNC
designs [1]
pre-synthesized using ABC’s compress2rs
scriptEPFL
arithmetic designs [2]
best-known mapping designs [2]
Iterative area minimization
routine
Subgraph extraction and parallelization
control
PIMap toolchain Benchmarks
[1] Yang, MCNC’91[2] Amarù, et al., http://lsi.epfl.ch/benchmarks
Configuration 40 trials, 100 iterations of area minimization per trial
Partitioning up to 16 subgraphs, each with up to 100 LUTs
Computing resource up to 8 machines, each with a quad-core Xeon processor
Setup

40
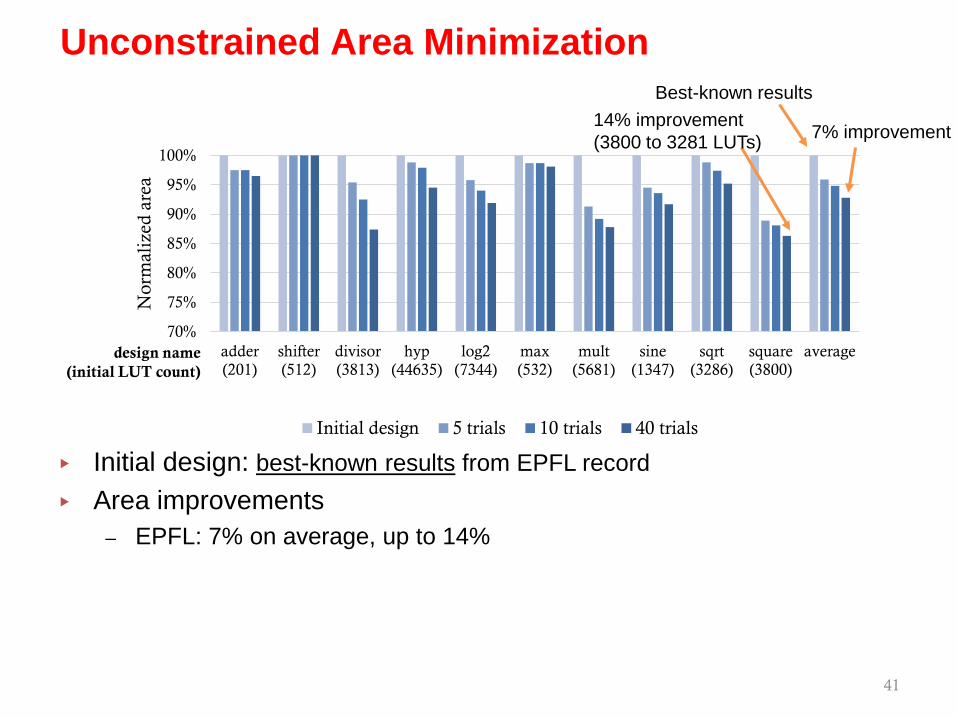
Unconstrained Area Minimization
▸ Initial design: best-known results from EPFL record
70%
75%
80%
85%
90%
95%
100%
adder(201)
shifter(512)
divisor(3813)
hyp(44635)
log2(7344)
max(532)
mult(5681)
sine(1347)
sqrt(3286)
square(3800)
average
Nor
mal
ized
are
a
Initial design 5 trials 10 trials 40 trials
design name(initial LUT count)
Best-known results
41
Unconstrained Area Minimization
70%
75%
80%
85%
90%
95%
100%
adder(201)
shifter(512)
divisor(3813)
hyp(44635)
log2(7344)
max(532)
mult(5681)
sine(1347)
sqrt(3286)
square(3800)
average
Nor
mal
ized
are
a
Initial design 5 trials 10 trials 40 trials
design name(initial LUT count)
Best-known results
7% improvement14% improvement(3800 to 3281 LUTs)
▸ Initial design: best-known results from EPFL record▸ Area improvements
– EPFL: 7% on average, up to 14%
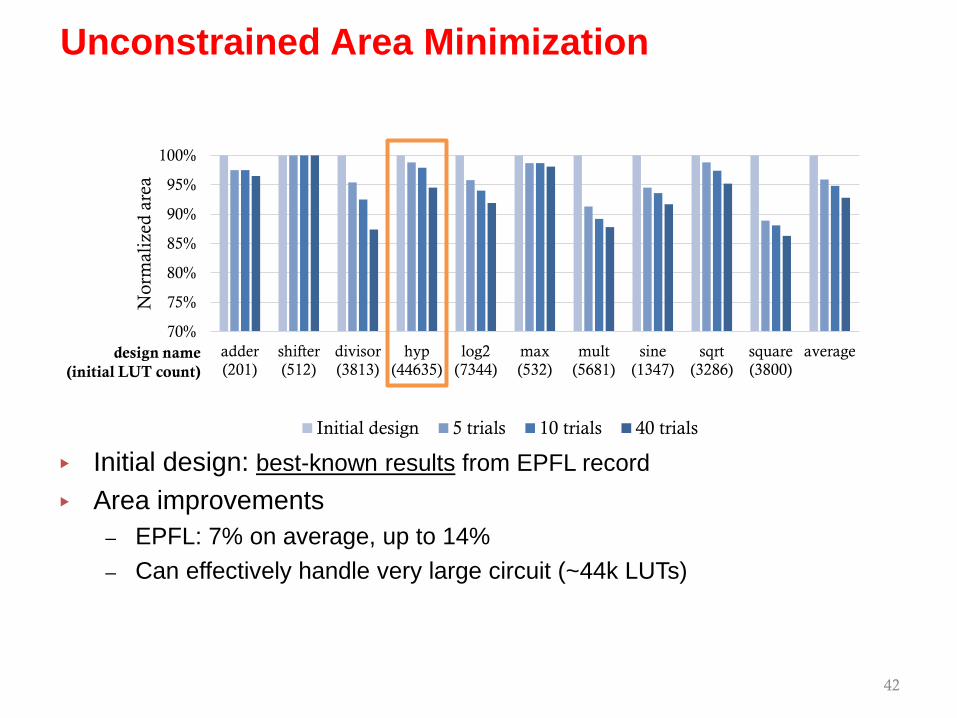
▸ Initial design: best-known results from EPFL record▸ Area improvements
– EPFL: 7% on average, up to 14%– Can effectively handle very large circuit (~44k LUTs)
42
Unconstrained Area Minimization
70%
75%
80%
85%
90%
95%
100%
adder(201)
shifter(512)
divisor(3813)
hyp(44635)
log2(7344)
max(532)
mult(5681)
sine(1347)
sqrt(3286)
square(3800)
average
Nor
mal
ized
are
a
Initial design 5 trials 10 trials 40 trials
design name(initial LUT count)
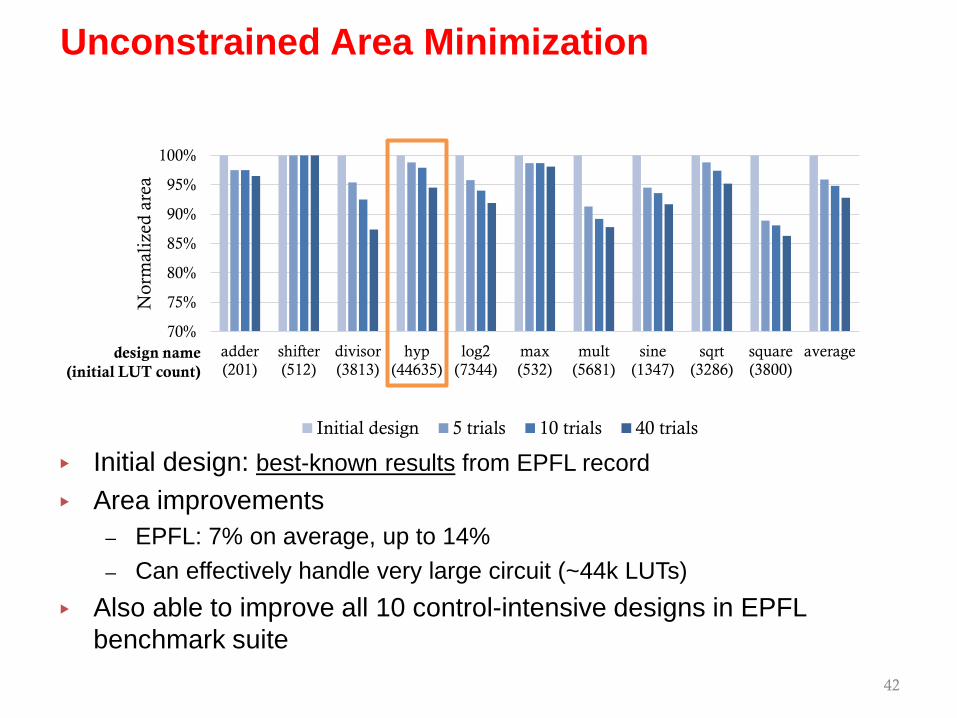
▸ Initial design: best-known results from EPFL record▸ Area improvements
– EPFL: 7% on average, up to 14%– Can effectively handle very large circuit (~44k LUTs)
▸ Also able to improve all 10 control-intensive designs in EPFL benchmark suite
42
Unconstrained Area Minimization
70%
75%
80%
85%
90%
95%
100%
adder(201)
shifter(512)
divisor(3813)
hyp(44635)
log2(7344)
max(532)
mult(5681)
sine(1347)
sqrt(3286)
square(3800)
average
Nor
mal
ized
are
a
Initial design 5 trials 10 trials 40 trials
design name(initial LUT count)
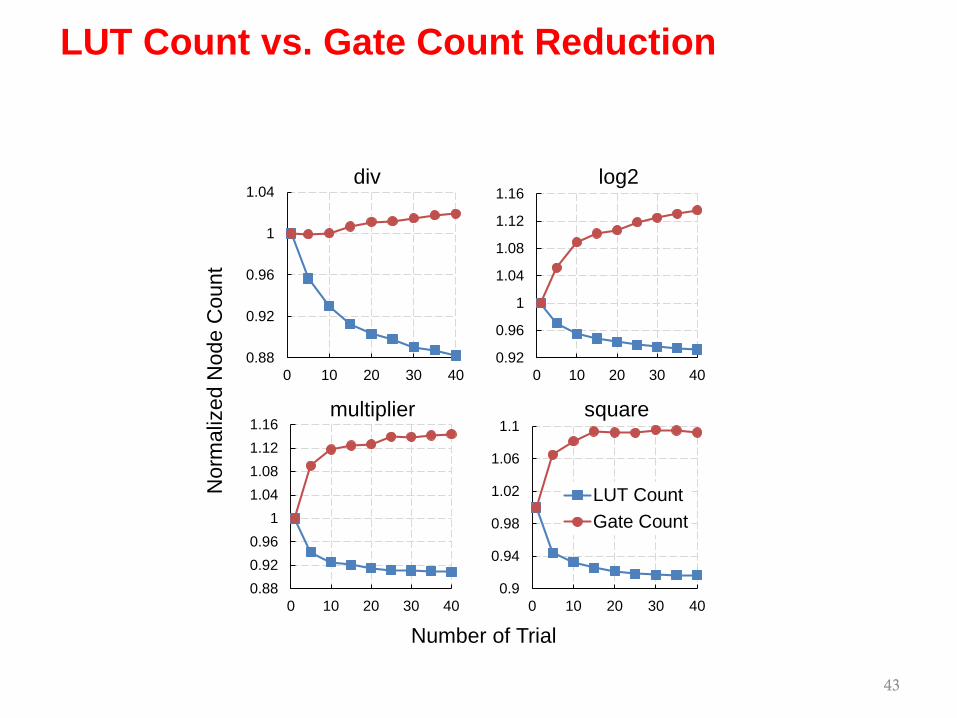
LUT Count vs. Gate Count Reduction
0.880.920.96
11.041.081.121.16
0 10 20 30 40
multiplier
0.9
0.94
0.98
1.02
1.06
1.1
0 10 20 30 40
square
LUT CountGate Count
Number of Trial
0.88
0.92
0.96
1
1.04
0 10 20 30 40
div
0.92
0.96
1
1.04
1.08
1.12
1.16
0 10 20 30 40
log2
Nor
mal
ized
Nod
e C
ount
43
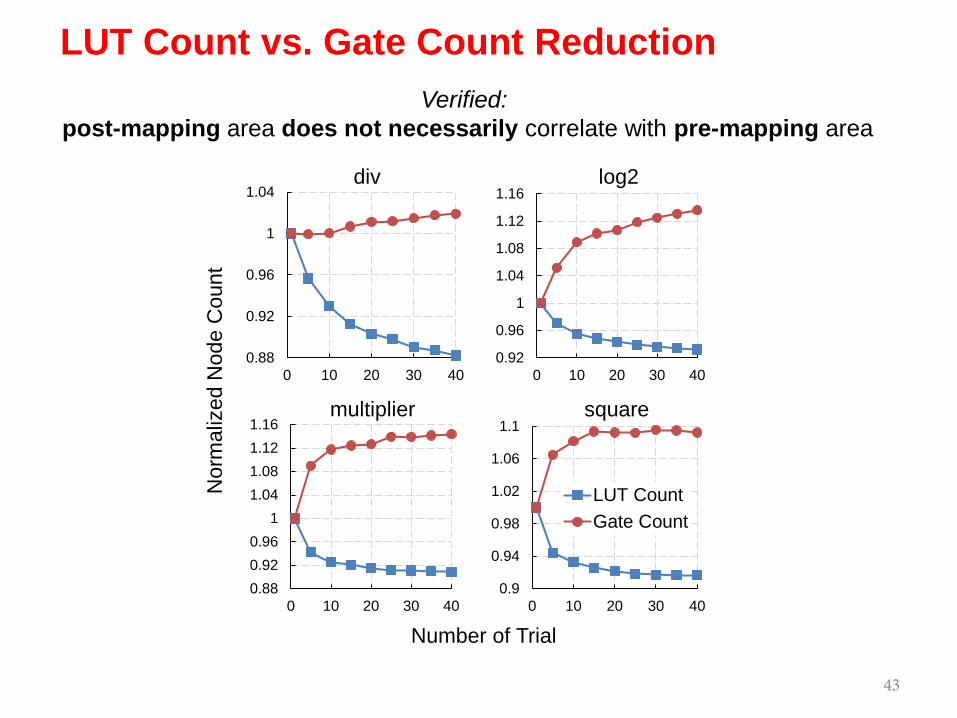
LUT Count vs. Gate Count Reduction
0.880.920.96
11.041.081.121.16
0 10 20 30 40
multiplier
0.9
0.94
0.98
1.02
1.06
1.1
0 10 20 30 40
square
LUT CountGate Count
Number of Trial
0.88
0.92
0.96
1
1.04
0 10 20 30 40
div
0.92
0.96
1
1.04
1.08
1.12
1.16
0 10 20 30 40
log2
Nor
mal
ized
Nod
e C
ount
43
Verified: post-mapping area does not necessarily correlate with pre-mapping area
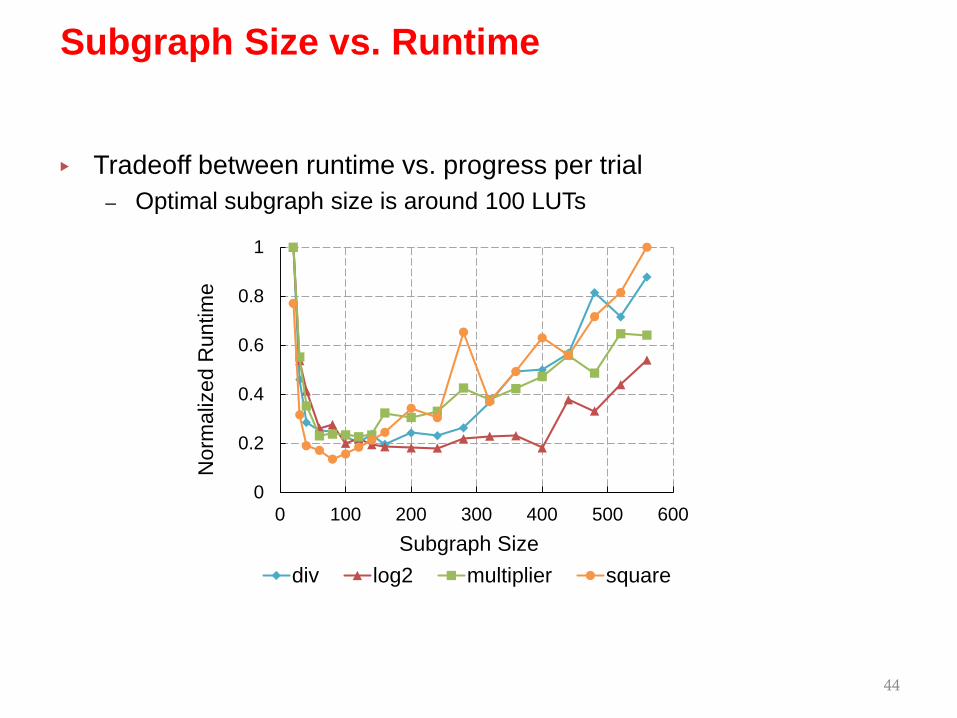
▸ Tradeoff between runtime vs. progress per trial– Optimal subgraph size is around 100 LUTs
Subgraph Size vs. Runtime
0
0.2
0.4
0.6
0.8
1
0 100 200 300 400 500 600
Nor
mal
ized
Run
time
Subgraph Sizediv log2 multiplier square
44
45
Depth Constrained Area Minimization
▸ Constraint: no depth increase compared to initial design– Initial designs generated by ABC’s depth-minimizing resyn2 script– In PIMap, only accept designs within depth constraint after each trial

▸ Constraint: no depth increase compared to initial design– Initial designs generated by ABC’s depth-minimizing resyn2 script– In PIMap, only accept designs within depth constraint after each trial
▸ Area improvements under depth constraint– 11% on average, up to 30%
46
Depth Constrained Area Minimization
design name(initial LUT count/depth)
60%
65%
70%
75%
80%
85%
90%
95%
100%
alu4(511/5)
apex2(674/6)
apex4(588/5)
des(818/5)
ex1010(655/5)
ex5p(351/5)
misex3(443/5)
pdc(1431/7)
seq(693/5)
spla(1392/7)
average
Nor
mal
ized
are
a
Initial design 5 trials 10 trials 40 trials
11% improvement
▸ In use cases with tight runtime budget– Use fewer number of trials and fewer iterations per trial
47
Area Reduction under a Tight Runtime Limit

▸ In use cases with tight runtime budget– Use fewer number of trials and fewer iterations per trial– PIMap still able to improve most of the best-known results of EPFL
benchmark designs
47
Area Reduction under a Tight Runtime Limit
Area reduction using PIMap with tight runtime limitDesigns Best-known PIMap
Adder 201 197
Shifter 512 512
Divisor 3813 3787
Hyp 44635 44635
Log2 7344 7305
Max 532 526
Mult 5681 5594
Sine 1347 1309
Sqrt 3286 3279
square 3800 3675
Runtime limit: 10 seconds

▸ Circuit area before/after mapping does not necessarily correlate▸ Stochastic mapping-in-the-loop approach for area minimization▸ Sub-circuit extraction and parallelization for runtime reduction▸ Up to 14% and 7% on average over the best-known records for the
EPFL arithmetic benchmark suite▸ Future work: depth minimization in tech mapping
48
Conclusions
Chortle
DAGMap
FlowMap
CutMap
DAOMap
K and LIMap
ABC Map
Exact synthesis
PIMap0.3
0.4
0.5
0.6
0.7
0.8
0.9
1
1990 1994 1998 2002 2006 2010 2014 2018
Nor
mal
ized
Are
a
Year