Embed Size (px)
Citation preview
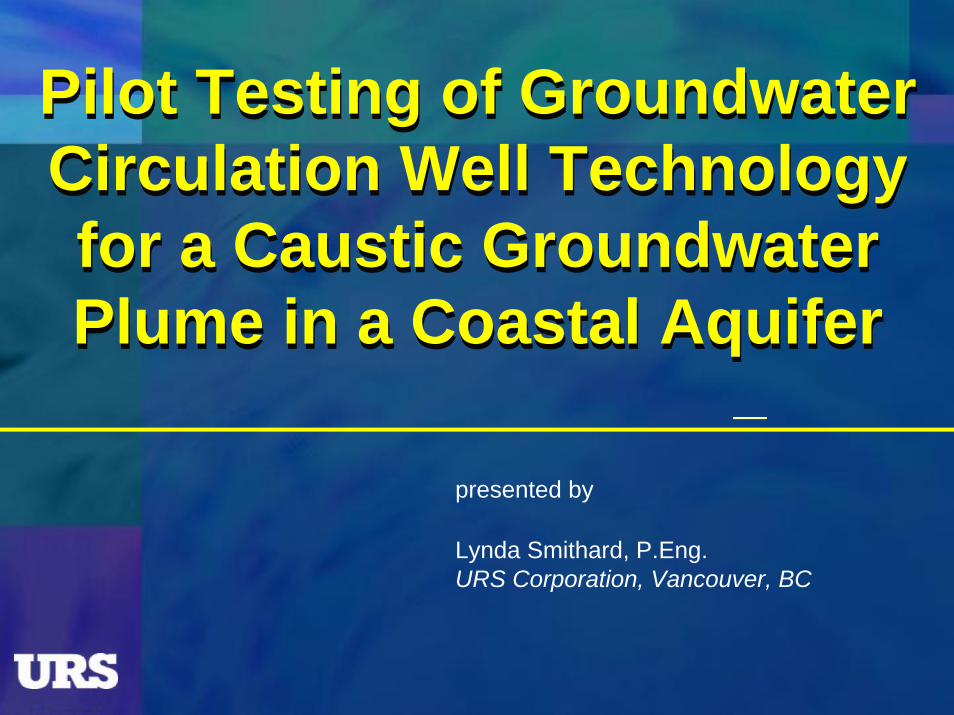
Pilot Testing of Groundwater Circulation Well Technology for a Caustic Groundwater Plume in a Coastal Aquifer
Pilot Testing of Groundwater Circulation Well Technology for a Caustic Groundwater Plume in a Coastal Aquifer
presented by
Lynda Smithard, P.Eng.URS Corporation, Vancouver, BC
Background
a portion of the groundwater beneath chlor-alkali plant has pH values in excess of 7.0 (caustic)
Client spent 5 years investigating and monitoring the groundwater within this area of the site
From June 04 to April 05 a pilot test was conducted to assess a GCW designed to neutralize the high pH groundwater
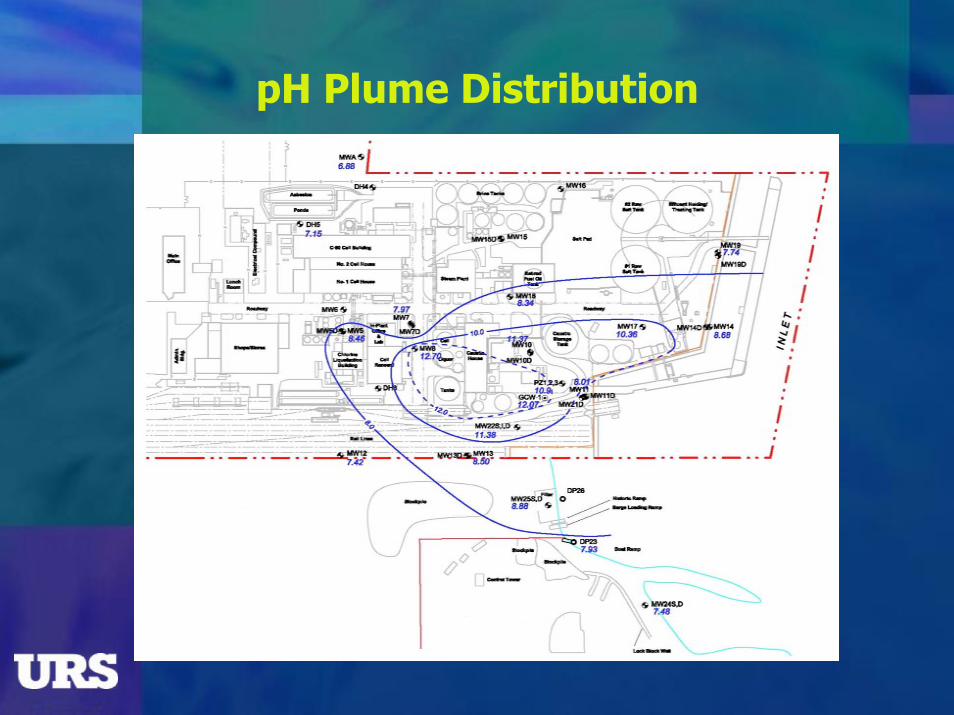
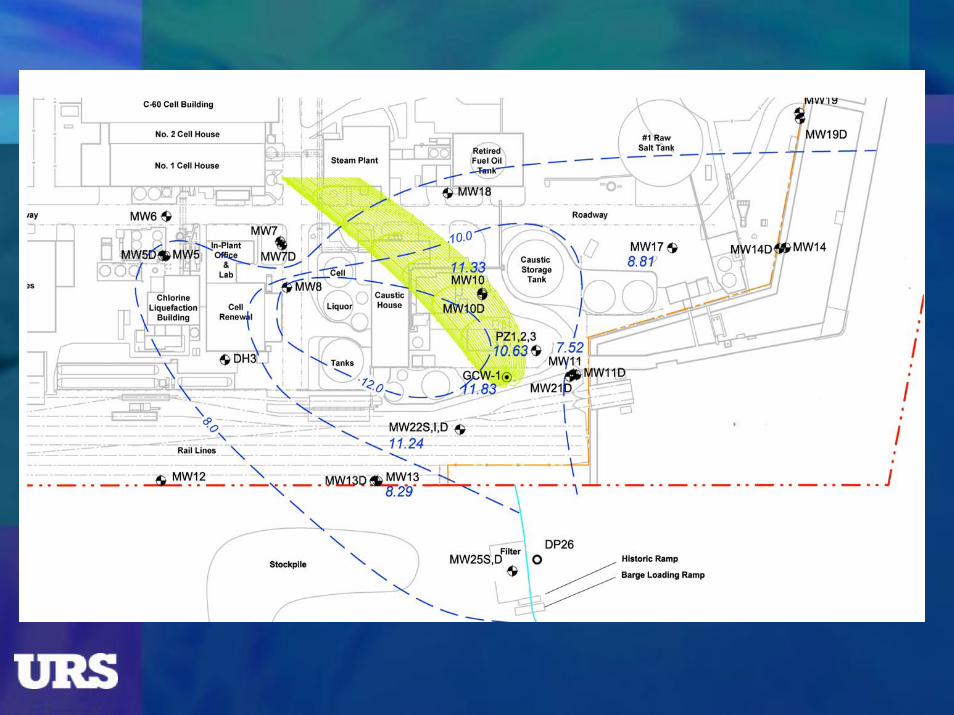
pH Plume Distribution
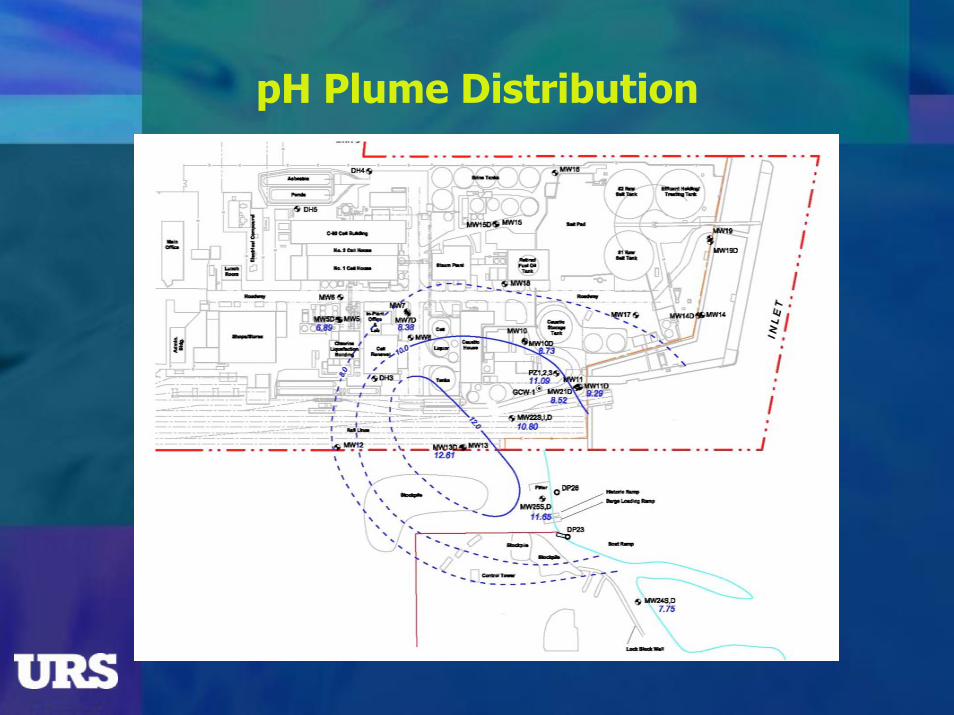
pH Plume Distribution
Summary of Receiving Environment Study Results
pH Plume
Discharge area located by direct push sampling from a barge
Area of discharge approximately 75 m2
Groundwater discharging from freshwater and saline zones of coastal aquifer
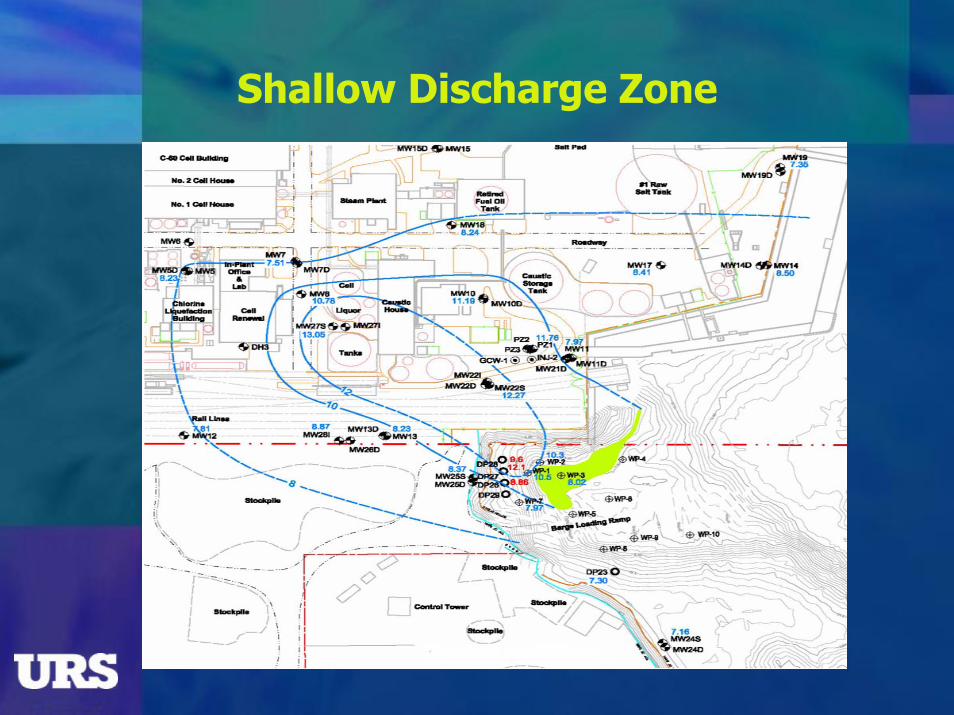
Shallow Discharge Zone
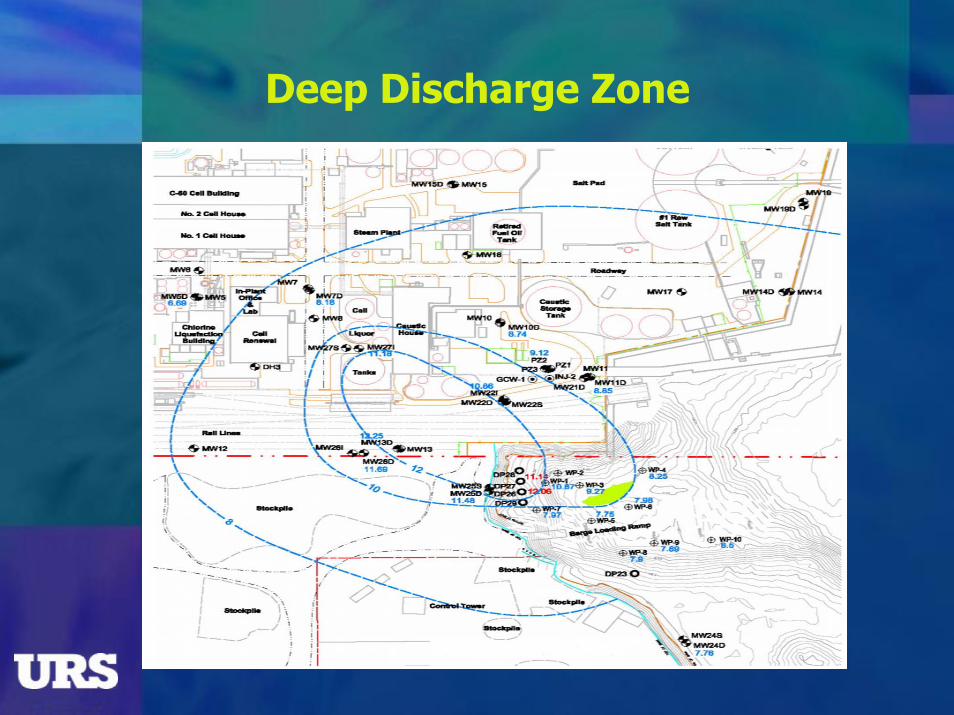
Deep Discharge Zone

Off-Site Receiving Environment Groundwater Discharge Area
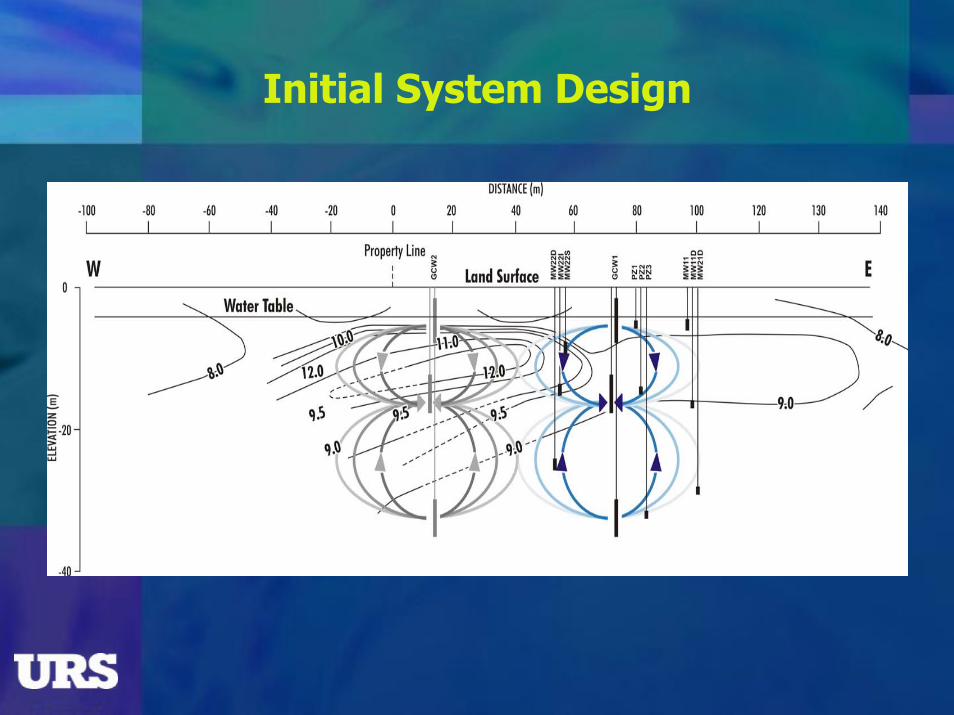
Initial System Design
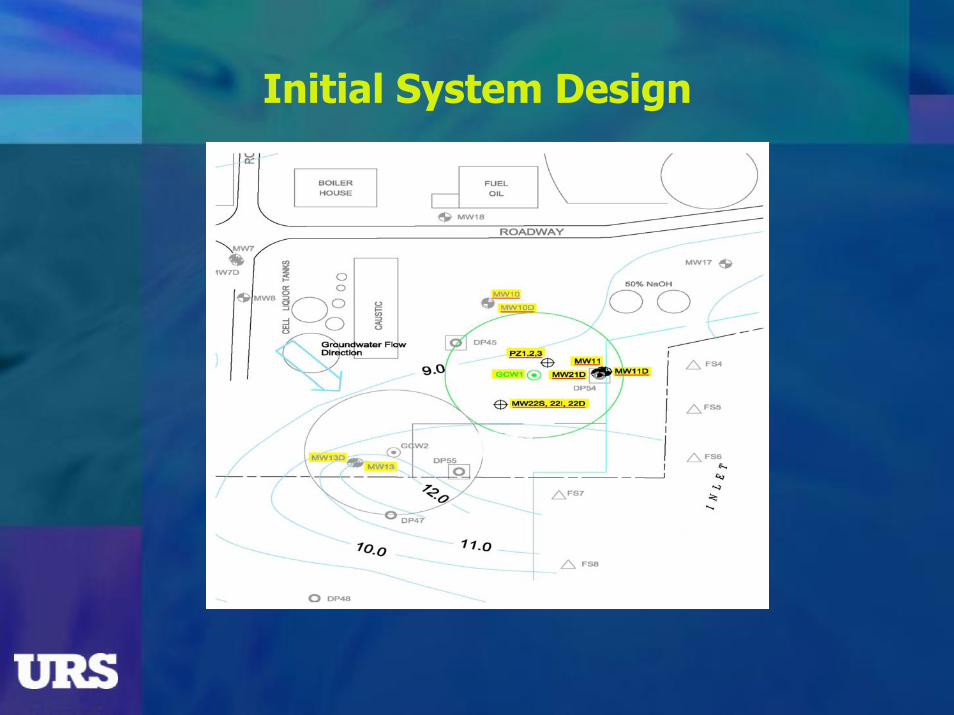
Initial System Design
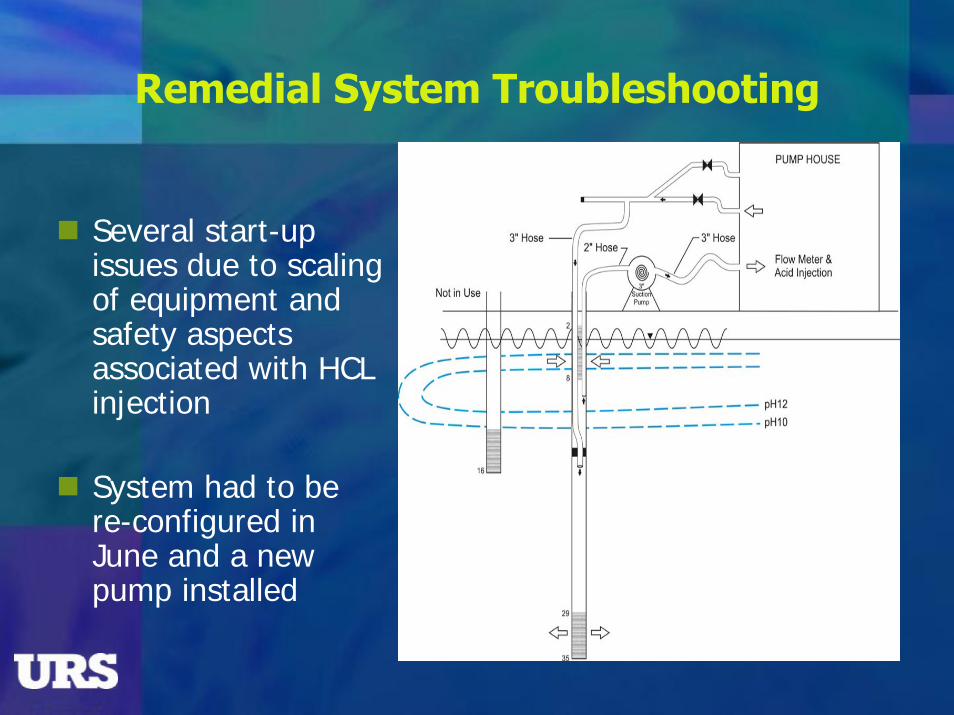
Remedial System Troubleshooting
Several start-up issues due to scaling of equipment and safety aspects associated with HCL injection
System had to be re-configured in June and a new pump installed

Remedial System Monitoring
Performed monthly monitoring of pH in system wells
pH observed to vary seasonally and over the daily tidal cycle
Comparison of annual pH values shows a decrease in some wells

pH over Daily Tidal Cycle
Fluctuation in Field pH with Time and Water Level at PZ-2
0.00
0.20
0.40
0.60
0.80
1.00
1.20
8:24 9:36 10:48 12:00 13:12 14:24 15:36 16:48 18:00
Time (hh:mm)
Gro
undwat
er E
leva
tion (m
asl)
8.
8.5
9.
9.5
10.
10.5
11.
11.5
12.
pH
Water Elevation
pH
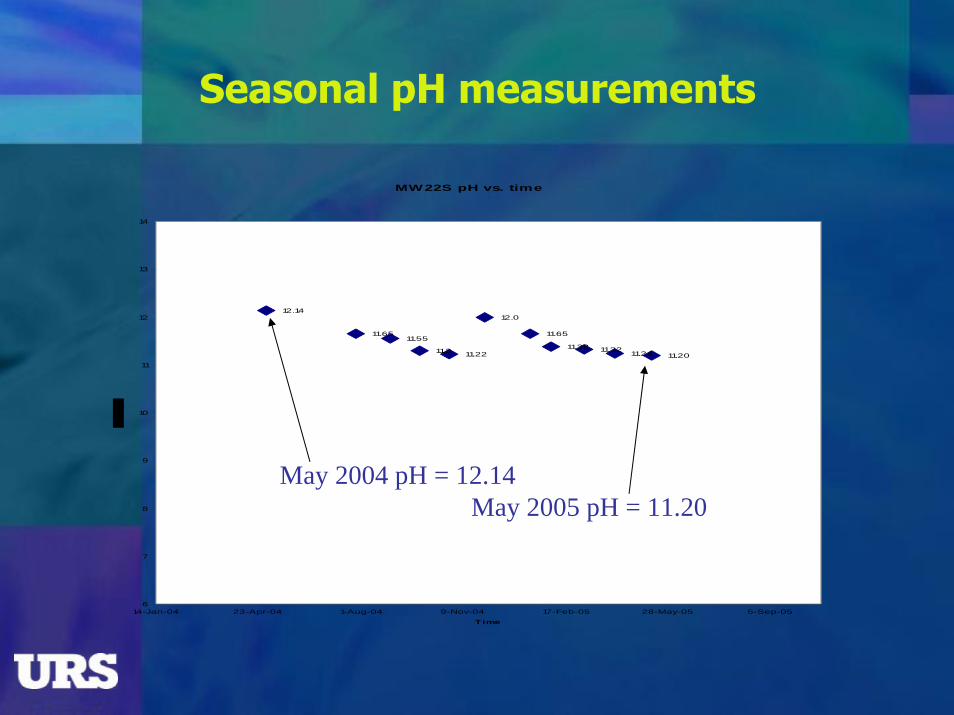
Seasonal pH measurements
MW22S pH vs. time
12.14
11.6511.55
11.3 11.22
12.0
11.65
11.38 11.3211.24 11.20
6
7
8
9
10
11
12
13
14
14-Jan-04 23-Apr-04 1-Aug-04 9-Nov-04 17-Feb-05 28-May-05 5-Sep-05
Time
May 2004 pH = 12.14May 2005 pH = 11.20

Seasonal pH measurements
PZ1 pH vs. time
12.13
11.63 11.5611.42
10.6
9.69
11.27
9.93
10.93
9.73
10.63
11.18
6
7
8
9
10
11
12
13
14
14-Jan-04 23-Apr-04 1-Aug-04 9-Nov-04 17-Feb-05 28-May-05 5-Sep-05
Time
May 2004 pH = 12.13May 2005 pH = 11.18
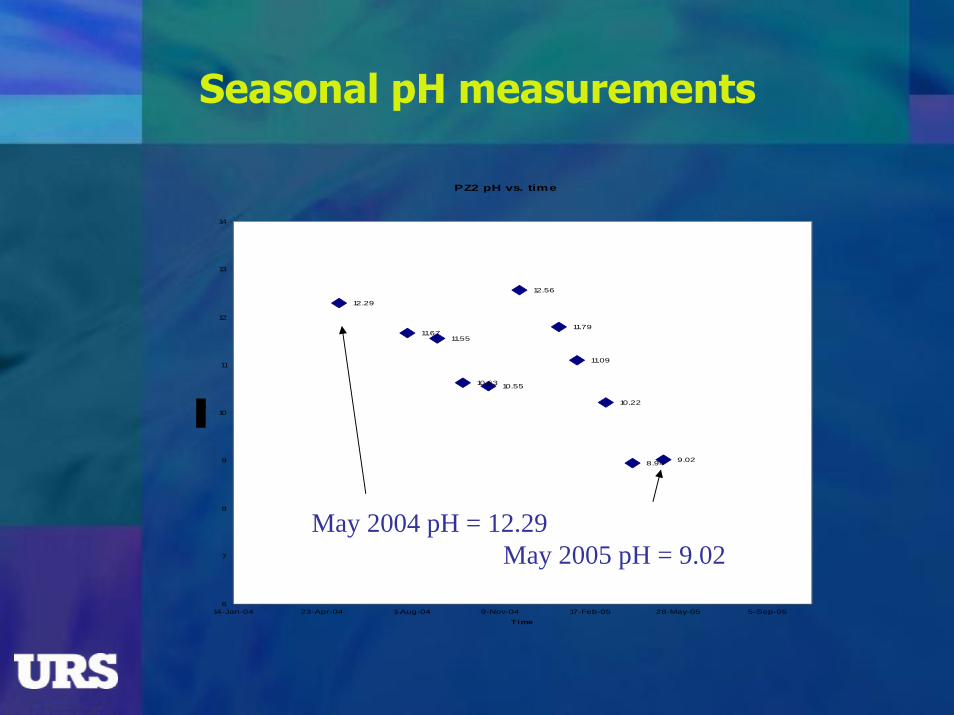
Seasonal pH measurements
PZ2 pH vs. time
12.29
11.6711.55
10.63 10.55
12.56
11.79
11.09
10.22
8.94 9.02
6
7
8
9
10
11
12
13
14
14-Jan-04 23-Apr-04 1-Aug-04 9-Nov-04 17-Feb-05 28-May-05 5-Sep-05
Time
May 2004 pH = 12.29May 2005 pH = 9.02

Remedial System Troubleshooting
Pumping rate observed to decrease over duration of pilot trial
Performed groundwater modeling to predict groundwater treatment zone at the end of the pilot trial
Figure 4. GCW Flow vs. Time
0
10
20
30
40
50
60
70
80
90
100
6/ 17/ 2004 7/ 17/ 2004 8/ 17/ 2004 9/ 17/ 2004 10/ 17/ 200 11/ 17/ 2004 12/ 17/ 200 1/ 17/ 2005 2/ 17/ 2005 3/ 17/ 2005
Time (months)
Remedial System Troubleshooting
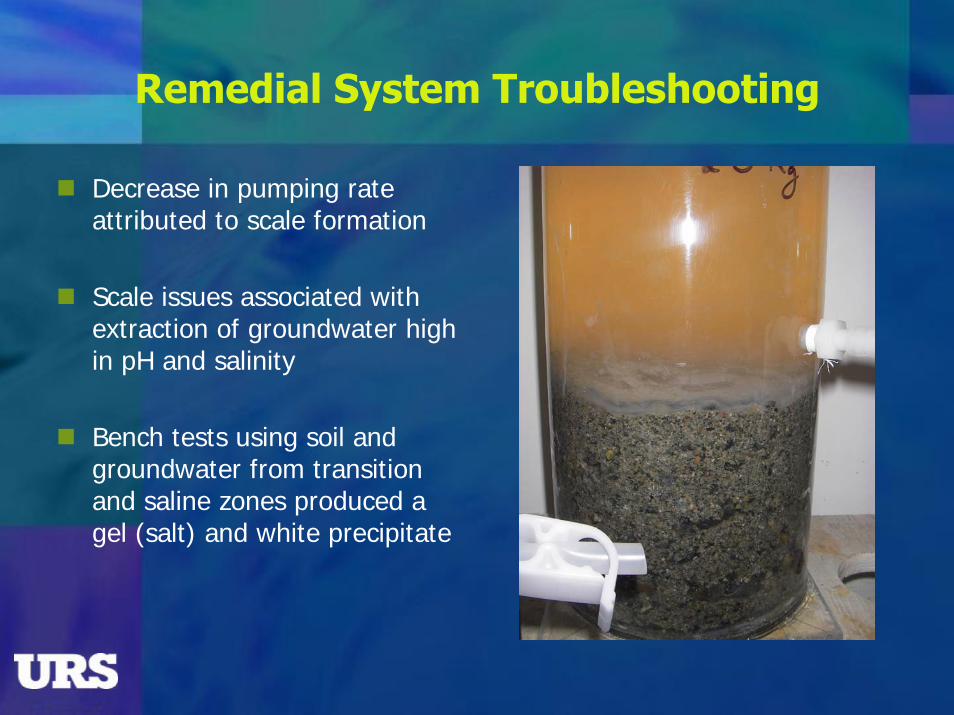
Decrease in pumping rate attributed to scale formation
Scale issues associated withextraction of groundwater high in pH and salinity
Bench tests using soil and groundwater from transition and saline zones produced a gel (salt) and white precipitate
Remedial System Troubleshooting
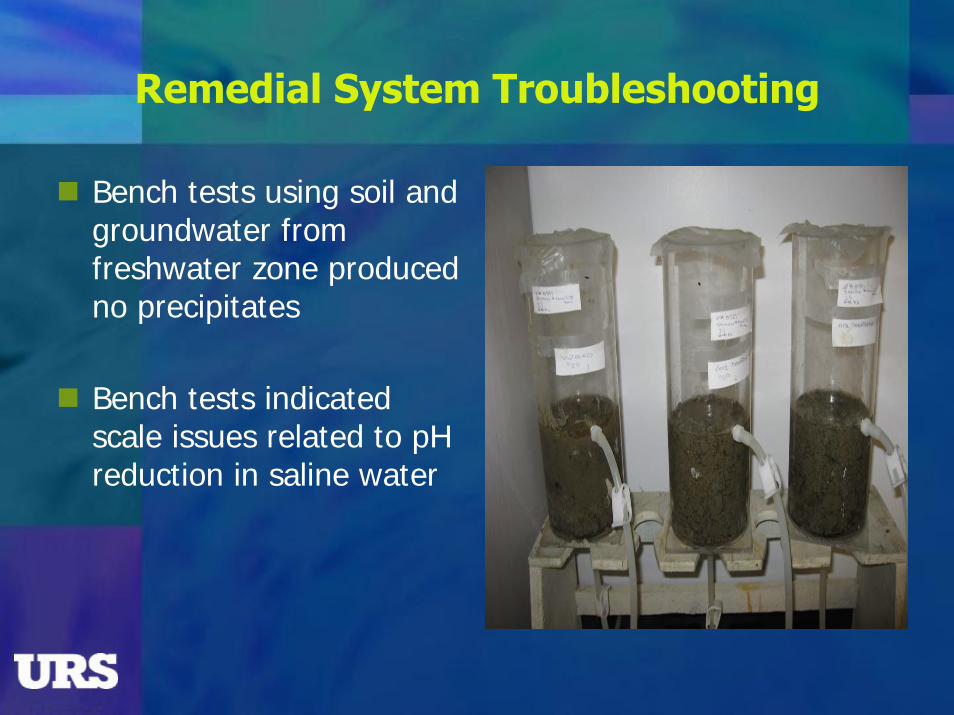
Bench tests using soil and groundwater from freshwater zone produced no precipitates
Bench tests indicated scale issues related to pH reduction in saline water
Supplemental Pilot Trial
Re-configured the system in 06 to assess feasibility of intermediate injection point (well hydraulics / fouling / scaling)
Installation of an intermediate injection well above the depth of saline groundwater
Monitored pump rates, water levels and pH in surrounding monitoring wells


Supplemental Pilot Trial – Average Daily Pump Rates
0.0
5.0
10.0
15.0
20.0
25.0
30.0
35.0
40.0
45.0
9/25
/200
69/
27/2
006
9/29/
2006
10/1/
2006
10/3/
2006
10/5
/2006
10/7
/200
610
/9/2
006
10/1
1/200
610
/13/
2006
10/1
5/200
610
/17/
2006
10/1
9/200
610
/21/
2006
10/2
3/20
0610
/25/
2006
10/27
/2006
10/2
9/200
610
/31/
2006
11/2
/200
611
/4/2
006
11/6
/200
611/
8/20
0611/
10/2
00611/
12/2
00611
/14/
2006
11/1
6/200
611
/18/
2006
11/20
/2006
11/2
2/200
611
/24/
2006
11/2
6/200
611
/28/
2006
11/3
0/20
0612/
2/20
0612
/4/2
00612
/6/2
006
Date
Pum
p R
ate
(gpm
)
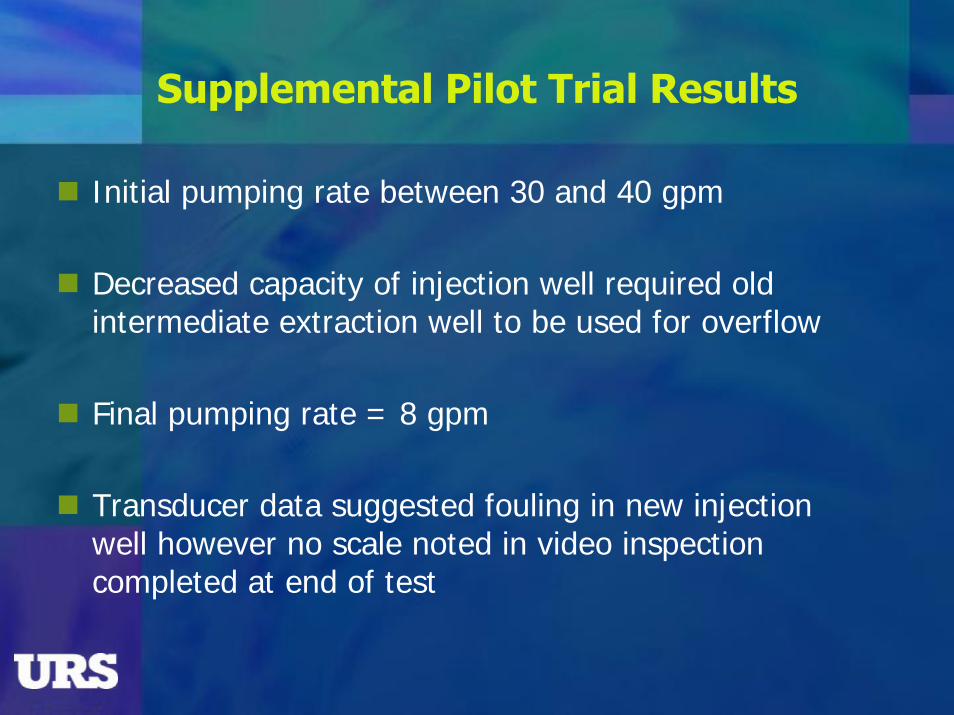
Supplemental Pilot Trial Results
Initial pumping rate between 30 and 40 gpm
Decreased capacity of injection well required old intermediate extraction well to be used for overflow
Final pumping rate = 8 gpm
Transducer data suggested fouling in new injection well however no scale noted in video inspection completed at end of test
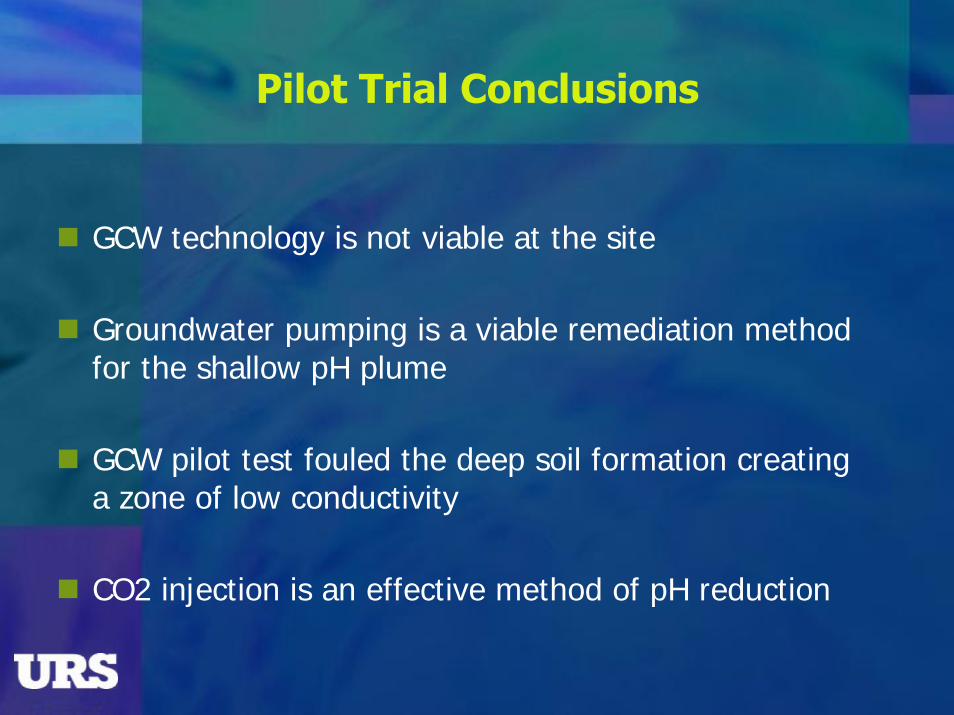
Pilot Trial Conclusions
GCW technology is not viable at the site
Groundwater pumping is a viable remediation method for the shallow pH plume
GCW pilot test fouled the deep soil formation creating a zone of low conductivity
CO2 injection is an effective method of pH reduction