Embed Size (px)
Citation preview

Pilot SAP version 3.1 9‐20‐2010 Page 1
FIELD SAMPLING PLAN AND GENERAL QUALITY ASSURANCE 1
PROJECT PLAN FOR A 2
PILOT STUDY TO ASSESS VOLUME OF MINE WASTE AND 3
CONCENTRATION OF SELECTED METALS IN STREAM AND 4
FLOODPLAIN SEDIMENTS WITHIN THE TRI-STATE MINING 5
DISTRICT IN KANSAS, MISSOURI, AND OKLAHOMA 6
PREPARED FOR 7
8
U.S. Fish and Wildlife Service 9
Draft February 5, 2010 10
Revised Draft September 24, 2010 11
12
PREPARED BY: 13
U.S. GEOLOGICAL SURVEY 14
Missouri and Oklahoma Water Science Centers 15
16
Agreement No. XXXXXX 17
18
APPROVED: 19
_____Mike Slifer _______________________Date:______________ 20 Director, Missouri Water Science Center, U.S. Geological Survey, Missouri 21
22 23
_____John Schumacher ___________________Date:______________ 24 Supervisory Hydrologist, Missouri Water Science Center, U.S. Geological Survey, Missouri 25
26 27
_____Doug Mugel ________________________Date:______________ 28 Project Chief, Missouri Water Science Center, U.S. Geological Survey, Missouri 29
30 31
_____Mark Becker ______________________Date:______________ 32 Project Chief, Oklahoma Water Science Center, U.S. Geological Survey, Oklahoma 33
34 35
_____Jim Dwyer_________________________Date: ______________ 36 U.S. Fish and Wildlife Service 37

Pilot SAP version 3.1 9‐20‐2010 Page 2
Contents 1
TABLES ......................................................................................................... 3 2
1.0 INTRODUCTION .................................................................................. 4 3
1.1PROBLEM ................................................................................................................................ 5 4
1.2 DESCRIPTION OF PROJECT OBJECTIVES AND SCOPE .............................................................. 5 5
1.3 PROJECT ORGANIZATION ........................................................................................................ 7 6
2.0 APPROACH AND METHODS .......................................................... 11 7
2.1 STREAM REACH SELECTION ................................................................................................. 11 8
2.1.1 Identification of Candidate stream reaches .................................................................. 11 9
2.1.2 Field Reconnaissance .................................................................................................... 11 10
2.1.3 Study reach selection and initial GIS mapping ............................................................. 12 11
2.2 SAMPLE SITE SELECTION AND METHODS ............................................................................ 12 12
2.2.1 Task 1. In-channel core site selection ........................................................................... 13 13
2.2.2. Task 2 Flood-plain core site selection ........................................................................ 16 14
2.2.3 Task 3 Determination of streambed sediment depth ..................................................... 17 15
2.2.4 Field GPS survey ........................................................................................................... 17 16
2.3 SAMPLE HANDLING AND FIELD PROCESSING ...................................................................... 18 17
2.3.1 Sample collection .......................................................................................................... 18 18
2.3.2 Other sediment sample collection methods ................................................................... 19 19
2.4 BOREHOLE GEOPHYSICS ...................................................................................................... 22 20
2.5 SAMPLE HANDLING AND PROCESSING ................................................................................. 22 21
2.6 ANALYTICAL METHODS ....................................................................................................... 24 22
2.6.1 Metal screening by X-Ray Fluorescence (XRF) ............................................................ 24 23
2.6.2 Laboratory Analyses ..................................................................................................... 25 24
2.7 QUALITY ISSUES ................................................................................................................... 27 25
2.7.1 Quality Control ............................................................................................................. 27 26
2.7.2 Data Quality Objectives for Measurement Data ........................................................... 28 27
2.8 DOCUMENTATION ................................................................................................................ 30 28
2.9 GEOSPATIAL ANALYSIS ........................................................................................................ 32 29
3.0 DELIVERABLES AND SCHEDULE ................................................ 32 30

Pilot SAP version 3.1 9‐20‐2010 Page 3
3.1 DELIVERABLES ..................................................................................................................... 32 1
3.2 PROJECT SCHEDULE ............................................................................................................. 33 2
4.0 REFERENCES ..................................................................................... 34 3
4
5
List of Figures (at the back of the report) 6
Figure 1. Location of candidate stream reaches to be investigated in the Tri-state Mining District 7
(TSMD). 8
Figure 2. Theoretical layout of in-channel transect and floodplain core sample sites along a 9
candidate representative study reach along Center Creek 10
Figure 3. Theoretical layout of in-channel bias and floodplain core sample sites along a candidate 11
representative study reach along Center Creek 12
Figure 4. Generalized X-Ray fluorescence (XRF) screening approach for a sediment core. 13
14
Tables 15
Table 1. Summary of key project team members. ....................................................................... 7 16
Table 2. List of target elements to be determined by Inductively-Coupled Plasma Atomic 17
Emission Spectroscopy (ICP-AES) in laboratory samples. ................................................... 26 18
Table 3. Generalized project timeline. ...................................................................................... 33 19
20
21
22
23
24

Pilot SAP version 3.1 9‐20‐2010 Page 4
1
Field Sampling Plan for a Pilot Study to Assess the 2
Volume of Mine Wastes and Concentration of Selected 3
Metals in Stream and Floodplain Sediments within the 4
Tri-State Mining District in Kansas, Missouri, and 5
Oklahoma 6
7
1.0 Introduction 8
Lead and zinc mining beginning in the mid-1800’s in the Tri-State Mining District (TSMD) has 9
left a legacy of mine waste distributed throughout the region. Waste products from the mining, 10
milling and extraction of ore include chat and tailings which contain elevated concentrations of 11
lead (Pb), zinc (Zn), and cadmium (Cd). Generally, chat is small gravel size material (0.6 – 1.6 12
cm) while tailings are sand sized (2 mm or less). Because of the size of tailings, they are easily 13
mobilized into streams and waterways and transported great distances from their source. Over 14
time, chat and tailings have become incorporated into streams resulting in increased 15
concentrations of Pb, Zn, and Cd in sediments. Because of the easily mobilized nature of tailings, 16
during flood events, tailings may also be deposited in overbank and floodplain deposits and could 17
be transported downstream when these sediments become reintroduced into the active stream 18
channel. The environmental contamination caused by decades of mining activity resulted in 19
several counties in the region being listed on the U.S. Environmental Protection Agency’s 20
(USEPA) National Priority List as Superfund hazardous waste sites. 21
22
Currently (2010) the USEPA is actively remediating mine sites (tailings and coarser “chat” 23
dumps, mine shafts, mine seeps, and associated facilities) in the TSMD. Recent studies by 24
theU.S. Geological Survey (USGS), in cooperation with the U.S. Fish and Wildlife Service 25
(USFWS), and the Kansas Department of Health and Environment (KDHE) and USEPA 26
(Regions 6 and 7) documented Pb, Zn, and Cd concentrations in sediment that far exceeded 27
background levels as well as probable effects guidelines for adverse biological effects for aquatic 28
biota (Pope, 2005; Juracek, 2006; Ingersoll and others, 2009; McDonald and others, 2000). These 29

Pilot SAP version 3.1 9‐20‐2010 Page 5
studies sampled deposited sediment in the Spring River and its tributaries Empire Lake in 1
Cherokee County, Kansas, Tar Creek, and Empire Lake in Cherokee County, Kansas and Grand 2
Lake O’ the Cherokees (Grand Lake) in Oklahoma. The adverse effect of the mining-related 3
contamination on freshwater mussels was documented by Angelo and others (2007). 4
5
1.1Problem 6
7
As remediation of mine source areas continues, increased attention is being focused on the extent 8
and magnitude of metals contamination in area streams, in particular, obtaining reliable 9
information on the distribution and volume of mine tailings and their associated metals contained 10
within stream and floodplain sediments in the TSMD. Standard practice for determining the 11
extent of metal contamination in streambed sediments is the collection of samples from the upper 12
few centimeters of the streambed, either in a biased manner by targeting depositional areas of 13
finer sediments behind rocks, etc., or collecting a composite of subsamples along one or more 14
transects across the stream. While these methods are effective at characterizing the spatial or 15
downstream extent of contamination, they do not provide information on the depth of 16
contamination or variability in contamination within stream features, such as bars, riffles, pools, 17
etc. While some tailings deposits currently are exposed in sand or gravel bars within and adjacent 18
to the stream, an unknown volume has been transported and redeposited and may be covered by 19
native sediments or vegetation, or exist in deep pools. The thickness of these deposits is unknown 20
but likely variable across and along the stream. Presently (2010), while the aerial extent of 21
contamination is generally known, there is insufficient information to allow for estimates of the 22
actual volume of contaminated sediments and mass of mining-related metals in the streams or on 23
the adjacent floodplains. 24
25
1.2 Description of Project Objectives and Scope 26
27
The primary objective of this investigation is to characterize the lateral and vertical extent of 28
mining-related metals contamination in streambed and adjacent floodplain sediments along 29
selected representative reaches of streams in the TSMD. This pilot study is designed to 30
supplement existing surficial streambed sediment data, and an ongoing USEPA floodplain study 31
in the Cherokee County, Kansas, by providing previously unknown information on the depth of 32
mine waste contamination within the stream channel (bank to bank) and adjacent floodplain, and 33
Pilot SAP version 3.1 9‐20‐2010 Page 6
allow estimates to be made of the volume of contaminated sediment within the selected stream 1
reaches. Sediment samples will be collected from within the active stream channel (hereinafter 2
referred to as in-channel) and from the adjacent floodplain using a variety of techniques and 3
drilling platforms. An important result of this effort will be a determination of which methods are 4
most appropriate to obtain sediment samples. 5
6
A traditional method to characterize subsurface contamination is to obtain depth dependent 7
sediment samples. Cores of sediment provide an intact representative sample of the sediment/soil 8
profile at the location of the core and an appropriate density of cores is needed to adequately 9
characterize the subsurface. However, a traditional sediment-core characterization of affected 10
streams in the district is impracticable because the heterogeneous nature of the sediments and the 11
broad scale of the impacted area necessitate a large number of cores and corresponding expense. 12
A pilot-scale assessment of representative reaches of streams in the Ozark Plateaus and Osage 13
Plains physiographic provinces in the TSMD is proposed. Results from this pilot assessment will 14
provide information on the vertical and lateral extent of mine waste and associated metals and 15
allow for comparison of several methods to estimate volumes of contaminated sediments along 16
the study reaches. This information, combined with geospatial information, could then be used to 17
extrapolate to the full length of the streams draining the TSMD or design a cost-efficient method 18
for a district-wide assessment of the volume of mine tailings and mass of metal contamination in 19
streams across the TSMD. Data density within these representative reaches will be higher than 20
anticipated during a district-wide implementation. 21
22
23
Preliminary discussion with the USFWS and USEPA, have defined streams of interest for this 24
study. Sediment samples will be collected from representative reaches on Center Creek, Turkey 25
Creek, and Shoal Creek in Missouri, Tar Creek in Oklahoma, and along two reaches of the Spring 26
River in Kansas. Up to 25 samples will be collected from each selected reach and the adjacent 27
flood plain. Core samples will be logged by a field geologist and screened with X-ray 28
fluorescence (XRF) for bulk concentrations of Pb, Zn, and Cd. A subset of the field XRF scans 29
will be verified with laboratory split samples. A geomorphic analysis of the study reach will be 30
done to provide an estimate of the volume of unconsolidated sediments within the stream channel 31
and fraction of those sediments contaminated with mine waste utilizing a Geographic Information 32
System (GIS) and field estimates of sediment thickness using tile probe measurements and a field 33
differential Global Position System (DGPS) survey of primary channel features (primarily bars). 34

Pilot SAP version 3.1 9‐20‐2010 Page 7
1
Data will be collected at several scales, such as digitizing features using the 2009 imagery and the 2
GIS versus field DGPS mapping of primary channel features and the comparison of higher 3
density sediment or composite sediment samples to lower density sampling methods, to provide 4
information for optimization of methods that might be used for scaling up to a larger district-wide 5
assessment. Results of investigation, including the evaluation of sediment collection methods, 6
geomorphic analyses, and analytical data will be published in a USGS interpretive report. 7
8
1.3 Project organization 9
The following is a summary of project team members, organizational structure, and 10
responsibilities. The project is a coordinated effort between the USGS Missouri and Oklahoma 11
Water Science Centers (WSC). The USGS will organize two field teams to meet the two general 12
project tasks of in-channel and floodplain core sampling (Table 1). The in-channel sampling team 13
will be headed by the Oklahoma WSC and the floodplain coring team will be headed by the 14
Missouri WSC. Except for Tar Creek, the Missouri WSC is primarily responsible for the 15
reconnaissance, selection of the study reaches, obtaining landowner consent and utility 16
clearances, conducting floodplain sampling, and maintaining the project GIS database. The 17
Missouri WSC also will be responsible for coordination with the ongoing USEPA Spring River 18
Floodplain study in Cherokee County, Kansas and ensuring data compatibility between the two 19
studies. Data review and compilation, database management, and GIS support is primarily the 20
responsibility of the Missouri WSC. The Oklahoma Center is primarily responsible for initial 21
preparation of the SAP, in-channel coring activities, and will lead all activities at the Tar Creek 22
study area. The Oklahoma WSC will also be responsible for coordination of XRF analytical 23
support from the USFWS, as needed. The final report will be jointly co-authored by both the 24
Missouri and Oklahoma WSC. Key individuals participating in the project and their specific roles 25
and responsibilities are discussed below: 26
27
Table 1. Summary of key project team members. 28
Function Team member Project Role Title Office Project Management Team
Jim Dwyer Overall project coordinator
Environmental Protection Specialist
USFWS
Dave Mosby (or designee)
USFWS Analytical Support
Fish and Wildlife Specialist
USFWS

Pilot SAP version 3.1 9‐20‐2010 Page 8
Mike Slifer USGS Approval official
Director Missouri WSC
John Schumacher USGS/FWS project liaison
Supervisory Hydrologist
Missouri WSC
Doug Mugel Project principle investigator
Hydrologist Missouri WSC
In-channel field team
Mark Becker Team leader Hydrologist Oklahoma WSC
-- Team member Technician Oklahoma WSC Jacob Morris Team member Technician Missouri WSC Mike Kleeschulte Team member Hydrologist Missouri WSC Doug Mugel Team member Hydrologist Missouri WSC Floodplain sampling team
Doug Mugel Team leader Hydrologist Missouri WSC
Paul Brenden Team member Technician Missouri WSC Jacob Morris Team member Technician Missouri WSC Mike Kleeschulte Team member Hydrologist Missouri WSC Mark Becker Team member Hydrologist Oklahoma WSC Project GIS Joe Richards GIS specialist Hydrologist Missouri WSC Project Reporting Mark Becker Project lead author Hydrologist Oklahoma WSC Doug Mugel Project coauthor Hydrologist Missouri WSC John Schumacher Project coauthor Hydrologist Missouri WSC 1
Jim Dwyer, USFWS, Project Manager – the primary decision maker for the project and the 2
primary user of the data to determine if project results meet the study objectives and if further 3
investigation in the study area is required and to what extent. His primary duties are: 4
- Overall responsibility for the investigation. 5
- Reviewing and approving the project SAP. 6
- Reviewing reports and ensuring plans are implemented according to schedule. 7
- Coordinate with Tri-State Case Managers related to study plans, implementation, results, 8
and reporting. 9
10
Dave Mosby (or designee) USFWS Fish and Wildlife Biologist 11
- Provide XRF analytical support in the field and/or laboratory 12
13
Mike Slifer, USGS Approving official –Director of the Missouri Water Science Center; will 14
serve as the approving official for all USGS activities for the project. Specific project duties 15
include: 16
- Reviewing and approving the project SAP. 17
- Ensuring that study objectives are relevant and within the mission of the USGS. 18
- Reviewing reports and ensuring plans are implemented according to schedule. 19
Pilot SAP version 3.1 9‐20‐2010 Page 9
- Making final project decisions with the authority to commit the necessary resources to 1
conduct the project. 2
- MOWSC approving official for the project final report. 3
4
John Schumacher, Overall USGS Project coordinator – The USGS Project coordinator has 5
the following specific responsibilities: 6
- In conjunction with project technical team, revises the SAP as needed to define project 7
goals and activities. 8
- Serve as a liaison between USGS and FWS and coordinates overall field and laboratory 9
activities (field XRF screening) associated with the project and prepares project updates. 10
- Coordinates with project team members to ensure project operates within allotted schedule 11
and budget. 12
-Provides technical assistance to the project team members on matters related to geochemical 13
processes, sampling protocols, and quality-assurance (QA) issues. 14
- Coordinates with ongoing USEPA Region 7 studies and activities in the TSMD. 15
Doug Mugel, Principal Investigator–Missouri Project Leader. Will oversee project activities in 16
Missouri, including Center Creek, Turkey Creek, and Shoal Creek. Doug has the following 17
specific responsibilities: 18
- Responsible for reconnaissance and selection of study area on Center, Turkey, and 19
Shoal Creeks. This includes coordination and obtaining access from landowners, and 20
utility clearances. 21
- Serve as head of the floodplain sampling team. Coordinate overall field and 22
laboratory activities associated with sampling of flood-plain soil. 23
- Conducts project activities in accordance with the SAP within the allotted time frame 24
and document and obtains approval for deviations. 25
- Verify and validate field and laboratory data generated from sampling activities. 26
- Ensures that all relevant project data and sample sites are properly entered into the 27
USGS National Water Information System (NWIS). 28
- Assists in the preparation of report describing the extent and magnitude of mining 29
contaminated sediments in the representative stream reaches studied. 30
31
Mike Kleeschulte, Project team member–Missouri. Mike will serve as a field team member 32
and will provide support to the Principle Investigator and be capable of fulfilling any of the 33
responsibilities of the Principle Investigator. 34

Pilot SAP version 3.1 9‐20‐2010 Page 10
1
Mark Becker, Lead Author –Oklahoma Project Leader. Mark’s specific project duties include: 2
- Responsible all field activities at the Tar Creek study reach ( reconnaissance, access, 3
utility clearance, sampling). 4
- Serve as head of the in-channel sampling team. Coordinates overall field activities 5
associated with in-channel sediment sampling. 6
- Project lead author responsible for preparation of the final study report. 7
- Verify and validate field and laboratory data generated from sampling activities. 8
- Ensures that all relevant project data for the Tar Creek area are properly entered into 9
the NWIS. 10
- Ensures that field activities follow USGS safety protocols and boat operations plans. 11
- Coordinates project activities with USEPA Region 6 activities in the Oklahoma part 12
of the TSMD. 13
14
Paul Brenden, Hydrologic technician – Missouri. Drill rig operator. Primary responsibility 15
includes safe operation, maintenance, and cleaning of drill rigs and sampling equipment. 16
17
Jacob Morris, Hydrologic technician – Missouri. Jacob will function in a key role in the 18
collection of field data and preparation of geologic logs, and compilation and review of field 19
XRF, laboratory, and geologic data. He will also assist with or operate drilling and sampling 20
equipment. 21
22
David Detra, USGS Central Region Mineral Resource Team –As the coordinator for 23
analytical services by the USGS Central Region Mineral Resource Assessment Team (CRMR), 24
is responsible for coordinating the analysis of sediment samples for laboratory grain-size and 25
elemental analysis and validation of laboratory data. This coordination will include the receipt of 26
samples at the laboratory, selection of the analytical team, verification that internal laboratory 27
audits are conducted per standard CRMR operating procedures (SOP’s). Dave will coordinate 28
internal laboratory QA procedures to include the analysis of standard reference samples (control 29
samples) and split-replicate samples. Associated laboratory QA data and any identified laboratory 30
problems will be reported to the project Principal Investigator as soon as they are determined. 31
32

Pilot SAP version 3.1 9‐20‐2010 Page 11
2.0 Approach and Methods 1
Some stream sampling locations will present access problems and difficulties in obtaining 2
representative samples. Initially, data collection will take place at 1 or 2 streams to determine 3
which approach and sampling methods are best suited for achieving the objectives of this project. 4
While it is understood that each stream has its unique attributes that may require a unique 5
approach and different methods, the lessons learned from the initial sampling will be applied to 6
the remaining streams. 7
2.1 Stream Reach Selection 8
2.1.1 Identification of Candidate stream reaches 9
Based on discussions with the USFWS and other members of the Trustee Councils of Tri-State, 10
five streams in the TSMD were selected to be included in this pilot study (1) Center Creek, (2) 11
Turkey Creek, (3) Shoal Creek, (4) Tar Creek, and (5) Spring River. One representative study 12
reach will be investigated along each stream except for the Spring River, where two reaches will 13
be selected to coincide with locations of the USEPA Spring River floodplain study (fig. 1). In-14
channel samples will be collected from all reaches. Samples will be collected from the floodplain 15
of all streams except Spring River, as floodplain coring of Spring River is part of the USEPA 16
Cherokee County study. Stream reaches selected for sampling will be selected based upon the 17
proximity to downstream tributaries, access, and evidence of extensive stream alteration since 18
mining has occurred. Historical aerial photos will be compared with recent photos to determine 19
anthropogenic or natural changes that may affect or bias the results. Stream segments in Missouri 20
selected for sampling must contain several of the geomorphic channel units (GCU) such as pools, 21
riffles, and runs. These are common characteristics in Ozark streams within the TSMD. Tar Creek 22
is a typical prairie stream and does not naturally contain the course sediment found in Ozark 23
streams. 24
25
2.1.2 Field Reconnaissance 26
After candidate reaches have been selected a field reconnaissance of the locations will be done to 27
verify that the reaches contain the primary GCUs and that there is adequate access to the stream 28
reach. Notes will be taken on approximate stream width, type and number of physical features 29
within the channel (bars, riffles, manmade features, bank heights, obvious utilities, etc.) and 30
floodplain (natural levees, terraces, old meanders, and cultural features), and a determination 31
made if the reach is wadeable or non-wadeable. Physical conditions of the stream bank (height, 32
slope, vegetative cover, etc.), water depth, and access will dictate the types of equipment that can 33

Pilot SAP version 3.1 9‐20‐2010 Page 12
be used at the site (hand operated, tractor or ATV, vehicle access). During the reconnaissance, a 1
tentative layout of in-channel and floodplain core locations will be made to estimate the number 2
of cores and samples to be collected at each candidate reach. A hand-held GPS will be utilized to 3
provide estimated locations of transects and core locations and to locate noteworthy features 4
observed such as tailings exposures, utilities, target areas of bias sampling (old cutoff meanders, 5
etc.) It is anticipated that most access will be on or across private property and an important focus 6
of the field reconnaissance will be contacting and securing access from property owners. Study 7
reaches will be moved or adjusted depending on access restrictions. More than one 8
reconnaissance may be required for each reach. 9
10
2.1.3 Study reach selection and initial GIS mapping 11
Based on the field reconnaissance, study reaches will be selected, a layout of proposed in-channel 12
sample sites will be done using a GIS. Any specific points of interest noted during the field 13
reconnaissance (old channel meanders or mine shafts, tailings exposures) that may affect the 14
study design will be imported into the GIS. The layout will include determination of the length of 15
the study reach, proposed locations and number of in-channel and floodplain sample locations. 16
The base map for the study will be 2009 NAIP imagery with overlays of the 1938 Soil 17
Conservation Service (SCS) imagery. The location of depositional features in the channel (bars 18
and riffles) observed on the 2009 imagery will be digitized using the GIS to provide an estimate 19
of the area of these features along each study reach for comparison to the mapping of these 20
features during the field effort. The results of this comparison will be used to determine the 21
validity of using GIS mapping to extrapolate beyond the selected reaches to other portions of the 22
streams. Coordinates of the study reach and of proposed subsurface activities will be used to 23
obtain the required utility clearances (e.g. Missouri One-Call). More than one visit to each study 24
reach may be required to stake locations of floodplain core sites and verify locations of marked 25
utility crossings. 26
27
2.2 Sample Site Selection and Methods 28
29
The following sections describe the theoretical approach for the collection of samples along each 30
representative stream reach. One of two general approaches will be used at each stream reach. In 31
addition to floodplain core sampling, the initial approach for each stream reach will be to collect 32
in-channel samples at sites along transects. However, because of the expected heterogeneous 33

Pilot SAP version 3.1 9‐20‐2010 Page 13
nature of sediment distribution in at some if not all in-channel streams reaches, the possibility that 1
regularly-spaced samples along a transect might not adequately represent the sediments in the 2
reach, and other issues such as access at transects, the transect approach may not yield suitable 3
samples, and a directed (bias) approach to sites where sediment accumulations are observed may 4
instead be used. The determination of sample approach will be made during sampling depending 5
on conditions encountered. Results from initial sampling will help direct the approach in 6
subsequent sampling. One outcome of this pilot study will be the determination of which of these 7
approaches is most suitable for sediment sampling of the TSMD. Also, because of the uncertainty 8
of subsurface conditions and physical limitations regarding the collection of in-channel core 9
samples, sample methods, including modifications to methods described herein or new methods 10
will to some extent be determined at the time of sample collection. 11
12
Sample collection along each representative stream reach will be divided into two tasks. Task 1 13
will involve the collection of in-channel samples (between top of banks). Task 2 will involve the 14
collection of core samples from the floodplain adjacent to the sampled stream reach. A third, non-15
sample task (task 3) will be to estimate the depth of in-channel sediments along the study reach 16
using a tile probe or maximum refusal depth from coring. The following describes the general 17
approach to the layout of sample sites along a representative stream reach. As an example, a 18
possible layout of in-channel and floodplain cores along a candidate study reach along Center 19
Creek is shown in figure 2. The candidate reach shown in figures 2 and 3 is along the lower part 20
of Center Creek about 0.7-mi (miles) upstream from the mouth. This area was identified because 21
of a complex series of old channel meanders and channel alternations, including a low-water dam 22
evident on the 1938 air photograph. 23
24
Figure 2. Theoretical layout of an in-channel transect and floodplain core sample sites along a 25
candidate representative study reach along Center Creek. 26
27
2.2.1 Task 1. In-channel core site selection 28
29

Pilot SAP version 3.1 9‐20‐2010 Page 14
A maximum of 20 in-channel core samples will be collected along each representative stream 1
reach. For the transect approach, in-channel sediment samples are proposed to be collected using 2
three strategies: 3
4
Transect sampling --by selecting transects perpendicular to the stream channel crossing the 5
stream at a specific GCU within the study reach (9 to 15 samples), 6
Longitudinal sampling --by evenly dividing the length of the study reach and placing one 7
core in the middle of the channel at each interval (3 to 5 samples), 8
Special sampling to target unusual features may be done, to supplement other samples (0 to 2 9
samples). 10
11
The number of transects in each GCU (one or two) and spacing of sample sites along each 12
transect will be dependent on the channel complexity along the study reach and width (between 13
top of banks) of the channel, and access from adjacent landowners. The spacing of cores along 14
each transect will be determined by dividing the channel width at that transect location (W) by 15
(n+1) where n is the number of cores (typically 3 or 5 depending on whether one or two transects 16
per GCU are done) to be collected along the transect. The first core sample will be collected at 17
W/(n+1) feet from the top of the right bank (looking downstream). Using this method, core 18
spacing along each transect will vary depending upon the channel width at each cross section. 19
Transects will be labeled with a letter designation beginning with “A” and increasing from 20
upstream to downstream order. Core sites will be numbered from the right bank (looking 21
downstream) beginning with “01”. Generally cores along a transect will not be spaced closer 22
than about 25 ft, such that only three cores are planned if the channel is less than about 100-ft 23
wide. 24
25
As part of the transect approach and to test this approach, longitudinal sampling will be done to 26
compare with the results from transect sampling. Generally these samples will be collected after 27
the transect samples have been collected. Spacing of the samples will be done by dividing the 28
length of the study reach by (n+1) where n is the number of longitudinal samples to be collected. 29
Depending upon the complexity of the channel and number of transect samples collected, three to 30
five longitudinal samples will be collected. The samples will be collected from the center of the 31
channel (midpoint between banks) and thus could be from within a pool, riffle, run, or gravel bar, 32
depending on the feature present at that location. Longitudinal cores will be given a “L” prefix 33
and numbered in downstream order beginning with “L01” at the upstream location. It is possible 34
Pilot SAP version 3.1 9‐20‐2010 Page 15
that unusual features may be encountered along a study reach that were not sampled by the 1
transect or longitudinal samples. These features may be selected for special sampling (maximum 2
of two samples). Such unusual features may include a depositional area of fine grained material 3
or an accumulation of visually identified tailings immediately upstream or downstream from a 4
pipeline crossing or low-water bridge. Special samples will be given an “S” prefix and numbered 5
sequentially in the order collected. 6
7
The alternative approach to the transect approach is directed (bias) sampling at locations where 8
sediments are known to occur in substantial thicknesses. This approach may be superior to the 9
transect approach if the transect sample sites, which are determined by regular spacing along the 10
transect, are not located where sediments are thick enough to yield samples representative of the 11
reach, or are located where access or other issues present a problem. If this appears to be the case 12
at the time of sampling, the decision will be made to collect samples using the bias approach. Up 13
to 20 samples would be collected along the length of the reach, primarily in bars where sediments 14
are thick, but also including up to 5 samples in the wetted channel (in-stream) where sediment 15
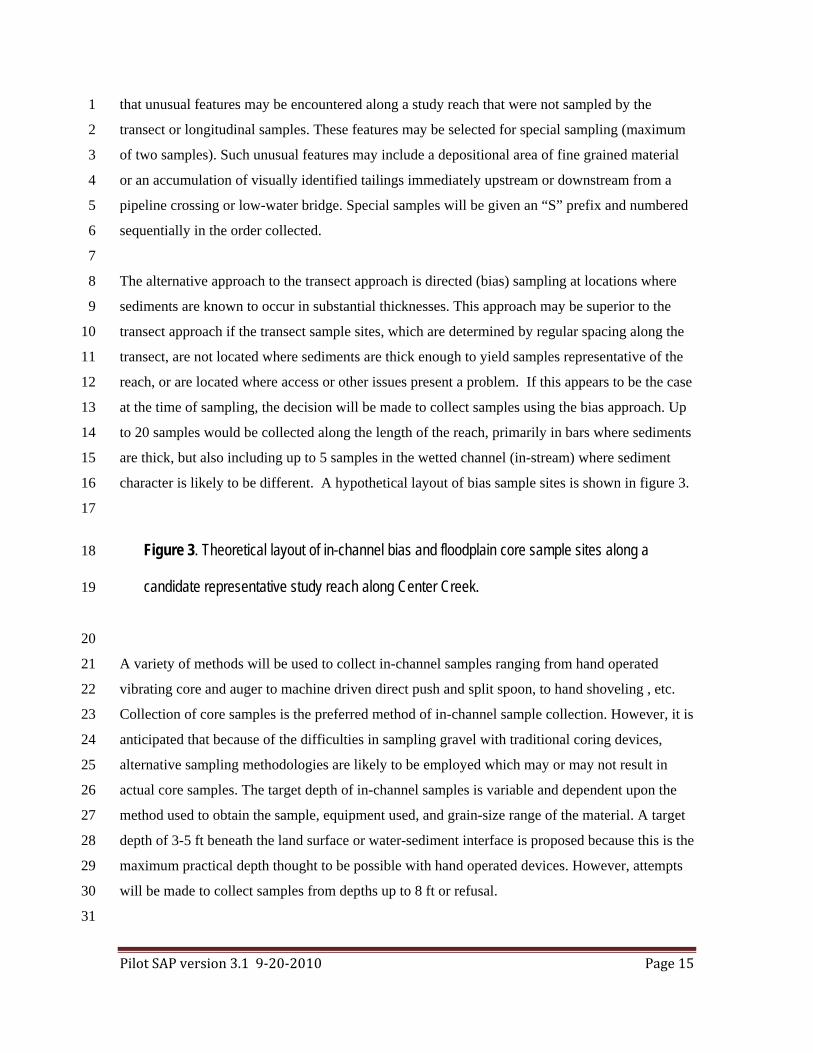
character is likely to be different. A hypothetical layout of bias sample sites is shown in figure 3. 16
17
Figure 3. Theoretical layout of in-channel bias and floodplain core sample sites along a 18
candidate representative study reach along Center Creek. 19
20
A variety of methods will be used to collect in-channel samples ranging from hand operated 21
vibrating core and auger to machine driven direct push and split spoon, to hand shoveling , etc. 22
Collection of core samples is the preferred method of in-channel sample collection. However, it is 23
anticipated that because of the difficulties in sampling gravel with traditional coring devices, 24
alternative sampling methodologies are likely to be employed which may or may not result in 25
actual core samples. The target depth of in-channel samples is variable and dependent upon the 26
method used to obtain the sample, equipment used, and grain-size range of the material. A target 27
depth of 3-5 ft beneath the land surface or water-sediment interface is proposed because this is the 28
maximum practical depth thought to be possible with hand operated devices. However, attempts 29
will be made to collect samples from depths up to 8 ft or refusal. 30
31

Pilot SAP version 3.1 9‐20‐2010 Page 16
A hierarchy of sampling methods will be used for in-channel sampling, starting with mechanical 1
core drill rigs (truck, tractor, or ATV mounted). Locations that are accessible by these drill rigs 2
(gravel bars and shallow riffles, if access to these locations across floodplains is possible) are 3
areas where continuous cores to depths to 8 ft may be possible given favorable grain-size and 4
other conditions, resulting in high-resolution vertical characterization of the sediments and their 5
metal contents. Where larger cobbles are encountered, those zones may be bypassed or larger 6
diameter “split spoon” type samples attempted. If grain-size is not too large, the most reliable 7
samples can be obtained using 2-in diameter core tubes with disposable liners that can be 8
advanced to specific depths, opened, and “pushed” to obtain core samples from saturated 9
materials that would otherwise collapse within an unlined borehole. Larger diameter (5-in. or 10
larger) split spoon samples can be used, however, these larger tools are limited to about 5 ft 11
below the water table or water-sediment interface because they will be advanced in an open 12
borehole. Remote areas not accessible by the truck or ATV drill rigs will be limited to hand 13
operated power equipment. On gravel bars and in shallow (less than about 2 ft of water depth) 14
riffles several methods ranging from vibratory and gasoline powered augers combined with 15
vibratory techniques [limited to smaller diameter (2-in or less) core tools] can be attempted (Box 16
and others, 2001). Hand methods likely will be limited to depths of less than 5 ft. For in-stream 17
samples in non-wadeable conditions, a floating platform will need to be used. This may consist of 18
a john boat, dock floats, or a pontoon boat. 19
20
2.2.2. Task 2 Flood-plain core site selection 21
Core samples from the floodplain will be collected along each representative reach where in-22
channel samples are collected. About 5 to 10 floodplain core samples will be collected along each 23
representative reach. The number of floodplain core samples is dependent upon the number of in-24
channel samples collected (maximum of 25 in-channel plus floodplain samples per study reach), 25
the length of the study reach, and complexity of floodplain features. Locations of floodplain core 26
samples will be determined in manner similar to that done for the USEPA/USGS Cherokee 27
County, Kansas floodplain study. A transect will be established generally perpendicular to the 28
stream. The width of the flood plain along the transect will be estimated from topographic maps 29
and NRCS soils maps, and will include soils that are defined by NRCS as “frequently flooded”, 30
where the probability of flooding in any year is greater than 50 percent, or “occasionally flooded” 31
where the probability of flooding in any year is 5 to 50 percent (Natural Resources Conservation 32
Service, 2002) and verified in the field. Core samples will be collected at equal-spaced intervals 33

Pilot SAP version 3.1 9‐20‐2010 Page 17
across the floodplain and samples designated with a “FP” prefix. Spacing between cores will be 1
established by dividing the floodplain width (W) by (n+1) where n is the number of core samples 2
to be collected (generally 5). Core samples will be numbered sequentially from the right edge of 3
the floodplain (looking downstream) and the first core sample site will be approximatley W/(n+1) 4
ft from the right edge of the flood plain. Spacing may be adjusted depending upon access, 5
landowner permission, and other on-site considerations. If the floodplain appears complex with 6
obvious old channel meanders, it is possible that two transects will be done across the floodplain 7
with 3 to 5 cores per transect. Several bias floodplain cores also may be taken in unusual features 8
such as old channel meanders or other possible depositional areas. Bias floodplain core samples 9
will be designated with a “FB” prefix and numbered in the order collected. The anticipated depth 10
of floodplain cores is to refusal but not to exceed 16 ft. The 16 ft baseline is based on the 11
maximum depth of core from the USEPA/USGS Cherokee County, Kansas Spring River 12
floodplain study (Kyle Juracek , U.S. Geological Survey, oral communication, 2010). 13
14
2.2.3 Task 3 Determination of streambed sediment depth 15
Estimates of the depth of unconsolidated sediments in the stream channel will be made along 16
each representative reach studied. For transect sampling, a tile probe will be used to probe to 17
refusal at 5 to 10 locations along each transect, including at each transect sample site, and at 18
longitudinal sample sites, to provide perspective on the adequacy of either the sampling method 19
or the tile probe to characterize the depth of the sediments. In the case of bias sampling of in-20
channel sediments, a tile probe will be used at several locations at each bar where samples are 21
collected, including at each sample site. Tile probes have been recently been used in Missouri and 22
Oklahoma to estimate the depths of unconsolidated sediments in streams and tailings near mine-23
waste dumps (Pavlowsky and others, 2008; CH2MHill, 2009). A unique ID number will be 24
assigned to each tile probe location and the horizontal and vertical coordinates will be obtained 25
with DGPS. Tile probe data will be used to make a rough estimate of in-channel sediment 26
thickness and volume of bars within the study reach. To supplement transect and longitudinal tile 27
probe data, the average height of bars that were identified and digitized during the initial GIS 28
mapping will be estimated using a DGPS. 29
30
2.2.4 Field GPS survey 31
A centimeter-accurate DGPS will be used to provide coordinates and elevations for each in-32
channel and floodplain sample and tile probe site. Several bars or riffles along each study reach 33

Pilot SAP version 3.1 9‐20‐2010 Page 18
will be mapped in greater detail (point spacing about 25 ft) using the DGPS to obtain horizontal 1
and vertical coordinates. The average height of these same bars above the water surface will be 2
estimated for later use in estimating volumes of sediment, and for comparing the accuracy of the 3
size of these features to values obtained from digitizing of the NAIP imagery. 4
5
2.3 Sample Handling and Field Processing 6
7
2.3.1 Sample collection 8
For both in-channel and floodplain sampling, the primary method for collection of core samples 9
will be direct-push using truck, tractor, or ATV mounted Geoprobe™ type drilling system. A 10
wide variety of sampling devices, core tube sizes, slit spoons, Shelby tubes, etc., are available for 11
use with direct-push drilling. Saturated alluvial sediments, especially gravels and sands, are 12
typically the most difficult sediments from which to collect continuous core samples. There are 13
two primary concerns when coring in saturated sediments. One concern is retention of the core 14
inside the sampling tube or device. Typically this is done using a plastic or stainless steel “sand 15
catcher” placed behind the core bit (consisting of a circular array of curved plastic or steel 16
“fingers” pointed upward) to hold the core inside the sample tube when the tube is removed from 17
the subsurface. The second concern is feeding of sediments into the sampling tube. Oversized 18
cobbles or debris larger than the opening of the sample tube will block the end of the tube 19
resulting in refusal or prevent smaller sediments from feeding into the sample tube. This is a more 20
common problem and source of poor core recovery. Gravel bars typically are armored at the 21
surface with larger cobbles or contain cobble beds at depth. If core recovery is poor, larger 22
sample tubes will be used or auger methods will be used to advance through cobble beds. When 23
core tubes are removed from the saturated sediments, the borehole will collapse preventing 24
collection of core from deeper depths. One solution is to use a “discrete” core tube that has a plug 25
at the bottom that can be driven to the desired depth, after which the plug is removed, and the 26
tube driven further 27
28
Core diameter will be determined by the largest diameter of the sediments. Continuous core tubes 29
suitable for discrete sampling are less than 3.0-in. diameter. If larger sized sediments are 30
encountered then larger diameter core tubes such as split spoon or “Shelby tube” samplers may be 31
used. A disadvantage of larger core tubes is that disposable liners may not be available (requiring 32
considerable decontamination between samples) and they may not be suitable in remote areas 33

Pilot SAP version 3.1 9‐20‐2010 Page 19
where hand operated equipment is used or where coring must be done from a boat. In addition, 1
split spoons are not discrete devices and must be advanced inside augers or an open ended casing 2
where soft or saturated sediments would cause borehole wall to collapse. Rather than a 3
continuous core, these methods result in a series of sampled intervals that may have gaps where 4
samples are not available. 5
6
2.3.2 Other sediment sample collection methods 7
Many sample locations will not be accessible by truck, tractor, or ATV mounted drilling 8
platforms, and hand-operated methods will be required. Hand-operated methods will employ a 9
variety of hammer/vibratory/auger, and shovel methods; however, the available options for core 10
sample collection and penetration depth are reduced. In these areas, the maximum target depth 11
anticipated is about 5 ft deep. 12
13
2.3.2.1 Vibro-core methods 14
Hand methods will use a 35 lb (pound) hammer drill, a 5-hp gasoline powered concrete shake, or 15
small air or hydraulic hammer to vibrate core tubes or other devices into the in-channel 16
sediments. This method has been used by the USGS to collect shallow sediment samples from 17
Grand Lake-O-Cherokees in Oklahoma and by the USGS to collect sandy streambed sediment 18
samples from streams in the Coeur D’ Alene mining district in Idaho (Box and others, 2001). 19
20
Vibro-core drilling is particularly well suited to core sampling in sandy unconsolidated sediments 21
that are water-saturated. A vibrating drill pipe agitates the intergranular pore water, which lifts 22
and separates sand grains, allowing downward penetration of the drill pipe. A gasoline powered 23
concrete vibrator or hammer drill is clamped to the pipe. Eccentric rotation of the vibrator creates 24
very strong vibrations, which are transmitted to the drill pipe. This method works well but as the 25
pipe fills its vibration is dampened causing decreasing drill rates and refusal. Before the tube is 26
withdrawn, a rubber plug is placed in the top to create a near vacuum as the tube is removed. 27
Sandy sediments tend to fall out of the tube bottom resulting in loss near the bottom of the core 28
run. Once extracted, the tubes will be transported to a work area on the bank. Samples can be 29
removed from the tube by either tipping the tube at an angle and lightly tapping to allow the 30
material to slump out onto a plastic sheet or tray (wallpaper tray) or the tube can be cut 31
lengthwise with a battery-powered saw. 32
33

Pilot SAP version 3.1 9‐20‐2010 Page 20
2.3.2.2 Auger-Vibro core 1
Modifications to the vibro-core methods likely will be necessary. If refusal is encountered 2
because the tube becomes filled with sediment then the sediment inside the tube can be sampled 3
and removed with hand bucket augers and piston samplers, then the tube advanced further into 4
the bottom. Typically, the overlying water must be removed with a peristaltic pump or bilge 5
pump. A section of sediment in the tube is removed with a bucket auger, then a hand driven 6
piston sampler can be used to collect a samples from discrete intervals inside the tube and the 7
process repeated. The upper one-third to one-half of material in the bucket auger or piston 8
sampler would be discarded as waste and only the bottom part retained as the field sample. 9
10
2.3.2.3 Auger-hand core 11
Traditional hand cores (bucket auger with piston core samplers) cannot be used where saturated 12
sediments collapse the borehole. However, these methods can be used inside casing. At some 13
locations, a hollow stem auger (HSA) may be turned into the sediments to a specified depth. The 14
HSA would have a center plug that would be removed allowing a bucket auger or piston sampler 15
to be turned or driven in front of the auger to obtain a discrete sample. The HSA could be 16
advanced several feet further, the internal material removed with a bucket auger to the bottom of 17
the HSA, then a piston samples advanced again. The upper one-third to one-half of the piston 18
samples would be discarded to waste and only the bottom section retained as actual samples. The 19
HSA would be advanced using a gasoline-powered hydraulic two-person boring device. 20
Additional sampling devices, such as the discrete core tube used with the drill rigs can be 21
advanced up to 4-foot through the HSA using either the vibrator or hammer drill. This is the 22
preferred method as the core tube has a liner minimizing the potential for cross-contamination. 23
24
2.3.2.4 Soft sediment piston cores or dredges 25
In areas of greater than about 6 ft in smaller streams that are accessible only by small john boat, 26
the vibro-core unit cannot used, and a traditional drop-type piston core will be used to collect 27
samples from the streambed. Penetration depths generally are limited to less than 4 ft, and likely 28
will be less than 2 ft. These samplers collect a single sample from the bottom and depth of 29
penetration is dependent upon the substrate bottom. These samplers generally do not have 30
disposable liners and must be thoroughly decontaminated between samples. If these methods fail, 31
then the final alternative at these locations is a Ponar or Eckman dredge to collect a limited depth 32
(less than 0.5 ft) grab sample from the streambed. 33
34

Pilot SAP version 3.1 9‐20‐2010 Page 21
2.3.2.5 Freeze core 1
If all attempts result in poor or no recovery, two less desirable methods involve freezing the 2
sediments either inside the sample tube bit (Murphy and Herkelrath, 1996) or onto the exterior of 3
a steel rod (Knaus and Calhoon 1990). In some cases, core recovery can be enhanced by using 4
liquid carbon dioxide or nitrogen to freeze the core tube bit. This method is limited to within a 5
few feet of the water table or water surface. Traditional core tubes can be advanced as described 6
in above sections, but a special bit and steel tubing is added to the outside of the core tube. Once 7
the core tube is advanced to depth, liquid carbon dioxide is pumped down the tubing to freeze 8
sediment inside the core bit. This method is applicable where the sediment can be penetrated but 9
slumps out of the core tube when the tube is removed from the sediment. 10
11
A second method is to freeze the fine-grained material to the exterior of a tube that is then 12
removed from the subsurface. In this method a small diameter steel rod (1-in. diameter or less) is 13
driven into the sediment, a copper tube is inserted inside the rod, liquid carbon-dioxide or 14
nitrogen is bubbled inside the rod to freeze sediments to the outside of the rod, and the rod is 15
pulled. This method results in some recovery of fines (clay up to small sand-sized particles) but 16
does not produce high quality samples from discrete depths 17
18
2.3.2.6 Trenching 19
If previous attempts result in little or no core recovery, sediment samples from bar or shallow 20
riffles accessible by a tractor will be collected from a trench using a backhoe or trencher. Because 21
of the scale of this method, only a few locations will be sampled and those will probably be 22
restricted to accessible gravel bars or areas above the water surface. The approach will be used to 23
excavate a trench in 1 to 2 ft depth increments. At the desired depth, material from one backhoe 24
bucket or trencher will be dumped onto a plywood or metal sheet. Large cobbles will be removed 25
by hand, and a shovel used to mix the remaining material. Ten to 15 subsamples will be collected 26
using a plastic or stainless steel scoop passed through the entire depth of the pile at each location 27
and composited into a clean plastic tub. 28
29
2.3.2.7 Hand Shovel 30
Because of access difficulties or problems getting good recovery using the above methods, it may 31
be necessary to use a hand shovel to sample the sediment. In a similar manner as using a backhoe, 32
the bar would be excavated by hand in 1 to 2 ft depth increments, the sediment placed on 33
plywood or a metal sheet, and a composite sample collected from 10-15 subsamples. 34
Pilot SAP version 3.1 9‐20‐2010 Page 22
1
2.4 Borehole Geophysics 2
To examine the potential for indirect methods of characterizing mine wastes in the subsurface, a 3
downhole electrical conductivity (EC) and resistivity probe will evaluated. The probe will be 4
advanced with the ATV, tractor, or truck mounted direct-push drill rig. As the probe is pushed 5
into the subsurface, a current is sent through the sediments between two probe contacts. This 6
current is measured along with the resulting voltage. The conductivity is a ratio of current to 7
voltage times a constant. The conductivity is different for each type of media with finer grained 8
sediments, such as silts or clays, having higher electrical conductance values. While coarser 9
grained sediments, sands and gravel, will have lower values. The EC tool can be calibrated to 10
soils in an area by matching the EC values with grain-size data of sediments obtained from core 11
samples. While the usefulness of the EC probe in mapping general characteristics of soils (grain-12
size of sediments) is documented, it is not known whether sediments containing mine tailings 13
may have a unique or anomalous EC signature possibly resulting from sulfide minerals or higher 14
conductance interstitial water associated with oxidation of sulfide minerals. Provided core sites 15
encounter obvious (in both appearance and XRF screening data) mine tailings that are in an 16
accessible area, the EC probe will be run though the mine tailings sediments and nearby non-mine 17
tailings sediments and the results compared. 18
19
2.5 Sample Handling and Processing 20
21
Procedures used for the handling and processing of sediment samples will be similar to those 22
used for the USEPA Cherokee County Floodplain study to allow combining of the two data sets. 23
Sediment samples will be collected using one of the methods and equipment discussed in section 24
2.3. Where possible, cores will be collected in 4-ft increments using disposable plastic core tubes 25
to hold the core inside the sample tube or split spoon, as was done in the USEPA Cherokee 26
County Floodplain study. 27
28
Because the core barrels are lined with plastic liners, potential contamination of the core 29
generally is restricted to the core bit and that resulting from handling and storage of the core once 30
the tubes are opened. Between each core run, the core barrel and bit will be washed with a 31
laboratory detergent solution and a brush, rinsed in tap water, and sprayed with a deionized low 32
pressure washer. 33
Pilot SAP version 3.1 9‐20‐2010 Page 23
1
Grab samples using dredges, shovels, trenching, freeze-core scrapping, etc., will be homogenized 2
prior to field XRF screening or sampling for laboratory analyses. Homogenization will include 3
removing large cobble-size rocks or debris, and placing the samples in a plastic or stainless flat 4
bottom container or flat plastic sheet or cheese-cloth to dry. After drying, the material will be 5
mixed and a 5-10 gram (g) subsample removed, re-mixed, and the process repeated until a 50-100 6
g composite sample is collected. The composite sample will be placed in a plastic bag, 7
disaggregated, and placed flat on a table for screening using the XRF. Five individual XRF scans 8
will be made on the sample with one in the center and four in each quadrant of the sample. Each 9
individual result will be recorded. One laboratory confirmation per sample will be collected by 10
drawing 1-2g subsamples using a plastic or stainless steel spatula (bag mixed between each 11
subsample) to obtain a 25 g sample. The samples will then be shipped overnight to the USGS 12
contract soil geochemistry laboratory for geochemical analyses. 13
14
A field log of each core or sample (depth, core recovery, drilling conditions, date, time, method, 15
equipment used etc.) will be made at the time of drilling. Each core tube will be capped, labeled, 16
and shipped to an offsite storage and processing location (Missouri or Oklahoma USGS office or 17
U.S. FWS office in Columbia, Missouri). Processing will include making a geologic log, air 18
drying, photographing, XRF screening, and sub-sampling of selected intervals for laboratory 19
confirmation analysis. For each core, a geologic log describing depth intervals, core recovery, 20
description of texture, grain size, color, moisture, etc. will be completed and the core sections 21
photographed as part of the record for each site. As part of the core processing, the core will be 22
subdivided into 1 ft depth intervals for XRF screening by placing small plastic tabs every foot. 23
Non-core samples will also be described in a similar manner as core samples. 24
25
One laboratory confirmation sample will also be collected from each core after XRF screening. 26
The laboratory sample will be collected using a plastic or stainless steel spoon. The spoon will be 27
cleaned before each reuse. Less than 25 g of sediment are required and the length of the sample 28
interval will be varied such that no more than one-half of the core is removed. It is anticipated 29
that the sample interval will be about 0.5 to 1.0 ft long. The sampled interval will be selected to 30
avoid sampling across obvious lithologic breaks and avoid large cobbles. The sample for each 31
core interval will be dried, sieved through a No. 1 sieve, and homogenized as described in section 32
2.6.1. 33
34

Pilot SAP version 3.1 9‐20‐2010 Page 24
Chain-of-custody (COC) protocol will be established and followed, as described in section 2.8. 1
2
3
2.6 Analytical Methods 4
5
2.6.1 Metal screening by X-Ray Fluorescence (XRF) 6
After geologic logging, the core will be air dried and analyzed by direct XRF for target mining-7
related metals (Pb, Zn, and Cd) and calcium (Ca). The USFWS will supply the XRF and trained 8
operator. XRF screening will be done at the USGS office in Rolla, Missouri or Oklahoma City, 9
Oklahoma. The XRF screening will be done at intervals of 3 measurements per 1 ft section of 10
core. Each 1-ft deep interval (previously marked by the geologist) will be sub-divided into 3 11
equal length sections and the XRF scan done at the middle of each 1/3 foot interval (fig. 4). This 12
protocol was used successfully in the screening of floodplain core samples collected from the 13
USEPA Cherokee County, Kansas project. 14
15
The primary concern for in-situ screening of the in-tact core is errors introduced because of 16
heterogeneity of the core (both grain size effects and unequal distribution of metals within the 17
core) and differences in moisture content. To control error from moisture differences, cores will 18
be air dried until the surface is dry to the touch which may require several days before screening). 19
If on-site screening of the damp or wet core is done at the field site to guide field sampling 20
efforts, a re-screening of dried core will be done and the re-screening values will be considered 21
the final values. Little can be done to control error introduced by heterogeneity of the core, except 22
to avoid scanning large cobbles and unsure a regular surface to the extent possible. A decision 23
may be made at the time of screening the core to collect subsamples for processing and 24
subsequent XRF analysis in the Rolla or Oklahoma City USGS laboratory as described below for 25
non-core samples. 26
27
Figure 4. Generalized X-Ray fluorescence (XRF) screening approach for a sediment core 28
29
As a quality check on the precision of the XRF instrument, during screening on in-tact core, three 30
repetitive scans at a fixed location will be done at a rate of about once every 15 to 20 31
measurement intervals (each repeat measurement recorded) and the average reported for that 32

Pilot SAP version 3.1 9‐20‐2010 Page 25
interval. This some procedure will be done for samples that were collect my method other than 1
intact core (see following paragraph). As a quality check on the variability of the XRF 2
measurements from the in-tact core, after the triplicate scans are done, three additional scans will 3
be done at the same interval but the instrument rotated about 120 degrees between each scan. 4
These three results also will be individually recorded and their average and range compared to the 5
average and range of the triplicate scans. Instrument scan time is proposed to be 60 to 90 seconds. 6
7
For samples that cannot be obtained from intact core, bulk samples collected in plastic ziplock 8
bags will be transported to the USGS laboratory in Rolla, Missouri or Oklahoma City, Oklahoma 9
where they will be processed and analyzed by XRF. Processing will include verification that 10
sample bag labeling is consistent with field notes. Samples will be air dried overnight in an oven 11
at 60 oC. After drying, large obvious cobbles, sticks, pieces of debris such as asphalt will be 12
removed then the sample disaggregated with a mortar and pestle (if needed), and sieved through a 13
No. 1 (25.4 mm open size) stainless steel sieve to remove large cobbles and rock fragments 14
atypical of mining wastes. The sieved material will be collected in a plastic bowl and 100-200 g 15
removed and homogenized according to Method 6200. A subsample from the homogenized 16
material will be analyzed using the portable XRF (three scans per sample with individual values 17
recorded and averaged). Any laboratory samples for ICP-AES analyses will be collected from the 18
homogenized sample and the remaining homogenized material archived in a clean plastic bag. A 19
second set of XRF measurements (three scans per sample) will be made on the exact sample to be 20
shipped for fixed laboratory analyses by ICP-AES. 21
22
The XRF will be operated by USFWS in accordance with standard procedures described in 23
USEPA Method 6200. Before analyses of environmental samples, a daily energy calibration 24
check, and operational checks will be done in as described in Method 6200 and the manufacture 25
operating instructions. Instrument blanks, calibration verification checks (using ASTM standard 26
reference samples), and replicate sample, will be run every 10 to 20 samples. The replicate 27
sample will be analyzed a minimum of 7 times to establish the precision of the XRF. 28
29
2.6.2 Laboratory Analyses 30
31
One laboratory confirmation sample will be collected from each core (maximum of 25 samples 32
per stream reach studied). Laboratory confirmatory samples will be selected to represent a range 33

Pilot SAP version 3.1 9‐20‐2010 Page 26
of metal (primarily Pb) concentrations determined by XRF screening. These samples will be 1
dried, sieved (No. 1 slot), and homogenized as described in section 2.6.1 and discussed in Method 2
6200 and placed in clean sealed plastic bags. Before shipping, each sample will be placed flat on 3
a table for an additional XRF screening. Five individual XRF scans will be made on the sample 4
with one in the center and four in each quadrant of the sample. Each individual result will be 5
recorded and the values averaged. After AXF screening, the samples will be submitted to the 6
USGS Central Region Mineral Resources Geochemistry (CRMR) laboratory in Denver, Colorado 7
for processing. The CRMR laboratory will login the sampling into a Laboratory Information 8
Management System (LIMS), and process the samples for subsequent elemental analysis. 9
Processing will include drying, disaggregating, splitting, archiving, and grain-size determination 10
(sand, silt, and clay-size fractions). Upon receipt the bulk samples will be dried then split with 11
one half being archived. The remaining split will be split again and one split sieved to obtain a 12
fine (less than 63-micron) fraction and the remaining split weighed, and sieved to determine the 13
percent by weight of sand, silt, and clay-size fractions then recombined into a single bulk fraction. 14
Each of these splits (fine and bulk) will be submitted to a USGS contract laboratory for routine 15
analysis for total (4-acid) digestion and elemental analysis by Inductively-Coupled Plasma 16
Atomic Emission Spectroscopy (ICP-AES). The ICP-AES elements analyzed and reporting limits 17
are listed in table 2. 18
19
Table 2. List of target elements to be determined by Inductively-Coupled Plasma Atomic Emission 20
Spectroscopy (ICP-AES) in laboratory samples. 21
Element, and abbreviation Units Concentration Range
Aluminum, Al Weight percent 0.005 0.5
Calcium, Ca Weight percent .005 .5
Iron, Fe Weight percent .02 .25
Potassium, K Weight percent .01 .5
Magnesium, Mg Weight percent .005 .05
Sodium, Na Weight percent .005 .5
Phosphorous, P Weight percent .005 .5
Titanium, Ti Weight percent .005 .25
Arsenic, As mg/kg 10 50,000
Barium, Ba mg/kg 1 35,000
Beryllium, Be mg/kg 1 5,000
Bismuth, Bi mg/kg 50 50,000

Pilot SAP version 3.1 9‐20‐2010 Page 27
Element, and abbreviation Units Concentration Range
Cadmium, Cd mg/kg 2 25,000
Cerium, Ce mg/kg 5 50,000
Chromium, Cr mg/kg 2 25,000
Cobalt, Co mg/kg 2 25,000
Copper, Cu mg/kg 2 15,000
Europium, Eu mg/kg 2 5,000
Gallium, Ga mg/kg 4 50,000
Gold, Au mg/kg 8 50,000
Holmium, Ho mg/kg 4 5,000
Lanthanum, La mg/kg 2 50,000
Lead, Pb mg/kg 4 50,000
Lithium, Li mg/kg 2 50,000
Manganese, Mn mg/kg 4 50,000
Molybdenum, Mo mg/kg 2 50,000
Neodymium, Nd mg/kg 9 50,000
Nickel, Ni mg/kg 3 50,000
Niobium, Nb mg/kg 4 50,000
Scandium, Sc mg/kg 2 50,000
Silver, Ag mg/kg 2 10,000
Strontium, Sr mg/kg 2 15,000
Tantalum, Ta mg/kg 40 50,000
Thorium, Th mg/kg 6 50,000
Tin, Sn mg/kg 50 50,000
Uranium, U mg/kg 100 100,000
Vanadium, V mg/kg 2 30,000
Ytterbium, Yb mg/kg 1 5,000
Yttrium, Y mg/kg 2 25,000
Zinc, Zn mg/kg 2 15,000
1
All sediment samples not consumed during analysis (core, grab, or otherwise) will be archived for 2
the duration of the project at either the USGS office in Oklahoma City or Rolla. The final 3
disposition of the samples beyond the project duration has not been determined. 4
5
2.7 Quality Issues 6
2.7.1 Quality Control 7
Quality control of sampling site variability and analytical determinations of trace metals in soil 8
will be maintained through the use of replicate samples and standard reference samples. Within 9

Pilot SAP version 3.1 9‐20‐2010 Page 28
site variability in trace metal concentrations will be evaluated through the collection of 1
sequential-replicate samples or measurements. Relative percent differences will be calculated for 2
each replicate pair and evaluated against acceptance criteria discussed below. Split-replicate 3
samples will be used to evaluate the precision of analytical procedures. Standard reference 4
samples will be used to evaluate the accuracy and bias of analytical procedures. The number of 5
quality control samples submitted for analysis will equal about 10 percent of the number of 6
environmental samples. 7
8
2.7.2 Data Quality Objectives for Measurement Data 9
Valid data of known and documented quality are needed to meet the objectives of the project. The 10
majority of concentrations of selected trace metals sediment samples collected for this study will 11
be determined by portable XRF screening and compared to concentrations in sediment from non-12
mined areas to assess the depth and extent of metal contamination from mining activities along 13
the study reaches. Background concentrations of metals will be values reported in Pope (2005) 14
and Juracek (2006). In addition, concentrations of selected metals in samples collected and 15
analyzed by laboratory methods used during this study may be compared to sediment-quality 16
guidelines to determine potential environmental effects of metals in these sediments. Data quality 17
indicators include precision, accuracy, representativeness, comparability, and completeness. 18
Measures of these indicators will be used to validate the data collected for this project. 19
20
Precision. Precision is the measure of agreement among replicate measurements of the same 21
property. In this project, precision of the XRF screening data will be evaluated by making a 22
minimum of seven replicate XRF measurements made at a single point on the core or sample 23
without moving the instrument as described in Method 6200. One precision measurement will be 24
made each day of XRF operation. Split-replicate samples will be analyzed for 10 percent of the 25
field XRF screening samples and laboratory samples submitted. Replicate field XRF screening 26
will be done by making three repetitive scans as described in section 2.6.1. Precision of 27
laboratory data will be evaluated by the preparation of blind split samples routinely prepared by 28
the CRMR Geochemistry laboratory and submitted blindly to the contract analytical laboratory. 29
Acceptable variability among analyses of split-replicate samples for this project will be a relative 30
percent difference ([(A-B)/(A+B/2)]*100) between replicate pairs (A and B) of plus or minus 20 31
percent. 32
33

Pilot SAP version 3.1 9‐20‐2010 Page 29
Accuracy. Accuracy is the measure of an individual measurement or the average of a number of 1
measurements to the true value of that being measured. Accuracy includes the combination of 2
random error (precision) and systematic error (bias) components that may result from the 3
sampling and analytical operations. Accuracy of the XRF screening will be measured by analysis 4
of standard reference samples. Confirmation of XRF accuracy and overall XRF analyses of 5
sample handling methods will be evaluated by analysis of split samples between the XRF and the 6
analytical laboratory, where the laboratory value is assumed to be the “true” value. Before a 7
laboratory sample is shipped, 5 individual XRF scans will be done as described in section 2.6.2. 8
9
Accuracy of laboratory analyses will be determined by the analysis of standard reference samples 10
of sediment with known concentrations of selected trace metals. Acceptable variability among 11
analyses of standard reference samples will be within the published limits for each constituent for 12
each standard or plus or minus 20 percent whichever is greater, except when constituent 13
concentrations are at or near analytical detection limits. 14
15
Representativeness. Representativeness is the degree to which data accurately and precisely 16
represents a characteristic of a population parameter at a sampling location. The 17
Representativeness of the XRF data will be evaluated by rotating the instrument about a fixed 18
point and making three replicate measurements at the same depth interval as described in section 19
2.6.1. Comparison of the average, range, and standard deviation of these three measurements will 20
provide an assessment of the ability of sample collection to adequately describe the average 21
concentrations of selected trace metals in the sample. Because of variable nature of metals in 22
sediment (typically associated with small metal-rich mineral grains such as galena) the acceptable 23
variability among analyses of sequential-replicate samples will be a percent relative standard 24
deviation (RSD) of plus or minus 40 percent. 25
26
Completeness. Completeness is the measure of the amount of valid data obtained from a 27
measurement system as expressed as a percentage of the number of valid measurements that 28
should have been collected. This includes the collection, proper handling and labeling, shipping, 29
and analysis of the samples. To generate data of the quantity necessary to meet the objectives 30
stated for this project, 70 percent of the data in the designed assessment system should be 31
collected and analyzed. This unusually low percentage is because of the high density of data 32
proposed to be collected and because of the unknown nature of the sediments and difficulty in 33
obtaining sediment samples from a river environment. In addition, the desired completeness ratio 34

Pilot SAP version 3.1 9‐20‐2010 Page 30
may be modified because of the variable physical or environmental characteristics at the time of 1
sample collection. Any deviation from a 70 percent completeness ratio will be evaluated in 2
context of all other available data before the decision is made that missing data have irreparably 3
affected the potential for the project to meet the stated objectives. 4
5
Comparability. Comparability is a measure of the confidence with which one data set or method 6
can be compared to another. For this project, comparability will be addressed through the use of 7
common and accepted practices in sample collection and analysis and by reporting data in 8
standard units. The preparation, splitting, and analysis of laboratory samples for this project will 9
be done as part of the routine USGS geochemistry surveys done by the CMRA team and 10
compatible with thousands of samples analyzed from across North America. In addition, the 11
comparison (regression analysis) between the XRF screening of laboratory samples prior to 12
submittal with the bulk laboratory data will enable comparison between the XRF and total 13
digestion and ICP-AES analytical data. 14
15
2.8 Documentation 16
The records for this project will include miscellaneous correspondence, field logs or notebooks 17
and field data work sheets, laboratory analytical reports, field activity documents, quarterly 18
progress reports, and the final report prepared at the conclusion of this project. Field bound 19
notebooks will be kept that will document the general daily field activities. Field logs will include 20
observations about weather and physical conditions of the study reach, descriptions of specific 21
sampling sites, descriptions of field visits (reconnaissance, utility clearances, sampling activities), 22
personnel involved, and contacts with landowners or other officials. Geologic logs will be kept 23
for each core or sampling site describing the equipment used, drilling methods, field personnel, 24
general lithology, recovery, sample depths, etc. Sampling site folders (for each representative 25
stream reach investigated) will be maintained by the USGS for the duration of the project. These 26
folders will contain all of the aforementioned documents and will be kept at the USGS office in 27
Rolla, Missouri. 28
29
Reports, geologic logs, and results of field XRF screening and laboratory analyses will be 30
submitted to the FWS Project Manager upon publication or completion. Any other pertinent 31
observations or deviations from the general SAP procedures also will be recorded on the field 32
sheets. Field books and field sheets will be signed and dated by the person making the entries. 33

Pilot SAP version 3.1 9‐20‐2010 Page 31
1
In accordance with USGS policy, all data collected as part of routine data collection by the USGS 2
are stored in the National Water Information System (NWIS) computer database. Sample sites are 3
assigned a unique 15 digit station number that generally is a combination of the latitude and 4
longitude of the site to the nearest second plus a 2-digit suffix that is a sequence number from 01 5
to 99. The field XRF screening data will not be entered into the NWIS, but will be tied to the 6
NWIS station number in the internal project database. 7
8
The NWIS is organized by state where the sample site is located, such that the responsibility for 9
uploading and maintaining backups of data stored electronically in NWIS is the responsibility of 10
the USGS state office. The USGS principle investigator (Doug Mugel) will ensure that all sample 11
sites are entered into the NWIS. 12
13
The Principal Investigator also will establish, maintain, and document a COC system for field 14
samples that is commensurate with the intended use of the data. A sample is in custody if it is in 15
actual physical possession or in a secured area that is restricted to authorized personnel. Every 16
exchange of a sample between people or places that involves a transfer of custody will be 17
recorded on appropriate forms that document the release and acceptance of the sample. Each 18
person involved in the release or acceptance of a sample will keep a copy of the transfer 19
paperwork. The Principal Investigator or designee is responsible for ensuring that custody 20
transfers of samples are performed and documented according to the requirements listed below: 21
• The means for identifying custody should be clearly understood (use of forms, stickers, 22
etc.); 23
• Instructions for documenting the transfer of samples and the person responsible for this 24
documentation must be clearly defined; and 25
• A plan must be in place for maintaining records in a specific location for a specific period 26
of time (for example, in the site folder). 27
Detailed guidance on chain-of-custody procedures is provided by the USGS National Water-28
Quality Laboratory (NWQL) at URL 29
http://rstalcoarv.cr.usgs.gov/USGS/ASRs/asr_instructions.html. 30
31
Data from the USGS contract geochemistry laboratory are transmitted electronically to the 32
Principal Investigator and entered into the NWIS. Environmental sample data are entered into the 33
NWIS QWDATA database 01 (DB1); QC data are entered into the NWIS QWDATA database 02 34

Pilot SAP version 3.1 9‐20‐2010 Page 32
(DB02). Data entry is the responsibility of the Principal Investigator or designee. The NWIS 1
QWDATA database receives daily incremental backup and weekly full backup. 2
3
2.9 Geospatial analysis 4
A GIS will be used to organize all data collected in this study. All sample sites will have GPS 5
coordinates and a unique ID number to allow spatial analysis of the data. In addition to its use for 6
organizing and simple mapping and overlaying of sample sites on current and historical images, 7
soils maps, etc., the GIS will be used to estimate sediment thickness stored within the current 8
(2010) stream channel along each study reach. Two methods for estimating these thicknesses will 9
be compared. First, streambed and gravel bar areas along the study reach will be estimated by 10
digitizing from the NAIP imagery and combined with tile probe depths and depths of 11
contamination to provide thickness estimates of contaminated streambed or bar sediments. 12
Generally, the elevation of the maximum depth of the tile probe along the reach (adjusted for 13
channel slope) will be used to establish a base plane that will be assumed to be the base of the 14
channel sediments. Second, the thickness of selected bars will be estimated using the base plane 15
as above and the footprint and elevations from the DGPS survey. Direct comparison of these two 16
methods will determine if methods can be optimized and quickly re-scaled to much larger stream 17
lengths across the TSMD, or what additional low-density data might be needed along the streams. 18
This data may also be used to estimate volumes of contaminated sediments within the stream. 19
20
3.0 Deliverables and Schedule 21
22
3.1 Deliverables 23
The USGS will prepare a progress reports to the FWS project manager each calendar quarter. The 24
reports will describe general project activities, and scheduling. Reports will be submitted monthly 25
during periods of intense field activity, 26
27
A final report USGS Scientific Investigations Report will be produced describing the methods 28
used, and the spatial and vertical distribution of target metals within sampled reaches of streams 29
in the Tri-State Mining District. Concentrations of metals will be illustrated in cross sections 30
showing depth and general lithology. The total volume of contaminated sediment and mass of 31
target metals (Pb, Zn, and Cd) will be estimated by different GIS methods along each sampled 32
study reach. Comparison of the in-channel longitudinal and special sample sites to the transect 33

Pilot SAP version 3.1 9‐20‐2010 Page 33
sites, and the use of bias sampling instead of transect sampling will be presented and discussed in 1
the context of optimization of a sample design for wider-scale implementation across the TSMD. 2
The various sampling methods will be discussed and compared to benefit any future study. 3
4
3.2 Project Schedule 5
The project funding was secured during fiscal year 2009. The project is anticipated to require 6
three years to complete beginning with preparation of the SAP. Initial field reconnaissance and 7
selection of representative study reaches is expected to be completed by October 2010, with 8
initial field sample collection during December of 2010. Subsequent field work will be 9
completed in the spring and summer of 2011. Data compilation and analysis will be conducted 10
from winter 2012 through spring 2012. A final interpretive report will be written during 2011 and 11
2012, and will be published by March 2013. A summary of the project timeline is shown in table 12
3. 13
14
Table 3. Generalized project timeline. 15
16
Task Estimated begin date
Estimated completion date
Prepare SAP Feb 2010 April 2010 Draft SAP review by FWS April-2010 May-2010 Revise and prepare final draft SAP
June-2010 August-2010
Final draft SAP to FWS Sept-2010 Sep-2010 Finalize SAP Nov-2010 Nov-2010 Begin field reconnaissance (phase 1)
June-2010 Mar-2011
Select study reaches and obtain access/clearances
June-2010 Mar-2011
Phase 1 field sampling effort Dec-2010 May-2011 Laboratory analyses (phase 1 and 2)
Feb-2010 Aug-2011
Phase 2 field sampling July-2011 Aug-2011 Data compilation and analyses Jan-2012 June-2012 Draft report preparation July- 2012 Sept-2012 FWS review of draft report Sep- 2012 Oct- 2012 Final Report preparation and publication
Nov-2012 Mar- 2013

Pilot SAP version 3.1 9‐20‐2010 Page 34
1
4.0 References 2
Angelo, R.T., Cringan, M.S., Chamberlain, D.L., Stahl, A.J., Haslouer, S.G., and Goodrich, C.A., 3
2007, Residual effects of lead and zinc mining on freshwater mussels in the Spring River 4
Basin (Kansas, Missouri, and Oklahoma, USA): Science of the Total Environment, v. 5
384, p. 467-496 6
Box, Stephen, E., Brookstrom, A.A., Ikramuddin, M., and Linday, J., 2001, Geochemical 7
analyses of soils and sediments, Coeur ’Alene drainage basin, Idaho: Sampling, analytical 8
methods, and results: U.S. Geological Survey Open-File Report 01-139, 206 p. 9
CH2MHill, 2009, Field sampling plan for the integrated site assessment/investigation of the Tar 10
Creek superfund site, Ottawa County, Oklahoma: U.S. Environmental Protection Agency, 11
Region 6 Contract No. EP-W-6-01, March 2009: 12
Fitzpatrick, F.A., Waite, I.R., D’Arconte, P.J., Meador, M.R., Maupin, M.A., and Gurtz, M.E., 13
1998, Revised methods for characterizing stream habitat in the National Water-Quality 14
Assessment Program: U.S. Geological Survey Water-Resources Investigations Report 98-15
4052, 67 p.Knaus, R.M. and Cahoon, 1990, Improved cryogenic coring device for 16
measuring soil accretion and bulk density: Journal of Sedimentary Petrology v. 60, no. 4, 17
pp 622-623. 18
Ingersoll, C.G., Ivey, C.D., Brumbaugh, W.G., Besser, J.M., and Kemble, N.E., 2009, Toxicity 19
assessment of sediments from the Grand Lake O’ the Cherokees with the amphipod 20
Hyalella azteca: U.S. Geological Survey Administrative Report CERC-8335-FY09-20-21
01, various pagination. 22
Juracek, K.E. 2006. Sedimentation and occurrence and trends of selected chemical constituents in 23
bottom sediment, Empire Lake, Cherokee County, Kansas, 1905-2005. U.S. Geological 24
Survey Scientific Investigations Report 2006-5307, 79 p 25
Knaus, R.M., and Cahoon, D.R., 1990, Improved cryogenic coring device for measuring soil 26
accretion and bulk density: Journal of Sedimentary Research, Vol 60, No. 4, pp 622-623 27
MacDonald, D.D., Ingersoll, C.G., and Berger, T.A., 2000, Development and evaluation of con-28
sensus-based sediment quality guidelines for freshwater ecosystems: Archives of 29
Environmental Contamination and Toxicology, v. 39, p. 20-31. 30

Pilot SAP version 3.1 9‐20‐2010 Page 35
Murphy, F., and Herkelrath, W.N., 1996, A sample-freeze drive shoe for a wireline piston core 1
sampler: Groundwater Monitoring and Review, Vol. 86, pp 86-90. 2
Natural Resources Conservation Service, 2002, Soil Survey of jasper County Missouri, accessed 3
August 2010, at 4
http://soildatamart.nrcs.usda.gov/Manuscripts/MO097/0/Jasper_MO.pdf. 5
Pavlowsky, R.T., Lecce, S., and Mickus, K., 2008, Big River Mine Sediment Assessment Project 6
(2008-2009), prepared for the Missouri Department of natural Resources: 14p, accessed 7
at URL http://www.dnr.mo.gov/ENV/hwp/docs/081125bigriversedimentassessment.pdf. 8
Pope, L.M. 2005. Assessment of contaminated streambed sediment in the Kansas part of the 9
historic Tri-State Lead and Zinc Mining District, Cherokee County, 2004. U.S. 10
Geological Survey Scientific Investigations Report 2005-5251, 61 p. 11
12