Embed Size (px)
Citation preview
Status of Oceanic Institute’s
Pilot Research Feed Mill
Anthony C. Ostrowski, Ph.D.
DOA/OI Feeds Round-up
August 15, 2012
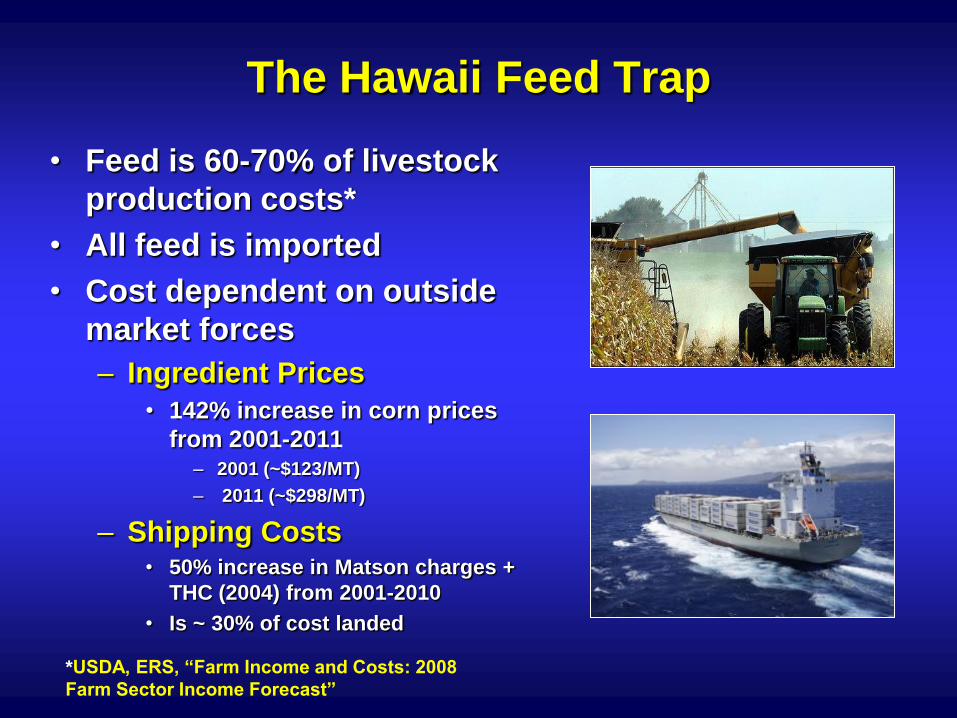
The Hawaii Feed Trap
• Feed is 60-70% of livestock
production costs*
• All feed is imported
• Cost dependent on outside
market forces
– Ingredient Prices
• 142% increase in corn prices
from 2001-2011 – 2001 (~$123/MT)
– 2011 (~$298/MT)
– Shipping Costs • 50% increase in Matson charges +
THC (2004) from 2001-2010
• Is ~ 30% of cost landed
*USDA, ERS, “Farm Income and Costs: 2008
Farm Sector Income Forecast”
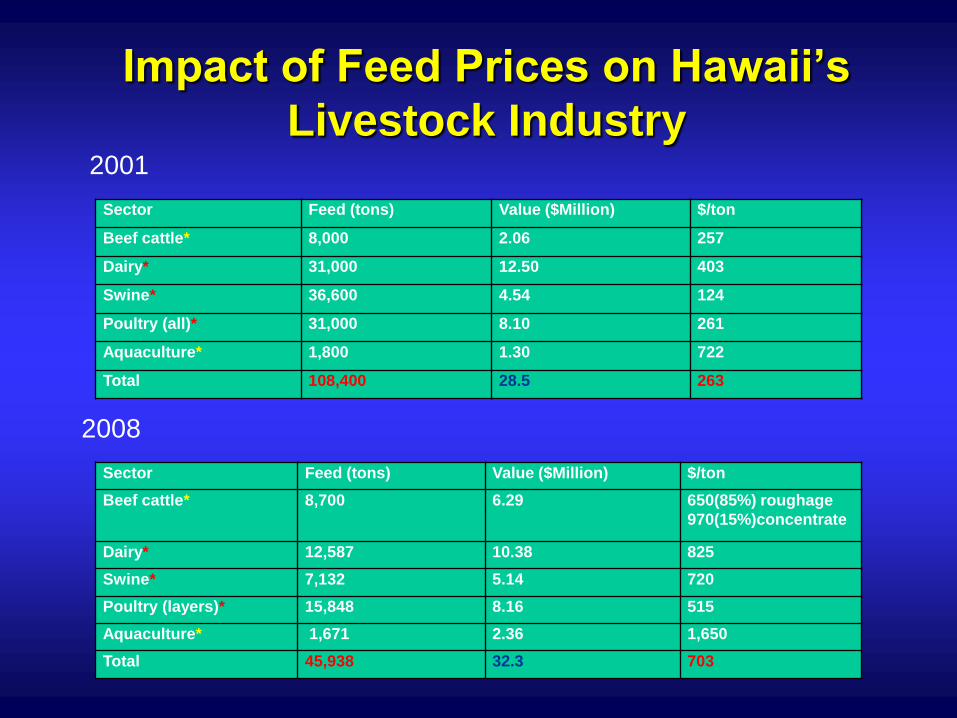
Impact of Feed Prices on Hawaii’s
Livestock Industry
Sector Feed (tons) Value ($Million) $/ton
Beef cattle* 8,700 6.29 650(85%) roughage
970(15%)concentrate
Dairy* 12,587 10.38 825
Swine* 7,132 5.14 720
Poultry (layers)* 15,848 8.16 515
Aquaculture* 1,671 2.36 1,650
Total 45,938 32.3 703
Sector Feed (tons) Value ($Million) $/ton
Beef cattle* 8,000 2.06 257
Dairy* 31,000 12.50 403
Swine* 36,600 4.54 124
Poultry (all)* 31,000 8.10 261
Aquaculture* 1,800 1.30 722
Total 108,400 28.5 263
2001
2008
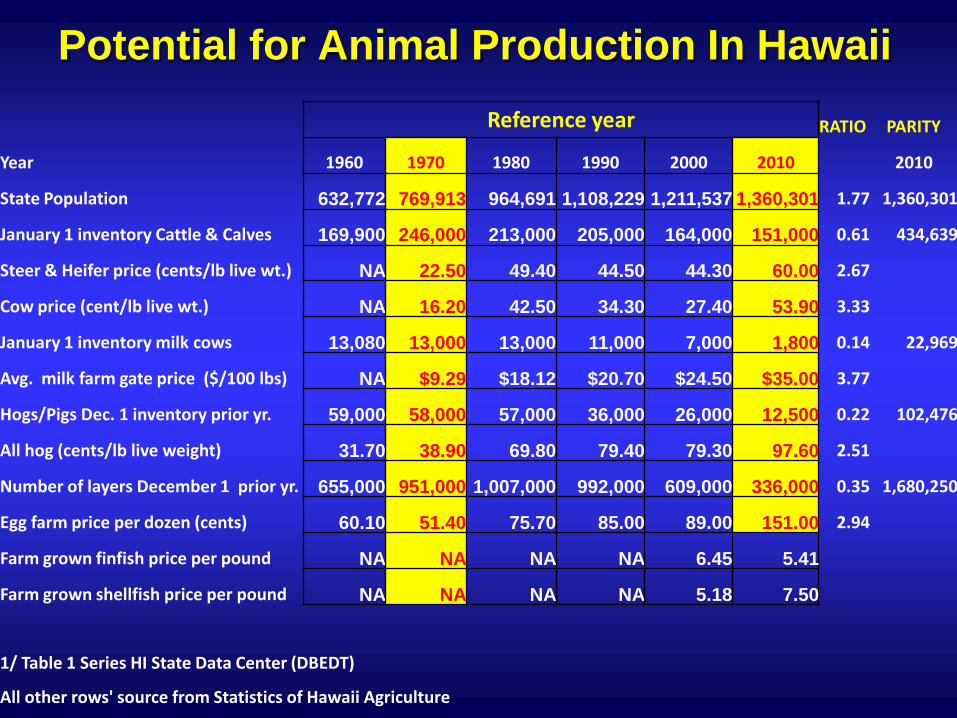
Potential for Animal Production In Hawaii
Reference year RATIO PARITY
Year 1960 1970 1980 1990 2000 2010 2010
State Population 632,772 769,913 964,691 1,108,229 1,211,537 1,360,301 1.77 1,360,301
January 1 inventory Cattle & Calves 169,900 246,000 213,000 205,000 164,000 151,000 0.61 434,639
Steer & Heifer price (cents/lb live wt.) NA 22.50 49.40 44.50 44.30 60.00 2.67
Cow price (cent/lb live wt.) NA 16.20 42.50 34.30 27.40 53.90 3.33
January 1 inventory milk cows 13,080 13,000 13,000 11,000 7,000 1,800 0.14 22,969
Avg. milk farm gate price ($/100 lbs) NA $9.29 $18.12 $20.70 $24.50 $35.00 3.77
Hogs/Pigs Dec. 1 inventory prior yr. 59,000 58,000 57,000 36,000 26,000 12,500 0.22 102,476
All hog (cents/lb live weight) 31.70 38.90 69.80 79.40 79.30 97.60 2.51
Number of layers December 1 prior yr. 655,000 951,000 1,007,000 992,000 609,000 336,000 0.35 1,680,250
Egg farm price per dozen (cents) 60.10 51.40 75.70 85.00 89.00 151.00 2.94
Farm grown finfish price per pound NA NA NA NA 6.45 5.41
Farm grown shellfish price per pound NA NA NA NA 5.18 7.50
1/ Table 1 Series HI State Data Center (DBEDT)
All other rows' source from Statistics of Hawaii Agriculture
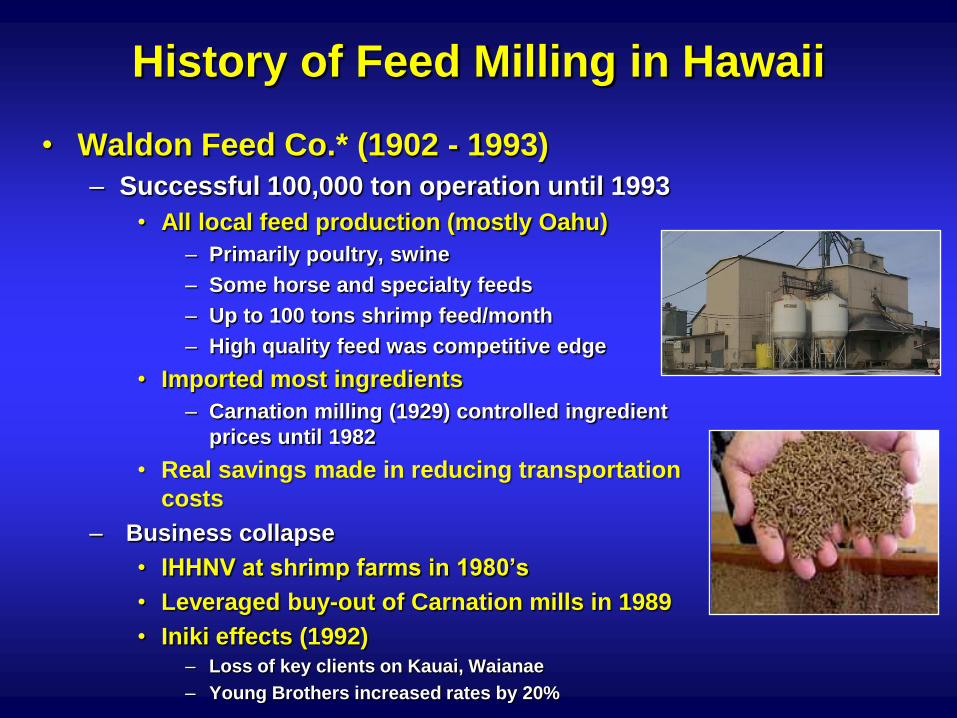
History of Feed Milling in Hawaii
• Waldon Feed Co.* (1902 - 1993)
– Successful 100,000 ton operation until 1993
• All local feed production (mostly Oahu)
– Primarily poultry, swine
– Some horse and specialty feeds
– Up to 100 tons shrimp feed/month
– High quality feed was competitive edge
• Imported most ingredients
– Carnation milling (1929) controlled ingredient
prices until 1982
• Real savings made in reducing transportation
costs
– Business collapse
• IHHNV at shrimp farms in 1980’s
• Leveraged buy-out of Carnation mills in 1989
• Iniki effects (1992) – Loss of key clients on Kauai, Waianae
– Young Brothers increased rates by 20%
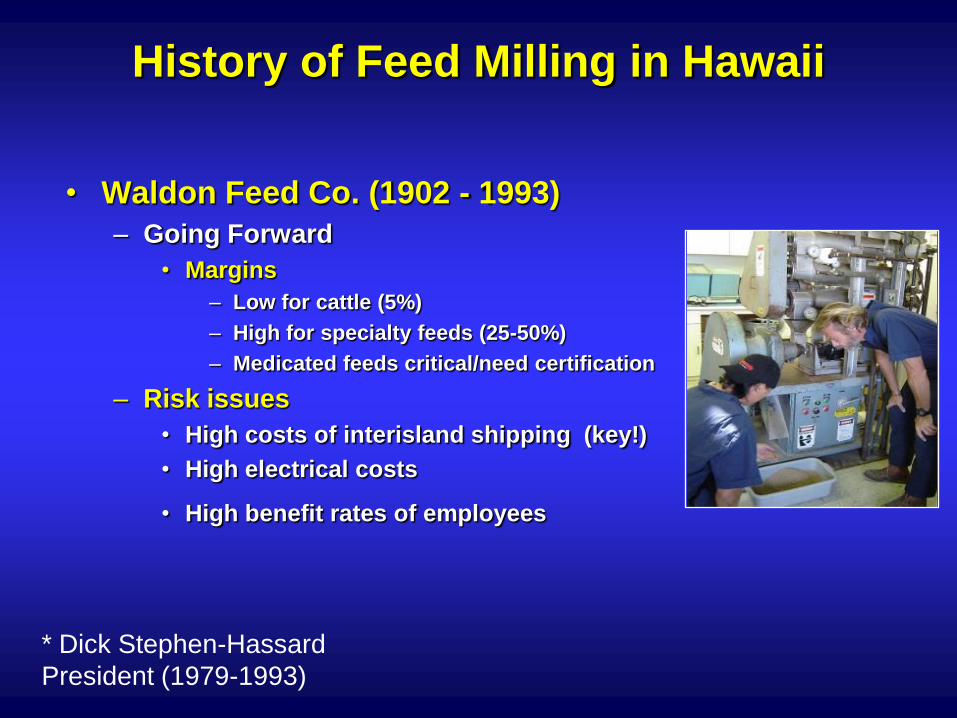
History of Feed Milling in Hawaii
• Waldon Feed Co. (1902 - 1993)
– Going Forward
• Margins
– Low for cattle (5%)
– High for specialty feeds (25-50%)
– Medicated feeds critical/need certification
– Risk issues
• High costs of interisland shipping (key!)
• High electrical costs
• High benefit rates of employees
* Dick Stephen-Hassard
President (1979-1993)
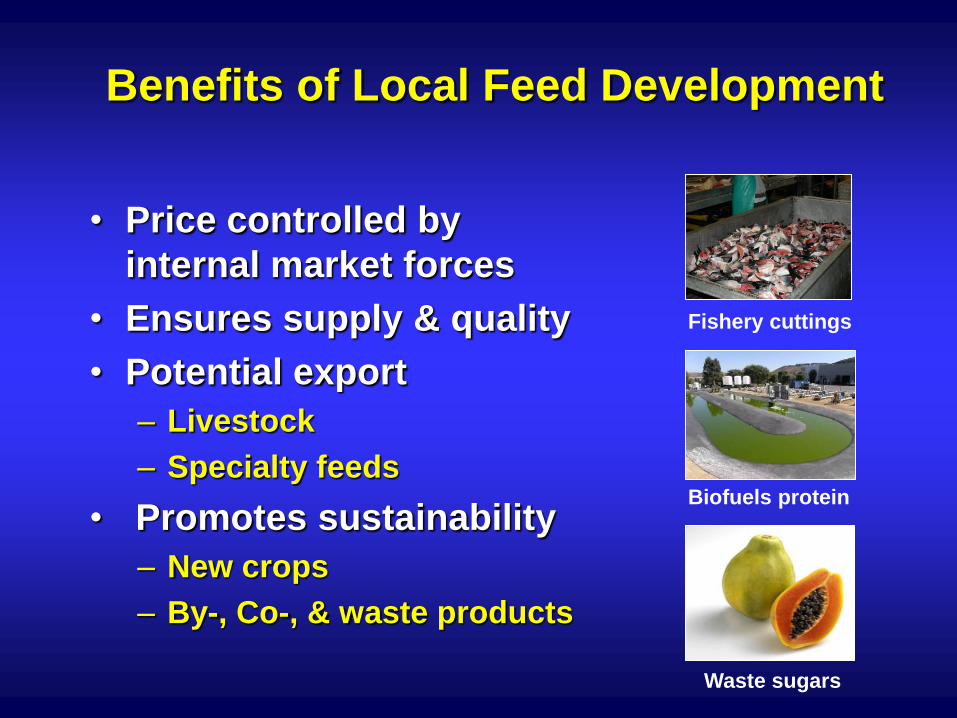
Benefits of Local Feed Development
• Price controlled by
internal market forces
• Ensures supply & quality
• Potential export
– Livestock
– Specialty feeds
• Promotes sustainability
– New crops
– By-, Co-, & waste products
Waste sugars
Biofuels protein
Fishery cuttings
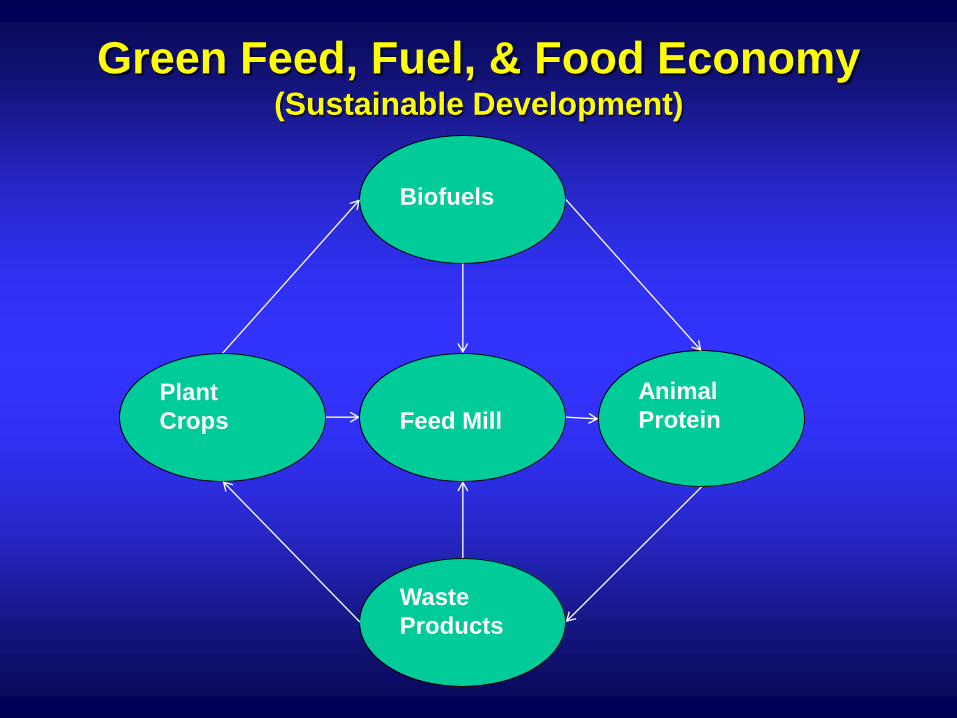
Green Feed, Fuel, & Food Economy (Sustainable Development)
Animal
Protein
Biofuels
Plant
Crops
Waste
Products
Feed Mill
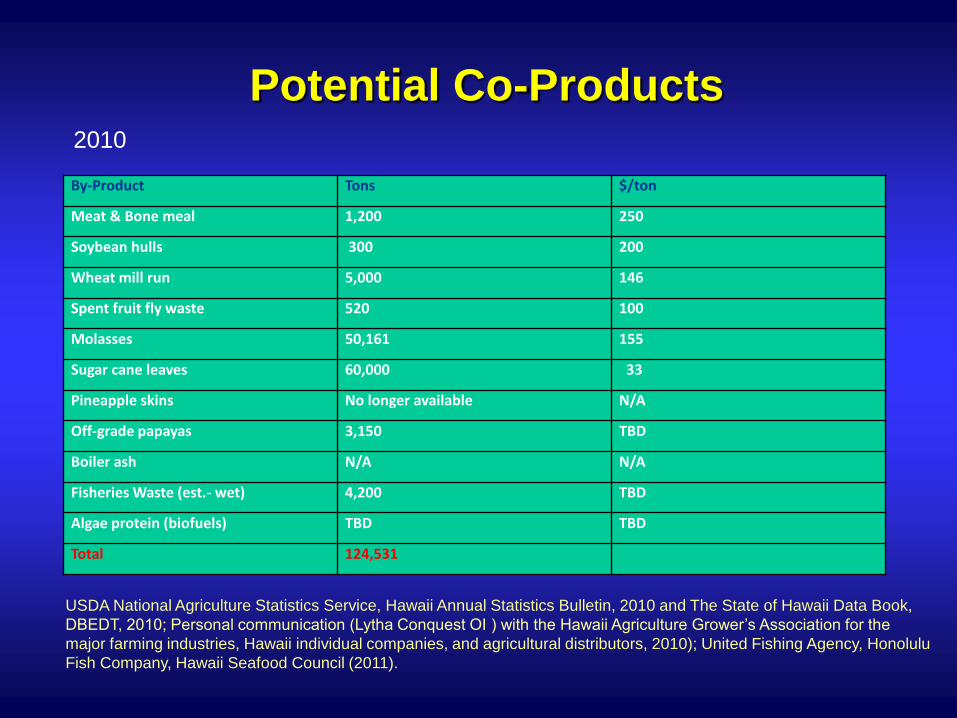
Potential Co-Products 2010
By-Product Tons $/ton
Meat & Bone meal 1,200 250
Soybean hulls 300 200
Wheat mill run 5,000 146
Spent fruit fly waste 520 100
Molasses 50,161 155
Sugar cane leaves 60,000 33
Pineapple skins No longer available N/A
Off-grade papayas 3,150 TBD
Boiler ash N/A N/A
Fisheries Waste (est.- wet) 4,200 TBD
Algae protein (biofuels) TBD TBD
Total 124,531
USDA National Agriculture Statistics Service, Hawaii Annual Statistics Bulletin, 2010 and The State of Hawaii Data Book,
DBEDT, 2010; Personal communication (Lytha Conquest OI ) with the Hawaii Agriculture Grower’s Association for the
major farming industries, Hawaii individual companies, and agricultural distributors, 2010); United Fishing Agency, Honolulu
Fish Company, Hawaii Seafood Council (2011).
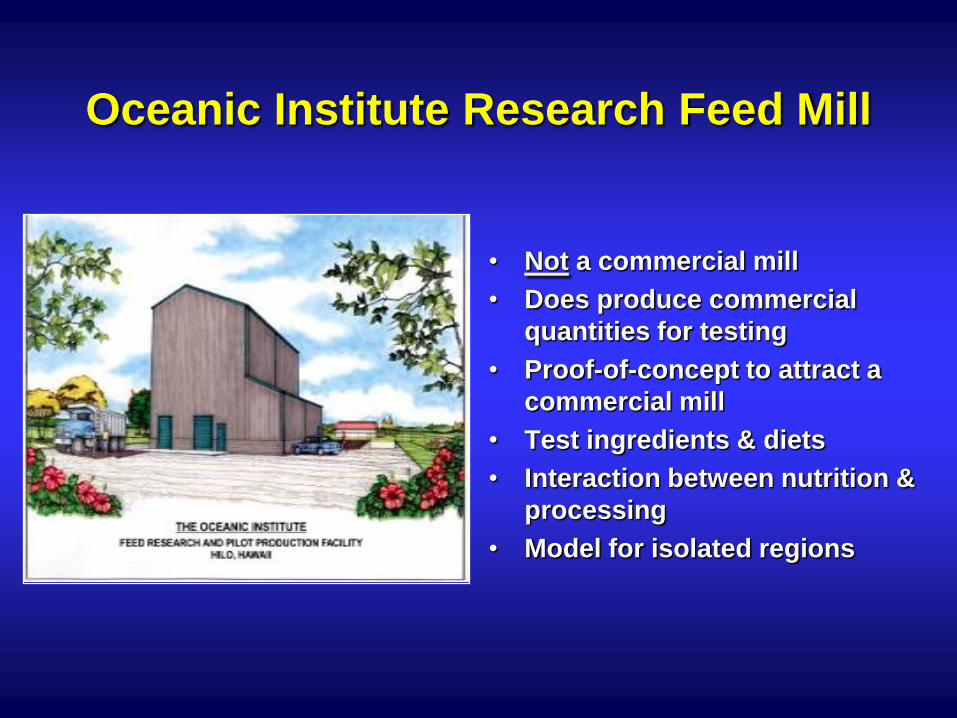
Oceanic Institute Research Feed Mill
• Not a commercial mill
• Does produce commercial
quantities for testing
• Proof-of-concept to attract a
commercial mill
• Test ingredients & diets
• Interaction between nutrition &
processing
• Model for isolated regions
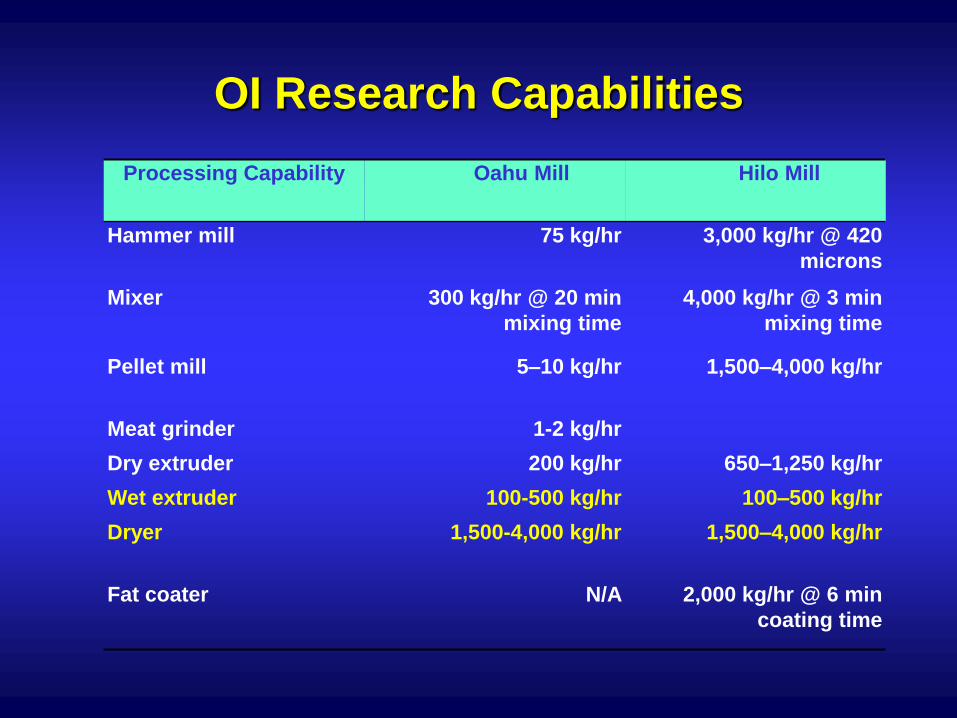
OI Research Capabilities
Processing Capability Oahu Mill Hilo Mill
Hammer mill 75 kg/hr 3,000 kg/hr @ 420
microns
Mixer 300 kg/hr @ 20 min
mixing time
4,000 kg/hr @ 3 min
mixing time
Pellet mill 5–10 kg/hr 1,500–4,000 kg/hr
Meat grinder 1-2 kg/hr
Dry extruder 200 kg/hr 650–1,250 kg/hr
Wet extruder 100-500 kg/hr 100–500 kg/hr
Dryer 1,500-4,000 kg/hr 1,500–4,000 kg/hr
Fat coater N/A 2,000 kg/hr @ 6 min
coating time
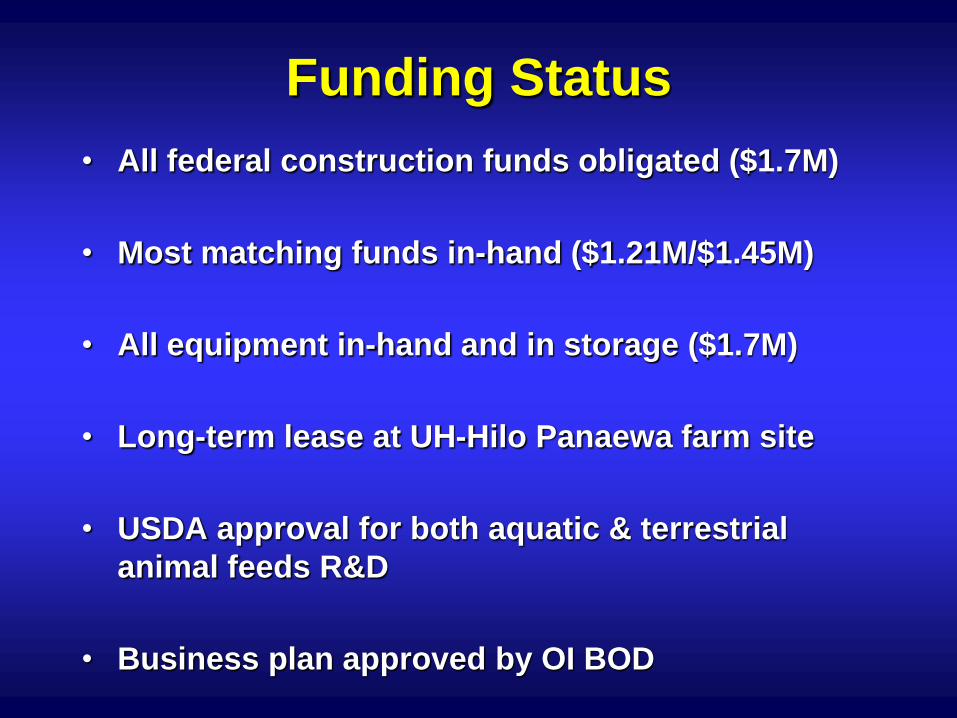
Funding Status
• All federal construction funds obligated ($1.7M)
• Most matching funds in-hand ($1.21M/$1.45M)
• All equipment in-hand and in storage ($1.7M)
• Long-term lease at UH-Hilo Panaewa farm site
• USDA approval for both aquatic & terrestrial
animal feeds R&D
• Business plan approved by OI BOD
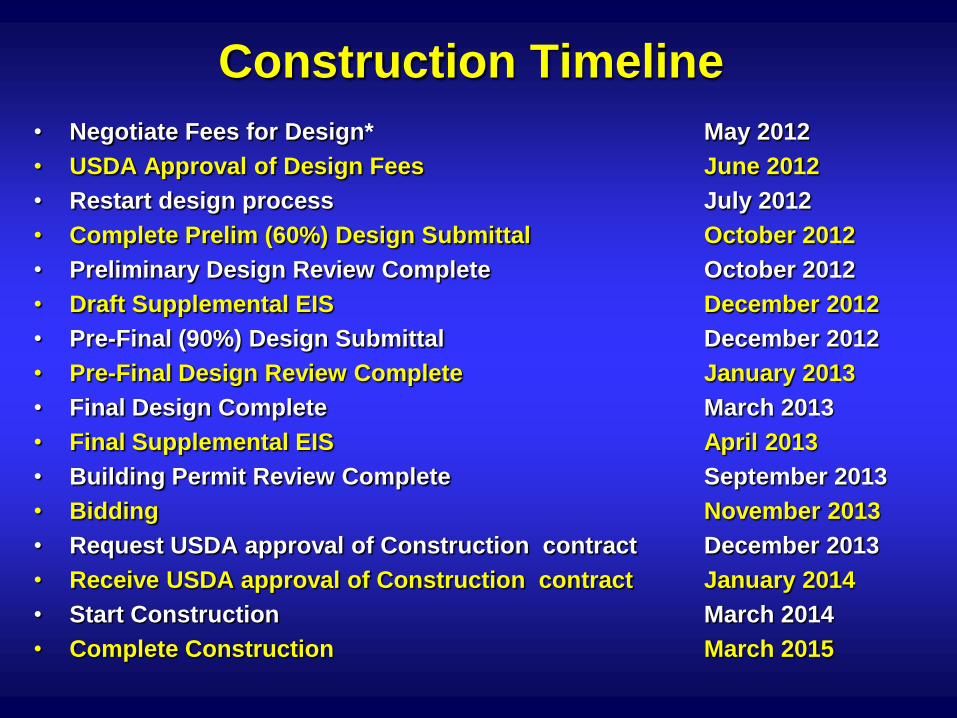
Construction Timeline
• Negotiate Fees for Design* May 2012
• USDA Approval of Design Fees June 2012
• Restart design process July 2012
• Complete Prelim (60%) Design Submittal October 2012
• Preliminary Design Review Complete October 2012
• Draft Supplemental EIS December 2012
• Pre-Final (90%) Design Submittal December 2012
• Pre-Final Design Review Complete January 2013
• Final Design Complete March 2013
• Final Supplemental EIS April 2013
• Building Permit Review Complete September 2013
• Bidding November 2013
• Request USDA approval of Construction contract December 2013
• Receive USDA approval of Construction contract January 2014
• Start Construction March 2014
• Complete Construction March 2015

Mahalo from
Oceanic Institute


![EPA Reg. No. 5813-111 Clorox Regular Bleach2 [2 X 121 oz ...hawaii.gov/hdoa/labels/9176.266.pdf · Clorox Regular Bleach2 [2 X 121 oz] Page 1 of 6 RC308020 F Shown on page 6 A Shown](https://img.pdfslide.us/doc/110x75/5fd8fa420071fc3e9803ef4e/epa-reg-no-5813-111-clorox-regular-bleach2-2-x-121-oz-clorox-regular-bleach2.jpg)