Embed Size (px)
Citation preview

Pilot evaluation of the efficacy of electronic monitoring on a demersal
gillnet vessel as an alternative to human observers
R. Evans and B. Molony
Fisheries Research Report No. 221, 2011
Fisheries Research Division Western Australian Fisheries and Marine Research Laboratories PO Box 20 NORTH BEACH, Western Australia 6920

ii Fisheries Research Report [Western Australia] No. 221, 2011
Correct citation:
Evans, R. and Molony, B. 2011. Pilot evaluation of the efficacy of electronic monitoring on a demersal gillnet vessel as an alternative to human observers. Fisheries Research Report No. 221. Department of Fisheries, Western Australia. 20pp.
Enquiries:
WA Fisheries and Marine Research Laboratories, PO Box 20, North Beach, WA 6920 Tel: +61 8 9203 0111 Email: [email protected] Website: www.fish.wa.gov.au ABN: 55 689 794 771
A complete list of Fisheries Research Reports is available online at www.fish.wa.gov.au
© Department of Fisheries, Western Australia. August 2011. ISSN: 1035 - 4549 ISBN: 978-1-921845-23-9

Fisheries Research Report [Western Australia] No. 221, 2011 iii
Contents
Abstract ................................................................................................................................. 1
1.0 Acknowledgements ....................................................................................................... 2
2.0 Introduction .................................................................................................................. 3
2.1 Methods .................................................................................................................. 6
2.2 Data recording and transfer .................................................................................... 6
2.3 Image size and frame rate ....................................................................................... 6
2.4 Results and discussion ............................................................................................ 6
2.5 Time ........................................................................................................................ 8
2.6 Dropouts.................................................................................................................. 8
2.7 Installation .............................................................................................................. 8
2.8 Conclusions ............................................................................................................. 9
3.0 References ..................................................................................................................... 10

iv Fisheries Research Report [Western Australia] No. 221, 2011
Fisheries Research Report [Western Australia] No. 221, 2011 1
Abstract
A large number of documents exist in peer reviewed and ‘grey’ scientific literature that describe ‘how to’ establish a generic observer program for bycatch. Rather than repeat the many reviews of establishing observer programs, this component of WAMSI project 4.4.1 undertook a pilot trial to test the efficacy of using Electronic Monitoring (EM) in place of on-board human observers to record and identify the catch composition of a commercial demersal gillnet vessel. Approximately 80% of all catch (including target, by-product and bycatch species), including interactions with threatened, endangered and protected species (TEPS) could be identified to the same taxon as reported by commercial fishers in logsheets. With additional tuning and regular maintenance of the EM equipment (particularly the camera), it is likely that the identification of all catch to the appropriate taxonomic level could approach 100%. The outcomes of the initial small-scale pilot trial of EM provide a basis for future evaluation of EM systems in West Australian fisheries.

2 Fisheries Research Report [Western Australia] No. 221, 2011
1.0 Acknowledgements
We thank Stuart Blight, Steve Guy and Kim Gray for their help in organising and fitting cameras and retrieving data. We also extend our thanks to the professional licensed gillnet fisher and his family for making their vessel available as a platform for this study and for Mathew Hourston and Rory McAuley for reviewing and commenting on earlier drafts. This research was supported by the Western Australian Marine Science Institute (WAMSI) under Node 4: Fisheries Ecosystems, Project 4.4: Captured Species Assessments. Additional support for the project was provided by the Department of Fisheries, Western Australia.
Fisheries Research Report [Western Australia] No. 221, 2011 3
2.0 Introduction
Growing implementation of Ecosystem Based Fisheries Management (EBFM) (Fletcher et al. 2010), coupled with increasing community scrutiny of fisheries, has resulted in a broader assessment of the impacts of fishing. EBFM requires not only consideration of the impacts and risks of commercial fishing on target species, but also interactions with by-product and non-retained species, and interactions between commercial fisheries and Threatened, Endangered and Protected Species (TEPS). In addition, many commercial fisheries with export approval under the Environmental Protection and Biodiversity Conservation Act (EPBC Act) have specific recommendations and/or conditions relating to avoiding or reducing interactions with TEPS which must be met to permit export of fishery products (see www.environment.gov.au/coasts/fisheries/wa/index.html for links to recommendations and/or conditions for West Australian managed fisheries under the EPBC Act).
Worldwide, many fisheries have adopted observer programs to record information on all species interacting with commercial fisheries, including TEPS (see www.afma.gov.au/services-for-industry/observer-program). Observer programs provide independently collected data from fishery dependent activities to enhance collection of management, research, monitoring and compliance data (Koolman et al. 2007, McEldery 2008, Stanley et al. 2009). Observer programs are generally focussed on specific objectives. For example, observer programs may focus on; the validation of fishing effort parameters; to provide fine resolution data on fishing behaviour (e.g. gear location, depth, orientation, configuration, etc.); size, age and sex composition of target species; validate tag (non-) reporting rates; collection of biological samples to support stock assessments; or estimate interaction rates with specific TEPS (e.g. Stephenson and Wells 2006, Stephenson et al. 2006).
However, there are some significant potential biases in the distribution of observer effort, with most typically focussed on larger industrial-style commercial fishing fleets while many smaller regional fleets receive minimal or no observer coverage (e.g. see WCPFC 2010). Biases may occur due to a combination of reasons including;
• The high costs of observers (typically met by the commercial operators);
• The ability of observers to correctly identify catches to species level;
• A high turn-over of observer staff, potentially leading to differential identification of species and issues around data robustness and validity;
• Limited physical space on smaller vessels that may restrict observer placement to those vessels (or fisheries) that can ‘fit’ (accommodate) an observer. This may bias data collection;
• Occupational health and safety considerations of observer programmes that require the identification of vessels that are safe to accommodate an observer;
• Issues may also arise if a vessel or fleet is unable to fish due to poor weather. Observers must be housed on land during these periods of poor weather, further increasing observer programme costs.
A majority of observer programs can physically and financially only cover less than 20% of the fishing activities of a fleet, and typically much lower coverage is obtained for many fisheries (e.g. Ames et al. 2007, WCPFC 2010). This provides limited power to detect interactions with rare species such as many TEPS. Nonetheless, an observer programme with 10–20% coverage would be able to detect any interactions that occurred regularly.
4 Fisheries Research Report [Western Australia] No. 221, 2011
A number of documents exist in peer reviewed and ‘grey’ scientific literature which describe ‘how to’ establish generic observer programmes for target and non-target species. These documents include reviews (Alverson 1999, Babcock & Pikitch 2003, NMFS (National Marine fisheries Service) 2004, Cotter & Pilling 2007), studies establishing relationships between target catch and bycatch species (NMFS 2004, Rochet & Trenkel 2005, Benoit & Allard 2009), and rigorous statistical methodological papers on bycatch observer programs (Northbridge & Thomas 2003, Rago et al. 2005, Wigley et al. 2010).
In brief, three main areas require careful consideration to enable a successful observer program - precision, accuracy and bias. Precision measures the similarity of several estimates; accuracy measures how similar averages of estimates are to the ‘true’ average, and; bias estimates how representative observer data are to the ‘true’ data arising from a fishery. One common objective of observer programs is to estimate catches of some or all components of the catch (e.g. target species, byproduct species, bycatch1 species, TEPS) with a low level of coverage that provides estimates that are similar to each other (i.e. precise) and with the mean close to the actual catches within a fishery (i.e. accurate with reduced and known levels of bias). Large numbers of samples generally provide more precise estimates, albeit with increasing expense. To balance cost versus precision, precision levels are typically set prior to an observer programme being implemented to determine target observer coverage rates required to meet an objective.
When designing an observer program the level of coverage required will be determined by the cost, logistics, safety of the observers, and the management objectives and questions being addressed. These management questions could be focussed on monitoring interactions with TEPS; improving knowledge of bycatch species and /or discard rates or the size/age/sex composition of target species catches to enhance stock assessments; validating fishing effort data; understanding fishing behaviour; collection of biological data, etc. (Babcock & Pikitch 2003). Ultimately 100% observer coverage would provide the most robust data. However, given the limitations typical of most observer programmes, a sub-sample of the fishing events (e.g. trips) is the approach generally taken. Babcock & Pikitch (2003) recommend 20% coverage for abundant species, at least 50% for rare species, with 100% observer coverage required for some special cases including interactions with TEPS.
Rather than repeat the many reviews of generic observer programs that exist in the literature, this part of the WAMSI project attempted to evaluate an alternative method for obtaining observer data.
As an alternative option to human observers, some jurisdictions are trialling Electronic Monitoring (EM) techniques as a way to reduce costs and/or increase coverage rates within a fishery (Ames et al. 2007, Koolman et al. 2007, McElderry 2008, Stanley et al. 2009). EM studies have been conducted for over two decades to monitor catch, bycatch and TEPS interactions in a wide range of fisheries methods including trawl, trap, gillnet and longline fisheries (McEldery 2008). EM technologies may be used to replace observers or to supplement them (Ames et al. 2007), as in some fisheries a single observer cannot see all parts of the fishing operation at all times (e.g. during rest periods on 24 hour operations (e.g. AFMA sub-Antarctic fisheries use two observers per trip, see www.afma.gov.au/wp-content/uploads/2010/06/summary_measures_2009.pdf).). AFMA has trialled and is currently reviewing cost-benefits of EM in a range of fisheries (see www.afma.gov.au/managing-our-fisheries/data-collection/data-collection-programs/#emon for links to a range of reports and evaluations).
1 In the Department of Fisheries, Western Australia, the term ‘bycatch’ is used to describe any species or individuals that are discarded (i.e. not retained).
Fisheries Research Report [Western Australia] No. 221, 2011 5
A number of commercial fisheries managed by the Department of Fisheries, Western Australia, have received some level of observer coverage at certain times. A recent report (Evans and Molony 2010) showed that 11 of 26 fisheries in the West Coast and Gascoyne Bioregions had some byproduct and bycatch data collected by observers placed on vessels. However, much of these data were not contemporary, with some observer data being more than two decades old. Other data were collected with fishing gear that does not represent the gears currently used within a fishery (e.g. observer data collected before the implementation of bycatch reduction devices (BRDs) on some trawl fisheries reducing bycatch and discard rates (Evans and Molony, 2010)). Further, many fisheries have had significant management changes since observer data were collected, including significant (33–50%) reductions in effort (e.g. WCDSF, TDGLF) that have presumably reduced catches and interactions with all species.
Recently, gillnet method fisheries in temperate Western Australia have become the focus of attention for three reasons;
1. Uncertainty in interaction rates with marine mammals, particularly the Australian Sea Lion, (Neophoca cinerea, ASL);
2. Uncertainty in interaction rates with other TEPS, including protected species of sharks (e.g. white sharks, Carcharodon carcharias);
3. Perception of ‘dropouts’2 of demersal scalefish (which are a legitimate and managed component of the catch of gillnet fisheries).
Two small studies, supported through the FRDC, are focussing on the first and third points above. All three areas above are likely to require the collection of contemporary observer data. However, given the high costs of human observers and other limitations, it is unclear how these new data will be efficiently collected. The alternative is to use EM approaches; however, EM techniques have not been evaluated for their efficacy in the Western Australian TDGNLF.
The purpose of this WAMSI study was to commence an evaluation of the efficacy of EM for undertaking some observer roles in this fishery. Specifically, the objectives of this pilot project were to observe, record and identify;
a) TEPS interactions in this fishery as a gillnet reaches the surface of the water;
b) The species composition of byproduct catches;
c) The species composition of bycatch species (i.e. discards), including ‘dropouts’ from the gillnet at the surface; and
d) The species composition of target catches.
Quantitative analysis of the catch composition was not part of this pilot study due to time and logistic constraints but data were stored and can be further analysed at a later date as required.
2 In this study ’dropouts’ are defined as individuals that are captured in the gillnet but fall out of the net before being landed on board a vessel. They may include target species, by-product species, bycatch species or TEPS. Animals that fell out of the net but were subsequently gaffed and landed were reported as part of the catch.
6 Fisheries Research Report [Western Australia] No. 221, 2011
2.1 Methods
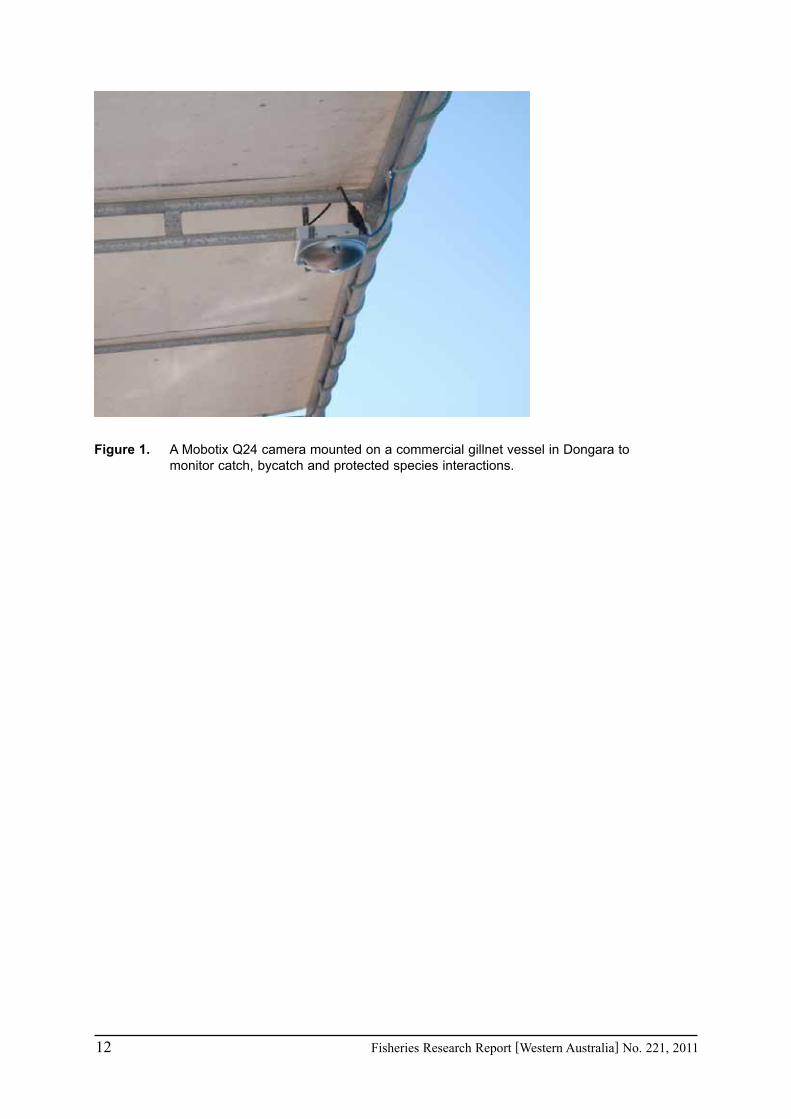
One Mobotix Q24 camera, connected to a Mac Mini, was placed on board a demersal gillnet vessel3 based in Dongara, approximately 360 km north of Perth, Western Australia. The camera was mounted, on the edge of a canopy frame that covers the back deck, looking over the gunwale of the vessel. The camera had a 360° view of the back deck and the water from the bow to the stern of the port side of the vessel (Figures 1 and 2).
2.2 Data recording and transfer
The Mobotix Q24 cameras can operate under two modes of data recording;
a) The computer saves everything from the moment the vessel power is turned on until it is turned off. Files are stored in one-hour blocks; or
b) Motion detectors in the camera can be focused on certain areas of the vessel and data saved only when there is movement in this area. All resulting images are joined together in one file.
In this study we opted to use the first option as it produced multiple, one hour files which were more efficient to download and review than a single large file. Data were stored in one-hour files on a Mac Mini, using “SecuritySpy” software. The hard drive on the Mac Mini was able to store 319 GB of data before the hard drive became full, equivalent to approximately 18 weeks of the study vessel’s typical fishing activity (at a rate of 200 MB per 1-hour file as used in this study).
Data can be transferred via wireless Internet if an appropriate connection speed is available and power to the vessel is maintained until all data are transferred. In the event that the power is turned off before download can occur, manual download on the vessel is also possible. Due to the inability to transfer data over the Internet from Dongara, the camera required manual download during this project.
2.3 Image size and frame rate
A series of configurations of file size, image capture, shutter speed, aperture and focus level were briefly tested during this study to optimise image quality. The objective was to increase image resolution and then decrease the frame rate to minimise data storage while still maintaining good estimates of catch. There was a trade-off between image size and quality, which required fine-tuning. Images from the camera in this study were recorded at a rate of 1 per second. Image size was recorded at the smallest resolution of the camera (1024 x 768 pixels).
2.4 Results and discussion
The original concept of this study was to download the data wirelessly via the Internet. However, download speeds from the vessel were insufficient for this to occur in this remote location and therefore the study relied on manual download. As a result of limited by project funding, footage download occurred only twice during the project.
3 The vessel is not identified in this report to maintain confidentiality.
Fisheries Research Report [Western Australia] No. 221, 2011 7
All images were reviewed after the field component of the study was complete. This did not permit optimising the image size and frame rate of the camera. Optimisation of images would likely take in the order of a few days if the data could be downloaded regularly over the Internet during at the initial stages of the project.
The limited funding did not permit the camera to be inspected and maintained during the field component of this study. On review of the images captured by the camera, water condensation was observed after approximately six weeks partially obscuring all subsequent images and completely obscuring the last week of images. The condensation could be from either rain and/or saltwater. Had the data been downloaded across the Internet and reviewed more regularly, this condensation would have been detected earlier and maintenance undertaken. This highlights the need for regular downloading and review of the images, at least on a monthly basis. Nonetheless, this pilot study aimed to establish a ‘proof of concept’ and the results still provided valuable information on the efficacy of EM of this fishery.
The main target species caught by this vessel (and the fishery) were sandbar (Carhcarhinus plumbeus), dusky (C. obscurus), blacktip (Carhcarhinus spp.) and whiskery (Furgaleus macki) sharks. Teleost species retained as by-products included West Australian dhufish (Glaucosoma hebraicum), pink snapper (Pagrus auratus), baldchin groper (Choerodon rubescens), sand snapper (Diagramma labiosum), mulloway (Argyrosomus japonicus) and small numbers of parrotfish (Family Scaridae), coral trout (Plectropomus spp.), estuary cod (Epinephelus coioides) and red throat emperor (Lethrinus miniatus). Bycatch elasmobranch species included Port Jackson shark (Heterodontus portusjacksoni), oversized dusky whaler sharks (Carcharhinus obscurus)4, eagle rays, stingrays and tiger sharks (Galeocerdo cuvier). Other taxa were discarded including buffalo bream, rock lobster and blowfish. TEPS observed interacting with the net during this trial included a single white shark, several grey nurse sharks and two dolphins.
The ability to determine if an animal was alive or dead on return to the water was sometimes difficult due to the single-frame images. Animals were determined to be alive if there seemed to be some form of movement when removed from the net.
Approximately 80% of elasmobranchs and teleosts recorded by the camera and identified to the lowest taxon concurred with the identifications recorded in logbooks completed by fishers. This is despite sub-optimal image quality. Reasons for less than 100% concurrence included;
a) Lack of experience in identifying elasmobranchs by the reviewer of the images (R. Evans);
b) Low light levels during haul periods before sunrise;
c) Blurry footage due to movement of an animal or the net;
d) Deckhands standing between the net and the camera;
e) Glare off the deck of the boat, and/or;
f) Glare off the surface of the water.
In practical terms, little can be done to minimise deck movement. However, the following changes may improve results, including thorough training of observers (image reviewers), alternative camera technology can be used to optimise image collection under low light conditions to produce clearer images, further optimisation of image size and shutter speed would improve image quality and clarity, and glare effects may be reduced if polarised/anti-glare lenses are
4 Dusky whaler sharks with an inter-dorsal fin length greater than 700 mm are totally protected in Western Australia, including in the temperate demersal gillnet fishery. There is also a maximum size limit (greater than 700 mm inter-dorsal fin length) for all species of whaler sharks which applies to all recreational fishers, and for all commercial fishers that do not operate in a “recognised” shark fishery in the South Coast Bioregion and/or West Coast Bioregion.
8 Fisheries Research Report [Western Australia] No. 221, 2011
used. Addressing all of these issues could greatly improve the ability of a remote observer to identify most catches from an EM programme. Presence of onboard observers during EM trials would also allow independent verification of image analysis results.
2.5 Time
On return of the images to the laboratory, it took one person 10 hours and 40 minutes to scan the footage from 10.5 fishing days. A fishing day in this instance was 10–14 hours, including the setting time of the net for the next day’s haul. Thus, if an observer were to be placed on this vessel for the duration of this study, not withstanding time spent travelling to and from the vessel and in the field between fishing days, they would be on board for approximately 105–147 hours.
An estimate of the costs for this study was approximately $20,000 including equipment, salaries for technical staff (one week) and a research scientist (four weeks for organising, analysing and report writing). In contrast, an on-board observer for the duration of the study (four months) would cost approximately $55,000, not including analysing and reporting. While the benefits in terms of time and costs of using EM for identifying catches appear clear, the current study was a small scale-pilot to demonstrate the utility of cameras, as opposed to formally comparing the costs and benefits of observers and on-board cameras. The costs of commercial installation, maintenance, life-time costs of the cameras, and the non-fiscal benefits of observers (e.g. building relationships between the industry and the Department) were not considered. Thus, the figures cited here are for information only.
There are many other aspects of observer programs that were not addressed as objectives of this trial (e.g. effort validation, fishing behaviour, biological sampling, etc.) that were not evaluated but may not be achievable using cameras. Therefore value for money in terms of multiple objectives may be greater using onboard observer programs. This study was not designed to answer this question.
2.6 Dropouts
Dropouts of animals from observed gillnets were rare events. Identification of dropouts was limited and could mainly be recorded only at higher taxonomic levels (e.g. elasmobranch, teleost) unless obvious morphological traits were observed. In total, five elasmobranchs and three teleosts were observed to dropout during hauling of the nets. The total number of dropouts does not include those animals that the fishers discarded (e.g. oversized bronze whalers or TEPS). For example, the image reviewer in the laboratory (R. Evans) recorded that fishers intentionally ‘dropped out’ two sharks from the net prior to the sharks reaching the deck. In addition, the skipper reported two grey nurse sharks in their statutory log book that were not noted by the image reviewer on that date. It is possible that the two intentionally dropped out sharks were these two grey nurse sharks.
2.7 Installation
Installation of the equipment is dependent on the layout of the vessel. In this project, preliminary investigation and conversations with the boat owner took one hour to understand the capabilities of the vessel to house the equipment. Installation of the equipment took half a day, not including travel time. This study would have benefited from thorough testing of the image size, light settings, shutter speeds and frame rates to optimise image quality and therefore data quality at
Fisheries Research Report [Western Australia] No. 221, 2011 9
the start of the project rather than relying on subsequent optimising of images. However time and funds were not available for fine-tuning images and thus images collected during the first half of the study were made under the original settings of the camera. Future studies would benefit from investment of time and resources to fine tune image capture during initial stages to ensure that data are collected at optimal quality.
2.8 Conclusions
This study demonstrated approximately 80% concurrence with fishers logbook records by reviewing camera footage without an on-board observer. With additional fine-tuning, identification of individuals and estimates of interaction rates are likely to improve. The costs of the EM units, including review of the data, was relatively cheaper than for an on-board observer, but provided limited ability to assess a range of objectives. The long-term reliability of the EM unit used in this study needs further evaluation. Quantitative analyses of the data, coincident on-board observers to verify catch identification, and verification with fishers log-sheet data are also recommended before consideration of EM in West Australian fisheries.

10 Fisheries Research Report [Western Australia] No. 221, 2011
3.0 ReferencesAlverson, D. L. 1999. Some observations on the science of bycatch. Marine Technology Society Journal.
33: 6–12.
Ames, R. T., Leaman, B. M., and Ames, K. L. 2007. Evaluation of video technology for monitoring of multispecies longline catches. North American Journal of Fisheries Management. 27: 955–964.
Babcock E. A. & Pikitch E. K. 2003. How much observer coverage is enough to adequately estimate bycatch? Unpublished report, 35 pp.
Benoit, H. P., and J. Allard. 2009. Can the data from at-sea observer surveys be used to make general inferences about catch composition and discards? Canadian Journal of Fisheries and Aquatic Sciences. 66: 2025–2039.
Cotter, A. J. R., and G. M. Pilling. 2007. Landings, logbooks and observer surveys: improving the protocols for sampling commercial fisheries. Fish and Fisheries. 8: 123–152.
Evans, R. and Molony, B. W. 2010. Ranked Risk Assessment for Bycatch in Multiple Fisheries: a Bioregional Risk Assessment Method. Fisheries Research Report No. 212. Department of Fisheries, Western Australia. 88 pp.
Fletcher, W. J., Shaw, J., Metcalf, S. J. and Gaughan, D. J. 2010. An Ecosystem Based Fisheries Management framework: the efficient, regional-level planning tool for management agencies. Marine Policy. 34: 1226–1238.
Goldsworthy, S. D., Page, B., Shaughnessy, P. D. and Linnane, A. 2010. Mitigating seal interactions in the SRLF and gillnet sector SESSF in South Australia. Report to the Fisheries Research and Development Institute. South Australian Research and Development Institute (Aquatic Sciences), Adelaide. SARDI Publication No. F2009/000613-1. SARDI Research Report Series No. 405. 213 pp.
Koolman, J., Mose, B., Stanley, R. D., and Trager, D. 2007. Developing an integrated commercial groundfish strategy for British Columbia: Insights gained in participatory management. In Biology, assessment, and management of North Pacific rockfishes, pp. 353-366 ed. by J. Heifetz, J. DiCosimo, A. J. Gharrett, M. S. Love, V. M. O’Connell, and R. D. Stanley. Alaska Sea Grant, University of Alaska Fairbanks.
McElderry, H. 2008. At sea observing using video-based electronic monitoring. Background paper for the Electronic Monitoring Workshop July 29-30, 2008, Seattle WA, held by the North Pacific Fishery Management Council, the National Marine Fisheries Service, and the North Pacific Research Board: The efficacy of video-based monitoring for the halibut fishery. http://www.fakr.noaa.gov/npfmc/misc_pub/EMproceedings.pdf.
NMFS (National Marine fisheries Service). 2004. Evaluating bycatch: a national approach to standardized bycatch monitoring. U.S. Dep. Commer., NOAA Tech. Memo. NMFS-F SPO-66 108p. On-line version http and spo.nmfs.noaa.gov/tm.
Northbridge S. & Thomas L. 2003. Monitoring levels required in European Fisheries to assess cetacean bycatch, with particular reference to UK fisheries. Report to DEFRA (EWD) 37 pp.
Rago P. J., Wigley S. E. & Fogarty M. J. 2005. NEFSC bycatch estimation methodology: allocation, precision, and accuracy. U.S. Dep. Commer., Northeast Fish. Sci. Cent. Ref. Doc. 05-09, 44 pp.
Rochet, M.-J., and V. M. Trenkel. 2005. Factors for the variability of discards: assumptions and field evidence. Canadian Journal of Fisheries and Aquatic Sciences. 62: 224–235.
Stanley, R. D., Olsen, N., and Fedoruk, A. 2009. The accuracy of yelloweye rockfish catch estimates from the British Columbia Groundfish Integration Project. Marine and Coastal Fisheries: Dynamics, Management, and Ecosystem Science. 1: 354–362.
Fisheries Research Report [Western Australia] No. 221, 2011 11
Stephenson, P. C. and Wells, S. 2006. Evaluation of the effectiveness of reducing dolphin catches with pingers and exclusion grids in the Pilbara trawl fishery. Final report to Fisheries Research and Development Corporation on Project No. 2004/068. Fisheries Research Report No. 173, Department of Fisheries, Western Australia, 44 pp.
Stephenson, P. C., Wells, S. & King, J. A. 2006. Evaluation of exclusion grids to reduce the catch of dolphins, turtles, sharks and rays in Pilbara trawl fishery. DBIF Funded Project. Fisheries Research Report No. 171, Department of Fisheries Western Australia, 24 pp.
WCPFC (Western and Central Pacific Fisheries Commission) 2010. Annual Report - Regional Observer Programme. WCPFC-TCC6-2010/08. Technical And Compliance Committee, Sixth Regular Session. 30th September – 5th October 2010, Pohnpei, Federated States of Micronesia.
Wigley S.E., Rago P. J., Sosebee K .A. & Palka D. L. 2010. The analytic component to the Standardized Bycatch Reporting Methodology Omnibus Amendment: sampling design end estimation of precision and accuracy (2nd edition). U.S. Dep. Commer., NortheastFish. Sci. Cent. Ref. Doc. 07-09, 156 pp.
12 Fisheries Research Report [Western Australia] No. 221, 2011
Figure 1. A Mobotix Q24 camera mounted on a commercial gillnet vessel in Dongara to monitor catch, bycatch and protected species interactions.
Fisheries Research Report [Western Australia] No. 221, 2011 13
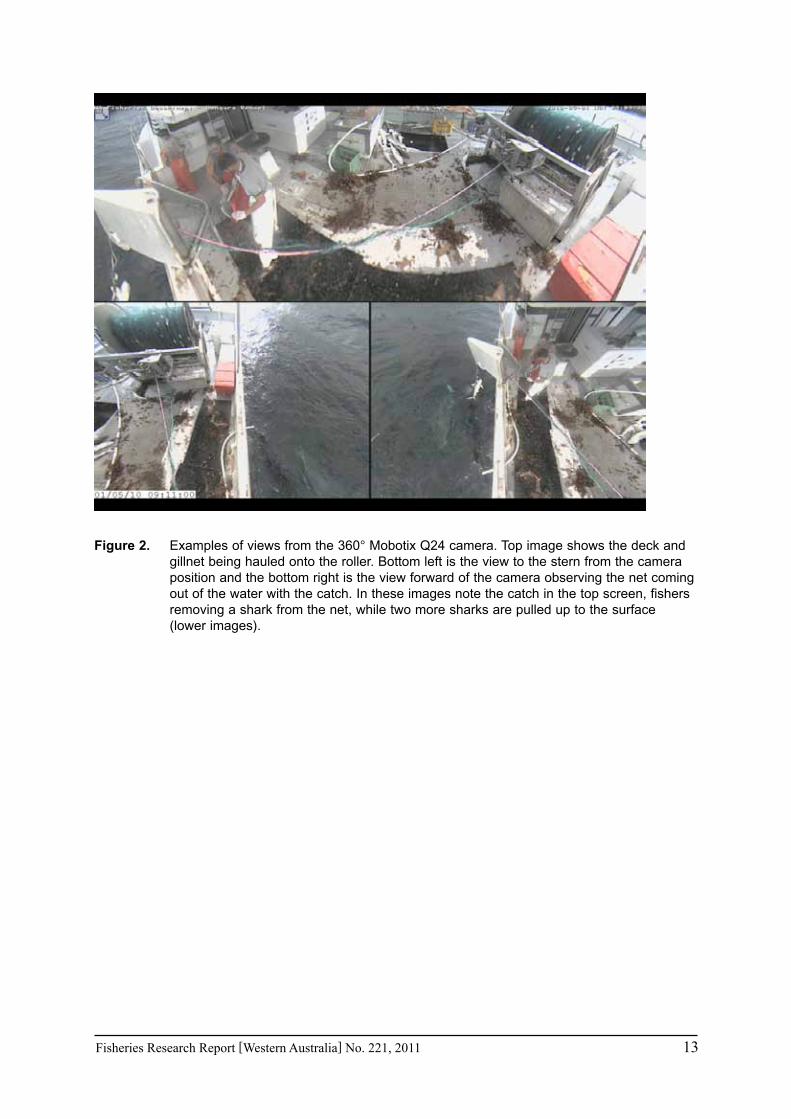
Figure 2. Examples of views from the 360° Mobotix Q24 camera. Top image shows the deck and gillnet being hauled onto the roller. Bottom left is the view to the stern from the camera position and the bottom right is the view forward of the camera observing the net coming out of the water with the catch. In these images note the catch in the top screen, fishers removing a shark from the net, while two more sharks are pulled up to the surface (lower images).

14 Fisheries Research Report [Western Australia] No. 221, 2011

Fisheries Research Report [Western Australia] No. 221, 2011 15

16 Fisheries Research Report [Western Australia] No. 221, 2011


![Pilot evaluation of the efficacy of electronic monitoring ...2 Fisheries Research Report [Western Australia ] No. 221, 2011 1.0 Acknowledgements We thank Stuart Blight, Steve Guy and](https://img.pdfslide.us/doc/110x75/5f02c8b67e708231d405fe24/pilot-evaluation-of-the-efficacy-of-electronic-monitoring-2-fisheries-research.jpg)