Embed Size (px)
Citation preview
Pillar 3 Report 2016
1
Contents Page
Forward-looking statements 2
Presentation of information 3
Capital and leverage 6
CAP 1: CAP and LR: Capital and leverage ratios - RBS CRR end-point and PRA transitional bases 6
CAP 2: CAP and LR: Capital and leverage ratios - RBS and significant subsidiaries 7
CAP 3: CAP: Capital resources (CRR own funds template) - RBS and significant subsidiaries 9
EU OV1: CAP: RWA and MCR summary 15
EU OV1_a: RWA bridge between EU OV1 and credit risk 17
EU OV1_b: RWA bridge between EU OV1 and counterparty credit risk 17
CAP 4: LR: Leverage exposures (CRR Delegated Act Template) - RBS and significant subsidiaries 18
CAP 5: CAP: Capital instruments - RBS and significant subsidiaries 20
CAP 6a: CAP: Countercyclical capital buffer - geographical distribution of credit exposures 22
CAP 6b: CAP: Countercyclical capital buffer requirement 22
EU LI1: CAP: Accounting and regulatory scopes of consolidation 23
Total credit risk exposures and RWAs (including counterparty credit risk) 24
EU CRA: IRB and STD: General qualitative information about credit risk 24
EU CRB_A: Qualitative disclosures relating to the credit quality of assets Note (1)
EU CRC: IRB and STD: Qualitative disclosures relating to credit risk mitigation 24
EU LI2: IRB and STD: Balance sheet to credit risk EAD bridge 25
CR1: IRB and STD: RWA density by RBS sector cluster 27
CR2: IRB and STD: EAD, RWAs and MCR by CRR exposure class: RBS and significant subsidiaries 31
CR3: IRB and STD: EAD, RWAs and MCR by CRR exposure class: RBS segments 35
Credit risk (excluding counterparty credit risk) 42
EU CRB_B: IRB and STD: Exposures (EAD) - period end and average EAD pre and post CRM 42
EU CRB_C: IRB and STD: Exposures (EAD post CRM) - geographical analysis 44
EU CRB_D: IRB and STD: Exposures (EAD post CRM) - industry analysis 46
EU CRB_E: IRB and STD: Exposures (EAD post CRM) - maturity analysis 48
EU CR1_A: IRB and STD: Exposures (Gross carrying value) - credit quality 50
EU CR1_B: IRB and STD: Exposures (Gross carrying value) - credit quality by geography 51
EU CR1_C: IRB and STD: Exposures (Gross carrying value) - credit quality by industry 51
EU CR1_D: IRB & STD: Ageing of past due exposures Note (1)
EU CR1_E: IRB & STD: Impaired and forborne exposures Note (1)
EU CR2_A: IRB & STD: Impairment provision Note (1)
EU CR2_B: IRB & STD: Impaired assets Note (1)
EU CR3: IRB and STD: Credit risk mitigation techniques - net carrying value 52
EU CR3_a: IRB: Credit risk mitigation - incorporation within IRB parameters 53
EU CRD: STD: Use of external credit ratings - qualitative disclosures Note (1)
EU CR4: STD: Exposures and CRM effects 54
EU CR5: STD: Credit risk exposure class and risk-weights 55
EU CR5a: STD: CQS mapping to external credit ratings 56
EU CRE: IRB models - qualitative disclosures 57
EU CRE_1: IRB models - Credit RWA calculation approach by exposure class 57
EU CRE_2: IRB models - Retail 58
EU CRE_2: IRB models - Wholesale 61
EU CR6_a: IRB: Exposures by exposure class and PD range - Retail 66
EU CR6_b: IRB: Exposures by exposure class and PD range - Wholesale 70
EU CR6_c: IRB: Geographical split of PD and LGD 74
EU CR8: IRB & STD: Credit risk RWA and MCR flow statement 75
EU CR9: IRB: IRB models back-testing qualitative disclosures 76
EU CR9_a: IRB: IRB models - Summary PD and EAD back-testing 76
EU CR9_a_1: IRB models - Back-testing of PD by exposure class - Retail - credit risk 77
EU CR9_a_2: IRB models - Back-testing of PD by exposure class - Wholesale - total credit risk 79
EU CR9_b: IRB: IRB models - Back-testing of LGD by exposure class - total credit risk 81
EU CR9_c: IRB: IRB models - Back-testing of EL by exposure class - total credit risk 82
EU CR10_A IRB: IRB specialised lending 82
EU CR10_B: IRB: IRB equities 83Note: (1) Refer to the RBS Annual Report and Accounts 2016 (ARA): Capital and risk management - Credit risk
Pillar 3 Report 2016
2
Contents continued Page
Counterparty credit risk 84
EU CCRA: CCR: General qualitative information 84
EU CCR1: CCR: Analysis of exposure by approach 86
EU CCR2: CCR: Credit valuation adjustment capital charge 86
EU CCR3: CCR STD: Exposures by regulatory portfolio and risk 87
EU CCR4: CCR IRB: Exposures by portfolio and PD scale 88
EU CCR6: CCR: Credit derivatives 92
EU CCR7: CCR: IMM & Non-IMM: Counterparty credit risk RWA and MCR flow statement 92
EU CCR8: CCR: Exposures (EAD post CRM) to central counterparties 93
Market risk 94
EU MRA: MR: General qualitative information 94
EU MRB_A: MR: Qualitative information - position risk 94
EU MRB_B: MR: Qualitative disclosure on use of internal model approach 94
EU MR1_A: MR IMA and STD: RWA and MCR - RBS and significant subsidiaries 96
EU MR1_B: MR STD: RWAs and MCR 98
EU MR2_A: MR IMA: RWAs and MCR 98
EU MR2_B: MR IMA and STD: Market risk RWA and MCR flow statement 99
EU MR3: MR IMA: IMA values for trading portfolios - RBS and significant subsidiaries 99
EU MR4: 1-day 99% regulatory VaR vs. Actual and Hypo P&L 100
EU MR4_A: Regulatory VaR model back-testing exceptions 100
Securitisation 101
SECA: SEC qualitative disclosures 101
SEC 1: Exposure, RWAs and MCR by regulatory approach 108
SEC 2: Exposure and MCR by regulatory approach and risk-weightings 109
SEC 3: Exposure by risk-weightings by underlying exposure type 110
SEC 4: Exposures by role, by on and off-balance sheet 111
SEC 5: Exposures subject to market risk capital requirements 112
SEC 6: Securitisation positions retained from origination and sponsorship - outstanding and past due 113
SEC 7: Securitisation positions in the trading book 113
Appendix 1 - Asset encumbrance 114
Appendix 2 - CRR roadmap 115
Appendix 3 - Key terms and glossary 123 Any discrepancies between totals and sums of components within tables in this report are due to rounding.
Forward-looking statements This document contains certain ‘forward-looking statements’ as that term is defined in the United States Private Securities Litigation Reform Act of 1995
with respect to the financial condition, results of operations and business of The Royal Bank of Scotland Group plc (RBS). Generally, words such as ‘may’,
‘could’, ‘will’, ‘expect’, ‘intend’, ‘estimate’, ‘anticipate’, ‘believe’, ‘plan’, ‘seek’, ‘continue’, ‘project’, ‘should’, ‘probability’, ‘risk’, ‘value-at-risk’, ‘target’, ‘goal’,
‘objective’, ‘endeavour’, ‘outlook’, ‘optimistic’ and ‘prospects’ or similar expressions or variations on such expressions identify forward-looking statements.
Any forward-looking statements set out herein represent RBS’s expectations or beliefs concerning future events and involve known and unknown risks and
uncertainty that could cause actual results, performance or events to differ materially from those expressed or implied in such statements. Factors that
could cause or contribute to differences in current expectations include, but are not limited to, legislative, fiscal and regulatory developments, accounting
standards, competitive conditions, technological developments, exchange rate fluctuations and general economic conditions. For further risks and
uncertainties faced by RBS that may impact the statements set out in this document, refer to the 2016 Annual Report and Accounts (ARA).
Any forward-looking statements set out herein speak only as at the date of this document. Except as required by the Prudential Regulation Authority (PRA),
the London Stock Exchange or other applicable law or regulation, RBS does not have any obligation or responsibility to update or revise publicly any
forward-looking statements, whether as a result of new information, further events or circumstances or otherwise, and expressly disclaims any obligation to
do so.
Pillar 3 Report 2016
3
Presentation of information Regulatory framework The European Union (EU) has implemented the Basel III capital proposals through the Capital Requirements Regulation (CRR) and the Capital Requirements Directive (CRD) collectively known as CRD IV. The framework is based on three Pillars: Pillar 1 - Minimum capital requirements:defines rules for the
capital requirement to absorb losses relating to credit, market and operational risk;
Pillar 2 - Supervisory review process: requires banks to undertake an internal capital adequacy assessment process for risks not included in Pillar 1; and
Pillar 3 - Market discipline: requires disclosures to allow investors and other market participants to understand the risk profiles of individual banks.
Pillar 1 - Minimum capital requirements CRR requires risk-weighted assets (RWAs) to be calculated for credit, counterparty credit, market and operational risks with various approaches available to banks, with differing levels of sophistication. The minimum capital requirement is calculated as 8% of RWAs.
RBS uses the following approaches to calculate RWAs: Credit risk: the advanced internal ratings based (IRB)
approach is used for most exposures. The standardised (STD) approach is used for exposures in certain portfolios.
Counterparty credit risk: both the mark-to-market (mtm) method and the internal model method (IMM) are used.
Securitisation: the IRB approach is used. Market risk: both the STD approach and the internal model
approach (IMA) are used. Operational risk: the STD approach is used and is based on
gross income. Refer to page 202 of the 2016 ARA for operational risk disclosures.
Pillar 2 - Supervisory review process Pillar 2 comprises RBS’s internal capital adequacy assessment process (ICAAP) and a supervisory review and evaluation process undertaken on an annual basis and focused on the amounts, types and distribution of capital which RBS considers adequate to cover the risks to which it is or may be exposed. The ICAAP evaluates capital requirements for major sources of risk over the short and long term: Pillar 2A comprises risks that are not captured in Pillar 1
(such as non-traded interest rate risk, structural foreign exchange risk and pension risk) or not adequately captured in Pillar 1 (such as credit concentration risk); and
Pillar 2B incorporates stress testing and scenario analysis, which serve as a basis for a forward-looking assessment of RBS’s capital requirements in stress conditions and any resultant stress capital buffers.
RBS undertakes a risk assessment to ensure all material risks are identified, adequately managed and capitalised where appropriate.
Within Pillar 2A, RBS assesses credit concentration risk, certain aspects of traded market risk that are not fully captured in Pillar 1, non-traded interest rate risk (NTIRR), pension risk and operational risk to compensate for shortcomings of the Pillar 1 standardised approach. RBS uses economic capital models to estimate Pillar 2A capital charges for operational and credit concentration risk. For more information, refer to pages 204, 210 and 218 of the 2016 ARA. Information regarding specific credit risk concentrations, such as sector or geography, is included within Pillar 3. Refer to page 261 of the 2016 ARA for more information on NTIRR and page 205 for pension risk. Pillar 2B is based on stress testing and scenario analysis. It is used to assess the quantum and quality of capital required to be set aside to counteract the adverse impact of a severe but plausible stress on RBS’s capital, and to ensure capital levels in stress conditions remain above minimum requirements. The ICAAP is approved by the Board before it is submitted to the regulator and forms the basis of the supervisory review and the setting of the Individual Capital Guidance by the PRA. Refer to page 179 of the 2016 ARA for details. Pillar 3 - Market discipline RBS is committed to delivering leading practice risk and capital disclosures to ensure that stakeholders understand the risks faced by RBS. The Pillar 3 disclosures are designed to encourage and promote market transparency and stability. They represent a component of RBS's broader disclosures framework. RBS publishes its Pillar 3 disclosures as required by the CRD. Certain of RBS’s subsidiaries in Europe publish capital and RWA data externally through an appropriate mechanism (such as websites and annual reports), thereby satisfying the European Banking Authority requirements for disclosures in the member states. Outside the EU, local subsidiaries may make additional disclosures under Pillar 3 as required by their local regulators. RBS continues to participate in the British Bankers’ Association’s drive towards consistent Pillar 3 disclosures for UK banks wherever possible. It is possible that disclosures made by other banks, especially outside the UK, are not directly comparable with those in this report. Notes are included with the data tables to ensure transparency regarding the approaches used for the disclosures. At EU and global levels, different definitions and assumptions adopted by other banks can make direct comparison difficult.
Pillar 3 Report 2016
4
Regulatory disclosure developments The Basel Committee on Banking Supervision (BCBS) released Part 1 of the revised Pillar 3 framework (RPF) in January 2015. By introducing more specific guidance and prescribed tables and templates, the RPF is regarded by the regulators as a significant step towards enhancing the consistency and comparability of banks’ regulatory disclosures. The RPF did not cover all relevant CRR disclosure requirements; in order to alleviate market pressure relating to these gaps, the European Banking Authority (EBA) issued its Pillar 3 Guidelines consultation paper on 29 June 2016 and final guidelines on 14 December 2016. RBS participated in the British Bankers’ Association Disclosure Code discussions relating to Pillar 3 disclosures during 2016 as in prior years. RBS approach RBS has published a significant proportion of the disclosures recommended by the EBA Pillar 3 guidelines in its 2016 Pillar 3 report and 2016 Annual Report and Accounts (2016 ARA). Disclosure requirements relating to capital, leverage and securitisation were not addressed in the 2016 EBA Guidelines and are unchanged from the prior year. The more significant changes compared with the 2015 Pillar 3 report are set out below: RBS has implemented the sequencing and nomenclature of
templates in line with the EBA Pillar 3 Guidelines with additional tables covering CRR requirements and other key disclosures, principally credit risk.
A significant number of CRR Common Reporting (COREP) templates are included at varying degrees of aggregation compared with COREP.
The exposure measure in the 2016 Pillar 3 Report is aligned with COREP for some of the templates, for example gross exposure in addition to exposure at default (EAD).
Gross exposures are analysed into defaulted and non-defaulted. Templates EU CR 1_A, EU CR 1_B, EU CR 1_C are based on COREP. Analysis of impairment provisions, impairment charges and write-offs and forbearance (templates EU CR 1_A, EU CR 1_B, EU CR 1_C; EU CR 2_A and EU CR2_B) are addressed in the 2016 ARA based on accounting values.
Template EU CRB_D maps CRR regulatory exposure classes to the industry sectors used by RBS Credit Risk for internal risk management.
Additional analysis of netting, collateral and credit conversion factors is provided.
Granularity of credit risk disclosures has been significantly expanded, particularly on IRB exposures. Notably, EU CR6 provides analysis for each exposure class by probability of default (PD) range, number of obligors, average PD, average loss given default (LGD), average maturity, RWAs, RWA density, expected loss (EL) and provisions.
Disclosures on back-testing of credit risk IRB PD models (template EU CR9) have also been significantly expanded to include estimated and actual annual default rates, the number of total and defaulted obligors, both one year and five year averages.
The RWA summary (template EU OV1) is more granular: securitisation, thresholds for capital deductions and credit valuation adjustments (CVA) are reported separately and excluded from credit and counterparty credit risk as relevant. However, to align with internal Group and segmental capital management, RWA flow statements - CR8 and CCR7 - include securitisation, threshold RWAs and CVA. This differs from the approach prescribed by the EBA.
Counterparty and market risk disclosures are more granular including a comparison of period end and average values over the preceding two months (EU MR2_A) in line with COREP.
Key metrics and disclosure roadmap Banks are required to disclose their material risks as part of the Pillar 3 framework. Most of this information is disclosed in the 2016 ARA, available at rbs.com. The 2016 ARA includes a range of risk factors and provides in-depth analysis on the specific risks to which RBS is exposed. These Pillar 3 disclosures provide additional information over and above that contained in the 2016 ARA.
Key metrics for RBS are published as follows: Financial performance measures and ratios - Strategic
report section on page 5 of the 2016 ARA. Capital and leverage ratios for RBS and significant
subsidiaries on page 7. Certain Pillar 3 disclosures are included elsewhere as follows: Remuneration on page 87 of the 2016 ARA. Strategic report - Risk overview on page 38 of the 2016
ARA. Report of the Board Risk Committee on page 79 of the 2016
ARA. Capital and risk management including Risk appetite and
governance on page 164 of the 2016 ARA. Credit risk management on page 207 of the 2016 ARA Market risk on page 260 of the 2016 ARA. Operational risk on page 202 of the 2016 ARA. Capital instruments - detailed terms - are found on the RBS
Investor Relations website. Global Systemically Important Institution (GSII) indicators at
31 December 2016 will be published on the RBS Investor Relations website in April 2017. The Financial Stability Board publishes the GSII list around November each year which informs the requirement for the following 12 months transition.
Pillar 3 Report 2016
5
Independent review The information presented in this Pillar 3 Report is not required to be, and has not been, subject to external audit. Internal Audit undertakes procedures to provide management and the Board with assurance relating to the adequacy and effectiveness of the processes, controls and governance framework over the production of the Pillar 3 disclosures.
Internal Audit also provides additional oversight to the adequacy and effectiveness of the model controls and processes and performs in-depth testing on an annual basis. Internal Audit is independent from Risk Management, and therefore from those responsible for the development and independent validation activity. Any material gaps in control identified by Internal Audit are escalated through standard board reporting and action plans agreed with those accountable for the activity behind the control.
Consolidation Scope of application The Royal Bank of Scotland Group plc is the parent entity for all authorised firms in the Group and is subject to consolidated supervision by the PRA. The Pillar 3 disclosures have been prepared in accordance with CRR applicable in the UK as promulgated by the PRA (Central Bank of Ireland definitions for Ulster Bank Ireland Designated Activity Company (UBI DAC, previously Ulster Bank Ireland Limited)). Control Inclusion of an entity in the statutory consolidation is driven by RBS’s ability to exercise control over that entity. The regulatory consolidation applies a comparable test but consolidation is restricted to certain categories of entities. In accordance with PRA rules, non-financial and certain structured entities are excluded from the regulatory consolidation.
Significant influence or joint control Where RBS does not have control of an entity but has more than 20% of the voting rights or capital of that entity, then it must be included in the regulatory consolidation on a pro-rata basis, unless it falls into one of the excluded categories or RBS has agreed a different treatment with the PRA (by obtaining permission). Such entities will only be included in the statutory consolidation on a pro-rata basis where RBS has joint control. Entities where RBS has significant influence will be equity accounted in the statutory consolidation. Solo-consolidation, impediments to the transfer of capital resources and aggregate capital deficiency Individual entities within RBS apply the provisions in CRR (solo-consolidation permission) in a limited number of cases only. In 2016, The Royal Bank of Scotland plc (RBS plc) had no solo-consolidated subsidiaries whilst National Westminster Bank Plc (NWB Plc) had two solo-consolidated subsidiaries, together NWB Plc in this report. Permission is only used where the business of the activities of the entity is an extension of the parent bank’s activities undertaken for commercial reasons and solo-consolidation is required to ensure that there are no adverse consequences to the capital ratios. All RBS companies are subject to policies, governance and controls set centrally. Aside from regulatory requirements, there are no current or foreseen material, practical or legal impediments to the transfer of capital or prompt repayments of liabilities when due.
Regulatory hierarchy In determining which are its significant subsidiaries for CRR reporting purposes, RBS has considered CRR requirements, including those entities whose total RWAs account for 5% or more of RBS’s RWAs. RBS’s significant subsidiaries at 31 December 2016 were RBS plc, NWB Plc and UBI DAC.
Capital and leverage
6
Capital and leverage Capital consists of reserves and instruments issued that are available to the Group and that have a degree of permanency and are capable of absorbing losses. A number of strict conditions set by regulators must be satisfied to be eligible to count as capital.
Capital risk is the risk that the Group has insufficient capital and other loss absorbing debt instruments to operate effectively including meeting minimum regulatory requirements, operating within Board approved risk appetite and supporting its strategic goals.
Capital management is the process by which the Group ensures that it has sufficient capital and other loss absorbing instruments to operate effectively including meeting minimum regulatory requirements, operating within Board approved risk appetite, maintaining its credit rating and supporting its strategic goals. Capital management is critical in supporting the Group’s business and is enacted through an end to end framework across the Group, its businesses and the legal entities through which it operates.
The Group manages capital based on regulatory requirements. Regulatory capital is monitored and reported on a regulated entity basis, each on a CRR transitional basis as relevant in the jurisdiction, other than for RBS which is on a consolidated and CRR end-point basis. As such, unless otherwise specified, this section applies to those individual regulated banks. For disclosure purposes, significant legal entities are determined with reference to RBS RWAs, using 5% as the threshold. The significant legal entities in the Group are the Royal Bank of Scotland plc (RBS plc), National Westminster Bank Plc (NWB Plc) and Ulster Bank Ireland DAC (UBI DAC). The PRA assesses capital adequacy in the UK banking sector, comparing a bank’s capital resources with its RWAs (the assets and off-balance sheet exposures are ‘weighted’ to reflect the inherent credit and other risks) as well as leverage exposure. For more information regarding the minimum capital and leverage requirements that RBS must meet, refer to the RBS ARA - Capital risk. For minimum capital and leverage requirements that apply to RBS plc, NWB Plc and UBI DAC, refer to the RBS plc ARA.
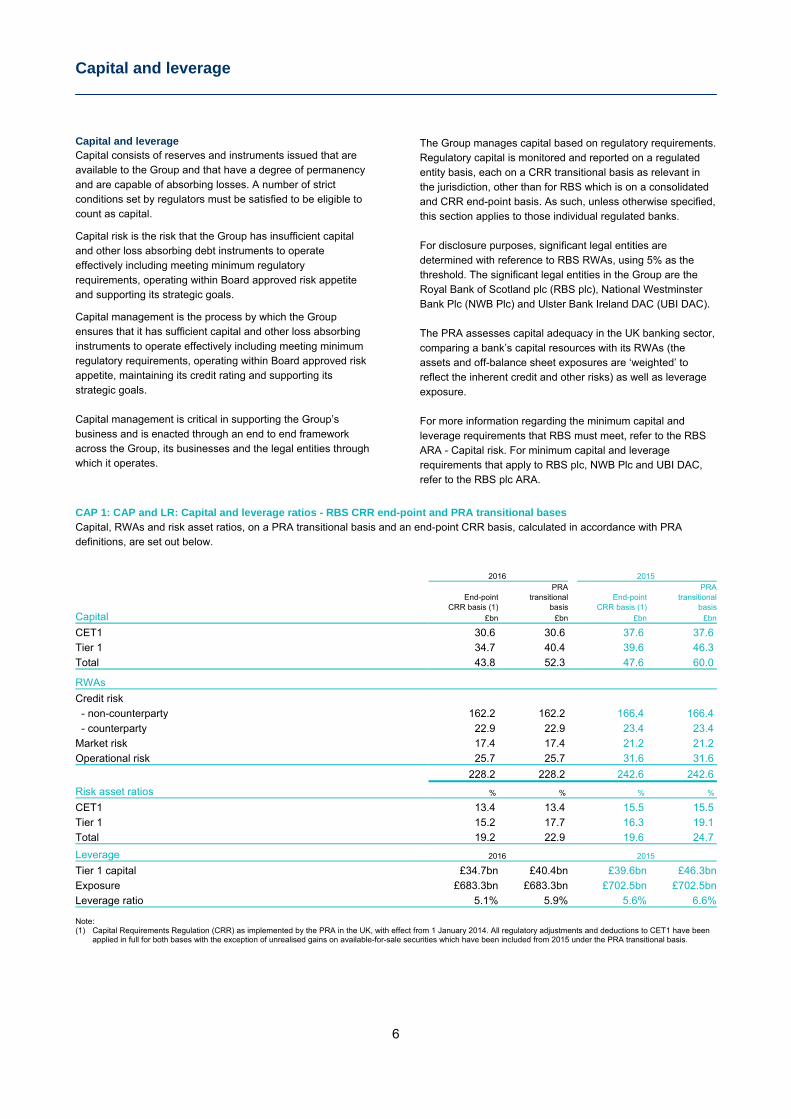
CAP 1: CAP and LR: Capital and leverage ratios - RBS CRR end-point and PRA transitional bases Capital, RWAs and risk asset ratios, on a PRA transitional basis and an end-point CRR basis, calculated in accordance with PRA definitions, are set out below.
2016 2015 PRA PRA
End-point transitional End-point transitional
Capital CRR basis (1) basis CRR basis (1) basis
£bn £bn £bn £bn
CET1 30.6 30.6 37.6 37.6
Tier 1 34.7 40.4 39.6 46.3
Total 43.8 52.3 47.6 60.0
RWAs Credit risk
- non-counterparty 162.2 162.2 166.4 166.4
- counterparty 22.9 22.9 23.4 23.4
Market risk 17.4 17.4 21.2 21.2
Operational risk 25.7 25.7 31.6 31.6
228.2 228.2 242.6 242.6
Risk asset ratios % % % %
CET1 13.4 13.4 15.5 15.5
Tier 1 15.2 17.7 16.3 19.1
Total 19.2 22.9 19.6 24.7
Leverage 2016 2015
Tier 1 capital £34.7bn £40.4bn £39.6bn £46.3bn
Exposure £683.3bn £683.3bn £702.5bn £702.5bn
Leverage ratio 5.1% 5.9% 5.6% 6.6% Note: (1) Capital Requirements Regulation (CRR) as implemented by the PRA in the UK, with effect from 1 January 2014. All regulatory adjustments and deductions to CET1 have been
applied in full for both bases with the exception of unrealised gains on available-for-sale securities which have been included from 2015 under the PRA transitional basis.
Capital and leverage
7
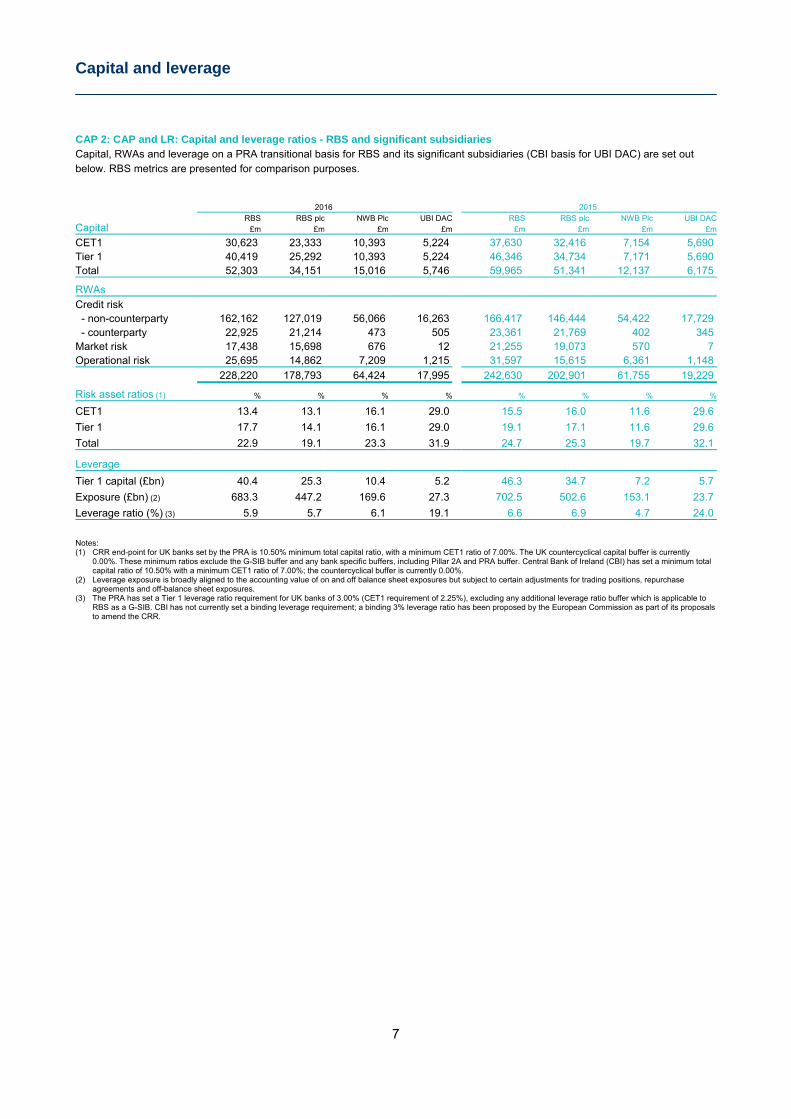
CAP 2: CAP and LR: Capital and leverage ratios - RBS and significant subsidiaries Capital, RWAs and leverage on a PRA transitional basis for RBS and its significant subsidiaries (CBI basis for UBI DAC) are set out below. RBS metrics are presented for comparison purposes.
2016 2015
Capital RBS RBS plc NWB Plc UBI DAC RBS RBS plc NWB Plc UBI DAC
£m £m £m £m £m £m £m £m
CET1 30,623 23,333 10,393 5,224 37,630 32,416 7,154 5,690 Tier 1 40,419 25,292 10,393 5,224 46,346 34,734 7,171 5,690 Total 52,303 34,151 15,016 5,746 59,965 51,341 12,137 6,175
RWAs
Credit risk
- non-counterparty 162,162 127,019 56,066 16,263 166,417 146,444 54,422 17,729 - counterparty 22,925 21,214 473 505 23,361 21,769 402 345 Market risk 17,438 15,698 676 12 21,255 19,073 570 7 Operational risk 25,695 14,862 7,209 1,215 31,597 15,615 6,361 1,148
228,220 178,793 64,424 17,995 242,630 202,901 61,755 19,229
Risk asset ratios (1) % % % % % % % %
CET1 13.4 13.1 16.1 29.0 15.5 16.0 11.6 29.6
Tier 1 17.7 14.1 16.1 29.0 19.1 17.1 11.6 29.6
Total 22.9 19.1 23.3 31.9 24.7 25.3 19.7 32.1
Leverage
Tier 1 capital (£bn) 40.4 25.3 10.4 5.2 46.3 34.7 7.2 5.7
Exposure (£bn) (2) 683.3 447.2 169.6 27.3 702.5 502.6 153.1 23.7
Leverage ratio (%) (3) 5.9 5.7 6.1 19.1 6.6 6.9 4.7 24.0
Notes: (1) CRR end-point for UK banks set by the PRA is 10.50% minimum total capital ratio, with a minimum CET1 ratio of 7.00%. The UK countercyclical capital buffer is currently
0.00%. These minimum ratios exclude the G-SIB buffer and any bank specific buffers, including Pillar 2A and PRA buffer. Central Bank of Ireland (CBI) has set a minimum total capital ratio of 10.50% with a minimum CET1 ratio of 7.00%; the countercyclical buffer is currently 0.00%.
(2) Leverage exposure is broadly aligned to the accounting value of on and off balance sheet exposures but subject to certain adjustments for trading positions, repurchase agreements and off-balance sheet exposures.
(3) The PRA has set a Tier 1 leverage ratio requirement for UK banks of 3.00% (CET1 requirement of 2.25%), excluding any additional leverage ratio buffer which is applicable to RBS as a G-SIB. CBI has not currently set a binding leverage requirement; a binding 3% leverage ratio has been proposed by the European Commission as part of its proposals to amend the CRR.
Capital and leverage
8
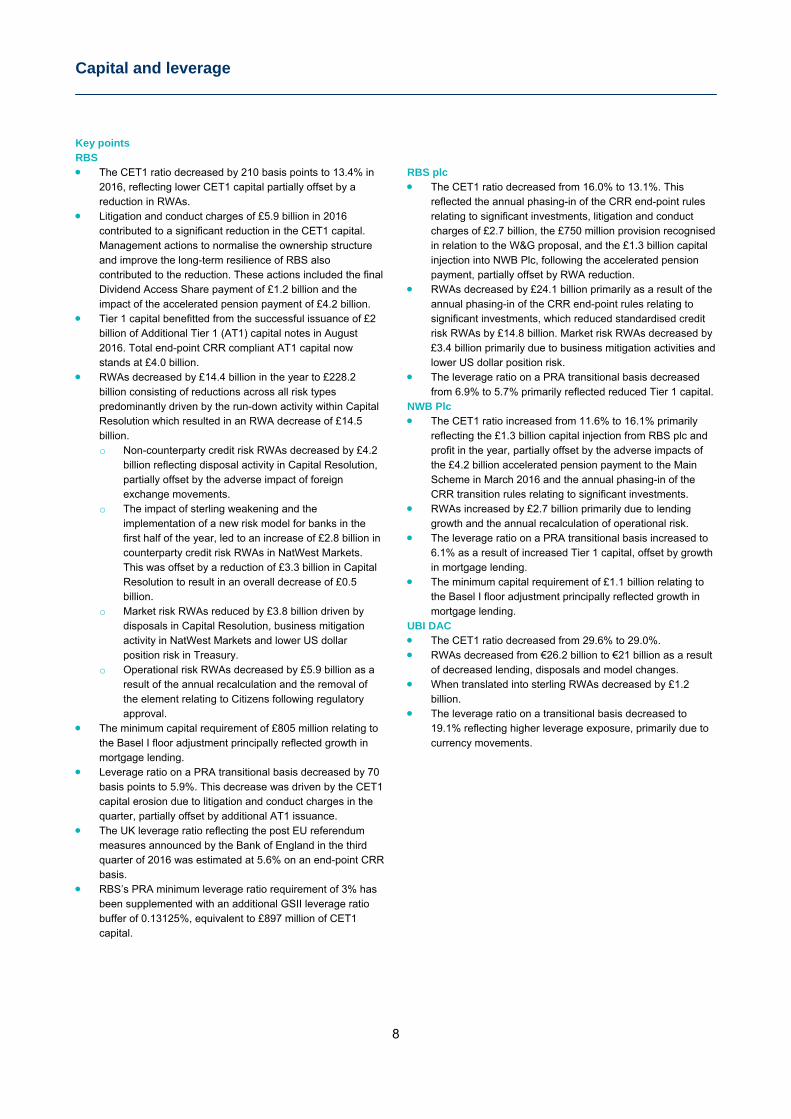
Key points RBS The CET1 ratio decreased by 210 basis points to 13.4% in
2016, reflecting lower CET1 capital partially offset by a reduction in RWAs.
Litigation and conduct charges of £5.9 billion in 2016 contributed to a significant reduction in the CET1 capital. Management actions to normalise the ownership structure and improve the long-term resilience of RBS also contributed to the reduction. These actions included the final Dividend Access Share payment of £1.2 billion and the impact of the accelerated pension payment of £4.2 billion.
Tier 1 capital benefitted from the successful issuance of £2 billion of Additional Tier 1 (AT1) capital notes in August 2016. Total end-point CRR compliant AT1 capital now stands at £4.0 billion.
RWAs decreased by £14.4 billion in the year to £228.2 billion consisting of reductions across all risk types predominantly driven by the run-down activity within Capital Resolution which resulted in an RWA decrease of £14.5 billion. o Non-counterparty credit risk RWAs decreased by £4.2
billion reflecting disposal activity in Capital Resolution, partially offset by the adverse impact of foreign exchange movements.
o The impact of sterling weakening and the implementation of a new risk model for banks in the first half of the year, led to an increase of £2.8 billion in counterparty credit risk RWAs in NatWest Markets. This was offset by a reduction of £3.3 billion in Capital Resolution to result in an overall decrease of £0.5 billion.
o Market risk RWAs reduced by £3.8 billion driven by disposals in Capital Resolution, business mitigation activity in NatWest Markets and lower US dollar position risk in Treasury.
o Operational risk RWAs decreased by £5.9 billion as a result of the annual recalculation and the removal of the element relating to Citizens following regulatory approval.
The minimum capital requirement of £805 million relating to the Basel I floor adjustment principally reflected growth in mortgage lending.
Leverage ratio on a PRA transitional basis decreased by 70 basis points to 5.9%. This decrease was driven by the CET1 capital erosion due to litigation and conduct charges in the quarter, partially offset by additional AT1 issuance.
The UK leverage ratio reflecting the post EU referendum measures announced by the Bank of England in the third quarter of 2016 was estimated at 5.6% on an end-point CRR basis.
RBS’s PRA minimum leverage ratio requirement of 3% has been supplemented with an additional GSII leverage ratio buffer of 0.13125%, equivalent to £897 million of CET1 capital.
RBS plc The CET1 ratio decreased from 16.0% to 13.1%. This
reflected the annual phasing-in of the CRR end-point rules relating to significant investments, litigation and conduct charges of £2.7 billion, the £750 million provision recognised in relation to the W&G proposal, and the £1.3 billion capital injection into NWB Plc, following the accelerated pension payment, partially offset by RWA reduction.
RWAs decreased by £24.1 billion primarily as a result of the annual phasing-in of the CRR end-point rules relating to significant investments, which reduced standardised credit risk RWAs by £14.8 billion. Market risk RWAs decreased by £3.4 billion primarily due to business mitigation activities and lower US dollar position risk.
The leverage ratio on a PRA transitional basis decreased from 6.9% to 5.7% primarily reflected reduced Tier 1 capital.
NWB Plc The CET1 ratio increased from 11.6% to 16.1% primarily
reflecting the £1.3 billion capital injection from RBS plc and profit in the year, partially offset by the adverse impacts of the £4.2 billion accelerated pension payment to the Main Scheme in March 2016 and the annual phasing-in of the CRR transition rules relating to significant investments.
RWAs increased by £2.7 billion primarily due to lending growth and the annual recalculation of operational risk.
The leverage ratio on a PRA transitional basis increased to 6.1% as a result of increased Tier 1 capital, offset by growth in mortgage lending.
The minimum capital requirement of £1.1 billion relating to the Basel I floor adjustment principally reflected growth in mortgage lending.
UBI DAC The CET1 ratio decreased from 29.6% to 29.0%. RWAs decreased from €26.2 billion to €21 billion as a result
of decreased lending, disposals and model changes. When translated into sterling RWAs decreased by £1.2
billion. The leverage ratio on a transitional basis decreased to
19.1% reflecting higher leverage exposure, primarily due to currency movements.
Capital and leverage
9
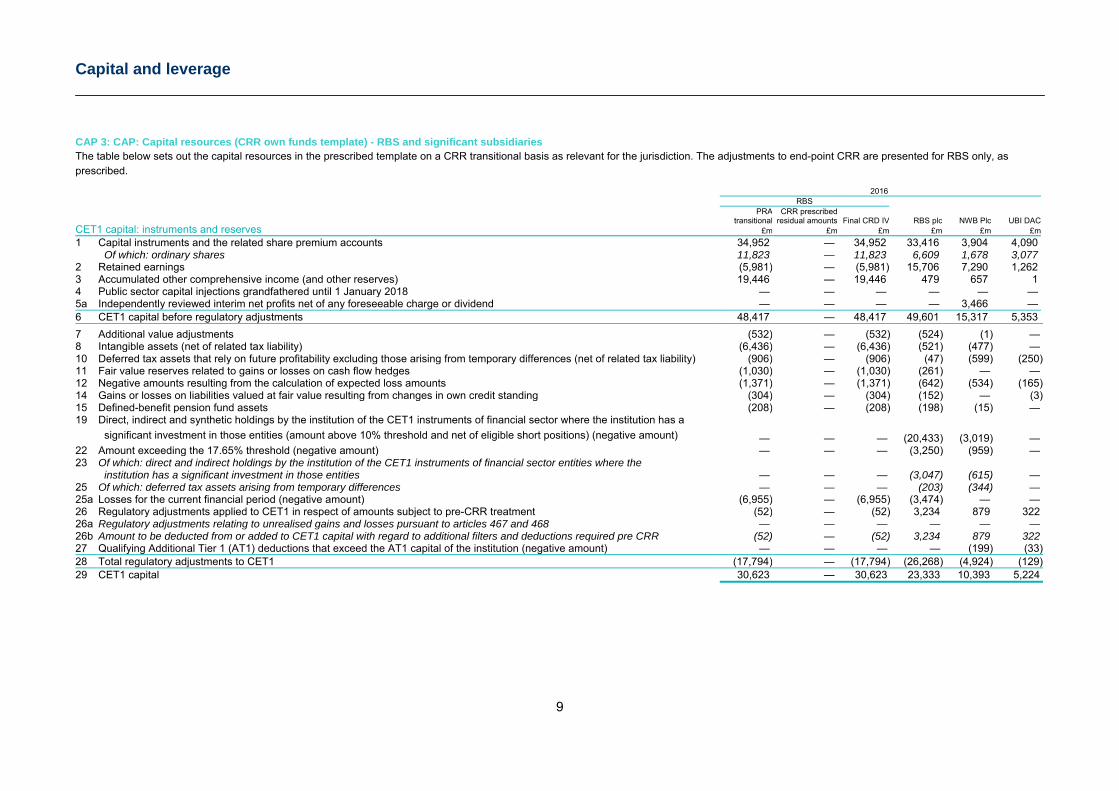
CAP 3: CAP: Capital resources (CRR own funds template) - RBS and significant subsidiaries The table below sets out the capital resources in the prescribed template on a CRR transitional basis as relevant for the jurisdiction. The adjustments to end-point CRR are presented for RBS only, as prescribed.
2016 RBS PRA CRR prescribed
CET1 capital: instruments and reserves transitional residual amounts Final CRD IV RBS plc NWB Plc UBI DAC
£m £m £m £m £m £m
1 Capital instruments and the related share premium accounts 34,952 — 34,952 33,416 3,904 4,090 Of which: ordinary shares 11,823 — 11,823 6,609 1,678 3,077 2 Retained earnings (5,981) — (5,981) 15,706 7,290 1,262 3 Accumulated other comprehensive income (and other reserves) 19,446 — 19,446 479 657 1 4 Public sector capital injections grandfathered until 1 January 2018 — — — — — — 5a Independently reviewed interim net profits net of any foreseeable charge or dividend — — — — 3,466 — 6 CET1 capital before regulatory adjustments 48,417 — 48,417 49,601 15,317 5,353
7 Additional value adjustments (532) — (532) (524) (1) — 8 Intangible assets (net of related tax liability) (6,436) — (6,436) (521) (477) — 10 Deferred tax assets that rely on future profitability excluding those arising from temporary differences (net of related tax liability) (906) — (906) (47) (599) (250)11 Fair value reserves related to gains or losses on cash flow hedges (1,030) — (1,030) (261) — — 12 Negative amounts resulting from the calculation of expected loss amounts (1,371) — (1,371) (642) (534) (165)14 Gains or losses on liabilities valued at fair value resulting from changes in own credit standing (304) — (304) (152) — (3)15 Defined-benefit pension fund assets (208) — (208) (198) (15) — 19 Direct, indirect and synthetic holdings by the institution of the CET1 instruments of financial sector where the institution has a significant investment in those entities (amount above 10% threshold and net of eligible short positions) (negative amount) — — — (20,433) (3,019) — 22 Amount exceeding the 17.65% threshold (negative amount) — — — (3,250) (959) — 23 Of which: direct and indirect holdings by the institution of the CET1 instruments of financial sector entities where the institution has a significant investment in those entities — — — (3,047) (615) — 25 Of which: deferred tax assets arising from temporary differences — — — (203) (344) — 25a Losses for the current financial period (negative amount) (6,955) — (6,955) (3,474) — — 26 Regulatory adjustments applied to CET1 in respect of amounts subject to pre-CRR treatment (52) — (52) 3,234 879 322 26a Regulatory adjustments relating to unrealised gains and losses pursuant to articles 467 and 468 — — — — — — 26b Amount to be deducted from or added to CET1 capital with regard to additional filters and deductions required pre CRR (52) — (52) 3,234 879 322 27 Qualifying Additional Tier 1 (AT1) deductions that exceed the AT1 capital of the institution (negative amount) — — — — (199) (33)28 Total regulatory adjustments to CET1 (17,794) — (17,794) (26,268) (4,924) (129)29 CET1 capital 30,623 — 30,623 23,333 10,393 5,224
Capital and leverage
10
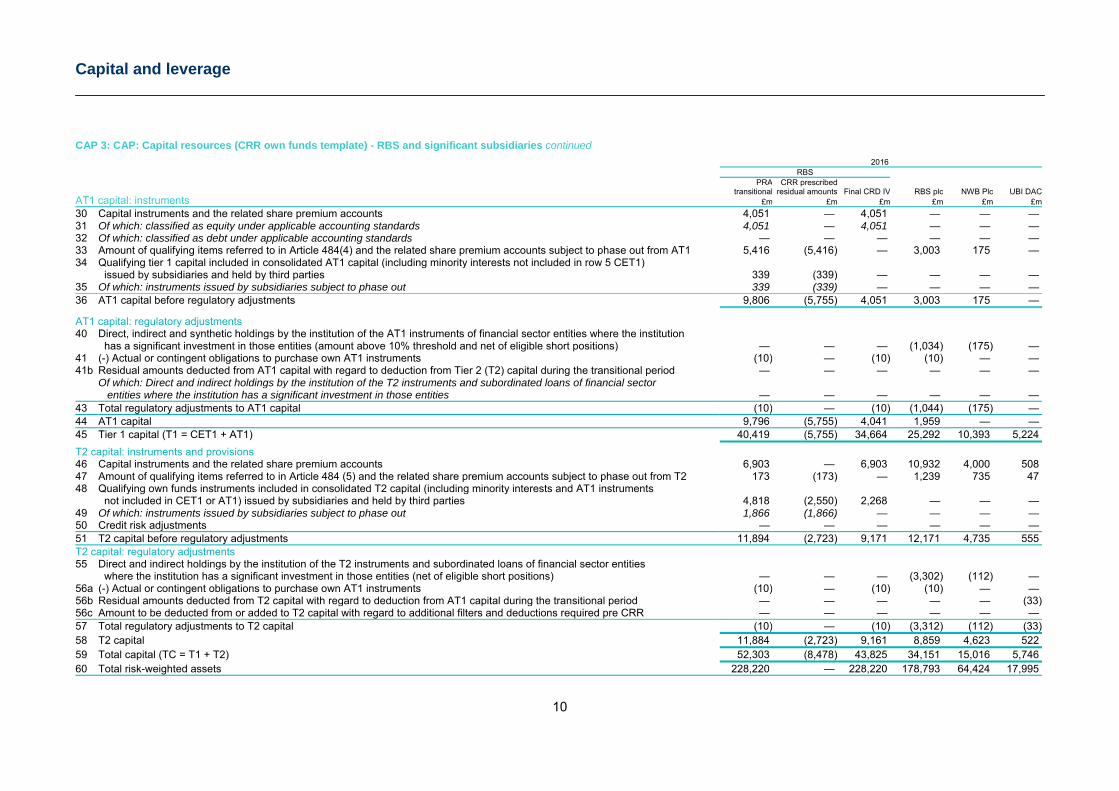
CAP 3: CAP: Capital resources (CRR own funds template) - RBS and significant subsidiaries continued 2016 RBS PRA CRR prescribed
AT1 capital: instruments transitional residual amounts Final CRD IV RBS plc NWB Plc UBI DAC
£m £m £m £m £m £m
30 Capital instruments and the related share premium accounts 4,051 — 4,051 — — — 31 Of which: classified as equity under applicable accounting standards 4,051 — 4,051 — — — 32 Of which: classified as debt under applicable accounting standards — — — — — — 33 Amount of qualifying items referred to in Article 484(4) and the related share premium accounts subject to phase out from AT1 5,416 (5,416) — 3,003 175 — 34 Qualifying tier 1 capital included in consolidated AT1 capital (including minority interests not included in row 5 CET1) issued by subsidiaries and held by third parties 339 (339) — — — — 35 Of which: instruments issued by subsidiaries subject to phase out 339 (339) — — — — 36 AT1 capital before regulatory adjustments 9,806 (5,755) 4,051 3,003 175 —
AT1 capital: regulatory adjustments
40 Direct, indirect and synthetic holdings by the institution of the AT1 instruments of financial sector entities where the institution has a significant investment in those entities (amount above 10% threshold and net of eligible short positions) — — — (1,034) (175) — 41 (-) Actual or contingent obligations to purchase own AT1 instruments (10) — (10) (10) — — 41b Residual amounts deducted from AT1 capital with regard to deduction from Tier 2 (T2) capital during the transitional period — — — — — — Of which: Direct and indirect holdings by the institution of the T2 instruments and subordinated loans of financial sector entities where the institution has a significant investment in those entities — — — — — — 43 Total regulatory adjustments to AT1 capital (10) — (10) (1,044) (175) — 44 AT1 capital 9,796 (5,755) 4,041 1,959 — — 45 Tier 1 capital (T1 = CET1 + AT1) 40,419 (5,755) 34,664 25,292 10,393 5,224
T2 capital: instruments and provisions 46 Capital instruments and the related share premium accounts 6,903 — 6,903 10,932 4,000 508 47 Amount of qualifying items referred to in Article 484 (5) and the related share premium accounts subject to phase out from T2 173 (173) — 1,239 735 47 48 Qualifying own funds instruments included in consolidated T2 capital (including minority interests and AT1 instruments not included in CET1 or AT1) issued by subsidiaries and held by third parties 4,818 (2,550) 2,268 — — — 49 Of which: instruments issued by subsidiaries subject to phase out 1,866 (1,866) — — — — 50 Credit risk adjustments — — — — — — 51 T2 capital before regulatory adjustments 11,894 (2,723) 9,171 12,171 4,735 555 T2 capital: regulatory adjustments 55 Direct and indirect holdings by the institution of the T2 instruments and subordinated loans of financial sector entities where the institution has a significant investment in those entities (net of eligible short positions) — — — (3,302) (112) — 56a (-) Actual or contingent obligations to purchase own AT1 instruments (10) — (10) (10) — — 56b Residual amounts deducted from T2 capital with regard to deduction from AT1 capital during the transitional period — — — — — (33)56c Amount to be deducted from or added to T2 capital with regard to additional filters and deductions required pre CRR — — — — — — 57 Total regulatory adjustments to T2 capital (10) — (10) (3,312) (112) (33)58 T2 capital 11,884 (2,723) 9,161 8,859 4,623 522 59 Total capital (TC = T1 + T2) 52,303 (8,478) 43,825 34,151 15,016 5,746 60 Total risk-weighted assets 228,220 — 228,220 178,793 64,424 17,995
Capital and leverage
11
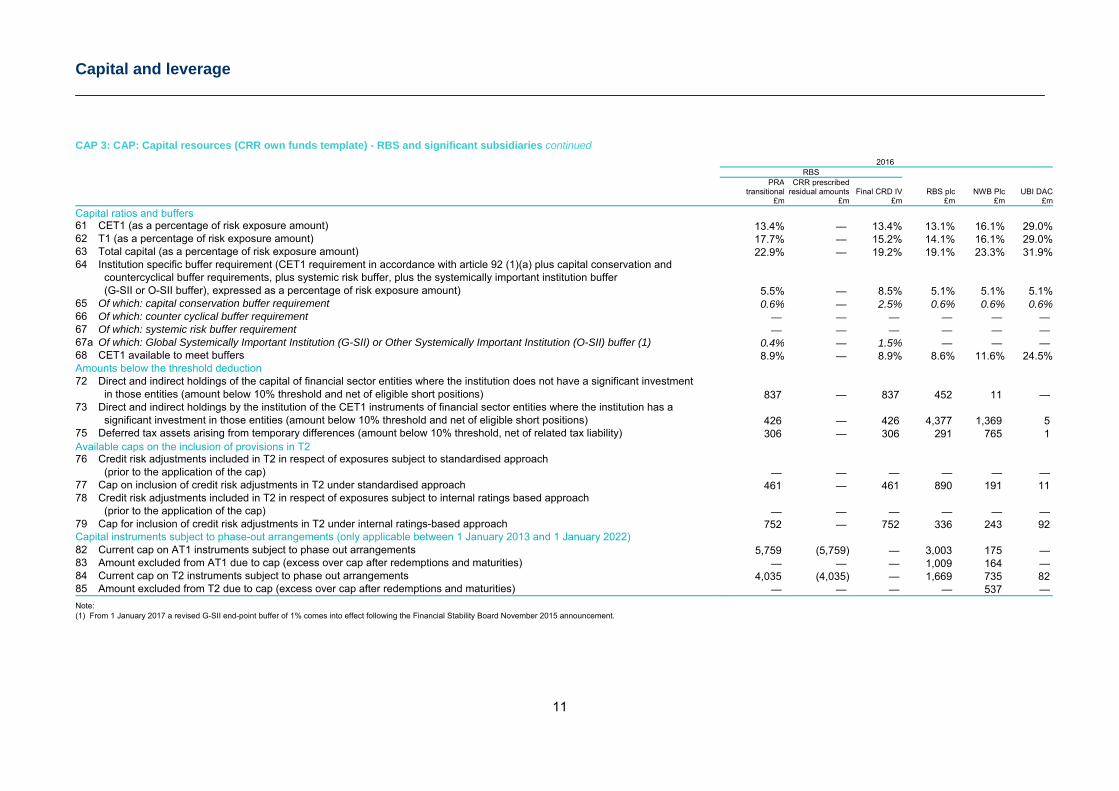
CAP 3: CAP: Capital resources (CRR own funds template) - RBS and significant subsidiaries continued 2016 RBS PRA CRR prescribed transitional residual amounts Final CRD IV RBS plc NWB Plc UBI DAC £m £m £m £m £m £m
Capital ratios and buffers
61 CET1 (as a percentage of risk exposure amount) 13.4% — 13.4% 13.1% 16.1% 29.0%62 T1 (as a percentage of risk exposure amount) 17.7% — 15.2% 14.1% 16.1% 29.0%63 Total capital (as a percentage of risk exposure amount) 22.9% — 19.2% 19.1% 23.3% 31.9%64 Institution specific buffer requirement (CET1 requirement in accordance with article 92 (1)(a) plus capital conservation and countercyclical buffer requirements, plus systemic risk buffer, plus the systemically important institution buffer (G-SII or O-SII buffer), expressed as a percentage of risk exposure amount) 5.5% — 8.5% 5.1% 5.1% 5.1%65 Of which: capital conservation buffer requirement 0.6% — 2.5% 0.6% 0.6% 0.6%66 Of which: counter cyclical buffer requirement — — — — — — 67 Of which: systemic risk buffer requirement — — — — — — 67a Of which: Global Systemically Important Institution (G-SII) or Other Systemically Important Institution (O-SII) buffer (1) 0.4% — 1.5% — — — 68 CET1 available to meet buffers 8.9% — 8.9% 8.6% 11.6% 24.5%Amounts below the threshold deduction 72 Direct and indirect holdings of the capital of financial sector entities where the institution does not have a significant investment in those entities (amount below 10% threshold and net of eligible short positions) 837 — 837 452 11 — 73 Direct and indirect holdings by the institution of the CET1 instruments of financial sector entities where the institution has a significant investment in those entities (amount below 10% threshold and net of eligible short positions) 426 — 426 4,377 1,369 5 75 Deferred tax assets arising from temporary differences (amount below 10% threshold, net of related tax liability) 306 — 306 291 765 1 Available caps on the inclusion of provisions in T2 76 Credit risk adjustments included in T2 in respect of exposures subject to standardised approach (prior to the application of the cap) — — — — — — 77 Cap on inclusion of credit risk adjustments in T2 under standardised approach 461 — 461 890 191 11 78 Credit risk adjustments included in T2 in respect of exposures subject to internal ratings based approach (prior to the application of the cap) — — — — — — 79 Cap for inclusion of credit risk adjustments in T2 under internal ratings-based approach 752 — 752 336 243 92 Capital instruments subject to phase-out arrangements (only applicable between 1 January 2013 and 1 January 2022) 82 Current cap on AT1 instruments subject to phase out arrangements 5,759 (5,759) — 3,003 175 — 83 Amount excluded from AT1 due to cap (excess over cap after redemptions and maturities) — — — 1,009 164 — 84 Current cap on T2 instruments subject to phase out arrangements 4,035 (4,035) — 1,669 735 82 85 Amount excluded from T2 due to cap (excess over cap after redemptions and maturities) — — — — 537 —
Note: (1) From 1 January 2017 a revised G-SII end-point buffer of 1% comes into effect following the Financial Stability Board November 2015 announcement.
Capital and leverage
12
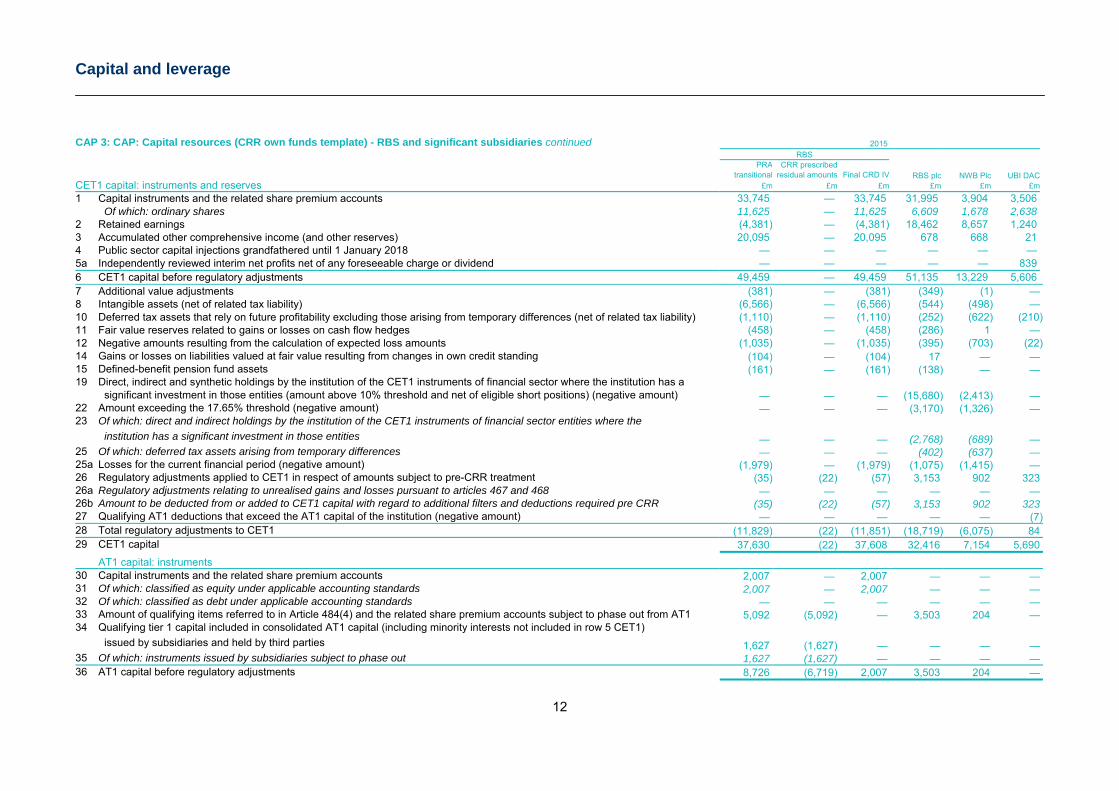
CAP 3: CAP: Capital resources (CRR own funds template) - RBS and significant subsidiaries continued 2015 RBS PRA CRR prescribed
CET1 capital: instruments and reserves
transitional residual amounts Final CRD IV RBS plc NWB Plc UBI DAC£m £m £m £m £m £m
1 Capital instruments and the related share premium accounts 33,745 — 33,745 31,995 3,904 3,506 Of which: ordinary shares 11,625 — 11,625 6,609 1,678 2,638 2 Retained earnings (4,381) — (4,381) 18,462 8,657 1,240 3 Accumulated other comprehensive income (and other reserves) 20,095 — 20,095 678 668 21 4 Public sector capital injections grandfathered until 1 January 2018 — — — — — — 5a Independently reviewed interim net profits net of any foreseeable charge or dividend — — — — — 839 6 CET1 capital before regulatory adjustments 49,459 — 49,459 51,135 13,229 5,606 7 Additional value adjustments (381) — (381) (349) (1) — 8 Intangible assets (net of related tax liability) (6,566) — (6,566) (544) (498) — 10 Deferred tax assets that rely on future profitability excluding those arising from temporary differences (net of related tax liability) (1,110) — (1,110) (252) (622) (210)11 Fair value reserves related to gains or losses on cash flow hedges (458) — (458) (286) 1 — 12 Negative amounts resulting from the calculation of expected loss amounts (1,035) — (1,035) (395) (703) (22)14 Gains or losses on liabilities valued at fair value resulting from changes in own credit standing (104) — (104) 17 — — 15 Defined-benefit pension fund assets (161) — (161) (138) — — 19 Direct, indirect and synthetic holdings by the institution of the CET1 instruments of financial sector where the institution has a significant investment in those entities (amount above 10% threshold and net of eligible short positions) (negative amount) — — — (15,680) (2,413) — 22 Amount exceeding the 17.65% threshold (negative amount) — — — (3,170) (1,326) — 23 Of which: direct and indirect holdings by the institution of the CET1 instruments of financial sector entities where the institution has a significant investment in those entities — — — (2,768) (689) — 25 Of which: deferred tax assets arising from temporary differences — — — (402) (637) — 25a Losses for the current financial period (negative amount) (1,979) — (1,979) (1,075) (1,415) — 26 Regulatory adjustments applied to CET1 in respect of amounts subject to pre-CRR treatment (35) (22) (57) 3,153 902 323 26a Regulatory adjustments relating to unrealised gains and losses pursuant to articles 467 and 468 — — — — — — 26b Amount to be deducted from or added to CET1 capital with regard to additional filters and deductions required pre CRR (35) (22) (57) 3,153 902 323 27 Qualifying AT1 deductions that exceed the AT1 capital of the institution (negative amount) — — — — — (7)28 Total regulatory adjustments to CET1 (11,829) (22) (11,851) (18,719) (6,075) 84 29 CET1 capital 37,630 (22) 37,608 32,416 7,154 5,690
AT1 capital: instruments 30 Capital instruments and the related share premium accounts 2,007 — 2,007 — — — 31 Of which: classified as equity under applicable accounting standards 2,007 — 2,007 — — — 32 Of which: classified as debt under applicable accounting standards — — — — — — 33 Amount of qualifying items referred to in Article 484(4) and the related share premium accounts subject to phase out from AT1 5,092 (5,092) — 3,503 204 — 34 Qualifying tier 1 capital included in consolidated AT1 capital (including minority interests not included in row 5 CET1) issued by subsidiaries and held by third parties 1,627 (1,627) — — — — 35 Of which: instruments issued by subsidiaries subject to phase out 1,627 (1,627) — — — — 36 AT1 capital before regulatory adjustments 8,726 (6,719) 2,007 3,503 204 —
Capital and leverage
13
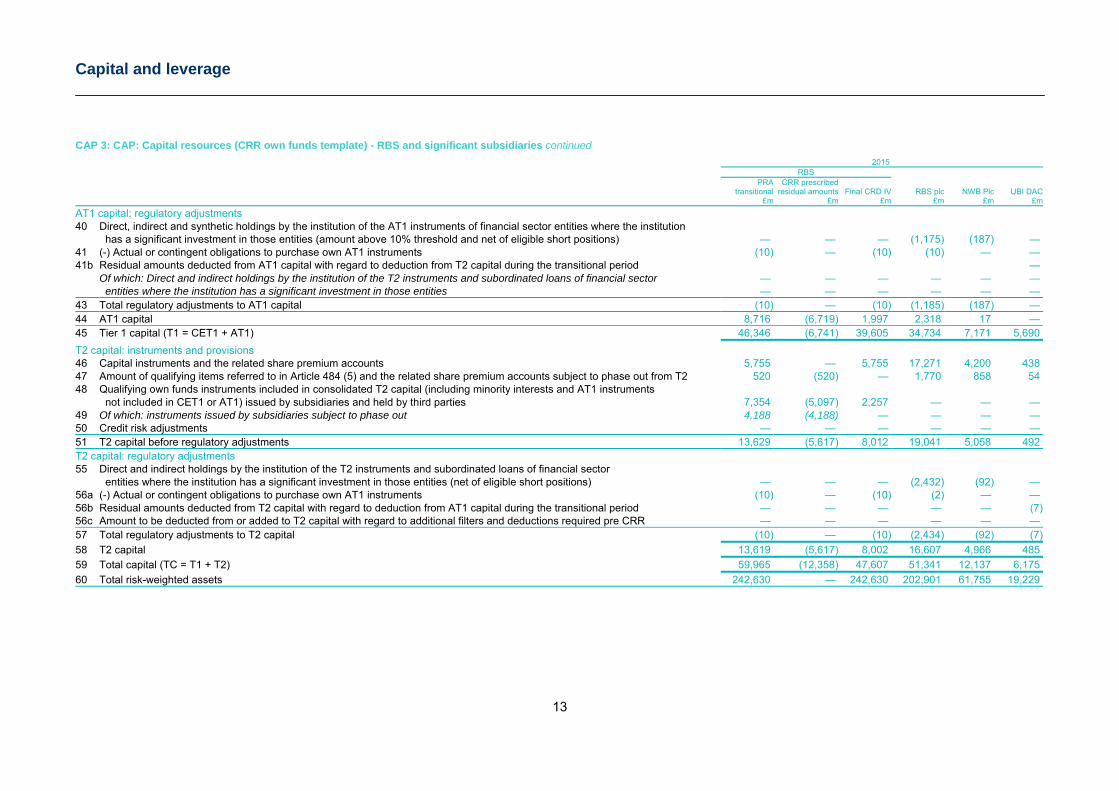
CAP 3: CAP: Capital resources (CRR own funds template) - RBS and significant subsidiaries continued 2015 RBS PRA CRR prescribed transitional residual amounts Final CRD IV RBS plc NWB Plc UBI DAC £m £m £m £m £m £m
AT1 capital: regulatory adjustments
40 Direct, indirect and synthetic holdings by the institution of the AT1 instruments of financial sector entities where the institution has a significant investment in those entities (amount above 10% threshold and net of eligible short positions) — — — (1,175) (187) — 41 (-) Actual or contingent obligations to purchase own AT1 instruments (10) — (10) (10) — — 41b Residual amounts deducted from AT1 capital with regard to deduction from T2 capital during the transitional period — Of which: Direct and indirect holdings by the institution of the T2 instruments and subordinated loans of financial sector — — — — — — entities where the institution has a significant investment in those entities — — — — — — 43 Total regulatory adjustments to AT1 capital (10) — (10) (1,185) (187) — 44 AT1 capital 8,716 (6,719) 1,997 2,318 17 — 45 Tier 1 capital (T1 = CET1 + AT1) 46,346 (6,741) 39,605 34,734 7,171 5,690
T2 capital: instruments and provisions 46 Capital instruments and the related share premium accounts 5,755 — 5,755 17,271 4,200 438 47 Amount of qualifying items referred to in Article 484 (5) and the related share premium accounts subject to phase out from T2 520 (520) — 1,770 858 54 48 Qualifying own funds instruments included in consolidated T2 capital (including minority interests and AT1 instruments not included in CET1 or AT1) issued by subsidiaries and held by third parties 7,354 (5,097) 2,257 — — — 49 Of which: instruments issued by subsidiaries subject to phase out 4,188 (4,188) — — — — 50 Credit risk adjustments — — — — — — 51 T2 capital before regulatory adjustments 13,629 (5,617) 8,012 19,041 5,058 492 T2 capital: regulatory adjustments 55 Direct and indirect holdings by the institution of the T2 instruments and subordinated loans of financial sector entities where the institution has a significant investment in those entities (net of eligible short positions) — — — (2,432) (92) — 56a (-) Actual or contingent obligations to purchase own AT1 instruments (10) — (10) (2) — — 56b Residual amounts deducted from T2 capital with regard to deduction from AT1 capital during the transitional period — — — — — (7)56c Amount to be deducted from or added to T2 capital with regard to additional filters and deductions required pre CRR — — — — — — 57 Total regulatory adjustments to T2 capital (10) — (10) (2,434) (92) (7)
58 T2 capital 13,619 (5,617) 8,002 16,607 4,966 485
59 Total capital (TC = T1 + T2) 59,965 (12,358) 47,607 51,341 12,137 6,175
60 Total risk-weighted assets 242,630 — 242,630 202,901 61,755 19,229
Capital and leverage
14
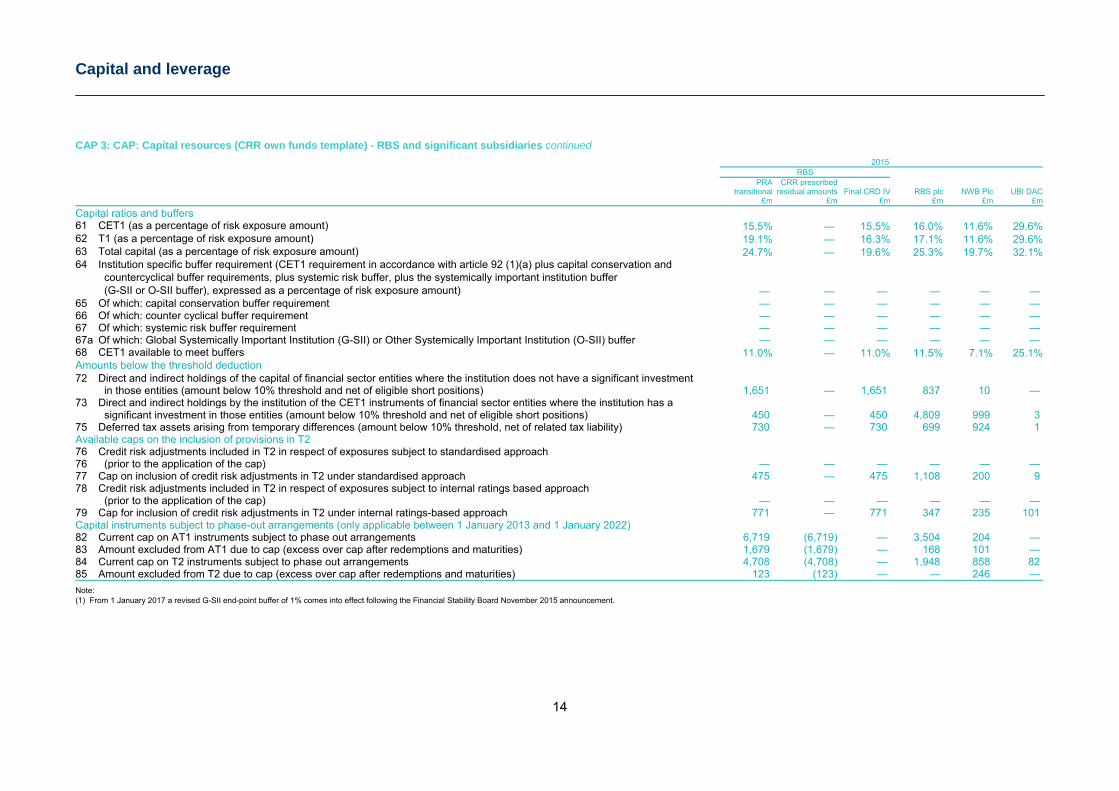
CAP 3: CAP: Capital resources (CRR own funds template) - RBS and significant subsidiaries continued 2015 RBS PRA CRR prescribed transitional residual amounts Final CRD IV RBS plc NWB Plc UBI DAC £m £m £m £m £m £m
Capital ratios and buffers
61 CET1 (as a percentage of risk exposure amount) 15.5% — 15.5% 16.0% 11.6% 29.6%62 T1 (as a percentage of risk exposure amount) 19.1% — 16.3% 17.1% 11.6% 29.6%63 Total capital (as a percentage of risk exposure amount) 24.7% — 19.6% 25.3% 19.7% 32.1%64 Institution specific buffer requirement (CET1 requirement in accordance with article 92 (1)(a) plus capital conservation and countercyclical buffer requirements, plus systemic risk buffer, plus the systemically important institution buffer (G-SII or O-SII buffer), expressed as a percentage of risk exposure amount) — — — — — — 65 Of which: capital conservation buffer requirement — — — — — — 66 Of which: counter cyclical buffer requirement — — — — — — 67 Of which: systemic risk buffer requirement — — — — — — 67a Of which: Global Systemically Important Institution (G-SII) or Other Systemically Important Institution (O-SII) buffer — — — — — — 68 CET1 available to meet buffers 11.0% — 11.0% 11.5% 7.1% 25.1%Amounts below the threshold deduction 72 Direct and indirect holdings of the capital of financial sector entities where the institution does not have a significant investment in those entities (amount below 10% threshold and net of eligible short positions) 1,651 — 1,651 837 10 — 73 Direct and indirect holdings by the institution of the CET1 instruments of financial sector entities where the institution has a significant investment in those entities (amount below 10% threshold and net of eligible short positions) 450 — 450 4,809 999 3 75 Deferred tax assets arising from temporary differences (amount below 10% threshold, net of related tax liability) 730 — 730 699 924 1 Available caps on the inclusion of provisions in T2 76 Credit risk adjustments included in T2 in respect of exposures subject to standardised approach 76 (prior to the application of the cap) — — — — — — 77 Cap on inclusion of credit risk adjustments in T2 under standardised approach 475 — 475 1,108 200 9 78 Credit risk adjustments included in T2 in respect of exposures subject to internal ratings based approach (prior to the application of the cap) — — — — — — 79 Cap for inclusion of credit risk adjustments in T2 under internal ratings-based approach 771 — 771 347 235 101 Capital instruments subject to phase-out arrangements (only applicable between 1 January 2013 and 1 January 2022) 82 Current cap on AT1 instruments subject to phase out arrangements 6,719 (6,719) — 3,504 204 — 83 Amount excluded from AT1 due to cap (excess over cap after redemptions and maturities) 1,679 (1,679) — 168 101 — 84 Current cap on T2 instruments subject to phase out arrangements 4,708 (4,708) — 1,948 858 82 85 Amount excluded from T2 due to cap (excess over cap after redemptions and maturities) 123 (123) — — 246 —
Note: (1) From 1 January 2017 a revised G-SII end-point buffer of 1% comes into effect following the Financial Stability Board November 2015 announcement.
Capital and leverage
15
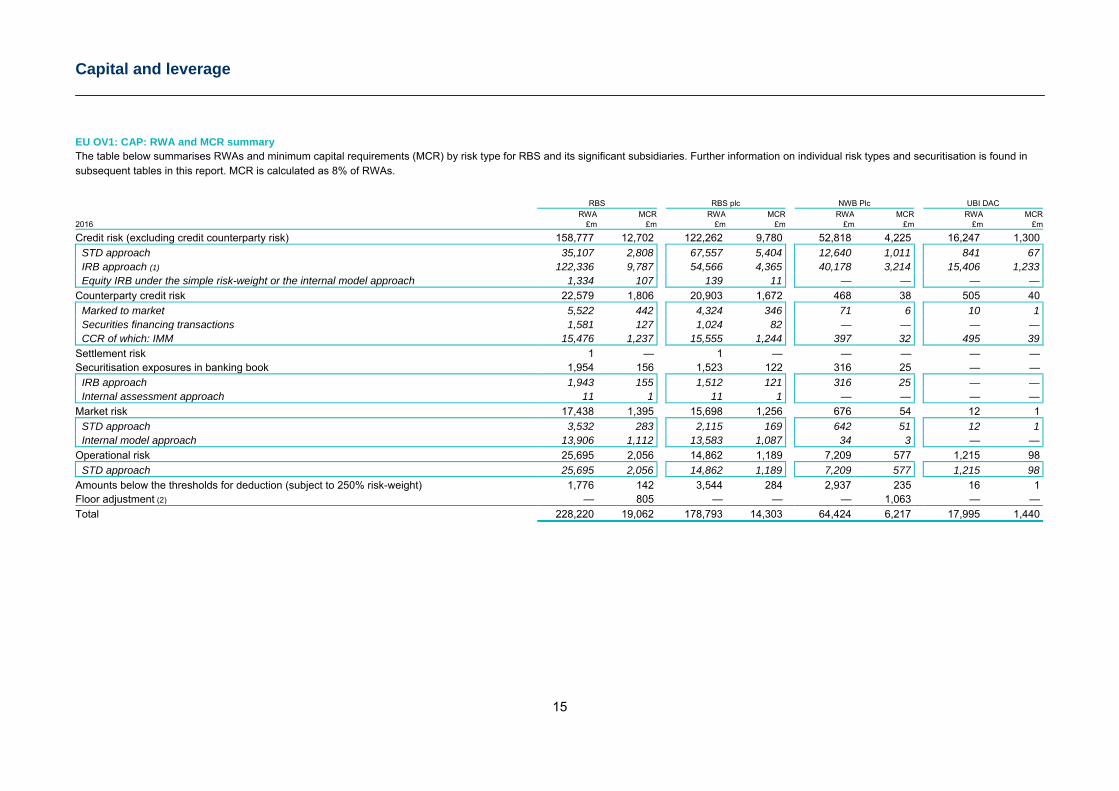
EU OV1: CAP: RWA and MCR summary The table below summarises RWAs and minimum capital requirements (MCR) by risk type for RBS and its significant subsidiaries. Further information on individual risk types and securitisation is found in subsequent tables in this report. MCR is calculated as 8% of RWAs.
RBS RBS plc NWB Plc UBI DAC RWA MCR RWA MCR RWA MCR RWA MCR2016 £m £m £m £m £m £m £m £m
Credit risk (excluding credit counterparty risk) 158,777 12,702 122,262 9,780 52,818 4,225 16,247 1,300
STD approach 35,107 2,808 67,557 5,404 12,640 1,011 841 67 IRB approach (1) 122,336 9,787 54,566 4,365 40,178 3,214 15,406 1,233 Equity IRB under the simple risk-weight or the internal model approach 1,334 107 139 11 — — — — Counterparty credit risk 22,579 1,806 20,903 1,672 468 38 505 40
Marked to market 5,522 442 4,324 346 71 6 10 1 Securities financing transactions 1,581 127 1,024 82 — — — — CCR of which: IMM 15,476 1,237 15,555 1,244 397 32 495 39 Settlement risk 1 — 1 — — — — — Securitisation exposures in banking book 1,954 156 1,523 122 316 25 — —
IRB approach 1,943 155 1,512 121 316 25 — — Internal assessment approach 11 1 11 1 — — — — Market risk 17,438 1,395 15,698 1,256 676 54 12 1
STD approach 3,532 283 2,115 169 642 51 12 1 Internal model approach 13,906 1,112 13,583 1,087 34 3 — — Operational risk 25,695 2,056 14,862 1,189 7,209 577 1,215 98
STD approach 25,695 2,056 14,862 1,189 7,209 577 1,215 98 Amounts below the thresholds for deduction (subject to 250% risk-weight) 1,776 142 3,544 284 2,937 235 16 1 Floor adjustment (2) — 805 — — — 1,063 — —
Total 228,220 19,062 178,793 14,303 64,424 6,217 17,995 1,440
Capital and leverage
16
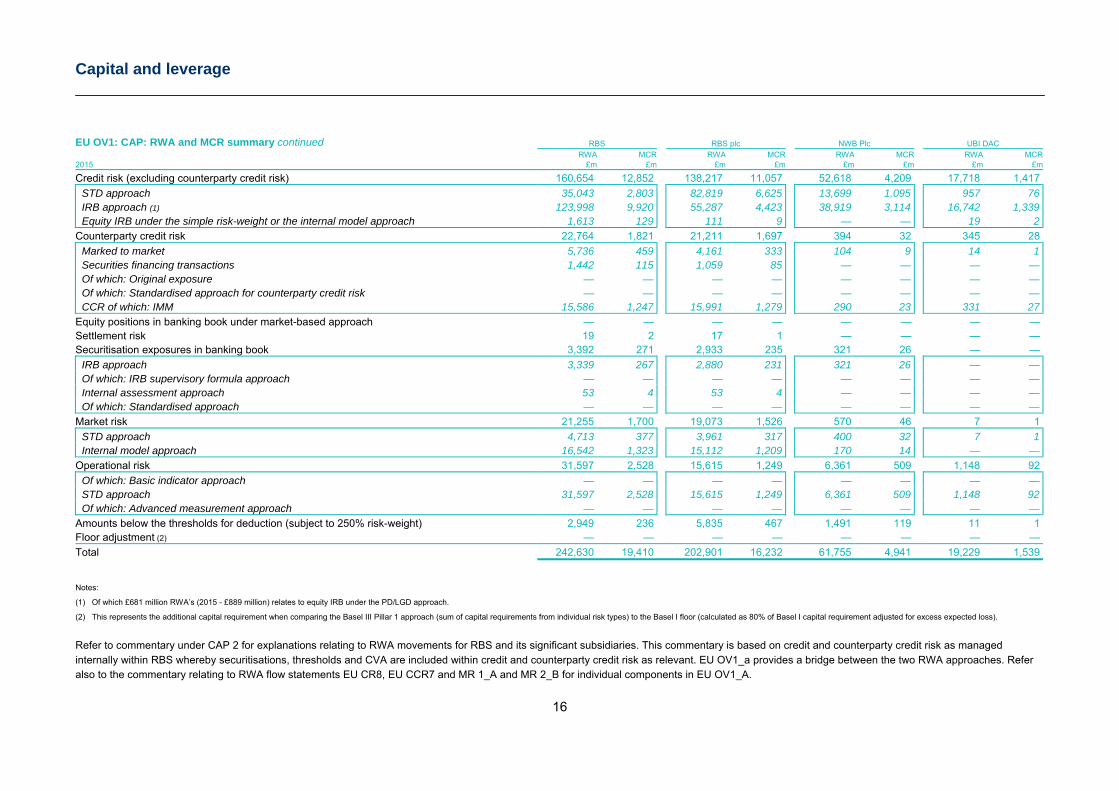
EU OV1: CAP: RWA and MCR summary continued RBS RBS plc NWB Plc UBI DAC RWA MCR RWA MCR RWA MCR RWA MCR2015 £m £m £m £m £m £m £m £m
Credit risk (excluding counterparty credit risk) 160,654 12,852 138,217 11,057 52,618 4,209 17,718 1,417
STD approach 35,043 2,803 82,819 6,625 13,699 1,095 957 76 IRB approach (1) 123,998 9,920 55,287 4,423 38,919 3,114 16,742 1,339 Equity IRB under the simple risk-weight or the internal model approach 1,613 129 111 9 — — 19 2 Counterparty credit risk 22,764 1,821 21,211 1,697 394 32 345 28
Marked to market 5,736 459 4,161 333 104 9 14 1 Securities financing transactions 1,442 115 1,059 85 — — — — Of which: Original exposure — — — — — — — — Of which: Standardised approach for counterparty credit risk — — — — — — — — CCR of which: IMM 15,586 1,247 15,991 1,279 290 23 331 27 Equity positions in banking book under market-based approach — — — — — — — — Settlement risk 19 2 17 1 — — — — Securitisation exposures in banking book 3,392 271 2,933 235 321 26 — —
IRB approach 3,339 267 2,880 231 321 26 — — Of which: IRB supervisory formula approach — — — — — — — — Internal assessment approach 53 4 53 4 — — — — Of which: Standardised approach — — — — — — — — Market risk 21,255 1,700 19,073 1,526 570 46 7 1
STD approach 4,713 377 3,961 317 400 32 7 1 Internal model approach 16,542 1,323 15,112 1,209 170 14 — — Operational risk 31,597 2,528 15,615 1,249 6,361 509 1,148 92
Of which: Basic indicator approach — — — — — — — — STD approach 31,597 2,528 15,615 1,249 6,361 509 1,148 92 Of which: Advanced measurement approach — — — — — — — — Amounts below the thresholds for deduction (subject to 250% risk-weight) 2,949 236 5,835 467 1,491 119 11 1 Floor adjustment (2) — — — — — — — —
Total 242,630 19,410 202,901 16,232 61,755 4,941 19,229 1,539
Notes:
(1) Of which £681 million RWA’s (2015 - £889 million) relates to equity IRB under the PD/LGD approach.
(2) This represents the additional capital requirement when comparing the Basel III Pillar 1 approach (sum of capital requirements from individual risk types) to the Basel I floor (calculated as 80% of Basel I capital requirement adjusted for excess expected loss).
Refer to commentary under CAP 2 for explanations relating to RWA movements for RBS and its significant subsidiaries. This commentary is based on credit and counterparty credit risk as managed internally within RBS whereby securitisations, thresholds and CVA are included within credit and counterparty credit risk as relevant. EU OV1_a provides a bridge between the two RWA approaches. Refer also to the commentary relating to RWA flow statements EU CR8, EU CCR7 and MR 1_A and MR 2_B for individual components in EU OV1_A.
Capital and leverage
17
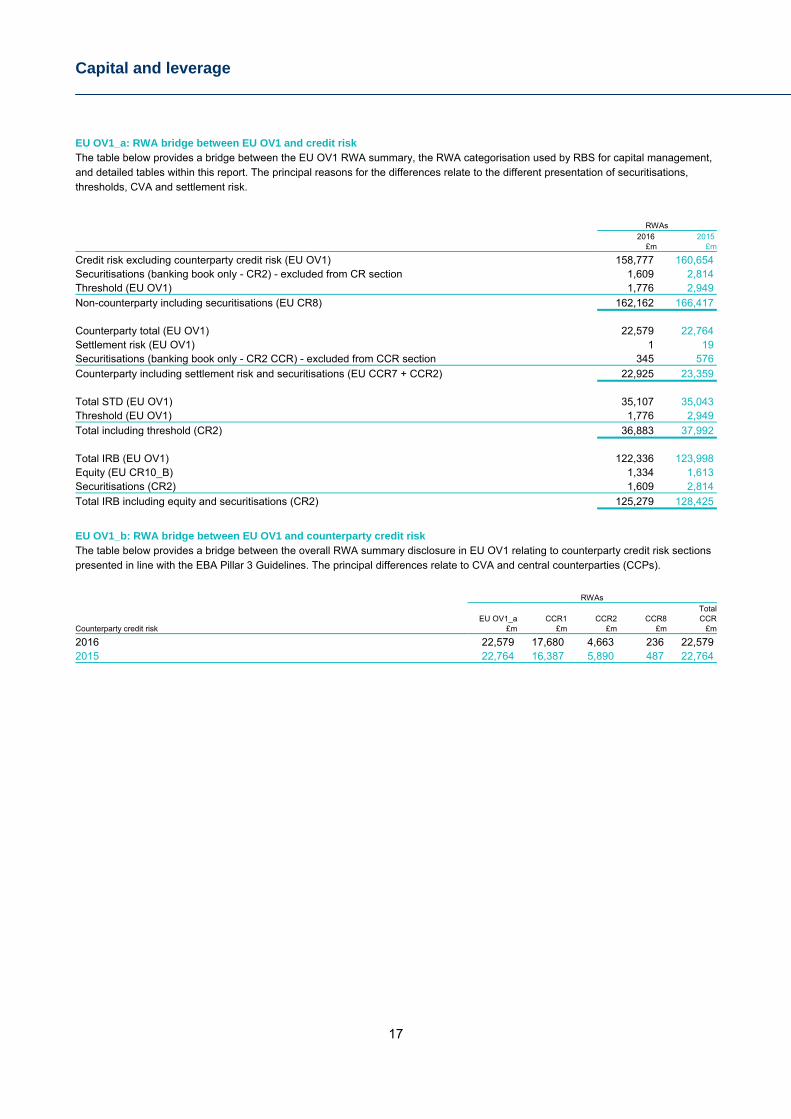
EU OV1_a: RWA bridge between EU OV1 and credit risk The table below provides a bridge between the EU OV1 RWA summary, the RWA categorisation used by RBS for capital management, and detailed tables within this report. The principal reasons for the differences relate to the different presentation of securitisations, thresholds, CVA and settlement risk.
RWAs 2016 2015 £m £m
Credit risk excluding counterparty credit risk (EU OV1) 158,777 160,654 Securitisations (banking book only - CR2) - excluded from CR section 1,609 2,814 Threshold (EU OV1) 1,776 2,949
Non-counterparty including securitisations (EU CR8) 162,162 166,417 Counterparty total (EU OV1) 22,579 22,764 Settlement risk (EU OV1) 1 19 Securitisations (banking book only - CR2 CCR) - excluded from CCR section 345 576
Counterparty including settlement risk and securitisations (EU CCR7 + CCR2) 22,925 23,359 Total STD (EU OV1) 35,107 35,043 Threshold (EU OV1) 1,776 2,949
Total including threshold (CR2) 36,883 37,992 Total IRB (EU OV1) 122,336 123,998 Equity (EU CR10_B) 1,334 1,613 Securitisations (CR2) 1,609 2,814
Total IRB including equity and securitisations (CR2) 125,279 128,425
EU OV1_b: RWA bridge between EU OV1 and counterparty credit risk The table below provides a bridge between the overall RWA summary disclosure in EU OV1 relating to counterparty credit risk sections presented in line with the EBA Pillar 3 Guidelines. The principal differences relate to CVA and central counterparties (CCPs).
RWAs Total EU OV1_a CCR1 CCR2 CCR8 CCRCounterparty credit risk £m £m £m £m £m
2016 22,579 17,680 4,663 236 22,579 2015 22,764 16,387 5,890 487 22,764
Capital and leverage
18
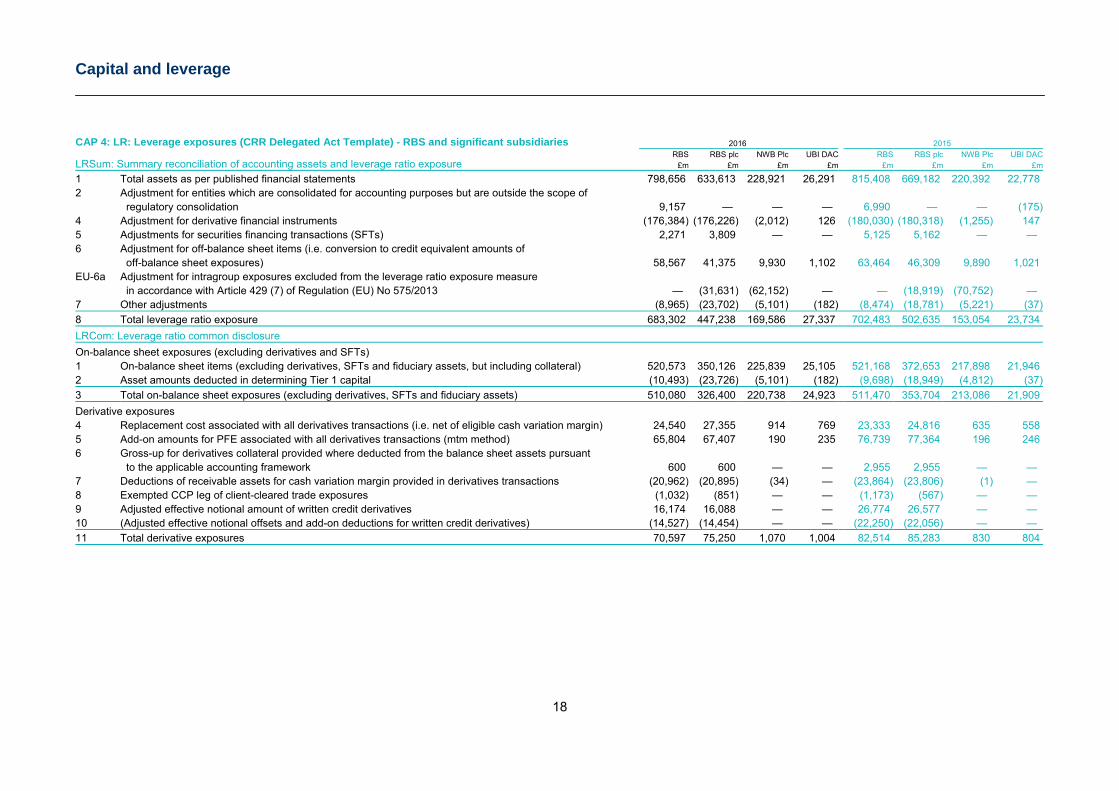
CAP 4: LR: Leverage exposures (CRR Delegated Act Template) - RBS and significant subsidiaries 2016 2015
LRSum: Summary reconciliation of accounting assets and leverage ratio exposure RBS RBS plc NWB Plc UBI DAC RBS RBS plc NWB Plc UBI DAC
£m £m £m £m £m £m £m £m
1 Total assets as per published financial statements 798,656 633,613 228,921 26,291 815,408 669,182 220,392 22,778 2 Adjustment for entities which are consolidated for accounting purposes but are outside the scope of regulatory consolidation 9,157 — — — 6,990 — — (175)4 Adjustment for derivative financial instruments (176,384) (176,226) (2,012) 126 (180,030) (180,318) (1,255) 147 5 Adjustments for securities financing transactions (SFTs) 2,271 3,809 — — 5,125 5,162 — — 6 Adjustment for off-balance sheet items (i.e. conversion to credit equivalent amounts of off-balance sheet exposures) 58,567 41,375 9,930 1,102 63,464 46,309 9,890 1,021 EU-6a Adjustment for intragroup exposures excluded from the leverage ratio exposure measure in accordance with Article 429 (7) of Regulation (EU) No 575/2013 — (31,631) (62,152) — — (18,919) (70,752) — 7 Other adjustments (8,965) (23,702) (5,101) (182) (8,474) (18,781) (5,221) (37)
8 Total leverage ratio exposure 683,302 447,238 169,586 27,337 702,483 502,635 153,054 23,734
LRCom: Leverage ratio common disclosure On-balance sheet exposures (excluding derivatives and SFTs) 1 On-balance sheet items (excluding derivatives, SFTs and fiduciary assets, but including collateral) 520,573 350,126 225,839 25,105 521,168 372,653 217,898 21,946 2 Asset amounts deducted in determining Tier 1 capital (10,493) (23,726) (5,101) (182) (9,698) (18,949) (4,812) (37)
3 Total on-balance sheet exposures (excluding derivatives, SFTs and fiduciary assets) 510,080 326,400 220,738 24,923 511,470 353,704 213,086 21,909
Derivative exposures 4 Replacement cost associated with all derivatives transactions (i.e. net of eligible cash variation margin) 24,540 27,355 914 769 23,333 24,816 635 558 5 Add-on amounts for PFE associated with all derivatives transactions (mtm method) 65,804 67,407 190 235 76,739 77,364 196 246 6 Gross-up for derivatives collateral provided where deducted from the balance sheet assets pursuant to the applicable accounting framework 600 600 — — 2,955 2,955 — — 7 Deductions of receivable assets for cash variation margin provided in derivatives transactions (20,962) (20,895) (34) — (23,864) (23,806) (1) — 8 Exempted CCP leg of client-cleared trade exposures (1,032) (851) — — (1,173) (567) — — 9 Adjusted effective notional amount of written credit derivatives 16,174 16,088 — — 26,774 26,577 — — 10 (Adjusted effective notional offsets and add-on deductions for written credit derivatives) (14,527) (14,454) — — (22,250) (22,056) — —
11 Total derivative exposures 70,597 75,250 1,070 1,004 82,514 85,283 830 804
Capital and leverage
19
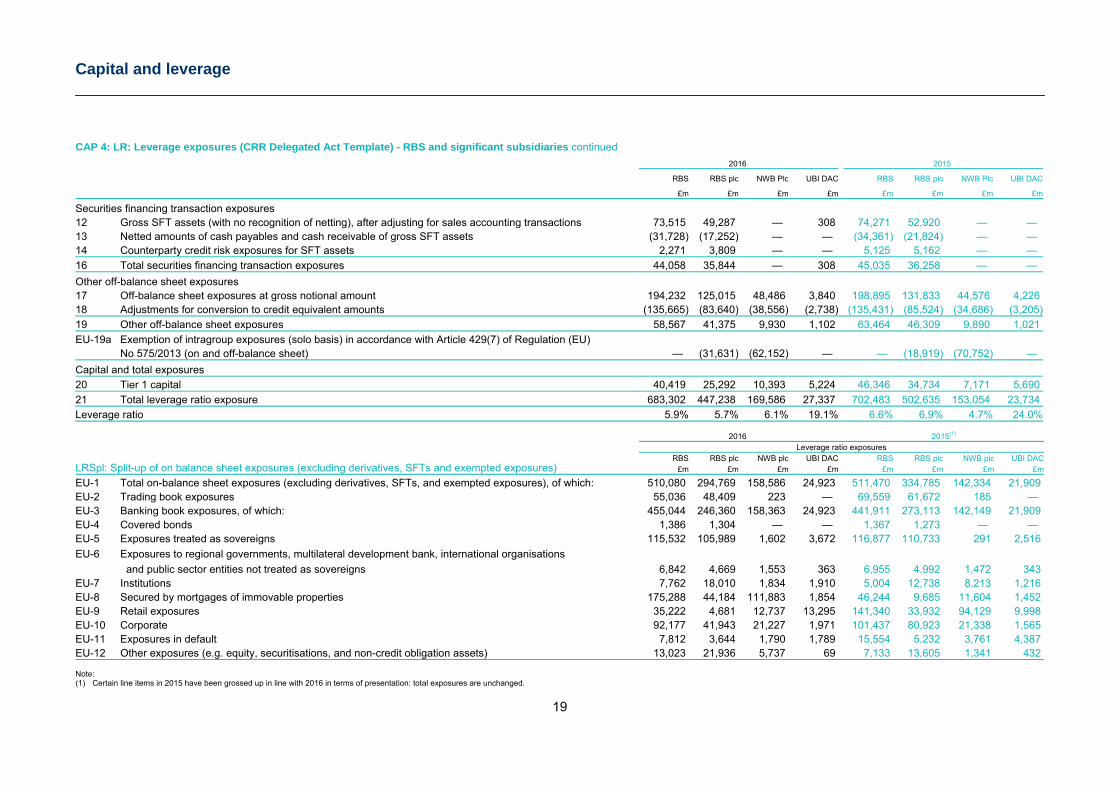
CAP 4: LR: Leverage exposures (CRR Delegated Act Template) - RBS and significant subsidiaries continued 2016 2015
RBS RBS plc NWB Plc UBI DAC RBS RBS plc NWB Plc UBI DAC
£m £m £m £m £m £m £m £m
Securities financing transaction exposures 12 Gross SFT assets (with no recognition of netting), after adjusting for sales accounting transactions 73,515 49,287 — 308 74,271 52,920 — — 13 Netted amounts of cash payables and cash receivable of gross SFT assets (31,728) (17,252) — — (34,361) (21,824) — — 14 Counterparty credit risk exposures for SFT assets 2,271 3,809 — — 5,125 5,162 — —
16 Total securities financing transaction exposures 44,058 35,844 — 308 45,035 36,258 — —
Other off-balance sheet exposures 17 Off-balance sheet exposures at gross notional amount 194,232 125,015 48,486 3,840 198,895 131,833 44,576 4,226 18 Adjustments for conversion to credit equivalent amounts (135,665) (83,640) (38,556) (2,738) (135,431) (85,524) (34,686) (3,205)
19 Other off-balance sheet exposures 58,567 41,375 9,930 1,102 63,464 46,309 9,890 1,021
EU-19a Exemption of intragroup exposures (solo basis) in accordance with Article 429(7) of Regulation (EU) No 575/2013 (on and off-balance sheet) — (31,631) (62,152) — — (18,919) (70,752) —
Capital and total exposures 20 Tier 1 capital 40,419 25,292 10,393 5,224 46,346 34,734 7,171 5,690
21 Total leverage ratio exposure 683,302 447,238 169,586 27,337 702,483 502,635 153,054 23,734
Leverage ratio 5.9% 5.7% 6.1% 19.1% 6.6% 6.9% 4.7% 24.0%
2016 2015(1) Leverage ratio exposures
LRSpl: Split-up of on balance sheet exposures (excluding derivatives, SFTs and exempted exposures) RBS RBS plc NWB plc UBI DAC RBS RBS plc NWB plc UBI DAC
£m £m £m £m £m £m £m £m
EU-1 Total on-balance sheet exposures (excluding derivatives, SFTs, and exempted exposures), of which: 510,080 294,769 158,586 24,923 511,470 334,785 142,334 21,909 EU-2 Trading book exposures 55,036 48,409 223 — 69,559 61,672 185 — EU-3 Banking book exposures, of which: 455,044 246,360 158,363 24,923 441,911 273,113 142,149 21,909 EU-4 Covered bonds 1,386 1,304 — — 1,367 1,273 — — EU-5 Exposures treated as sovereigns 115,532 105,989 1,602 3,672 116,877 110,733 291 2,516
EU-6 Exposures to regional governments, multilateral development bank, international organisations and public sector entities not treated as sovereigns 6,842 4,669 1,553 363 6,955 4,992 1,472 343 EU-7 Institutions 7,762 18,010 1,834 1,910 5,004 12,738 8,213 1,216 EU-8 Secured by mortgages of immovable properties 175,288 44,184 111,883 1,854 46,244 9,685 11,604 1,452 EU-9 Retail exposures 35,222 4,681 12,737 13,295 141,340 33,932 94,129 9,998 EU-10 Corporate 92,177 41,943 21,227 1,971 101,437 80,923 21,338 1,565 EU-11 Exposures in default 7,812 3,644 1,790 1,789 15,554 5,232 3,761 4,387 EU-12 Other exposures (e.g. equity, securitisations, and non-credit obligation assets) 13,023 21,936 5,737 69 7,133 13,605 1,341 432 Note: (1) Certain line items in 2015 have been grossed up in line with 2016 in terms of presentation: total exposures are unchanged.
Capital and leverage
20
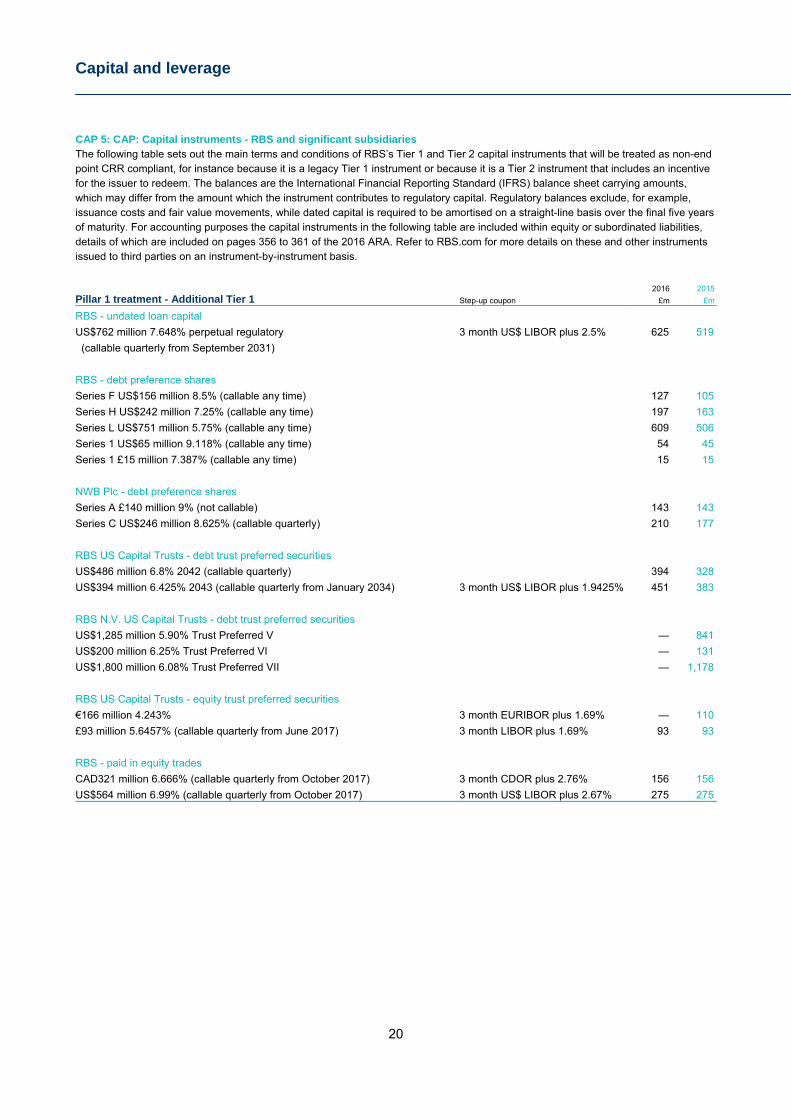
CAP 5: CAP: Capital instruments - RBS and significant subsidiaries The following table sets out the main terms and conditions of RBS’s Tier 1 and Tier 2 capital instruments that will be treated as non-end point CRR compliant, for instance because it is a legacy Tier 1 instrument or because it is a Tier 2 instrument that includes an incentive for the issuer to redeem. The balances are the International Financial Reporting Standard (IFRS) balance sheet carrying amounts, which may differ from the amount which the instrument contributes to regulatory capital. Regulatory balances exclude, for example, issuance costs and fair value movements, while dated capital is required to be amortised on a straight-line basis over the final five years of maturity. For accounting purposes the capital instruments in the following table are included within equity or subordinated liabilities, details of which are included on pages 356 to 361 of the 2016 ARA. Refer to RBS.com for more details on these and other instruments issued to third parties on an instrument-by-instrument basis.
Pillar 1 treatment - Additional Tier 1 Step-up coupon 2016 2015
£m £m
RBS - undated loan capital
US$762 million 7.648% perpetual regulatory 3 month US$ LIBOR plus 2.5% 625 519
(callable quarterly from September 2031)
RBS - debt preference shares
Series F US$156 million 8.5% (callable any time) 127 105
Series H US$242 million 7.25% (callable any time) 197 163
Series L US$751 million 5.75% (callable any time) 609 506
Series 1 US$65 million 9.118% (callable any time) 54 45
Series 1 £15 million 7.387% (callable any time) 15 15
NWB Plc - debt preference shares
Series A £140 million 9% (not callable) 143 143
Series C US$246 million 8.625% (callable quarterly) 210 177
RBS US Capital Trusts - debt trust preferred securities
US$486 million 6.8% 2042 (callable quarterly) 394 328
US$394 million 6.425% 2043 (callable quarterly from January 2034) 3 month US$ LIBOR plus 1.9425% 451 383
RBS N.V. US Capital Trusts - debt trust preferred securities
US$1,285 million 5.90% Trust Preferred V — 841
US$200 million 6.25% Trust Preferred VI — 131
US$1,800 million 6.08% Trust Preferred VII — 1,178
RBS US Capital Trusts - equity trust preferred securities
€166 million 4.243% 3 month EURIBOR plus 1.69% — 110
£93 million 5.6457% (callable quarterly from June 2017) 3 month LIBOR plus 1.69% 93 93
RBS - paid in equity trades
CAD321 million 6.666% (callable quarterly from October 2017) 3 month CDOR plus 2.76% 156 156
US$564 million 6.99% (callable quarterly from October 2017) 3 month US$ LIBOR plus 2.67% 275 275
Capital and leverage
21
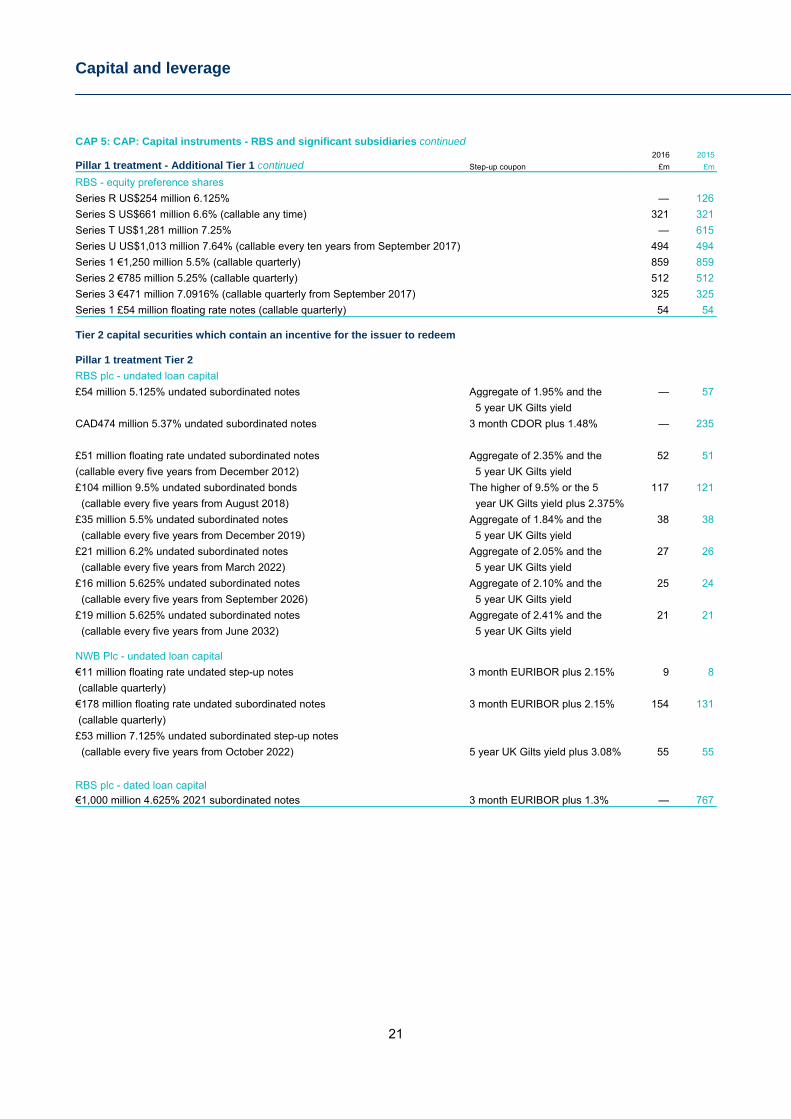
CAP 5: CAP: Capital instruments - RBS and significant subsidiaries continued
Pillar 1 treatment - Additional Tier 1 continued Step-up coupon 2016 2015
£m £m
RBS - equity preference shares
Series R US$254 million 6.125% — 126
Series S US$661 million 6.6% (callable any time) 321 321
Series T US$1,281 million 7.25% — 615
Series U US$1,013 million 7.64% (callable every ten years from September 2017) 494 494
Series 1 €1,250 million 5.5% (callable quarterly) 859 859
Series 2 €785 million 5.25% (callable quarterly) 512 512
Series 3 €471 million 7.0916% (callable quarterly from September 2017) 325 325
Series 1 £54 million floating rate notes (callable quarterly) 54 54
Tier 2 capital securities which contain an incentive for the issuer to redeem
Pillar 1 treatment Tier 2
RBS plc - undated loan capital
£54 million 5.125% undated subordinated notes Aggregate of 1.95% and the — 57
5 year UK Gilts yield
CAD474 million 5.37% undated subordinated notes 3 month CDOR plus 1.48% — 235
£51 million floating rate undated subordinated notes Aggregate of 2.35% and the 52 51
(callable every five years from December 2012) 5 year UK Gilts yield
£104 million 9.5% undated subordinated bonds The higher of 9.5% or the 5 117 121
(callable every five years from August 2018) year UK Gilts yield plus 2.375%
£35 million 5.5% undated subordinated notes Aggregate of 1.84% and the 38 38
(callable every five years from December 2019) 5 year UK Gilts yield
£21 million 6.2% undated subordinated notes Aggregate of 2.05% and the 27 26
(callable every five years from March 2022) 5 year UK Gilts yield
£16 million 5.625% undated subordinated notes Aggregate of 2.10% and the 25 24
(callable every five years from September 2026) 5 year UK Gilts yield
£19 million 5.625% undated subordinated notes Aggregate of 2.41% and the 21 21
(callable every five years from June 2032) 5 year UK Gilts yield
NWB Plc - undated loan capital
€11 million floating rate undated step-up notes 3 month EURIBOR plus 2.15% 9 8
(callable quarterly)
€178 million floating rate undated subordinated notes 3 month EURIBOR plus 2.15% 154 131
(callable quarterly)
£53 million 7.125% undated subordinated step-up notes (callable every five years from October 2022) 5 year UK Gilts yield plus 3.08% 55 55
RBS plc - dated loan capital
€1,000 million 4.625% 2021 subordinated notes 3 month EURIBOR plus 1.3% — 767
Capital and leverage
22
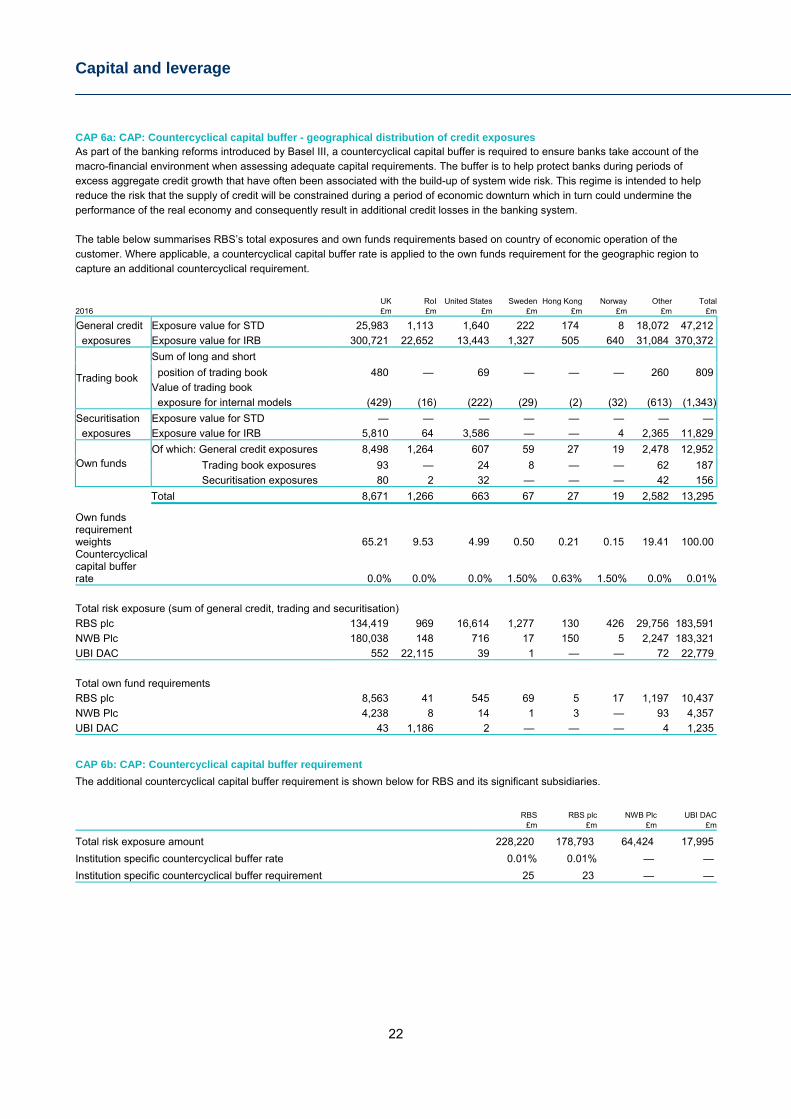
CAP 6a: CAP: Countercyclical capital buffer - geographical distribution of credit exposures As part of the banking reforms introduced by Basel III, a countercyclical capital buffer is required to ensure banks take account of the macro-financial environment when assessing adequate capital requirements. The buffer is to help protect banks during periods of excess aggregate credit growth that have often been associated with the build-up of system wide risk. This regime is intended to help reduce the risk that the supply of credit will be constrained during a period of economic downturn which in turn could undermine the performance of the real economy and consequently result in additional credit losses in the banking system. The table below summarises RBS’s total exposures and own funds requirements based on country of economic operation of the customer. Where applicable, a countercyclical capital buffer rate is applied to the own funds requirement for the geographic region to capture an additional countercyclical requirement.
UK RoI United States Sweden Hong Kong Norway Other Total2016 £m £m £m £m £m £m £m £m
General credit Exposure value for STD 25,983 1,113 1,640 222 174 8 18,072 47,212
exposures Exposure value for IRB 300,721 22,652 13,443 1,327 505 640 31,084 370,372
Trading book
Sum of long and short
position of trading book 480 — 69 — — — 260 809
Value of trading book
exposure for internal models (429) (16) (222) (29) (2) (32) (613) (1,343)
Securitisation Exposure value for STD — — — — — — — —
exposures Exposure value for IRB 5,810 64 3,586 — — 4 2,365 11,829
Own funds Of which: General credit exposures 8,498 1,264 607 59 27 19 2,478 12,952
Trading book exposures 93 — 24 8 — — 62 187
Securitisation exposures 80 2 32 — — — 42 156
Total 8,671 1,266 663 67 27 19 2,582 13,295
Own funds requirement weights 65.21 9.53 4.99 0.50 0.21 0.15 19.41 100.00 Countercyclical capital buffer rate 0.0% 0.0% 0.0% 1.50% 0.63% 1.50% 0.0% 0.01%
Total risk exposure (sum of general credit, trading and securitisation)
RBS plc 134,419 969 16,614 1,277 130 426 29,756 183,591
NWB Plc 180,038 148 716 17 150 5 2,247 183,321
UBI DAC 552 22,115 39 1 — — 72 22,779
Total own fund requirements
RBS plc 8,563 41 545 69 5 17 1,197 10,437
NWB Plc 4,238 8 14 1 3 — 93 4,357
UBI DAC 43 1,186 2 — — — 4 1,235
CAP 6b: CAP: Countercyclical capital buffer requirement The additional countercyclical capital buffer requirement is shown below for RBS and its significant subsidiaries. RBS RBS plc NWB Plc UBI DAC £m £m £m £m
Total risk exposure amount 228,220 178,793 64,424 17,995
Institution specific countercyclical buffer rate 0.01% 0.01% — —
Institution specific countercyclical buffer requirement 25 23 — —
Capital and leverage
23
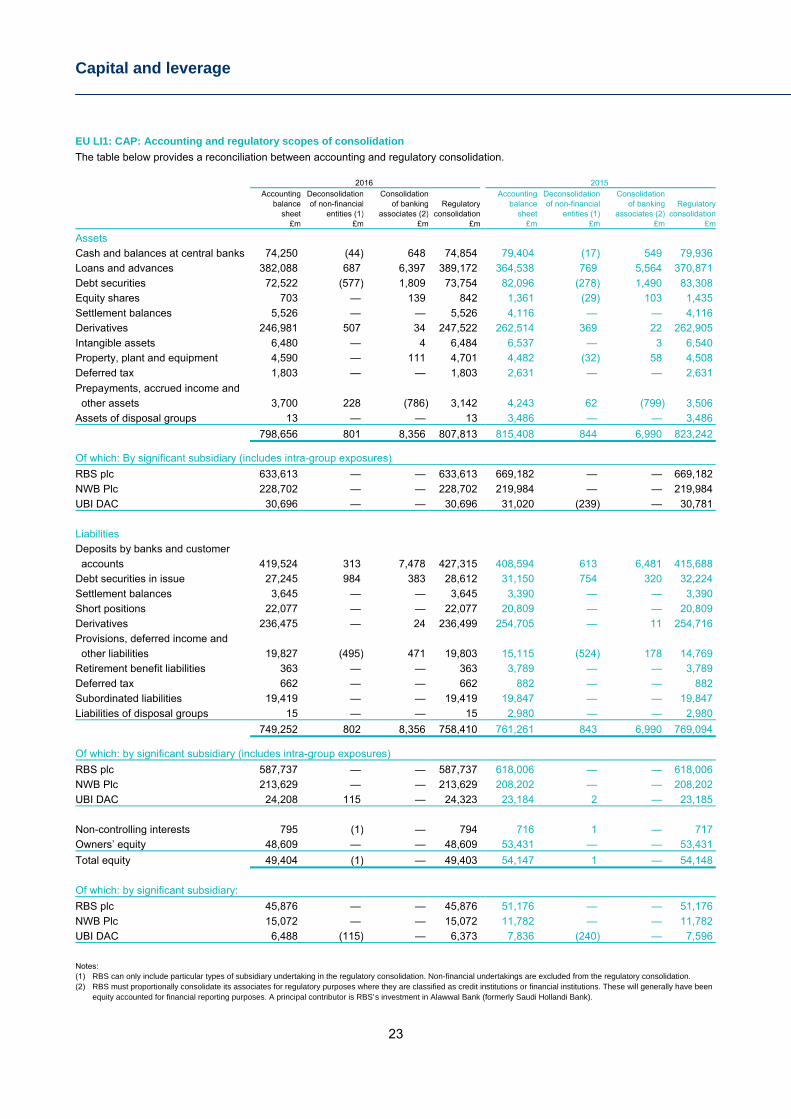
EU LI1: CAP: Accounting and regulatory scopes of consolidation The table below provides a reconciliation between accounting and regulatory consolidation.
2016 2015
Accounting Deconsolidation Consolidation Accounting Deconsolidation Consolidationbalance of non-financial of banking Regulatory balance of non-financial of banking Regulatory
sheet entities (1) associates (2) consolidation sheet entities (1) associates (2) consolidation£m £m £m £m £m £m £m £m
Assets
Cash and balances at central banks 74,250 (44) 648 74,854 79,404 (17) 549 79,936
Loans and advances 382,088 687 6,397 389,172 364,538 769 5,564 370,871
Debt securities 72,522 (577) 1,809 73,754 82,096 (278) 1,490 83,308
Equity shares 703 — 139 842 1,361 (29) 103 1,435
Settlement balances 5,526 — — 5,526 4,116 — — 4,116
Derivatives 246,981 507 34 247,522 262,514 369 22 262,905
Intangible assets 6,480 — 4 6,484 6,537 — 3 6,540
Property, plant and equipment 4,590 — 111 4,701 4,482 (32) 58 4,508
Deferred tax 1,803 — — 1,803 2,631 — — 2,631
Prepayments, accrued income and other assets 3,700 228 (786) 3,142 4,243 62 (799) 3,506
Assets of disposal groups 13 — — 13 3,486 — — 3,486
798,656 801 8,356 807,813 815,408 844 6,990 823,242
Of which: By significant subsidiary (includes intra-group exposures)
RBS plc 633,613 — — 633,613 669,182 — — 669,182
NWB Plc 228,702 — — 228,702 219,984 — — 219,984
UBI DAC 30,696 — — 30,696 31,020 (239) — 30,781
Liabilities
Deposits by banks and customer
accounts 419,524 313 7,478 427,315 408,594 613 6,481 415,688
Debt securities in issue 27,245 984 383 28,612 31,150 754 320 32,224
Settlement balances 3,645 — — 3,645 3,390 — — 3,390
Short positions 22,077 — — 22,077 20,809 — — 20,809
Derivatives 236,475 — 24 236,499 254,705 — 11 254,716
Provisions, deferred income and
other liabilities 19,827 (495) 471 19,803 15,115 (524) 178 14,769
Retirement benefit liabilities 363 — — 363 3,789 — — 3,789
Deferred tax 662 — — 662 882 — — 882
Subordinated liabilities 19,419 — — 19,419 19,847 — — 19,847
Liabilities of disposal groups 15 — — 15 2,980 — — 2,980
749,252 802 8,356 758,410 761,261 843 6,990 769,094
Of which: by significant subsidiary (includes intra-group exposures) RBS plc 587,737 — — 587,737 618,006 — — 618,006
NWB Plc 213,629 — — 213,629 208,202 — — 208,202
UBI DAC 24,208 115 — 24,323 23,184 2 — 23,185
Non-controlling interests 795 (1) — 794 716 1 — 717
Owners’ equity 48,609 — — 48,609 53,431 — — 53,431
Total equity 49,404 (1) — 49,403 54,147 1 — 54,148
Of which: by significant subsidiary:
RBS plc 45,876 — — 45,876 51,176 — — 51,176
NWB Plc 15,072 — — 15,072 11,782 — — 11,782
UBI DAC 6,488 (115) — 6,373 7,836 (240) — 7,596
Notes: (1) RBS can only include particular types of subsidiary undertaking in the regulatory consolidation. Non-financial undertakings are excluded from the regulatory consolidation. (2) RBS must proportionally consolidate its associates for regulatory purposes where they are classified as credit institutions or financial institutions. These will generally have been
equity accounted for financial reporting purposes. A principal contributor is RBS’s investment in Alawwal Bank (formerly Saudi Hollandi Bank).
Total credit risk exposures and RWAs (including counterparty credit risk)
24
EU CRA: IRB and STD: General qualitative information about credit risk Definitions and framework Credit risk is the risk of financial loss owing to the failure of a customer or counterparty to meet its obligation to settle outstanding amounts. RBS is exposed to credit risk as a result of a wide range of business activities. The most significant source of credit risk is lending. The second most significant source is counterparty credit risk, which results from activities in the derivatives and security financing transaction markets. Credit risk management covers concentration risk, settlement risk, issuer risk, wrong-way risk, residual value risk and credit mitigation risk. For definitions of terms used in credit and counterparty credit risk tables and text, refer to the Glossary. The disclosures in this section cover both credit risk (referred to as non-counterparty credit risk for clarity) and counterparty credit risk. Counterparty credit risk principally comprises exposures arising from derivatives and securities financing transactions. Non-counterparty credit risk excludes such exposures but includes loans and advances to customers, banks and central banks, as well as holdings of debt securities and equity shares. The two subsequent sections cover credit risk and counterparty credit risk separately. Except where noted, the disclosures in these sections exclude intra-Group exposures. Credit risk governance and management For a description of the main characteristics and elements of credit risk governance and management as well as additional credit risk disclosures, refer to page 207 of the 2016 ARA. Measurement of credit RWAs under CRR RBS has been granted permission by the PRA and other European regulators to use the Advanced Internal Ratings Based (AIRB) approach to calculate RWAs for the majority of its credit risk exposures. This permits RBS to use its own models to estimate Probability of Default (PD), Loss Given Default (LGD) and Exposure at Default (EAD) as inputs to the regulatory formula that determines RWAs. In the case of project finance and income-producing real estate lending, the supervisory slotting methodology is used to determine RWAs. For some portfolios, primarily in Private Banking, RBS uses the Standardised (STD) approach to calculate RWAs - either on a permanent basis or pending an application to the PRA to transition to the AIRB approach under RBS’s roll-out plan. Under the STD approach, risk weights are assigned to exposures in accordance with the CRR. For corporates, sovereigns and financial institutions, RBS uses risk weights based on credit quality steps that are mapped from credit ratings issued by external rating agencies, namely Standard & Poor’s (S&P), Moody’s and Fitch.
EU CRC: IRB and STD: Qualitative disclosures relating to credit risk mitigation RBS uses a number of credit risk mitigation approaches. These differ for Personal and Wholesale customers. For Personal customers, RBS takes collateral in the form of residential property to mitigate the credit risk arising from mortgages and home equity lending. For Wholesale customers, RBS mitigates credit risk through the use of netting, collateral and market standard documentation, depending on the nature of the counterparty and its assets. Mitigation can include commercial real estate, other physical assets - such as stock, plant, equipment, machinery, vehicles, ships and aircraft - receivables (amounts due to counterparties from their own customers) and financial collateral. In certain cases, credit risk is mitigated through the use of guarantees. Such guarantees may be from banks or other financial institutions (including standby letters of credit), companies (including one-way or inter-company structures), export credit agencies, UK government schemes (such as the Enterprise Finance Guarantee), other Sovereigns, or individuals (in which case the amount must be specified). Requirements and conditions for these are set out in RBS credit policies. RBS mitigates counterparty credit risk arising from both derivatives transactions and repurchase agreements through the use of market standard documentation, enabling netting, and through collateralisation. Credit insurance can also be used as a mitigant. In such cases the insurer will, in return for insurance premiums, pay all or part of an amount due to RBS if certain events agreed with the insurer occur. Credit insurance may be used to mitigate debtor risk in receivables financing, to mitigate lessee risk in asset financing or otherwise to mitigate general exposure to a customer. Requirements and conditions for these are set out in RBS credit policies. Credit risk mitigants are reviewed in the context of the overall credit concentration risk frameworks. For further information on credit risk mitigation, refer to Table EU CR3_a of this report and page 211 of the 2016 ARA.
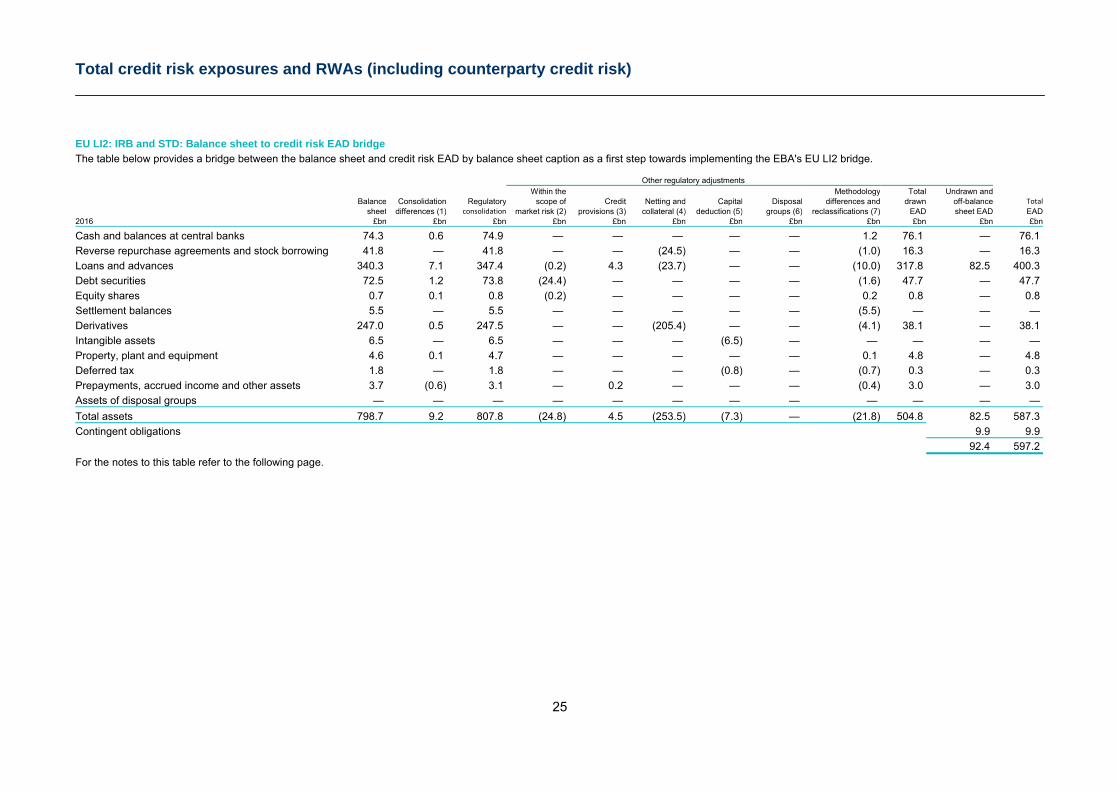
Total credit risk exposures and RWAs (including counterparty credit risk)
25
EU LI2: IRB and STD: Balance sheet to credit risk EAD bridge The table below provides a bridge between the balance sheet and credit risk EAD by balance sheet caption as a first step towards implementing the EBA's EU LI2 bridge.
Other regulatory adjustments Within the Methodology Total Undrawn and Balance Consolidation Regulatory scope of Credit Netting and Capital Disposal differences and drawn off-balance Total sheet differences (1) consolidation market risk (2) provisions (3) collateral (4) deduction (5) groups (6) reclassifications (7) EAD sheet EAD EAD 2016 £bn £bn £bn £bn £bn £bn £bn £bn £bn £bn £bn £bn
Cash and balances at central banks 74.3 0.6 74.9 — — — — — 1.2 76.1 — 76.1
Reverse repurchase agreements and stock borrowing 41.8 — 41.8 — — (24.5) — — (1.0) 16.3 — 16.3
Loans and advances 340.3 7.1 347.4 (0.2) 4.3 (23.7) — — (10.0) 317.8 82.5 400.3
Debt securities 72.5 1.2 73.8 (24.4) — — — — (1.6) 47.7 — 47.7
Equity shares 0.7 0.1 0.8 (0.2) — — — — 0.2 0.8 — 0.8
Settlement balances 5.5 — 5.5 — — — — — (5.5) — — —
Derivatives 247.0 0.5 247.5 — — (205.4) — — (4.1) 38.1 — 38.1
Intangible assets 6.5 — 6.5 — — — (6.5) — — — — —
Property, plant and equipment 4.6 0.1 4.7 — — — — — 0.1 4.8 — 4.8
Deferred tax 1.8 — 1.8 — — — (0.8) — (0.7) 0.3 — 0.3
Prepayments, accrued income and other assets 3.7 (0.6) 3.1 — 0.2 — — — (0.4) 3.0 — 3.0
Assets of disposal groups — — — — — — — — — — — —
Total assets 798.7 9.2 807.8 (24.8) 4.5 (253.5) (7.3) — (21.8) 504.8 82.5 587.3
Contingent obligations 9.9 9.9
92.4 597.2
For the notes to this table refer to the following page.
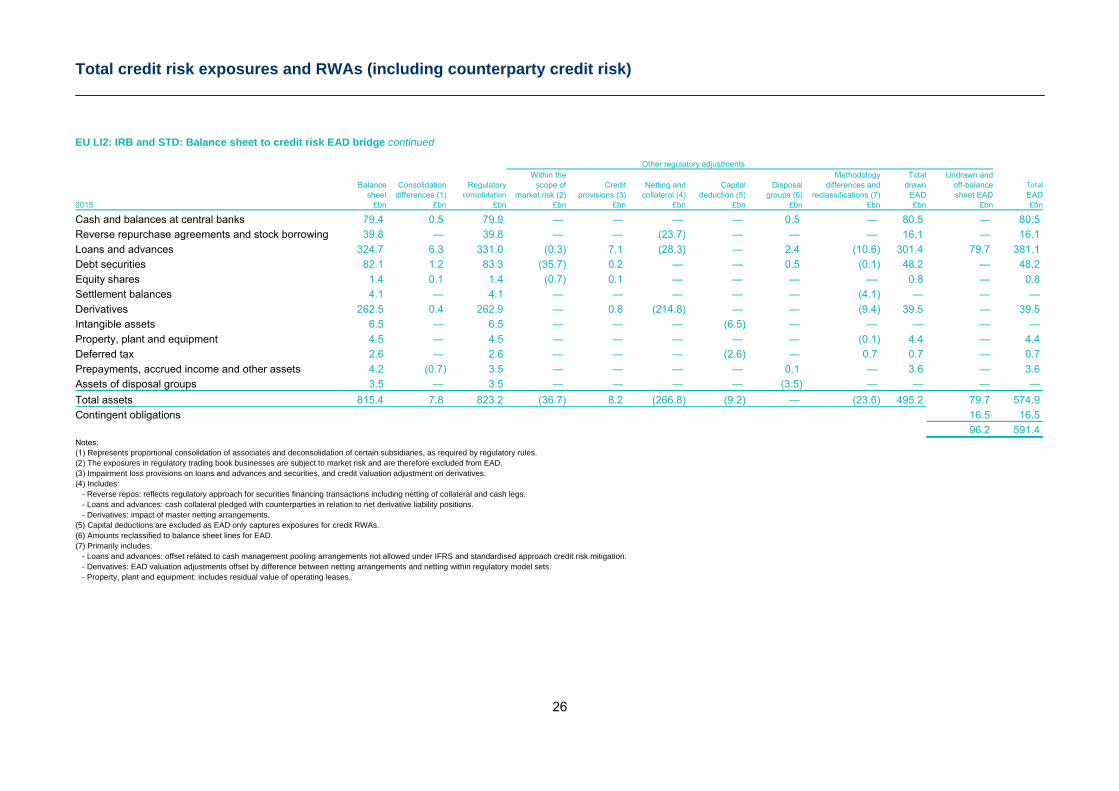
Total credit risk exposures and RWAs (including counterparty credit risk)
26
EU LI2: IRB and STD: Balance sheet to credit risk EAD bridge continued Other regulatory adjustments Within the Methodology Total Undrawn and Balance Consolidation Regulatory scope of Credit Netting and Capital Disposal differences and drawn off-balance Total sheet differences (1) consolidation market risk (2) provisions (3) collateral (4) deduction (5) groups (6) reclassifications (7) EAD sheet EAD EAD 2015 £bn £bn £bn £bn £bn £bn £bn £bn £bn £bn £bn £bn
Cash and balances at central banks 79.4 0.5 79.9 — — — — 0.5 — 80.5 — 80.5
Reverse repurchase agreements and stock borrowing 39.8 — 39.8 — — (23.7) — — — 16.1 — 16.1
Loans and advances 324.7 6.3 331.0 (0.3) 7.1 (28.3) — 2.4 (10.6) 301.4 79.7 381.1
Debt securities 82.1 1.2 83.3 (35.7) 0.2 — — 0.5 (0.1) 48.2 — 48.2
Equity shares 1.4 0.1 1.4 (0.7) 0.1 — — — — 0.8 — 0.8
Settlement balances 4.1 — 4.1 — — — — — (4.1) — — —
Derivatives 262.5 0.4 262.9 — 0.8 (214.8) — — (9.4) 39.5 — 39.5
Intangible assets 6.5 — 6.5 — — — (6.5) — — — — —
Property, plant and equipment 4.5 — 4.5 — — — — — (0.1) 4.4 — 4.4
Deferred tax 2.6 — 2.6 — — — (2.6) — 0.7 0.7 — 0.7
Prepayments, accrued income and other assets 4.2 (0.7) 3.5 — — — — 0.1 — 3.6 — 3.6
Assets of disposal groups 3.5 — 3.5 — — — — (3.5) — — — —
Total assets 815.4 7.8 823.2 (36.7) 8.2 (266.8) (9.2) — (23.6) 495.2 79.7 574.9
Contingent obligations 16.5 16.5
96.2 591.4 Notes: (1) Represents proportional consolidation of associates and deconsolidation of certain subsidiaries, as required by regulatory rules. (2) The exposures in regulatory trading book businesses are subject to market risk and are therefore excluded from EAD. (3) Impairment loss provisions on loans and advances and securities, and credit valuation adjustment on derivatives. (4) Includes: - Reverse repos: reflects regulatory approach for securities financing transactions including netting of collateral and cash legs. - Loans and advances: cash collateral pledged with counterparties in relation to net derivative liability positions. - Derivatives: impact of master netting arrangements. (5) Capital deductions are excluded as EAD only captures exposures for credit RWAs. (6) Amounts reclassified to balance sheet lines for EAD. (7) Primarily includes: - Loans and advances: offset related to cash management pooling arrangements not allowed under IFRS and standardised approach credit risk mitigation. - Derivatives: EAD valuation adjustments offset by difference between netting arrangements and netting within regulatory model sets. - Property, plant and equipment: includes residual value of operating leases.
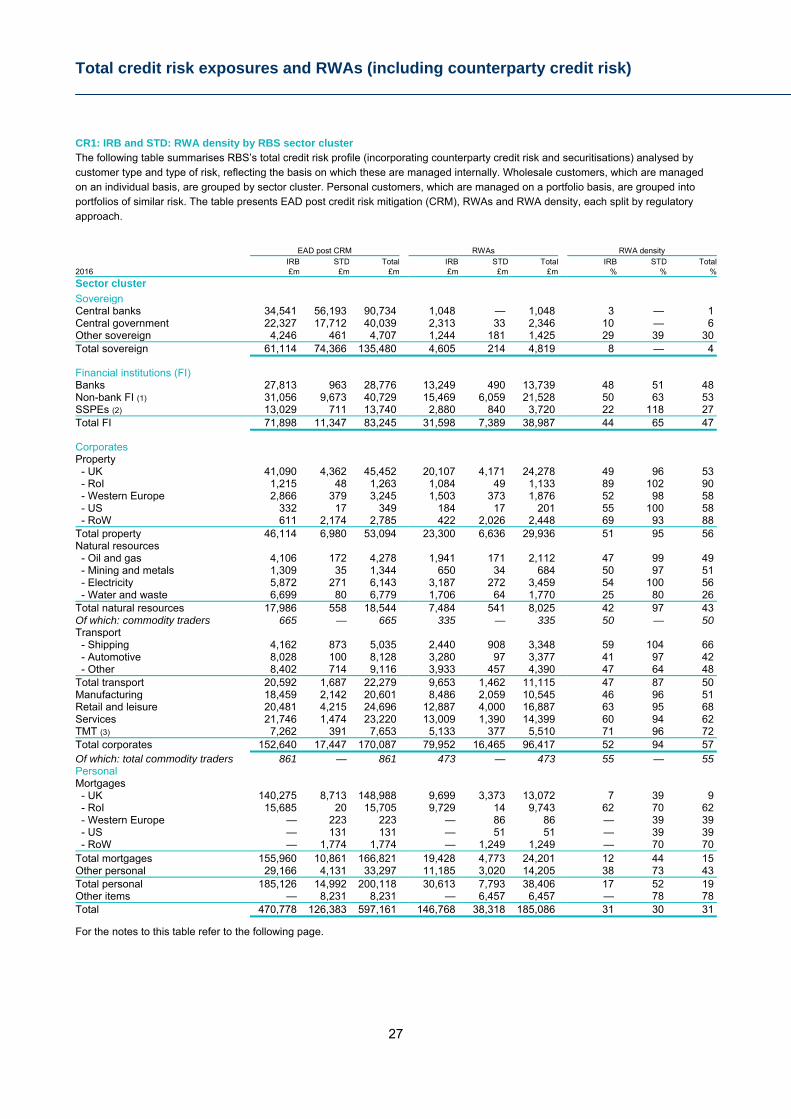
Total credit risk exposures and RWAs (including counterparty credit risk)
27
CR1: IRB and STD: RWA density by RBS sector cluster The following table summarises RBS’s total credit risk profile (incorporating counterparty credit risk and securitisations) analysed by customer type and type of risk, reflecting the basis on which these are managed internally. Wholesale customers, which are managed on an individual basis, are grouped by sector cluster. Personal customers, which are managed on a portfolio basis, are grouped into portfolios of similar risk. The table presents EAD post credit risk mitigation (CRM), RWAs and RWA density, each split by regulatory approach.
EAD post CRM RWAs RWA density IRB STD Total IRB STD Total IRB STD Total2016 £m £m £m £m £m £m % % %
Sector cluster
Sovereign Central banks 34,541 56,193 90,734 1,048 — 1,048 3 — 1 Central government 22,327 17,712 40,039 2,313 33 2,346 10 — 6 Other sovereign 4,246 461 4,707 1,244 181 1,425 29 39 30 Total sovereign 61,114 74,366 135,480 4,605 214 4,819 8 — 4 Financial institutions (FI) Banks 27,813 963 28,776 13,249 490 13,739 48 51 48 Non-bank FI (1) 31,056 9,673 40,729 15,469 6,059 21,528 50 63 53 SSPEs (2) 13,029 711 13,740 2,880 840 3,720 22 118 27 Total FI 71,898 11,347 83,245 31,598 7,389 38,987 44 65 47 Corporates Property - UK 41,090 4,362 45,452 20,107 4,171 24,278 49 96 53 - RoI 1,215 48 1,263 1,084 49 1,133 89 102 90 - Western Europe 2,866 379 3,245 1,503 373 1,876 52 98 58 - US 332 17 349 184 17 201 55 100 58 - RoW 611 2,174 2,785 422 2,026 2,448 69 93 88 Total property 46,114 6,980 53,094 23,300 6,636 29,936 51 95 56 Natural resources - Oil and gas 4,106 172 4,278 1,941 171 2,112 47 99 49 - Mining and metals 1,309 35 1,344 650 34 684 50 97 51 - Electricity 5,872 271 6,143 3,187 272 3,459 54 100 56 - Water and waste 6,699 80 6,779 1,706 64 1,770 25 80 26 Total natural resources 17,986 558 18,544 7,484 541 8,025 42 97 43 Of which: commodity traders 665 — 665 335 — 335 50 — 50 Transport - Shipping 4,162 873 5,035 2,440 908 3,348 59 104 66 - Automotive 8,028 100 8,128 3,280 97 3,377 41 97 42 - Other 8,402 714 9,116 3,933 457 4,390 47 64 48 Total transport 20,592 1,687 22,279 9,653 1,462 11,115 47 87 50 Manufacturing 18,459 2,142 20,601 8,486 2,059 10,545 46 96 51 Retail and leisure 20,481 4,215 24,696 12,887 4,000 16,887 63 95 68 Services 21,746 1,474 23,220 13,009 1,390 14,399 60 94 62 TMT (3) 7,262 391 7,653 5,133 377 5,510 71 96 72 Total corporates 152,640 17,447 170,087 79,952 16,465 96,417 52 94 57 Of which: total commodity traders 861 — 861 473 — 473 55 — 55 Personal Mortgages - UK 140,275 8,713 148,988 9,699 3,373 13,072 7 39 9 - RoI 15,685 20 15,705 9,729 14 9,743 62 70 62 - Western Europe — 223 223 — 86 86 — 39 39 - US — 131 131 — 51 51 — 39 39 - RoW — 1,774 1,774 — 1,249 1,249 — 70 70 Total mortgages 155,960 10,861 166,821 19,428 4,773 24,201 12 44 15 Other personal 29,166 4,131 33,297 11,185 3,020 14,205 38 73 43 Total personal 185,126 14,992 200,118 30,613 7,793 38,406 17 52 19 Other items — 8,231 8,231 — 6,457 6,457 — 78 78 Total 470,778 126,383 597,161 146,768 38,318 185,086 31 30 31
For the notes to this table refer to the following page.
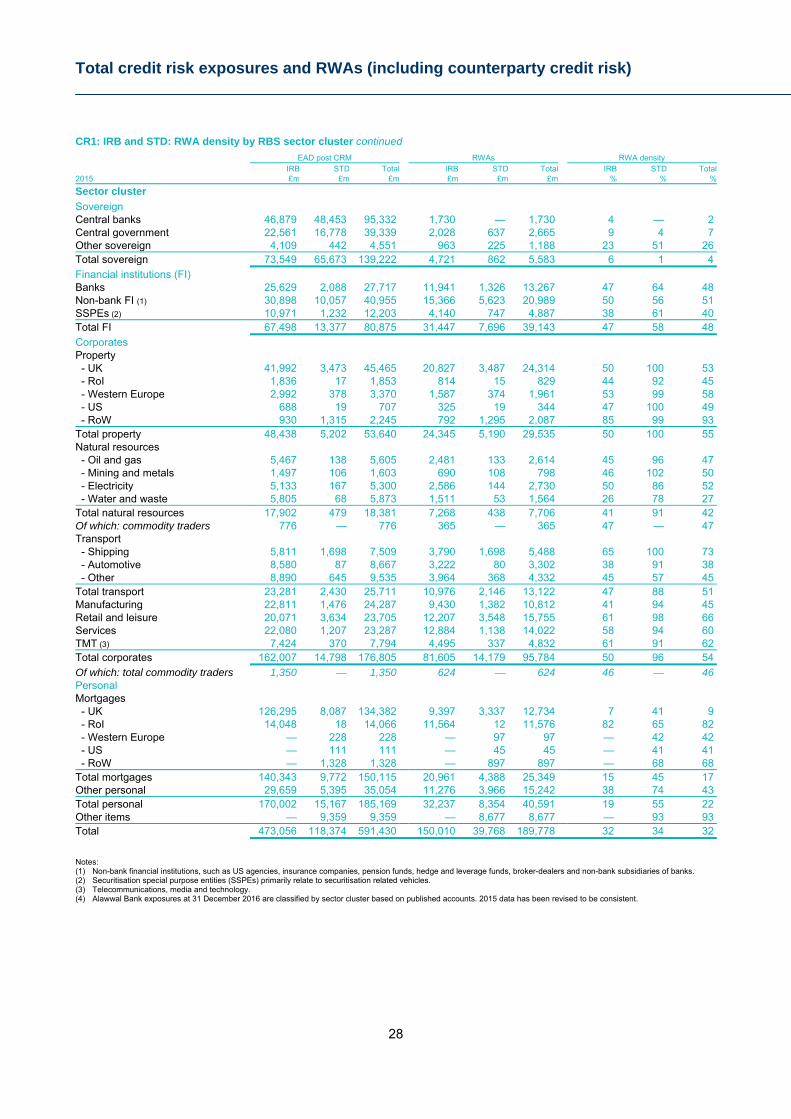
Total credit risk exposures and RWAs (including counterparty credit risk)
28
CR1: IRB and STD: RWA density by RBS sector cluster continued
EAD post CRM RWAs RWA density IRB STD Total IRB STD Total IRB STD Total2015 £m £m £m £m £m £m % % %
Sector cluster
Sovereign Central banks 46,879 48,453 95,332 1,730 — 1,730 4 — 2 Central government 22,561 16,778 39,339 2,028 637 2,665 9 4 7 Other sovereign 4,109 442 4,551 963 225 1,188 23 51 26 Total sovereign 73,549 65,673 139,222 4,721 862 5,583 6 1 4
Financial institutions (FI) Banks 25,629 2,088 27,717 11,941 1,326 13,267 47 64 48 Non-bank FI (1) 30,898 10,057 40,955 15,366 5,623 20,989 50 56 51 SSPEs (2) 10,971 1,232 12,203 4,140 747 4,887 38 61 40 Total FI 67,498 13,377 80,875 31,447 7,696 39,143 47 58 48
Corporates Property - UK 41,992 3,473 45,465 20,827 3,487 24,314 50 100 53 - RoI 1,836 17 1,853 814 15 829 44 92 45 - Western Europe 2,992 378 3,370 1,587 374 1,961 53 99 58 - US 688 19 707 325 19 344 47 100 49 - RoW 930 1,315 2,245 792 1,295 2,087 85 99 93 Total property 48,438 5,202 53,640 24,345 5,190 29,535 50 100 55 Natural resources - Oil and gas 5,467 138 5,605 2,481 133 2,614 45 96 47 - Mining and metals 1,497 106 1,603 690 108 798 46 102 50 - Electricity 5,133 167 5,300 2,586 144 2,730 50 86 52 - Water and waste 5,805 68 5,873 1,511 53 1,564 26 78 27 Total natural resources 17,902 479 18,381 7,268 438 7,706 41 91 42 Of which: commodity traders 776 — 776 365 — 365 47 — 47 Transport - Shipping 5,811 1,698 7,509 3,790 1,698 5,488 65 100 73 - Automotive 8,580 87 8,667 3,222 80 3,302 38 91 38 - Other 8,890 645 9,535 3,964 368 4,332 45 57 45 Total transport 23,281 2,430 25,711 10,976 2,146 13,122 47 88 51 Manufacturing 22,811 1,476 24,287 9,430 1,382 10,812 41 94 45 Retail and leisure 20,071 3,634 23,705 12,207 3,548 15,755 61 98 66 Services 22,080 1,207 23,287 12,884 1,138 14,022 58 94 60 TMT (3) 7,424 370 7,794 4,495 337 4,832 61 91 62 Total corporates 162,007 14,798 176,805 81,605 14,179 95,784 50 96 54
Of which: total commodity traders 1,350 — 1,350 624 — 624 46 — 46 Personal Mortgages - UK 126,295 8,087 134,382 9,397 3,337 12,734 7 41 9 - RoI 14,048 18 14,066 11,564 12 11,576 82 65 82 - Western Europe — 228 228 — 97 97 — 42 42 - US — 111 111 — 45 45 — 41 41 - RoW — 1,328 1,328 — 897 897 — 68 68 Total mortgages 140,343 9,772 150,115 20,961 4,388 25,349 15 45 17 Other personal 29,659 5,395 35,054 11,276 3,966 15,242 38 74 43 Total personal 170,002 15,167 185,169 32,237 8,354 40,591 19 55 22 Other items — 9,359 9,359 — 8,677 8,677 — 93 93 Total 473,056 118,374 591,430 150,010 39,768 189,778 32 34 32
Notes: (1) Non-bank financial institutions, such as US agencies, insurance companies, pension funds, hedge and leverage funds, broker-dealers and non-bank subsidiaries of banks. (2) Securitisation special purpose entities (SSPEs) primarily relate to securitisation related vehicles. (3) Telecommunications, media and technology. (4) Alawwal Bank exposures at 31 December 2016 are classified by sector cluster based on published accounts. 2015 data has been revised to be consistent.
Total credit risk exposures and RWAs (including counterparty credit risk)
29
Key points Total credit risk exposure increased over the year, with EAD
post CRM up 1% (£5.7 billion) to £597 billion at 31 December 2016 while RWAs fell 2% (£4.7 billion) to £185 billion as overall credit quality improved. Overall, RWA density remained fairly stable, as £7.7 billion of the increase in exposure related to zero-weighted placements with the Bank of England.
Excluding the exchange rate impact, EAD post CRM fell 3% or £16.3 billion.
The key upward drivers for EAD post CRM were: o The weakening of sterling against other major
currencies following the EU referendum (which accounted for an underlying upward impact of £22 billion); and
o 11% growth in the UK mortgage portfolio to £149 billion, in line with the growth strategy for this sector, still within risk appetite (accounting for an upward impact of £15 billion).
These were largely offset by: o Asset sales, limit reductions and early repayments in
line with risk reduction strategy (accounting for a downward impact of £22 billion); and
o A reduction in exposures to central banks as part of ongoing liquidity management by Treasury (accounting for a downward impact of £11 billion).
RWA movements were also affected by recent updates to the PD models for banks, local authorities, housing associations and investment fund bridge lending; and the LGD models for banks and quasi-governments. These updates are implemented through annual customer credit review. The update of the PD model for banks recognised a reduction in implied government support reflecting changes in the regulatory environment in response to the global economic downturn in 2008. This resulted in some downward rating migration across internal asset quality bands.
Retail PD models are recalibrated on a quarterly basis to incorporate more recent data. This resulted in upward rating migrations due to the current benign credit conditions, notably in mortgage lending.
Credit risk (excluding non-counterparty credit risk) Non-counterparty credit risk EAD post CRM increased 1% (£7.0 billion) to £543 billion. The increase was predominantly driven by the growth in the UK mortgage portfolio and exchange rate movements, partly offset by a reduction in exposures to central banks as part of ongoing liquidity management by Treasury and selective disposals in the US and APAC, portfolio sales, limit reductions and early repayments in line with risk reduction strategy. RWAs decreased 3% (£4.3 billion) to £162 billion reflecting risk reduction strategy, a change in the portfolio mix in securitisations and upward rating migrations in the Retail portfolio.
Counterparty credit risk Counterparty credit risk EAD post CRM and RWAs fell 2% due to the continuing roll-off of trades in Capital Resolution, offset by the impact of exchange rate movements.
Sector cluster movements - IRB approach Overall, EAD post CRM under the IRB approach fell 0.5% (£2.3 billion) to £471 billion due to a reduction in exposures to central banks as part of ongoing liquidity management by Treasury and selective disposals in the US and APAC, as well as portfolio sales, limit reductions and early repayments in line with RBS’s risk reduction strategy. This was largely offset by exchange rate movements and growth in the UK mortgage portfolio. RWA density fell from 32% to 31% in line with RWA reductions of 2% (£3.2 billion) reflecting risk reduction strategy, a change in the portfolio mix in securitisations and the continued benign economic conditions, reflected in the Retail portfolio. Sovereigns - The decrease of 17% (£12.4 billion) in EAD post CRM reflected liquidity management, partially offset by exchange rate movements. RWAs and RWA density remained stable. Securitisation SPEs - The 19% (£2.1 billion) increase in EAD post CRM reflected growth in lower-risk transactions and the continuing run-down of high-risk assets. This was reflected in the RWA decrease of 30% (£1.3 billion) in line with RBS’s risk reduction strategy. This caused RWA density to fall from 38% to 22%. Property - EAD post CRM fell 5% (£2.3 billion) and RWAs fell by 4% (£1 billion), primarily as a result of reductions through repayments, asset sales and write-offs of legacy non-performing assets. RWA density in RoI increased from 44% to 89% following the sale of a non-performing portfolio of loans that had no impact on RWAs. Oil and gas - EAD post CRM fell 25% (£1.4 billion) and RWAs fell 22% (£0.5 billion), mainly due to exposure reductions in the US and APAC (£0.5 billion). RWA density increased from 45% to 47%, reflecting the deteriorating credit quality of the portfolio, as the challenging market conditions in this sector continued. Mining and metals - EAD post CRM fell 13% (£0.2 billion) while RWAs fell 6% (£0.04 billion). There was no material trend in the portfolio other than normal business activities. RWA density rose from 46% to 50% due to a degree of deterioration in the credit quality of the portfolio, as the sector remained affected by a slowdown in demand and the oversupply of key metal commodities.
Electricity - EAD post CRM increased 14% (£0.7 billion). This largely reflected a refined classification of exposure in the natural resources sector, which led to a transfer of regulated utility exposure from Oil and Gas to Electricity and an increase in Project Finance portfolio as part of the growth strategy. This caused RWAs to rise 23% (£0.6 billion) and RWA density to rise from 50% to 54%. The overall average RWA density for the Project Finance portfolio was unchanged at 75% compared to 2015.
Water and waste - EAD post CRM increased 15% (£0.9 billion) driven by derivative mark-to-market movements. RWA density fell from 26% to 25% despite RWAs increasing 13% (£0.2 billion) as these derivative products attract below-average RWAs for this sector.
Total credit risk exposures and RWAs (including counterparty credit risk)
30
Shipping - EAD post CRM fell 28% (£1.6 billion) and RWAs fell by 36% (£1.4 billion). The reductions reflected not only asset sales and loan amortisations but also the continued challenging market conditions that affect vessel values in the bulk, container and tanker sectors as a number of customers moved into default. RWA density decreased from 65% to 59% due to sales of high-capital-consumption portfolios in Capital Resolution.
Personal: Mortgages - EAD post CRM for UK mortgages rose 11%, driven by business strategy to increase lending, while underwriting standards remained robust. RWAs remained fairly stable, due to asset mix benefits and overall improved credit quality, largely reflecting the current benign credit conditions. RWA density remained flat at 7%. EAD post CRM for RoI mortgages increased 12%, mostly driven by exchange rate movements as well as new lending reflecting continuing market demand. This was offset by asset disposals, repayments and the sale of a loan portfolio. RWAs fell 16% and RWA density fell from 82% to 62% due to higher-risk asset sales and improvements in credit quality. The underlying credit metrics continued to benefit from the improving economic environment.
Sector cluster movements - STD approach Overall, EAD post CRM under the STD approach increased 7% to £126 billion, mainly due to liquidity management activities and an increase in Alawwal Bank’s mortgage, property and manufacturing exposure in the Rest of the World (RoW). This was offset by reductions in unsecured lending to Personal customers, reduced placements with Banks and asset sales in Shipping. RWAs fell 4% and RWA density fell from 34% to 30%, mainly due to the RWA reduction relating to Alawwal Bank’s exposure. Shipping - EAD post CRM fell 49% and RWAs fell 47%. The reductions reflected not only asset sales and loan amortisations but also the continued challenging market conditions. RWA density increased from 100% to 104%.The exposure under the STD approach relates to customers outside the UK, the RoI and the US, for which RBS has no permission to use internal models. Personal: Other personal lending - EAD post CRM fell 23% and RWAs fell 24% due to a disposal of international business. The remaining UK-focused portfolio was stable and the arrears rate was in line with the prior year. Other items - EAD post CRM fell by 12% and RWAs fell 26%, reflecting a reduction in Non-Credit Obligation Assets. Refer to the Credit risk section of the 2016 ARA for further commentary on exposure movements by sector.
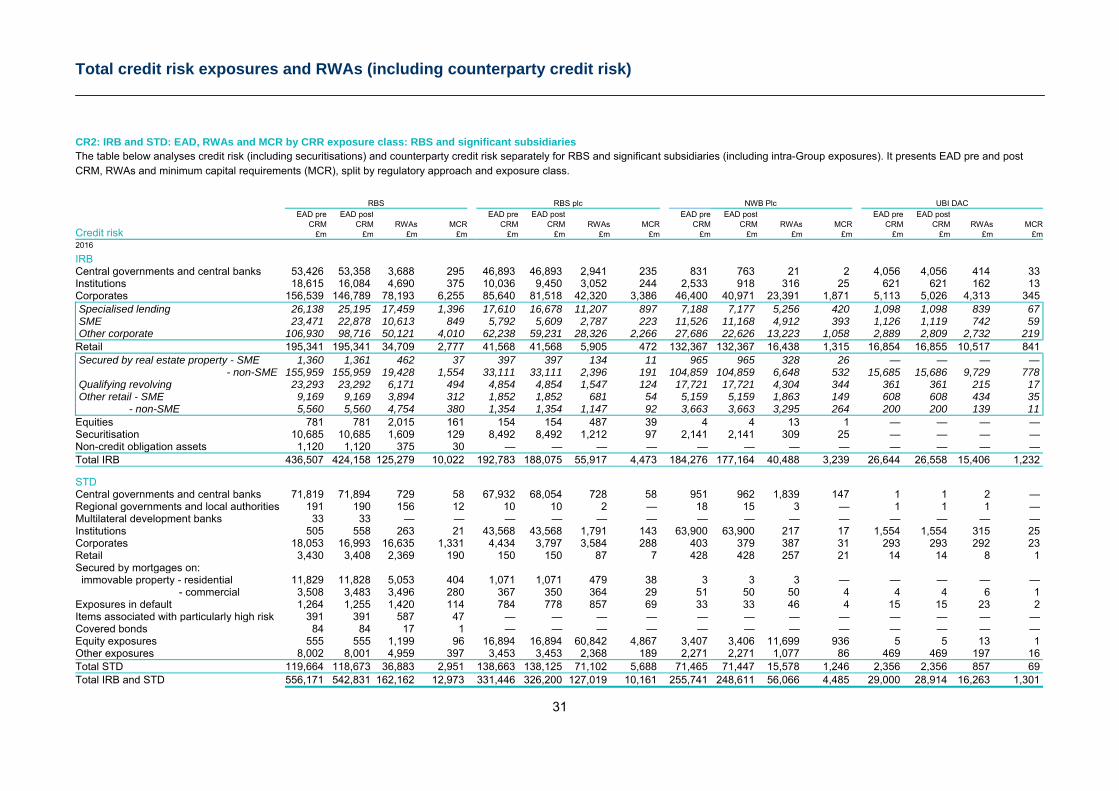
Total credit risk exposures and RWAs (including counterparty credit risk)
31
CR2: IRB and STD: EAD, RWAs and MCR by CRR exposure class: RBS and significant subsidiaries The table below analyses credit risk (including securitisations) and counterparty credit risk separately for RBS and significant subsidiaries (including intra-Group exposures). It presents EAD pre and post CRM, RWAs and minimum capital requirements (MCR), split by regulatory approach and exposure class.
RBS RBS plc NWB Plc UBI DAC EAD pre EAD post EAD pre EAD post EAD pre EAD post EAD pre EAD post
Credit risk CRM CRM RWAs MCR CRM CRM RWAs MCR CRM CRM RWAs MCR CRM CRM RWAs MCR
£m £m £m £m £m £m £m £m £m £m £m £m £m £m £m £m 2016
IRB Central governments and central banks 53,426 53,358 3,688 295 46,893 46,893 2,941 235 831 763 21 2 4,056 4,056 414 33 Institutions 18,615 16,084 4,690 375 10,036 9,450 3,052 244 2,533 918 316 25 621 621 162 13 Corporates 156,539 146,789 78,193 6,255 85,640 81,518 42,320 3,386 46,400 40,971 23,391 1,871 5,113 5,026 4,313 345 Specialised lending 26,138 25,195 17,459 1,396 17,610 16,678 11,207 897 7,188 7,177 5,256 420 1,098 1,098 839 67 SME 23,471 22,878 10,613 849 5,792 5,609 2,787 223 11,526 11,168 4,912 393 1,126 1,119 742 59 Other corporate 106,930 98,716 50,121 4,010 62,238 59,231 28,326 2,266 27,686 22,626 13,223 1,058 2,889 2,809 2,732 219 Retail 195,341 195,341 34,709 2,777 41,568 41,568 5,905 472 132,367 132,367 16,438 1,315 16,854 16,855 10,517 841 Secured by real estate property - SME 1,360 1,361 462 37 397 397 134 11 965 965 328 26 — — — — - non-SME 155,959 155,959 19,428 1,554 33,111 33,111 2,396 191 104,859 104,859 6,648 532 15,685 15,686 9,729 778 Qualifying revolving 23,293 23,292 6,171 494 4,854 4,854 1,547 124 17,721 17,721 4,304 344 361 361 215 17 Other retail - SME 9,169 9,169 3,894 312 1,852 1,852 681 54 5,159 5,159 1,863 149 608 608 434 35 - non-SME 5,560 5,560 4,754 380 1,354 1,354 1,147 92 3,663 3,663 3,295 264 200 200 139 11 Equities 781 781 2,015 161 154 154 487 39 4 4 13 1 — — — — Securitisation 10,685 10,685 1,609 129 8,492 8,492 1,212 97 2,141 2,141 309 25 — — — — Non-credit obligation assets 1,120 1,120 375 30 — — — — — — — — — — — — Total IRB 436,507 424,158 125,279 10,022 192,783 188,075 55,917 4,473 184,276 177,164 40,488 3,239 26,644 26,558 15,406 1,232
STD Central governments and central banks 71,819 71,894 729 58 67,932 68,054 728 58 951 962 1,839 147 1 1 2 — Regional governments and local authorities 191 190 156 12 10 10 2 — 18 15 3 — 1 1 1 — Multilateral development banks 33 33 — — — — — — — — — — — — — — Institutions 505 558 263 21 43,568 43,568 1,791 143 63,900 63,900 217 17 1,554 1,554 315 25 Corporates 18,053 16,993 16,635 1,331 4,434 3,797 3,584 288 403 379 387 31 293 293 292 23 Retail 3,430 3,408 2,369 190 150 150 87 7 428 428 257 21 14 14 8 1 Secured by mortgages on: immovable property - residential 11,829 11,828 5,053 404 1,071 1,071 479 38 3 3 3 — — — — — - commercial 3,508 3,483 3,496 280 367 350 364 29 51 50 50 4 4 4 6 1 Exposures in default 1,264 1,255 1,420 114 784 778 857 69 33 33 46 4 15 15 23 2 Items associated with particularly high risk 391 391 587 47 — — — — — — — — — — — — Covered bonds 84 84 17 1 — — — — — — — — — — — — Equity exposures 555 555 1,199 96 16,894 16,894 60,842 4,867 3,407 3,406 11,699 936 5 5 13 1 Other exposures 8,002 8,001 4,959 397 3,453 3,453 2,368 189 2,271 2,271 1,077 86 469 469 197 16 Total STD 119,664 118,673 36,883 2,951 138,663 138,125 71,102 5,688 71,465 71,447 15,578 1,246 2,356 2,356 857 69 Total IRB and STD 556,171 542,831 162,162 12,973 331,446 326,200 127,019 10,161 255,741 248,611 56,066 4,485 29,000 28,914 16,263 1,301
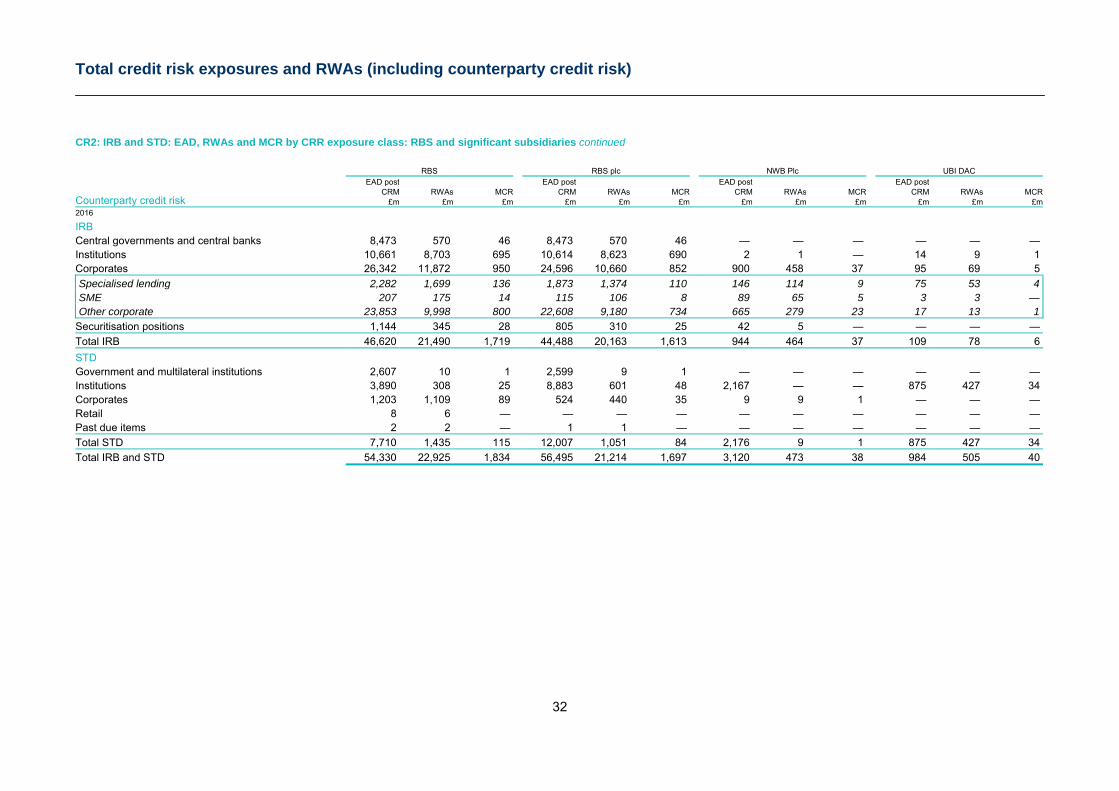
Total credit risk exposures and RWAs (including counterparty credit risk)
32
CR2: IRB and STD: EAD, RWAs and MCR by CRR exposure class: RBS and significant subsidiaries continued
RBS RBS plc NWB Plc UBI DAC EAD post EAD post EAD post EAD post
Counterparty credit risk CRM RWAs MCR CRM RWAs MCR CRM RWAs MCR CRM RWAs MCR
£m £m £m £m £m £m £m £m £m £m £m £m 2016
IRB Central governments and central banks 8,473 570 46 8,473 570 46 — — — — — — Institutions 10,661 8,703 695 10,614 8,623 690 2 1 — 14 9 1 Corporates 26,342 11,872 950 24,596 10,660 852 900 458 37 95 69 5
Specialised lending 2,282 1,699 136 1,873 1,374 110 146 114 9 75 53 4 SME 207 175 14 115 106 8 89 65 5 3 3 — Other corporate 23,853 9,998 800 22,608 9,180 734 665 279 23 17 13 1 Securitisation positions 1,144 345 28 805 310 25 42 5 — — — —
Total IRB 46,620 21,490 1,719 44,488 20,163 1,613 944 464 37 109 78 6
STD Government and multilateral institutions 2,607 10 1 2,599 9 1 — — — — — — Institutions 3,890 308 25 8,883 601 48 2,167 — — 875 427 34 Corporates 1,203 1,109 89 524 440 35 9 9 1 — — — Retail 8 6 — — — — — — — — — — Past due items 2 2 — 1 1 — — — — — — —
Total STD 7,710 1,435 115 12,007 1,051 84 2,176 9 1 875 427 34
Total IRB and STD 54,330 22,925 1,834 56,495 21,214 1,697 3,120 473 38 984 505 40
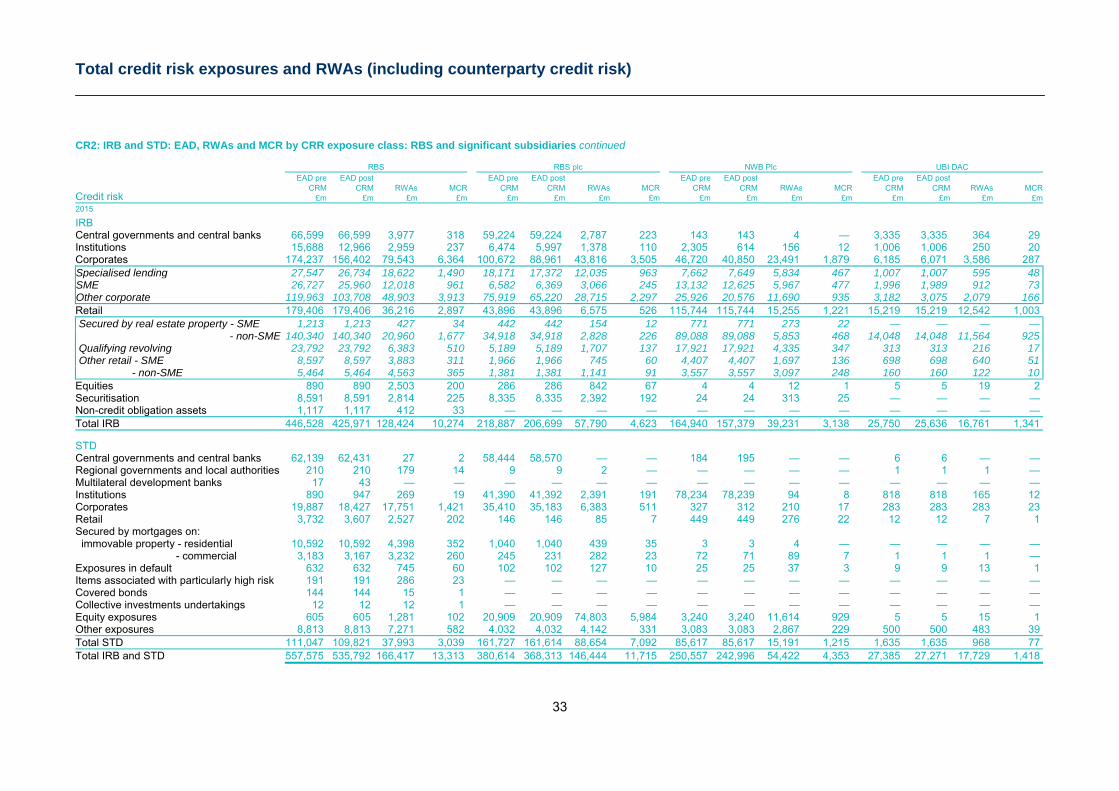
Total credit risk exposures and RWAs (including counterparty credit risk)
33
CR2: IRB and STD: EAD, RWAs and MCR by CRR exposure class: RBS and significant subsidiaries continued
RBS RBS plc NWB Plc UBI DAC EAD pre EAD post EAD pre EAD post EAD pre EAD post EAD pre EAD post
Credit risk CRM CRM RWAs MCR CRM CRM RWAs MCR CRM CRM RWAs MCR CRM CRM RWAs MCR
£m £m £m £m £m £m £m £m £m £m £m £m £m £m £m £m 2015
IRB Central governments and central banks 66,599 66,599 3,977 318 59,224 59,224 2,787 223 143 143 4 — 3,335 3,335 364 29 Institutions 15,688 12,966 2,959 237 6,474 5,997 1,378 110 2,305 614 156 12 1,006 1,006 250 20 Corporates 174,237 156,402 79,543 6,364 100,672 88,961 43,816 3,505 46,720 40,850 23,491 1,879 6,185 6,071 3,586 287 Specialised lending 27,547 26,734 18,622 1,490 18,171 17,372 12,035 963 7,662 7,649 5,834 467 1,007 1,007 595 48 SME 26,727 25,960 12,018 961 6,582 6,369 3,066 245 13,132 12,625 5,967 477 1,996 1,989 912 73 Other corporate 119,963 103,708 48,903 3,913 75,919 65,220 28,715 2,297 25,926 20,576 11,690 935 3,182 3,075 2,079 166 Retail 179,406 179,406 36,216 2,897 43,896 43,896 6,575 526 115,744 115,744 15,255 1,221 15,219 15,219 12,542 1,003 Secured by real estate property - SME 1,213 1,213 427 34 442 442 154 12 771 771 273 22 — — — — - non-SME 140,340 140,340 20,960 1,677 34,918 34,918 2,828 226 89,088 89,088 5,853 468 14,048 14,048 11,564 925 Qualifying revolving 23,792 23,792 6,383 510 5,189 5,189 1,707 137 17,921 17,921 4,335 347 313 313 216 17 Other retail - SME 8,597 8,597 3,883 311 1,966 1,966 745 60 4,407 4,407 1,697 136 698 698 640 51 - non-SME 5,464 5,464 4,563 365 1,381 1,381 1,141 91 3,557 3,557 3,097 248 160 160 122 10 Equities 890 890 2,503 200 286 286 842 67 4 4 12 1 5 5 19 2 Securitisation 8,591 8,591 2,814 225 8,335 8,335 2,392 192 24 24 313 25 — — — — Non-credit obligation assets 1,117 1,117 412 33 — — — — — — — — — — — — Total IRB 446,528 425,971 128,424 10,274 218,887 206,699 57,790 4,623 164,940 157,379 39,231 3,138 25,750 25,636 16,761 1,341
STD Central governments and central banks 62,139 62,431 27 2 58,444 58,570 — — 184 195 — — 6 6 — — Regional governments and local authorities 210 210 179 14 9 9 2 — — — — — 1 1 1 — Multilateral development banks 17 43 — — — — — — — — — — — — — — Institutions 890 947 269 19 41,390 41,392 2,391 191 78,234 78,239 94 8 818 818 165 12 Corporates 19,887 18,427 17,751 1,421 35,410 35,183 6,383 511 327 312 210 17 283 283 283 23 Retail 3,732 3,607 2,527 202 146 146 85 7 449 449 276 22 12 12 7 1 Secured by mortgages on: immovable property - residential 10,592 10,592 4,398 352 1,040 1,040 439 35 3 3 4 — — — — — - commercial 3,183 3,167 3,232 260 245 231 282 23 72 71 89 7 1 1 1 — Exposures in default 632 632 745 60 102 102 127 10 25 25 37 3 9 9 13 1 Items associated with particularly high risk 191 191 286 23 — — — — — — — — — — — — Covered bonds 144 144 15 1 — — — — — — — — — — — — Collective investments undertakings 12 12 12 1 — — — — — — — — — — — — Equity exposures 605 605 1,281 102 20,909 20,909 74,803 5,984 3,240 3,240 11,614 929 5 5 15 1 Other exposures 8,813 8,813 7,271 582 4,032 4,032 4,142 331 3,083 3,083 2,867 229 500 500 483 39 Total STD 111,047 109,821 37,993 3,039 161,727 161,614 88,654 7,092 85,617 85,617 15,191 1,215 1,635 1,635 968 77 Total IRB and STD 557,575 535,792 166,417 13,313 380,614 368,313 146,444 11,715 250,557 242,996 54,422 4,353 27,385 27,271 17,729 1,418
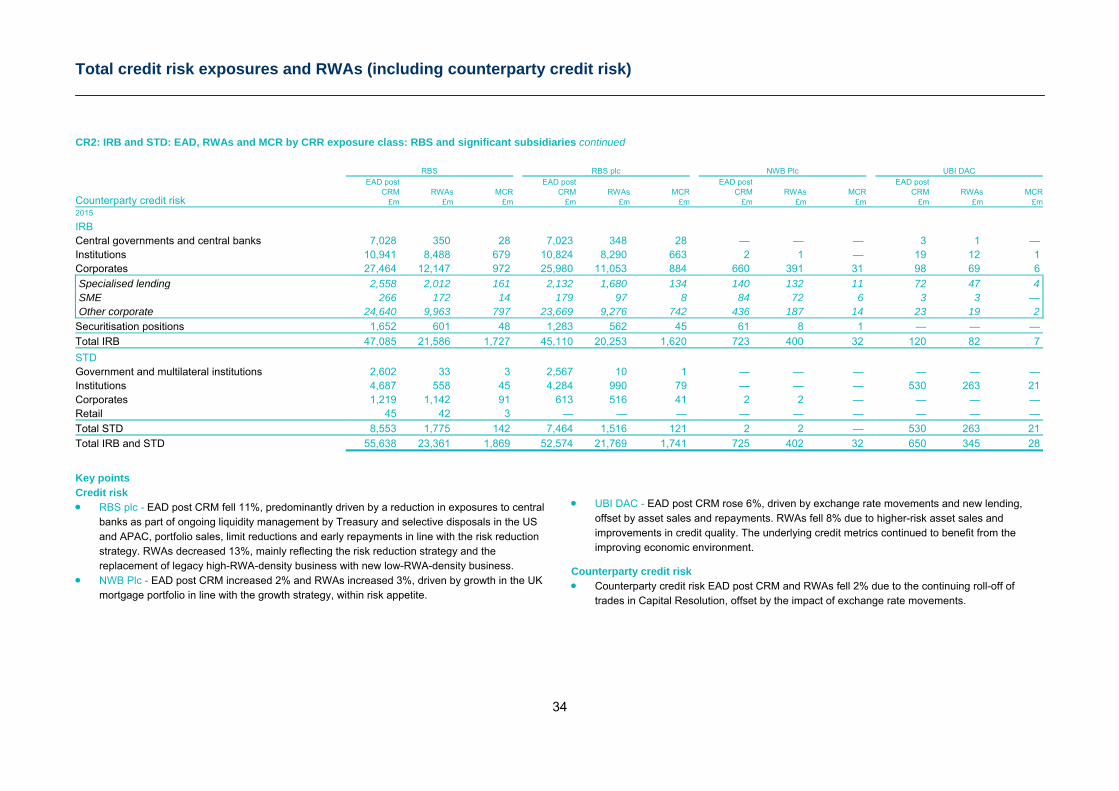
Total credit risk exposures and RWAs (including counterparty credit risk)
34
CR2: IRB and STD: EAD, RWAs and MCR by CRR exposure class: RBS and significant subsidiaries continued
RBS RBS plc NWB Plc UBI DAC EAD post EAD post EAD post EAD post
Counterparty credit risk CRM RWAs MCR CRM RWAs MCR CRM RWAs MCR CRM RWAs MCR
£m £m £m £m £m £m £m £m £m £m £m £m 2015
IRB Central governments and central banks 7,028 350 28 7,023 348 28 — — — 3 1 — Institutions 10,941 8,488 679 10,824 8,290 663 2 1 — 19 12 1 Corporates 27,464 12,147 972 25,980 11,053 884 660 391 31 98 69 6
Specialised lending 2,558 2,012 161 2,132 1,680 134 140 132 11 72 47 4 SME 266 172 14 179 97 8 84 72 6 3 3 — Other corporate 24,640 9,963 797 23,669 9,276 742 436 187 14 23 19 2 Securitisation positions 1,652 601 48 1,283 562 45 61 8 1 — — —
Total IRB 47,085 21,586 1,727 45,110 20,253 1,620 723 400 32 120 82 7
STD Government and multilateral institutions 2,602 33 3 2,567 10 1 — — — — — — Institutions 4,687 558 45 4,284 990 79 — — — 530 263 21 Corporates 1,219 1,142 91 613 516 41 2 2 — — — — Retail 45 42 3 — — — — — — — — —
Total STD 8,553 1,775 142 7,464 1,516 121 2 2 — 530 263 21
Total IRB and STD 55,638 23,361 1,869 52,574 21,769 1,741 725 402 32 650 345 28
Key points Credit risk RBS plc - EAD post CRM fell 11%, predominantly driven by a reduction in exposures to central
banks as part of ongoing liquidity management by Treasury and selective disposals in the US and APAC, portfolio sales, limit reductions and early repayments in line with the risk reduction strategy. RWAs decreased 13%, mainly reflecting the risk reduction strategy and the replacement of legacy high-RWA-density business with new low-RWA-density business.
NWB Plc - EAD post CRM increased 2% and RWAs increased 3%, driven by growth in the UK mortgage portfolio in line with the growth strategy, within risk appetite.
UBI DAC - EAD post CRM rose 6%, driven by exchange rate movements and new lending,
offset by asset sales and repayments. RWAs fell 8% due to higher-risk asset sales and improvements in credit quality. The underlying credit metrics continued to benefit from the improving economic environment.
Counterparty credit risk Counterparty credit risk EAD post CRM and RWAs fell 2% due to the continuing roll-off of
trades in Capital Resolution, offset by the impact of exchange rate movements.
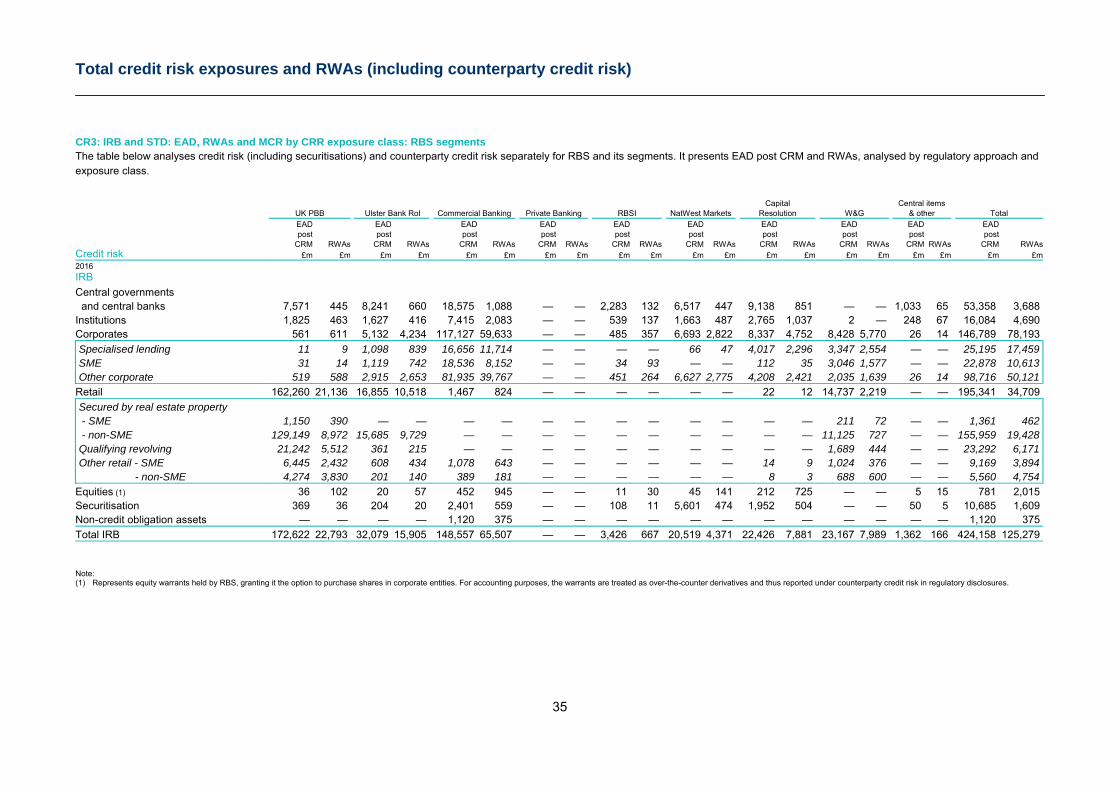
Total credit risk exposures and RWAs (including counterparty credit risk)
35
CR3: IRB and STD: EAD, RWAs and MCR by CRR exposure class: RBS segments The table below analyses credit risk (including securitisations) and counterparty credit risk separately for RBS and its segments. It presents EAD post CRM and RWAs, analysed by regulatory approach and exposure class.
Capital Central items UK PBB Ulster Bank RoI Commercial Banking Private Banking RBSI NatWest Markets Resolution W&G & other Total
EAD EAD EAD EAD EAD EAD EAD EAD EAD EAD post post post post post post post post post post
Credit risk CRM RWAs CRM RWAs CRM RWAs CRM RWAs CRM RWAs CRM RWAs CRM RWAs CRM RWAs CRM RWAs CRM RWAs
£m £m £m £m £m £m £m £m £m £m £m £m £m £m £m £m £m £m £m £m 2016
IRB
Central governments and central banks 7,571 445 8,241 660 18,575 1,088 — — 2,283 132 6,517 447 9,138 851 — — 1,033 65 53,358 3,688 Institutions 1,825 463 1,627 416 7,415 2,083 — — 539 137 1,663 487 2,765 1,037 2 — 248 67 16,084 4,690 Corporates 561 611 5,132 4,234 117,127 59,633 — — 485 357 6,693 2,822 8,337 4,752 8,428 5,770 26 14 146,789 78,193
Specialised lending 11 9 1,098 839 16,656 11,714 — — — — 66 47 4,017 2,296 3,347 2,554 — — 25,195 17,459 SME 31 14 1,119 742 18,536 8,152 — — 34 93 — — 112 35 3,046 1,577 — — 22,878 10,613 Other corporate 519 588 2,915 2,653 81,935 39,767 — — 451 264 6,627 2,775 4,208 2,421 2,035 1,639 26 14 98,716 50,121 Retail 162,260 21,136 16,855 10,518 1,467 824 — — — — — — 22 12 14,737 2,219 — — 195,341 34,709
Secured by real estate property - SME 1,150 390 — — — — — — — — — — — — 211 72 — — 1,361 462 - non-SME 129,149 8,972 15,685 9,729 — — — — — — — — — — 11,125 727 — — 155,959 19,428 Qualifying revolving 21,242 5,512 361 215 — — — — — — — — — — 1,689 444 — — 23,292 6,171 Other retail - SME 6,445 2,432 608 434 1,078 643 — — — — — — 14 9 1,024 376 — — 9,169 3,894 - non-SME 4,274 3,830 201 140 389 181 — — — — — — 8 3 688 600 — — 5,560 4,754 Equities (1) 36 102 20 57 452 945 — — 11 30 45 141 212 725 — — 5 15 781 2,015 Securitisation 369 36 204 20 2,401 559 — — 108 11 5,601 474 1,952 504 — — 50 5 10,685 1,609 Non-credit obligation assets — — — — 1,120 375 — — — — — — — — — — — — 1,120 375
Total IRB 172,622 22,793 32,079 15,905 148,557 65,507 — — 3,426 667 20,519 4,371 22,426 7,881 23,167 7,989 1,362 166 424,158 125,279
Note: (1) Represents equity warrants held by RBS, granting it the option to purchase shares in corporate entities. For accounting purposes, the warrants are treated as over-the-counter derivatives and thus reported under counterparty credit risk in regulatory disclosures.
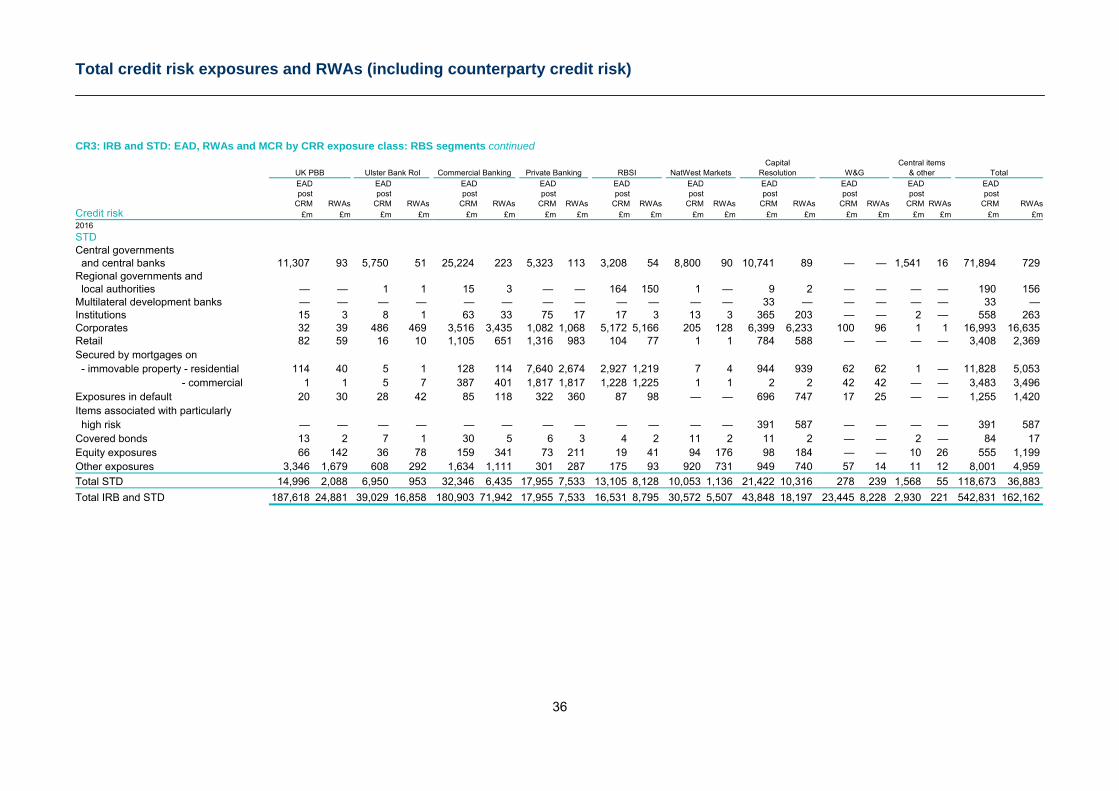
Total credit risk exposures and RWAs (including counterparty credit risk)
36
CR3: IRB and STD: EAD, RWAs and MCR by CRR exposure class: RBS segments continued Capital Central items
UK PBB Ulster Bank RoI Commercial Banking Private Banking RBSI NatWest Markets Resolution W&G & other Total EAD EAD EAD EAD EAD EAD EAD EAD EAD EAD post post post post post post post post post post
Credit risk CRM RWAs CRM RWAs CRM RWAs CRM RWAs CRM RWAs CRM RWAs CRM RWAs CRM RWAs CRM RWAs CRM RWAs
£m £m £m £m £m £m £m £m £m £m £m £m £m £m £m £m £m £m £m £m 2016
STD Central governments and central banks 11,307 93 5,750 51 25,224 223 5,323 113 3,208 54 8,800 90 10,741 89 — — 1,541 16 71,894 729 Regional governments and local authorities — — 1 1 15 3 — — 164 150 1 — 9 2 — — — — 190 156 Multilateral development banks — — — — — — — — — — — — 33 — — — — — 33 — Institutions 15 3 8 1 63 33 75 17 17 3 13 3 365 203 — — 2 — 558 263 Corporates 32 39 486 469 3,516 3,435 1,082 1,068 5,172 5,166 205 128 6,399 6,233 100 96 1 1 16,993 16,635 Retail 82 59 16 10 1,105 651 1,316 983 104 77 1 1 784 588 — — — — 3,408 2,369 Secured by mortgages on - immovable property - residential 114 40 5 1 128 114 7,640 2,674 2,927 1,219 7 4 944 939 62 62 1 — 11,828 5,053 - commercial 1 1 5 7 387 401 1,817 1,817 1,228 1,225 1 1 2 2 42 42 — — 3,483 3,496 Exposures in default 20 30 28 42 85 118 322 360 87 98 — — 696 747 17 25 — — 1,255 1,420 Items associated with particularly high risk — — — — — — — — — — — — 391 587 — — — — 391 587 Covered bonds 13 2 7 1 30 5 6 3 4 2 11 2 11 2 — — 2 — 84 17 Equity exposures 66 142 36 78 159 341 73 211 19 41 94 176 98 184 — — 10 26 555 1,199 Other exposures 3,346 1,679 608 292 1,634 1,111 301 287 175 93 920 731 949 740 57 14 11 12 8,001 4,959
Total STD 14,996 2,088 6,950 953 32,346 6,435 17,955 7,533 13,105 8,128 10,053 1,136 21,422 10,316 278 239 1,568 55 118,673 36,883
Total IRB and STD 187,618 24,881 39,029 16,858 180,903 71,942 17,955 7,533 16,531 8,795 30,572 5,507 43,848 18,197 23,445 8,228 2,930 221 542,831 162,162
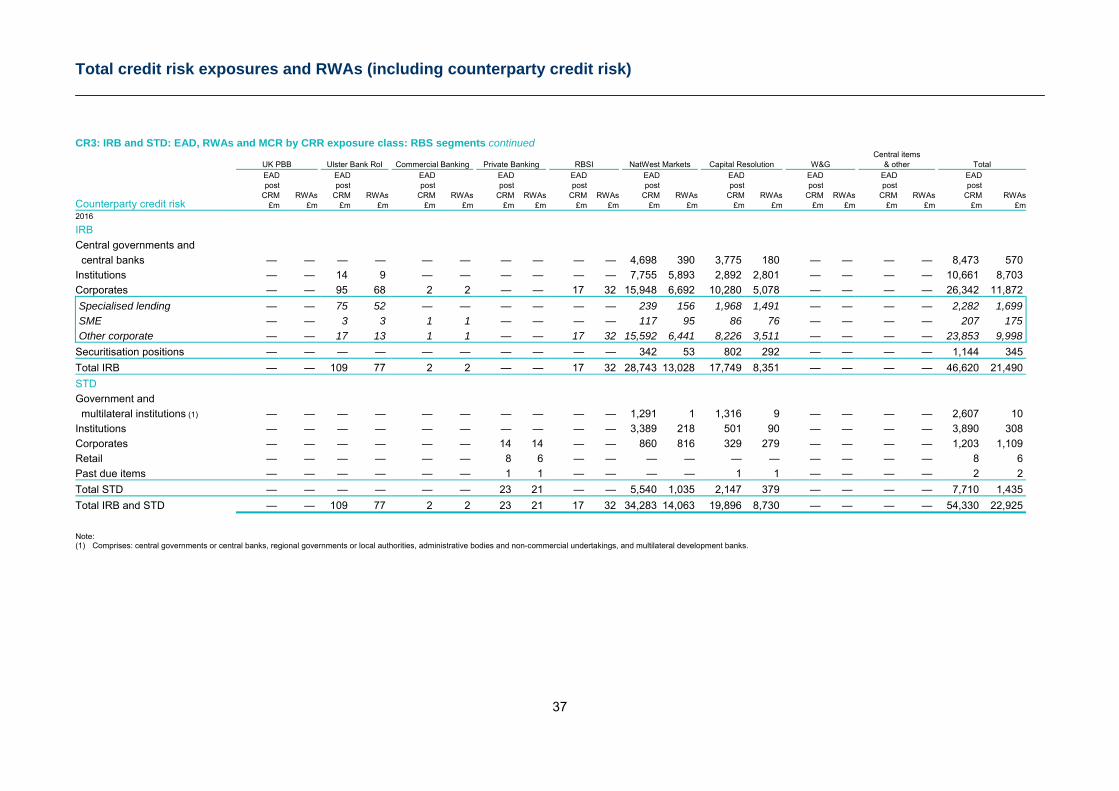
Total credit risk exposures and RWAs (including counterparty credit risk)
37
CR3: IRB and STD: EAD, RWAs and MCR by CRR exposure class: RBS segments continued Central items UK PBB Ulster Bank RoI Commercial Banking Private Banking RBSI NatWest Markets Capital Resolution W&G & other Total EAD EAD EAD EAD EAD EAD EAD EAD EAD EAD post post post post post post post post post post
Counterparty credit risk CRM RWAs CRM RWAs CRM RWAs CRM RWAs CRM RWAs CRM RWAs CRM RWAs CRM RWAs CRM RWAs CRM RWAs
£m £m £m £m £m £m £m £m £m £m £m £m £m £m £m £m £m £m £m £m 2016
IRB
Central governments and central banks — — — — — — — — — — 4,698 390 3,775 180 — — — — 8,473 570
Institutions — — 14 9 — — — — — — 7,755 5,893 2,892 2,801 — — — — 10,661 8,703
Corporates — — 95 68 2 2 — — 17 32 15,948 6,692 10,280 5,078 — — — — 26,342 11,872
Specialised lending — — 75 52 — — — — — — 239 156 1,968 1,491 — — — — 2,282 1,699 SME — — 3 3 1 1 — — — — 117 95 86 76 — — — — 207 175 Other corporate — — 17 13 1 1 — — 17 32 15,592 6,441 8,226 3,511 — — — — 23,853 9,998 Securitisation positions — — — — — — — — — — 342 53 802 292 — — — — 1,144 345
Total IRB — — 109 77 2 2 — — 17 32 28,743 13,028 17,749 8,351 — — — — 46,620 21,490
STD
Government and
multilateral institutions (1) — — — — — — — — — — 1,291 1 1,316 9 — — — — 2,607 10
Institutions — — — — — — — — — — 3,389 218 501 90 — — — — 3,890 308
Corporates — — — — — — 14 14 — — 860 816 329 279 — — — — 1,203 1,109
Retail — — — — — — 8 6 — — — — — — — — — — 8 6
Past due items — — — — — — 1 1 — — — — 1 1 — — — — 2 2
Total STD — — — — — — 23 21 — — 5,540 1,035 2,147 379 — — — — 7,710 1,435
Total IRB and STD — — 109 77 2 2 23 21 17 32 34,283 14,063 19,896 8,730 — — — — 54,330 22,925
Note: (1) Comprises: central governments or central banks, regional governments or local authorities, administrative bodies and non-commercial undertakings, and multilateral development banks.
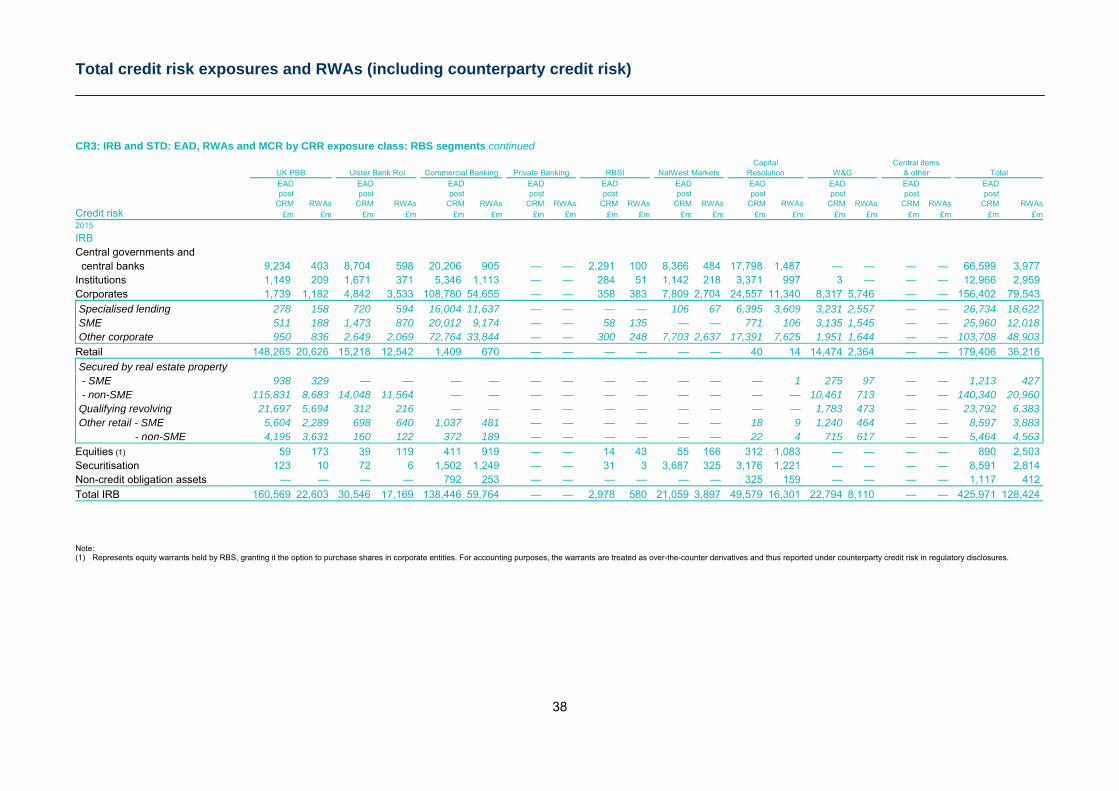
Total credit risk exposures and RWAs (including counterparty credit risk)
38
CR3: IRB and STD: EAD, RWAs and MCR by CRR exposure class: RBS segments continued Capital Central items
UK PBB Ulster Bank RoI Commercial Banking Private Banking RBSI NatWest Markets Resolution W&G & other Total EAD EAD EAD EAD EAD EAD EAD EAD EAD EAD post post post post post post post post post post
Credit risk CRM RWAs CRM RWAs CRM RWAs CRM RWAs CRM RWAs CRM RWAs CRM RWAs CRM RWAs CRM RWAs CRM RWAs
£m £m £m £m £m £m £m £m £m £m £m £m £m £m £m £m £m £m £m £m 2015
IRB Central governments and central banks 9,234 403 8,704 598 20,206 905 — — 2,291 100 8,366 484 17,798 1,487 — — — — 66,599 3,977 Institutions 1,149 209 1,671 371 5,346 1,113 — — 284 51 1,142 218 3,371 997 3 — — — 12,966 2,959 Corporates 1,739 1,182 4,842 3,533 108,780 54,655 — — 358 383 7,809 2,704 24,557 11,340 8,317 5,746 — — 156,402 79,543
Specialised lending 278 158 720 594 16,004 11,637 — — — — 106 67 6,395 3,609 3,231 2,557 — — 26,734 18,622 SME 511 188 1,473 870 20,012 9,174 — — 58 135 — — 771 106 3,135 1,545 — — 25,960 12,018 Other corporate 950 836 2,649 2,069 72,764 33,844 — — 300 248 7,703 2,637 17,391 7,625 1,951 1,644 — — 103,708 48,903 Retail 148,265 20,626 15,218 12,542 1,409 670 — — — — — — 40 14 14,474 2,364 — — 179,406 36,216
Secured by real estate property - SME 938 329 — — — — — — — — — — — 1 275 97 — — 1,213 427 - non-SME 115,831 8,683 14,048 11,564 — — — — — — — — — — 10,461 713 — — 140,340 20,960 Qualifying revolving 21,697 5,694 312 216 — — — — — — — — — — 1,783 473 — — 23,792 6,383 Other retail - SME 5,604 2,289 698 640 1,037 481 — — — — — — 18 9 1,240 464 — — 8,597 3,883 - non-SME 4,195 3,631 160 122 372 189 — — — — — — 22 4 715 617 — — 5,464 4,563 Equities (1) 59 173 39 119 411 919 — — 14 43 55 166 312 1,083 — — — — 890 2,503 Securitisation 123 10 72 6 1,502 1,249 — — 31 3 3,687 325 3,176 1,221 — — — — 8,591 2,814 Non-credit obligation assets — — — — 792 253 — — — — — — 325 159 — — — — 1,117 412
Total IRB 160,569 22,603 30,546 17,169 138,446 59,764 — — 2,978 580 21,059 3,897 49,579 16,301 22,794 8,110 — — 425,971 128,424
Note: (1) Represents equity warrants held by RBS, granting it the option to purchase shares in corporate entities. For accounting purposes, the warrants are treated as over-the-counter derivatives and thus reported under counterparty credit risk in regulatory disclosures.
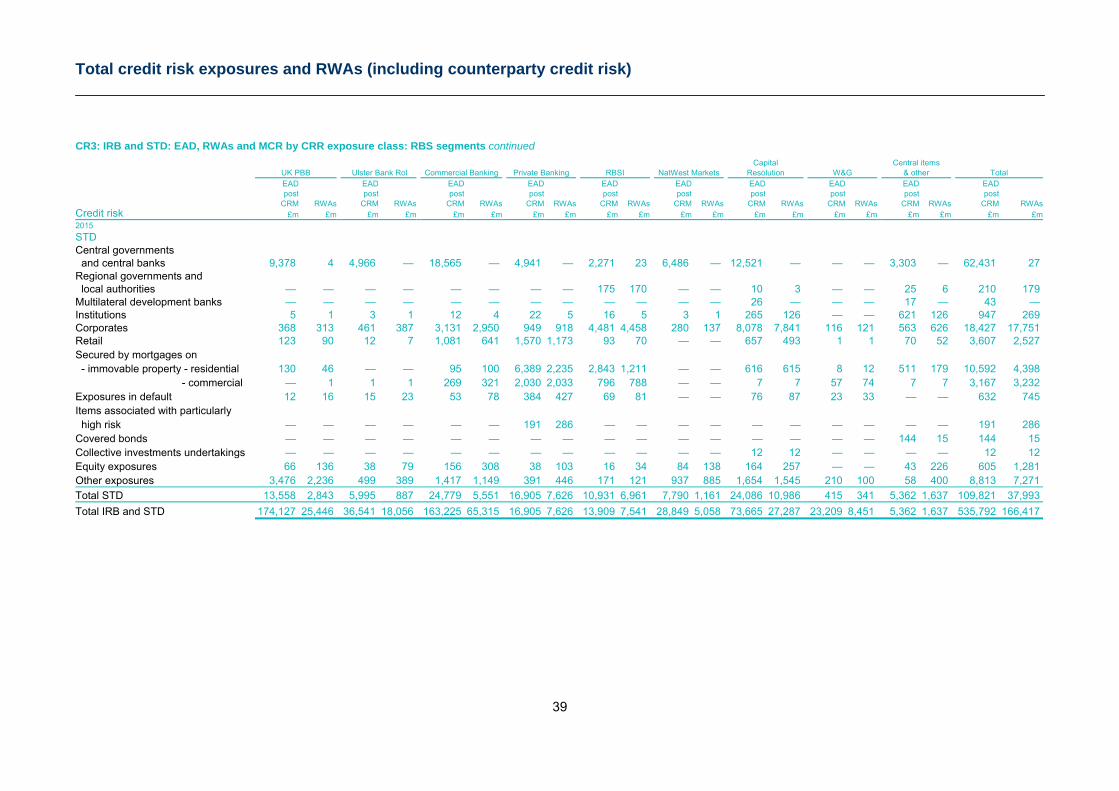
Total credit risk exposures and RWAs (including counterparty credit risk)
39
CR3: IRB and STD: EAD, RWAs and MCR by CRR exposure class: RBS segments continued Capital Central items
UK PBB Ulster Bank RoI Commercial Banking Private Banking RBSI NatWest Markets Resolution W&G & other Total EAD EAD EAD EAD EAD EAD EAD EAD EAD EAD post post post post post post post post post post
Credit risk CRM RWAs CRM RWAs CRM RWAs CRM RWAs CRM RWAs CRM RWAs CRM RWAs CRM RWAs CRM RWAs CRM RWAs
£m £m £m £m £m £m £m £m £m £m £m £m £m £m £m £m £m £m £m £m 2015
STD Central governments and central banks 9,378 4 4,966 — 18,565 — 4,941 — 2,271 23 6,486 — 12,521 — — — 3,303 — 62,431 27 Regional governments and local authorities — — — — — — — — 175 170 — — 10 3 — — 25 6 210 179 Multilateral development banks — — — — — — — — — — — — 26 — — — 17 — 43 — Institutions 5 1 3 1 12 4 22 5 16 5 3 1 265 126 — — 621 126 947 269 Corporates 368 313 461 387 3,131 2,950 949 918 4,481 4,458 280 137 8,078 7,841 116 121 563 626 18,427 17,751 Retail 123 90 12 7 1,081 641 1,570 1,173 93 70 — — 657 493 1 1 70 52 3,607 2,527 Secured by mortgages on - immovable property - residential 130 46 — — 95 100 6,389 2,235 2,843 1,211 — — 616 615 8 12 511 179 10,592 4,398 - commercial — 1 1 1 269 321 2,030 2,033 796 788 — — 7 7 57 74 7 7 3,167 3,232 Exposures in default 12 16 15 23 53 78 384 427 69 81 — — 76 87 23 33 — — 632 745 Items associated with particularly high risk — — — — — — 191 286 — — — — — — — — — — 191 286 Covered bonds — — — — — — — — — — — — — — — — 144 15 144 15 Collective investments undertakings — — — — — — — — — — — — 12 12 — — — — 12 12 Equity exposures 66 136 38 79 156 308 38 103 16 34 84 138 164 257 — — 43 226 605 1,281 Other exposures 3,476 2,236 499 389 1,417 1,149 391 446 171 121 937 885 1,654 1,545 210 100 58 400 8,813 7,271
Total STD 13,558 2,843 5,995 887 24,779 5,551 16,905 7,626 10,931 6,961 7,790 1,161 24,086 10,986 415 341 5,362 1,637 109,821 37,993
Total IRB and STD 174,127 25,446 36,541 18,056 163,225 65,315 16,905 7,626 13,909 7,541 28,849 5,058 73,665 27,287 23,209 8,451 5,362 1,637 535,792 166,417
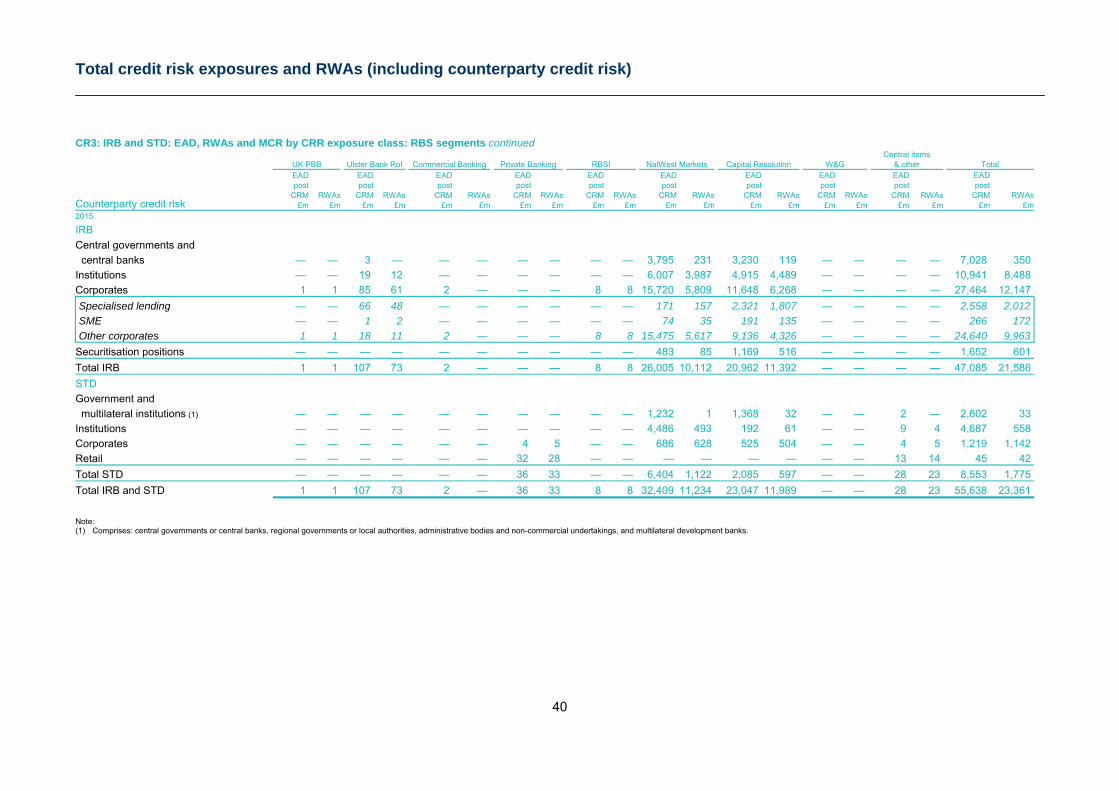
Total credit risk exposures and RWAs (including counterparty credit risk)
40
CR3: IRB and STD: EAD, RWAs and MCR by CRR exposure class: RBS segments continued Central items UK PBB Ulster Bank RoI Commercial Banking Private Banking RBSI NatWest Markets Capital Resolution W&G & other Total EAD EAD EAD EAD EAD EAD EAD EAD EAD EAD post post post post post post post post post post
Counterparty credit risk CRM RWAs CRM RWAs CRM RWAs CRM RWAs CRM RWAs CRM RWAs CRM RWAs CRM RWAs CRM RWAs CRM RWAs
£m £m £m £m £m £m £m £m £m £m £m £m £m £m £m £m £m £m £m £m 2015
IRB
Central governments and central banks — — 3 — — — — — — — 3,795 231 3,230 119 — — — — 7,028 350
Institutions — — 19 12 — — — — — — 6,007 3,987 4,915 4,489 — — — — 10,941 8,488
Corporates 1 1 85 61 2 — — — 8 8 15,720 5,809 11,648 6,268 — — — — 27,464 12,147
Specialised lending — — 66 48 — — — — — — 171 157 2,321 1,807 — — — — 2,558 2,012 SME — — 1 2 — — — — — — 74 35 191 135 — — — — 266 172 Other corporates 1 1 18 11 2 — — — 8 8 15,475 5,617 9,136 4,326 — — — — 24,640 9,963 Securitisation positions — — — — — — — — — — 483 85 1,169 516 — — — — 1,652 601
Total IRB 1 1 107 73 2 — — — 8 8 26,005 10,112 20,962 11,392 — — — — 47,085 21,586
STD
Government and
multilateral institutions (1) — — — — — — — — — — 1,232 1 1,368 32 — — 2 — 2,602 33
Institutions — — — — — — — — — — 4,486 493 192 61 — — 9 4 4,687 558
Corporates — — — — — — 4 5 — — 686 628 525 504 — — 4 5 1,219 1,142
Retail — — — — — — 32 28 — — — — — — — — 13 14 45 42
Total STD — — — — — — 36 33 — — 6,404 1,122 2,085 597 — — 28 23 8,553 1,775
Total IRB and STD 1 1 107 73 2 — 36 33 8 8 32,409 11,234 23,047 11,989 — — 28 23 55,638 23,361
Note: (1) Comprises: central governments or central banks, regional governments or local authorities, administrative bodies and non-commercial undertakings, and multilateral development banks.
Total credit risk exposures and RWAs (including counterparty credit risk)
41
Key points Non-counterparty credit risk UK PBB - EAD post CRM increased 8%, driven by
significant mortgage lending activity. Underwriting standards are constantly monitored to ensure that they remain adequate in the current market environment and were not weakened to sustain the growth observed during the period. The UK unsecured lending portfolio remained stable during the year, with no material changes to asset quality. RWAs remained fairly stable, reflecting the continued low interest rate environment.
Ulster Bank RoI - EAD post CRM for mortgages increased 7%, driven by new mortgage lending and exchange rate movements; offset by asset sales and repayments. RWAs fell 7% as underlying credit metrics continued to benefit from the improving economic environment and higher-risk asset sales.
Commercial Banking - EAD post CRM increased 11% and RWAs increased 10%, driven by new lending to commercial customers aimed at continuing to support the UK and Western Europe business community across a variety of sectors.
RBSI - EAD post CRM increased 19% and RWAs increased
17% reflecting the segment’s growth strategy and risk appetite, mainly within the Funds sector.
NatWest Markets - EAD post CRM increased 6% and RWAs increased 9%, mainly due to an increase in securitisation positions.
Capital Resolution - EAD post CRM fell 40% and RWAs fell 33% as the franchise continued to dispose of non-strategic assets.
Counterparty credit risk NatWest Markets - EAD post CRM increased 6%, mainly
due to exchange rate movements. RWAs increased 25%, primarily reflecting the recent updates to PD estimates to reflect the reduced implied government support for banks.
Capital Resolution - EAD post CRM fell 14% and RWAs fell 27%, driven by the continued roll-off of trades in line with strategy.
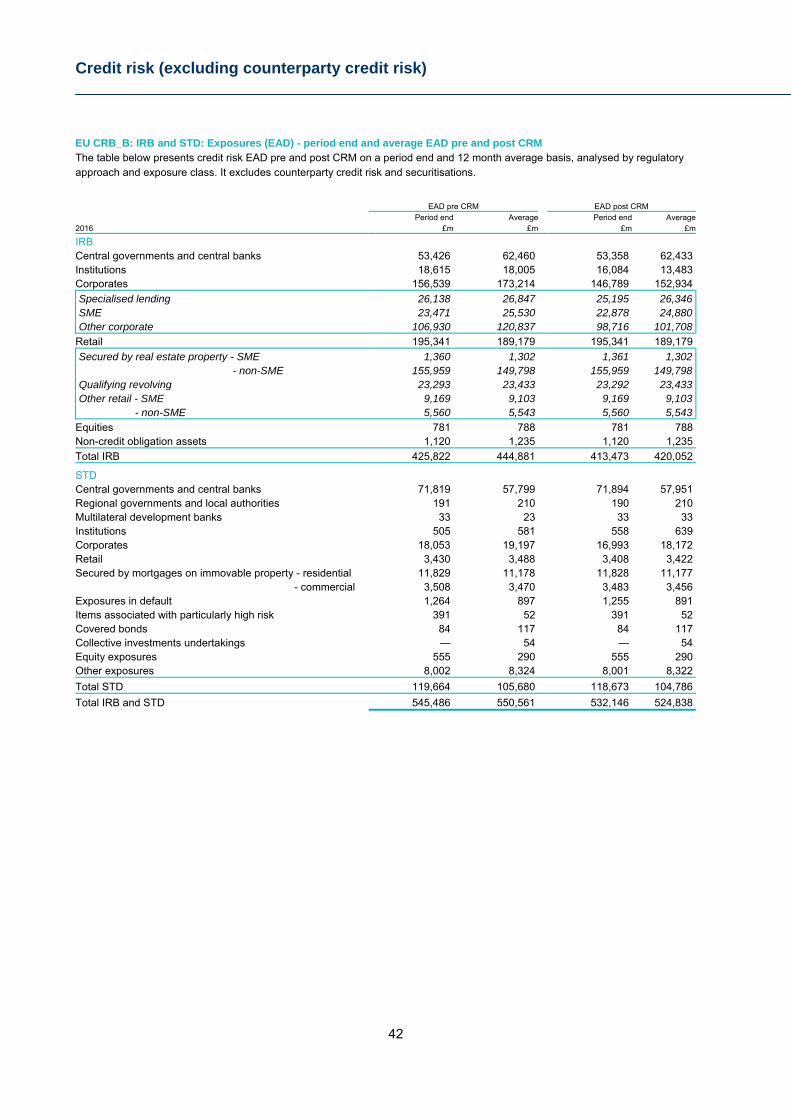
Credit risk (excluding counterparty credit risk)
42
EU CRB_B: IRB and STD: Exposures (EAD) - period end and average EAD pre and post CRM The table below presents credit risk EAD pre and post CRM on a period end and 12 month average basis, analysed by regulatory approach and exposure class. It excludes counterparty credit risk and securitisations.
EAD pre CRM EAD post CRM
2016 Period end Average Period end Average
£m £m £m £m
IRB Central governments and central banks 53,426 62,460 53,358 62,433 Institutions 18,615 18,005 16,084 13,483 Corporates 156,539 173,214 146,789 152,934
Specialised lending 26,138 26,847 25,195 26,346 SME 23,471 25,530 22,878 24,880 Other corporate 106,930 120,837 98,716 101,708 Retail 195,341 189,179 195,341 189,179
Secured by real estate property - SME 1,360 1,302 1,361 1,302 - non-SME 155,959 149,798 155,959 149,798 Qualifying revolving 23,293 23,433 23,292 23,433 Other retail - SME 9,169 9,103 9,169 9,103 - non-SME 5,560 5,543 5,560 5,543 Equities 781 788 781 788 Non-credit obligation assets 1,120 1,235 1,120 1,235
Total IRB 425,822 444,881 413,473 420,052
STD Central governments and central banks 71,819 57,799 71,894 57,951 Regional governments and local authorities 191 210 190 210 Multilateral development banks 33 23 33 33 Institutions 505 581 558 639 Corporates 18,053 19,197 16,993 18,172 Retail 3,430 3,488 3,408 3,422 Secured by mortgages on immovable property - residential 11,829 11,178 11,828 11,177 - commercial 3,508 3,470 3,483 3,456 Exposures in default 1,264 897 1,255 891 Items associated with particularly high risk 391 52 391 52 Covered bonds 84 117 84 117 Collective investments undertakings — 54 — 54 Equity exposures 555 290 555 290 Other exposures 8,002 8,324 8,001 8,322
Total STD 119,664 105,680 118,673 104,786
Total IRB and STD 545,486 550,561 532,146 524,838
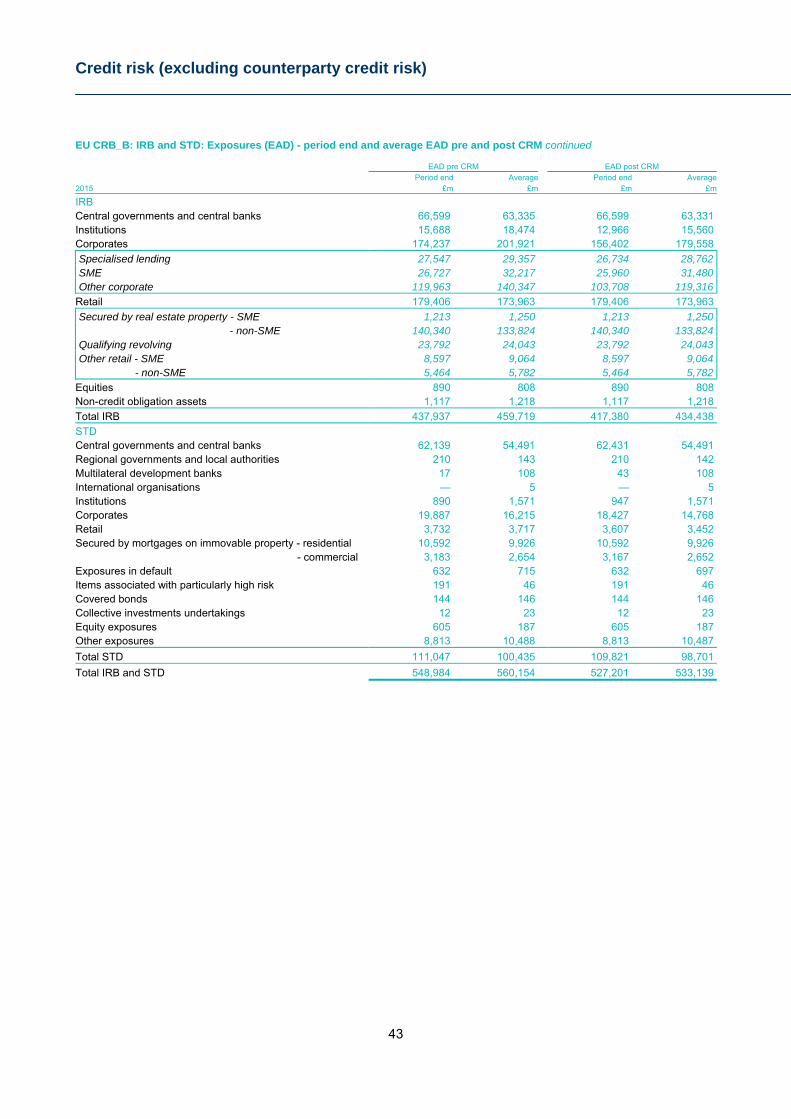
Credit risk (excluding counterparty credit risk)
43
EU CRB_B: IRB and STD: Exposures (EAD) - period end and average EAD pre and post CRM continued
EAD pre CRM EAD post CRM
2015 Period end Average Period end Average
£m £m £m £m
IRB
Central governments and central banks 66,599 63,335 66,599 63,331 Institutions 15,688 18,474 12,966 15,560 Corporates 174,237 201,921 156,402 179,558
Specialised lending 27,547 29,357 26,734 28,762 SME 26,727 32,217 25,960 31,480 Other corporate 119,963 140,347 103,708 119,316 Retail 179,406 173,963 179,406 173,963
Secured by real estate property - SME 1,213 1,250 1,213 1,250 - non-SME 140,340 133,824 140,340 133,824 Qualifying revolving 23,792 24,043 23,792 24,043 Other retail - SME 8,597 9,064 8,597 9,064 - non-SME 5,464 5,782 5,464 5,782 Equities 890 808 890 808 Non-credit obligation assets 1,117 1,218 1,117 1,218
Total IRB 437,937 459,719 417,380 434,438
STD Central governments and central banks 62,139 54,491 62,431 54,491 Regional governments and local authorities 210 143 210 142 Multilateral development banks 17 108 43 108 International organisations — 5 — 5 Institutions 890 1,571 947 1,571 Corporates 19,887 16,215 18,427 14,768 Retail 3,732 3,717 3,607 3,452 Secured by mortgages on immovable property - residential 10,592 9,926 10,592 9,926 - commercial 3,183 2,654 3,167 2,652 Exposures in default 632 715 632 697 Items associated with particularly high risk 191 46 191 46 Covered bonds 144 146 144 146 Collective investments undertakings 12 23 12 23 Equity exposures 605 187 605 187 Other exposures 8,813 10,488 8,813 10,487
Total STD 111,047 100,435 109,821 98,701
Total IRB and STD 548,984 560,154 527,201 533,139
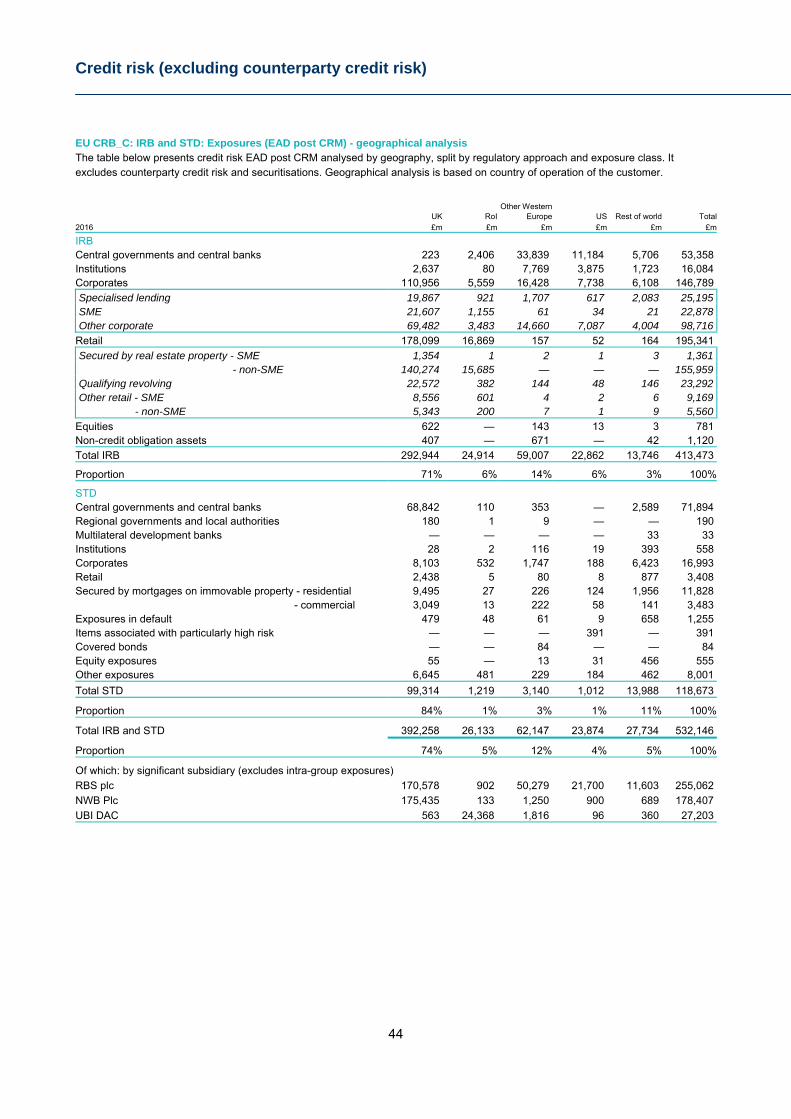
Credit risk (excluding counterparty credit risk)
44
EU CRB_C: IRB and STD: Exposures (EAD post CRM) - geographical analysis The table below presents credit risk EAD post CRM analysed by geography, split by regulatory approach and exposure class. It excludes counterparty credit risk and securitisations. Geographical analysis is based on country of operation of the customer.
Other Western
2016 UK RoI Europe US Rest of world Total£m £m £m £m £m £m
IRB
Central governments and central banks 223 2,406 33,839 11,184 5,706 53,358 Institutions 2,637 80 7,769 3,875 1,723 16,084 Corporates 110,956 5,559 16,428 7,738 6,108 146,789
Specialised lending 19,867 921 1,707 617 2,083 25,195 SME 21,607 1,155 61 34 21 22,878 Other corporate 69,482 3,483 14,660 7,087 4,004 98,716 Retail 178,099 16,869 157 52 164 195,341
Secured by real estate property - SME 1,354 1 2 1 3 1,361 - non-SME 140,274 15,685 — — — 155,959 Qualifying revolving 22,572 382 144 48 146 23,292 Other retail - SME 8,556 601 4 2 6 9,169 - non-SME 5,343 200 7 1 9 5,560 Equities 622 — 143 13 3 781 Non-credit obligation assets 407 — 671 — 42 1,120
Total IRB 292,944 24,914 59,007 22,862 13,746 413,473
Proportion 71% 6% 14% 6% 3% 100%
STD Central governments and central banks 68,842 110 353 — 2,589 71,894 Regional governments and local authorities 180 1 9 — — 190 Multilateral development banks — — — — 33 33 Institutions 28 2 116 19 393 558 Corporates 8,103 532 1,747 188 6,423 16,993 Retail 2,438 5 80 8 877 3,408 Secured by mortgages on immovable property - residential 9,495 27 226 124 1,956 11,828 - commercial 3,049 13 222 58 141 3,483 Exposures in default 479 48 61 9 658 1,255 Items associated with particularly high risk — — — 391 — 391 Covered bonds — — 84 — — 84 Equity exposures 55 — 13 31 456 555 Other exposures 6,645 481 229 184 462 8,001
Total STD 99,314 1,219 3,140 1,012 13,988 118,673
Proportion 84% 1% 3% 1% 11% 100%
Total IRB and STD 392,258 26,133 62,147 23,874 27,734 532,146
Proportion 74% 5% 12% 4% 5% 100%
Of which: by significant subsidiary (excludes intra-group exposures)
RBS plc 170,578 902 50,279 21,700 11,603 255,062
NWB Plc 175,435 133 1,250 900 689 178,407
UBI DAC 563 24,368 1,816 96 360 27,203
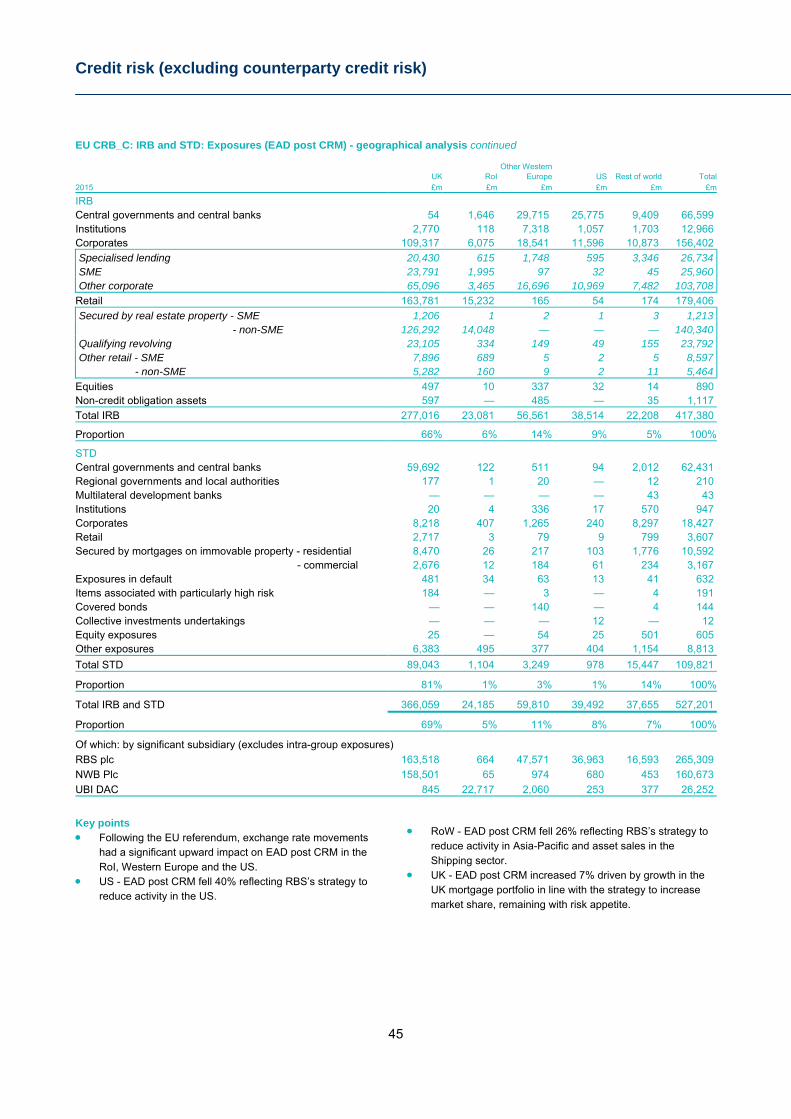
Credit risk (excluding counterparty credit risk)
45
EU CRB_C: IRB and STD: Exposures (EAD post CRM) - geographical analysis continued
Other Western
2015 UK RoI Europe US Rest of world Total£m £m £m £m £m £m
IRB
Central governments and central banks 54 1,646 29,715 25,775 9,409 66,599 Institutions 2,770 118 7,318 1,057 1,703 12,966 Corporates 109,317 6,075 18,541 11,596 10,873 156,402
Specialised lending 20,430 615 1,748 595 3,346 26,734 SME 23,791 1,995 97 32 45 25,960 Other corporate 65,096 3,465 16,696 10,969 7,482 103,708 Retail 163,781 15,232 165 54 174 179,406
Secured by real estate property - SME 1,206 1 2 1 3 1,213 - non-SME 126,292 14,048 — — — 140,340 Qualifying revolving 23,105 334 149 49 155 23,792 Other retail - SME 7,896 689 5 2 5 8,597 - non-SME 5,282 160 9 2 11 5,464 Equities 497 10 337 32 14 890 Non-credit obligation assets 597 — 485 — 35 1,117
Total IRB 277,016 23,081 56,561 38,514 22,208 417,380
Proportion 66% 6% 14% 9% 5% 100%
STD Central governments and central banks 59,692 122 511 94 2,012 62,431 Regional governments and local authorities 177 1 20 — 12 210 Multilateral development banks — — — — 43 43 Institutions 20 4 336 17 570 947 Corporates 8,218 407 1,265 240 8,297 18,427 Retail 2,717 3 79 9 799 3,607 Secured by mortgages on immovable property - residential 8,470 26 217 103 1,776 10,592 - commercial 2,676 12 184 61 234 3,167 Exposures in default 481 34 63 13 41 632 Items associated with particularly high risk 184 — 3 — 4 191 Covered bonds — — 140 — 4 144 Collective investments undertakings — — — 12 — 12 Equity exposures 25 — 54 25 501 605 Other exposures 6,383 495 377 404 1,154 8,813
Total STD 89,043 1,104 3,249 978 15,447 109,821
Proportion 81% 1% 3% 1% 14% 100%
Total IRB and STD 366,059 24,185 59,810 39,492 37,655 527,201
Proportion 69% 5% 11% 8% 7% 100%
Of which: by significant subsidiary (excludes intra-group exposures)
RBS plc 163,518 664 47,571 36,963 16,593 265,309
NWB Plc 158,501 65 974 680 453 160,673
UBI DAC 845 22,717 2,060 253 377 26,252
Key points Following the EU referendum, exchange rate movements
had a significant upward impact on EAD post CRM in the RoI, Western Europe and the US.
US - EAD post CRM fell 40% reflecting RBS’s strategy to reduce activity in the US.
RoW - EAD post CRM fell 26% reflecting RBS’s strategy to
reduce activity in Asia-Pacific and asset sales in the Shipping sector.
UK - EAD post CRM increased 7% driven by growth in the UK mortgage portfolio in line with the strategy to increase market share, remaining with risk appetite.
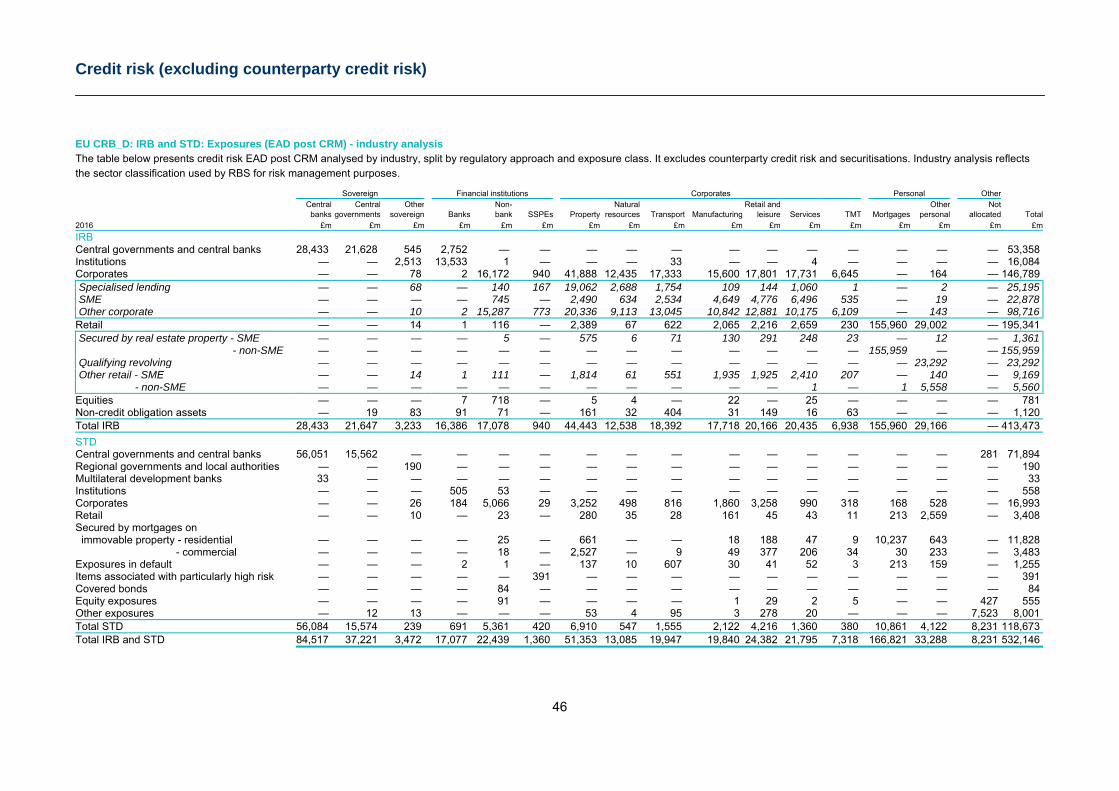
Credit risk (excluding counterparty credit risk)
46
EU CRB_D: IRB and STD: Exposures (EAD post CRM) - industry analysis The table below presents credit risk EAD post CRM analysed by industry, split by regulatory approach and exposure class. It excludes counterparty credit risk and securitisations. Industry analysis reflects the sector classification used by RBS for risk management purposes. Sovereign Financial institutions Corporates Personal Other Central Central Other Non- Natural Retail and Other Not
2016 banks governments sovereign Banks bank SSPEs Property resources Transport Manufacturing leisure Services TMT Mortgages personal allocated Total
£m £m £m £m £m £m £m £m £m £m £m £m £m £m £m £m £m
IRB
Central governments and central banks 28,433 21,628 545 2,752 — — — — — — — — — — — — 53,358 Institutions — — 2,513 13,533 1 — — — 33 — — 4 — — — — 16,084 Corporates — — 78 2 16,172 940 41,888 12,435 17,333 15,600 17,801 17,731 6,645 — 164 — 146,789 Specialised lending — — 68 — 140 167 19,062 2,688 1,754 109 144 1,060 1 — 2 — 25,195 SME — — — — 745 — 2,490 634 2,534 4,649 4,776 6,496 535 — 19 — 22,878 Other corporate — — 10 2 15,287 773 20,336 9,113 13,045 10,842 12,881 10,175 6,109 — 143 — 98,716 Retail — — 14 1 116 — 2,389 67 622 2,065 2,216 2,659 230 155,960 29,002 — 195,341 Secured by real estate property - SME — — — — 5 — 575 6 71 130 291 248 23 — 12 — 1,361 - non-SME — — — — — — — — — — — — — 155,959 — — 155,959 Qualifying revolving — — — — — — — — — — — — — — 23,292 — 23,292 Other retail - SME — — 14 1 111 — 1,814 61 551 1,935 1,925 2,410 207 — 140 — 9,169 - non-SME — — — — — — — — — — — 1 — 1 5,558 — 5,560 Equities — — — 7 718 — 5 4 — 22 — 25 — — — — 781 Non-credit obligation assets — 19 83 91 71 — 161 32 404 31 149 16 63 — — — 1,120 Total IRB 28,433 21,647 3,233 16,386 17,078 940 44,443 12,538 18,392 17,718 20,166 20,435 6,938 155,960 29,166 — 413,473
STD Central governments and central banks 56,051 15,562 — — — — — — — — — — — — — 281 71,894 Regional governments and local authorities — — 190 — — — — — — — — — — — — — 190 Multilateral development banks 33 — — — — — — — — — — — — — — — 33 Institutions — — — 505 53 — — — — — — — — — — — 558 Corporates — — 26 184 5,066 29 3,252 498 816 1,860 3,258 990 318 168 528 — 16,993 Retail — — 10 — 23 — 280 35 28 161 45 43 11 213 2,559 — 3,408 Secured by mortgages on immovable property - residential — — — — 25 — 661 — — 18 188 47 9 10,237 643 — 11,828 - commercial — — — — 18 — 2,527 — 9 49 377 206 34 30 233 — 3,483 Exposures in default — — — 2 1 — 137 10 607 30 41 52 3 213 159 — 1,255 Items associated with particularly high risk — — — — — 391 — — — — — — — — — — 391 Covered bonds — — — — 84 — — — — — — — — — — — 84 Equity exposures — — — — 91 — — — — 1 29 2 5 — — 427 555 Other exposures — 12 13 — — — 53 4 95 3 278 20 — — — 7,523 8,001 Total STD 56,084 15,574 239 691 5,361 420 6,910 547 1,555 2,122 4,216 1,360 380 10,861 4,122 8,231 118,673 Total IRB and STD 84,517 37,221 3,472 17,077 22,439 1,360 51,353 13,085 19,947 19,840 24,382 21,795 7,318 166,821 33,288 8,231 532,146
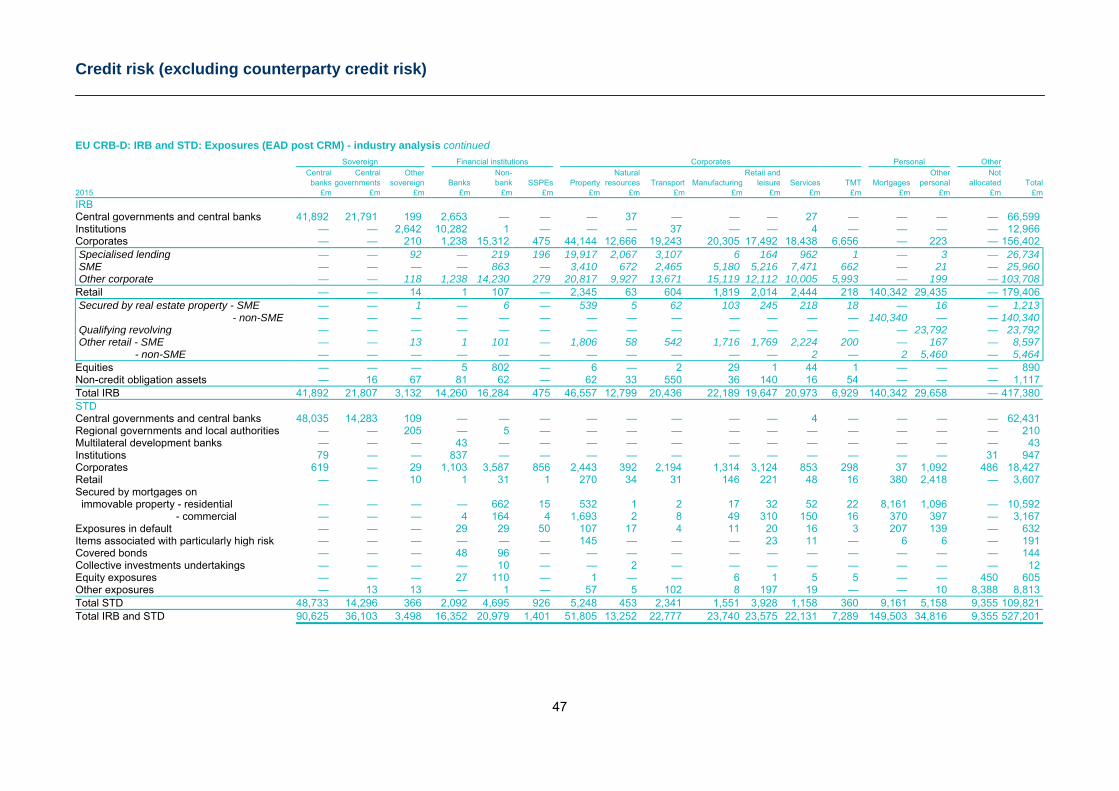
Credit risk (excluding counterparty credit risk)
47
EU CRB-D: IRB and STD: Exposures (EAD post CRM) - industry analysis continued Sovereign Financial institutions Corporates Personal Other Central Central Other Non- Natural Retail and Other Not banks governments sovereign Banks bank SSPEs Property resources Transport Manufacturing leisure Services TMT Mortgages personal allocated Total2015 £m £m £m £m £m £m £m £m £m £m £m £m £m £m £m £m £m
IRB
Central governments and central banks 41,892 21,791 199 2,653 — — — 37 — — — 27 — — — — 66,599 Institutions — — 2,642 10,282 1 — — — 37 — — 4 — — — — 12,966 Corporates — — 210 1,238 15,312 475 44,144 12,666 19,243 20,305 17,492 18,438 6,656 — 223 — 156,402 Specialised lending — — 92 — 219 196 19,917 2,067 3,107 6 164 962 1 — 3 — 26,734 SME — — — — 863 — 3,410 672 2,465 5,180 5,216 7,471 662 — 21 — 25,960 Other corporate — — 118 1,238 14,230 279 20,817 9,927 13,671 15,119 12,112 10,005 5,993 — 199 — 103,708 Retail — — 14 1 107 — 2,345 63 604 1,819 2,014 2,444 218 140,342 29,435 — 179,406 Secured by real estate property - SME — — 1 — 6 — 539 5 62 103 245 218 18 — 16 — 1,213 - non-SME — — — — — — — — — — — — — 140,340 — — 140,340 Qualifying revolving — — — — — — — — — — — — — — 23,792 — 23,792 Other retail - SME — — 13 1 101 — 1,806 58 542 1,716 1,769 2,224 200 — 167 — 8,597 - non-SME — — — — — — — — — — — 2 — 2 5,460 — 5,464 Equities — — — 5 802 — 6 — 2 29 1 44 1 — — — 890 Non-credit obligation assets — 16 67 81 62 — 62 33 550 36 140 16 54 — — — 1,117 Total IRB 41,892 21,807 3,132 14,260 16,284 475 46,557 12,799 20,436 22,189 19,647 20,973 6,929 140,342 29,658 — 417,380 STD Central governments and central banks 48,035 14,283 109 — — — — — — — — 4 — — — — 62,431 Regional governments and local authorities — — 205 — 5 — — — — — — — — — — — 210 Multilateral development banks — — — 43 — — — — — — — — — — — — 43 Institutions 79 — — 837 — — — — — — — — — — — 31 947 Corporates 619 — 29 1,103 3,587 856 2,443 392 2,194 1,314 3,124 853 298 37 1,092 486 18,427 Retail — — 10 1 31 1 270 34 31 146 221 48 16 380 2,418 — 3,607 Secured by mortgages on immovable property - residential — — — — 662 15 532 1 2 17 32 52 22 8,161 1,096 — 10,592 - commercial — — — 4 164 4 1,693 2 8 49 310 150 16 370 397 — 3,167 Exposures in default — — — 29 29 50 107 17 4 11 20 16 3 207 139 — 632 Items associated with particularly high risk — — — — — — 145 — — — 23 11 — 6 6 — 191 Covered bonds — — — 48 96 — — — — — — — — — — — 144 Collective investments undertakings — — — — 10 — — 2 — — — — — — — — 12 Equity exposures — — — 27 110 — 1 — — 6 1 5 5 — — 450 605 Other exposures — 13 13 — 1 — 57 5 102 8 197 19 — — 10 8,388 8,813 Total STD 48,733 14,296 366 2,092 4,695 926 5,248 453 2,341 1,551 3,928 1,158 360 9,161 5,158 9,355 109,821 Total IRB and STD 90,625 36,103 3,498 16,352 20,979 1,401 51,805 13,252 22,777 23,740 23,575 22,131 7,289 149,503 34,816 9,355 527,201
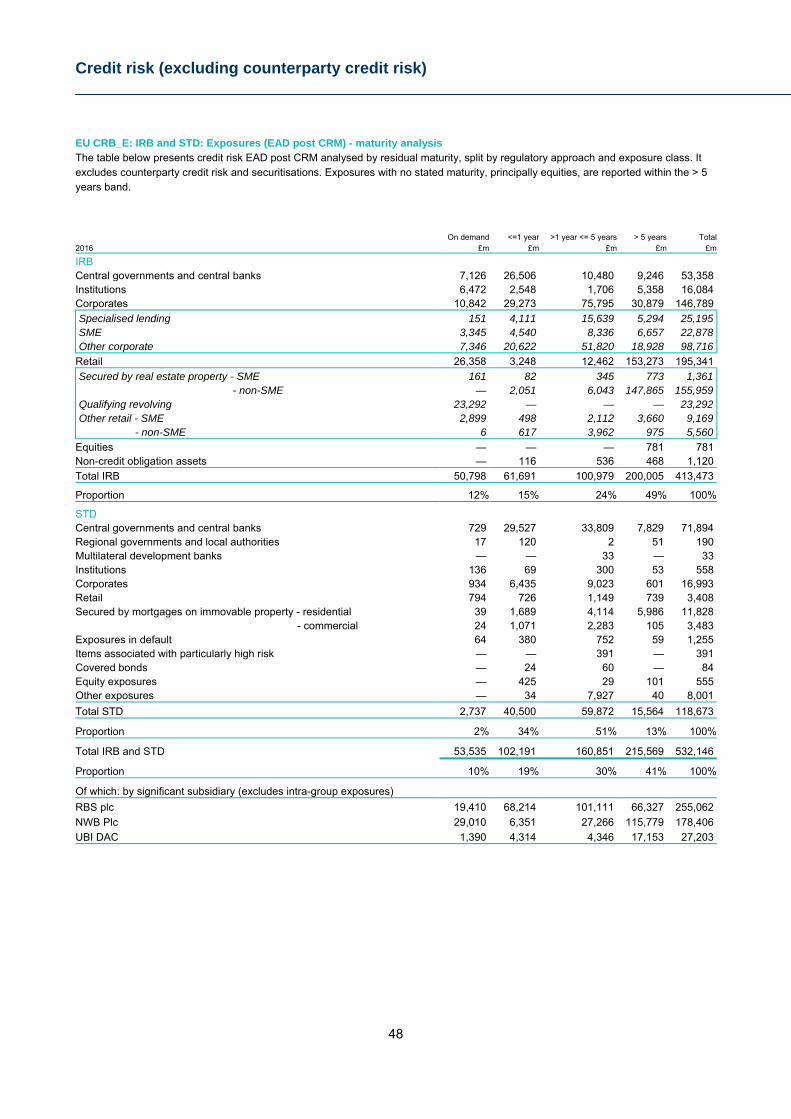
Credit risk (excluding counterparty credit risk)
48
EU CRB_E: IRB and STD: Exposures (EAD post CRM) - maturity analysis The table below presents credit risk EAD post CRM analysed by residual maturity, split by regulatory approach and exposure class. It excludes counterparty credit risk and securitisations. Exposures with no stated maturity, principally equities, are reported within the > 5 years band.
2016 On demand <=1 year >1 year <= 5 years > 5 years Total
£m £m £m £m £m
IRB
Central governments and central banks 7,126 26,506 10,480 9,246 53,358 Institutions 6,472 2,548 1,706 5,358 16,084 Corporates 10,842 29,273 75,795 30,879 146,789
Specialised lending 151 4,111 15,639 5,294 25,195 SME 3,345 4,540 8,336 6,657 22,878 Other corporate 7,346 20,622 51,820 18,928 98,716 Retail 26,358 3,248 12,462 153,273 195,341
Secured by real estate property - SME 161 82 345 773 1,361 - non-SME — 2,051 6,043 147,865 155,959 Qualifying revolving 23,292 — — — 23,292 Other retail - SME 2,899 498 2,112 3,660 9,169 - non-SME 6 617 3,962 975 5,560 Equities — — — 781 781 Non-credit obligation assets — 116 536 468 1,120
Total IRB 50,798 61,691 100,979 200,005 413,473
Proportion 12% 15% 24% 49% 100%
STD Central governments and central banks 729 29,527 33,809 7,829 71,894 Regional governments and local authorities 17 120 2 51 190 Multilateral development banks — — 33 — 33 Institutions 136 69 300 53 558 Corporates 934 6,435 9,023 601 16,993 Retail 794 726 1,149 739 3,408 Secured by mortgages on immovable property - residential 39 1,689 4,114 5,986 11,828 - commercial 24 1,071 2,283 105 3,483 Exposures in default 64 380 752 59 1,255 Items associated with particularly high risk — — 391 — 391 Covered bonds — 24 60 — 84 Equity exposures — 425 29 101 555 Other exposures — 34 7,927 40 8,001
Total STD 2,737 40,500 59,872 15,564 118,673
Proportion 2% 34% 51% 13% 100%
Total IRB and STD 53,535 102,191 160,851 215,569 532,146
Proportion 10% 19% 30% 41% 100%
Of which: by significant subsidiary (excludes intra-group exposures) RBS plc 19,410 68,214 101,111 66,327 255,062
NWB Plc 29,010 6,351 27,266 115,779 178,406
UBI DAC 1,390 4,314 4,346 17,153 27,203
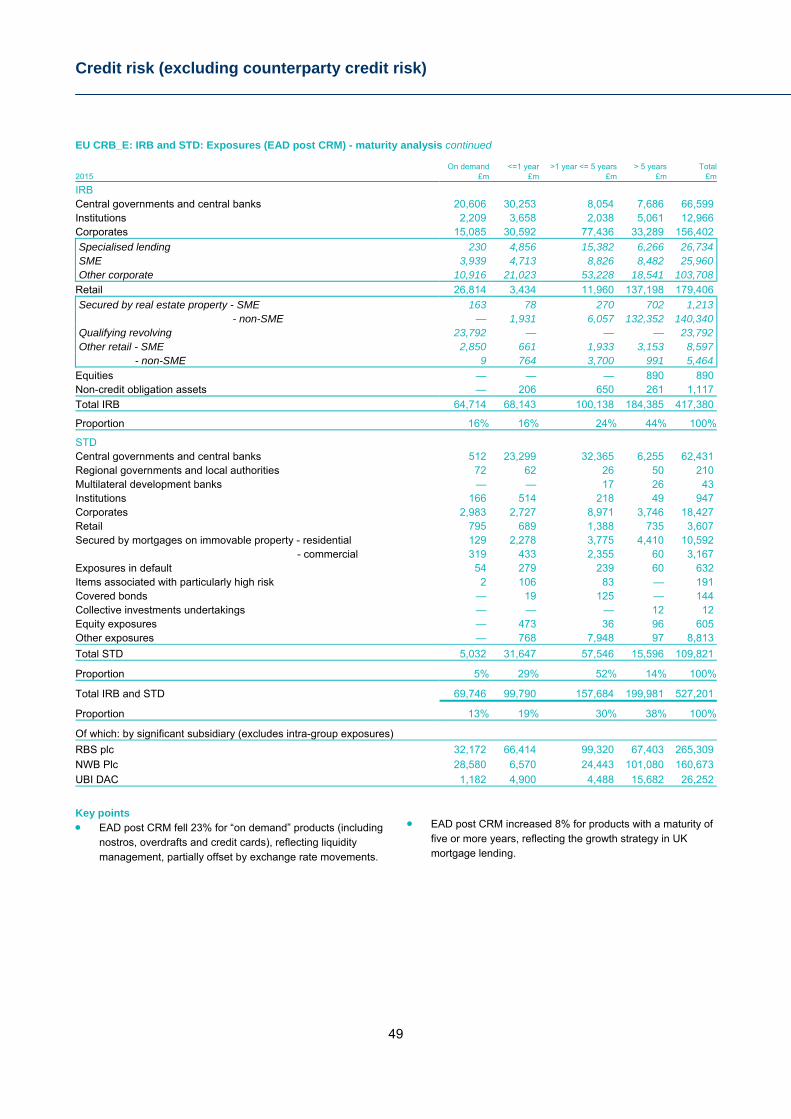
Credit risk (excluding counterparty credit risk)
49
EU CRB_E: IRB and STD: Exposures (EAD post CRM) - maturity analysis continued
2015 On demand <=1 year >1 year <= 5 years > 5 years Total
£m £m £m £m £m
IRB
Central governments and central banks 20,606 30,253 8,054 7,686 66,599 Institutions 2,209 3,658 2,038 5,061 12,966 Corporates 15,085 30,592 77,436 33,289 156,402
Specialised lending 230 4,856 15,382 6,266 26,734 SME 3,939 4,713 8,826 8,482 25,960 Other corporate 10,916 21,023 53,228 18,541 103,708 Retail 26,814 3,434 11,960 137,198 179,406
Secured by real estate property - SME 163 78 270 702 1,213 - non-SME — 1,931 6,057 132,352 140,340 Qualifying revolving 23,792 — — — 23,792 Other retail - SME 2,850 661 1,933 3,153 8,597 - non-SME 9 764 3,700 991 5,464 Equities — — — 890 890 Non-credit obligation assets — 206 650 261 1,117
Total IRB 64,714 68,143 100,138 184,385 417,380
Proportion 16% 16% 24% 44% 100%
STD Central governments and central banks 512 23,299 32,365 6,255 62,431 Regional governments and local authorities 72 62 26 50 210 Multilateral development banks — — 17 26 43 Institutions 166 514 218 49 947 Corporates 2,983 2,727 8,971 3,746 18,427 Retail 795 689 1,388 735 3,607 Secured by mortgages on immovable property - residential 129 2,278 3,775 4,410 10,592 - commercial 319 433 2,355 60 3,167 Exposures in default 54 279 239 60 632 Items associated with particularly high risk 2 106 83 — 191 Covered bonds — 19 125 — 144 Collective investments undertakings — — — 12 12 Equity exposures — 473 36 96 605 Other exposures — 768 7,948 97 8,813
Total STD 5,032 31,647 57,546 15,596 109,821
Proportion 5% 29% 52% 14% 100%
Total IRB and STD 69,746 99,790 157,684 199,981 527,201
Proportion 13% 19% 30% 38% 100%
Of which: by significant subsidiary (excludes intra-group exposures) RBS plc 32,172 66,414 99,320 67,403 265,309
NWB Plc 28,580 6,570 24,443 101,080 160,673
UBI DAC 1,182 4,900 4,488 15,682 26,252
Key points EAD post CRM fell 23% for “on demand” products (including
nostros, overdrafts and credit cards), reflecting liquidity management, partially offset by exchange rate movements.
EAD post CRM increased 8% for products with a maturity of
five or more years, reflecting the growth strategy in UK mortgage lending.
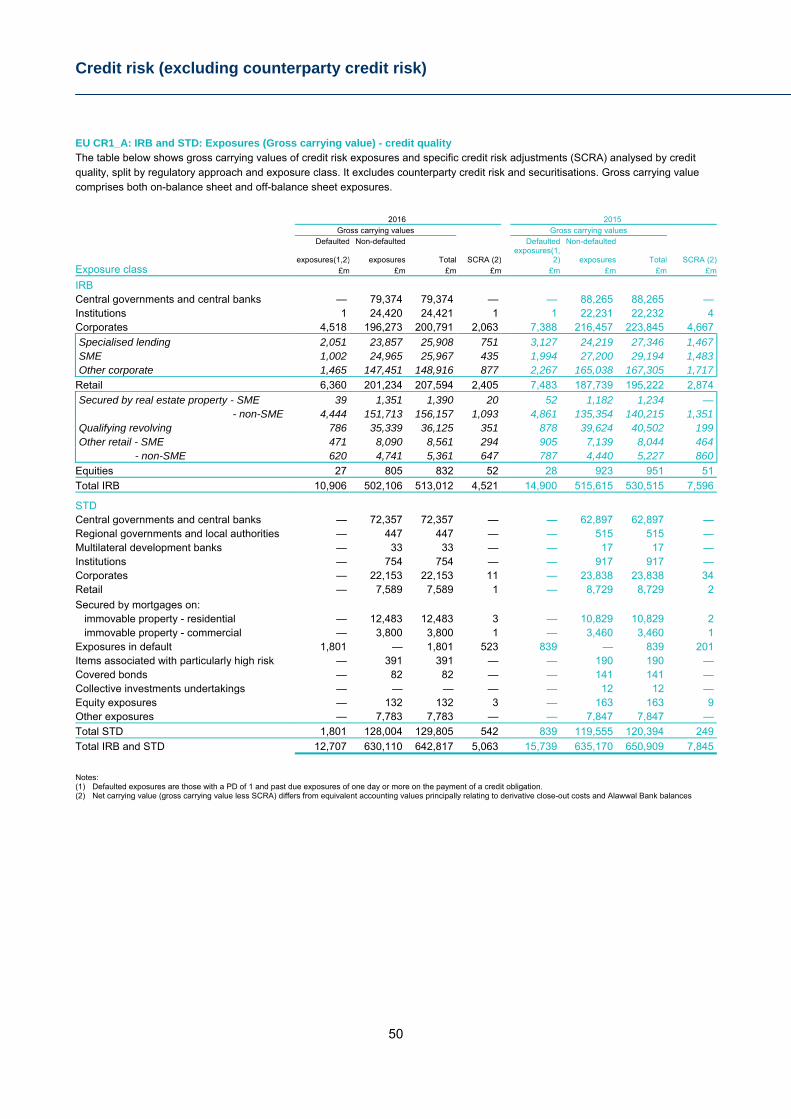
Credit risk (excluding counterparty credit risk)
50
EU CR1_A: IRB and STD: Exposures (Gross carrying value) - credit quality The table below shows gross carrying values of credit risk exposures and specific credit risk adjustments (SCRA) analysed by credit quality, split by regulatory approach and exposure class. It excludes counterparty credit risk and securitisations. Gross carrying value comprises both on-balance sheet and off-balance sheet exposures.
2016 2015 Gross carrying values Gross carrying values Defaulted Non-defaulted Defaulted Non-defaulted
Exposure class exposures(1,2) exposures Total SCRA (2)
exposures(1,2) exposures Total SCRA (2)
£m £m £m £m £m £m £m £m
IRB
Central governments and central banks — 79,374 79,374 — — 88,265 88,265 — Institutions 1 24,420 24,421 1 1 22,231 22,232 4 Corporates 4,518 196,273 200,791 2,063 7,388 216,457 223,845 4,667
Specialised lending 2,051 23,857 25,908 751 3,127 24,219 27,346 1,467 SME 1,002 24,965 25,967 435 1,994 27,200 29,194 1,483 Other corporate 1,465 147,451 148,916 877 2,267 165,038 167,305 1,717 Retail 6,360 201,234 207,594 2,405 7,483 187,739 195,222 2,874
Secured by real estate property - SME 39 1,351 1,390 20 52 1,182 1,234 — - non-SME 4,444 151,713 156,157 1,093 4,861 135,354 140,215 1,351 Qualifying revolving 786 35,339 36,125 351 878 39,624 40,502 199 Other retail - SME 471 8,090 8,561 294 905 7,139 8,044 464 - non-SME 620 4,741 5,361 647 787 4,440 5,227 860 Equities 27 805 832 52 28 923 951 51
Total IRB 10,906 502,106 513,012 4,521 14,900 515,615 530,515 7,596
STD Central governments and central banks — 72,357 72,357 — — 62,897 62,897 — Regional governments and local authorities — 447 447 — — 515 515 — Multilateral development banks — 33 33 — — 17 17 — Institutions — 754 754 — — 917 917 — Corporates — 22,153 22,153 11 — 23,838 23,838 34 Retail — 7,589 7,589 1 — 8,729 8,729 2
Secured by mortgages on: immovable property - residential — 12,483 12,483 3 — 10,829 10,829 2 immovable property - commercial — 3,800 3,800 1 — 3,460 3,460 1 Exposures in default 1,801 — 1,801 523 839 — 839 201 Items associated with particularly high risk — 391 391 — — 190 190 — Covered bonds — 82 82 — — 141 141 — Collective investments undertakings — — — — — 12 12 — Equity exposures — 132 132 3 — 163 163 9 Other exposures — 7,783 7,783 — — 7,847 7,847 —
Total STD 1,801 128,004 129,805 542 839 119,555 120,394 249
Total IRB and STD 12,707 630,110 642,817 5,063 15,739 635,170 650,909 7,845
Notes: (1) Defaulted exposures are those with a PD of 1 and past due exposures of one day or more on the payment of a credit obligation. (2) Net carrying value (gross carrying value less SCRA) differs from equivalent accounting values principally relating to derivative close-out costs and Alawwal Bank balances
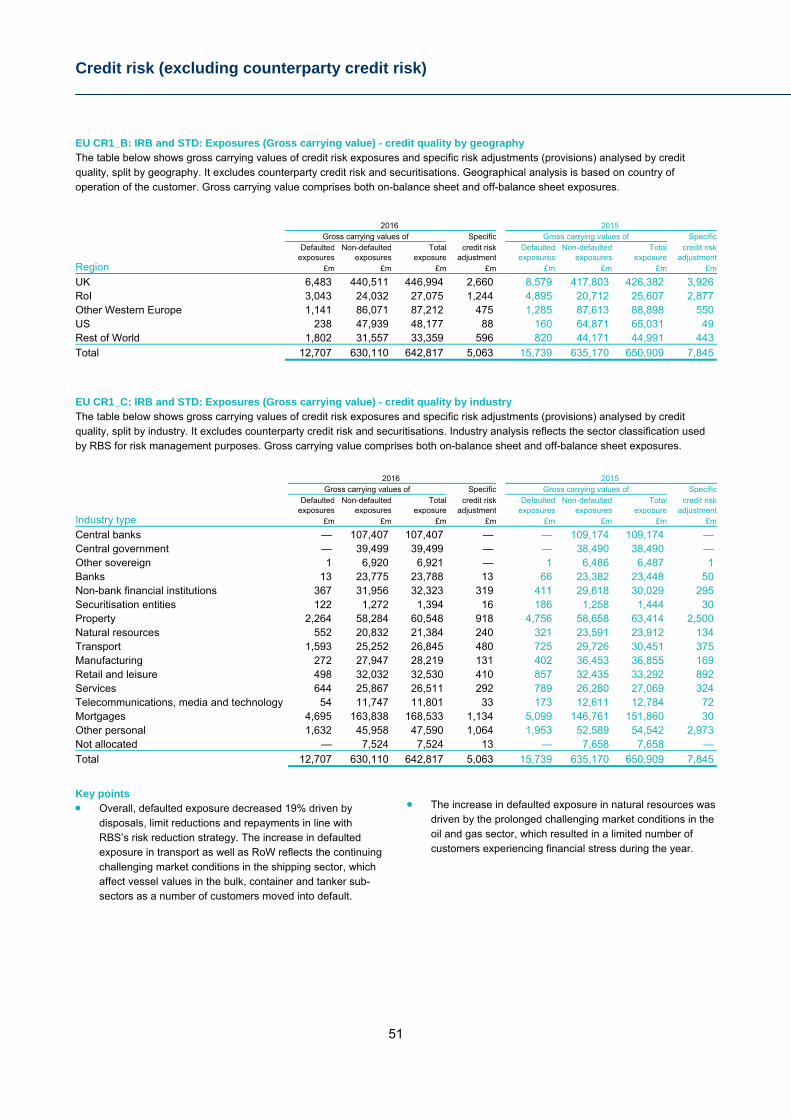
Credit risk (excluding counterparty credit risk)
51
EU CR1_B: IRB and STD: Exposures (Gross carrying value) - credit quality by geography The table below shows gross carrying values of credit risk exposures and specific risk adjustments (provisions) analysed by credit quality, split by geography. It excludes counterparty credit risk and securitisations. Geographical analysis is based on country of operation of the customer. Gross carrying value comprises both on-balance sheet and off-balance sheet exposures.
2016 2015 Gross carrying values of Specific Gross carrying values of Specific Defaulted Non-defaulted Total credit risk Defaulted Non-defaulted Total credit risk
Region exposures exposures exposure adjustment exposures exposures exposure adjustment
£m £m £m £m £m £m £m £m
UK 6,483 440,511 446,994 2,660 8,579 417,803 426,382 3,926 RoI 3,043 24,032 27,075 1,244 4,895 20,712 25,607 2,877 Other Western Europe 1,141 86,071 87,212 475 1,285 87,613 88,898 550 US 238 47,939 48,177 88 160 64,871 65,031 49 Rest of World 1,802 31,557 33,359 596 820 44,171 44,991 443
Total 12,707 630,110 642,817 5,063 15,739 635,170 650,909 7,845
EU CR1_C: IRB and STD: Exposures (Gross carrying value) - credit quality by industry The table below shows gross carrying values of credit risk exposures and specific risk adjustments (provisions) analysed by credit quality, split by industry. It excludes counterparty credit risk and securitisations. Industry analysis reflects the sector classification used by RBS for risk management purposes. Gross carrying value comprises both on-balance sheet and off-balance sheet exposures.
2016 2015 Gross carrying values of Specific Gross carrying values of Specific Defaulted Non-defaulted Total credit risk Defaulted Non-defaulted Total credit risk
Industry type exposures exposures exposure adjustment exposures exposures exposure adjustment
£m £m £m £m £m £m £m £m
Central banks — 107,407 107,407 — — 109,174 109,174 — Central government — 39,499 39,499 — — 38,490 38,490 — Other sovereign 1 6,920 6,921 — 1 6,486 6,487 1 Banks 13 23,775 23,788 13 66 23,382 23,448 50 Non-bank financial institutions 367 31,956 32,323 319 411 29,618 30,029 295 Securitisation entities 122 1,272 1,394 16 186 1,258 1,444 30 Property 2,264 58,284 60,548 918 4,756 58,658 63,414 2,500 Natural resources 552 20,832 21,384 240 321 23,591 23,912 134 Transport 1,593 25,252 26,845 480 725 29,726 30,451 375 Manufacturing 272 27,947 28,219 131 402 36,453 36,855 169 Retail and leisure 498 32,032 32,530 410 857 32,435 33,292 892 Services 644 25,867 26,511 292 789 26,280 27,069 324 Telecommunications, media and technology 54 11,747 11,801 33 173 12,611 12,784 72 Mortgages 4,695 163,838 168,533 1,134 5,099 146,761 151,860 30 Other personal 1,632 45,958 47,590 1,064 1,953 52,589 54,542 2,973 Not allocated — 7,524 7,524 13 — 7,658 7,658 —
Total 12,707 630,110 642,817 5,063 15,739 635,170 650,909 7,845
Key points Overall, defaulted exposure decreased 19% driven by
disposals, limit reductions and repayments in line with RBS’s risk reduction strategy. The increase in defaulted exposure in transport as well as RoW reflects the continuing challenging market conditions in the shipping sector, which affect vessel values in the bulk, container and tanker sub-sectors as a number of customers moved into default.
The increase in defaulted exposure in natural resources was
driven by the prolonged challenging market conditions in the oil and gas sector, which resulted in a limited number of customers experiencing financial stress during the year.
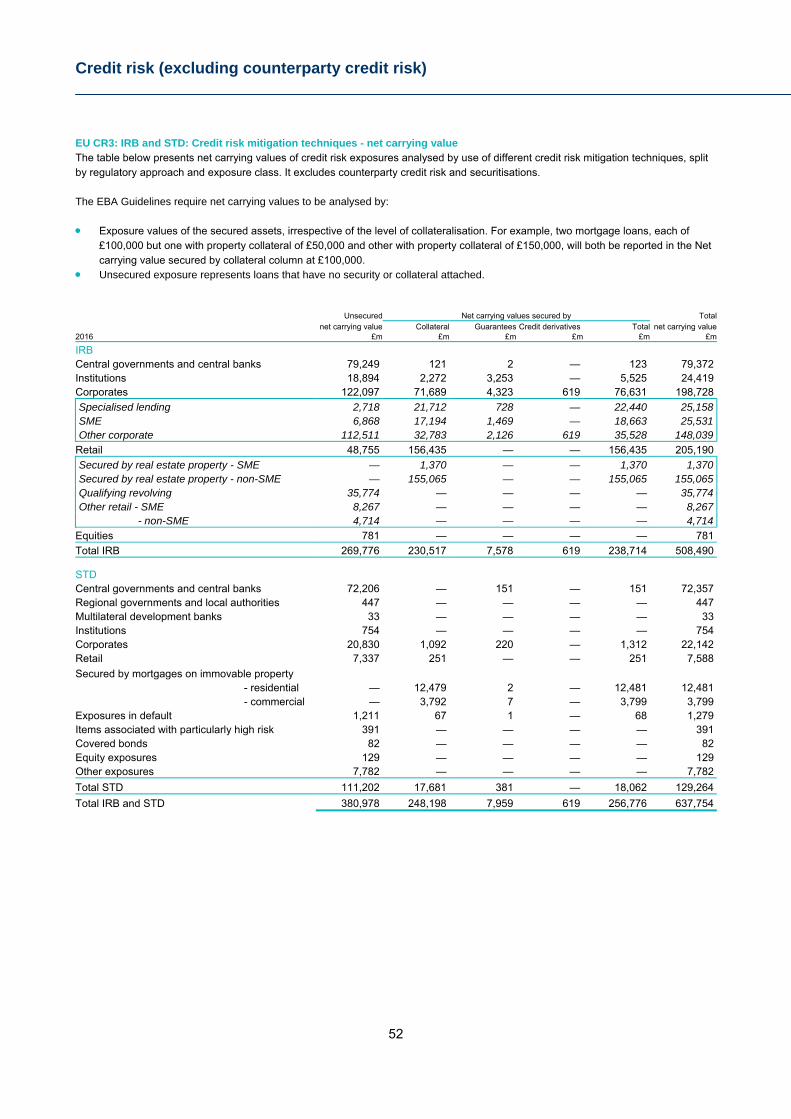
Credit risk (excluding counterparty credit risk)
52
EU CR3: IRB and STD: Credit risk mitigation techniques - net carrying value The table below presents net carrying values of credit risk exposures analysed by use of different credit risk mitigation techniques, split by regulatory approach and exposure class. It excludes counterparty credit risk and securitisations. The EBA Guidelines require net carrying values to be analysed by: Exposure values of the secured assets, irrespective of the level of collateralisation. For example, two mortgage loans, each of
£100,000 but one with property collateral of £50,000 and other with property collateral of £150,000, will both be reported in the Net carrying value secured by collateral column at £100,000.
Unsecured exposure represents loans that have no security or collateral attached.
Unsecured Net carrying values secured by Total net carrying value Collateral Guarantees Credit derivatives Total net carrying value2016 £m £m £m £m £m £m
IRB
Central governments and central banks 79,249 121 2 — 123 79,372 Institutions 18,894 2,272 3,253 — 5,525 24,419 Corporates 122,097 71,689 4,323 619 76,631 198,728
Specialised lending 2,718 21,712 728 — 22,440 25,158 SME 6,868 17,194 1,469 — 18,663 25,531 Other corporate 112,511 32,783 2,126 619 35,528 148,039 Retail 48,755 156,435 — — 156,435 205,190
Secured by real estate property - SME — 1,370 — — 1,370 1,370 Secured by real estate property - non-SME — 155,065 — — 155,065 155,065 Qualifying revolving 35,774 — — — — 35,774 Other retail - SME 8,267 — — — — 8,267 - non-SME 4,714 — — — — 4,714 Equities 781 — — — — 781
Total IRB 269,776 230,517 7,578 619 238,714 508,490
STD Central governments and central banks 72,206 — 151 — 151 72,357 Regional governments and local authorities 447 — — — — 447 Multilateral development banks 33 — — — — 33 Institutions 754 — — — — 754 Corporates 20,830 1,092 220 — 1,312 22,142 Retail 7,337 251 — — 251 7,588
Secured by mortgages on immovable property - residential — 12,479 2 — 12,481 12,481 - commercial — 3,792 7 — 3,799 3,799 Exposures in default 1,211 67 1 — 68 1,279 Items associated with particularly high risk 391 — — — — 391 Covered bonds 82 — — — — 82 Equity exposures 129 — — — — 129 Other exposures 7,782 — — — — 7,782
Total STD 111,202 17,681 381 — 18,062 129,264
Total IRB and STD 380,978 248,198 7,959 619 256,776 637,754
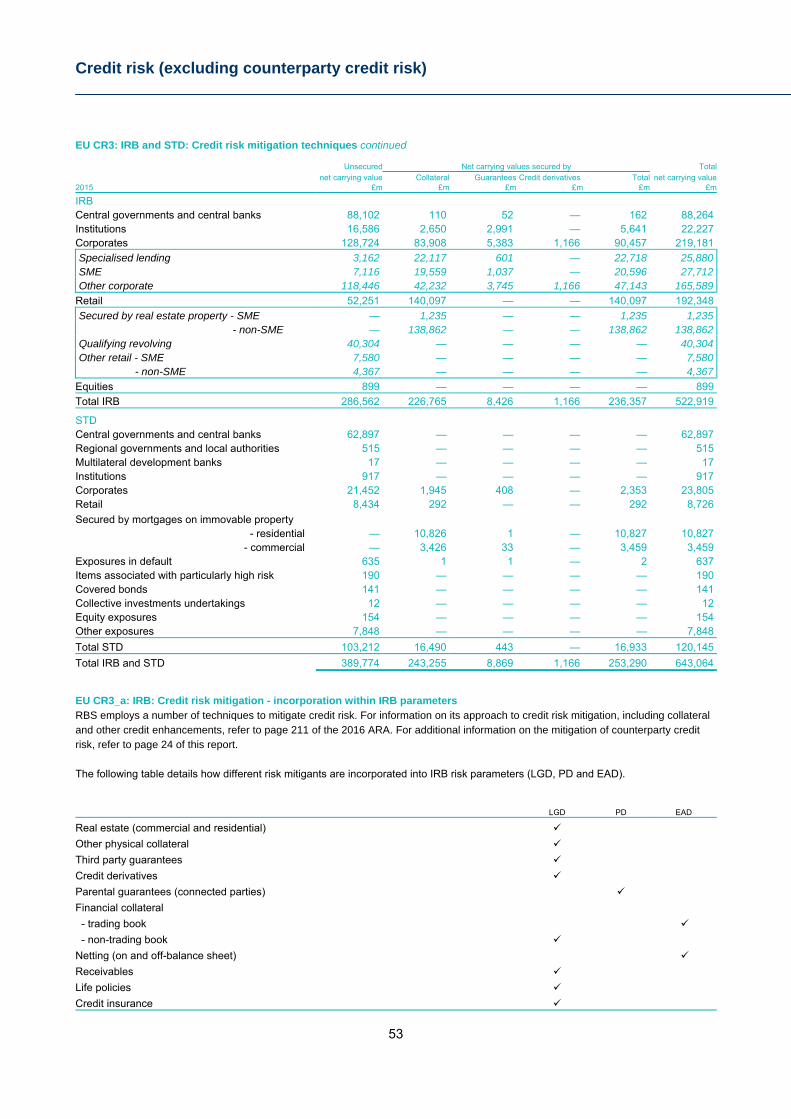
Credit risk (excluding counterparty credit risk)
53
EU CR3: IRB and STD: Credit risk mitigation techniques continued
Unsecured Net carrying values secured by Total net carrying value Collateral Guarantees Credit derivatives Total net carrying value2015 £m £m £m £m £m £m
IRB
Central governments and central banks 88,102 110 52 — 162 88,264 Institutions 16,586 2,650 2,991 — 5,641 22,227 Corporates 128,724 83,908 5,383 1,166 90,457 219,181
Specialised lending 3,162 22,117 601 — 22,718 25,880 SME 7,116 19,559 1,037 — 20,596 27,712 Other corporate 118,446 42,232 3,745 1,166 47,143 165,589 Retail 52,251 140,097 — — 140,097 192,348
Secured by real estate property - SME — 1,235 — — 1,235 1,235 - non-SME — 138,862 — — 138,862 138,862 Qualifying revolving 40,304 — — — — 40,304 Other retail - SME 7,580 — — — — 7,580 - non-SME 4,367 — — — — 4,367 Equities 899 — — — — 899
Total IRB 286,562 226,765 8,426 1,166 236,357 522,919
STD Central governments and central banks 62,897 — — — — 62,897 Regional governments and local authorities 515 — — — — 515 Multilateral development banks 17 — — — — 17 Institutions 917 — — — — 917 Corporates 21,452 1,945 408 — 2,353 23,805 Retail 8,434 292 — — 292 8,726
Secured by mortgages on immovable property - residential — 10,826 1 — 10,827 10,827 - commercial — 3,426 33 — 3,459 3,459 Exposures in default 635 1 1 — 2 637 Items associated with particularly high risk 190 — — — — 190 Covered bonds 141 — — — — 141 Collective investments undertakings 12 — — — — 12 Equity exposures 154 — — — — 154 Other exposures 7,848 — — — — 7,848
Total STD 103,212 16,490 443 — 16,933 120,145
Total IRB and STD 389,774 243,255 8,869 1,166 253,290 643,064
EU CR3_a: IRB: Credit risk mitigation - incorporation within IRB parameters RBS employs a number of techniques to mitigate credit risk. For information on its approach to credit risk mitigation, including collateral and other credit enhancements, refer to page 211 of the 2016 ARA. For additional information on the mitigation of counterparty credit risk, refer to page 24 of this report. The following table details how different risk mitigants are incorporated into IRB risk parameters (LGD, PD and EAD).
LGD PD EAD
Real estate (commercial and residential)
Other physical collateral
Third party guarantees
Credit derivatives
Parental guarantees (connected parties)
Financial collateral
- trading book
- non-trading book
Netting (on and off-balance sheet)
Receivables
Life policies
Credit insurance
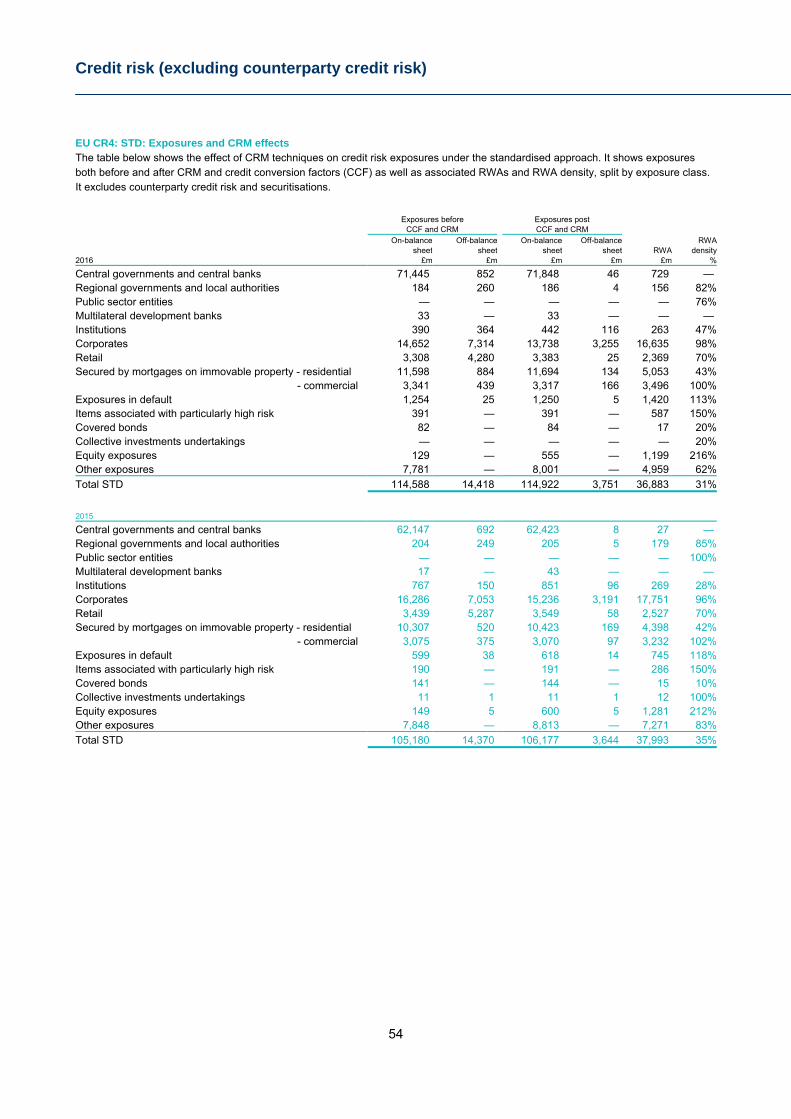
Credit risk (excluding counterparty credit risk)
54
EU CR4: STD: Exposures and CRM effects The table below shows the effect of CRM techniques on credit risk exposures under the standardised approach. It shows exposures both before and after CRM and credit conversion factors (CCF) as well as associated RWAs and RWA density, split by exposure class. It excludes counterparty credit risk and securitisations.
Exposures before Exposures post CCF and CRM CCF and CRM On-balance Off-balance On-balance Off-balance RWA sheet sheet sheet sheet RWA density2016 £m £m £m £m £m %
Central governments and central banks 71,445 852 71,848 46 729 — Regional governments and local authorities 184 260 186 4 156 82%Public sector entities — — — — — 76%Multilateral development banks 33 — 33 — — — Institutions 390 364 442 116 263 47%Corporates 14,652 7,314 13,738 3,255 16,635 98%Retail 3,308 4,280 3,383 25 2,369 70%Secured by mortgages on immovable property - residential 11,598 884 11,694 134 5,053 43% - commercial 3,341 439 3,317 166 3,496 100%Exposures in default 1,254 25 1,250 5 1,420 113%Items associated with particularly high risk 391 — 391 — 587 150%Covered bonds 82 — 84 — 17 20%Collective investments undertakings — — — — — 20%Equity exposures 129 — 555 — 1,199 216%Other exposures 7,781 — 8,001 — 4,959 62%
Total STD 114,588 14,418 114,922 3,751 36,883 31%
2015
Central governments and central banks 62,147 692 62,423 8 27 — Regional governments and local authorities 204 249 205 5 179 85%Public sector entities — — — — — 100%Multilateral development banks 17 — 43 — — — Institutions 767 150 851 96 269 28%Corporates 16,286 7,053 15,236 3,191 17,751 96%Retail 3,439 5,287 3,549 58 2,527 70%Secured by mortgages on immovable property - residential 10,307 520 10,423 169 4,398 42% - commercial 3,075 375 3,070 97 3,232 102%Exposures in default 599 38 618 14 745 118%Items associated with particularly high risk 190 — 191 — 286 150%Covered bonds 141 — 144 — 15 10%Collective investments undertakings 11 1 11 1 12 100%Equity exposures 149 5 600 5 1,281 212%Other exposures 7,848 — 8,813 — 7,271 83%
Total STD 105,180 14,370 106,177 3,644 37,993 35%
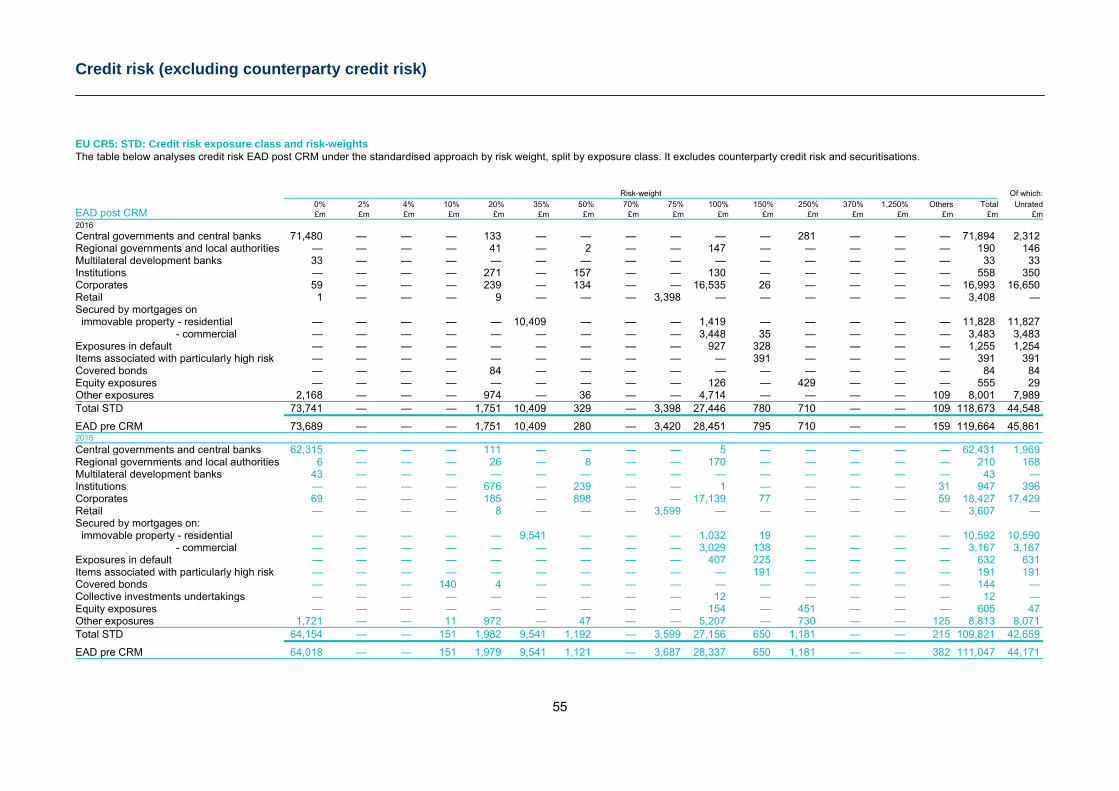
Credit risk (excluding counterparty credit risk)
55
EU CR5: STD: Credit risk exposure class and risk-weights The table below analyses credit risk EAD post CRM under the standardised approach by risk weight, split by exposure class. It excludes counterparty credit risk and securitisations.
Risk-weight Of which:
EAD post CRM 0% 2% 4% 10% 20% 35% 50% 70% 75% 100% 150% 250% 370% 1,250% Others Total Unrated£m £m £m £m £m £m £m £m £m £m £m £m £m £m £m £m £m
2016
Central governments and central banks 71,480 — — — 133 — — — — — — 281 — — — 71,894 2,312 Regional governments and local authorities — — — — 41 — 2 — — 147 — — — — — 190 146 Multilateral development banks 33 — — — — — — — — — — — — — — 33 33 Institutions — — — — 271 — 157 — — 130 — — — — — 558 350 Corporates 59 — — — 239 — 134 — — 16,535 26 — — — — 16,993 16,650 Retail 1 — — — 9 — — — 3,398 — — — — — — 3,408 — Secured by mortgages on immovable property - residential — — — — — 10,409 — — — 1,419 — — — — — 11,828 11,827 - commercial — — — — — — — — — 3,448 35 — — — — 3,483 3,483 Exposures in default — — — — — — — — — 927 328 — — — — 1,255 1,254 Items associated with particularly high risk — — — — — — — — — — 391 — — — — 391 391 Covered bonds — — — — 84 — — — — — — — — — — 84 84 Equity exposures — — — — — — — — — 126 — 429 — — — 555 29 Other exposures 2,168 — — — 974 — 36 — — 4,714 — — — — 109 8,001 7,989 Total STD 73,741 — — — 1,751 10,409 329 — 3,398 27,446 780 710 — — 109 118,673 44,548
EAD pre CRM 73,689 — — — 1,751 10,409 280 — 3,420 28,451 795 710 — — 159 119,664 45,861 2015 Central governments and central banks 62,315 — — — 111 — — — — 5 — — — — — 62,431 1,969 Regional governments and local authorities 6 — — — 26 — 8 — — 170 — — — — — 210 168 Multilateral development banks 43 — — — — — — — — — — — — — — 43 — Institutions — — — — 676 — 239 — — 1 — — — — 31 947 396 Corporates 69 — — — 185 — 898 — — 17,139 77 — — — 59 18,427 17,429 Retail — — — — 8 — — — 3,599 — — — — — — 3,607 — Secured by mortgages on: immovable property - residential — — — — — 9,541 — — — 1,032 19 — — — — 10,592 10,590 - commercial — — — — — — — — — 3,029 138 — — — — 3,167 3,167 Exposures in default — — — — — — — — — 407 225 — — — — 632 631 Items associated with particularly high risk — — — — — — — — — — 191 — — — — 191 191 Covered bonds — — — 140 4 — — — — — — — — — — 144 — Collective investments undertakings — — — — — — — — — 12 — — — — — 12 — Equity exposures — — — — — — — — — 154 — 451 — — — 605 47 Other exposures 1,721 — — 11 972 — 47 — — 5,207 — 730 — — 125 8,813 8,071 Total STD 64,154 — — 151 1,982 9,541 1,192 — 3,599 27,156 650 1,181 — — 215 109,821 42,659
EAD pre CRM 64,018 — — 151 1,979 9,541 1,121 — 3,687 28,337 650 1,181 — — 382 111,047 44,171
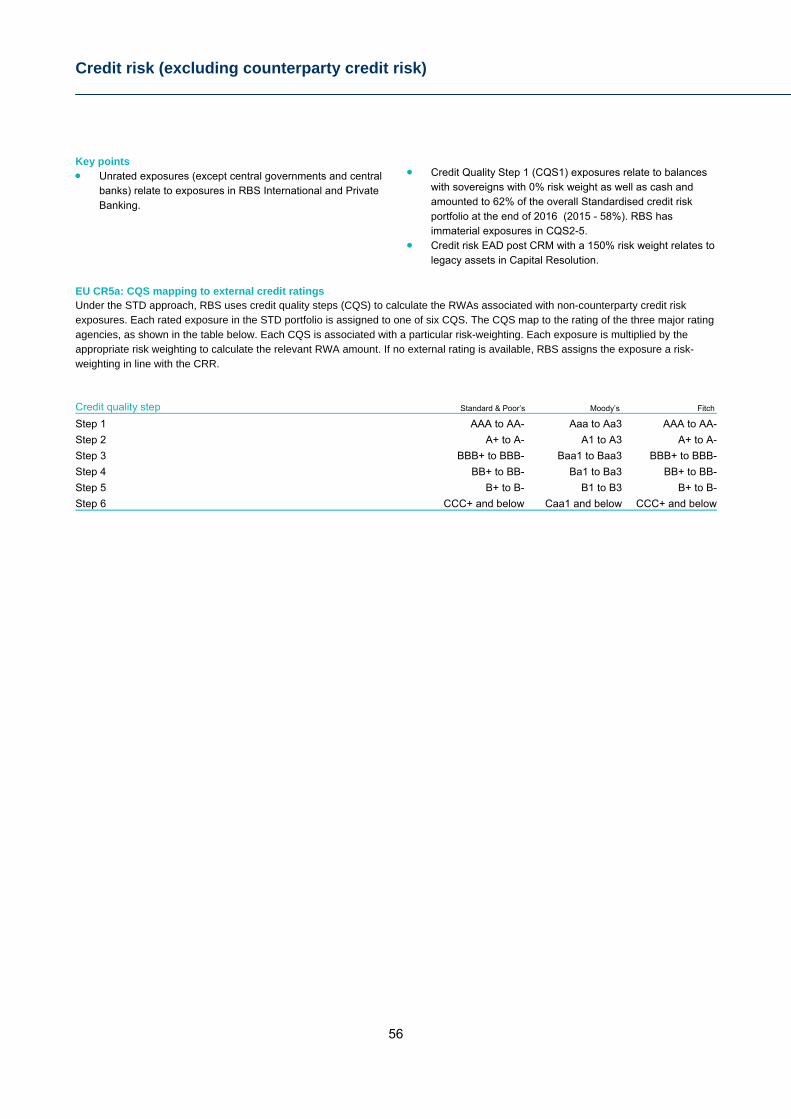
Credit risk (excluding counterparty credit risk)
56
Key points Unrated exposures (except central governments and central
banks) relate to exposures in RBS International and Private Banking.
Credit Quality Step 1 (CQS1) exposures relate to balances
with sovereigns with 0% risk weight as well as cash and amounted to 62% of the overall Standardised credit risk portfolio at the end of 2016 (2015 - 58%). RBS has immaterial exposures in CQS2-5.
Credit risk EAD post CRM with a 150% risk weight relates to legacy assets in Capital Resolution.
EU CR5a: CQS mapping to external credit ratings Under the STD approach, RBS uses credit quality steps (CQS) to calculate the RWAs associated with non-counterparty credit risk exposures. Each rated exposure in the STD portfolio is assigned to one of six CQS. The CQS map to the rating of the three major rating agencies, as shown in the table below. Each CQS is associated with a particular risk-weighting. Each exposure is multiplied by the appropriate risk weighting to calculate the relevant RWA amount. If no external rating is available, RBS assigns the exposure a risk-weighting in line with the CRR.
Credit quality step Standard & Poor’s Moody’s Fitch
Step 1 AAA to AA- Aaa to Aa3 AAA to AA-
Step 2 A+ to A- A1 to A3 A+ to A-
Step 3 BBB+ to BBB- Baa1 to Baa3 BBB+ to BBB-
Step 4 BB+ to BB- Ba1 to Ba3 BB+ to BB-
Step 5 B+ to B- B1 to B3 B+ to B-
Step 6 CCC+ and below Caa1 and below CCC+ and below
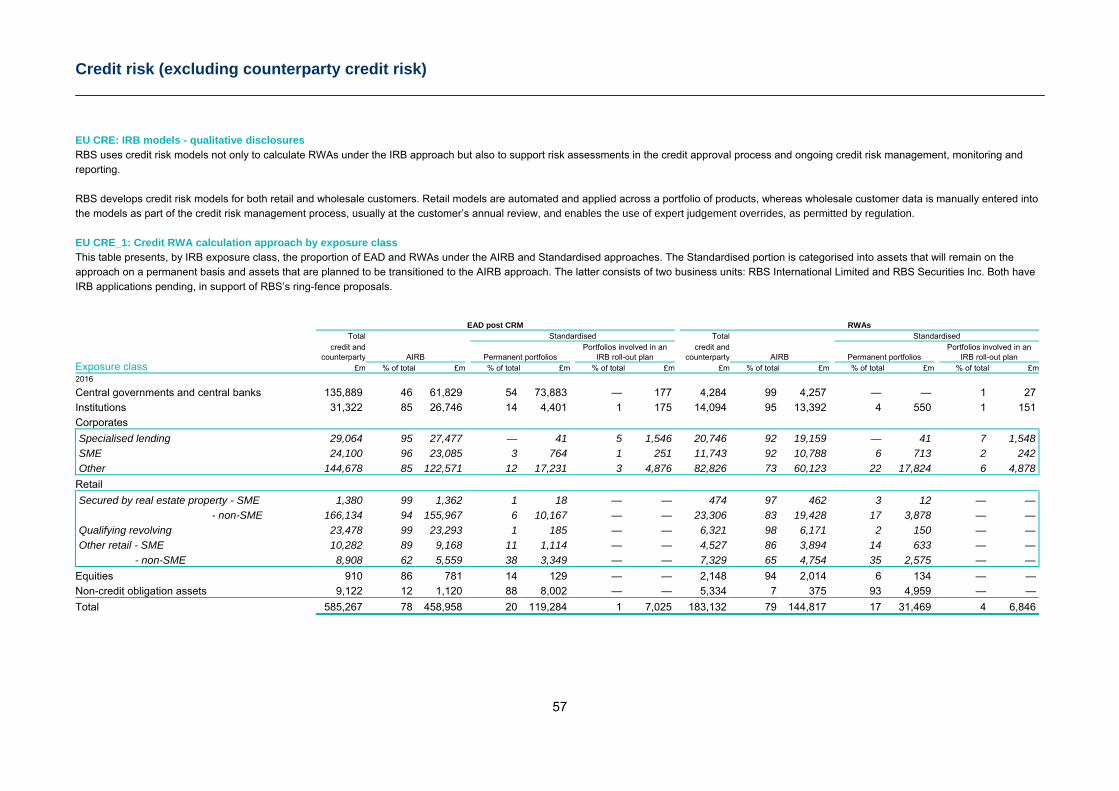
Credit risk (excluding counterparty credit risk)
57
EU CRE: IRB models - qualitative disclosures RBS uses credit risk models not only to calculate RWAs under the IRB approach but also to support risk assessments in the credit approval process and ongoing credit risk management, monitoring and reporting. RBS develops credit risk models for both retail and wholesale customers. Retail models are automated and applied across a portfolio of products, whereas wholesale customer data is manually entered into the models as part of the credit risk management process, usually at the customer’s annual review, and enables the use of expert judgement overrides, as permitted by regulation. EU CRE_1: Credit RWA calculation approach by exposure class This table presents, by IRB exposure class, the proportion of EAD and RWAs under the AIRB and Standardised approaches. The Standardised portion is categorised into assets that will remain on the approach on a permanent basis and assets that are planned to be transitioned to the AIRB approach. The latter consists of two business units: RBS International Limited and RBS Securities Inc. Both have IRB applications pending, in support of RBS’s ring-fence proposals. EAD post CRM RWAs Total Standardised Total Standardised credit and Portfolios involved in an credit and Portfolios involved in an
Exposure class counterparty AIRB Permanent portfolios IRB roll-out plan counterparty AIRB Permanent portfolios IRB roll-out plan
£m % of total £m % of total £m % of total £m £m % of total £m % of total £m % of total £m2016
Central governments and central banks 135,889 46 61,829 54 73,883 — 177 4,284 99 4,257 — — 1 27
Institutions 31,322 85 26,746 14 4,401 1 175 14,094 95 13,392 4 550 1 151
Corporates
Specialised lending 29,064 95 27,477 — 41 5 1,546 20,746 92 19,159 — 41 7 1,548 SME 24,100 96 23,085 3 764 1 251 11,743 92 10,788 6 713 2 242 Other 144,678 85 122,571 12 17,231 3 4,876 82,826 73 60,123 22 17,824 6 4,878 Retail Secured by real estate property - SME 1,380 99 1,362 1 18 — — 474 97 462 3 12 — — - non-SME 166,134 94 155,967 6 10,167 — — 23,306 83 19,428 17 3,878 — — Qualifying revolving 23,478 99 23,293 1 185 — — 6,321 98 6,171 2 150 — — Other retail - SME 10,282 89 9,168 11 1,114 — — 4,527 86 3,894 14 633 — — - non-SME 8,908 62 5,559 38 3,349 — — 7,329 65 4,754 35 2,575 — — Equities 910 86 781 14 129 — — 2,148 94 2,014 6 134 — —
Non-credit obligation assets 9,122 12 1,120 88 8,002 — — 5,334 7 375 93 4,959 — —
Total 585,267 78 458,958 20 119,284 1 7,025 183,132 79 144,817 17 31,469 4 6,846
Credit risk (excluding counterparty credit risk)
58
EU CRE_2: IRB models - Retail Retail IRB models The following table presents an overview of the Retail IRB models used to calculate RWAs for UK and Republic of Ireland retail customers and small business brands. Most retail models are statistical models developed using logistic or linear regression techniques.
Probability of default/customer credit grade models PD models assess the probability that a customer will fail to
honour their credit obligations in the next 12 months. RBS assigns each customer account a score and this is
used across the businesses to support decision-making and portfolio management. This score is used as an input into the PD model.
Retail PD models are point-in-time by design, meaning they predict the probability of default under current economic conditions. They are typically developed applying logistic regression techniques using a range of customer and account data across portfolios, as well as data from credit bureaux.
Different models are developed for different product types, with further distinctions based on other criteria such as whether or not a customer also has a current account with RBS. All retail PD models produce both a best estimate measure, used for portfolio reporting and forecasting, and a conservative measure, which is an input to RWA calculations. The conservative measure is designed to take account of the normal volatility in actual default rates and is floored at 0.03%, as mandated by regulation.
To ensure that the retail PD models remain point-in-time, they are calibrated quarterly using observed default data covering the most recent performance period for the underlying portfolio.
All retail PD models discriminate well and are stable.
Loss given default models LGD models estimate the amount of exposure that will not
be recovered by RBS in the event of customer default. These models are developed by product type using internal
loss data reflecting the collections and recoveries processes. They use a combination of borrower and facility characteristics and take account of credit risk mitigants, including collateral.
As LGD represents economic loss, the estimate also incorporates the cost of collections and the impact of discounting to account for delays in recovery. In accordance with regulatory requirements, the estimates are calibrated to reflect loss rates expected during an economic downturn.
Exposure at default models EAD models estimate the utilisation of a credit facility at the
time of a customer's default, recognising that further drawings on unused credit facilities may be made prior to the default.
Historical data on limit utilisation, in the period prior to customer default, is used for estimation and calibration. EAD for revolving products (e.g. credit cards and current accounts) has a more material anticipation of further drawings.
As required by regulation, EAD estimates are set to be no lower than the current balance and reflect economic downturn conditions.
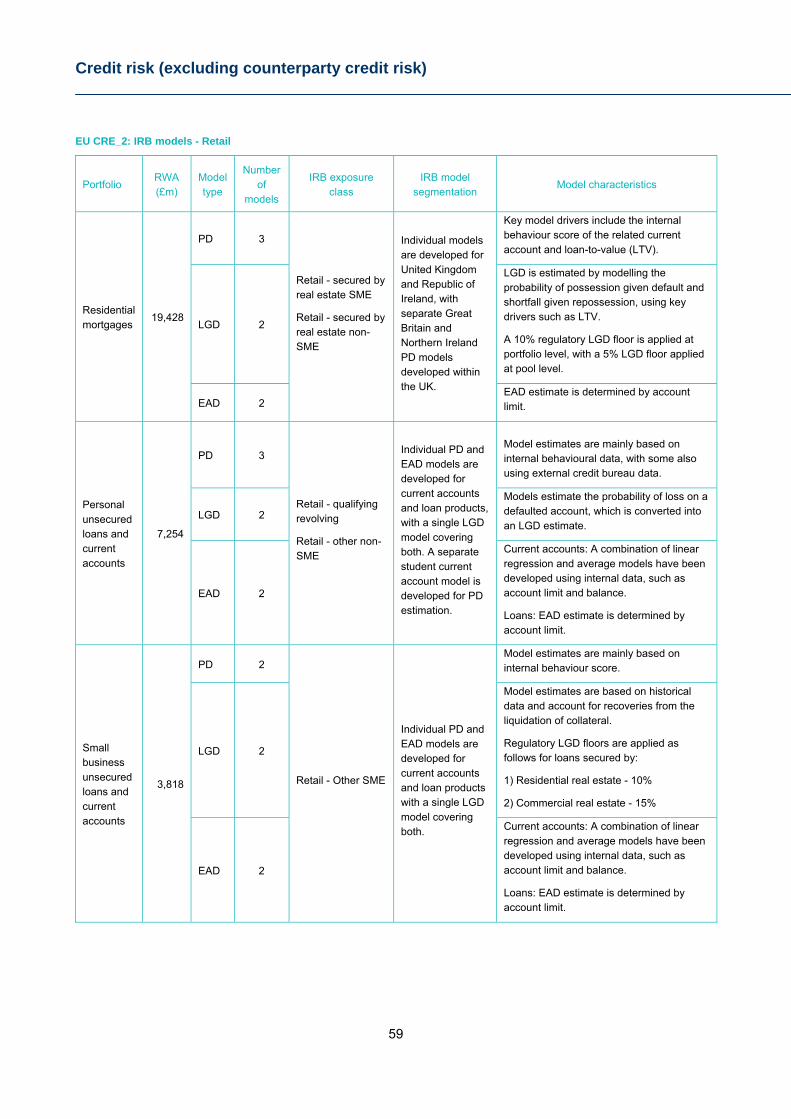
Credit risk (excluding counterparty credit risk)
59
EU CRE_2: IRB models - Retail
Portfolio RWA (£m)
Model type
Number of
models
IRB exposure class
IRB model segmentation
Model characteristics
Residential mortgages
19,428
PD 3
Retail - secured by real estate SME
Retail - secured by real estate non-SME
Individual models are developed for United Kingdom and Republic of Ireland, with separate Great Britain and Northern Ireland PD models developed within the UK.
Key model drivers include the internal behaviour score of the related current account and loan-to-value (LTV).
LGD 2
LGD is estimated by modelling the probability of possession given default and shortfall given repossession, using key drivers such as LTV.
A 10% regulatory LGD floor is applied at portfolio level, with a 5% LGD floor applied at pool level.
EAD 2 EAD estimate is determined by account limit.
Personal unsecured loans and current accounts
7,254
PD 3
Retail - qualifying revolving
Retail - other non-SME
Individual PD and EAD models are developed for current accounts and loan products, with a single LGD model covering both. A separate student current account model is developed for PD estimation.
Model estimates are mainly based on internal behavioural data, with some also using external credit bureau data.
LGD 2
Models estimate the probability of loss on a defaulted account, which is converted into an LGD estimate.
EAD 2
Current accounts: A combination of linear regression and average models have been developed using internal data, such as account limit and balance.
Loans: EAD estimate is determined by account limit.
Small business unsecured loans and current accounts
3,818
PD 2
Retail - Other SME
Individual PD and EAD models are developed for current accounts and loan products with a single LGD model covering both.
Model estimates are mainly based on internal behaviour score.
LGD 2
Model estimates are based on historical data and account for recoveries from the liquidation of collateral.
Regulatory LGD floors are applied as follows for loans secured by:
1) Residential real estate - 10%
2) Commercial real estate - 15%
EAD 2
Current accounts: A combination of linear regression and average models have been developed using internal data, such as account limit and balance.
Loans: EAD estimate is determined by account limit.
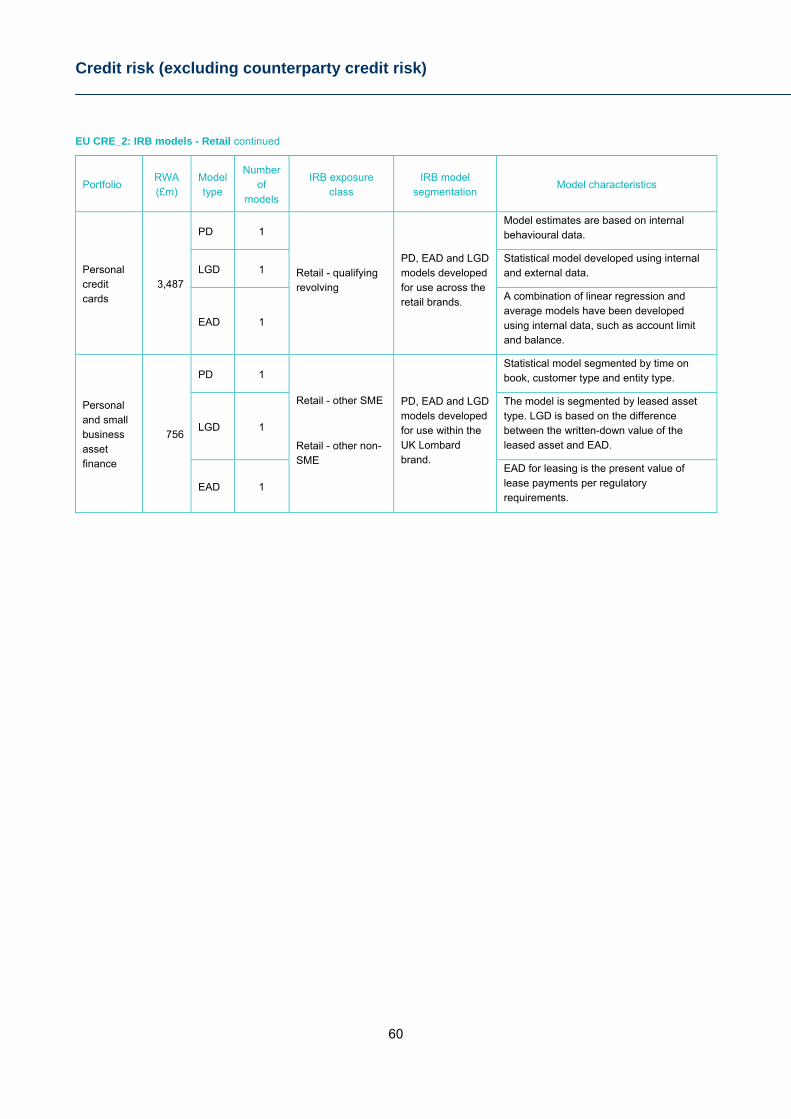
Credit risk (excluding counterparty credit risk)
60
EU CRE_2: IRB models - Retail continued
Portfolio RWA (£m)
Model type
Number of
models
IRB exposure class
IRB model segmentation
Model characteristics
Personal credit cards
3,487
PD 1
Retail - qualifying revolving
PD, EAD and LGD models developed for use across the retail brands.
Model estimates are based on internal behavioural data.
LGD 1 Statistical model developed using internal and external data.
EAD 1
A combination of linear regression and average models have been developed using internal data, such as account limit and balance.
Personal and small business asset finance
756
PD 1
Retail - other SME
Retail - other non-SME
PD, EAD and LGD models developed for use within the UK Lombard brand.
Statistical model segmented by time on book, customer type and entity type.
LGD 1
The model is segmented by leased asset type. LGD is based on the difference between the written-down value of the leased asset and EAD.
EAD 1
EAD for leasing is the present value of lease payments per regulatory requirements.
Credit risk (excluding counterparty credit risk)
61
EU CRE: IRB models continued Wholesale IRB models The following table presents the wholesale IRB models RBS uses to calculate RWAs.
Probability of default/customer credit grade models As part of the credit assessment process, RBS assigns each
customer a credit grade reflecting its PD. RBS maintains and uses a number of credit grading models which consider risk characteristics relevant to the customer, incorporating both quantitative and qualitative inputs. RBS uses these credit grades in many of its risk management and measurement frameworks, including credit sanctioning, provisioning and managing single name concentration risk.
Different models are developed for different customer types. The most material models (those used for the largest aggregate amounts of exposure) are those applied to large to mid-corporate customers and bank and sovereign counterparties. In addition, a number of less material models are used, including those for non-bank financial institutions, public sector entities and specialist corporate sectors such as shipping.
Regulation defines the minimum time series and other attributes of the data used for developing and calibrating models. For the most material models, external data is referenced for estimation and calibration purposes (historical default and rating data from rating agencies and insolvency rates) so that models are based on over 20 years of default experience.
Most of the less material models are developed for portfolios with low default frequency - where customer loan volumes are lower or borrowers are of higher credit quality. In these cases, as required by the PRA, a specific low-default portfolio approach is applied to produce an appropriately prudent calibration to reflect the potential that future outcomes differ from the very low risk outcomes historically observed.
The majority of the PD model suite discriminates risk levels well and is stable; current observed default rates are lower than model estimates. This reflects prudent calibrations and the combined effect of the models being largely through-the-cycle in nature and above-average credit cycle conditions experienced throughout 2016 for the majority of sectors and regions.
The exception to the previous point is the shipping PD model, where observed default rates exceed model estimates. This is a result of the distressed conditions in the shipping sector and RBS’s stated intention to exit the ship finance business and that subsequent portfolio experience is not representative of the historical dataset used to develop the model. A remediation plan has been implemented to ensure appropriate capitalisation of the portfolio.
PDs are floored at 0.03% (except for the Sovereign asset class) as mandated by regulation.
Loss given default models Models are developed for different customer segments and
reflect the recoveries approach applied to each segment. Where sufficient internal and external loss data exists, LGD
is modelled based on this experience and directly incorporates the impact of credit cycle conditions.
For low-default portfolios, where loss data is scarce or the effect of credit conditions is only of limited relevance, simple benchmark LGDs are assigned in accordance with the PRA’s low-default portfolio framework.
Updates to the model for the UK mid-corporate portfolio have been undertaken, with roll-out expected in 2017.
Exposure at default models EAD is estimated on a product type basis, with different
credit conversion factors (CCFs) - measuring the portion of unused credit facility expected to be further drawn prior to default - assigned to each product. For contingent products, such as trade letters of credit, a “probability of call” multiplier is also applied which reflects the likelihood of payout once issued.
Exposure can be reduced by a netting agreement, subject to meeting standards of legal enforceability.
Where sufficient internal historical data exists, CCF estimates are developed to reflect economic downturn conditions and are based on limit utilisation in the period prior to customer default.
For low-default portfolios, where data is scarce, products are rank-ordered and CCFs benchmarked to modelled products or relevant regulatory values.
The product families with greatest impact on EAD are those applying to non-contingent products, in particular loans, overdrafts and revolving credit facilities.
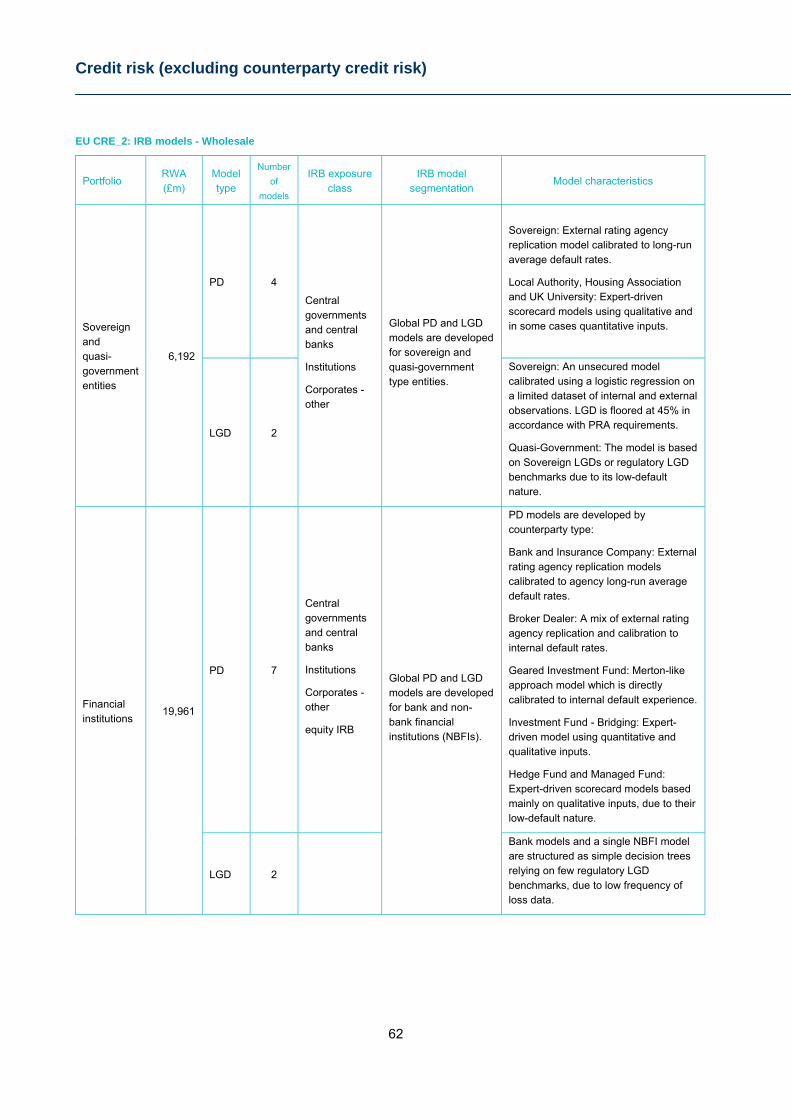
Credit risk (excluding counterparty credit risk)
62
EU CRE_2: IRB models - Wholesale
Portfolio RWA (£m)
Model type
Number
of
models
IRB exposure class
IRB model segmentation
Model characteristics
Sovereign and quasi-government entities
6,192
PD 4
Central governments and central banks
Institutions
Corporates - other
Global PD and LGD models are developed for sovereign and quasi-government type entities.
Sovereign: External rating agency replication model calibrated to long-run average default rates.
Local Authority, Housing Association and UK University: Expert-driven scorecard models using qualitative and in some cases quantitative inputs.
LGD 2
Sovereign: An unsecured model calibrated using a logistic regression on a limited dataset of internal and external observations. LGD is floored at 45% in accordance with PRA requirements.
Quasi-Government: The model is based on Sovereign LGDs or regulatory LGD benchmarks due to its low-default nature.
Financial institutions
19,961
PD 7
Central governments and central banks
Institutions
Corporates - other
equity IRB
Global PD and LGD models are developed for bank and non-bank financial institutions (NBFIs).
PD models are developed by counterparty type:
Bank and Insurance Company: External rating agency replication models calibrated to agency long-run average default rates.
Broker Dealer: A mix of external rating agency replication and calibration to internal default rates.
Geared Investment Fund: Merton-like approach model which is directly calibrated to internal default experience.
Investment Fund - Bridging: Expert-driven model using quantitative and qualitative inputs.
Hedge Fund and Managed Fund: Expert-driven scorecard models based mainly on qualitative inputs, due to their low-default nature.
LGD 2
Bank models and a single NBFI model are structured as simple decision trees relying on few regulatory LGD benchmarks, due to low frequency of loss data.
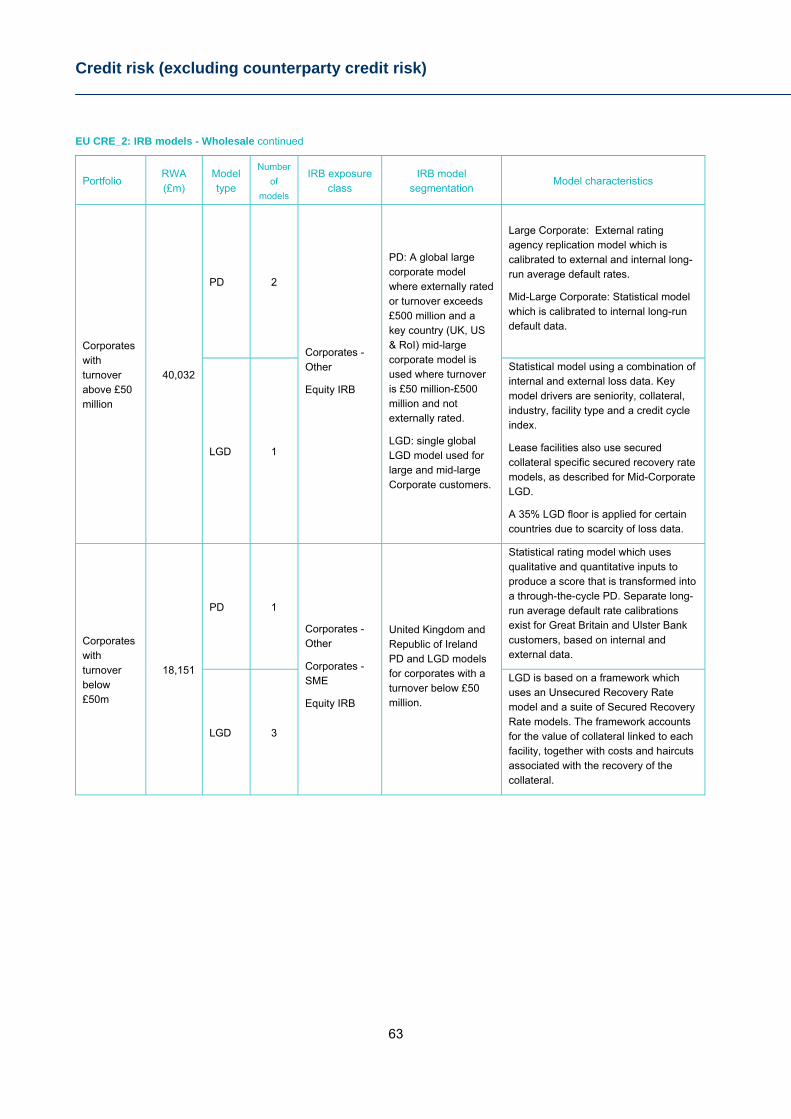
Credit risk (excluding counterparty credit risk)
63
EU CRE_2: IRB models - Wholesale continued
Portfolio RWA (£m)
Model type
Number
of
models
IRB exposure class
IRB model segmentation
Model characteristics
Corporates with turnover above £50 million
40,032
PD 2
Corporates - Other
Equity IRB
PD: A global large corporate model where externally rated or turnover exceeds £500 million and a key country (UK, US & RoI) mid-large corporate model is used where turnover is £50 million-£500 million and not externally rated.
LGD: single global LGD model used for large and mid-large Corporate customers.
Large Corporate: External rating agency replication model which is calibrated to external and internal long-run average default rates.
Mid-Large Corporate: Statistical model which is calibrated to internal long-run default data.
LGD 1
Statistical model using a combination of internal and external loss data. Key model drivers are seniority, collateral, industry, facility type and a credit cycle index.
Lease facilities also use secured collateral specific secured recovery rate models, as described for Mid-Corporate LGD.
A 35% LGD floor is applied for certain countries due to scarcity of loss data.
Corporates with turnover below £50m
18,151
PD 1
Corporates - Other
Corporates - SME
Equity IRB
United Kingdom and Republic of Ireland PD and LGD models for corporates with a turnover below £50 million.
Statistical rating model which uses qualitative and quantitative inputs to produce a score that is transformed into a through-the-cycle PD. Separate long-run average default rate calibrations exist for Great Britain and Ulster Bank customers, based on internal and external data.
LGD 3
LGD is based on a framework which uses an Unsecured Recovery Rate model and a suite of Secured Recovery Rate models. The framework accounts for the value of collateral linked to each facility, together with costs and haircuts associated with the recovery of the collateral.
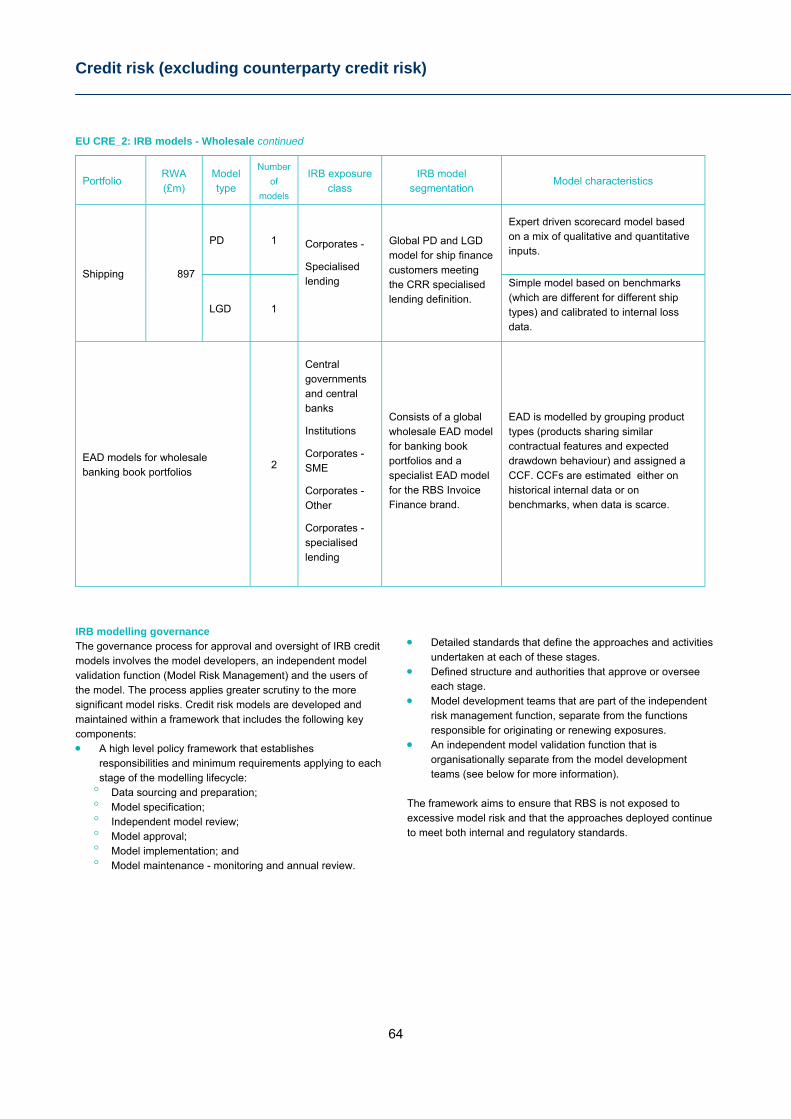
Credit risk (excluding counterparty credit risk)
64
EU CRE_2: IRB models - Wholesale continued
IRB modelling governance The governance process for approval and oversight of IRB credit models involves the model developers, an independent model validation function (Model Risk Management) and the users of the model. The process applies greater scrutiny to the more significant model risks. Credit risk models are developed and maintained within a framework that includes the following key components: A high level policy framework that establishes
responsibilities and minimum requirements applying to each stage of the modelling lifecycle: Data sourcing and preparation; Model specification; Independent model review; Model approval; Model implementation; and Model maintenance - monitoring and annual review.
Detailed standards that define the approaches and activities
undertaken at each of these stages. Defined structure and authorities that approve or oversee
each stage. Model development teams that are part of the independent
risk management function, separate from the functions responsible for originating or renewing exposures.
An independent model validation function that is organisationally separate from the model development teams (see below for more information).
The framework aims to ensure that RBS is not exposed to excessive model risk and that the approaches deployed continue to meet both internal and regulatory standards.
Portfolio RWA (£m)
Model type
Number
of
models
IRB exposure class
IRB model segmentation
Model characteristics
Shipping 897
PD 1 Corporates -
Specialised lending
Global PD and LGD model for ship finance customers meeting the CRR specialised lending definition.
Expert driven scorecard model based on a mix of qualitative and quantitative inputs.
LGD 1
Simple model based on benchmarks (which are different for different ship types) and calibrated to internal loss data.
EAD models for wholesale banking book portfolios
2
Central governments and central banks
Institutions
Corporates - SME
Corporates - Other
Corporates - specialised lending
Consists of a global wholesale EAD model for banking book portfolios and a specialist EAD model for the RBS Invoice Finance brand.
EAD is modelled by grouping product types (products sharing similar contractual features and expected drawdown behaviour) and assigned a CCF. CCFs are estimated either on historical internal data or on benchmarks, when data is scarce.
Credit risk (excluding counterparty credit risk)
65
EU CRE: IRB models continued The performance of models is tested by monitoring and annual review. Every model is tested regularly by comparing estimates to outcomes to assess the accuracy of the model. Other statistical tests assess the ability of the models to discriminate risk (i.e. their ability to determine the relative risk level of a particular customer or exposure), the extent to which portfolio composition remains stable and, where relevant, the frequency and magnitude of overrides applied by model users to modelled estimates. Reports providing the outcome of the monitoring are presented at the Credit Model Risk Forum for peer and stakeholder review and challenge. A summarised version of these reports is presented to the Risk Models Approval Committee (RMAC), including any points of escalation. The annual reviews comprise further analyses that consider: Ongoing user acceptance and confidence in the model and
its performance; Movements in the portfolio (both observed and anticipated);
and Other relevant data that might be used to explain or assess
model performance. Where model performance is determined to be outside tolerance as part of the monitoring or annual review, appropriate action is taken. This may entail recalibration of the model, enhancement (such as by reweighting existing model factors) or redevelopment. Interim adjustments may be applied whilst the remediation activity is undertaken if management believe the underperformance may lead to insufficient capital requirements for the portfolio. Because IRB models are used in the calculation of credit risk regulatory capital, once they have been approved through internal governance, they need to follow the appropriate regulatory approval or notification process before being implemented.
Independent model validation All new and changed credit risk models are subject to detailed review by Model Risk Management (MRM) aimed at providing independent affirmation that the models are appropriate and remain fit for regulatory capital calculations. MRM’s independent review of model redevelopments comprises some or all of the following steps, as appropriate: Testing and challenging the logical and conceptual
soundness of the methodology; Testing the assumptions underlying the model, where
feasible, against actual behaviour. In its validation report, MRM will opine on the reasonableness and stability of the assumptions and specify which assumptions, if any, should be routinely monitored in production;
Testing whether all key appropriate risks have been sufficiently captured;
Checking the accuracy of calculations; Comparing outputs with results from alternative methods; Testing parameter selection and calibration; Ensuring model outputs are sufficiently conservative in
areas where there is significant model uncertainty; Confirming the applicability of tests for accuracy and
stability; recalculating and ensuring that results are robust; and
Ensuring appropriate sensitivity analysis has been performed and documented.
Based on the review and findings from MRM, the relevant model approver (which may be an individual or committee subject to delegation) will consider whether a model or model change can be approved and whether any conditions need to be imposed, including those relating to the remediation of material issues raised through the review process.
For model performance monitoring and annual reviews, MRM contributes to the technical oversight and challenge, and forms part of the Credit Model Risk Forum where these reviews are presented. A separate MRM review report is produced where there are material points to escalate at the forum. Ongoing use of the model needs to be affirmed by the model approver.
Internal Audit Internal Audit provides additional oversight to the adequacy and effectiveness of the model controls and processes and performs in-depth testing on an annual basis. This function is stand-alone and organisationally separate to Risk Management, and therefore those responsible for the development and independent validation activity. Any material gaps in control are escalated through standard board reporting and action plans agreed with those accountable for the activity behind the control.
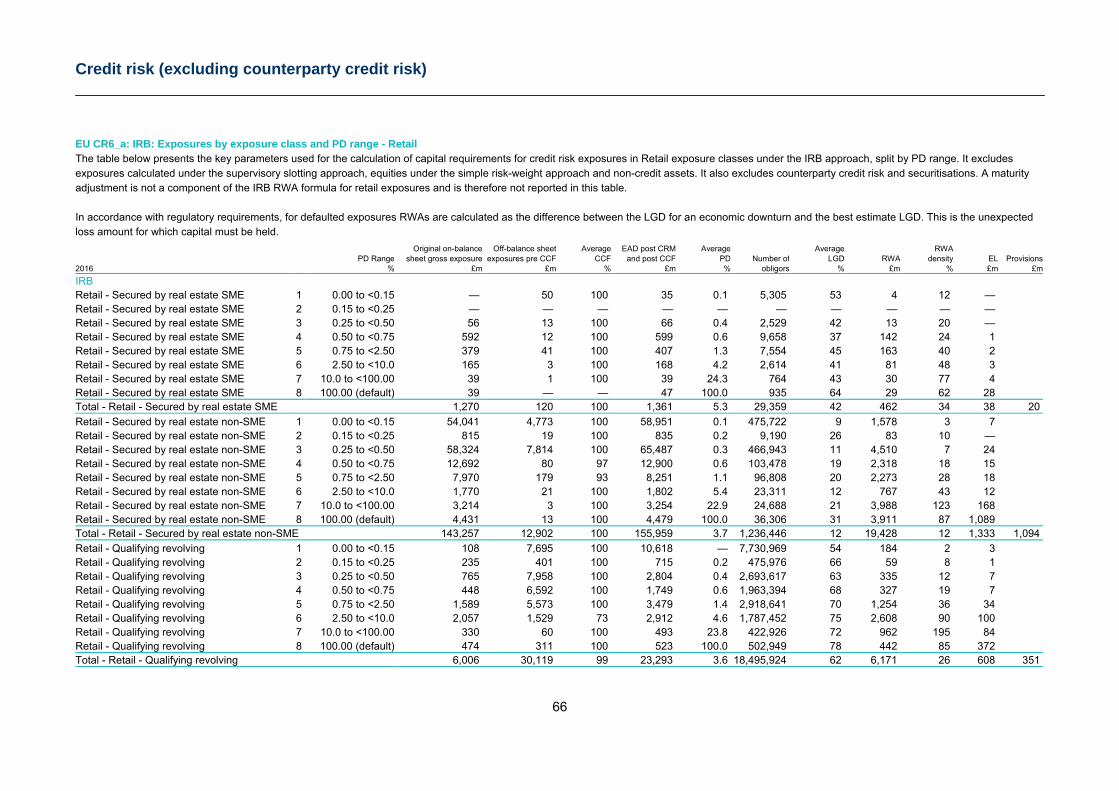
Credit risk (excluding counterparty credit risk)
66
EU CR6_a: IRB: Exposures by exposure class and PD range - Retail The table below presents the key parameters used for the calculation of capital requirements for credit risk exposures in Retail exposure classes under the IRB approach, split by PD range. It excludes exposures calculated under the supervisory slotting approach, equities under the simple risk-weight approach and non-credit assets. It also excludes counterparty credit risk and securitisations. A maturity adjustment is not a component of the IRB RWA formula for retail exposures and is therefore not reported in this table.
In accordance with regulatory requirements, for defaulted exposures RWAs are calculated as the difference between the LGD for an economic downturn and the best estimate LGD. This is the unexpected loss amount for which capital must be held.
Original on-balance Off-balance sheet Average EAD post CRM Average Average RWA PD Range sheet gross exposure exposures pre CCF CCF and post CCF PD Number of LGD RWA density EL Provisions2016 % £m £m % £m % obligors % £m % £m £m
IRB Retail - Secured by real estate SME 1 0.00 to <0.15 — 50 100 35 0.1 5,305 53 4 12 — Retail - Secured by real estate SME 2 0.15 to <0.25 — — — — — — — — — — Retail - Secured by real estate SME 3 0.25 to <0.50 56 13 100 66 0.4 2,529 42 13 20 — Retail - Secured by real estate SME 4 0.50 to <0.75 592 12 100 599 0.6 9,658 37 142 24 1 Retail - Secured by real estate SME 5 0.75 to <2.50 379 41 100 407 1.3 7,554 45 163 40 2 Retail - Secured by real estate SME 6 2.50 to <10.0 165 3 100 168 4.2 2,614 41 81 48 3 Retail - Secured by real estate SME 7 10.0 to <100.00 39 1 100 39 24.3 764 43 30 77 4 Retail - Secured by real estate SME 8 100.00 (default) 39 — — 47 100.0 935 64 29 62 28 Total - Retail - Secured by real estate SME 1,270 120 100 1,361 5.3 29,359 42 462 34 38 20
Retail - Secured by real estate non-SME 1 0.00 to <0.15 54,041 4,773 100 58,951 0.1 475,722 9 1,578 3 7 Retail - Secured by real estate non-SME 2 0.15 to <0.25 815 19 100 835 0.2 9,190 26 83 10 — Retail - Secured by real estate non-SME 3 0.25 to <0.50 58,324 7,814 100 65,487 0.3 466,943 11 4,510 7 24 Retail - Secured by real estate non-SME 4 0.50 to <0.75 12,692 80 97 12,900 0.6 103,478 19 2,318 18 15 Retail - Secured by real estate non-SME 5 0.75 to <2.50 7,970 179 93 8,251 1.1 96,808 20 2,273 28 18 Retail - Secured by real estate non-SME 6 2.50 to <10.0 1,770 21 100 1,802 5.4 23,311 12 767 43 12 Retail - Secured by real estate non-SME 7 10.0 to <100.00 3,214 3 100 3,254 22.9 24,688 21 3,988 123 168 Retail - Secured by real estate non-SME 8 100.00 (default) 4,431 13 100 4,479 100.0 36,306 31 3,911 87 1,089 Total - Retail - Secured by real estate non-SME 143,257 12,902 100 155,959 3.7 1,236,446 12 19,428 12 1,333 1,094
Retail - Qualifying revolving 1 0.00 to <0.15 108 7,695 100 10,618 — 7,730,969 54 184 2 3 Retail - Qualifying revolving 2 0.15 to <0.25 235 401 100 715 0.2 475,976 66 59 8 1 Retail - Qualifying revolving 3 0.25 to <0.50 765 7,958 100 2,804 0.4 2,693,617 63 335 12 7 Retail - Qualifying revolving 4 0.50 to <0.75 448 6,592 100 1,749 0.6 1,963,394 68 327 19 7 Retail - Qualifying revolving 5 0.75 to <2.50 1,589 5,573 100 3,479 1.4 2,918,641 70 1,254 36 34 Retail - Qualifying revolving 6 2.50 to <10.0 2,057 1,529 73 2,912 4.6 1,787,452 75 2,608 90 100 Retail - Qualifying revolving 7 10.0 to <100.00 330 60 100 493 23.8 422,926 72 962 195 84 Retail - Qualifying revolving 8 100.00 (default) 474 311 100 523 100.0 502,949 78 442 85 372 Total - Retail - Qualifying revolving 6,006 30,119 99 23,293 3.6 18,495,924 62 6,171 26 608 351
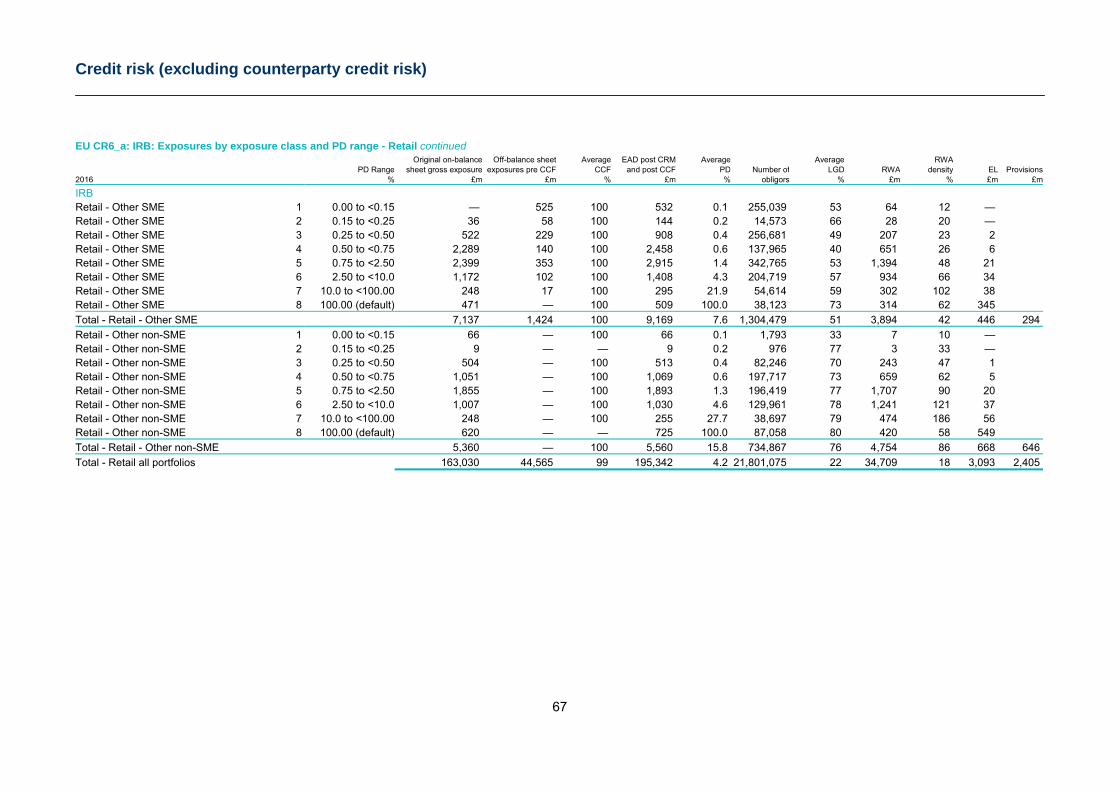
Credit risk (excluding counterparty credit risk)
67
EU CR6_a: IRB: Exposures by exposure class and PD range - Retail continued Original on-balance Off-balance sheet Average EAD post CRM Average Average RWA PD Range sheet gross exposure exposures pre CCF CCF and post CCF PD Number of LGD RWA density EL Provisions2016 % £m £m % £m % obligors % £m % £m £m
IRB Retail - Other SME 1 0.00 to <0.15 — 525 100 532 0.1 255,039 53 64 12 — Retail - Other SME 2 0.15 to <0.25 36 58 100 144 0.2 14,573 66 28 20 — Retail - Other SME 3 0.25 to <0.50 522 229 100 908 0.4 256,681 49 207 23 2 Retail - Other SME 4 0.50 to <0.75 2,289 140 100 2,458 0.6 137,965 40 651 26 6 Retail - Other SME 5 0.75 to <2.50 2,399 353 100 2,915 1.4 342,765 53 1,394 48 21 Retail - Other SME 6 2.50 to <10.0 1,172 102 100 1,408 4.3 204,719 57 934 66 34 Retail - Other SME 7 10.0 to <100.00 248 17 100 295 21.9 54,614 59 302 102 38 Retail - Other SME 8 100.00 (default) 471 — 100 509 100.0 38,123 73 314 62 345
Total - Retail - Other SME 7,137 1,424 100 9,169 7.6 1,304,479 51 3,894 42 446 294
Retail - Other non-SME 1 0.00 to <0.15 66 — 100 66 0.1 1,793 33 7 10 — Retail - Other non-SME 2 0.15 to <0.25 9 — — 9 0.2 976 77 3 33 — Retail - Other non-SME 3 0.25 to <0.50 504 — 100 513 0.4 82,246 70 243 47 1 Retail - Other non-SME 4 0.50 to <0.75 1,051 — 100 1,069 0.6 197,717 73 659 62 5 Retail - Other non-SME 5 0.75 to <2.50 1,855 — 100 1,893 1.3 196,419 77 1,707 90 20 Retail - Other non-SME 6 2.50 to <10.0 1,007 — 100 1,030 4.6 129,961 78 1,241 121 37 Retail - Other non-SME 7 10.0 to <100.00 248 — 100 255 27.7 38,697 79 474 186 56 Retail - Other non-SME 8 100.00 (default) 620 — — 725 100.0 87,058 80 420 58 549
Total - Retail - Other non-SME 5,360 — 100 5,560 15.8 734,867 76 4,754 86 668 646
Total - Retail all portfolios 163,030 44,565 99 195,342 4.2 21,801,075 22 34,709 18 3,093 2,405
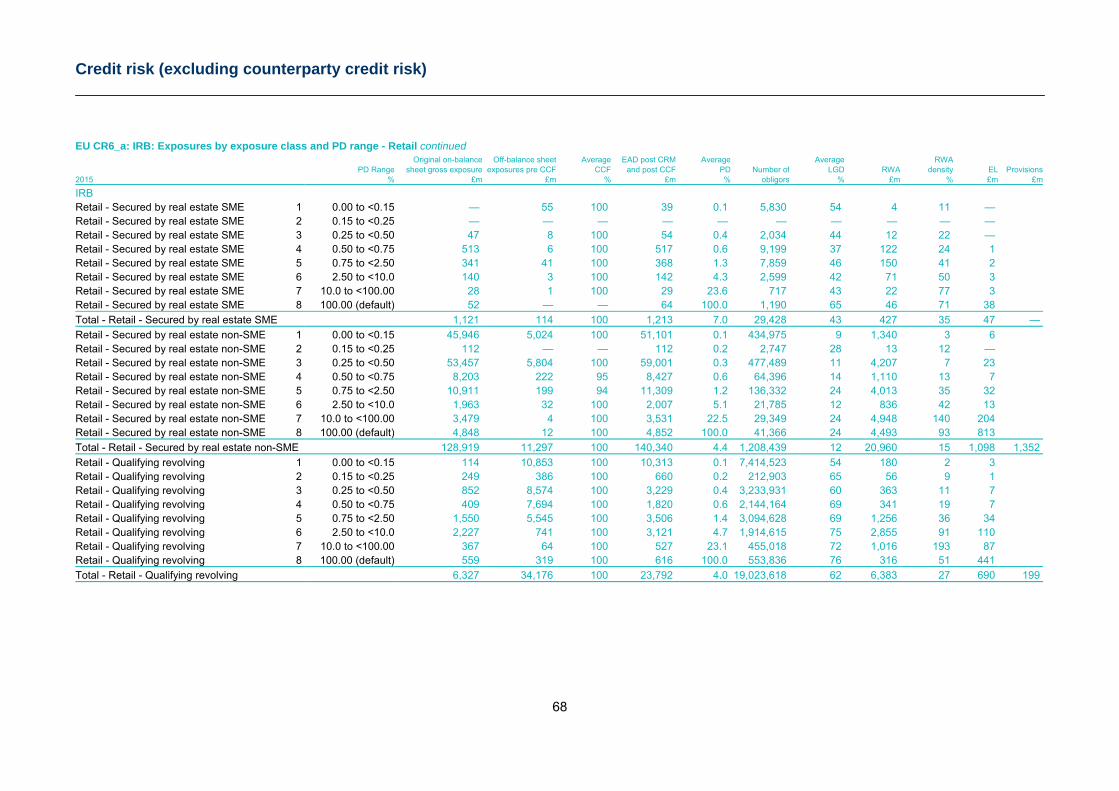
Credit risk (excluding counterparty credit risk)
68
EU CR6_a: IRB: Exposures by exposure class and PD range - Retail continued Original on-balance Off-balance sheet Average EAD post CRM Average Average RWA PD Range sheet gross exposure exposures pre CCF CCF and post CCF PD Number of LGD RWA density EL Provisions2015 % £m £m % £m % obligors % £m % £m £m
IRB Retail - Secured by real estate SME 1 0.00 to <0.15 — 55 100 39 0.1 5,830 54 4 11 — Retail - Secured by real estate SME 2 0.15 to <0.25 — — — — — — — — — — Retail - Secured by real estate SME 3 0.25 to <0.50 47 8 100 54 0.4 2,034 44 12 22 — Retail - Secured by real estate SME 4 0.50 to <0.75 513 6 100 517 0.6 9,199 37 122 24 1 Retail - Secured by real estate SME 5 0.75 to <2.50 341 41 100 368 1.3 7,859 46 150 41 2 Retail - Secured by real estate SME 6 2.50 to <10.0 140 3 100 142 4.3 2,599 42 71 50 3 Retail - Secured by real estate SME 7 10.0 to <100.00 28 1 100 29 23.6 717 43 22 77 3 Retail - Secured by real estate SME 8 100.00 (default) 52 — — 64 100.0 1,190 65 46 71 38
Total - Retail - Secured by real estate SME 1,121 114 100 1,213 7.0 29,428 43 427 35 47 —
Retail - Secured by real estate non-SME 1 0.00 to <0.15 45,946 5,024 100 51,101 0.1 434,975 9 1,340 3 6 Retail - Secured by real estate non-SME 2 0.15 to <0.25 112 — — 112 0.2 2,747 28 13 12 — Retail - Secured by real estate non-SME 3 0.25 to <0.50 53,457 5,804 100 59,001 0.3 477,489 11 4,207 7 23 Retail - Secured by real estate non-SME 4 0.50 to <0.75 8,203 222 95 8,427 0.6 64,396 14 1,110 13 7 Retail - Secured by real estate non-SME 5 0.75 to <2.50 10,911 199 94 11,309 1.2 136,332 24 4,013 35 32 Retail - Secured by real estate non-SME 6 2.50 to <10.0 1,963 32 100 2,007 5.1 21,785 12 836 42 13 Retail - Secured by real estate non-SME 7 10.0 to <100.00 3,479 4 100 3,531 22.5 29,349 24 4,948 140 204 Retail - Secured by real estate non-SME 8 100.00 (default) 4,848 12 100 4,852 100.0 41,366 24 4,493 93 813
Total - Retail - Secured by real estate non-SME 128,919 11,297 100 140,340 4.4 1,208,439 12 20,960 15 1,098 1,352
Retail - Qualifying revolving 1 0.00 to <0.15 114 10,853 100 10,313 0.1 7,414,523 54 180 2 3 Retail - Qualifying revolving 2 0.15 to <0.25 249 386 100 660 0.2 212,903 65 56 9 1 Retail - Qualifying revolving 3 0.25 to <0.50 852 8,574 100 3,229 0.4 3,233,931 60 363 11 7 Retail - Qualifying revolving 4 0.50 to <0.75 409 7,694 100 1,820 0.6 2,144,164 69 341 19 7 Retail - Qualifying revolving 5 0.75 to <2.50 1,550 5,545 100 3,506 1.4 3,094,628 69 1,256 36 34 Retail - Qualifying revolving 6 2.50 to <10.0 2,227 741 100 3,121 4.7 1,914,615 75 2,855 91 110 Retail - Qualifying revolving 7 10.0 to <100.00 367 64 100 527 23.1 455,018 72 1,016 193 87 Retail - Qualifying revolving 8 100.00 (default) 559 319 100 616 100.0 553,836 76 316 51 441
Total - Retail - Qualifying revolving 6,327 34,176 100 23,792 4.0 19,023,618 62 6,383 27 690 199
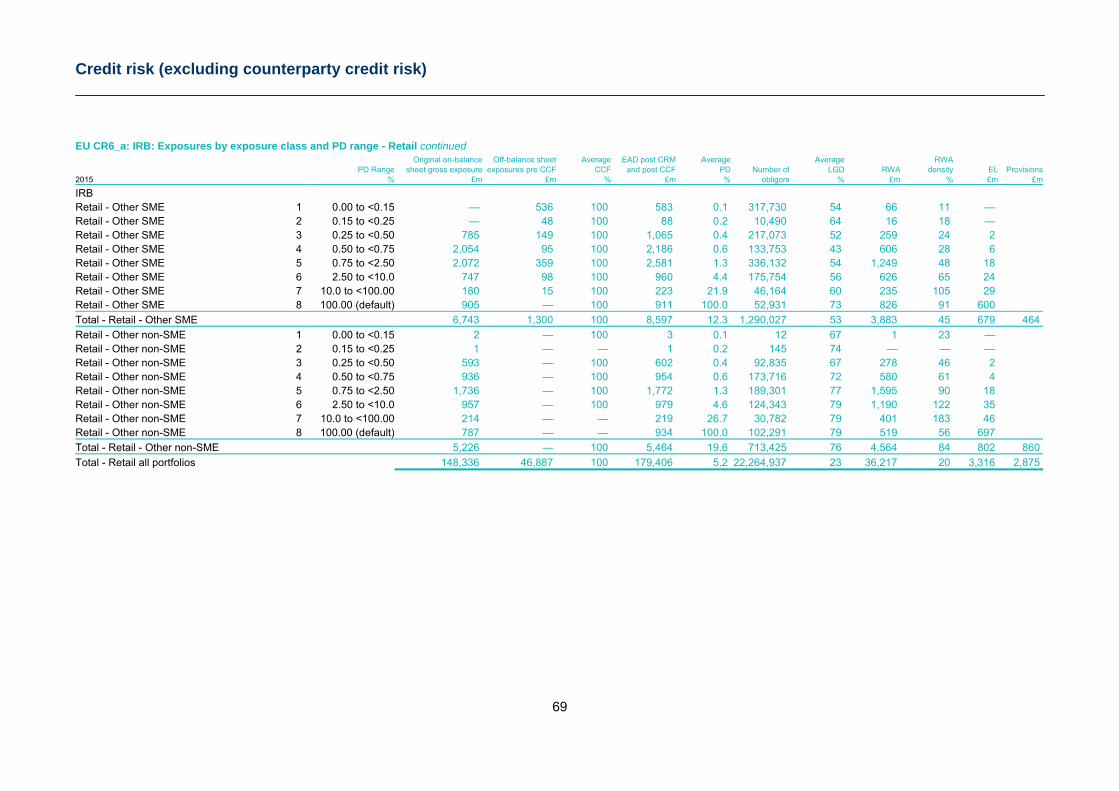
Credit risk (excluding counterparty credit risk)
69
EU CR6_a: IRB: Exposures by exposure class and PD range - Retail continued Original on-balance Off-balance sheet Average EAD post CRM Average Average RWA PD Range sheet gross exposure exposures pre CCF CCF and post CCF PD Number of LGD RWA density EL Provisions2015 % £m £m % £m % obligors % £m % £m £m
IRB Retail - Other SME 1 0.00 to <0.15 — 536 100 583 0.1 317,730 54 66 11 — Retail - Other SME 2 0.15 to <0.25 — 48 100 88 0.2 10,490 64 16 18 — Retail - Other SME 3 0.25 to <0.50 785 149 100 1,065 0.4 217,073 52 259 24 2 Retail - Other SME 4 0.50 to <0.75 2,054 95 100 2,186 0.6 133,753 43 606 28 6 Retail - Other SME 5 0.75 to <2.50 2,072 359 100 2,581 1.3 336,132 54 1,249 48 18 Retail - Other SME 6 2.50 to <10.0 747 98 100 960 4.4 175,754 56 626 65 24 Retail - Other SME 7 10.0 to <100.00 180 15 100 223 21.9 46,164 60 235 105 29 Retail - Other SME 8 100.00 (default) 905 — 100 911 100.0 52,931 73 826 91 600
Total - Retail - Other SME 6,743 1,300 100 8,597 12.3 1,290,027 53 3,883 45 679 464
Retail - Other non-SME 1 0.00 to <0.15 2 — 100 3 0.1 12 67 1 23 — Retail - Other non-SME 2 0.15 to <0.25 1 — — 1 0.2 145 74 — — — Retail - Other non-SME 3 0.25 to <0.50 593 — 100 602 0.4 92,835 67 278 46 2 Retail - Other non-SME 4 0.50 to <0.75 936 — 100 954 0.6 173,716 72 580 61 4 Retail - Other non-SME 5 0.75 to <2.50 1,736 — 100 1,772 1.3 189,301 77 1,595 90 18 Retail - Other non-SME 6 2.50 to <10.0 957 — 100 979 4.6 124,343 79 1,190 122 35 Retail - Other non-SME 7 10.0 to <100.00 214 — — 219 26.7 30,782 79 401 183 46 Retail - Other non-SME 8 100.00 (default) 787 — — 934 100.0 102,291 79 519 56 697
Total - Retail - Other non-SME 5,226 — 100 5,464 19.6 713,425 76 4,564 84 802 860
Total - Retail all portfolios 148,336 46,887 100 179,406 5.2 22,264,937 23 36,217 20 3,316 2,875
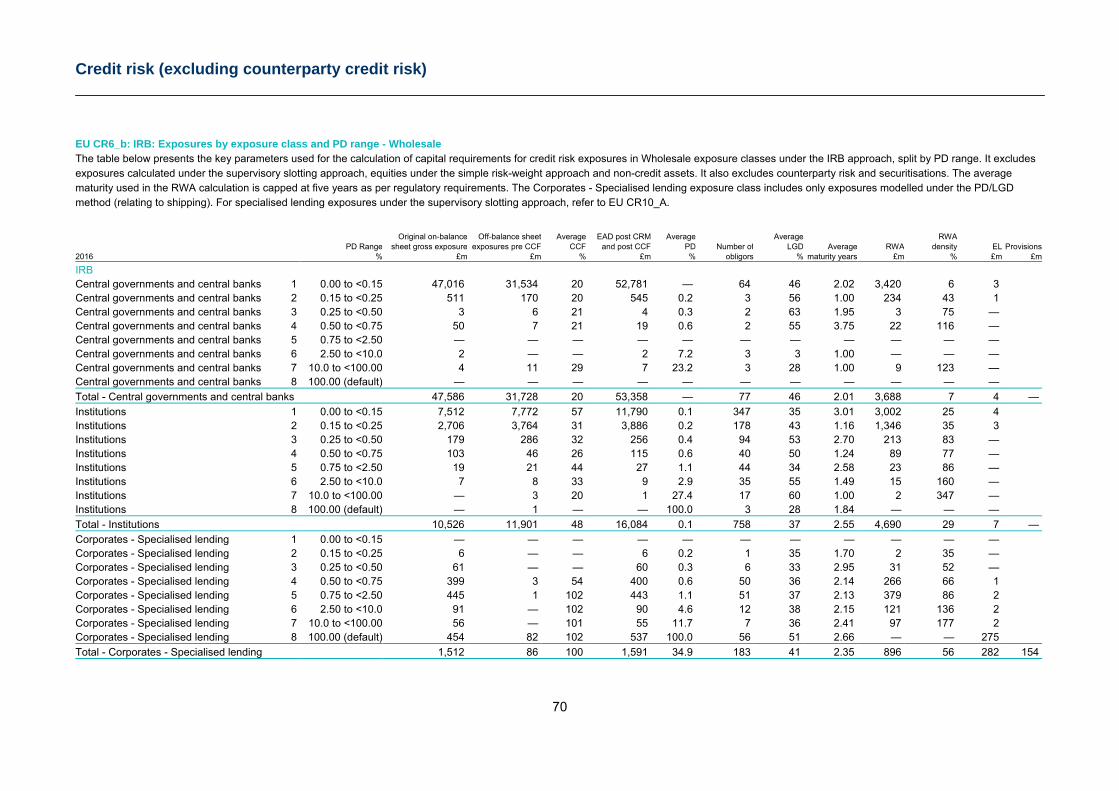
Credit risk (excluding counterparty credit risk)
70
EU CR6_b: IRB: Exposures by exposure class and PD range - Wholesale The table below presents the key parameters used for the calculation of capital requirements for credit risk exposures in Wholesale exposure classes under the IRB approach, split by PD range. It excludes exposures calculated under the supervisory slotting approach, equities under the simple risk-weight approach and non-credit assets. It also excludes counterparty risk and securitisations. The average maturity used in the RWA calculation is capped at five years as per regulatory requirements. The Corporates - Specialised lending exposure class includes only exposures modelled under the PD/LGD method (relating to shipping). For specialised lending exposures under the supervisory slotting approach, refer to EU CR10_A.
Original on-balance Off-balance sheet Average EAD post CRM Average Average RWA PD Range sheet gross exposure exposures pre CCF CCF and post CCF PD Number of LGD Average RWA density EL Provisions2016 % £m £m % £m % obligors % maturity years £m % £m £m
IRB Central governments and central banks 1 0.00 to <0.15 47,016 31,534 20 52,781 — 64 46 2.02 3,420 6 3 Central governments and central banks 2 0.15 to <0.25 511 170 20 545 0.2 3 56 1.00 234 43 1 Central governments and central banks 3 0.25 to <0.50 3 6 21 4 0.3 2 63 1.95 3 75 — Central governments and central banks 4 0.50 to <0.75 50 7 21 19 0.6 2 55 3.75 22 116 — Central governments and central banks 5 0.75 to <2.50 — — — — — — — — — — — Central governments and central banks 6 2.50 to <10.0 2 — — 2 7.2 3 3 1.00 — — — Central governments and central banks 7 10.0 to <100.00 4 11 29 7 23.2 3 28 1.00 9 123 — Central governments and central banks 8 100.00 (default) — — — — — — — — — — —
Total - Central governments and central banks 47,586 31,728 20 53,358 — 77 46 2.01 3,688 7 4 —
Institutions 1 0.00 to <0.15 7,512 7,772 57 11,790 0.1 347 35 3.01 3,002 25 4 Institutions 2 0.15 to <0.25 2,706 3,764 31 3,886 0.2 178 43 1.16 1,346 35 3 Institutions 3 0.25 to <0.50 179 286 32 256 0.4 94 53 2.70 213 83 — Institutions 4 0.50 to <0.75 103 46 26 115 0.6 40 50 1.24 89 77 — Institutions 5 0.75 to <2.50 19 21 44 27 1.1 44 34 2.58 23 86 — Institutions 6 2.50 to <10.0 7 8 33 9 2.9 35 55 1.49 15 160 — Institutions 7 10.0 to <100.00 — 3 20 1 27.4 17 60 1.00 2 347 — Institutions 8 100.00 (default) — 1 — — 100.0 3 28 1.84 — — —
Total - Institutions 10,526 11,901 48 16,084 0.1 758 37 2.55 4,690 29 7 —
Corporates - Specialised lending 1 0.00 to <0.15 — — — — — — — — — — — Corporates - Specialised lending 2 0.15 to <0.25 6 — — 6 0.2 1 35 1.70 2 35 — Corporates - Specialised lending 3 0.25 to <0.50 61 — — 60 0.3 6 33 2.95 31 52 — Corporates - Specialised lending 4 0.50 to <0.75 399 3 54 400 0.6 50 36 2.14 266 66 1 Corporates - Specialised lending 5 0.75 to <2.50 445 1 102 443 1.1 51 37 2.13 379 86 2 Corporates - Specialised lending 6 2.50 to <10.0 91 — 102 90 4.6 12 38 2.15 121 136 2 Corporates - Specialised lending 7 10.0 to <100.00 56 — 101 55 11.7 7 36 2.41 97 177 2 Corporates - Specialised lending 8 100.00 (default) 454 82 102 537 100.0 56 51 2.66 — — 275
Total - Corporates - Specialised lending 1,512 86 100 1,591 34.9 183 41 2.35 896 56 282 154
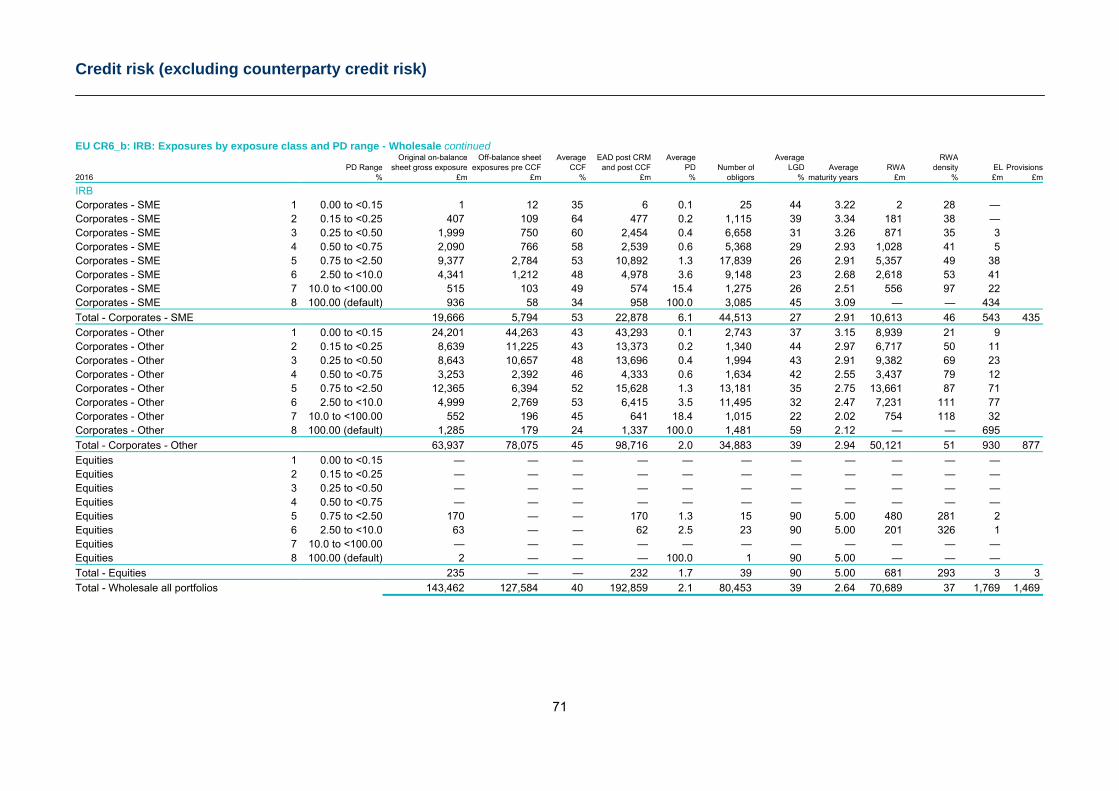
Credit risk (excluding counterparty credit risk)
71
EU CR6_b: IRB: Exposures by exposure class and PD range - Wholesale continued Original on-balance Off-balance sheet Average EAD post CRM Average Average RWA PD Range sheet gross exposure exposures pre CCF CCF and post CCF PD Number of LGD Average RWA density EL Provisions2016 % £m £m % £m % obligors % maturity years £m % £m £m
IRB Corporates - SME 1 0.00 to <0.15 1 12 35 6 0.1 25 44 3.22 2 28 — Corporates - SME 2 0.15 to <0.25 407 109 64 477 0.2 1,115 39 3.34 181 38 — Corporates - SME 3 0.25 to <0.50 1,999 750 60 2,454 0.4 6,658 31 3.26 871 35 3 Corporates - SME 4 0.50 to <0.75 2,090 766 58 2,539 0.6 5,368 29 2.93 1,028 41 5 Corporates - SME 5 0.75 to <2.50 9,377 2,784 53 10,892 1.3 17,839 26 2.91 5,357 49 38 Corporates - SME 6 2.50 to <10.0 4,341 1,212 48 4,978 3.6 9,148 23 2.68 2,618 53 41 Corporates - SME 7 10.0 to <100.00 515 103 49 574 15.4 1,275 26 2.51 556 97 22 Corporates - SME 8 100.00 (default) 936 58 34 958 100.0 3,085 45 3.09 — — 434
Total - Corporates - SME 19,666 5,794 53 22,878 6.1 44,513 27 2.91 10,613 46 543 435
Corporates - Other 1 0.00 to <0.15 24,201 44,263 43 43,293 0.1 2,743 37 3.15 8,939 21 9 Corporates - Other 2 0.15 to <0.25 8,639 11,225 43 13,373 0.2 1,340 44 2.97 6,717 50 11 Corporates - Other 3 0.25 to <0.50 8,643 10,657 48 13,696 0.4 1,994 43 2.91 9,382 69 23 Corporates - Other 4 0.50 to <0.75 3,253 2,392 46 4,333 0.6 1,634 42 2.55 3,437 79 12 Corporates - Other 5 0.75 to <2.50 12,365 6,394 52 15,628 1.3 13,181 35 2.75 13,661 87 71 Corporates - Other 6 2.50 to <10.0 4,999 2,769 53 6,415 3.5 11,495 32 2.47 7,231 111 77 Corporates - Other 7 10.0 to <100.00 552 196 45 641 18.4 1,015 22 2.02 754 118 32 Corporates - Other 8 100.00 (default) 1,285 179 24 1,337 100.0 1,481 59 2.12 — — 695
Total - Corporates - Other 63,937 78,075 45 98,716 2.0 34,883 39 2.94 50,121 51 930 877
Equities 1 0.00 to <0.15 — — — — — — — — — — — Equities 2 0.15 to <0.25 — — — — — — — — — — — Equities 3 0.25 to <0.50 — — — — — — — — — — — Equities 4 0.50 to <0.75 — — — — — — — — — — — Equities 5 0.75 to <2.50 170 — — 170 1.3 15 90 5.00 480 281 2 Equities 6 2.50 to <10.0 63 — — 62 2.5 23 90 5.00 201 326 1 Equities 7 10.0 to <100.00 — — — — — — — — — — — Equities 8 100.00 (default) 2 — — — 100.0 1 90 5.00 — — —
Total - Equities 235 — — 232 1.7 39 90 5.00 681 293 3 3
Total - Wholesale all portfolios 143,462 127,584 40 192,859 2.1 80,453 39 2.64 70,689 37 1,769 1,469
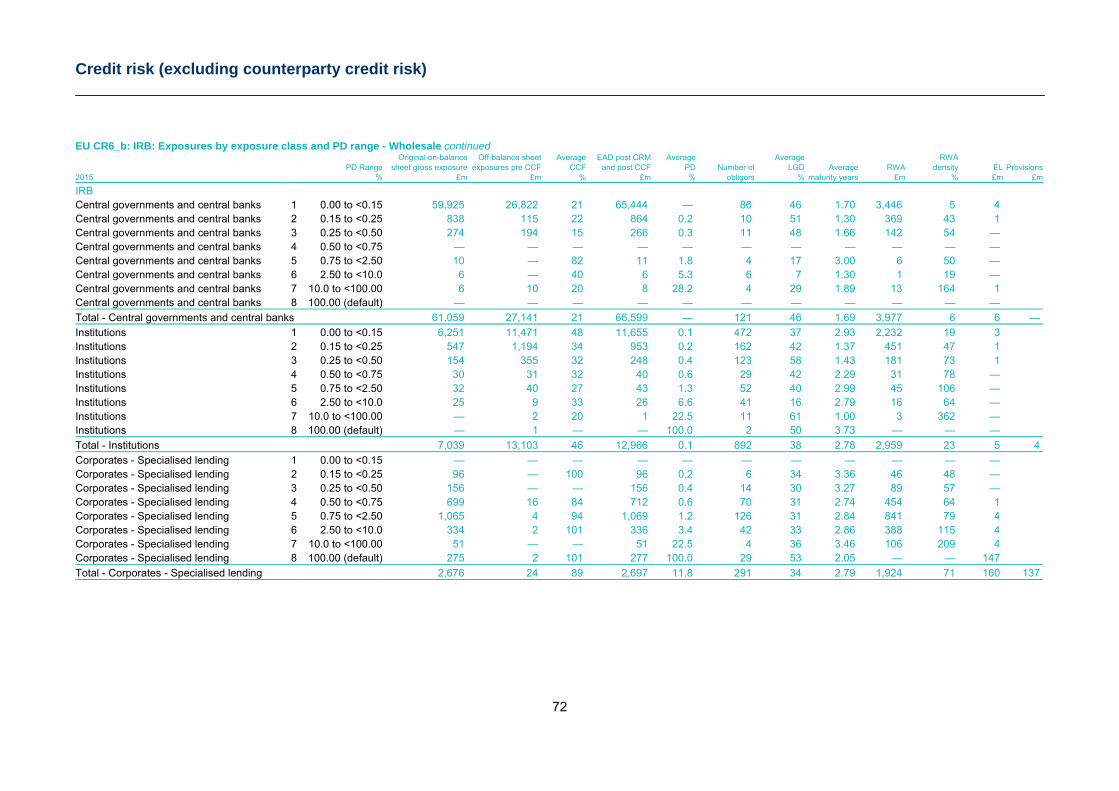
Credit risk (excluding counterparty credit risk)
72
EU CR6_b: IRB: Exposures by exposure class and PD range - Wholesale continued Original on-balance Off-balance sheet Average EAD post CRM Average Average RWA PD Range sheet gross exposure exposures pre CCF CCF and post CCF PD Number of LGD Average RWA density EL Provisions2015 % £m £m % £m % obligors % maturity years £m % £m £m
IRB Central governments and central banks 1 0.00 to <0.15 59,925 26,822 21 65,444 — 86 46 1.70 3,446 5 4 Central governments and central banks 2 0.15 to <0.25 838 115 22 864 0.2 10 51 1.30 369 43 1 Central governments and central banks 3 0.25 to <0.50 274 194 15 266 0.3 11 48 1.66 142 54 — Central governments and central banks 4 0.50 to <0.75 — — — — — — — — — — — Central governments and central banks 5 0.75 to <2.50 10 — 82 11 1.8 4 17 3.00 6 50 — Central governments and central banks 6 2.50 to <10.0 6 — 40 6 5.3 6 7 1.30 1 19 — Central governments and central banks 7 10.0 to <100.00 6 10 20 8 28.2 4 29 1.89 13 164 1 Central governments and central banks 8 100.00 (default) — — — — — — — — — — —
Total - Central governments and central banks 61,059 27,141 21 66,599 — 121 46 1.69 3,977 6 6 —
Institutions 1 0.00 to <0.15 6,251 11,471 48 11,655 0.1 472 37 2.93 2,232 19 3 Institutions 2 0.15 to <0.25 547 1,194 34 953 0.2 162 42 1.37 451 47 1 Institutions 3 0.25 to <0.50 154 355 32 248 0.4 123 58 1.43 181 73 1 Institutions 4 0.50 to <0.75 30 31 32 40 0.6 29 42 2.29 31 78 — Institutions 5 0.75 to <2.50 32 40 27 43 1.3 52 40 2.99 45 106 — Institutions 6 2.50 to <10.0 25 9 33 26 6.6 41 16 2.79 16 64 — Institutions 7 10.0 to <100.00 — 2 20 1 22.5 11 61 1.00 3 362 — Institutions 8 100.00 (default) — 1 — — 100.0 2 50 3.73 — — —
Total - Institutions 7,039 13,103 46 12,966 0.1 892 38 2.78 2,959 23 5 4
Corporates - Specialised lending 1 0.00 to <0.15 — — — — — — — — — — — Corporates - Specialised lending 2 0.15 to <0.25 96 — 100 96 0.2 6 34 3.36 46 48 — Corporates - Specialised lending 3 0.25 to <0.50 156 — — 156 0.4 14 30 3.27 89 57 — Corporates - Specialised lending 4 0.50 to <0.75 699 16 84 712 0.6 70 31 2.74 454 64 1 Corporates - Specialised lending 5 0.75 to <2.50 1,065 4 94 1,069 1.2 126 31 2.84 841 79 4 Corporates - Specialised lending 6 2.50 to <10.0 334 2 101 336 3.4 42 33 2.86 388 115 4 Corporates - Specialised lending 7 10.0 to <100.00 51 — — 51 22.5 4 36 3.46 106 209 4 Corporates - Specialised lending 8 100.00 (default) 275 2 101 277 100.0 29 53 2.05 — — 147
Total - Corporates - Specialised lending 2,676 24 89 2,697 11.8 291 34 2.79 1,924 71 160 137
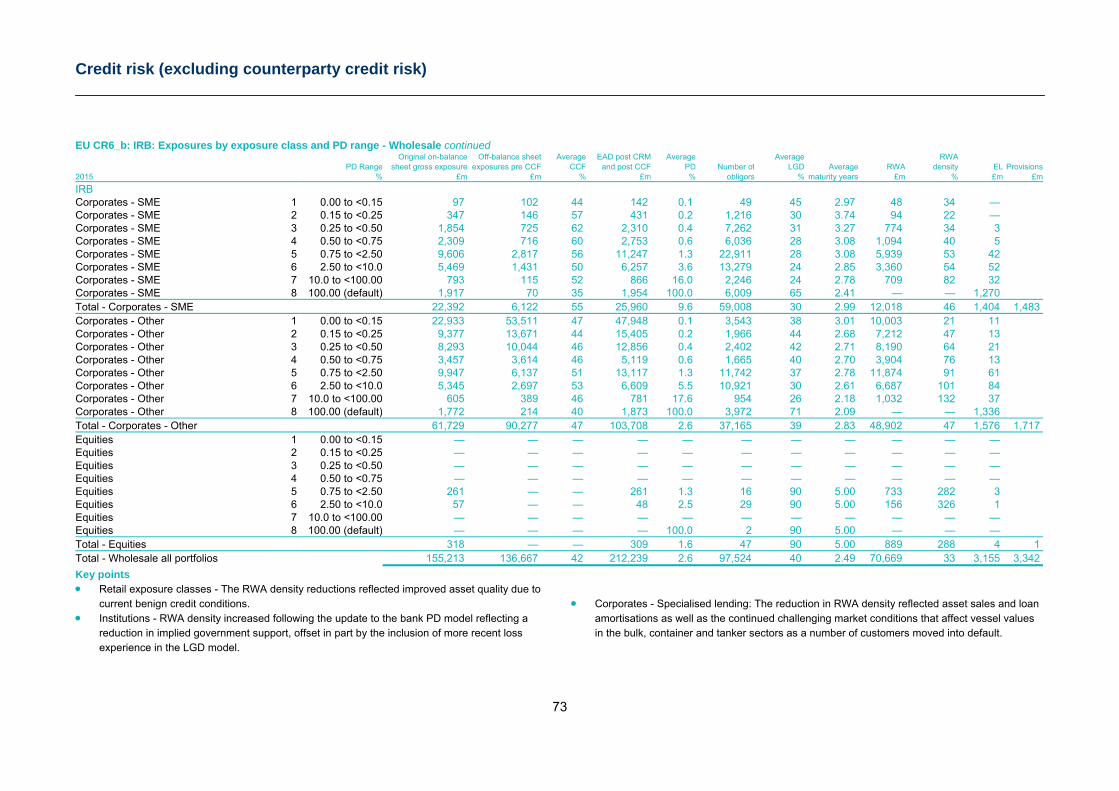
Credit risk (excluding counterparty credit risk)
73
EU CR6_b: IRB: Exposures by exposure class and PD range - Wholesale continued Original on-balance Off-balance sheet Average EAD post CRM Average Average RWA PD Range sheet gross exposure exposures pre CCF CCF and post CCF PD Number of LGD Average RWA density EL Provisions2015 % £m £m % £m % obligors % maturity years £m % £m £m
IRB Corporates - SME 1 0.00 to <0.15 97 102 44 142 0.1 49 45 2.97 48 34 — Corporates - SME 2 0.15 to <0.25 347 146 57 431 0.2 1,216 30 3.74 94 22 — Corporates - SME 3 0.25 to <0.50 1,854 725 62 2,310 0.4 7,262 31 3.27 774 34 3 Corporates - SME 4 0.50 to <0.75 2,309 716 60 2,753 0.6 6,036 28 3.08 1,094 40 5 Corporates - SME 5 0.75 to <2.50 9,606 2,817 56 11,247 1.3 22,911 28 3.08 5,939 53 42 Corporates - SME 6 2.50 to <10.0 5,469 1,431 50 6,257 3.6 13,279 24 2.85 3,360 54 52 Corporates - SME 7 10.0 to <100.00 793 115 52 866 16.0 2,246 24 2.78 709 82 32 Corporates - SME 8 100.00 (default) 1,917 70 35 1,954 100.0 6,009 65 2.41 — — 1,270 Total - Corporates - SME 22,392 6,122 55 25,960 9.6 59,008 30 2.99 12,018 46 1,404 1,483 Corporates - Other 1 0.00 to <0.15 22,933 53,511 47 47,948 0.1 3,543 38 3.01 10,003 21 11 Corporates - Other 2 0.15 to <0.25 9,377 13,671 44 15,405 0.2 1,966 44 2.68 7,212 47 13 Corporates - Other 3 0.25 to <0.50 8,293 10,044 46 12,856 0.4 2,402 42 2.71 8,190 64 21 Corporates - Other 4 0.50 to <0.75 3,457 3,614 46 5,119 0.6 1,665 40 2.70 3,904 76 13 Corporates - Other 5 0.75 to <2.50 9,947 6,137 51 13,117 1.3 11,742 37 2.78 11,874 91 61 Corporates - Other 6 2.50 to <10.0 5,345 2,697 53 6,609 5.5 10,921 30 2.61 6,687 101 84 Corporates - Other 7 10.0 to <100.00 605 389 46 781 17.6 954 26 2.18 1,032 132 37 Corporates - Other 8 100.00 (default) 1,772 214 40 1,873 100.0 3,972 71 2.09 — — 1,336 Total - Corporates - Other 61,729 90,277 47 103,708 2.6 37,165 39 2.83 48,902 47 1,576 1,717 Equities 1 0.00 to <0.15 — — — — — — — — — — — Equities 2 0.15 to <0.25 — — — — — — — — — — — Equities 3 0.25 to <0.50 — — — — — — — — — — — Equities 4 0.50 to <0.75 — — — — — — — — — — — Equities 5 0.75 to <2.50 261 — — 261 1.3 16 90 5.00 733 282 3 Equities 6 2.50 to <10.0 57 — — 48 2.5 29 90 5.00 156 326 1 Equities 7 10.0 to <100.00 — — — — — — — — — — — Equities 8 100.00 (default) — — — — 100.0 2 90 5.00 — — — Total - Equities 318 — — 309 1.6 47 90 5.00 889 288 4 1 Total - Wholesale all portfolios 155,213 136,667 42 212,239 2.6 97,524 40 2.49 70,669 33 3,155 3,342
Key points Retail exposure classes - The RWA density reductions reflected improved asset quality due to
current benign credit conditions. Institutions - RWA density increased following the update to the bank PD model reflecting a
reduction in implied government support, offset in part by the inclusion of more recent loss experience in the LGD model.
Corporates - Specialised lending: The reduction in RWA density reflected asset sales and loan
amortisations as well as the continued challenging market conditions that affect vessel values in the bulk, container and tanker sectors as a number of customers moved into default.
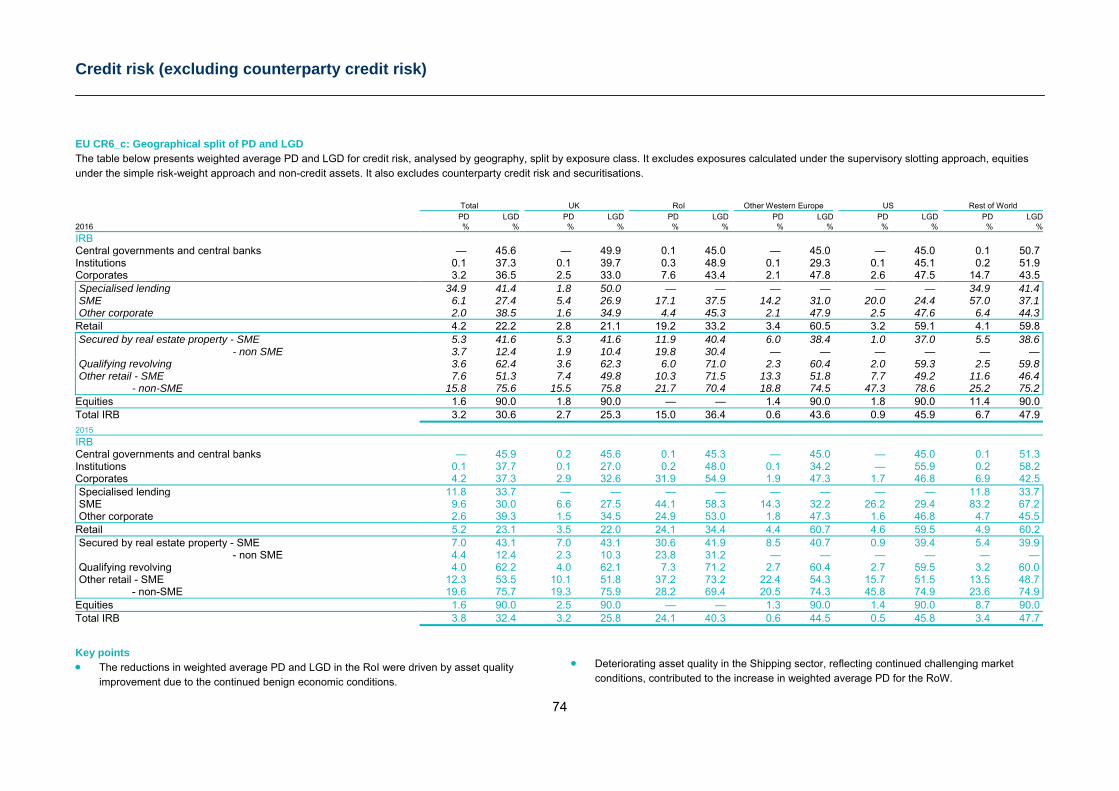
Credit risk (excluding counterparty credit risk)
74
EU CR6_c: Geographical split of PD and LGD The table below presents weighted average PD and LGD for credit risk, analysed by geography, split by exposure class. It excludes exposures calculated under the supervisory slotting approach, equities under the simple risk-weight approach and non-credit assets. It also excludes counterparty credit risk and securitisations.
Total UK RoI Other Western Europe US Rest of World PD LGD PD LGD PD LGD PD LGD PD LGD PD LGD2016 % % % % % % % % % % % %
IRB Central governments and central banks — 45.6 — 49.9 0.1 45.0 — 45.0 — 45.0 0.1 50.7 Institutions 0.1 37.3 0.1 39.7 0.3 48.9 0.1 29.3 0.1 45.1 0.2 51.9 Corporates 3.2 36.5 2.5 33.0 7.6 43.4 2.1 47.8 2.6 47.5 14.7 43.5 Specialised lending 34.9 41.4 1.8 50.0 — — — — — — 34.9 41.4 SME 6.1 27.4 5.4 26.9 17.1 37.5 14.2 31.0 20.0 24.4 57.0 37.1 Other corporate 2.0 38.5 1.6 34.9 4.4 45.3 2.1 47.9 2.5 47.6 6.4 44.3 Retail 4.2 22.2 2.8 21.1 19.2 33.2 3.4 60.5 3.2 59.1 4.1 59.8 Secured by real estate property - SME 5.3 41.6 5.3 41.6 11.9 40.4 6.0 38.4 1.0 37.0 5.5 38.6 - non SME 3.7 12.4 1.9 10.4 19.8 30.4 — — — — — — Qualifying revolving 3.6 62.4 3.6 62.3 6.0 71.0 2.3 60.4 2.0 59.3 2.5 59.8 Other retail - SME 7.6 51.3 7.4 49.8 10.3 71.5 13.3 51.8 7.7 49.2 11.6 46.4 - non-SME 15.8 75.6 15.5 75.8 21.7 70.4 18.8 74.5 47.3 78.6 25.2 75.2 Equities 1.6 90.0 1.8 90.0 — — 1.4 90.0 1.8 90.0 11.4 90.0 Total IRB 3.2 30.6 2.7 25.3 15.0 36.4 0.6 43.6 0.9 45.9 6.7 47.9 2015
IRB Central governments and central banks — 45.9 0.2 45.6 0.1 45.3 — 45.0 — 45.0 0.1 51.3 Institutions 0.1 37.7 0.1 27.0 0.2 48.0 0.1 34.2 — 55.9 0.2 58.2 Corporates 4.2 37.3 2.9 32.6 31.9 54.9 1.9 47.3 1.7 46.8 6.9 42.5 Specialised lending 11.8 33.7 — — — — — — — — 11.8 33.7 SME 9.6 30.0 6.6 27.5 44.1 58.3 14.3 32.2 26.2 29.4 83.2 67.2 Other corporate 2.6 39.3 1.5 34.5 24.9 53.0 1.8 47.3 1.6 46.8 4.7 45.5 Retail 5.2 23.1 3.5 22.0 24.1 34.4 4.4 60.7 4.6 59.5 4.9 60.2 Secured by real estate property - SME 7.0 43.1 7.0 43.1 30.6 41.9 8.5 40.7 0.9 39.4 5.4 39.9 - non SME 4.4 12.4 2.3 10.3 23.8 31.2 — — — — — — Qualifying revolving 4.0 62.2 4.0 62.1 7.3 71.2 2.7 60.4 2.7 59.5 3.2 60.0 Other retail - SME 12.3 53.5 10.1 51.8 37.2 73.2 22.4 54.3 15.7 51.5 13.5 48.7 - non-SME 19.6 75.7 19.3 75.9 28.2 69.4 20.5 74.3 45.8 74.9 23.6 74.9 Equities 1.6 90.0 2.5 90.0 — — 1.3 90.0 1.4 90.0 8.7 90.0 Total IRB 3.8 32.4 3.2 25.8 24.1 40.3 0.6 44.5 0.5 45.8 3.4 47.7
Key points The reductions in weighted average PD and LGD in the RoI were driven by asset quality
improvement due to the continued benign economic conditions.
Deteriorating asset quality in the Shipping sector, reflecting continued challenging market
conditions, contributed to the increase in weighted average PD for the RoW.
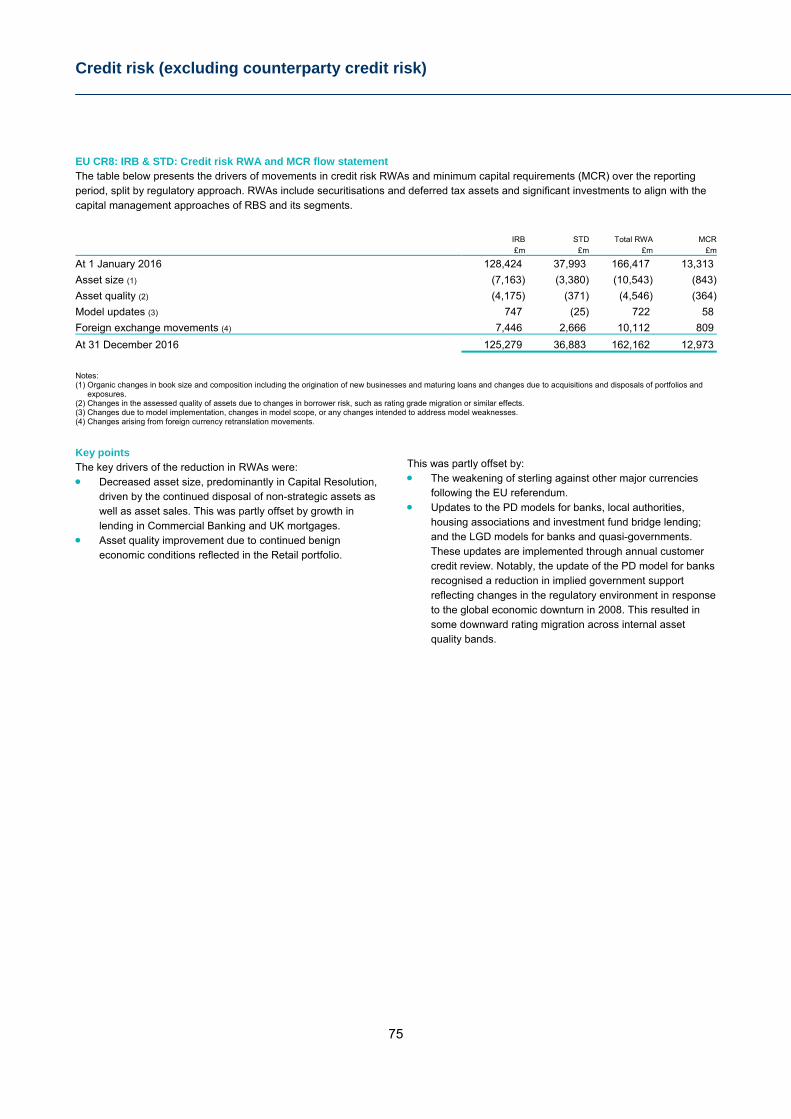
Credit risk (excluding counterparty credit risk)
75
EU CR8: IRB & STD: Credit risk RWA and MCR flow statement The table below presents the drivers of movements in credit risk RWAs and minimum capital requirements (MCR) over the reporting period, split by regulatory approach. RWAs include securitisations and deferred tax assets and significant investments to align with the capital management approaches of RBS and its segments.
IRB STD Total RWA MCR£m £m £m £m
At 1 January 2016 128,424 37,993 166,417 13,313
Asset size (1) (7,163) (3,380) (10,543) (843)
Asset quality (2) (4,175) (371) (4,546) (364)
Model updates (3) 747 (25) 722 58
Foreign exchange movements (4) 7,446 2,666 10,112 809
At 31 December 2016 125,279 36,883 162,162 12,973
Notes: (1) Organic changes in book size and composition including the origination of new businesses and maturing loans and changes due to acquisitions and disposals of portfolios and
exposures. (2) Changes in the assessed quality of assets due to changes in borrower risk, such as rating grade migration or similar effects. (3) Changes due to model implementation, changes in model scope, or any changes intended to address model weaknesses. (4) Changes arising from foreign currency retranslation movements.
Key points The key drivers of the reduction in RWAs were: Decreased asset size, predominantly in Capital Resolution,
driven by the continued disposal of non-strategic assets as well as asset sales. This was partly offset by growth in lending in Commercial Banking and UK mortgages.
Asset quality improvement due to continued benign economic conditions reflected in the Retail portfolio.
This was partly offset by: The weakening of sterling against other major currencies
following the EU referendum. Updates to the PD models for banks, local authorities,
housing associations and investment fund bridge lending; and the LGD models for banks and quasi-governments. These updates are implemented through annual customer credit review. Notably, the update of the PD model for banks recognised a reduction in implied government support reflecting changes in the regulatory environment in response to the global economic downturn in 2008. This resulted in some downward rating migration across internal asset quality bands.
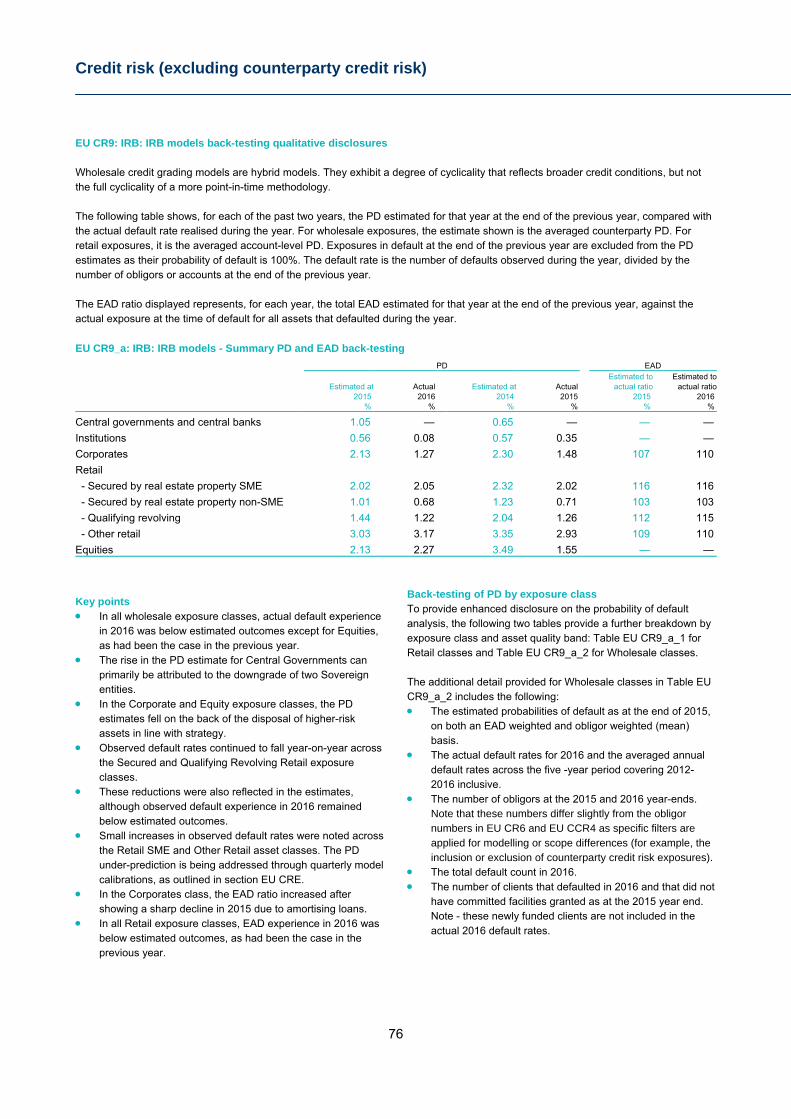
Credit risk (excluding counterparty credit risk)
76
EU CR9: IRB: IRB models back-testing qualitative disclosures Wholesale credit grading models are hybrid models. They exhibit a degree of cyclicality that reflects broader credit conditions, but not the full cyclicality of a more point-in-time methodology. The following table shows, for each of the past two years, the PD estimated for that year at the end of the previous year, compared with the actual default rate realised during the year. For wholesale exposures, the estimate shown is the averaged counterparty PD. For retail exposures, it is the averaged account-level PD. Exposures in default at the end of the previous year are excluded from the PD estimates as their probability of default is 100%. The default rate is the number of defaults observed during the year, divided by the number of obligors or accounts at the end of the previous year. The EAD ratio displayed represents, for each year, the total EAD estimated for that year at the end of the previous year, against the actual exposure at the time of default for all assets that defaulted during the year.
EU CR9_a: IRB: IRB models - Summary PD and EAD back-testing PD EAD Estimated to Estimated to
Estimated at Actual Estimated at Actual actual ratio actual ratio2015 2016 2014 2015 2015 2016
% % % % % %
Central governments and central banks 1.05 — 0.65 — — —
Institutions 0.56 0.08 0.57 0.35 — —
Corporates 2.13 1.27 2.30 1.48 107 110
Retail
- Secured by real estate property SME 2.02 2.05 2.32 2.02 116 116
- Secured by real estate property non-SME 1.01 0.68 1.23 0.71 103 103
- Qualifying revolving 1.44 1.22 2.04 1.26 112 115
- Other retail 3.03 3.17 3.35 2.93 109 110
Equities 2.13 2.27 3.49 1.55 — —
Key points In all wholesale exposure classes, actual default experience
in 2016 was below estimated outcomes except for Equities, as had been the case in the previous year.
The rise in the PD estimate for Central Governments can primarily be attributed to the downgrade of two Sovereign entities.
In the Corporate and Equity exposure classes, the PD estimates fell on the back of the disposal of higher-risk assets in line with strategy.
Observed default rates continued to fall year-on-year across the Secured and Qualifying Revolving Retail exposure classes.
These reductions were also reflected in the estimates, although observed default experience in 2016 remained below estimated outcomes.
Small increases in observed default rates were noted across the Retail SME and Other Retail asset classes. The PD under-prediction is being addressed through quarterly model calibrations, as outlined in section EU CRE.
In the Corporates class, the EAD ratio increased after showing a sharp decline in 2015 due to amortising loans.
In all Retail exposure classes, EAD experience in 2016 was below estimated outcomes, as had been the case in the previous year.
Back-testing of PD by exposure class To provide enhanced disclosure on the probability of default analysis, the following two tables provide a further breakdown by exposure class and asset quality band: Table EU CR9_a_1 for Retail classes and Table EU CR9_a_2 for Wholesale classes. The additional detail provided for Wholesale classes in Table EU CR9_a_2 includes the following: The estimated probabilities of default as at the end of 2015,
on both an EAD weighted and obligor weighted (mean) basis.
The actual default rates for 2016 and the averaged annual default rates across the five -year period covering 2012-2016 inclusive.
The number of obligors at the 2015 and 2016 year-ends. Note that these numbers differ slightly from the obligor numbers in EU CR6 and EU CCR4 as specific filters are applied for modelling or scope differences (for example, the inclusion or exclusion of counterparty credit risk exposures).
The total default count in 2016. The number of clients that defaulted in 2016 and that did not
have committed facilities granted as at the 2015 year end. Note - these newly funded clients are not included in the actual 2016 default rates.
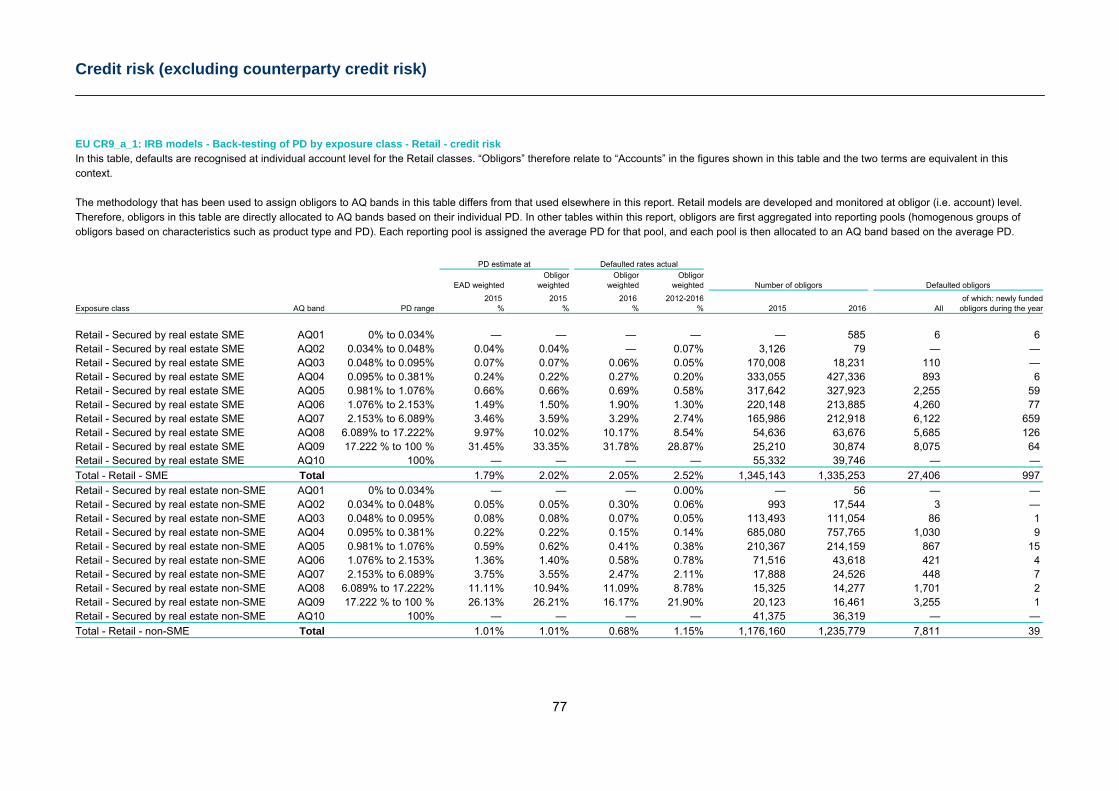
Credit risk (excluding counterparty credit risk)
77
EU CR9_a_1: IRB models - Back-testing of PD by exposure class - Retail - credit risk In this table, defaults are recognised at individual account level for the Retail classes. “Obligors” therefore relate to “Accounts” in the figures shown in this table and the two terms are equivalent in this context. The methodology that has been used to assign obligors to AQ bands in this table differs from that used elsewhere in this report. Retail models are developed and monitored at obligor (i.e. account) level. Therefore, obligors in this table are directly allocated to AQ bands based on their individual PD. In other tables within this report, obligors are first aggregated into reporting pools (homogenous groups of obligors based on characteristics such as product type and PD). Each reporting pool is assigned the average PD for that pool, and each pool is then allocated to an AQ band based on the average PD.
PD estimate at Defaulted rates actual Obligor Obligor Obligor EAD weighted weighted weighted weighted Number of obligors Defaulted obligors
2015 2015 2016 2012-2016 of which: newly fundedExposure class AQ band PD range % % % % 2015 2016 All obligors during the year
Retail - Secured by real estate SME AQ01 0% to 0.034% — — — — — 585 6 6 Retail - Secured by real estate SME AQ02 0.034% to 0.048% 0.04% 0.04% — 0.07% 3,126 79 — — Retail - Secured by real estate SME AQ03 0.048% to 0.095% 0.07% 0.07% 0.06% 0.05% 170,008 18,231 110 — Retail - Secured by real estate SME AQ04 0.095% to 0.381% 0.24% 0.22% 0.27% 0.20% 333,055 427,336 893 6 Retail - Secured by real estate SME AQ05 0.981% to 1.076% 0.66% 0.66% 0.69% 0.58% 317,642 327,923 2,255 59 Retail - Secured by real estate SME AQ06 1.076% to 2.153% 1.49% 1.50% 1.90% 1.30% 220,148 213,885 4,260 77 Retail - Secured by real estate SME AQ07 2.153% to 6.089% 3.46% 3.59% 3.29% 2.74% 165,986 212,918 6,122 659 Retail - Secured by real estate SME AQ08 6.089% to 17.222% 9.97% 10.02% 10.17% 8.54% 54,636 63,676 5,685 126 Retail - Secured by real estate SME AQ09 17.222 % to 100 % 31.45% 33.35% 31.78% 28.87% 25,210 30,874 8,075 64 Retail - Secured by real estate SME AQ10 100% — — — — 55,332 39,746 — —
Total - Retail - SME Total 1.79% 2.02% 2.05% 2.52% 1,345,143 1,335,253 27,406 997
Retail - Secured by real estate non-SME AQ01 0% to 0.034% — — — 0.00% — 56 — — Retail - Secured by real estate non-SME AQ02 0.034% to 0.048% 0.05% 0.05% 0.30% 0.06% 993 17,544 3 — Retail - Secured by real estate non-SME AQ03 0.048% to 0.095% 0.08% 0.08% 0.07% 0.05% 113,493 111,054 86 1 Retail - Secured by real estate non-SME AQ04 0.095% to 0.381% 0.22% 0.22% 0.15% 0.14% 685,080 757,765 1,030 9 Retail - Secured by real estate non-SME AQ05 0.981% to 1.076% 0.59% 0.62% 0.41% 0.38% 210,367 214,159 867 15 Retail - Secured by real estate non-SME AQ06 1.076% to 2.153% 1.36% 1.40% 0.58% 0.78% 71,516 43,618 421 4 Retail - Secured by real estate non-SME AQ07 2.153% to 6.089% 3.75% 3.55% 2.47% 2.11% 17,888 24,526 448 7 Retail - Secured by real estate non-SME AQ08 6.089% to 17.222% 11.11% 10.94% 11.09% 8.78% 15,325 14,277 1,701 2 Retail - Secured by real estate non-SME AQ09 17.222 % to 100 % 26.13% 26.21% 16.17% 21.90% 20,123 16,461 3,255 1 Retail - Secured by real estate non-SME AQ10 100% — — — — 41,375 36,319 — —
Total - Retail - non-SME Total 1.01% 1.01% 0.68% 1.15% 1,176,160 1,235,779 7,811 39
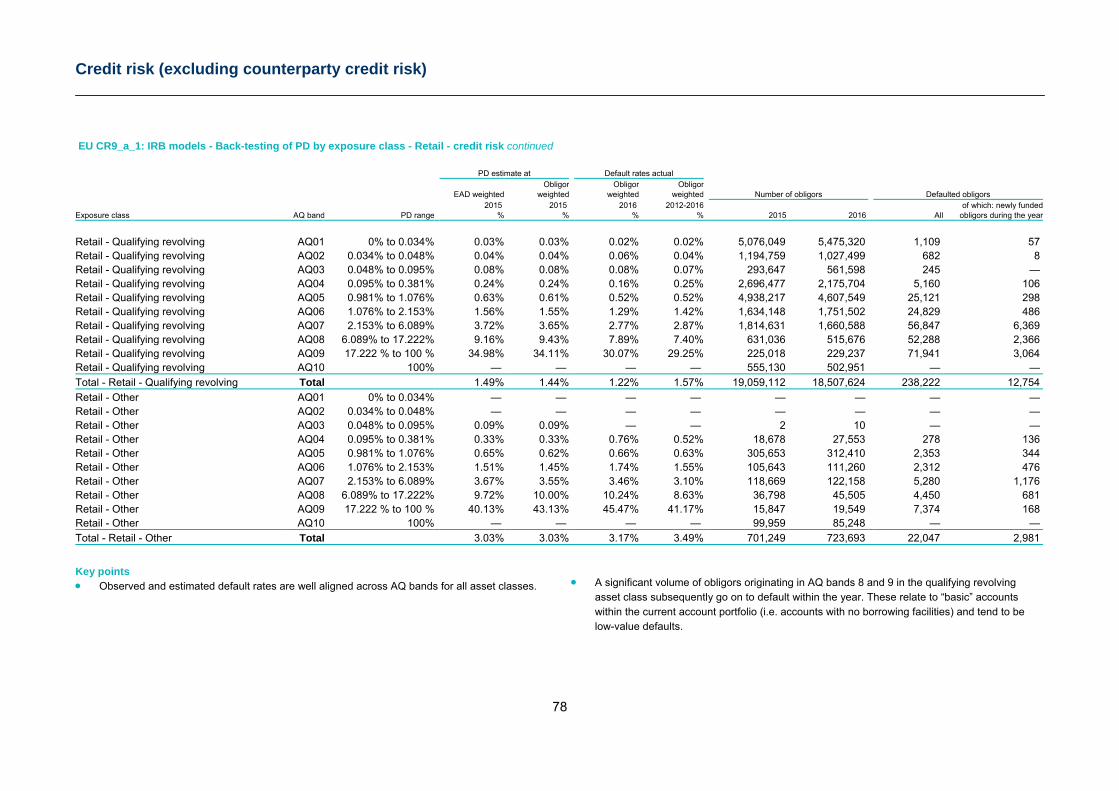
Credit risk (excluding counterparty credit risk)
78
EU CR9_a_1: IRB models - Back-testing of PD by exposure class - Retail - credit risk continued PD estimate at Default rates actual Obligor Obligor Obligor EAD weighted weighted weighted weighted Number of obligors Defaulted obligors 2015 2015 2016 2012-2016 of which: newly fundedExposure class AQ band PD range % % % % 2015 2016 All obligors during the year
Retail - Qualifying revolving AQ01 0% to 0.034% 0.03% 0.03% 0.02% 0.02% 5,076,049 5,475,320 1,109 57 Retail - Qualifying revolving AQ02 0.034% to 0.048% 0.04% 0.04% 0.06% 0.04% 1,194,759 1,027,499 682 8 Retail - Qualifying revolving AQ03 0.048% to 0.095% 0.08% 0.08% 0.08% 0.07% 293,647 561,598 245 — Retail - Qualifying revolving AQ04 0.095% to 0.381% 0.24% 0.24% 0.16% 0.25% 2,696,477 2,175,704 5,160 106 Retail - Qualifying revolving AQ05 0.981% to 1.076% 0.63% 0.61% 0.52% 0.52% 4,938,217 4,607,549 25,121 298 Retail - Qualifying revolving AQ06 1.076% to 2.153% 1.56% 1.55% 1.29% 1.42% 1,634,148 1,751,502 24,829 486 Retail - Qualifying revolving AQ07 2.153% to 6.089% 3.72% 3.65% 2.77% 2.87% 1,814,631 1,660,588 56,847 6,369 Retail - Qualifying revolving AQ08 6.089% to 17.222% 9.16% 9.43% 7.89% 7.40% 631,036 515,676 52,288 2,366 Retail - Qualifying revolving AQ09 17.222 % to 100 % 34.98% 34.11% 30.07% 29.25% 225,018 229,237 71,941 3,064 Retail - Qualifying revolving AQ10 100% — — — — 555,130 502,951 — —
Total - Retail - Qualifying revolving Total 1.49% 1.44% 1.22% 1.57% 19,059,112 18,507,624 238,222 12,754
Retail - Other AQ01 0% to 0.034% — — — — — — — — Retail - Other AQ02 0.034% to 0.048% — — — — — — — — Retail - Other AQ03 0.048% to 0.095% 0.09% 0.09% — — 2 10 — — Retail - Other AQ04 0.095% to 0.381% 0.33% 0.33% 0.76% 0.52% 18,678 27,553 278 136 Retail - Other AQ05 0.981% to 1.076% 0.65% 0.62% 0.66% 0.63% 305,653 312,410 2,353 344 Retail - Other AQ06 1.076% to 2.153% 1.51% 1.45% 1.74% 1.55% 105,643 111,260 2,312 476 Retail - Other AQ07 2.153% to 6.089% 3.67% 3.55% 3.46% 3.10% 118,669 122,158 5,280 1,176 Retail - Other AQ08 6.089% to 17.222% 9.72% 10.00% 10.24% 8.63% 36,798 45,505 4,450 681 Retail - Other AQ09 17.222 % to 100 % 40.13% 43.13% 45.47% 41.17% 15,847 19,549 7,374 168 Retail - Other AQ10 100% — — — — 99,959 85,248 — —
Total - Retail - Other Total 3.03% 3.03% 3.17% 3.49% 701,249 723,693 22,047 2,981
Key points Observed and estimated default rates are well aligned across AQ bands for all asset classes.
A significant volume of obligors originating in AQ bands 8 and 9 in the qualifying revolving
asset class subsequently go on to default within the year. These relate to “basic” accounts within the current account portfolio (i.e. accounts with no borrowing facilities) and tend to be low-value defaults.
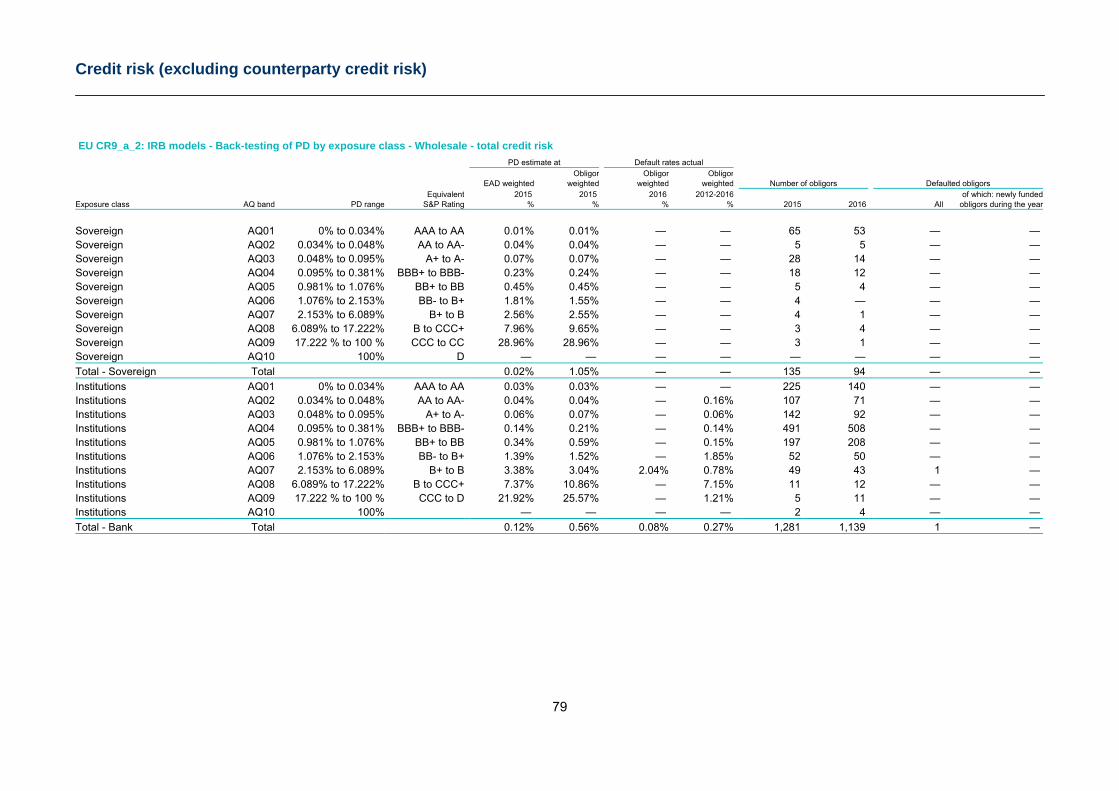
Credit risk (excluding counterparty credit risk)
79
EU CR9_a_2: IRB models - Back-testing of PD by exposure class - Wholesale - total credit risk PD estimate at Default rates actual Obligor Obligor Obligor EAD weighted weighted weighted weighted Number of obligors Defaulted obligors Equivalent 2015 2015 2016 2012-2016 of which: newly fundedExposure class AQ band PD range S&P Rating % % % % 2015 2016 All obligors during the year
Sovereign AQ01 0% to 0.034% AAA to AA 0.01% 0.01% — — 65 53 — — Sovereign AQ02 0.034% to 0.048% AA to AA- 0.04% 0.04% — — 5 5 — — Sovereign AQ03 0.048% to 0.095% A+ to A- 0.07% 0.07% — — 28 14 — — Sovereign AQ04 0.095% to 0.381% BBB+ to BBB- 0.23% 0.24% — — 18 12 — — Sovereign AQ05 0.981% to 1.076% BB+ to BB 0.45% 0.45% — — 5 4 — — Sovereign AQ06 1.076% to 2.153% BB- to B+ 1.81% 1.55% — — 4 — — — Sovereign AQ07 2.153% to 6.089% B+ to B 2.56% 2.55% — — 4 1 — — Sovereign AQ08 6.089% to 17.222% B to CCC+ 7.96% 9.65% — — 3 4 — — Sovereign AQ09 17.222 % to 100 % CCC to CC 28.96% 28.96% — — 3 1 — — Sovereign AQ10 100% D — — — — — — — —
Total - Sovereign Total 0.02% 1.05% — — 135 94 — —
Institutions AQ01 0% to 0.034% AAA to AA 0.03% 0.03% — — 225 140 — — Institutions AQ02 0.034% to 0.048% AA to AA- 0.04% 0.04% — 0.16% 107 71 — — Institutions AQ03 0.048% to 0.095% A+ to A- 0.06% 0.07% — 0.06% 142 92 — — Institutions AQ04 0.095% to 0.381% BBB+ to BBB- 0.14% 0.21% — 0.14% 491 508 — — Institutions AQ05 0.981% to 1.076% BB+ to BB 0.34% 0.59% — 0.15% 197 208 — — Institutions AQ06 1.076% to 2.153% BB- to B+ 1.39% 1.52% — 1.85% 52 50 — — Institutions AQ07 2.153% to 6.089% B+ to B 3.38% 3.04% 2.04% 0.78% 49 43 1 — Institutions AQ08 6.089% to 17.222% B to CCC+ 7.37% 10.86% — 7.15% 11 12 — — Institutions AQ09 17.222 % to 100 % CCC to D 21.92% 25.57% — 1.21% 5 11 — — Institutions AQ10 100% — — — — 2 4 — —
Total - Bank Total 0.12% 0.56% 0.08% 0.27% 1,281 1,139 1 —
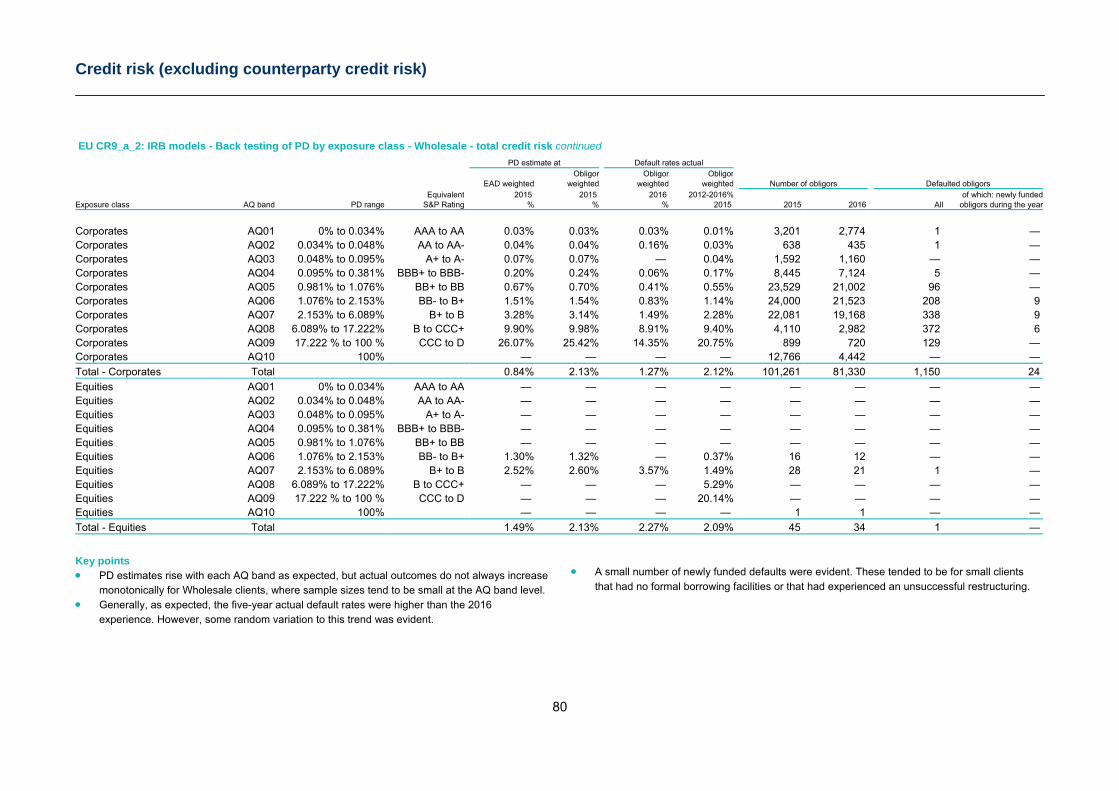
Credit risk (excluding counterparty credit risk)
80
EU CR9_a_2: IRB models - Back testing of PD by exposure class - Wholesale - total credit risk continued PD estimate at Default rates actual Obligor Obligor Obligor EAD weighted weighted weighted weighted Number of obligors Defaulted obligors Equivalent 2015 2015 2016 2012-2016% of which: newly fundedExposure class AQ band PD range S&P Rating % % % 2015 2015 2016 All obligors during the year
Corporates AQ01 0% to 0.034% AAA to AA 0.03% 0.03% 0.03% 0.01% 3,201 2,774 1 — Corporates AQ02 0.034% to 0.048% AA to AA- 0.04% 0.04% 0.16% 0.03% 638 435 1 — Corporates AQ03 0.048% to 0.095% A+ to A- 0.07% 0.07% — 0.04% 1,592 1,160 — — Corporates AQ04 0.095% to 0.381% BBB+ to BBB- 0.20% 0.24% 0.06% 0.17% 8,445 7,124 5 — Corporates AQ05 0.981% to 1.076% BB+ to BB 0.67% 0.70% 0.41% 0.55% 23,529 21,002 96 — Corporates AQ06 1.076% to 2.153% BB- to B+ 1.51% 1.54% 0.83% 1.14% 24,000 21,523 208 9 Corporates AQ07 2.153% to 6.089% B+ to B 3.28% 3.14% 1.49% 2.28% 22,081 19,168 338 9 Corporates AQ08 6.089% to 17.222% B to CCC+ 9.90% 9.98% 8.91% 9.40% 4,110 2,982 372 6 Corporates AQ09 17.222 % to 100 % CCC to D 26.07% 25.42% 14.35% 20.75% 899 720 129 — Corporates AQ10 100% — — — — 12,766 4,442 — —
Total - Corporates Total 0.84% 2.13% 1.27% 2.12% 101,261 81,330 1,150 24
Equities AQ01 0% to 0.034% AAA to AA — — — — — — — — Equities AQ02 0.034% to 0.048% AA to AA- — — — — — — — — Equities AQ03 0.048% to 0.095% A+ to A- — — — — — — — — Equities AQ04 0.095% to 0.381% BBB+ to BBB- — — — — — — — — Equities AQ05 0.981% to 1.076% BB+ to BB — — — — — — — — Equities AQ06 1.076% to 2.153% BB- to B+ 1.30% 1.32% — 0.37% 16 12 — — Equities AQ07 2.153% to 6.089% B+ to B 2.52% 2.60% 3.57% 1.49% 28 21 1 — Equities AQ08 6.089% to 17.222% B to CCC+ — — — 5.29% — — — — Equities AQ09 17.222 % to 100 % CCC to D — — — 20.14% — — — — Equities AQ10 100% — — — — 1 1 — —
Total - Equities Total 1.49% 2.13% 2.27% 2.09% 45 34 1 —
Key points PD estimates rise with each AQ band as expected, but actual outcomes do not always increase
monotonically for Wholesale clients, where sample sizes tend to be small at the AQ band level. Generally, as expected, the five-year actual default rates were higher than the 2016
experience. However, some random variation to this trend was evident.
A small number of newly funded defaults were evident. These tended to be for small clients
that had no formal borrowing facilities or that had experienced an unsuccessful restructuring.
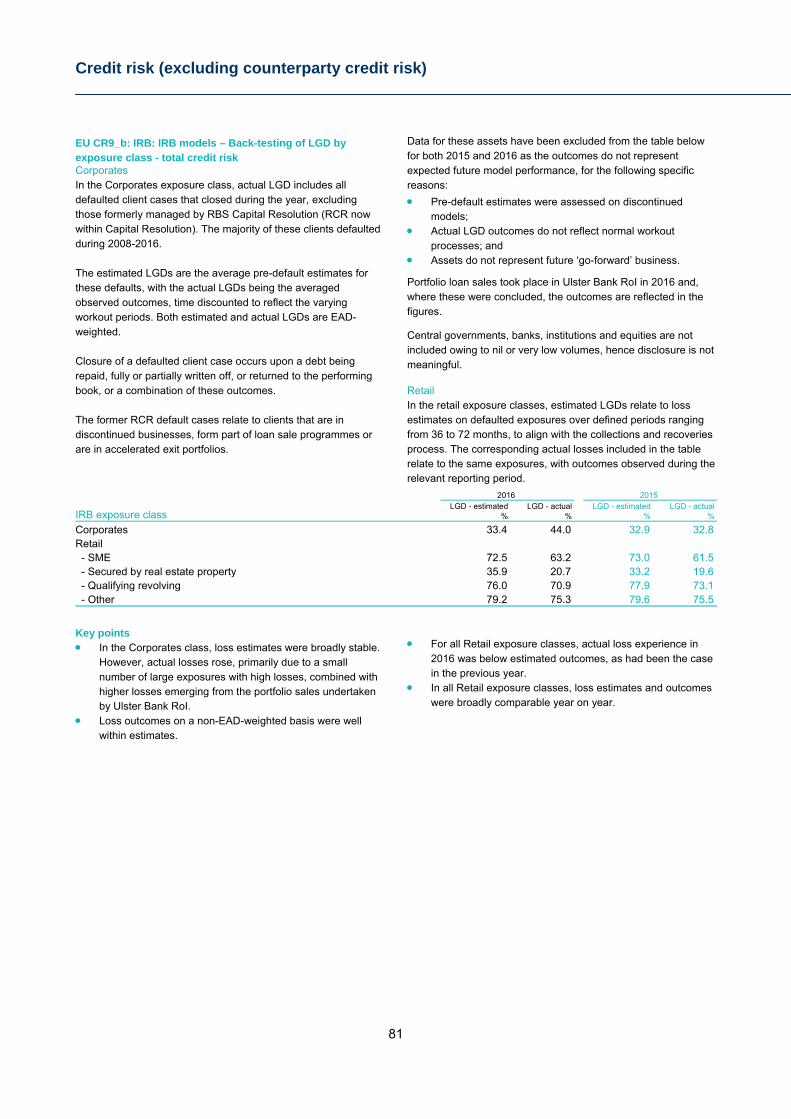
Credit risk (excluding counterparty credit risk)
81
EU CR9_b: IRB: IRB models – Back-testing of LGD by exposure class - total credit risk Corporates In the Corporates exposure class, actual LGD includes all defaulted client cases that closed during the year, excluding those formerly managed by RBS Capital Resolution (RCR now within Capital Resolution). The majority of these clients defaulted during 2008-2016. The estimated LGDs are the average pre-default estimates for these defaults, with the actual LGDs being the averaged observed outcomes, time discounted to reflect the varying workout periods. Both estimated and actual LGDs are EAD-weighted. Closure of a defaulted client case occurs upon a debt being repaid, fully or partially written off, or returned to the performing book, or a combination of these outcomes. The former RCR default cases relate to clients that are in discontinued businesses, form part of loan sale programmes or are in accelerated exit portfolios.
Data for these assets have been excluded from the table below for both 2015 and 2016 as the outcomes do not represent expected future model performance, for the following specific reasons:
Pre-default estimates were assessed on discontinued models;
Actual LGD outcomes do not reflect normal workout processes; and
Assets do not represent future ‘go-forward’ business.
Portfolio loan sales took place in Ulster Bank RoI in 2016 and, where these were concluded, the outcomes are reflected in the figures.
Central governments, banks, institutions and equities are not included owing to nil or very low volumes, hence disclosure is not meaningful.
Retail In the retail exposure classes, estimated LGDs relate to loss estimates on defaulted exposures over defined periods ranging from 36 to 72 months, to align with the collections and recoveries process. The corresponding actual losses included in the table relate to the same exposures, with outcomes observed during the relevant reporting period.
IRB exposure class
2016 2015 LGD - estimated LGD - actual LGD - estimated LGD - actual
% % % %
Corporates 33.4 44.0 32.9 32.8 Retail - SME 72.5 63.2 73.0 61.5 - Secured by real estate property 35.9 20.7 33.2 19.6 - Qualifying revolving 76.0 70.9 77.9 73.1 - Other 79.2 75.3 79.6 75.5
Key points In the Corporates class, loss estimates were broadly stable.
However, actual losses rose, primarily due to a small number of large exposures with high losses, combined with higher losses emerging from the portfolio sales undertaken by Ulster Bank RoI.
Loss outcomes on a non-EAD-weighted basis were well within estimates.
For all Retail exposure classes, actual loss experience in
2016 was below estimated outcomes, as had been the case in the previous year.
In all Retail exposure classes, loss estimates and outcomes were broadly comparable year on year.
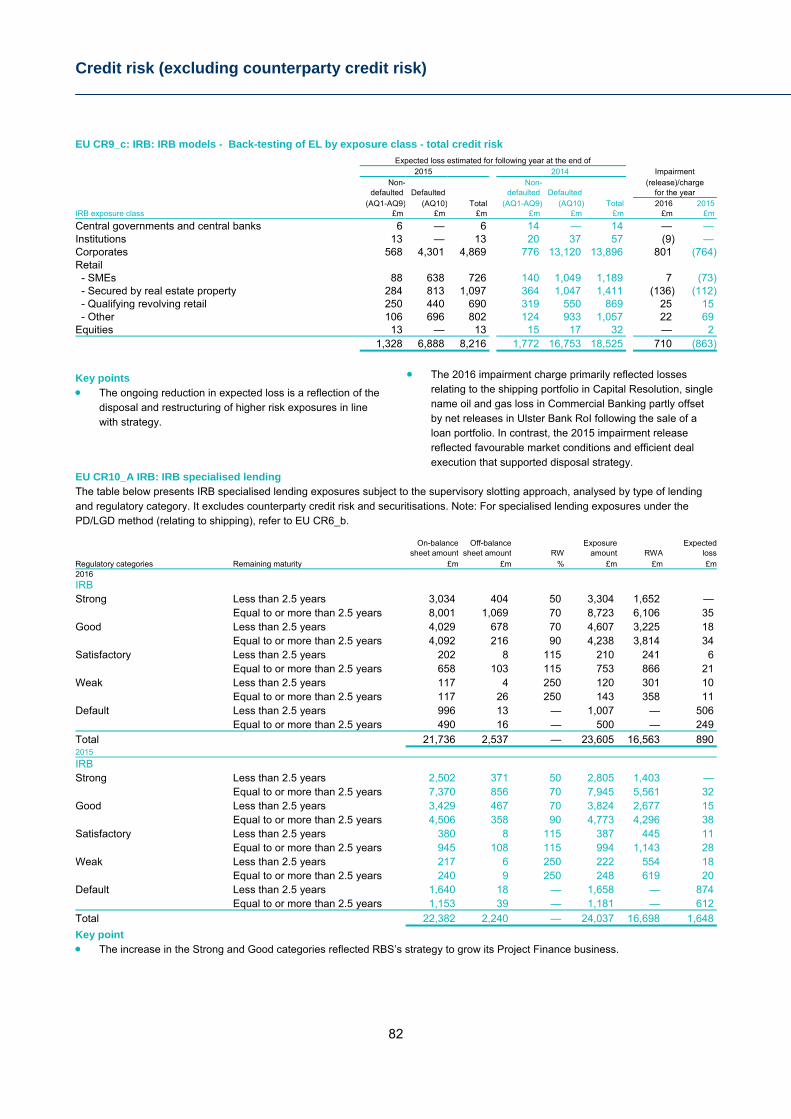
Credit risk (excluding counterparty credit risk)
82
EU CR9_c: IRB: IRB models - Back-testing of EL by exposure class - total credit risk
IRB exposure class
Expected loss estimated for following year at the end of 2015 2014 Impairment
Non- Non- (release)/charge defaulted Defaulted defaulted Defaulted for the year
(AQ1-AQ9) (AQ10) Total (AQ1-AQ9) (AQ10) Total 2016 2015 £m £m £m £m £m £m £m £m
Central governments and central banks 6 — 6 14 — 14 — — Institutions 13 — 13 20 37 57 (9) — Corporates 568 4,301 4,869 776 13,120 13,896 801 (764)Retail - SMEs 88 638 726 140 1,049 1,189 7 (73) - Secured by real estate property 284 813 1,097 364 1,047 1,411 (136) (112) - Qualifying revolving retail 250 440 690 319 550 869 25 15 - Other 106 696 802 124 933 1,057 22 69 Equities 13 — 13 15 17 32 — 2 1,328 6,888 8,216 1,772 16,753 18,525 710 (863)
Key points The ongoing reduction in expected loss is a reflection of the
disposal and restructuring of higher risk exposures in line with strategy.
The 2016 impairment charge primarily reflected losses
relating to the shipping portfolio in Capital Resolution, single name oil and gas loss in Commercial Banking partly offset by net releases in Ulster Bank RoI following the sale of a loan portfolio. In contrast, the 2015 impairment release reflected favourable market conditions and efficient deal execution that supported disposal strategy.
EU CR10_A IRB: IRB specialised lending The table below presents IRB specialised lending exposures subject to the supervisory slotting approach, analysed by type of lending and regulatory category. It excludes counterparty credit risk and securitisations. Note: For specialised lending exposures under the PD/LGD method (relating to shipping), refer to EU CR6_b.
On-balance Off-balance Exposure Expected
Regulatory categories Remaining maturity sheet amount sheet amount RW amount RWA loss
£m £m % £m £m £m2016
IRB Strong Less than 2.5 years 3,034 404 50 3,304 1,652 — Equal to or more than 2.5 years 8,001 1,069 70 8,723 6,106 35 Good Less than 2.5 years 4,029 678 70 4,607 3,225 18 Equal to or more than 2.5 years 4,092 216 90 4,238 3,814 34 Satisfactory Less than 2.5 years 202 8 115 210 241 6 Equal to or more than 2.5 years 658 103 115 753 866 21 Weak Less than 2.5 years 117 4 250 120 301 10 Equal to or more than 2.5 years 117 26 250 143 358 11 Default Less than 2.5 years 996 13 — 1,007 — 506 Equal to or more than 2.5 years 490 16 — 500 — 249
Total 21,736 2,537 — 23,605 16,563 890 2015 IRB Strong Less than 2.5 years 2,502 371 50 2,805 1,403 — Equal to or more than 2.5 years 7,370 856 70 7,945 5,561 32 Good Less than 2.5 years 3,429 467 70 3,824 2,677 15 Equal to or more than 2.5 years 4,506 358 90 4,773 4,296 38 Satisfactory Less than 2.5 years 380 8 115 387 445 11 Equal to or more than 2.5 years 945 108 115 994 1,143 28 Weak Less than 2.5 years 217 6 250 222 554 18 Equal to or more than 2.5 years 240 9 250 248 619 20 Default Less than 2.5 years 1,640 18 — 1,658 — 874 Equal to or more than 2.5 years 1,153 39 — 1,181 — 612
Total 22,382 2,240 — 24,037 16,698 1,648
Key point The increase in the Strong and Good categories reflected RBS’s strategy to grow its Project Finance business.
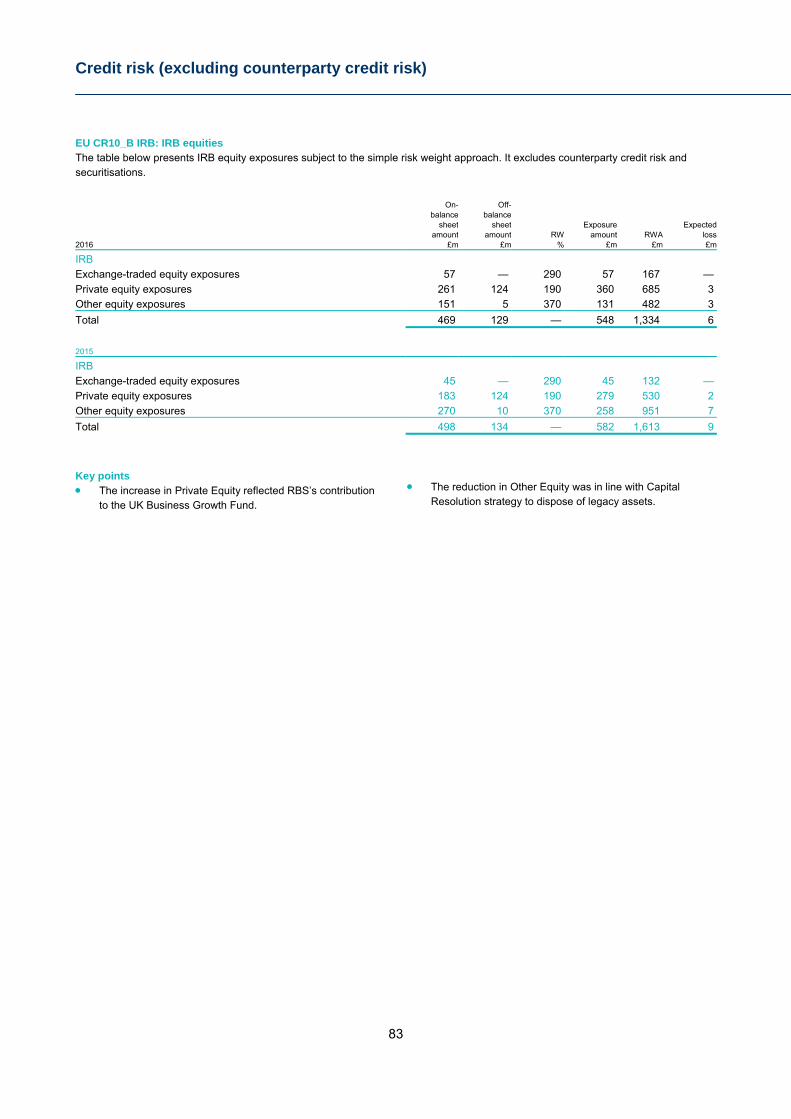
Credit risk (excluding counterparty credit risk)
83
EU CR10_B IRB: IRB equities The table below presents IRB equity exposures subject to the simple risk weight approach. It excludes counterparty credit risk and securitisations.
On- Off- balance balance sheet sheet Exposure Expected amount amount RW amount RWA loss2016 £m £m % £m £m £m
IRB
Exchange-traded equity exposures 57 — 290 57 167 —
Private equity exposures 261 124 190 360 685 3
Other equity exposures 151 5 370 131 482 3
Total 469 129 — 548 1,334 6
2015
IRB
Exchange-traded equity exposures 45 — 290 45 132 —
Private equity exposures 183 124 190 279 530 2
Other equity exposures 270 10 370 258 951 7
Total 498 134 — 582 1,613 9
Key points The increase in Private Equity reflected RBS’s contribution
to the UK Business Growth Fund.
The reduction in Other Equity was in line with Capital
Resolution strategy to dispose of legacy assets.
Counterparty credit risk
84
Counterparty credit risk EU CCRA: CCR: General qualitative information Definition and framework Counterparty credit risk relates to derivative contracts (including over-the-counter (OTC) derivatives and exchange-traded derivatives), securities financing transactions (SFTs), and long settlement transactions in either the trading or the non-trading book. It is the risk of loss arising from a default of a customer before the final settlement of the transaction's cash flows, which vary in value by reference to a market factor, such as an interest rate, exchange rate or asset price. Counterparty credit risk is covered by RBS’s credit risk framework. Refer to the Credit risk section in the 2016 ARA for more information. However, a number of specific policies apply to derivatives including those transacted with central counterparties (CCPs) and SFTs. These include policies that address documentation requirements, product-specific requirements (for example, futures, credit derivatives and securities lending), counterparty specific requirements (for example, hedge funds and pension funds), margin trading, collateral and custodians. EAD calculation methods Internal model method (IMM) RBS has permission from the PRA to use an internal model for calculating EADs for regulatory capital requirements for certain derivatives. The IMM calculates EAD as the product of effective expected positive exposure (EEPE) or stressed EEPE whichever is the higher, and the regulatory prescribed alpha multiplier. The alpha multiplier, which was 1.4 for both 2015 and 2016 and uplifts the EAD, is indicative of the robustness of an institution’s approach and governance framework for managing counterparty credit risk. In accordance with the CRR requirements, the IMM for OTC derivatives is adjusted for wrong-way risk (for more information on wrong-way risks, refer to the following page), collateral and an increased margin period of risk, when appropriate. Mark-to-market (mtm) method For derivatives that fall outside the IMM and for exchange-traded derivatives where RBS does not have permission to use the IMM to calculate EAD for regulatory capital purposes, it calculates counterparty credit risk exposures using the mtm method. Exposure is calculated as the positive mtm value of outstanding contracts plus a potential future exposure. Exposure is adjusted for collateral, including any haircuts applied to collateral in accordance with regulatory requirements. Financial collateral comprehensive method RBS uses the financial collateral comprehensive method for calculating EAD on SFTs. Exposure is adjusted for collateral, after volatility adjustments are applied.
Counterparty credit limit setting Counterparty credit limits are established through the credit risk management framework. Limits are based on the credit quality of the counterparty and the appetite for the projected maximum potential future exposure of transactions, based on 95th percentile confidence levels. The utilisations recorded against the limits also reflect the nature of the relevant documentation and the anticipated close-out periods in the event of default. For CCPs, utilisations are calculated in the same way as for other collateralised counterparties, and a credit limit is set. However, additional limits are set to cover initial margin posted to the CCP, default fund contributions and other contingent liabilities. Counterparty credit risk management The credit policy framework governs counterparty credit risk management requirements. Industry standard documentation (for example, International Swaps and Derivatives Association master agreements for derivatives and Global Master Repurchase Agreements for SFTs) is executed for clients prior to trading. Exceptions to this require specific approval from a senior credit risk officer. The legal and administrative capacity of counterparties to enter into legal agreements, including collateral agreements (such as a credit support annex) is assessed. The policy framework establishes minimum documentation requirements under collateral agreements including: collateral threshold amounts; minimum transfer amounts; minimum haircuts; collateral eligibility criteria; and collateral call frequency. Where netting is not enforceable, exposures are shown gross, and where netting and collateral enforceability criteria are not fulfilled, exposure is assumed to be uncollateralised. The framework also includes a formal escalation policy for counterparty collateral disputes and unpaid collateral calls. Collateral required in the event of a credit rating downgrade RBS calculates the additional collateral it would be required to post in the event of its credit ratings being downgraded by one or two notches. This is undertaken on a daily basis for treasury and liquidity management purposes. Refer to page 446 of the 2016 ARA for more information.
Counterparty credit risk
85
Credit valuation adjustments (CVAs) The counterparty exposure management team charges the relevant trading desk a credit premium at the inception of a trade, in exchange for taking on the credit risk over the life of the transaction. The team may then hedge the default risk using credit derivatives sourced from third party providers. CVA sensitivities may be hedged using a combination of credit derivatives, interest rate derivatives, foreign exchange derivatives and other instruments. RBS calculates a regulatory CVA capital charge. The purpose of this charge is to improve the resilience of banks to potential mark-to-market losses associated with deterioration in the creditworthiness of counterparties in non-cleared derivative trades. Under CRR rules, the charge is calculated using either the advanced approach or the standardised approach. As RBS has regulatory approval to use an internal model to calculate counterparty credit risk capital and permission to use an internal Value-at-Risk model for the specific risk of debt instruments, the advanced approach is used where possible. For products that fall outside the model permissions, the standardised approach, which is based on the external credit rating of the counterparty, is used.
Wrong-way risks Wrong-way risk represents the risk of loss that arises when the risk factors driving the exposure to a counterparty are positively correlated with the probability of default of that counterparty, i.e. the size of the exposure increases at the same time as the risk of the counterparty being unable to meet that obligation increases. In addition to its usual credit approval and credit authority policies, RBS also manages its exposure to wrong-way risk through a dedicated policy that establishes a framework incorporating approvals, controls, limits and regular monitoring, where appropriate. Under the framework, enhanced transaction approval is required and limits are set to constrain wrong-way risk arising through currency exposure to countries classified as high-risk under the internal Watchlist process. The reporting process includes a monthly review of wrong-way risks arising either from such currency exposure or through reverse repos, credit derivatives and equity trades. The framework distinguishes between specific wrong-way risk (where the risk factor driving the exposure is specific to the counterparty) and general wrong-way risk (where the risk factor driving the exposure is not specific to the counterparty but still positively correlated with its probability of default, for instance country or currency related factors).
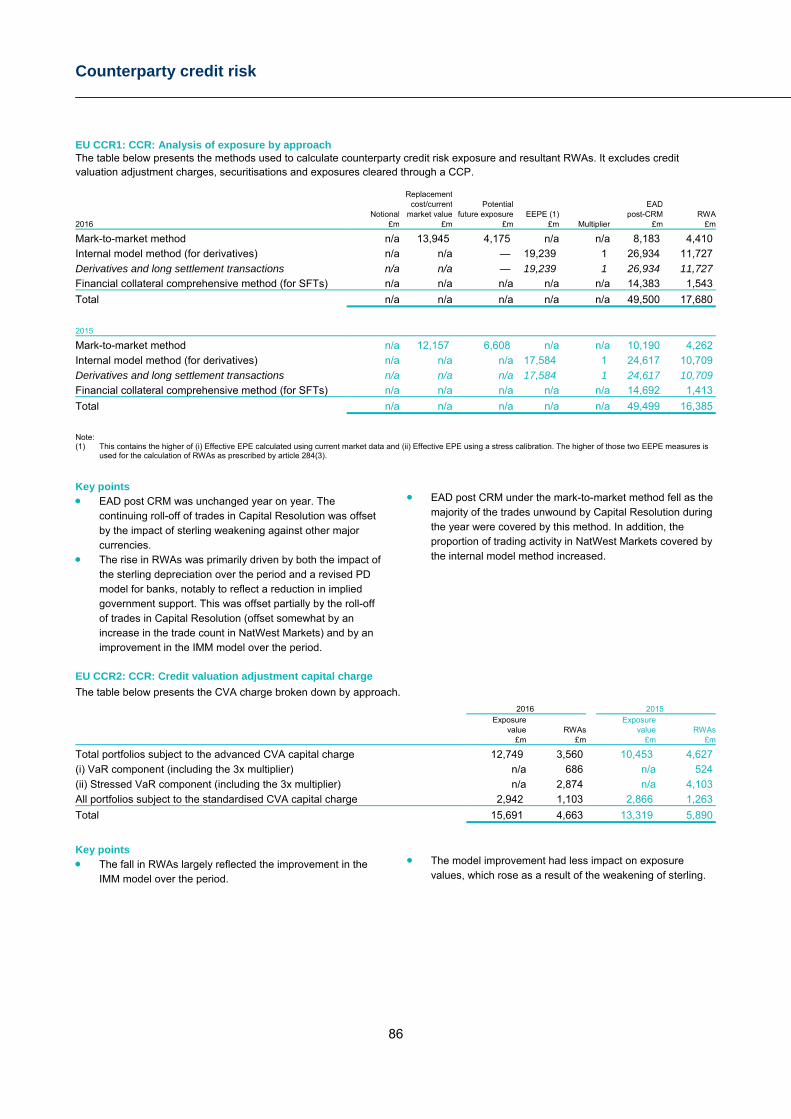
Counterparty credit risk
86
EU CCR1: CCR: Analysis of exposure by approach The table below presents the methods used to calculate counterparty credit risk exposure and resultant RWAs. It excludes credit valuation adjustment charges, securitisations and exposures cleared through a CCP. Replacement cost/current Potential EAD Notional market value future exposure EEPE (1) post-CRM RWA2016 £m £m £m £m Multiplier £m £m
Mark-to-market method n/a 13,945 4,175 n/a n/a 8,183 4,410
Internal model method (for derivatives) n/a n/a — 19,239 1 26,934 11,727
Derivatives and long settlement transactions n/a n/a — 19,239 1 26,934 11,727 Financial collateral comprehensive method (for SFTs) n/a n/a n/a n/a n/a 14,383 1,543
Total n/a n/a n/a n/a n/a 49,500 17,680
2015
Mark-to-market method n/a 12,157 6,608 n/a n/a 10,190 4,262
Internal model method (for derivatives) n/a n/a n/a 17,584 1 24,617 10,709
Derivatives and long settlement transactions n/a n/a n/a 17,584 1 24,617 10,709 Financial collateral comprehensive method (for SFTs) n/a n/a n/a n/a n/a 14,692 1,413
Total n/a n/a n/a n/a n/a 49,499 16,385
Note: (1) This contains the higher of (i) Effective EPE calculated using current market data and (ii) Effective EPE using a stress calibration. The higher of those two EEPE measures is
used for the calculation of RWAs as prescribed by article 284(3).
Key points EAD post CRM was unchanged year on year. The
continuing roll-off of trades in Capital Resolution was offset by the impact of sterling weakening against other major currencies.
The rise in RWAs was primarily driven by both the impact of the sterling depreciation over the period and a revised PD model for banks, notably to reflect a reduction in implied government support. This was offset partially by the roll-off of trades in Capital Resolution (offset somewhat by an increase in the trade count in NatWest Markets) and by an improvement in the IMM model over the period.
EAD post CRM under the mark-to-market method fell as the
majority of the trades unwound by Capital Resolution during the year were covered by this method. In addition, the proportion of trading activity in NatWest Markets covered by the internal model method increased.
EU CCR2: CCR: Credit valuation adjustment capital charge The table below presents the CVA charge broken down by approach. 2016 2015 Exposure Exposure value RWAs value RWAs £m £m £m £m
Total portfolios subject to the advanced CVA capital charge 12,749 3,560 10,453 4,627
(i) VaR component (including the 3x multiplier) n/a 686 n/a 524
(ii) Stressed VaR component (including the 3x multiplier) n/a 2,874 n/a 4,103
All portfolios subject to the standardised CVA capital charge 2,942 1,103 2,866 1,263
Total 15,691 4,663 13,319 5,890
Key points The fall in RWAs largely reflected the improvement in the
IMM model over the period.
The model improvement had less impact on exposure
values, which rose as a result of the weakening of sterling.
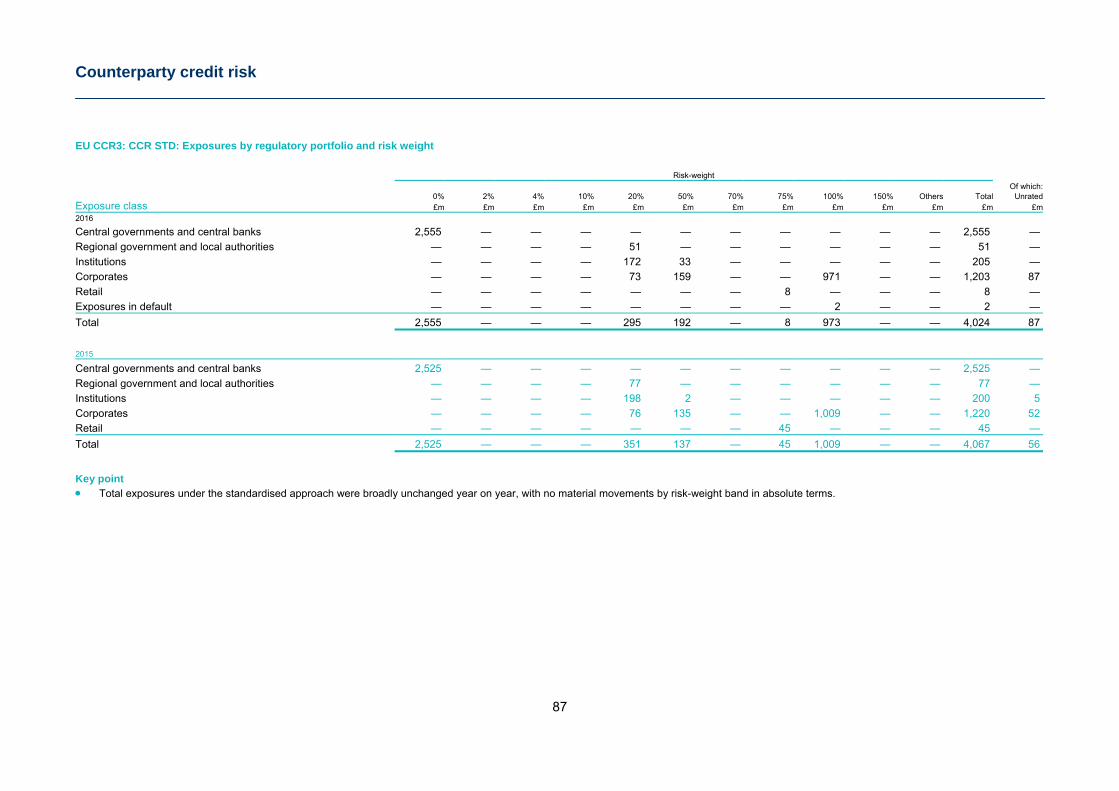
Counterparty credit risk
87
EU CCR3: CCR STD: Exposures by regulatory portfolio and risk weight Risk-weight Of which:
Exposure class 0% 2% 4% 10% 20% 50% 70% 75% 100% 150% Others Total Unrated£m £m £m £m £m £m £m £m £m £m £m £m £m
2016
Central governments and central banks 2,555 — — — — — — — — — — 2,555 —
Regional government and local authorities — — — — 51 — — — — — — 51 —
Institutions — — — — 172 33 — — — — — 205 —
Corporates — — — — 73 159 — — 971 — — 1,203 87
Retail — — — — — — — 8 — — — 8 —
Exposures in default — — — — — — — — 2 — — 2 —
Total 2,555 — — — 295 192 — 8 973 — — 4,024 87
2015
Central governments and central banks 2,525 — — — — — — — — — — 2,525 —
Regional government and local authorities — — — — 77 — — — — — — 77 —
Institutions — — — — 198 2 — — — — — 200 5
Corporates — — — — 76 135 — — 1,009 — — 1,220 52
Retail — — — — — — — 45 — — — 45 —
Total 2,525 — — — 351 137 — 45 1,009 — — 4,067 56
Key point Total exposures under the standardised approach were broadly unchanged year on year, with no material movements by risk-weight band in absolute terms.
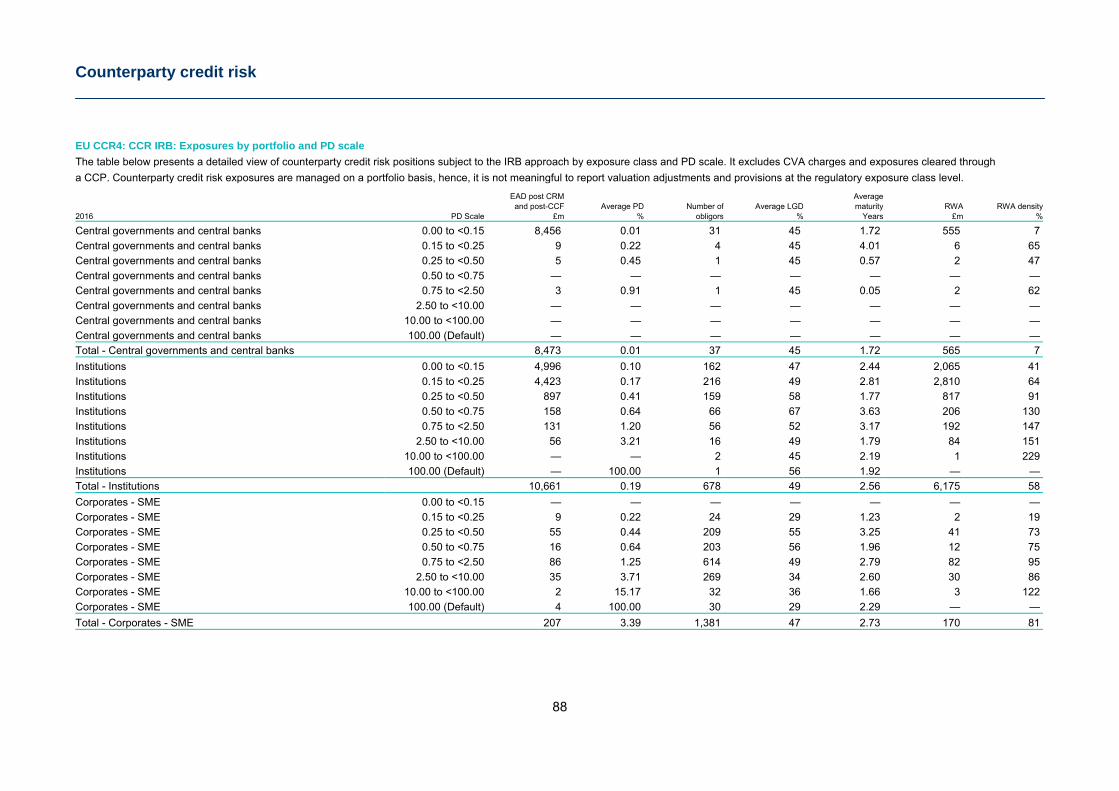
Counterparty credit risk
88
EU CCR4: CCR IRB: Exposures by portfolio and PD scale The table below presents a detailed view of counterparty credit risk positions subject to the IRB approach by exposure class and PD scale. It excludes CVA charges and exposures cleared through a CCP. Counterparty credit risk exposures are managed on a portfolio basis, hence, it is not meaningful to report valuation adjustments and provisions at the regulatory exposure class level.
EAD post CRM Average and post-CCF Average PD Number of Average LGD maturity RWA RWA density2016 PD Scale £m % obligors % Years £m %
Central governments and central banks 0.00 to <0.15 8,456 0.01 31 45 1.72 555 7
Central governments and central banks 0.15 to <0.25 9 0.22 4 45 4.01 6 65
Central governments and central banks 0.25 to <0.50 5 0.45 1 45 0.57 2 47
Central governments and central banks 0.50 to <0.75 — — — — — — —
Central governments and central banks 0.75 to <2.50 3 0.91 1 45 0.05 2 62
Central governments and central banks 2.50 to <10.00 — — — — — — —
Central governments and central banks 10.00 to <100.00 — — — — — — —
Central governments and central banks 100.00 (Default) — — — — — — —
Total - Central governments and central banks 8,473 0.01 37 45 1.72 565 7
Institutions 0.00 to <0.15 4,996 0.10 162 47 2.44 2,065 41
Institutions 0.15 to <0.25 4,423 0.17 216 49 2.81 2,810 64
Institutions 0.25 to <0.50 897 0.41 159 58 1.77 817 91
Institutions 0.50 to <0.75 158 0.64 66 67 3.63 206 130
Institutions 0.75 to <2.50 131 1.20 56 52 3.17 192 147
Institutions 2.50 to <10.00 56 3.21 16 49 1.79 84 151
Institutions 10.00 to <100.00 — — 2 45 2.19 1 229
Institutions 100.00 (Default) — 100.00 1 56 1.92 — —
Total - Institutions 10,661 0.19 678 49 2.56 6,175 58
Corporates - SME 0.00 to <0.15 — — — — — — —
Corporates - SME 0.15 to <0.25 9 0.22 24 29 1.23 2 19
Corporates - SME 0.25 to <0.50 55 0.44 209 55 3.25 41 73
Corporates - SME 0.50 to <0.75 16 0.64 203 56 1.96 12 75
Corporates - SME 0.75 to <2.50 86 1.25 614 49 2.79 82 95
Corporates - SME 2.50 to <10.00 35 3.71 269 34 2.60 30 86
Corporates - SME 10.00 to <100.00 2 15.17 32 36 1.66 3 122
Corporates - SME 100.00 (Default) 4 100.00 30 29 2.29 — —
Total - Corporates - SME 207 3.39 1,381 47 2.73 170 81
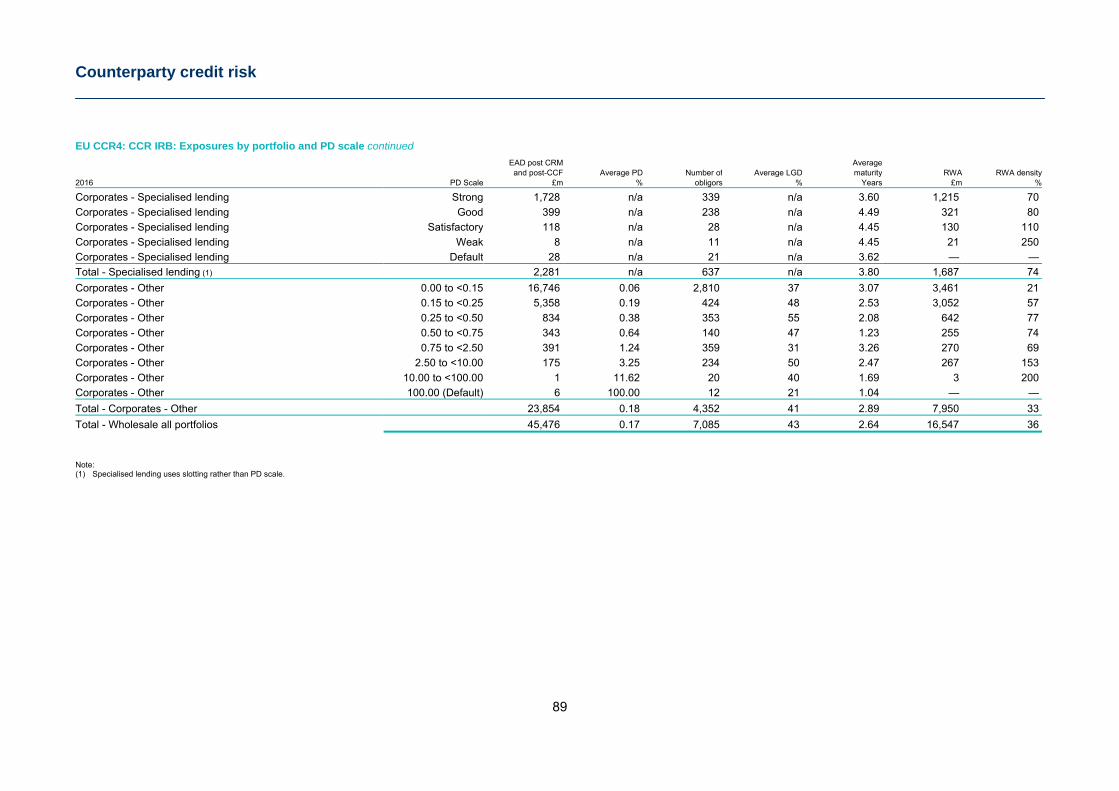
Counterparty credit risk
89
EU CCR4: CCR IRB: Exposures by portfolio and PD scale continued EAD post CRM Average and post-CCF Average PD Number of Average LGD maturity RWA RWA density2016 PD Scale £m % obligors % Years £m %
Corporates - Specialised lending Strong 1,728 n/a 339 n/a 3.60 1,215 70
Corporates - Specialised lending Good 399 n/a 238 n/a 4.49 321 80
Corporates - Specialised lending Satisfactory 118 n/a 28 n/a 4.45 130 110
Corporates - Specialised lending Weak 8 n/a 11 n/a 4.45 21 250
Corporates - Specialised lending Default 28 n/a 21 n/a 3.62 — —
Total - Specialised lending (1) 2,281 n/a 637 n/a 3.80 1,687 74
Corporates - Other 0.00 to <0.15 16,746 0.06 2,810 37 3.07 3,461 21
Corporates - Other 0.15 to <0.25 5,358 0.19 424 48 2.53 3,052 57
Corporates - Other 0.25 to <0.50 834 0.38 353 55 2.08 642 77
Corporates - Other 0.50 to <0.75 343 0.64 140 47 1.23 255 74
Corporates - Other 0.75 to <2.50 391 1.24 359 31 3.26 270 69
Corporates - Other 2.50 to <10.00 175 3.25 234 50 2.47 267 153
Corporates - Other 10.00 to <100.00 1 11.62 20 40 1.69 3 200
Corporates - Other 100.00 (Default) 6 100.00 12 21 1.04 — —
Total - Corporates - Other 23,854 0.18 4,352 41 2.89 7,950 33
Total - Wholesale all portfolios 45,476 0.17 7,085 43 2.64 16,547 36
Note: (1) Specialised lending uses slotting rather than PD scale.
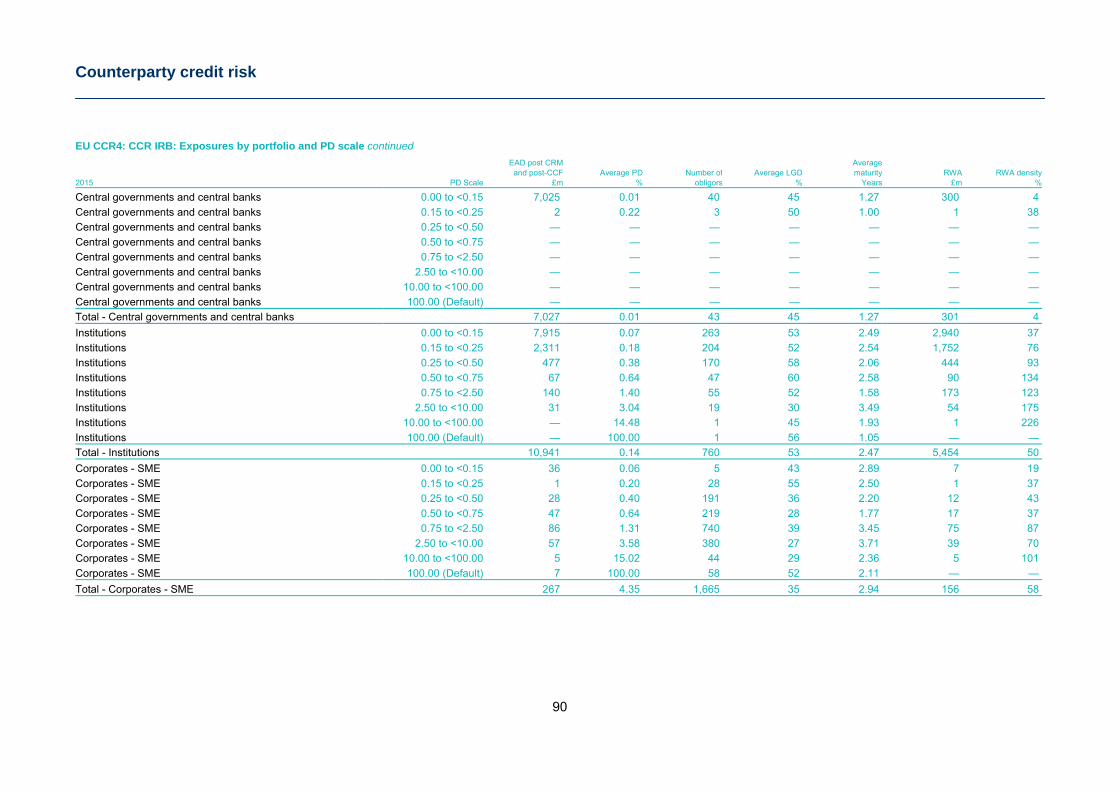
Counterparty credit risk
90
EU CCR4: CCR IRB: Exposures by portfolio and PD scale continued EAD post CRM Average and post-CCF Average PD Number of Average LGD maturity RWA RWA density2015 PD Scale £m % obligors % Years £m %
Central governments and central banks 0.00 to <0.15 7,025 0.01 40 45 1.27 300 4
Central governments and central banks 0.15 to <0.25 2 0.22 3 50 1.00 1 38
Central governments and central banks 0.25 to <0.50 — — — — — — —
Central governments and central banks 0.50 to <0.75 — — — — — — —
Central governments and central banks 0.75 to <2.50 — — — — — — —
Central governments and central banks 2.50 to <10.00 — — — — — — —
Central governments and central banks 10.00 to <100.00 — — — — — — —
Central governments and central banks 100.00 (Default) — — — — — — —
Total - Central governments and central banks 7,027 0.01 43 45 1.27 301 4
Institutions 0.00 to <0.15 7,915 0.07 263 53 2.49 2,940 37
Institutions 0.15 to <0.25 2,311 0.18 204 52 2.54 1,752 76
Institutions 0.25 to <0.50 477 0.38 170 58 2.06 444 93
Institutions 0.50 to <0.75 67 0.64 47 60 2.58 90 134
Institutions 0.75 to <2.50 140 1.40 55 52 1.58 173 123
Institutions 2.50 to <10.00 31 3.04 19 30 3.49 54 175
Institutions 10.00 to <100.00 — 14.48 1 45 1.93 1 226
Institutions 100.00 (Default) — 100.00 1 56 1.05 — —
Total - Institutions 10,941 0.14 760 53 2.47 5,454 50
Corporates - SME 0.00 to <0.15 36 0.06 5 43 2.89 7 19
Corporates - SME 0.15 to <0.25 1 0.20 28 55 2.50 1 37
Corporates - SME 0.25 to <0.50 28 0.40 191 36 2.20 12 43
Corporates - SME 0.50 to <0.75 47 0.64 219 28 1.77 17 37
Corporates - SME 0.75 to <2.50 86 1.31 740 39 3.45 75 87
Corporates - SME 2.50 to <10.00 57 3.58 380 27 3.71 39 70
Corporates - SME 10.00 to <100.00 5 15.02 44 29 2.36 5 101
Corporates - SME 100.00 (Default) 7 100.00 58 52 2.11 — —
Total - Corporates - SME 267 4.35 1,665 35 2.94 156 58
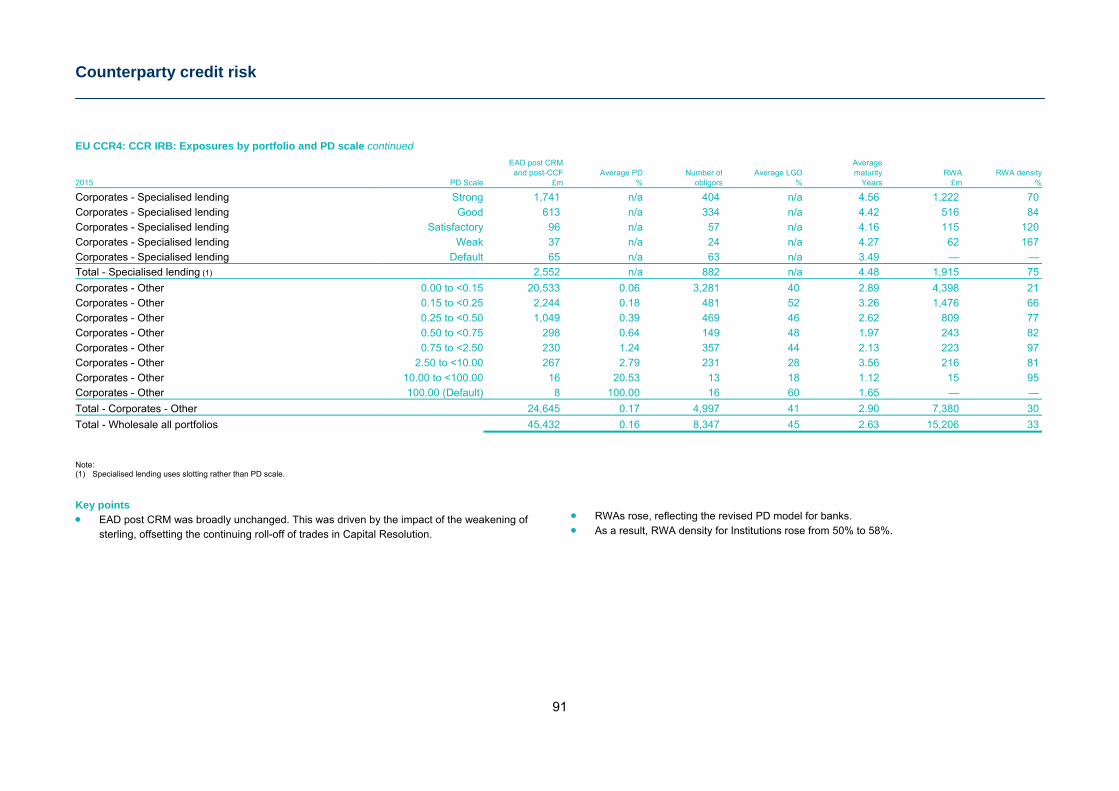
Counterparty credit risk
91
EU CCR4: CCR IRB: Exposures by portfolio and PD scale continued EAD post CRM Average and post-CCF Average PD Number of Average LGD maturity RWA RWA density2015 PD Scale £m % obligors % Years £m %
Corporates - Specialised lending Strong 1,741 n/a 404 n/a 4.56 1,222 70
Corporates - Specialised lending Good 613 n/a 334 n/a 4.42 516 84
Corporates - Specialised lending Satisfactory 96 n/a 57 n/a 4.16 115 120
Corporates - Specialised lending Weak 37 n/a 24 n/a 4.27 62 167
Corporates - Specialised lending Default 65 n/a 63 n/a 3.49 — —
Total - Specialised lending (1) 2,552 n/a 882 n/a 4.48 1,915 75
Corporates - Other 0.00 to <0.15 20,533 0.06 3,281 40 2.89 4,398 21
Corporates - Other 0.15 to <0.25 2,244 0.18 481 52 3.26 1,476 66
Corporates - Other 0.25 to <0.50 1,049 0.39 469 46 2.62 809 77
Corporates - Other 0.50 to <0.75 298 0.64 149 48 1.97 243 82
Corporates - Other 0.75 to <2.50 230 1.24 357 44 2.13 223 97
Corporates - Other 2.50 to <10.00 267 2.79 231 28 3.56 216 81
Corporates - Other 10.00 to <100.00 16 20.53 13 18 1.12 15 95
Corporates - Other 100.00 (Default) 8 100.00 16 60 1.65 — —
Total - Corporates - Other 24,645 0.17 4,997 41 2.90 7,380 30
Total - Wholesale all portfolios 45,432 0.16 8,347 45 2.63 15,206 33
Note: (1) Specialised lending uses slotting rather than PD scale.
Key points EAD post CRM was broadly unchanged. This was driven by the impact of the weakening of
sterling, offsetting the continuing roll-off of trades in Capital Resolution.
RWAs rose, reflecting the revised PD model for banks. As a result, RWA density for Institutions rose from 50% to 58%.
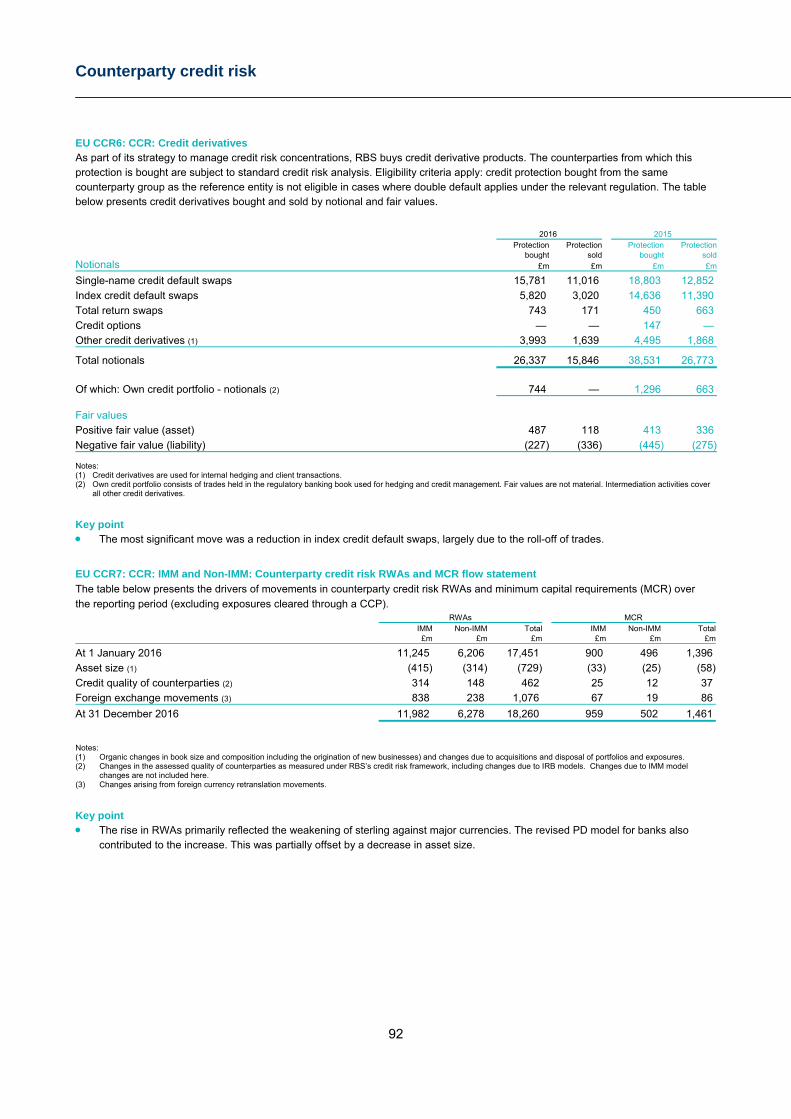
Counterparty credit risk
92
EU CCR6: CCR: Credit derivatives As part of its strategy to manage credit risk concentrations, RBS buys credit derivative products. The counterparties from which this protection is bought are subject to standard credit risk analysis. Eligibility criteria apply: credit protection bought from the same counterparty group as the reference entity is not eligible in cases where double default applies under the relevant regulation. The table below presents credit derivatives bought and sold by notional and fair values.
2016 2015 Protection Protection Protection Protection
Notionals bought sold bought sold
£m £m £m £m
Single-name credit default swaps 15,781 11,016 18,803 12,852
Index credit default swaps 5,820 3,020 14,636 11,390
Total return swaps 743 171 450 663
Credit options — — 147 —
Other credit derivatives (1) 3,993 1,639 4,495 1,868
Total notionals 26,337 15,846 38,531 26,773
Of which: Own credit portfolio - notionals (2) 744 — 1,296 663 Fair values
Positive fair value (asset) 487 118 413 336
Negative fair value (liability) (227) (336) (445) (275) Notes: (1) Credit derivatives are used for internal hedging and client transactions. (2) Own credit portfolio consists of trades held in the regulatory banking book used for hedging and credit management. Fair values are not material. Intermediation activities cover
all other credit derivatives.
Key point The most significant move was a reduction in index credit default swaps, largely due to the roll-off of trades.
EU CCR7: CCR: IMM and Non-IMM: Counterparty credit risk RWAs and MCR flow statement The table below presents the drivers of movements in counterparty credit risk RWAs and minimum capital requirements (MCR) over
the reporting period (excluding exposures cleared through a CCP). RWAs MCR IMM Non-IMM Total IMM Non-IMM Total £m £m £m £m £m £m
At 1 January 2016 11,245 6,206 17,451 900 496 1,396
Asset size (1) (415) (314) (729) (33) (25) (58)
Credit quality of counterparties (2) 314 148 462 25 12 37
Foreign exchange movements (3) 838 238 1,076 67 19 86
At 31 December 2016 11,982 6,278 18,260 959 502 1,461
Notes: (1) Organic changes in book size and composition including the origination of new businesses) and changes due to acquisitions and disposal of portfolios and exposures. (2) Changes in the assessed quality of counterparties as measured under RBS’s credit risk framework, including changes due to IRB models. Changes due to IMM model
changes are not included here. (3) Changes arising from foreign currency retranslation movements.
Key point The rise in RWAs primarily reflected the weakening of sterling against major currencies. The revised PD model for banks also
contributed to the increase. This was partially offset by a decrease in asset size.
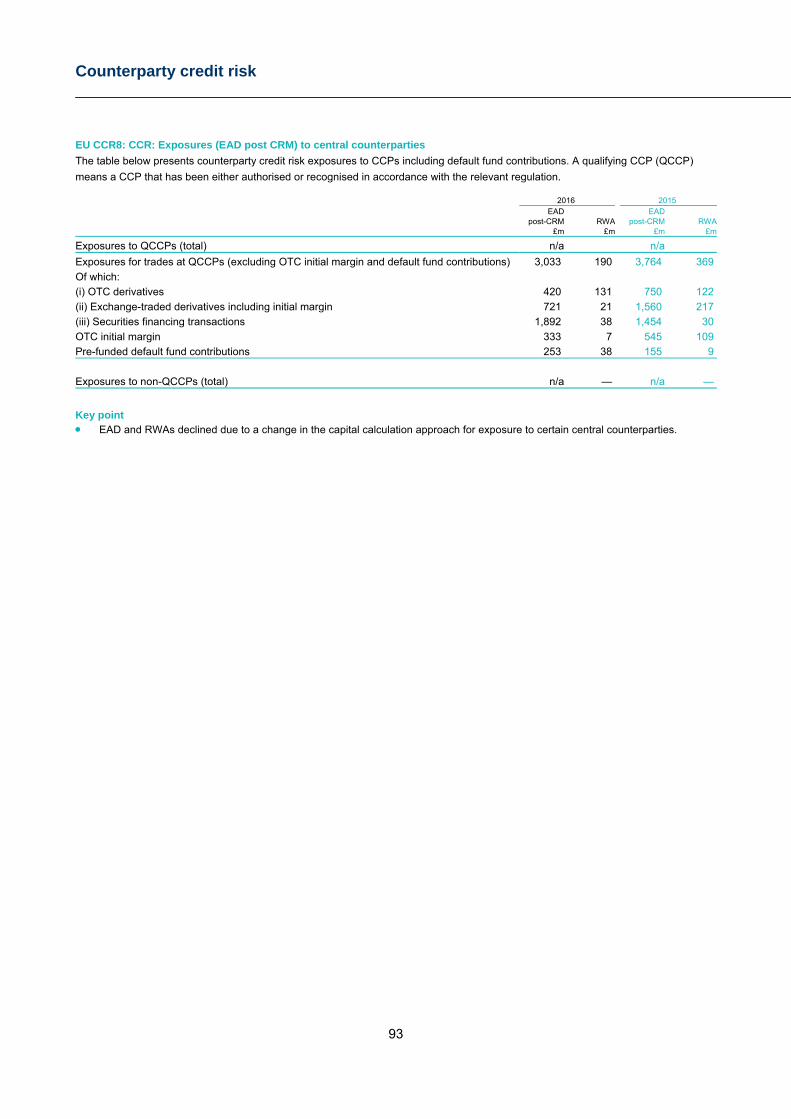
Counterparty credit risk
93
EU CCR8: CCR: Exposures (EAD post CRM) to central counterparties The table below presents counterparty credit risk exposures to CCPs including default fund contributions. A qualifying CCP (QCCP) means a CCP that has been either authorised or recognised in accordance with the relevant regulation. 2016 2015 EAD EAD post-CRM RWA post-CRM RWA £m £m £m £m
Exposures to QCCPs (total) n/a n/a
Exposures for trades at QCCPs (excluding OTC initial margin and default fund contributions) 3,033 190 3,764 369
Of which:
(i) OTC derivatives 420 131 750 122
(ii) Exchange-traded derivatives including initial margin 721 21 1,560 217
(iii) Securities financing transactions 1,892 38 1,454 30
OTC initial margin 333 7 545 109
Pre-funded default fund contributions 253 38 155 9
Exposures to non-QCCPs (total) n/a — n/a —
Key point EAD and RWAs declined due to a change in the capital calculation approach for exposure to certain central counterparties.
Market risk
94
Market risk EU MRA: MR: General qualitative information Definition and framework Market risk is the risk of losses arising from fluctuations in interest rates, credit spreads, foreign currency rates, equity prices, commodity prices and other factors, such as market-implied volatilities, that may lead to a reduction in earnings, economic value or both.
RBS is exposed to traded market risk through its trading activities and to non-traded market risk as a result of its banking activities. In many respects, it manages its traded and non-traded market risk exposures separately, largely in line with the regulatory definitions of the trading and non-trading books.
Market risk governance and management Responsibility for identifying, measuring, monitoring and controlling the market risk arising from trading or non-trading activities lies with the relevant trading or non-trading business, with second-line-of-defence oversight provided by the Market Risk function, headed by the Director of Market Risk. For more information on the governance and management, measurement and reporting of traded market risk, refer to page 262 of the 2016 ARA. For information on non-traded market risk, including non-traded interest rate risk, refer to page 268 of the 2016 ARA.
EU MRB_A: MR: Qualitative information - position risk Inclusion of exposures in trading book The Trading Book Policy sets out the RBS-wide principles and criteria for identifying and classifying trading book positions for the purpose of regulatory capital and market risk and credit risk measurement. The policy also stipulates the control requirements for the management and regular monitoring of the trading book status of positions and the procedures for escalation where necessary. Key criteria for determining trading book status set within the policy include considerations such as whether positions are transferable or comprise hedgeable financial instruments held with the intent to trade or in a hedging relationship with other trading book positions.
Trading book positions must be valued by marking them to market or to model on a daily basis. They are subject to market risk-based rules, with market risk capital requirements calculated either by using internal models where regulatory approval has been received or otherwise by using the non-modelled, or standardised, approach. Where the criteria set out in the policy are not met, positions are classified as non-trading book exposure and capitalised according to rules outlined on page 276 in the 2016 ARA.
Prudential valuation Prudential valuation is a regulatory provision that requires additional valuation adjustments (AVAs) to be made over and above fair value adjustments that are calculated in accordance with accounting standards. AVAs represent excess valuation adjustments required to achieve a prudent value over the reported fair value. The purpose of these adjustments is to achieve an appropriate degree of certainty that the valuation is sufficiently prudent having regard to the dynamic nature of trading positions. Prudential valuation adjustments result in a deduction to CET1 capital in accordance with Article 105 of the CRR.
RBS applies prudential valuation to all positions that are subject to fair value accounting (both regulatory trading and banking books) classified for accounting purposes as fair value through profit or loss, including held for trading and available for sale. The prudent valuation is the value of the positions at the lower bound (downside) of the valuation uncertainty range and is always equal to or lower than the fair value for assets, and equal to or higher than the fair value for liabilities.
For more information regarding valuation methodologies of modelled and non-modelled products, the independent price verification process and the control and governance framework, please refer to the 2016 ARA, Financial instruments - valuation on page 331.
EU MRB_B: MR: Qualitative disclosure on use of internal model approach Calculation of market risk capital requirements As noted above, RBS uses two broad methodologies to calculate its market risk capital requirements: (i) the standardised (STD) approach, whereby regulator-prescribed rules are applied, or (ii) subject to regulatory approval, the internal model approach (IMA).
The PRA renewed RBS’s IMA permission with effect from 30 November 2016, incorporating changes to the legal entity coverage of the permission (removal of RBS Securities Inc (RBSSI)) and minor revisions to its product and trading location coverage. The changes were requested by RBS, reflecting the continued simplification of its operations. RBS has IMA permission for the following material legal entities: RBS plc and NWB Plc.
The calculation of regulatory VaR differs from that of the internal VaR as it takes into account only products, locations and legal entities covered by the regulator’s IMA permission. This differs from the calculation of internal VaR, which takes into account all trading book positions. In addition, regulatory VaR is based on a directly modelled ten-day holding period, rather than the scaled one-day holding period on which internal VaR is based. The PRA approval covers general market risk in interest rate, foreign exchange, equity and commodity products and specific market risk in interest rate and equity products.
RBS’s Stressed VaR (SVaR) model has also been approved by the PRA for use in the capital requirement calculation. SVaR is a VaR-based measure using historical data from a one-year period of stressed market conditions. The distinction between regulatory SVaR and internal SVaR is the same as that between regulatory VaR and internal VaR.
Market risk
95
The Risks not in VaR (RNIV) framework is used to identify and quantify market risks that are inadequately captured by the VaR and SVaR models and to ensure that such risks are adequately covered by capital. RBS adopts two approaches for the quantification of RNIVs: A VaR/SVaR approach. Under this approach, two values are
calculated: (i) the VaR RNIV; and (ii) the SVaR RNIV. A stress-scenario approach. Under this approach, an
assessment of ten-day extreme, but plausible, market moves is used in combination with position sensitivities to give a stress-type loss number - the stress-based RNIV value.
In line with regulatory guidelines for external reporting, VaR RNIV values are reported as a subset of the VaR-based regulatory capital charge, whereas SVaR RNIV values and stress-based RNIV values are reported as subsets of the SVaR-based charge.
VaR and SVaR capture general and specific risks using a single model but not risks arising from the impact of defaults and rating changes associated with traded credit products and their derivatives. For these risks, two product-dependent approaches are used: The incremental risk charge (IRC) model captures risks
arising from rating migration and default events for the more liquid traded credit instruments and their derivatives.
Securitisation and re-securitisation risks in the trading book are treated with the non-trading book non-modelled capitalisation approach.
RBS does not use the comprehensive risk measure.
For more information on the characteristics of the market risk measurement methodologies used by RBS under the IMA, including model validation, as well as their use for internal risk management purposes, refer to page 263 of the 2016 ARA. Apart from RBS plc, RBSSI is the major contributor to market risk capital requirements in RBS and is therefore included in this section, although it is not otherwise considered a significant subsidiary. UBI DAC’s market risk capital requirements are not material (£1 million).
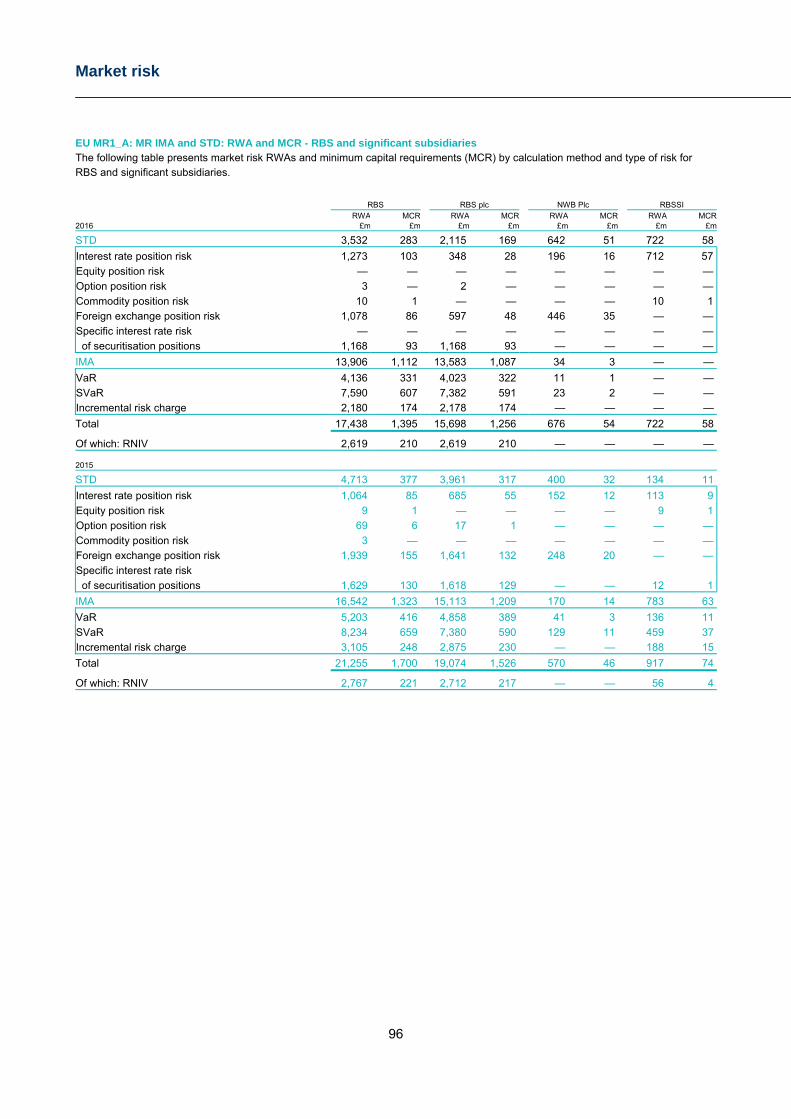
Market risk
96
EU MR1_A: MR IMA and STD: RWA and MCR - RBS and significant subsidiaries The following table presents market risk RWAs and minimum capital requirements (MCR) by calculation method and type of risk for RBS and significant subsidiaries.
RBS RBS plc NWB Plc RBSSI RWA MCR RWA MCR RWA MCR RWA MCR2016 £m £m £m £m £m £m £m £m
STD 3,532 283 2,115 169 642 51 722 58
Interest rate position risk 1,273 103 348 28 196 16 712 57
Equity position risk — — — — — — — —
Option position risk 3 — 2 — — — — —
Commodity position risk 10 1 — — — — 10 1
Foreign exchange position risk 1,078 86 597 48 446 35 — —
Specific interest rate risk — — — — — — — —
of securitisation positions 1,168 93 1,168 93 — — — —
IMA 13,906 1,112 13,583 1,087 34 3 — —
VaR 4,136 331 4,023 322 11 1 — —
SVaR 7,590 607 7,382 591 23 2 — —
Incremental risk charge 2,180 174 2,178 174 — — — —
Total 17,438 1,395 15,698 1,256 676 54 722 58
Of which: RNIV 2,619 210 2,619 210 — — — —
2015
STD 4,713 377 3,961 317 400 32 134 11
Interest rate position risk 1,064 85 685 55 152 12 113 9
Equity position risk 9 1 — — — — 9 1
Option position risk 69 6 17 1 — — — —
Commodity position risk 3 — — — — — — —
Foreign exchange position risk 1,939 155 1,641 132 248 20 — —
Specific interest rate risk
of securitisation positions 1,629 130 1,618 129 — — 12 1
IMA 16,542 1,323 15,113 1,209 170 14 783 63
VaR 5,203 416 4,858 389 41 3 136 11
SVaR 8,234 659 7,380 590 129 11 459 37
Incremental risk charge 3,105 248 2,875 230 — — 188 15
Total 21,255 1,700 19,074 1,526 570 46 917 74
Of which: RNIV 2,767 221 2,712 217 — — 56 4
Market risk
97
Key points RBS’s total market risk RWAs fell 18% or £3.8 billion to
£17.4 billion, driven by reductions under both the standardised approach and the internal model approach.
Under the standardised approach, RWAs fell 25% or £1.2 billion to £3.5 billion. This was mainly driven by a reduction in the banking book FX charge - reflecting sterling depreciation against major currencies following the EU referendum and a significant reduction in the US dollar long position in Treasury - and by asset disposals in trading book securitisations. The overall downward trend was partially offset by the transition of RBSSI from the internal model approach to the standardised approach, notably reflected in the increase in the interest rate position risk.
Under the internal model approach, RWAs fell 16% or £2.6 billion to £13.9 billion as VaR and SVaR based requirements and the incremental risk charge all declined.
The 21% decline in the VaR based requirement was primarily driven by: o RBSSI, reflecting its transition to the standardised
approach; and o RBS plc, reflecting the significant reduction in traded
market risk exposure in the run-up to key events, such as the UK referendum on EU membership in June and the US presidential election in November. Market flows increased markedly following these events, supporting NatWest Markets’ customer activity. Given the significant risk reduction achieved in recent years, notably in Capital Resolution, by year-end 2016 the Group’s VaR profile was more reflective of NatWest Markets’ areas of activity in line with its strategic focus.
The 8% decline in the SVaR based requirement was
primarily driven by the transition of RBSSI to the standardised approach.
The 30% decline in the incremental risk charge reflected a reduction in periphery bond positions during Q4 2016, predominantly related to RBS plc.
RNIVs were broadly unchanged. New RNIVs introduced to supplement the capitalisation of risks against unreliable market data during H1 2016 were offset by the retirement of other RNIVs that are now adequately captured in the VaR and SVaR models during H2 2016.
At the NWB Plc level, RWAs increased by 19% or £106 million to £676 million. This reflected a change in internal risk hedging strategy, resulting in a small residual risk for this entity.
At the RBSSI level, the 21% fall in RWAs was primarily due to the change in approach for this entity. This is chiefly because US government securities, which form a large proportion of RBSSI’s portfolio, do not attract a specific risk charge under the standardised approach, given their high credit quality. Therefore, the largest component of the standardised charge is general interest rate risk.
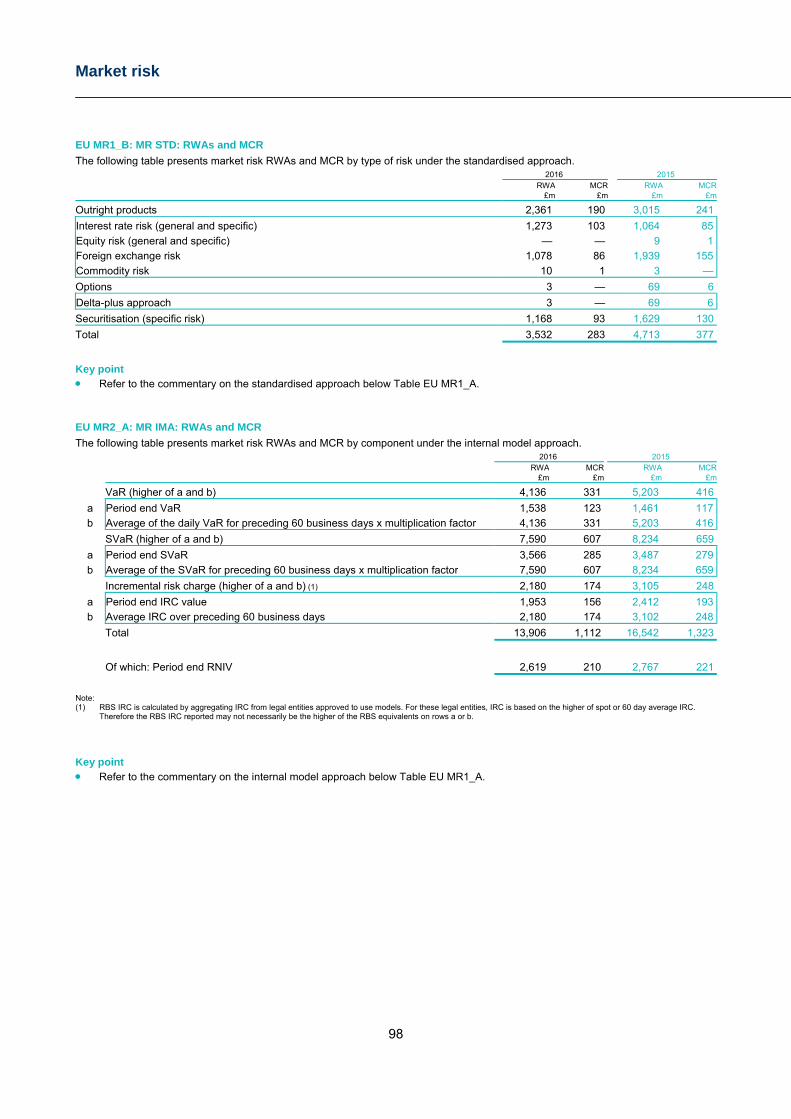
Market risk
98
EU MR1_B: MR STD: RWAs and MCR The following table presents market risk RWAs and MCR by type of risk under the standardised approach. 2016 2015 RWA MCR RWA MCR £m £m £m £m
Outright products 2,361 190 3,015 241
Interest rate risk (general and specific) 1,273 103 1,064 85
Equity risk (general and specific) — — 9 1
Foreign exchange risk 1,078 86 1,939 155
Commodity risk 10 1 3 —
Options 3 — 69 6
Delta-plus approach 3 — 69 6
Securitisation (specific risk) 1,168 93 1,629 130
Total 3,532 283 4,713 377
Key point Refer to the commentary on the standardised approach below Table EU MR1_A.
EU MR2_A: MR IMA: RWAs and MCR The following table presents market risk RWAs and MCR by component under the internal model approach. 2016 2015 RWA MCR RWA MCR £m £m £m £m
VaR (higher of a and b) 4,136 331 5,203 416
a Period end VaR 1,538 123 1,461 117
b Average of the daily VaR for preceding 60 business days x multiplication factor 4,136 331 5,203 416
SVaR (higher of a and b) 7,590 607 8,234 659
a Period end SVaR 3,566 285 3,487 279
b Average of the SVaR for preceding 60 business days x multiplication factor 7,590 607 8,234 659
Incremental risk charge (higher of a and b) (1) 2,180 174 3,105 248
a Period end IRC value 1,953 156 2,412 193
b Average IRC over preceding 60 business days 2,180 174 3,102 248
Total 13,906 1,112 16,542 1,323
Of which: Period end RNIV 2,619 210 2,767 221
Note: (1) RBS IRC is calculated by aggregating IRC from legal entities approved to use models. For these legal entities, IRC is based on the higher of spot or 60 day average IRC.
Therefore the RBS IRC reported may not necessarily be the higher of the RBS equivalents on rows a or b.
Key point Refer to the commentary on the internal model approach below Table EU MR1_A.
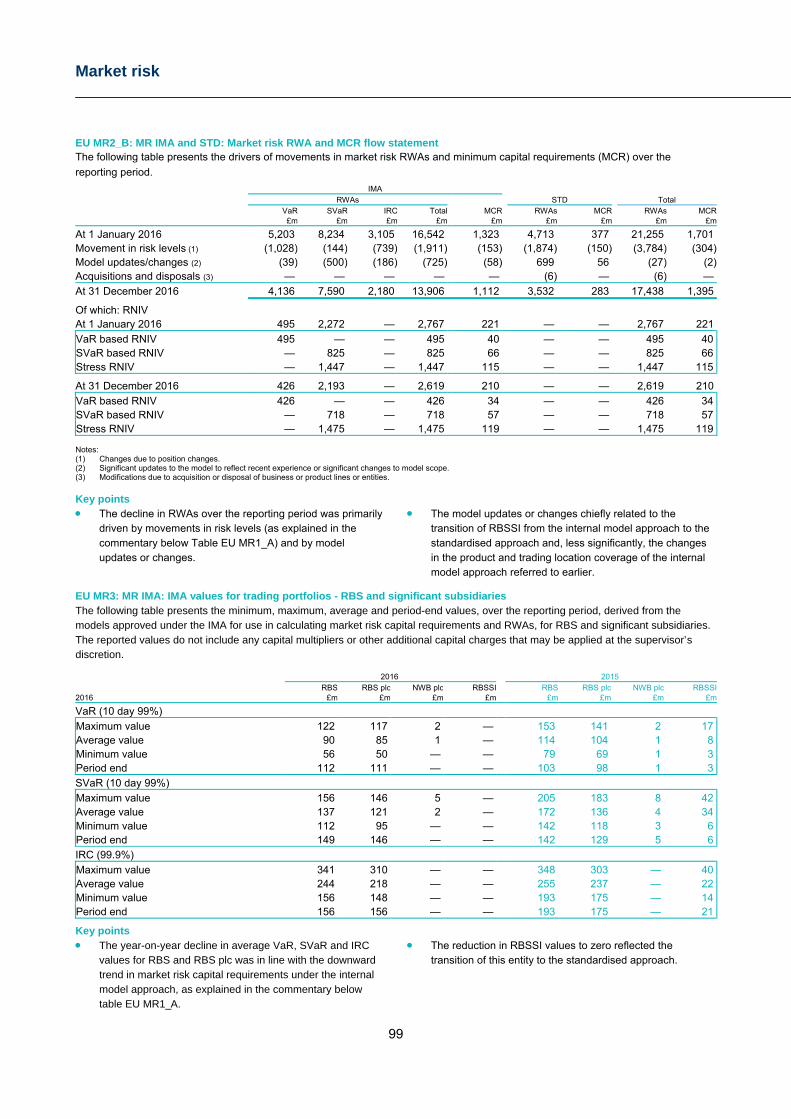
Market risk
99
EU MR2_B: MR IMA and STD: Market risk RWA and MCR flow statement The following table presents the drivers of movements in market risk RWAs and minimum capital requirements (MCR) over the
reporting period. IMA RWAs STD Total VaR SVaR IRC Total MCR RWAs MCR RWAs MCR £m £m £m £m £m £m £m £m £m
At 1 January 2016 5,203 8,234 3,105 16,542 1,323 4,713 377 21,255 1,701 Movement in risk levels (1) (1,028) (144) (739) (1,911) (153) (1,874) (150) (3,784) (304)Model updates/changes (2) (39) (500) (186) (725) (58) 699 56 (27) (2)Acquisitions and disposals (3) — — — — — (6) — (6) —
At 31 December 2016 4,136 7,590 2,180 13,906 1,112 3,532 283 17,438 1,395
Of which: RNIV At 1 January 2016 495 2,272 — 2,767 221 — — 2,767 221
VaR based RNIV 495 — — 495 40 — — 495 40 SVaR based RNIV — 825 — 825 66 — — 825 66 Stress RNIV — 1,447 — 1,447 115 — — 1,447 115
At 31 December 2016 426 2,193 — 2,619 210 — — 2,619 210
VaR based RNIV 426 — — 426 34 — — 426 34 SVaR based RNIV — 718 — 718 57 — — 718 57 Stress RNIV — 1,475 — 1,475 119 — — 1,475 119 Notes: (1) Changes due to position changes. (2) Significant updates to the model to reflect recent experience or significant changes to model scope. (3) Modifications due to acquisition or disposal of business or product lines or entities.
Key points The decline in RWAs over the reporting period was primarily
driven by movements in risk levels (as explained in the commentary below Table EU MR1_A) and by model updates or changes.
The model updates or changes chiefly related to the
transition of RBSSI from the internal model approach to the standardised approach and, less significantly, the changes in the product and trading location coverage of the internal model approach referred to earlier.
EU MR3: MR IMA: IMA values for trading portfolios - RBS and significant subsidiaries The following table presents the minimum, maximum, average and period-end values, over the reporting period, derived from the models approved under the IMA for use in calculating market risk capital requirements and RWAs, for RBS and significant subsidiaries. The reported values do not include any capital multipliers or other additional capital charges that may be applied at the supervisor’s discretion.
2016 2015 RBS RBS plc NWB plc RBSSI RBS RBS plc NWB plc RBSSI2016 £m £m £m £m £m £m £m £m
VaR (10 day 99%)
Maximum value 122 117 2 — 153 141 2 17 Average value 90 85 1 — 114 104 1 8 Minimum value 56 50 — — 79 69 1 3 Period end 112 111 — — 103 98 1 3
SVaR (10 day 99%)
Maximum value 156 146 5 — 205 183 8 42 Average value 137 121 2 — 172 136 4 34 Minimum value 112 95 — — 142 118 3 6 Period end 149 146 — — 142 129 5 6
IRC (99.9%)
Maximum value 341 310 — — 348 303 — 40 Average value 244 218 — — 255 237 — 22 Minimum value 156 148 — — 193 175 — 14 Period end 156 156 — — 193 175 — 21
Key points The year-on-year decline in average VaR, SVaR and IRC
values for RBS and RBS plc was in line with the downward trend in market risk capital requirements under the internal model approach, as explained in the commentary below table EU MR1_A.
The reduction in RBSSI values to zero reflected the
transition of this entity to the standardised approach.
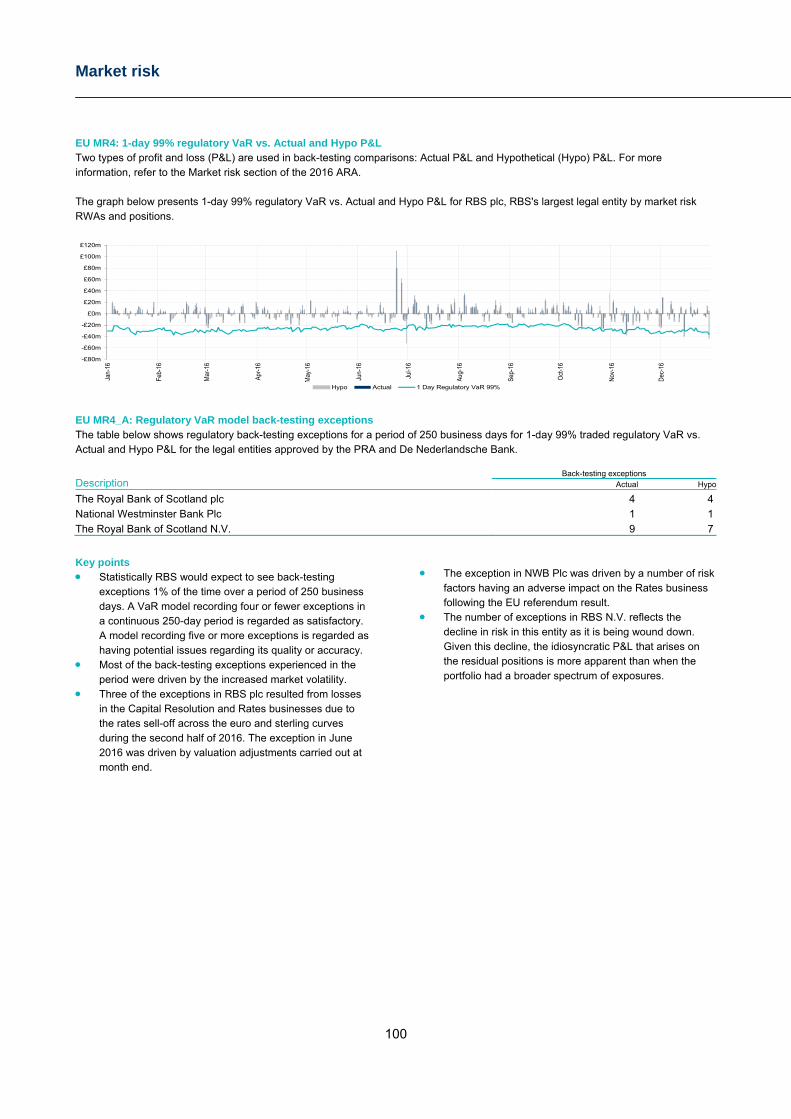
Market risk
100
EU MR4: 1-day 99% regulatory VaR vs. Actual and Hypo P&L Two types of profit and loss (P&L) are used in back-testing comparisons: Actual P&L and Hypothetical (Hypo) P&L. For more information, refer to the Market risk section of the 2016 ARA. The graph below presents 1-day 99% regulatory VaR vs. Actual and Hypo P&L for RBS plc, RBS's largest legal entity by market risk RWAs and positions.
-£80m
-£60m
-£40m
-£20m
£0m
£20m
£40m
£60m
£80m
£100m
£120m
Jan-
16
Feb-
16
Mar
-16
Apr
-16
May
-16
Jun-
16
Jul-1
6
Aug
-16
Sep
-16
Oct
-16
Nov
-16
Dec
-16
Hypo Actual 1 Day Regulatory VaR 99% EU MR4_A: Regulatory VaR model back-testing exceptions The table below shows regulatory back-testing exceptions for a period of 250 business days for 1-day 99% traded regulatory VaR vs. Actual and Hypo P&L for the legal entities approved by the PRA and De Nederlandsche Bank.
Description Back-testing exceptions
Actual Hypo
The Royal Bank of Scotland plc 4 4
National Westminster Bank Plc 1 1
The Royal Bank of Scotland N.V. 9 7
Key points Statistically RBS would expect to see back-testing
exceptions 1% of the time over a period of 250 business days. A VaR model recording four or fewer exceptions in a continuous 250-day period is regarded as satisfactory. A model recording five or more exceptions is regarded as having potential issues regarding its quality or accuracy.
Most of the back-testing exceptions experienced in the period were driven by the increased market volatility.
Three of the exceptions in RBS plc resulted from losses in the Capital Resolution and Rates businesses due to the rates sell-off across the euro and sterling curves during the second half of 2016. The exception in June 2016 was driven by valuation adjustments carried out at month end.
The exception in NWB Plc was driven by a number of risk
factors having an adverse impact on the Rates business following the EU referendum result.
The number of exceptions in RBS N.V. reflects the decline in risk in this entity as it is being wound down. Given this decline, the idiosyncratic P&L that arises on the residual positions is more apparent than when the portfolio had a broader spectrum of exposures.
Securitisation
101
Securitisation SECA: SEC qualitative disclosures Framework, roles and definitions This section presents descriptive information on RBS’s securitisation activities and related risk management processes and accounting policies, followed by quantitative disclosures on its exposures to securitisations.
Definitions Securitisation and special purpose entities The CRR defines a securitisation as a transaction or scheme where the credit risk of an exposure or pool of exposures is tranched, where the payments arising from the transaction or scheme are dependent upon the performance of the underlying exposure(s) and where the subordination of tranches determines the distribution of losses during the ongoing life of the transaction or scheme.
Securitisations can broadly take two forms: traditional and synthetic. In traditional securitisations, the originator transfers ownership of the underlying exposure(s) to a securitisation special purpose entity (SSPE), putting the asset(s) beyond the reach of the originator and its creditors. The purchase of the underlying exposure(s) by the SSPE is funded by the issuance of securities. In synthetic securitisations, the originator retains ownership of the underlying exposure(s) but transfers the associated credit risk to another entity through the use of guarantees or credit derivatives.
SSPEs are set up for a specific limited purpose to facilitate a securitisation transaction. They do not provide a commercial service or employ staff. They may take a variety of legal forms, such as trusts, partnerships and companies. Their activities are limited to those appropriate to carrying out a securitisation and their structure is intended to isolate the obligations of the SSPE from those of the originator institution and to ensure that the holders of the beneficial interests have the right to pledge or exchange those interests without restriction. Typically, their share capital is held ultimately by charitable trusts. Although SSPEs are frequently used, they are not necessarily required for all securitisation structures. The following definitions are used in these Pillar 3 disclosures: Trading book - The trading book consists of positions in financial instruments and commodities held either with the intent to trade or in order to hedge other elements of the trading book. To be eligible for trading book capital treatment, financial instruments must either be free of any covenants restricting their tradability or be able to be hedged. Non-trading book - The non-trading book consists of positions, exposures, assets and liabilities that are not in the trading book. It is also referred to as the ‘banking book’. In this section, the counterparty credit risk arising from derivative trades associated with SSPEs is captured in the non-trading book disclosures.
Securitisation position - Any exposure to a securitisation that falls within the scope of regulatory treatment (further details on page 106). This includes not only exposures arising from the purchase or retention of the securities issued by an SSPE but also loans and liquidity facilities to securitisations, and the counterparty credit risk exposure of derivative positions transacted with a securitisation. Re-securitisation - A securitisation in which the underlying asset or pool of assets comprises at least one securitisation position. Securitised exposure - An asset or pool of assets that is securitised by way of a traditional or synthetic securitisation. Significant risk transfer assessment - An assessment prescribed by the CRR and designed to determine whether or not a securitisation structure effectively transfers the underlying risks of the assets to a party or parties other than the originator. Term securitisation - A securitisation vehicle funding a pool of assets through the issuance of long-term securities. A term securitisation may hold the assets of one or more originators.
Asset-backed commercial paper (ABCP) conduit - A securitisation vehicle funding a pool of assets through the issuance of predominantly short-term securities (namely commercial paper). A conduit may hold the assets of one or more originators (referred to as a single-seller or multi-seller conduit, respectively), one of which may also be the sponsor.
Objectives and roles By participating in securitisation activity, RBS aims to achieve one or both of the following objectives: To diversify sources of funding, either for its own
purposes or for customers; and To facilitate prudential balance sheet and risk
management, either for its own purposes or for customers.
In doing so, RBS may incur a range of risks, including credit (non-counterparty and counterparty), market, liquidity and funding, legal, regulatory and reputational risks for which it must hold regulatory capital. For details of CRR rules governing the calculation of regulatory capital required in respect of securitisations, refer to page 106.
RBS may play one or more of the following roles in a securitisation transaction:
Originator - To diversify its sources of funding and manage its balance sheet, RBS securitises assets it has purchased or originated. The origination of securitisation assets may expose it to credit risk (non-counterparty and counterparty) and market risk, particularly if the structure of the transaction does not transfer these risks to third parties. Even if these risks have been transferred, it may nevertheless be exposed to credit and market risks if it retains a securitisation position by, for example, providing the SSPE with a liquidity facility or entering into derivative transactions with the SSPE.
Securitisation
102
Investor - To generate financial returns, RBS may: Purchase securities issued by an SSPE; Enter into derivative transactions with an SSPE; or Lend to an SSPE, often by providing a back-up liquidity
facility that the SSPE can use if it is unable to issue securities, particularly commercial paper. Investment in securitisations exposes RBS to market risk and credit risk, both non-counterparty and counterparty.
To generate additional fee income, RBS may play other roles as well: Sponsor - RBS may establish and manage a term securitisation that purchases bonds or other financial assets from third parties. It may do so on its own account or on behalf of its customers. Additionally, it historically established and managed ABCP conduits. In its role as sponsor, it is particularly exposed to credit and liquidity risk. Arranger - RBS may structure a securitisation transaction, drafting the documentation that governs the behaviour of the SSPE, and then sell the securities issued by the SSPE to investors. It may act as arranger for securitisation transactions it originates or, alternatively, for securitisation transactions originated by its customers, principally financial institutions and large corporates. Manager - RBS may manage and service the asset pool of the securitisation as required by the terms of the transaction. Underwriter - RBS may underwrite the securities issued by an SSPE. The associated securitisation transaction may be originated by RBS or its customers.
Other administrative roles - As a ‘contractual party’, RBS may do any of the following, alone or in combination: Hold the bank account of an SSPE on its own books; Monitor the credit quality of the underlying assets on
behalf of investors; Report on the performance of the SSPE to investors; and Make payments to investors on behalf of the SSPE.
Risk management As noted above, acting as an originator, sponsor or investor in a securitisation transaction may give rise to both credit and market risk. The CRR prescribes how the regulatory capital held in connection with those risks is calculated. RBS may also incur other types of risk in the course of its exposure to securitisation activity. All such risks are described in the table below, along with details of how they are monitored and managed. With respect to the non-trading book, Capital Resolution manages the legacy positions mentioned above, including some re-securitisations. Treasury manages securitisations originated by RBS, particularly those used as a means of diversifying its funding sources. NatWest Markets manages trading book securitisation positions, including some re-securitisations. In the case of junior notes, all of the following risks are likely to be heightened and thus subject to increased scrutiny.
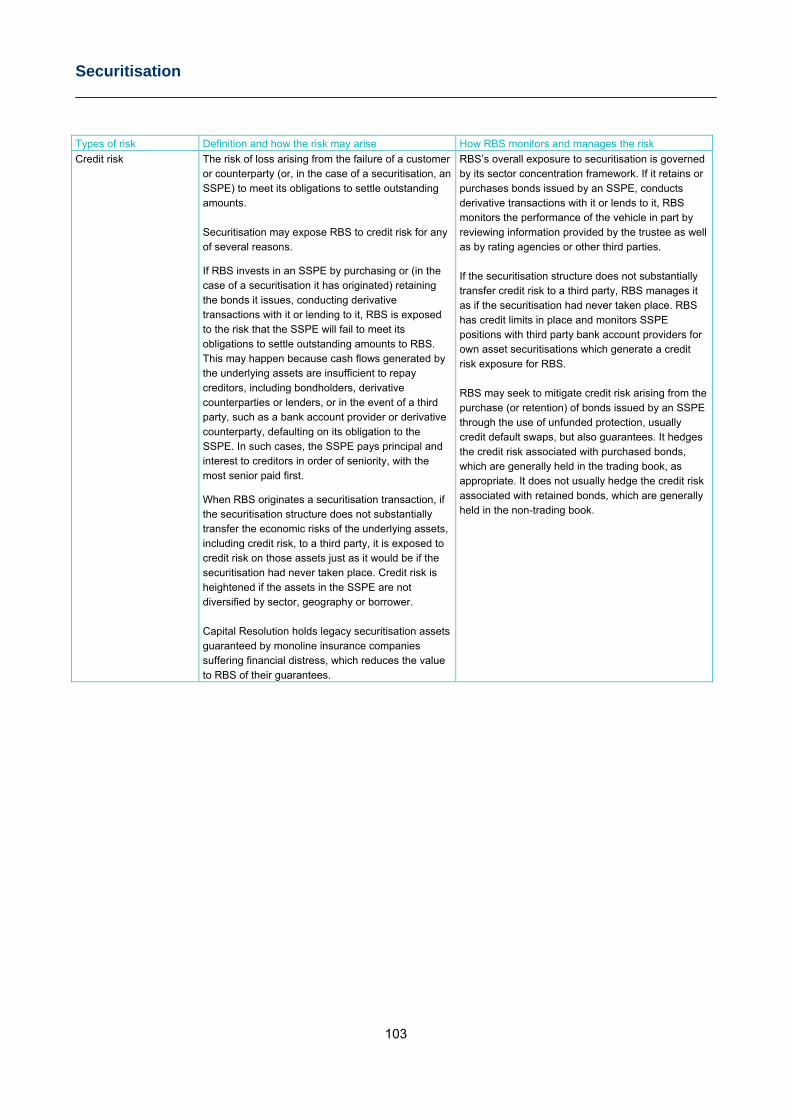
Securitisation
103
Types of risk Definition and how the risk may arise How RBS monitors and manages the risk
Credit risk The risk of loss arising from the failure of a customer or counterparty (or, in the case of a securitisation, an SSPE) to meet its obligations to settle outstanding amounts. Securitisation may expose RBS to credit risk for any of several reasons.
If RBS invests in an SSPE by purchasing or (in the case of a securitisation it has originated) retaining the bonds it issues, conducting derivative transactions with it or lending to it, RBS is exposed to the risk that the SSPE will fail to meet its obligations to settle outstanding amounts to RBS. This may happen because cash flows generated by the underlying assets are insufficient to repay creditors, including bondholders, derivative counterparties or lenders, or in the event of a third party, such as a bank account provider or derivative counterparty, defaulting on its obligation to the SSPE. In such cases, the SSPE pays principal and interest to creditors in order of seniority, with the most senior paid first.
When RBS originates a securitisation transaction, if the securitisation structure does not substantially transfer the economic risks of the underlying assets, including credit risk, to a third party, it is exposed to credit risk on those assets just as it would be if the securitisation had never taken place. Credit risk is heightened if the assets in the SSPE are not diversified by sector, geography or borrower. Capital Resolution holds legacy securitisation assets guaranteed by monoline insurance companies suffering financial distress, which reduces the value to RBS of their guarantees.
RBS’s overall exposure to securitisation is governed by its sector concentration framework. If it retains or purchases bonds issued by an SSPE, conducts derivative transactions with it or lends to it, RBS monitors the performance of the vehicle in part by reviewing information provided by the trustee as well as by rating agencies or other third parties. If the securitisation structure does not substantially transfer credit risk to a third party, RBS manages it as if the securitisation had never taken place. RBS has credit limits in place and monitors SSPE positions with third party bank account providers for own asset securitisations which generate a credit risk exposure for RBS. RBS may seek to mitigate credit risk arising from the purchase (or retention) of bonds issued by an SSPE through the use of unfunded protection, usually credit default swaps, but also guarantees. It hedges the credit risk associated with purchased bonds, which are generally held in the trading book, as appropriate. It does not usually hedge the credit risk associated with retained bonds, which are generally held in the non-trading book.
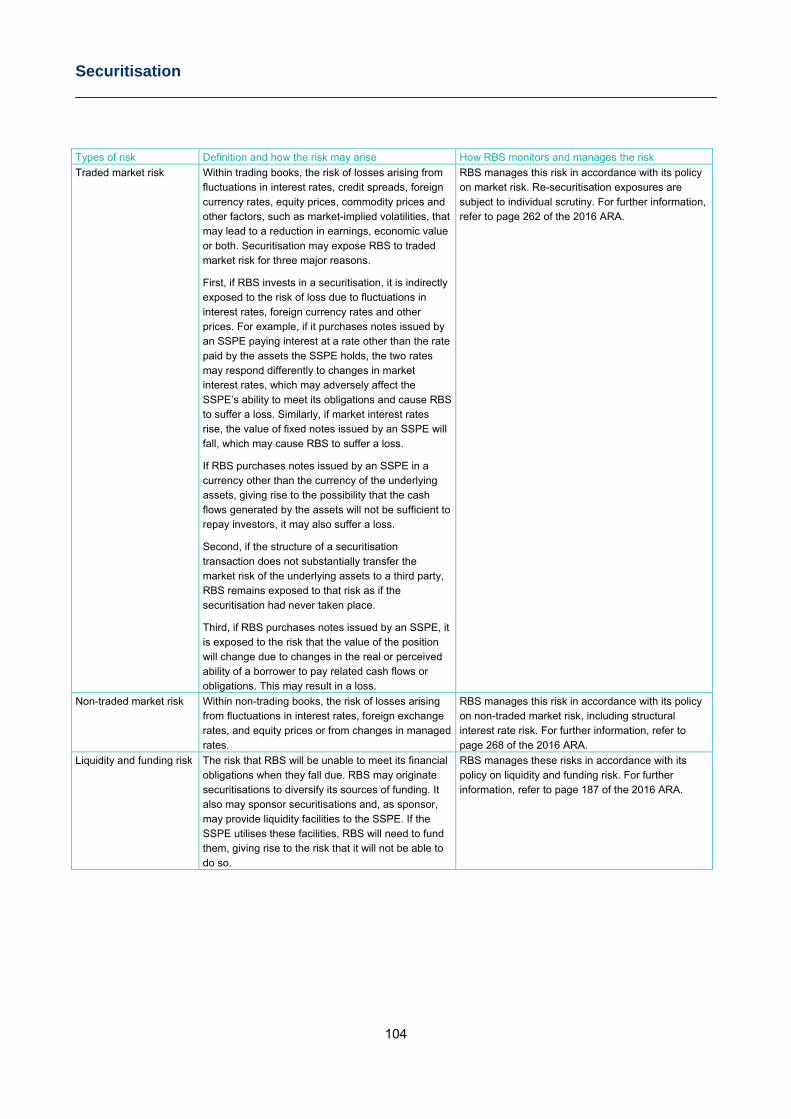
Securitisation
104
Types of risk Definition and how the risk may arise How RBS monitors and manages the risk
Traded market risk Within trading books, the risk of losses arising from fluctuations in interest rates, credit spreads, foreign currency rates, equity prices, commodity prices and other factors, such as market-implied volatilities, that may lead to a reduction in earnings, economic value or both. Securitisation may expose RBS to traded market risk for three major reasons.
First, if RBS invests in a securitisation, it is indirectly exposed to the risk of loss due to fluctuations in interest rates, foreign currency rates and other prices. For example, if it purchases notes issued by an SSPE paying interest at a rate other than the rate paid by the assets the SSPE holds, the two rates may respond differently to changes in market interest rates, which may adversely affect the SSPE’s ability to meet its obligations and cause RBS to suffer a loss. Similarly, if market interest rates rise, the value of fixed notes issued by an SSPE will fall, which may cause RBS to suffer a loss.
If RBS purchases notes issued by an SSPE in a currency other than the currency of the underlying assets, giving rise to the possibility that the cash flows generated by the assets will not be sufficient to repay investors, it may also suffer a loss.
Second, if the structure of a securitisation transaction does not substantially transfer the market risk of the underlying assets to a third party, RBS remains exposed to that risk as if the securitisation had never taken place.
Third, if RBS purchases notes issued by an SSPE, it is exposed to the risk that the value of the position will change due to changes in the real or perceived ability of a borrower to pay related cash flows or obligations. This may result in a loss.
RBS manages this risk in accordance with its policy on market risk. Re-securitisation exposures are subject to individual scrutiny. For further information, refer to page 262 of the 2016 ARA.
Non-traded market risk Within non-trading books, the risk of losses arising from fluctuations in interest rates, foreign exchange rates, and equity prices or from changes in managed rates.
RBS manages this risk in accordance with its policy on non-traded market risk, including structural interest rate risk. For further information, refer to page 268 of the 2016 ARA.
Liquidity and funding risk The risk that RBS will be unable to meet its financial obligations when they fall due. RBS may originate securitisations to diversify its sources of funding. It also may sponsor securitisations and, as sponsor, may provide liquidity facilities to the SSPE. If the SSPE utilises these facilities, RBS will need to fund them, giving rise to the risk that it will not be able to do so.
RBS manages these risks in accordance with its policy on liquidity and funding risk. For further information, refer to page 187 of the 2016 ARA.
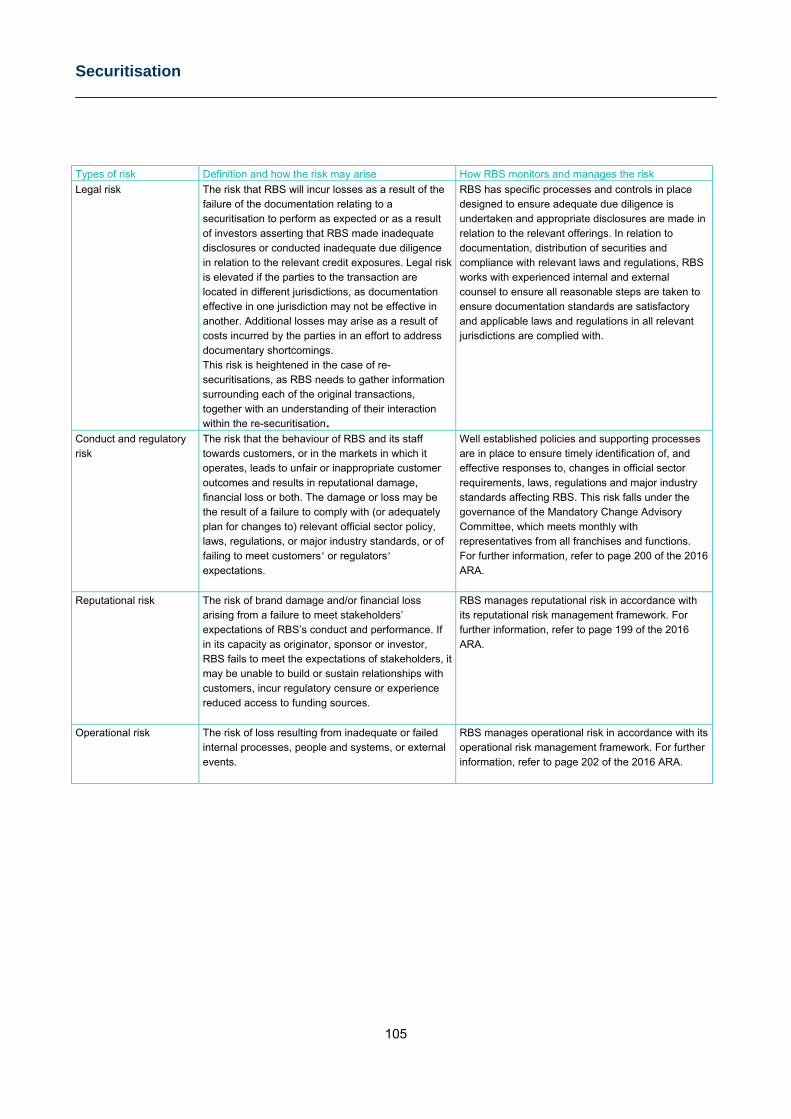
Securitisation
105
Types of risk Definition and how the risk may arise How RBS monitors and manages the risk
Legal risk The risk that RBS will incur losses as a result of the failure of the documentation relating to a securitisation to perform as expected or as a result of investors asserting that RBS made inadequate disclosures or conducted inadequate due diligence in relation to the relevant credit exposures. Legal risk is elevated if the parties to the transaction are located in different jurisdictions, as documentation effective in one jurisdiction may not be effective in another. Additional losses may arise as a result of costs incurred by the parties in an effort to address documentary shortcomings. This risk is heightened in the case of re-securitisations, as RBS needs to gather information surrounding each of the original transactions, together with an understanding of their interaction within the re-securitisation.
RBS has specific processes and controls in place designed to ensure adequate due diligence is undertaken and appropriate disclosures are made in relation to the relevant offerings. In relation to documentation, distribution of securities and compliance with relevant laws and regulations, RBS works with experienced internal and external counsel to ensure all reasonable steps are taken to ensure documentation standards are satisfactory and applicable laws and regulations in all relevant jurisdictions are complied with.
Conduct and regulatory risk
The risk that the behaviour of RBS and its staff towards customers, or in the markets in which it operates, leads to unfair or inappropriate customer outcomes and results in reputational damage, financial loss or both. The damage or loss may be the result of a failure to comply with (or adequately plan for changes to) relevant official sector policy, laws, regulations, or major industry standards, or of failing to meet customers’ or regulators’ expectations.
Well established policies and supporting processes are in place to ensure timely identification of, and effective responses to, changes in official sector requirements, laws, regulations and major industry standards affecting RBS. This risk falls under the governance of the Mandatory Change Advisory Committee, which meets monthly with representatives from all franchises and functions. For further information, refer to page 200 of the 2016 ARA.
Reputational risk The risk of brand damage and/or financial loss arising from a failure to meet stakeholders’ expectations of RBS’s conduct and performance. If in its capacity as originator, sponsor or investor, RBS fails to meet the expectations of stakeholders, it may be unable to build or sustain relationships with customers, incur regulatory censure or experience reduced access to funding sources.
RBS manages reputational risk in accordance with its reputational risk management framework. For further information, refer to page 199 of the 2016 ARA.
Operational risk The risk of loss resulting from inadequate or failed internal processes, people and systems, or external events.
RBS manages operational risk in accordance with its operational risk management framework. For further information, refer to page 202 of the 2016 ARA.
Securitisation
106
Regulatory treatment RBS determines the regulatory capital required for exposures related to its securitisation activities in accordance with the CRR. In so doing, with respect to each securitisation transaction, it considers on an ongoing basis:
The effectiveness of the originated securitisation structure in achieving risk transfer; and
Whether the securitisation positions it holds relate to the trading or non-trading book.
In instances where it is an originator, in accordance with the CRR, RBS carries out a significant risk transfer assessment to evaluate whether the securitisation structure effectively transfers the risks associated with the underlying assets to the holders of the securitisation positions. If significant risk transfer is deemed to have been achieved, RBS need not hold any capital against the underlying assets. However, if it is deemed not to have been achieved, capital must be held against the underlying assets as if the securitisation had never taken place. As noted earlier, RBS may play any of several roles in respect of securitisations. Of these, three may result in RBS holding securitisation positions in connection with which a capital charge is required: originator; sponsor; or investor. In the case of securitisation positions related to the trading book, RBS calculates regulatory capital needed for specific and general market risks (refer to page 267 of the 2016 ARA). In the case of securitisation positions related to the non-trading book, it calculates regulatory capital needed for credit risk, either non-counterparty or counterparty.
Calculation of risk-weighted exposures The regulatory framework for securitisation allows RWA calculation using either the STD or the IRB approach. The choice of approach depends on the credit framework adopted by the firm under Pillar 1 for the underlying portfolio of securitised exposures. As at 31 December 2016, all of the securitisation positions held by RBS were subject to the IRB approach. RBS categorises securitised exposures according to risk-weight bands when calculating RWAs. Under the CRR, unrated positions are classified under the highest risk-weight band: 1,250%. Risk-weight bands are shown in Tables SEC 2 and SEC 3.
The IRB method used by RBS is the ratings based approach (RBA). When assessing debt issued by SSPEs under the RBA, RBS recognises ratings issued by Standard & Poor’s, Moody’s, Fitch, DBRS or ARC Ratings. Most transactions are rated by two or more of these rating agencies, which are formally classified as external credit assessment institutions (ECAIs). When assessing unrated exposures funded via an ABCP conduit, (whether a legacy RBS sponsored conduit or an ABCP conduit sponsored by other institutions), RBS is permitted to use the Internal Assessment Approach (IAA) under its IRB waiver. Under the RBA (including the IAA), ECAI ratings are mapped to the corresponding credit quality step (CQS) in order to determine the risk weights for the facilities relating to each transaction. The mapping used is shown in Table EU CR5a in the Credit risk section. More details on RBS’s use of the IAA are provided below. Summary of Internal Assessment Approach Where an ABCP conduit is rated by an approved ECAI, the IAA permits RBS to calculate and assign internal credit grades and implied ratings based on published rating agency methodologies for the relevant asset class. The assessment methodology must be that of one of the ECAIs that provides a rating to the ABCP conduit. The methodology selected need not be publicly available if RBS can demonstrate that, due to specific features of the securitisation, there is not yet an appropriate publicly available ECAI methodology. The sponsoring business for the underlying transaction is required to model the transaction using an assessment methodology in line with the above. The modelling analysis is completed, refreshed or reviewed, as appropriate, as part of the credit application process/ongoing transaction surveillance. The credit risk assessment of the transaction which takes place both at inception and as part of ongoing review considers the appropriateness of the IAA, the assumptions used and the proposed implied rating. Under the RBA, including the IAA, the ECAI ratings are mapped to the Credit Quality Steps (CQS) in order to determine the risk weight for the facilities relating to each transaction. At programme level, the commercial paper issued by the conduits receives a public short-term rating, which is determined primarily by RBS’s rating as liquidity provider.
Securitisation
107
Summary of accounting policies including derecognition Accounting assessment takes place at the time of closing a transaction and under accounting rules, depends on a securitisation’s residual risk. By contrast, significant risk transfer assessments take place at regular intervals. The resulting capital calculations can differ depending on the change in residual risk over time. Recognition of sales Securitisation vehicles are assessed for consolidation in accordance with RBS’s published accounting policy Basis of Consolidation (refer to page 297 of the 2016 ARA). The transfer of assets to a securitisation vehicle is treated as a sale if the securitised assets are derecognised from the consolidated balance sheet in accordance with RBS’s published accounting policy Derecognition (refer to page 304 of the 2016 ARA). RBS applies its accounting policies Provisions; Loan commitments; and Financial guarantee contracts (set out on pages 301 and 304 of the 2016 ARA) to contractual commitments, such as liquidity lines, that could require it to provide financial support for securitised assets. Key assumptions for valuing securitisation positions Securitisation positions are valued using external information, such as market data for recent transactions, price information from third-party managers and advisors, and asset performance data provided to all bond holders at interest payment dates. Synthetic securitisations Synthetic securitisations are assessed using the same approach as non-synthetic securitisations. Any derivatives are treated in accordance with RBS’s published accounting policy Derivatives and hedging (refer to page 305 of the 2016 ARA). Assets awaiting securitisation Financial assets are valued using RBS’s accounting policy for financial assets (refer to page 301 of the 2016 ARA). At both 31 December 2016 and 31 December 2015, no assets were categorised as awaiting securitisation. Implicit support RBS has not provided support to any securitisation transactions beyond its contractual obligations.
Securitisation and re-securitisation exposures Additional information detailing accounting policies, and treatment of securitisations and re-securitisations can be found on page 304 of the 2016 ARA.
Types of transactions In the role of originator, RBS securitises a variety of assets which typically include the following:
Residential mortgages and commercial real estate loans - RBS securitises residential mortgages and commercial real estate loans that it originates itself. Mortgages and real estate loans are assigned to SSPEs, which fund themselves principally through the issue of floating rate notes.
Credit card receivables - In the UK, RBS securitises credit card receivables that it originates itself. Noteholders have a proportionate interest in a pool of credit card receivables that are assigned by RBS to a receivables trust.
Other loan types - RBS selectively securitises other loans that it originates, principally those to corporates and small and medium-sized enterprises.
SSPEs used by RBS SSPEs used by RBS hold either the securitised assets themselves (traditional securitisations) or a package of other assets economically equivalent to those assets (synthetic securitisations). At 31 December 2016, RBS sponsored one remaining multi-seller commercial paper conduit programme, Thames Asset Global Securitization (TAGS). RBS provides programme-wide credit enhancement and liquidity facilities to TAGS. During 2016, TAGS issued no commercial paper to external parties. The transactions in which RBS acts as a swap counterparty, has originated all the assets and continues to administer the associated SSPEs include the following: Arran (UK residential mortgages SSPEs); Celtic (Irish residential mortgages SSPEs); Epic (commercial real estate SSPEs); and Talisman (commercial real estate SSPEs). The last remaining Arran UK residential mortgages transaction was called on 20 January 2017. Notes on the following tables Tables SEC 1 to SEC 4 show total securitisation positions, as discussed under Regulatory treatment of securitisation on page 106. The exposures included those retained from RBS’s own securitised assets, investments in SSPE notes, credit lines to SSPEs and derivative transactions with SSPEs. The term ‘exposure amount’ used in the following tables refers to EAD, which is calculated according to CRR rules. Exposure amount is shown along with other measures in Tables SEC 1 and SEC 2. Tables SEC 3 and SEC 4 show exposure amounts exclusively. In previous years, Table SEC 7 appeared in the Market risk section of the ARA. RBS did not securitise any of its own assets during 2015. In 2016 it completed a synthetic securitisation of £433 million of loans to corporates or SMEs. No gain or loss was recognised on the transfer of these assets.
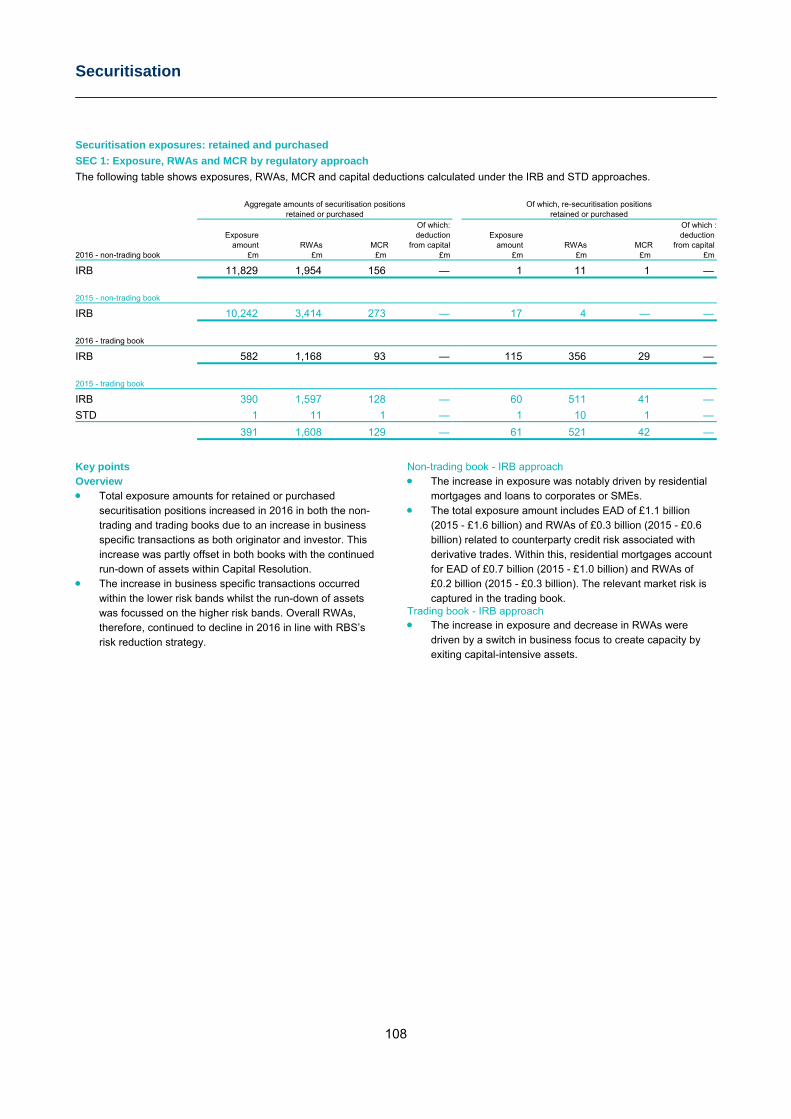
Securitisation
108
Securitisation exposures: retained and purchased SEC 1: Exposure, RWAs and MCR by regulatory approach The following table shows exposures, RWAs, MCR and capital deductions calculated under the IRB and STD approaches.
Aggregate amounts of securitisation positions
Of which, re-securitisation positions
retained or purchased retained or purchased
Of which: Of which :Exposure deduction Exposure deduction
amount RWAs MCR from capital amount RWAs MCR from capital 2016 - non-trading book £m £m £m £m £m £m £m £m
IRB 11,829 1,954 156 — 1 11 1 —
2015 - non-trading book
IRB 10,242 3,414 273 — 17 4 — —
2016 - trading book
IRB 582 1,168 93 — 115 356 29 —
2015 - trading book
IRB 390 1,597 128 — 60 511 41 —
STD 1 11 1 — 1 10 1 —
391 1,608 129 — 61 521 42 —
Key points Overview Total exposure amounts for retained or purchased
securitisation positions increased in 2016 in both the non-trading and trading books due to an increase in business specific transactions as both originator and investor. This increase was partly offset in both books with the continued run-down of assets within Capital Resolution.
The increase in business specific transactions occurred within the lower risk bands whilst the run-down of assets was focussed on the higher risk bands. Overall RWAs, therefore, continued to decline in 2016 in line with RBS’s risk reduction strategy.
Non-trading book - IRB approach The increase in exposure was notably driven by residential
mortgages and loans to corporates or SMEs. The total exposure amount includes EAD of £1.1 billion
(2015 - £1.6 billion) and RWAs of £0.3 billion (2015 - £0.6 billion) related to counterparty credit risk associated with derivative trades. Within this, residential mortgages account for EAD of £0.7 billion (2015 - £1.0 billion) and RWAs of £0.2 billion (2015 - £0.3 billion). The relevant market risk is captured in the trading book.
Trading book - IRB approach The increase in exposure and decrease in RWAs were
driven by a switch in business focus to create capacity by exiting capital-intensive assets.
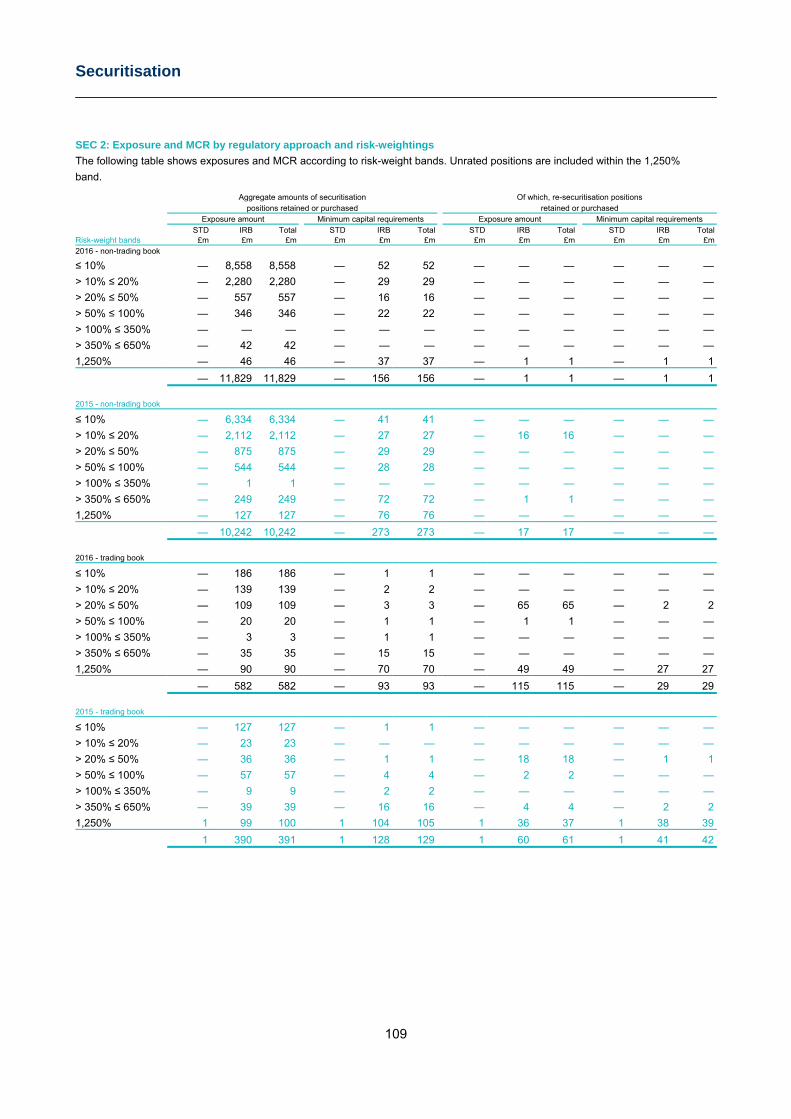
Securitisation
109
SEC 2: Exposure and MCR by regulatory approach and risk-weightings The following table shows exposures and MCR according to risk-weight bands. Unrated positions are included within the 1,250% band.
Risk-weight bands
Aggregate amounts of securitisation Of which, re-securitisation positions positions retained or purchased retained or purchased
Exposure amount Minimum capital requirements Exposure amount Minimum capital requirements STD IRB Total STD IRB Total STD IRB Total STD IRB Total
£m £m £m £m £m £m £m £m £m £m £m £m 2016 - non-trading book
≤ 10% — 8,558 8,558 — 52 52 — — — — — —
> 10% ≤ 20% — 2,280 2,280 — 29 29 — — — — — —
> 20% ≤ 50% — 557 557 — 16 16 — — — — — —
> 50% ≤ 100% — 346 346 — 22 22 — — — — — —
> 100% ≤ 350% — — — — — — — — — — — —
> 350% ≤ 650% — 42 42 — — — — — — — — —
1,250% — 46 46 — 37 37 — 1 1 — 1 1
— 11,829 11,829 — 156 156 — 1 1 — 1 1 2015 - non-trading book
≤ 10% — 6,334 6,334 — 41 41 — — — — — —
> 10% ≤ 20% — 2,112 2,112 — 27 27 — 16 16 — — —
> 20% ≤ 50% — 875 875 — 29 29 — — — — — —
> 50% ≤ 100% — 544 544 — 28 28 — — — — — —
> 100% ≤ 350% — 1 1 — — — — — — — — —
> 350% ≤ 650% — 249 249 — 72 72 — 1 1 — — —
1,250% — 127 127 — 76 76 — — — — — —
— 10,242 10,242 — 273 273 — 17 17 — — — 2016 - trading book
≤ 10% — 186 186 — 1 1 — — — — — —
> 10% ≤ 20% — 139 139 — 2 2 — — — — — —
> 20% ≤ 50% — 109 109 — 3 3 — 65 65 — 2 2
> 50% ≤ 100% — 20 20 — 1 1 — 1 1 — — —
> 100% ≤ 350% — 3 3 — 1 1 — — — — — —
> 350% ≤ 650% — 35 35 — 15 15 — — — — — —
1,250% — 90 90 — 70 70 — 49 49 — 27 27
— 582 582 — 93 93 — 115 115 — 29 29 2015 - trading book
≤ 10% — 127 127 — 1 1 — — — — — —
> 10% ≤ 20% — 23 23 — — — — — — — — —
> 20% ≤ 50% — 36 36 — 1 1 — 18 18 — 1 1
> 50% ≤ 100% — 57 57 — 4 4 — 2 2 — — —
> 100% ≤ 350% — 9 9 — 2 2 — — — — — —
> 350% ≤ 650% — 39 39 — 16 16 — 4 4 — 2 2
1,250% 1 99 100 1 104 105 1 36 37 1 38 39
1 390 391 1 128 129 1 60 61 1 41 42
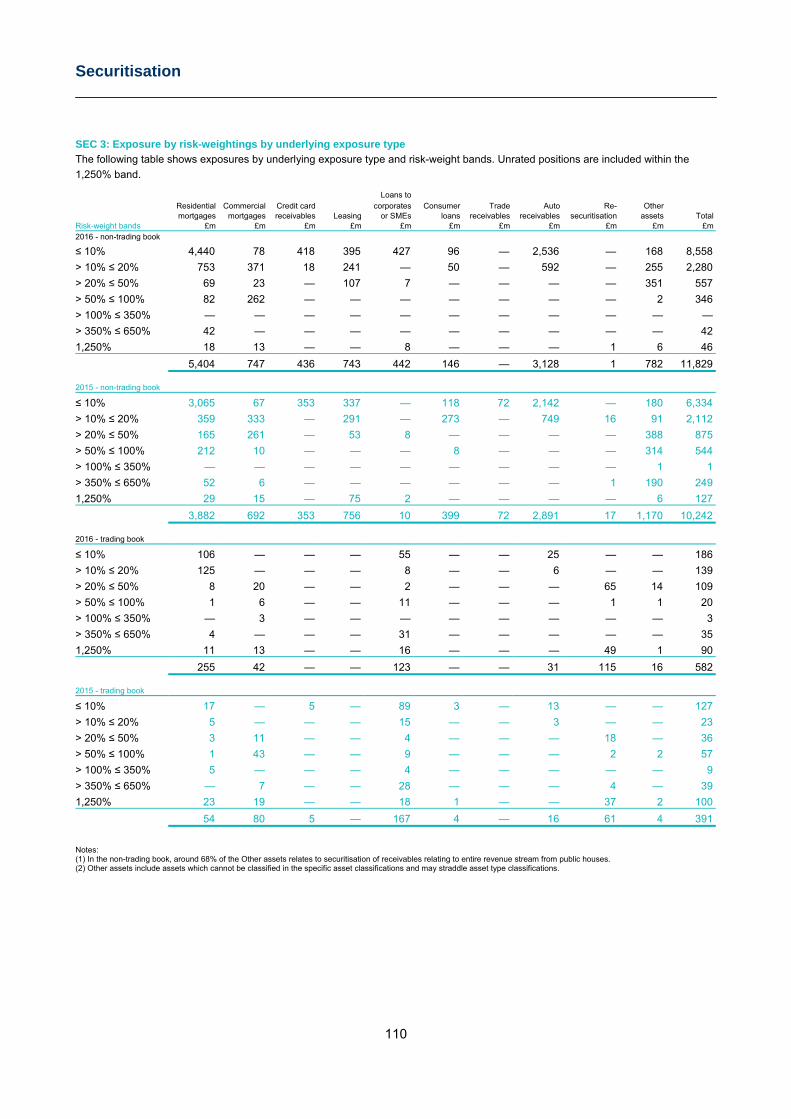
Securitisation
110
SEC 3: Exposure by risk-weightings by underlying exposure type The following table shows exposures by underlying exposure type and risk-weight bands. Unrated positions are included within the 1,250% band.
Risk-weight bands Leasing
Loans to
Total Residential Commercial Credit card corporates Consumer Trade Auto Re- Other mortgages mortgages receivables or SMEs loans receivables receivables securitisation assets
£m £m £m £m £m £m £m £m £m £m £m 2016 - non-trading book
≤ 10% 4,440 78 418 395 427 96 — 2,536 — 168 8,558
> 10% ≤ 20% 753 371 18 241 — 50 — 592 — 255 2,280
> 20% ≤ 50% 69 23 — 107 7 — — — — 351 557
> 50% ≤ 100% 82 262 — — — — — — — 2 346
> 100% ≤ 350% — — — — — — — — — — —
> 350% ≤ 650% 42 — — — — — — — — — 42
1,250% 18 13 — — 8 — — — 1 6 46
5,404 747 436 743 442 146 — 3,128 1 782 11,829
2015 - non-trading book
≤ 10% 3,065 67 353 337 — 118 72 2,142 — 180 6,334
> 10% ≤ 20% 359 333 — 291 — 273 — 749 16 91 2,112
> 20% ≤ 50% 165 261 — 53 8 — — — — 388 875
> 50% ≤ 100% 212 10 — — — 8 — — — 314 544
> 100% ≤ 350% — — — — — — — — — 1 1
> 350% ≤ 650% 52 6 — — — — — — 1 190 249
1,250% 29 15 — 75 2 — — — — 6 127
3,882 692 353 756 10 399 72 2,891 17 1,170 10,242
2016 - trading book
≤ 10% 106 — — — 55 — — 25 — — 186
> 10% ≤ 20% 125 — — — 8 — — 6 — — 139
> 20% ≤ 50% 8 20 — — 2 — — — 65 14 109
> 50% ≤ 100% 1 6 — — 11 — — — 1 1 20
> 100% ≤ 350% — 3 — — — — — — — — 3
> 350% ≤ 650% 4 — — — 31 — — — — — 35
1,250% 11 13 — — 16 — — — 49 1 90
255 42 — — 123 — — 31 115 16 582
2015 - trading book
≤ 10% 17 — 5 — 89 3 — 13 — — 127
> 10% ≤ 20% 5 — — — 15 — — 3 — — 23
> 20% ≤ 50% 3 11 — — 4 — — — 18 — 36
> 50% ≤ 100% 1 43 — — 9 — — — 2 2 57
> 100% ≤ 350% 5 — — — 4 — — — — — 9
> 350% ≤ 650% — 7 — — 28 — — — 4 — 39
1,250% 23 19 — — 18 1 — — 37 2 100
54 80 5 — 167 4 — 16 61 4 391
Notes: (1) In the non-trading book, around 68% of the Other assets relates to securitisation of receivables relating to entire revenue stream from public houses. (2) Other assets include assets which cannot be classified in the specific asset classifications and may straddle asset type classifications.
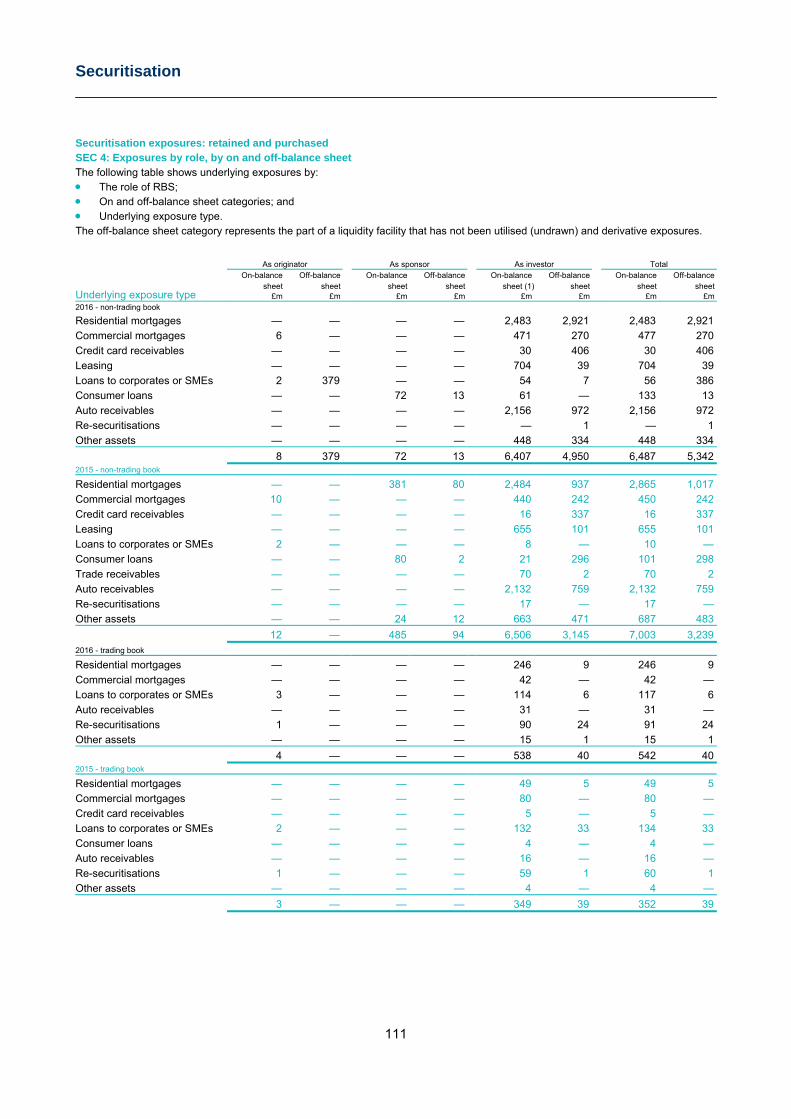
Securitisation
111
Securitisation exposures: retained and purchased SEC 4: Exposures by role, by on and off-balance sheet The following table shows underlying exposures by: The role of RBS; On and off-balance sheet categories; and Underlying exposure type. The off-balance sheet category represents the part of a liquidity facility that has not been utilised (undrawn) and derivative exposures.
As originator As sponsor As investor Total
Underlying exposure type
On-balance Off-balance On-balance Off-balance On-balance Off-balance On-balance Off-balance sheet sheet sheet sheet sheet (1) sheet sheet sheet
£m £m £m £m £m £m £m £m 2016 - non-trading book
Residential mortgages — — — — 2,483 2,921 2,483 2,921
Commercial mortgages 6 — — — 471 270 477 270
Credit card receivables — — — — 30 406 30 406
Leasing — — — — 704 39 704 39
Loans to corporates or SMEs 2 379 — — 54 7 56 386
Consumer loans — — 72 13 61 — 133 13
Auto receivables — — — — 2,156 972 2,156 972
Re-securitisations — — — — — 1 — 1
Other assets — — — — 448 334 448 334
8 379 72 13 6,407 4,950 6,487 5,342 2015 - non-trading book
Residential mortgages — — 381 80 2,484 937 2,865 1,017
Commercial mortgages 10 — — — 440 242 450 242
Credit card receivables — — — — 16 337 16 337
Leasing — — — — 655 101 655 101
Loans to corporates or SMEs 2 — — — 8 — 10 —
Consumer loans — — 80 2 21 296 101 298
Trade receivables — — — — 70 2 70 2
Auto receivables — — — — 2,132 759 2,132 759
Re-securitisations — — — — 17 — 17 —
Other assets — — 24 12 663 471 687 483
12 — 485 94 6,506 3,145 7,003 3,239 2016 - trading book
Residential mortgages — — — — 246 9 246 9
Commercial mortgages — — — — 42 — 42 —
Loans to corporates or SMEs 3 — — — 114 6 117 6
Auto receivables — — — — 31 — 31 —
Re-securitisations 1 — — — 90 24 91 24
Other assets — — — — 15 1 15 1
4 — — — 538 40 542 40 2015 - trading book
Residential mortgages — — — — 49 5 49 5
Commercial mortgages — — — — 80 — 80 —
Credit card receivables — — — — 5 — 5 —
Loans to corporates or SMEs 2 — — — 132 33 134 33
Consumer loans — — — — 4 — 4 —
Auto receivables — — — — 16 — 16 —
Re-securitisations 1 — — — 59 1 60 1
Other assets — — — — 4 — 4 —
3 — — — 349 39 352 39
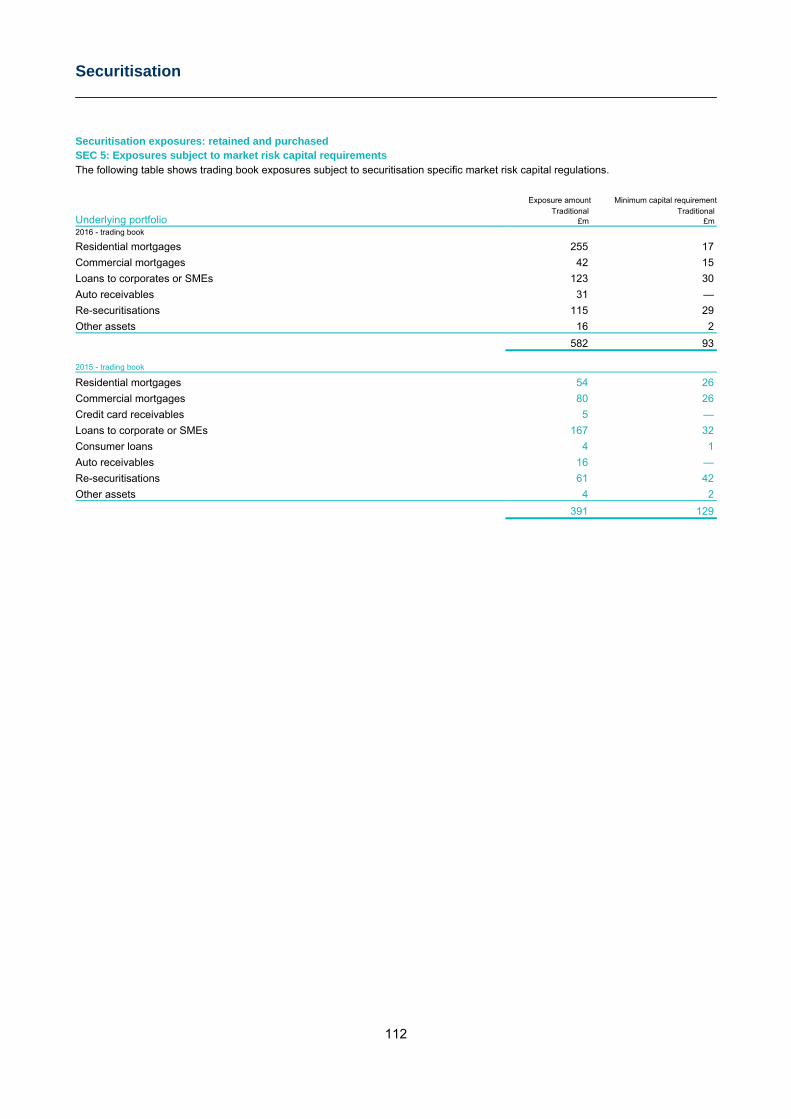
Securitisation
112
Securitisation exposures: retained and purchased SEC 5: Exposures subject to market risk capital requirements The following table shows trading book exposures subject to securitisation specific market risk capital regulations.
Underlying portfolio Exposure amount Minimum capital requirement
Traditional Traditional £m £m
2016 - trading book
Residential mortgages 255 17
Commercial mortgages 42 15
Loans to corporates or SMEs 123 30
Auto receivables 31 —
Re-securitisations 115 29
Other assets 16 2
582 93
2015 - trading book
Residential mortgages 54 26
Commercial mortgages 80 26
Credit card receivables 5 —
Loans to corporate or SMEs 167 32
Consumer loans 4 1
Auto receivables 16 —
Re-securitisations 61 42
Other assets 4 2
391 129
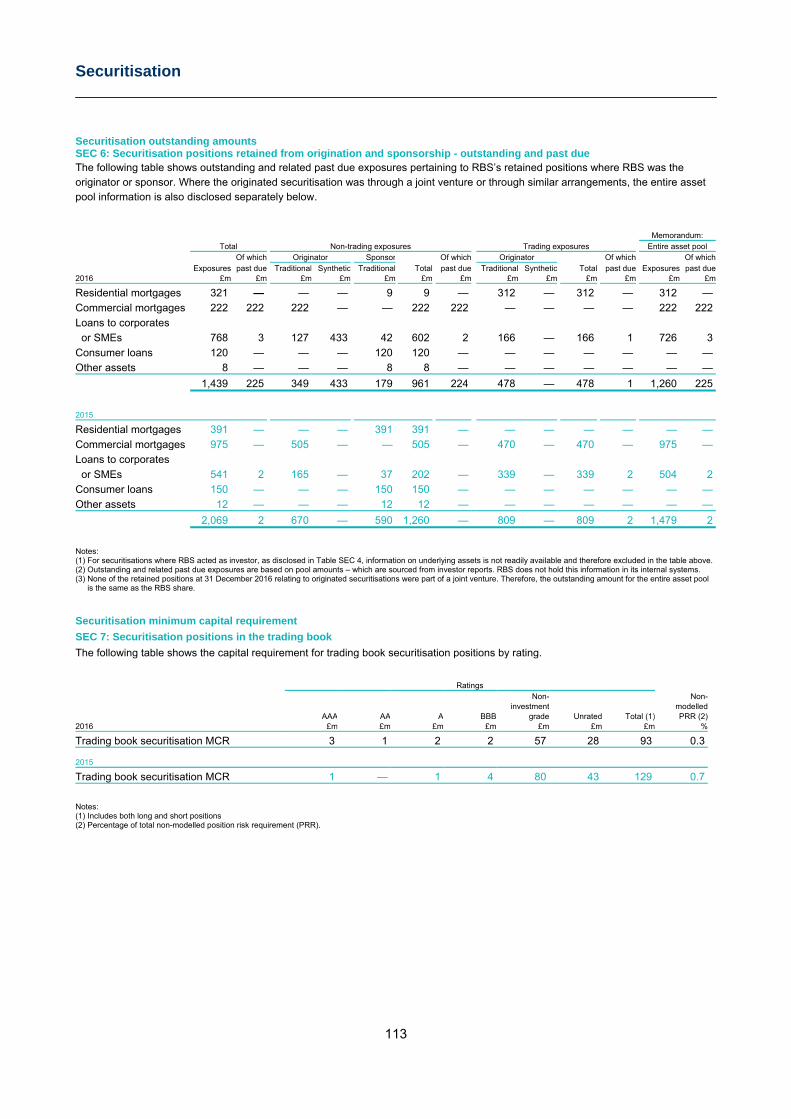
Securitisation
113
Securitisation outstanding amounts SEC 6: Securitisation positions retained from origination and sponsorship - outstanding and past due The following table shows outstanding and related past due exposures pertaining to RBS’s retained positions where RBS was the originator or sponsor. Where the originated securitisation was through a joint venture or through similar arrangements, the entire asset pool information is also disclosed separately below.
Memorandum: Total Non-trading exposures Trading exposures Entire asset pool Of which Originator Sponsor Of which Originator Of which Of which Exposures past due Traditional Synthetic Traditional Total past due Traditional Synthetic Total past due Exposures past due2016 £m £m £m £m £m £m £m £m £m £m £m £m £m
Residential mortgages 321 — — — 9 9 — 312 — 312 — 312 —
Commercial mortgages 222 222 222 — — 222 222 — — — — 222 222
Loans to corporates
or SMEs 768 3 127 433 42 602 2 166 — 166 1 726 3
Consumer loans 120 — — — 120 120 — — — — — — —
Other assets 8 — — — 8 8 — — — — — — —
1,439 225 349 433 179 961 224 478 — 478 1 1,260 225
2015
Residential mortgages 391 — — — 391 391 — — — — — — —
Commercial mortgages 975 — 505 — — 505 — 470 — 470 — 975 —
Loans to corporates
or SMEs 541 2 165 — 37 202 — 339 — 339 2 504 2
Consumer loans 150 — — — 150 150 — — — — — — —
Other assets 12 — — — 12 12 — — — — — — —
2,069 2 670 — 590 1,260 — 809 — 809 2 1,479 2
Notes: (1) For securitisations where RBS acted as investor, as disclosed in Table SEC 4, information on underlying assets is not readily available and therefore excluded in the table above. (2) Outstanding and related past due exposures are based on pool amounts – which are sourced from investor reports. RBS does not hold this information in its internal systems. (3) None of the retained positions at 31 December 2016 relating to originated securitisations were part of a joint venture. Therefore, the outstanding amount for the entire asset pool
is the same as the RBS share.
Securitisation minimum capital requirement SEC 7: Securitisation positions in the trading book
The following table shows the capital requirement for trading book securitisation positions by rating.
Ratings Non- Non- investment modelled AAA AA A BBB grade Unrated Total (1) PRR (2)2016 £m £m £m £m £m £m £m %
Trading book securitisation MCR 3 1 2 2 57 28 93 0.3
2015
Trading book securitisation MCR 1 — 1 4 80 43 129 0.7
Notes: (1) Includes both long and short positions (2) Percentage of total non-modelled position risk requirement (PRR).
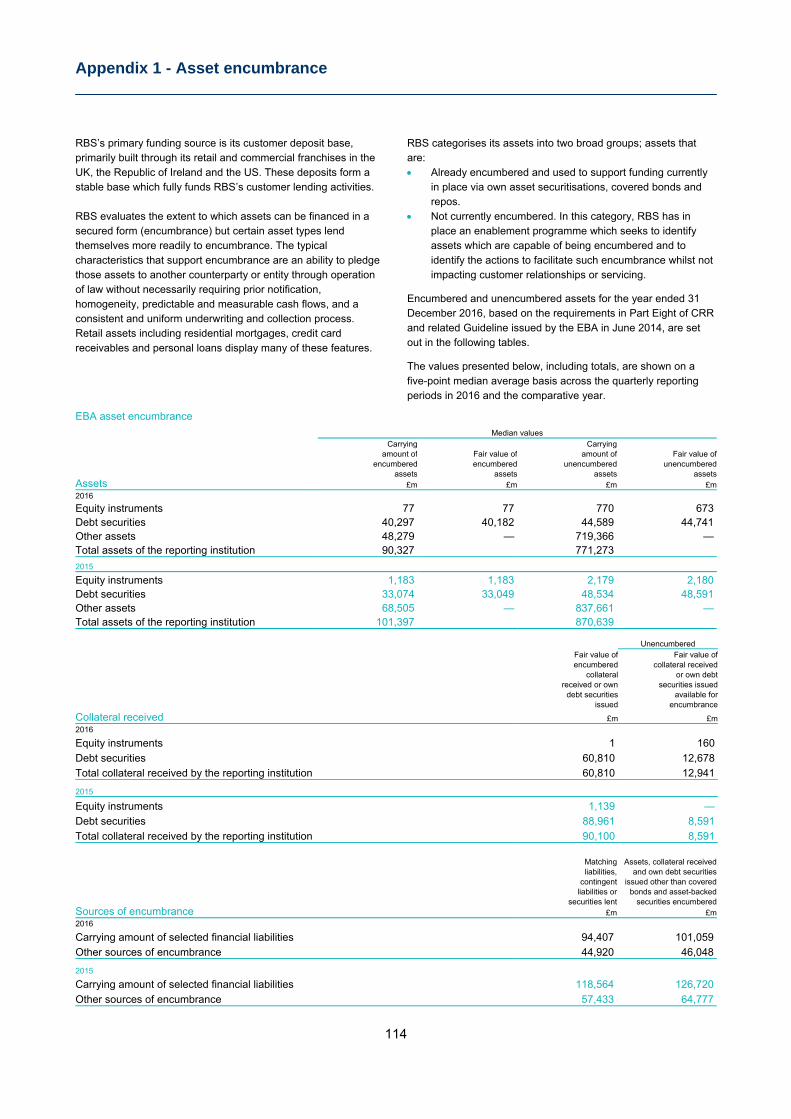
Appendix 1 - Asset encumbrance
114
RBS’s primary funding source is its customer deposit base, primarily built through its retail and commercial franchises in the UK, the Republic of Ireland and the US. These deposits form a stable base which fully funds RBS’s customer lending activities. RBS evaluates the extent to which assets can be financed in a secured form (encumbrance) but certain asset types lend themselves more readily to encumbrance. The typical characteristics that support encumbrance are an ability to pledge those assets to another counterparty or entity through operation of law without necessarily requiring prior notification, homogeneity, predictable and measurable cash flows, and a consistent and uniform underwriting and collection process. Retail assets including residential mortgages, credit card receivables and personal loans display many of these features.
RBS categorises its assets into two broad groups; assets that are: Already encumbered and used to support funding currently
in place via own asset securitisations, covered bonds and repos.
Not currently encumbered. In this category, RBS has in place an enablement programme which seeks to identify assets which are capable of being encumbered and to identify the actions to facilitate such encumbrance whilst not impacting customer relationships or servicing.
Encumbered and unencumbered assets for the year ended 31 December 2016, based on the requirements in Part Eight of CRR and related Guideline issued by the EBA in June 2014, are set out in the following tables.
The values presented below, including totals, are shown on a five-point median average basis across the quarterly reporting periods in 2016 and the comparative year.
EBA asset encumbrance Median values Carrying Carrying amount of Fair value of amount of Fair value of encumbered encumbered unencumbered unencumbered
Assets assets assets assets assets
£m £m £m £m2016
Equity instruments 77 77 770 673 Debt securities 40,297 40,182 44,589 44,741 Other assets 48,279 — 719,366 — Total assets of the reporting institution 90,327 771,273
2015 Equity instruments 1,183 1,183 2,179 2,180 Debt securities 33,074 33,049 48,534 48,591 Other assets 68,505 — 837,661 — Total assets of the reporting institution 101,397 870,639
Unencumbered Fair value of Fair value of encumbered collateral received collateral or own debt received or own securities issued debt securities available for issued encumbrance
Collateral received £m £m2016
Equity instruments 1 160
Debt securities 60,810 12,678
Total collateral received by the reporting institution 60,810 12,941
2015
Equity instruments 1,139 —
Debt securities 88,961 8,591
Total collateral received by the reporting institution 90,100 8,591
Matching Assets, collateral received liabilities, and own debt securities contingent issued other than covered liabilities or bonds and asset-backed
Sources of encumbrance securities lent securities encumbered
£m £m2016
Carrying amount of selected financial liabilities 94,407 101,059
Other sources of encumbrance 44,920 46,048
2015 Carrying amount of selected financial liabilities 118,564 126,720
Other sources of encumbrance 57,433 64,777
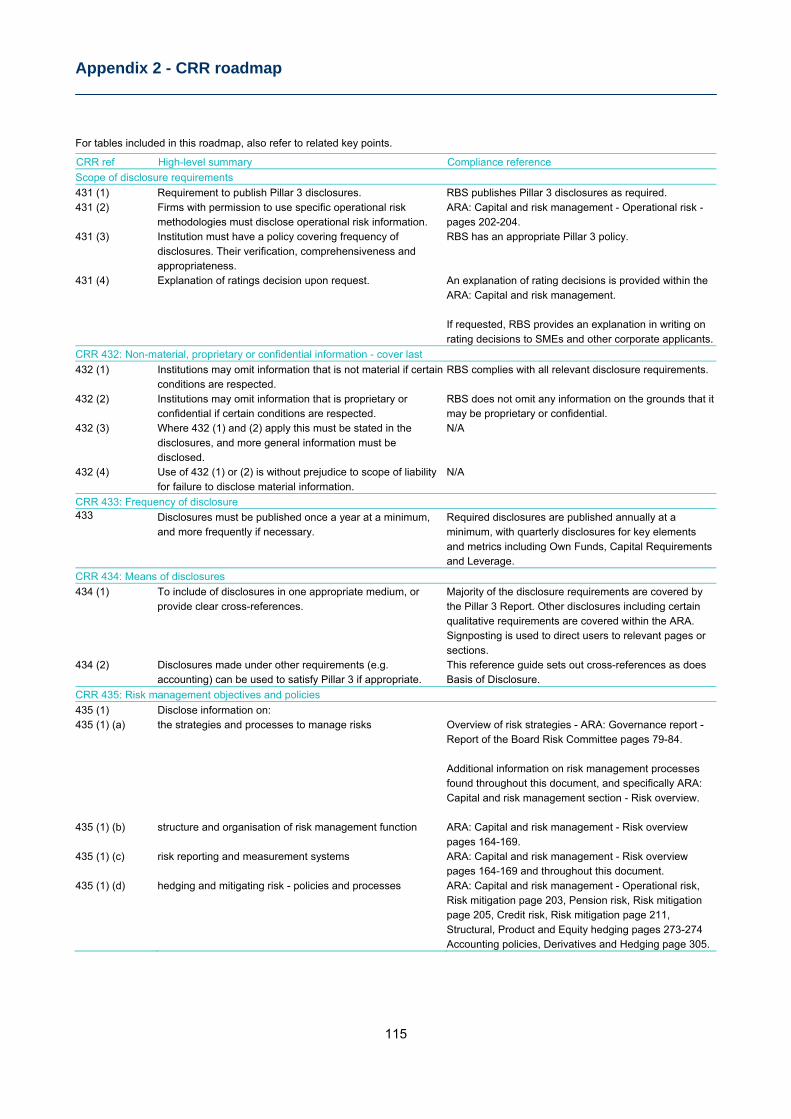
Appendix 2 - CRR roadmap
115
For tables included in this roadmap, also refer to related key points.
CRR ref High-level summary Compliance reference
Scope of disclosure requirements
431 (1) Requirement to publish Pillar 3 disclosures. RBS publishes Pillar 3 disclosures as required. 431 (2) Firms with permission to use specific operational risk
methodologies must disclose operational risk information. ARA: Capital and risk management - Operational risk - pages 202-204.
431 (3) Institution must have a policy covering frequency of disclosures. Their verification, comprehensiveness and appropriateness.
RBS has an appropriate Pillar 3 policy.
431 (4) Explanation of ratings decision upon request. An explanation of rating decisions is provided within the ARA: Capital and risk management. If requested, RBS provides an explanation in writing on rating decisions to SMEs and other corporate applicants.
CRR 432: Non-material, proprietary or confidential information - cover last
432 (1) Institutions may omit information that is not material if certain conditions are respected.
RBS complies with all relevant disclosure requirements.
432 (2) Institutions may omit information that is proprietary or confidential if certain conditions are respected.
RBS does not omit any information on the grounds that it may be proprietary or confidential.
432 (3) Where 432 (1) and (2) apply this must be stated in the disclosures, and more general information must be disclosed.
N/A
432 (4) Use of 432 (1) or (2) is without prejudice to scope of liability for failure to disclose material information.
N/A
CRR 433: Frequency of disclosure 433 Disclosures must be published once a year at a minimum,
and more frequently if necessary. Required disclosures are published annually at a minimum, with quarterly disclosures for key elements and metrics including Own Funds, Capital Requirements and Leverage.
CRR 434: Means of disclosures
434 (1) To include of disclosures in one appropriate medium, or provide clear cross-references.
Majority of the disclosure requirements are covered by the Pillar 3 Report. Other disclosures including certain qualitative requirements are covered within the ARA. Signposting is used to direct users to relevant pages or sections.
434 (2) Disclosures made under other requirements (e.g. accounting) can be used to satisfy Pillar 3 if appropriate.
This reference guide sets out cross-references as does Basis of Disclosure.
CRR 435: Risk management objectives and policies
435 (1) Disclose information on: 435 (1) (a) the strategies and processes to manage risks Overview of risk strategies - ARA: Governance report -
Report of the Board Risk Committee pages 79-84. Additional information on risk management processes found throughout this document, and specifically ARA: Capital and risk management section - Risk overview.
435 (1) (b) structure and organisation of risk management function ARA: Capital and risk management - Risk overview pages 164-169.
435 (1) (c) risk reporting and measurement systems ARA: Capital and risk management - Risk overview pages 164-169 and throughout this document.
435 (1) (d) hedging and mitigating risk - policies and processes ARA: Capital and risk management - Operational risk, Risk mitigation page 203, Pension risk, Risk mitigation page 205, Credit risk, Risk mitigation page 211, Structural, Product and Equity hedging pages 273-274 Accounting policies, Derivatives and Hedging page 305.
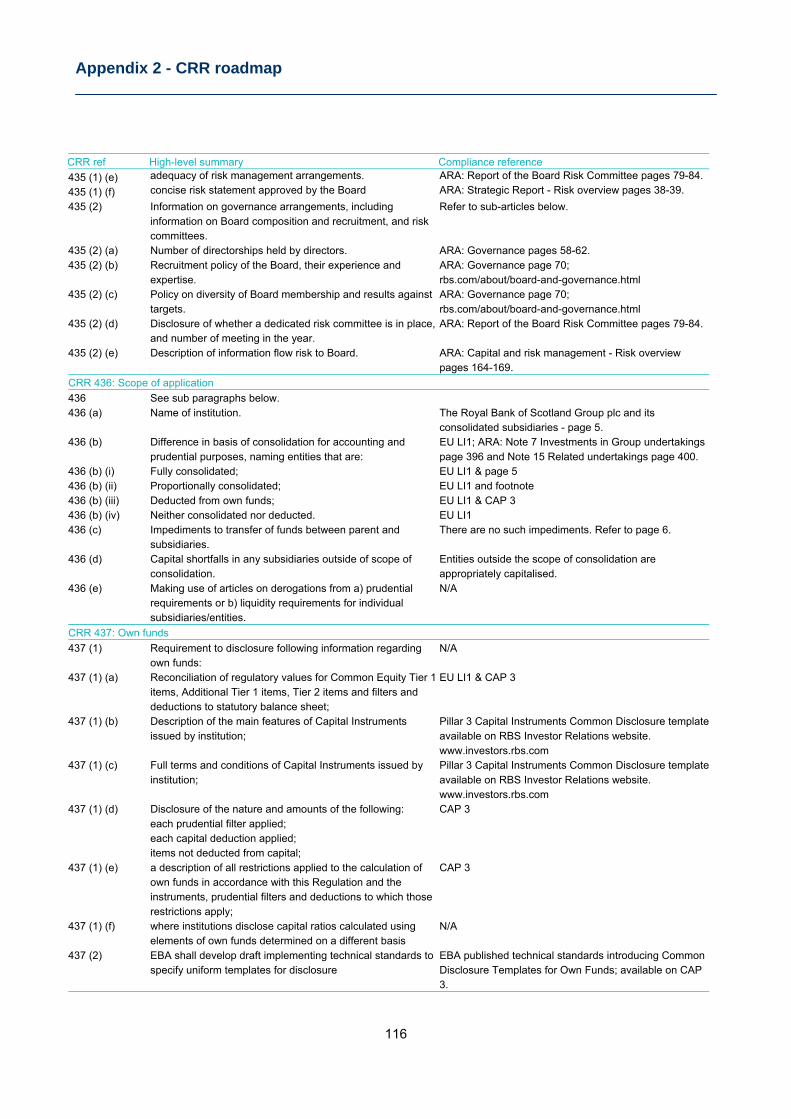
Appendix 2 - CRR roadmap
116
CRR ref High-level summary Compliance reference
435 (1) (e) adequacy of risk management arrangements. ARA: Report of the Board Risk Committee pages 79-84.
435 (1) (f) concise risk statement approved by the Board ARA: Strategic Report - Risk overview pages 38-39.
435 (2) Information on governance arrangements, including information on Board composition and recruitment, and risk committees.
Refer to sub-articles below.
435 (2) (a) Number of directorships held by directors. ARA: Governance pages 58-62. 435 (2) (b) Recruitment policy of the Board, their experience and
expertise. ARA: Governance page 70; rbs.com/about/board-and-governance.html
435 (2) (c) Policy on diversity of Board membership and results against targets.
ARA: Governance page 70; rbs.com/about/board-and-governance.html
435 (2) (d) Disclosure of whether a dedicated risk committee is in place, and number of meeting in the year.
ARA: Report of the Board Risk Committee pages 79-84.
435 (2) (e) Description of information flow risk to Board. ARA: Capital and risk management - Risk overview pages 164-169.
CRR 436: Scope of application
436 See sub paragraphs below. 436 (a) Name of institution. The Royal Bank of Scotland Group plc and its
consolidated subsidiaries - page 5. 436 (b) Difference in basis of consolidation for accounting and
prudential purposes, naming entities that are: EU LI1; ARA: Note 7 Investments in Group undertakings page 396 and Note 15 Related undertakings page 400.
436 (b) (i) Fully consolidated; EU LI1 & page 5 436 (b) (ii) Proportionally consolidated; EU LI1 and footnote 436 (b) (iii) Deducted from own funds; EU LI1 & CAP 3 436 (b) (iv) Neither consolidated nor deducted. EU LI1 436 (c) Impediments to transfer of funds between parent and
subsidiaries. There are no such impediments. Refer to page 6.
436 (d) Capital shortfalls in any subsidiaries outside of scope of consolidation.
Entities outside the scope of consolidation are appropriately capitalised.
436 (e) Making use of articles on derogations from a) prudential requirements or b) liquidity requirements for individual subsidiaries/entities.
N/A
CRR 437: Own funds
437 (1) Requirement to disclosure following information regarding own funds:
N/A
437 (1) (a) Reconciliation of regulatory values for Common Equity Tier 1 items, Additional Tier 1 items, Tier 2 items and filters and deductions to statutory balance sheet;
EU LI1 & CAP 3
437 (1) (b) Description of the main features of Capital Instruments issued by institution;
Pillar 3 Capital Instruments Common Disclosure template available on RBS Investor Relations website. www.investors.rbs.com
437 (1) (c) Full terms and conditions of Capital Instruments issued by institution;
Pillar 3 Capital Instruments Common Disclosure template available on RBS Investor Relations website. www.investors.rbs.com
437 (1) (d) Disclosure of the nature and amounts of the following: CAP 3 each prudential filter applied; each capital deduction applied; items not deducted from capital; 437 (1) (e) a description of all restrictions applied to the calculation of
own funds in accordance with this Regulation and the instruments, prudential filters and deductions to which those restrictions apply;
CAP 3
437 (1) (f) where institutions disclose capital ratios calculated using elements of own funds determined on a different basis
N/A
437 (2) EBA shall develop draft implementing technical standards to specify uniform templates for disclosure
EBA published technical standards introducing Common Disclosure Templates for Own Funds; available on CAP 3.
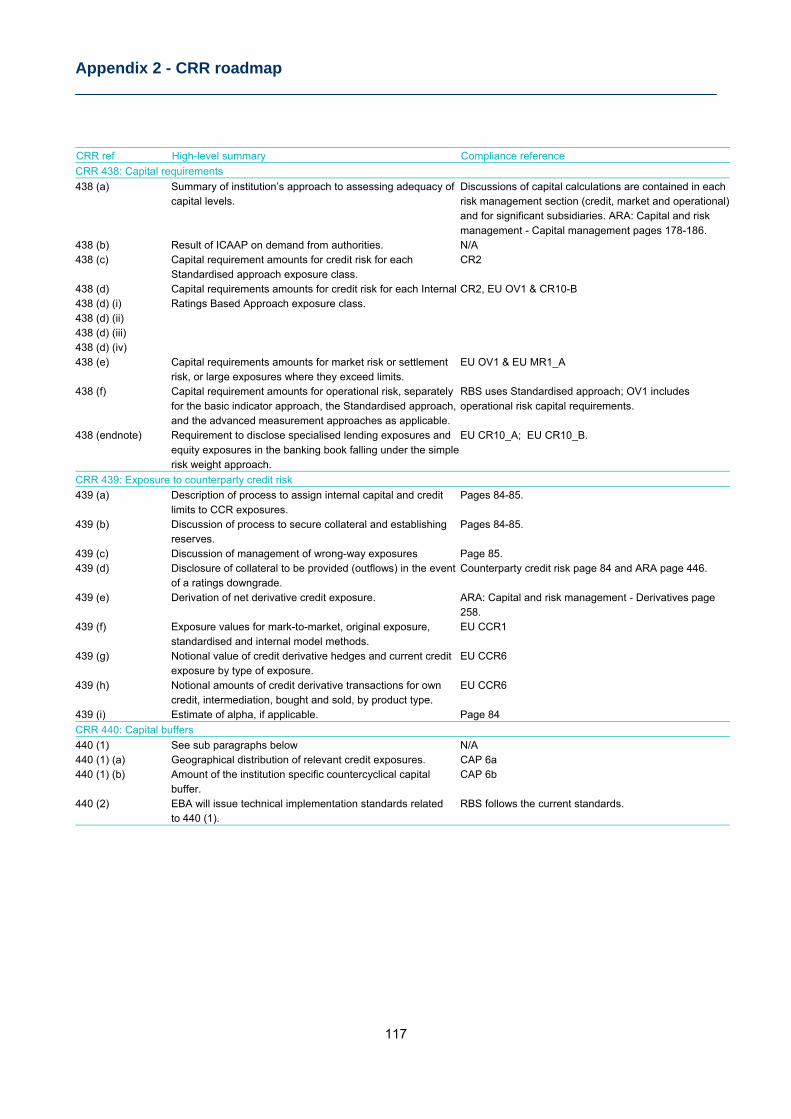
Appendix 2 - CRR roadmap
117
CRR ref High-level summary Compliance reference
CRR 438: Capital requirements
438 (a) Summary of institution’s approach to assessing adequacy of capital levels.
Discussions of capital calculations are contained in each risk management section (credit, market and operational) and for significant subsidiaries. ARA: Capital and risk management - Capital management pages 178-186.
438 (b) Result of ICAAP on demand from authorities. N/A 438 (c) Capital requirement amounts for credit risk for each
Standardised approach exposure class. CR2
438 (d) Capital requirements amounts for credit risk for each Internal Ratings Based Approach exposure class.
CR2, EU OV1 & CR10-B 438 (d) (i) 438 (d) (ii) 438 (d) (iii) 438 (d) (iv) 438 (e) Capital requirements amounts for market risk or settlement
risk, or large exposures where they exceed limits. EU OV1 & EU MR1_A
438 (f) Capital requirement amounts for operational risk, separately for the basic indicator approach, the Standardised approach, and the advanced measurement approaches as applicable.
RBS uses Standardised approach; OV1 includes operational risk capital requirements.
438 (endnote) Requirement to disclose specialised lending exposures and equity exposures in the banking book falling under the simple risk weight approach.
EU CR10_A; EU CR10_B.
CRR 439: Exposure to counterparty credit risk
439 (a) Description of process to assign internal capital and credit limits to CCR exposures.
Pages 84-85.
439 (b) Discussion of process to secure collateral and establishing reserves.
Pages 84-85.
439 (c) Discussion of management of wrong-way exposures Page 85. 439 (d) Disclosure of collateral to be provided (outflows) in the event
of a ratings downgrade. Counterparty credit risk page 84 and ARA page 446.
439 (e) Derivation of net derivative credit exposure. ARA: Capital and risk management - Derivatives page 258.
439 (f) Exposure values for mark-to-market, original exposure, standardised and internal model methods.
EU CCR1
439 (g) Notional value of credit derivative hedges and current credit exposure by type of exposure.
EU CCR6
439 (h) Notional amounts of credit derivative transactions for own credit, intermediation, bought and sold, by product type.
EU CCR6
439 (i) Estimate of alpha, if applicable. Page 84
CRR 440: Capital buffers
440 (1) See sub paragraphs below N/A 440 (1) (a) Geographical distribution of relevant credit exposures. CAP 6a 440 (1) (b) Amount of the institution specific countercyclical capital
buffer. CAP 6b
440 (2) EBA will issue technical implementation standards related to 440 (1).
RBS follows the current standards.
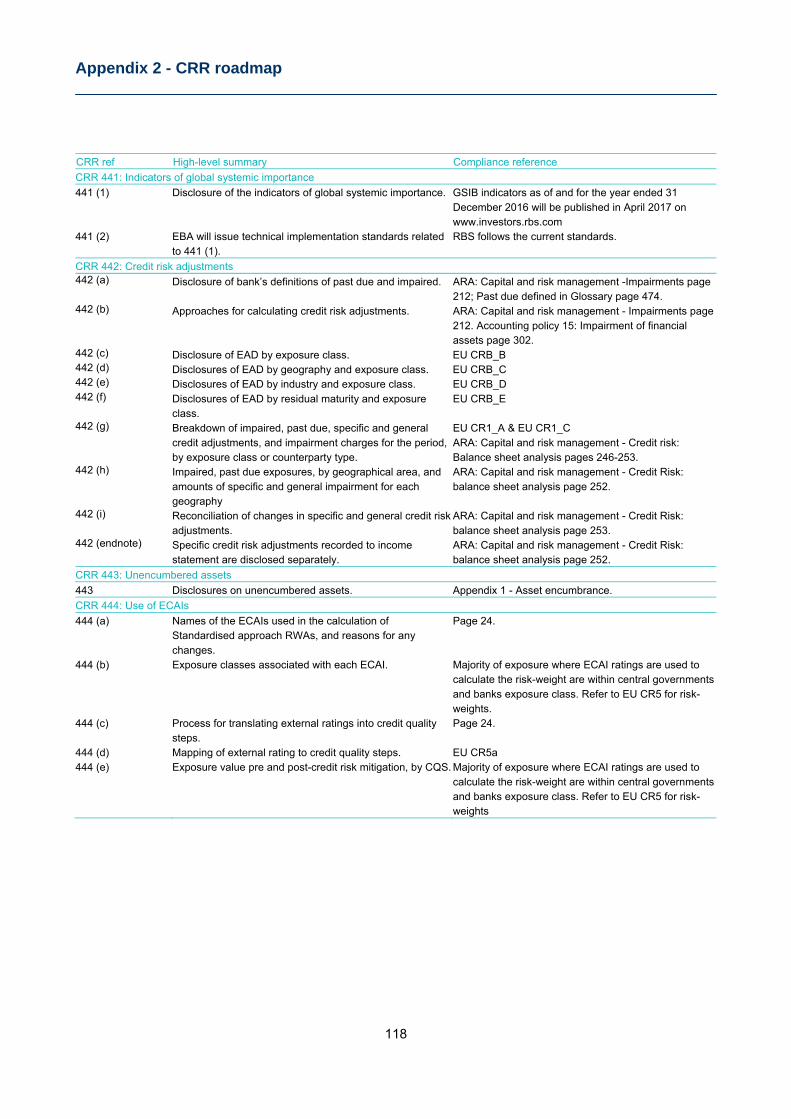
Appendix 2 - CRR roadmap
118
CRR ref High-level summary Compliance reference
CRR 441: Indicators of global systemic importance
441 (1) Disclosure of the indicators of global systemic importance. GSIB indicators as of and for the year ended 31 December 2016 will be published in April 2017 on www.investors.rbs.com
441 (2) EBA will issue technical implementation standards related to 441 (1).
RBS follows the current standards.
CRR 442: Credit risk adjustments 442 (a) Disclosure of bank’s definitions of past due and impaired. ARA: Capital and risk management -Impairments page
212; Past due defined in Glossary page 474. 442 (b) Approaches for calculating credit risk adjustments. ARA: Capital and risk management - Impairments page
212. Accounting policy 15: Impairment of financial assets page 302.
442 (c) Disclosure of EAD by exposure class. EU CRB_B 442 (d) Disclosures of EAD by geography and exposure class. EU CRB_C 442 (e) Disclosures of EAD by industry and exposure class. EU CRB_D 442 (f) Disclosures of EAD by residual maturity and exposure
class. EU CRB_E
442 (g) Breakdown of impaired, past due, specific and general credit adjustments, and impairment charges for the period, by exposure class or counterparty type.
EU CR1_A & EU CR1_C ARA: Capital and risk management - Credit risk: Balance sheet analysis pages 246-253.
442 (h) Impaired, past due exposures, by geographical area, and amounts of specific and general impairment for each geography
ARA: Capital and risk management - Credit Risk: balance sheet analysis page 252.
442 (i) Reconciliation of changes in specific and general credit risk adjustments.
ARA: Capital and risk management - Credit Risk: balance sheet analysis page 253.
442 (endnote) Specific credit risk adjustments recorded to income statement are disclosed separately.
ARA: Capital and risk management - Credit Risk: balance sheet analysis page 252.
CRR 443: Unencumbered assets
443 Disclosures on unencumbered assets. Appendix 1 - Asset encumbrance.
CRR 444: Use of ECAIs
444 (a) Names of the ECAIs used in the calculation of Standardised approach RWAs, and reasons for any changes.
Page 24.
444 (b) Exposure classes associated with each ECAI. Majority of exposure where ECAI ratings are used to calculate the risk-weight are within central governments and banks exposure class. Refer to EU CR5 for risk-weights.
444 (c) Process for translating external ratings into credit quality steps.
Page 24.
444 (d) Mapping of external rating to credit quality steps. EU CR5a 444 (e) Exposure value pre and post-credit risk mitigation, by CQS. Majority of exposure where ECAI ratings are used to
calculate the risk-weight are within central governments and banks exposure class. Refer to EU CR5 for risk-weights
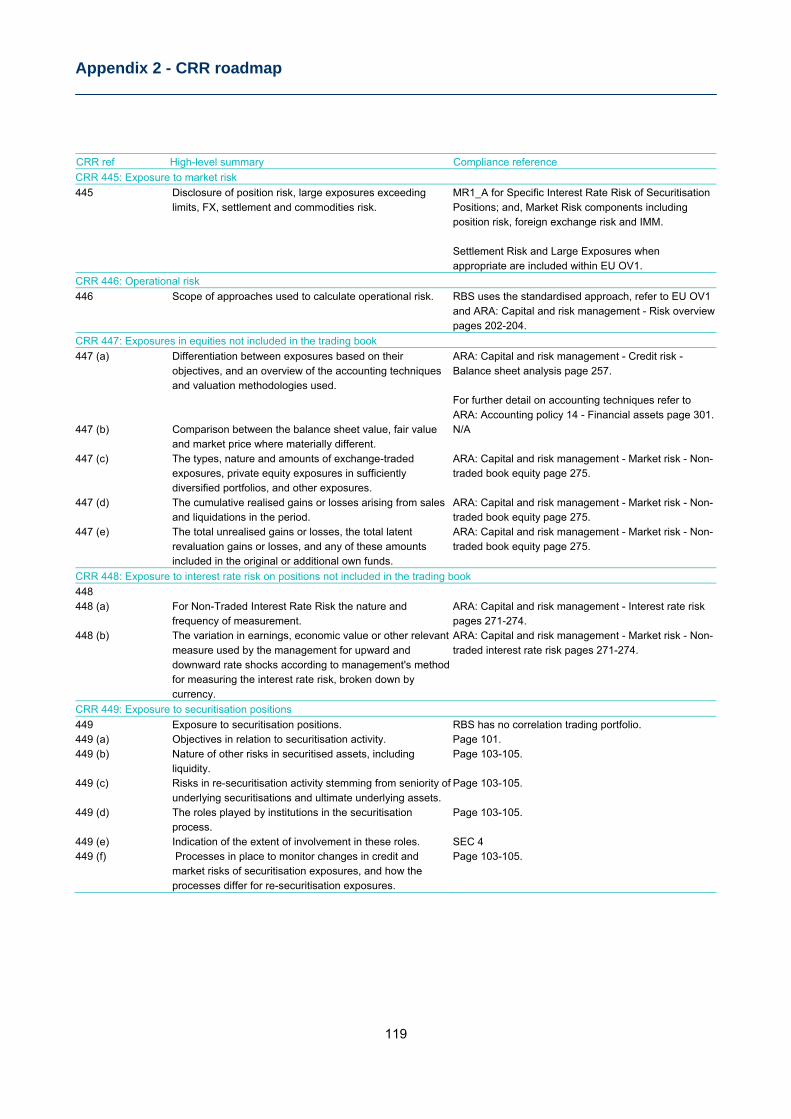
Appendix 2 - CRR roadmap
119
CRR ref High-level summary Compliance reference
CRR 445: Exposure to market risk
445 Disclosure of position risk, large exposures exceeding limits, FX, settlement and commodities risk.
MR1_A for Specific Interest Rate Risk of Securitisation Positions; and, Market Risk components including position risk, foreign exchange risk and IMM. Settlement Risk and Large Exposures when appropriate are included within EU OV1.
CRR 446: Operational risk
446 Scope of approaches used to calculate operational risk. RBS uses the standardised approach, refer to EU OV1 and ARA: Capital and risk management - Risk overview pages 202-204.
CRR 447: Exposures in equities not included in the trading book
447 (a) Differentiation between exposures based on their objectives, and an overview of the accounting techniques and valuation methodologies used.
ARA: Capital and risk management - Credit risk - Balance sheet analysis page 257. For further detail on accounting techniques refer to ARA: Accounting policy 14 - Financial assets page 301.
447 (b) Comparison between the balance sheet value, fair value and market price where materially different.
N/A
447 (c) The types, nature and amounts of exchange-traded exposures, private equity exposures in sufficiently diversified portfolios, and other exposures.
ARA: Capital and risk management - Market risk - Non-traded book equity page 275.
447 (d) The cumulative realised gains or losses arising from sales and liquidations in the period.
ARA: Capital and risk management - Market risk - Non-traded book equity page 275.
447 (e) The total unrealised gains or losses, the total latent revaluation gains or losses, and any of these amounts included in the original or additional own funds.
ARA: Capital and risk management - Market risk - Non-traded book equity page 275.
CRR 448: Exposure to interest rate risk on positions not included in the trading book
448 448 (a) For Non-Traded Interest Rate Risk the nature and
frequency of measurement. ARA: Capital and risk management - Interest rate risk pages 271-274.
448 (b) The variation in earnings, economic value or other relevant measure used by the management for upward and downward rate shocks according to management's method for measuring the interest rate risk, broken down by currency.
ARA: Capital and risk management - Market risk - Non-traded interest rate risk pages 271-274.
CRR 449: Exposure to securitisation positions
449 Exposure to securitisation positions. RBS has no correlation trading portfolio. 449 (a) Objectives in relation to securitisation activity. Page 101. 449 (b) Nature of other risks in securitised assets, including
liquidity. Page 103-105.
449 (c) Risks in re-securitisation activity stemming from seniority of underlying securitisations and ultimate underlying assets.
Page 103-105.
449 (d) The roles played by institutions in the securitisation process.
Page 103-105.
449 (e) Indication of the extent of involvement in these roles. SEC 4 449 (f) Processes in place to monitor changes in credit and
market risks of securitisation exposures, and how the processes differ for re-securitisation exposures.
Page 103-105.
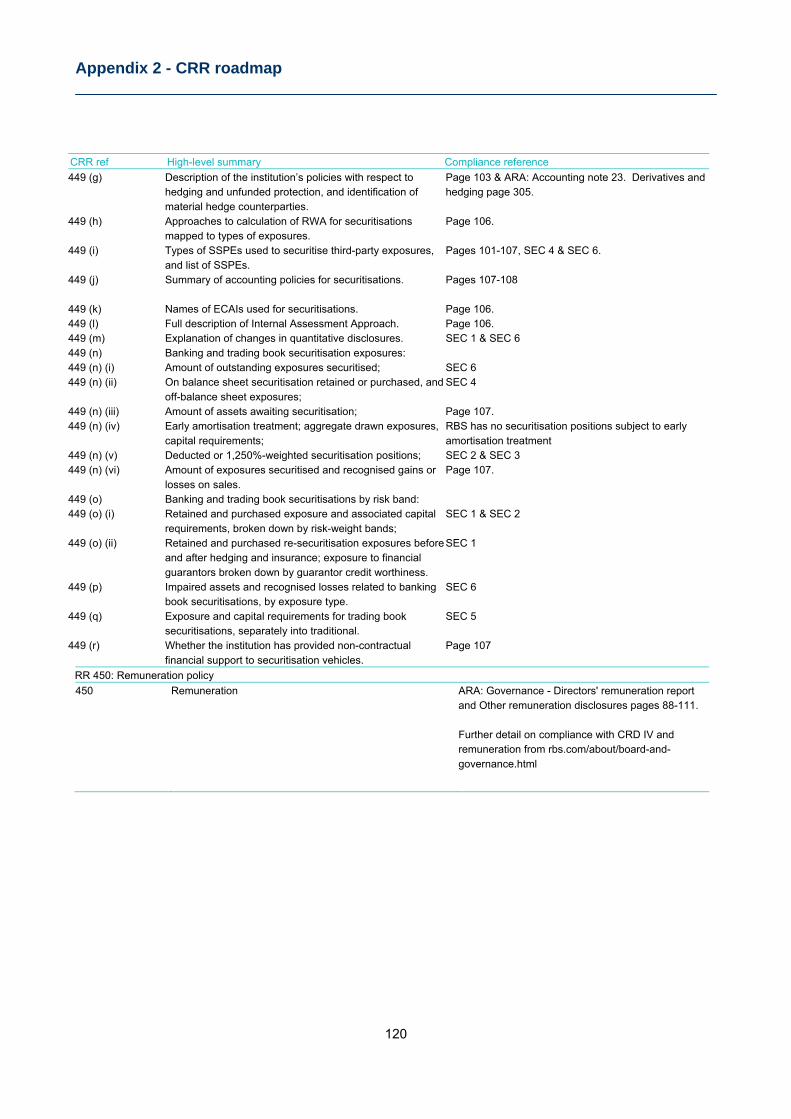
Appendix 2 - CRR roadmap
120
CRR ref High-level summary Compliance reference
449 (g) Description of the institution’s policies with respect to hedging and unfunded protection, and identification of material hedge counterparties.
Page 103 & ARA: Accounting note 23. Derivatives and hedging page 305.
449 (h) Approaches to calculation of RWA for securitisations mapped to types of exposures.
Page 106.
449 (i) Types of SSPEs used to securitise third-party exposures, and list of SSPEs.
Pages 101-107, SEC 4 & SEC 6.
449 (j) Summary of accounting policies for securitisations.
Pages 107-108
449 (k) Names of ECAIs used for securitisations. Page 106. 449 (l) Full description of Internal Assessment Approach. Page 106. 449 (m) Explanation of changes in quantitative disclosures. SEC 1 & SEC 6 449 (n) Banking and trading book securitisation exposures: 449 (n) (i) Amount of outstanding exposures securitised; SEC 6 449 (n) (ii) On balance sheet securitisation retained or purchased, and
off-balance sheet exposures; SEC 4
449 (n) (iii) Amount of assets awaiting securitisation; Page 107. 449 (n) (iv) Early amortisation treatment; aggregate drawn exposures,
capital requirements; RBS has no securitisation positions subject to early amortisation treatment
449 (n) (v) Deducted or 1,250%-weighted securitisation positions; SEC 2 & SEC 3 449 (n) (vi) Amount of exposures securitised and recognised gains or
losses on sales. Page 107.
449 (o) Banking and trading book securitisations by risk band: 449 (o) (i) Retained and purchased exposure and associated capital
requirements, broken down by risk-weight bands; SEC 1 & SEC 2
449 (o) (ii) Retained and purchased re-securitisation exposures before and after hedging and insurance; exposure to financial guarantors broken down by guarantor credit worthiness.
SEC 1
449 (p) Impaired assets and recognised losses related to banking book securitisations, by exposure type.
SEC 6
449 (q) Exposure and capital requirements for trading book securitisations, separately into traditional.
SEC 5
449 (r) Whether the institution has provided non-contractual financial support to securitisation vehicles.
Page 107
RR 450: Remuneration policy
450 Remuneration ARA: Governance - Directors' remuneration report and Other remuneration disclosures pages 88-111. Further detail on compliance with CRD IV and remuneration from rbs.com/about/board-and-governance.html
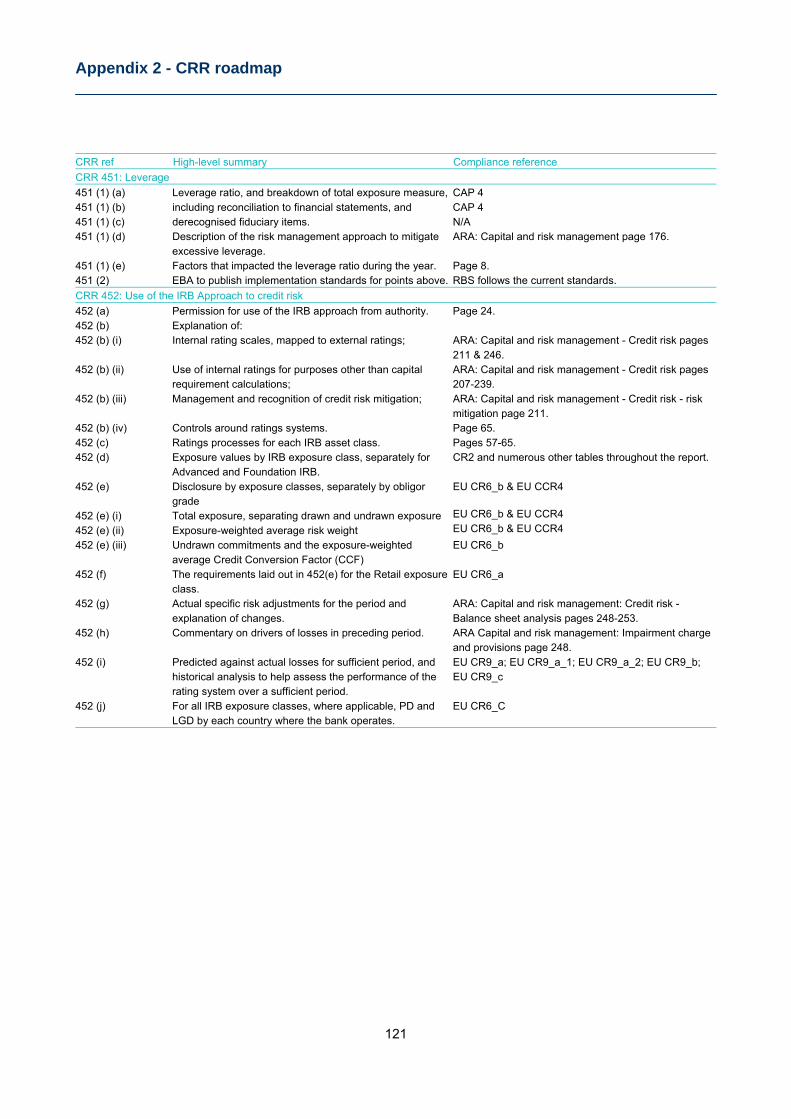
Appendix 2 - CRR roadmap
121
CRR ref High-level summary Compliance reference
CRR 451: Leverage
451 (1) (a) Leverage ratio, and breakdown of total exposure measure, CAP 4 451 (1) (b) including reconciliation to financial statements, and CAP 4 451 (1) (c) derecognised fiduciary items. N/A 451 (1) (d) Description of the risk management approach to mitigate
excessive leverage. ARA: Capital and risk management page 176.
451 (1) (e) Factors that impacted the leverage ratio during the year. Page 8. 451 (2) EBA to publish implementation standards for points above. RBS follows the current standards.
CRR 452: Use of the IRB Approach to credit risk
452 (a) Permission for use of the IRB approach from authority. Page 24. 452 (b) Explanation of: 452 (b) (i) Internal rating scales, mapped to external ratings; ARA: Capital and risk management - Credit risk pages
211 & 246. 452 (b) (ii) Use of internal ratings for purposes other than capital
requirement calculations; ARA: Capital and risk management - Credit risk pages 207-239.
452 (b) (iii) Management and recognition of credit risk mitigation; ARA: Capital and risk management - Credit risk - risk mitigation page 211.
452 (b) (iv) Controls around ratings systems. Page 65. 452 (c) Ratings processes for each IRB asset class. Pages 57-65. 452 (d) Exposure values by IRB exposure class, separately for
Advanced and Foundation IRB. CR2 and numerous other tables throughout the report.
452 (e) Disclosure by exposure classes, separately by obligor grade
EU CR6_b & EU CCR4
452 (e) (i) Total exposure, separating drawn and undrawn exposure EU CR6_b & EU CCR4 452 (e) (ii) Exposure-weighted average risk weight EU CR6_b & EU CCR4 452 (e) (iii) Undrawn commitments and the exposure-weighted
average Credit Conversion Factor (CCF) EU CR6_b
452 (f) The requirements laid out in 452(e) for the Retail exposure class.
EU CR6_a
452 (g) Actual specific risk adjustments for the period and explanation of changes.
ARA: Capital and risk management: Credit risk - Balance sheet analysis pages 248-253.
452 (h) Commentary on drivers of losses in preceding period. ARA Capital and risk management: Impairment charge and provisions page 248.
452 (i) Predicted against actual losses for sufficient period, and historical analysis to help assess the performance of the rating system over a sufficient period.
EU CR9_a; EU CR9_a_1; EU CR9_a_2; EU CR9_b; EU CR9_c
452 (j) For all IRB exposure classes, where applicable, PD and LGD by each country where the bank operates.
EU CR6_C
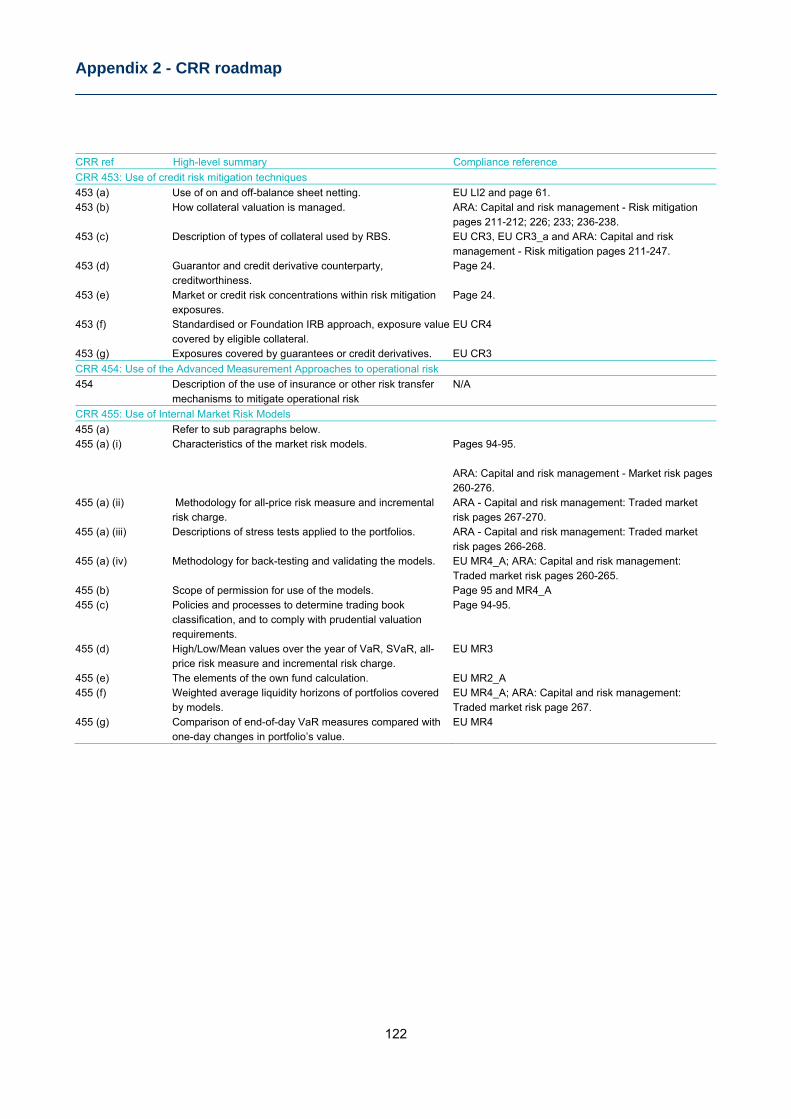
Appendix 2 - CRR roadmap
122
CRR ref High-level summary Compliance reference
CRR 453: Use of credit risk mitigation techniques
453 (a) Use of on and off-balance sheet netting. EU LI2 and page 61. 453 (b) How collateral valuation is managed. ARA: Capital and risk management - Risk mitigation
pages 211-212; 226; 233; 236-238. 453 (c) Description of types of collateral used by RBS. EU CR3, EU CR3_a and ARA: Capital and risk
management - Risk mitigation pages 211-247. 453 (d) Guarantor and credit derivative counterparty,
creditworthiness. Page 24.
453 (e) Market or credit risk concentrations within risk mitigation exposures.
Page 24.
453 (f) Standardised or Foundation IRB approach, exposure value covered by eligible collateral.
EU CR4
453 (g) Exposures covered by guarantees or credit derivatives. EU CR3
CRR 454: Use of the Advanced Measurement Approaches to operational risk
454 Description of the use of insurance or other risk transfer mechanisms to mitigate operational risk
N/A
CRR 455: Use of Internal Market Risk Models
455 (a) Refer to sub paragraphs below. 455 (a) (i) Characteristics of the market risk models. Pages 94-95.
ARA: Capital and risk management - Market risk pages 260-276.
455 (a) (ii) Methodology for all-price risk measure and incremental risk charge.
ARA - Capital and risk management: Traded market risk pages 267-270.
455 (a) (iii) Descriptions of stress tests applied to the portfolios. ARA - Capital and risk management: Traded market risk pages 266-268.
455 (a) (iv) Methodology for back-testing and validating the models. EU MR4_A; ARA: Capital and risk management: Traded market risk pages 260-265.
455 (b) Scope of permission for use of the models. Page 95 and MR4_A 455 (c) Policies and processes to determine trading book
classification, and to comply with prudential valuation requirements.
Page 94-95.
455 (d) High/Low/Mean values over the year of VaR, SVaR, all-price risk measure and incremental risk charge.
EU MR3 455 (e) The elements of the own fund calculation. EU MR2_A 455 (f) Weighted average liquidity horizons of portfolios covered
by models. EU MR4_A; ARA: Capital and risk management: Traded market risk page 267.
455 (g) Comparison of end-of-day VaR measures compared with one-day changes in portfolio’s value.
EU MR4
Key terms and glossary
123
Acronyms ABCP Asset-backed commercial paper AIRB Advanced internal ratings based AT1 Additional Tier 1 ARA Annual Report and Accounts AQ Asset quality BBA British Bankers’ Association CCF Credit conversion factor CCP Central counterparty CDOR Canadian Dollar Offered Rate CET1 Common Equity Tier 1 COREP CRR Common Reporting CQS Credit quality steps CRD Capital Requirements Directive CRM Credit risk mitigation CRR Capital Requirements Regulation CVA Credit valuation adjustment EAD Exposure at default EBA European Banking Authority ECAI External Credit Assessment Institution EEPE Effective expected positive exposure EL Expected loss EPE Expected positive exposure EU European Union EURIBOR Euro Interbank Offered Rate FI Financial institution GSIB Global Systemically Important Bank IAA Internal assessment approach ICAAP Internal capital adequacy assessment process IFRS International Financial Reporting Standard IMA Internal model approach IMM Internal model method IRB Internal ratings based IRC Incremental risk charge LGD Loss given default LIBOR London Interbank Offered Rate
.
MCR Minimum capital requirements MRM Model risk management MTM Mark-to-market NTIRR Non-traded interest rate risk NWB Plc National Westminster Bank Plc OTC Over-the-counter PBB Personal & Business Banking PD Probability of default PFE Potential future exposure PRA Prudential Regulation Authority QCCP Qualifying central counterparty RAR Risk asset ratio RBA Ratings based approach RBS The Royal Bank of Scotland Group plc and its
subsidiaries RBS plc The Royal Bank of Scotland plc RBSSI RBS Securities Inc. RCR RBS Capital Resolution RNIV Risks not in VaR RoI Republic of Ireland RoW Rest of the World RPF Revised Pillar 3 framework RWAs Risk-weighted assets S&P Standard & Poor’s SCRA Specific credit risk adjustments SFTs Securities financing transactions SME Small and medium-sized enterprise SSPE Securitisation special purpose entity STD Standardised SVaR Stressed value-at-risk T2 Tier 2 TAGS Thames Asset Global Securitization TMT Telecommunications, media, technology UBI DAC Ulster Bank Ireland Designated Activity Company VaR Value-at-risk
Key terms and glossary
124
Key terms Also refer to pages 505 to 511 of the 2016 ARA. Additional Tier 1 Capital - a level of regulatory capital as defined within EU under CRD IV, typically non-cumulative perpetual capital instruments and related share premium. AT1 instruments include a write-down or conversion feature, usually based on a trigger event if Common Equity Tier 1 falls below a certain level.
Alpha - in the context of regulatory capital for counterparty credit risk, under the internal model method, alpha is a multiplier applied to the effective expected positive exposure (EPE) to determine the exposure at default. Alpha may be set using an own estimate with a floor of 1.2. It accounts for the extra capital needed for derivatives, compared to loans with the same EPE, to reflect the additional risks.
Asset-backed commercial paper (ABCP) - a form of asset-backed security generally issued by a commercial paper conduit.
Asset quality (AQ) band - probability of default banding for all counterparties on a scale of 1 to 10.
Back-testing - statistical techniques that assess the performance of a model, and how that model would have performed had it been applied in the past. Basel II - the capital adequacy framework issued by the Basel Committee on Banking Supervision in June 2006 in the form of the ‘International Convergence of Capital Measurement and Capital Standards’.
Basel III - in December 2010, the Basel Committee on Banking Supervision issued final rules: ‘Basel III: A global regulatory framework for more resilient banks and banking systems’ and ‘Basel III: International framework for liquidity risk measurement, standards and monitoring’.
Central counterparty (CCP) default fund - a mechanism that allows the sharing (mutualisation) of losses among the central counterparty’s clearing members. It is used where the losses incurred by the CCP following the default of a clearing member are greater than the margins and default fund contributions provided by that clearing member and any other defence the CCP may use before recurring to the default fund contributions of the remaining clearing members. In view of this, the risk of loss associated with exposures from default fund contributions is higher than that associated with trade exposures. Therefore, this type of exposures should be subject to a higher own funds requirement.
Commercial paper conduit - a structured entity that issues commercial paper and uses the proceeds to purchase or fund a pool of assets. The commercial paper is secured on the assets and is redeemed either by further commercial paper issuance, repayment of assets or liquidity drawings.
Common Equity Tier 1 capital - the highest quality form of regulatory capital under Basel III comprising common shares issued and related share premium, retained earnings and other reserves excluding the cash flow hedging reserve, less specified regulatory adjustments. Counterparty credit risk - the risk that a counterparty defaults before the maturity of a derivative or sale and repurchase contract. In contrast to non-counterparty credit risk, the exposure to counterparty credit risk varies by reference to a market factor (e.g. interest rate, exchange rate, asset price).
CRD IV - the European Union has implemented the Basel III capital proposals through the Capital Requirements Regulation and the Capital Requirements Directive (CRD), collectively known as CRD IV. CRD IV was implemented on 1 January 2014. The European Banking Authority’s technical standards are still to be finalised through adoption by the European Commission and implemented within the UK.
Credit conversion factor (CCF) - the CCF is an estimate of the proportion of undrawn commitments that will be drawn at the point of default. It is used in determining EAD and reflects the assumption that drawn balance at default might be greater than the current balance.
Credit default swap - a contract where the protection seller receives premium or interest-related payments in return for contracting to make payments to the protection buyer upon a defined credit event in relation to a reference financial asset or portfolio of financial assets. Credit events usually include bankruptcy, payment default and rating downgrades.
Credit grade - a rating that represents an assessment of the creditworthiness of a customer. It is a point on a scale representing the probability of default of a customer.
Credit quality step (CQS) - a grade on the PRA credit quality assessment scale based on the credit ratings of external credit assessment institutions. It is used to assign risk weights under the standardised approach to credit risk.
Credit risk - the risk of financial loss due to the failure of a customer, or counterparty, to meet its obligation to settle outstanding amounts.
Credit risk mitigation (CRM) - reducing the credit risk of an exposure by application of techniques such as netting, collateral, guarantees and credit derivatives.
Credit spread - the yield spread between securities with the same currency and maturity structure but with different associated credit risks, with the yield spread rising as the credit rating worsens. It is the premium over the benchmark or risk-free rate required by the market to take on a lower credit quality. Credit valuation adjustment capital charge - The purpose of this charge is to improve the resilience of banks to potential mark-to-market losses associated with deterioration in the creditworthiness of counterparties in non-cleared derivative trades. Under CRR rules, the charge is calculated using either the advanced approach or the standardised approach.
Key terms and glossary
125
Key terms Defaulted assets (AQ10) - Assets with a PD of 100%.
Effective expected positive exposure (effective EPE) - a measure used to determine EAD for OTC derivatives under the internal model method. It is calculated as the weighted average of non-decreasing expected positive exposures. The weight of each exposure is calculated as a percentage of total expected exposure over the relevant period. When calculating the minimum capital requirement, the average is taken over the first year. Expected loss (EL, a regulatory measure) - is the product of the regulatory credit exposure, the probability of default over the next 12 months, averaged through an economic cycle, and the downturn loss given default. It is applied to exposures whether performance is recognised in income or reserves. Credit exposures include all financial assets, customer facilities and are subject to regulatory overlays. Exposure - a claim, contingent claim or position which carries a risk of financial loss.
Exposure at default (EAD) - an estimate of the extent to which the bank will be exposed under a specific facility, in the event of the default of a counterparty.
EAD pre CRM/EAD post CRM - Credit risk mitigation (CRM) is defined as the use of collateral or guarantees to reduce potential loss if a customer fails to settle all or part of its obligations to RBS. The application of CRM depends on the approach (STD or IRB) governing capital calculation related to a credit exposure. (Refer to Table EU CR3_A for details of how different risk mitigants are incorporated into IRB risk parameters.)
EAD figures may be either pre or post CRM, and are labelled accordingly.
Non-counterparty credit risk EAD pre CRM: STD approach - EAD before legally enforceable netting,
collateral and guarantees. IRB approach - EAD before legally enforceable netting only.
Non-counterparty credit risk EAD post CRM: STD approach - EAD after legally enforceable netting,
collateral and guarantees. IRB approach - EAD after legally enforceable netting only.
Counterparty credit risk EAD post CRM for derivatives and securities financing transactions, under both the STD and IRB approaches, is EAD after legally enforceable netting and collateral.
Exposure class - exposures are assigned to classes defined under CRR, namely article 147 for the advanced IRB approach and article 112 for the standardised approach. This classification is required by the regulatory framework when calculating the capital requirements of banks.
Exposure-weighted average LGD (for each AQ band) - Calculated by multiplying the EAD of each position by the associated LGD, giving an LGD-weighted EAD value for each position. LGD-weighted EADs for each position are added together for the whole AQ band, and the final sum is divided by the total EAD for the AQ band to arrive at an exposure-weighted average LGD for each AQ band.
Exposure-weighted average PD (for each AQ band) - Calculated by multiplying the EAD of each position by the associated PD, giving a PD-weighted EAD for each position. PD-weighted EADs for each position are added together for the whole AQ band, and the final sum is divided by the total PD for the AQ band to arrive at an exposure-weighted average PD for each AQ band.
Fair value - the amount for which an asset could be exchanged or a liability settled, between knowledgeable and willing parties in an arm’s length transaction. Geographical region - The numbers are reported by country of operation of the obligor, except exposures to governments and individuals which are shown by country of residence. The country of operation is the country where the main operating assets of a legal entity are held, or where its main cash flows are generated, taking account of the entity’s dependency on subsidiaries' activities. Rest of the World (RoW) includes exposures to supranationals and ocean-going vessels Guarantees - an agreement by a third party to cover the potential loss to RBS should a specified counterparty default on its commitments.
Haircut - a downward adjustment to collateral value to reflect its nature and any currency or maturity mismatches between the collateral and the exposure it secures.
Income-producing real estate - comprises real estate exposures that meet the following CRR criteria for specialised lending exposures: (i) the exposure is to an entity that was created specifically to finance and/or operate physical assets; (ii) the contractual arrangements give the lender a substantial degree of control over the assets and the income that they generate; and (iii) the primary source of repayment of the obligation is the income generated by the assets being financed, rather than the independent capacity of a broader commercial enterprise. It therefore constitutes a sub-set of RBS’s overall exposure to commercial real estate. Incremental risk charge (IRC) - the IRC model quantifies the impact of rating migration and default events on the market value of instruments with embedded credit risk (in particular, bonds and credit default swaps) that are held in the trading book. It further captures basis risk between different instruments, maturities and reference entities.
Key terms and glossary
126
Key terms Interest rate risk - the adverse impact on the value or interest income of a financial asset arising from changes in interest rates.
Internal Capital Adequacy Assessment Process (ICAAP) - RBS’s own assessment, as part of CRR requirements, of its risks, how it intends to mitigate those risks and how much current and future capital is necessary having considered other mitigating factors.
Internal model method (IMM) - in the context of counterparty credit risk, the IMM is the most risk-sensitive and sophisticated approach to calculating EAD out of the three methods available under CRR. Under the IMM firms may use their internal model which should be aligned to the firm’s internal risk management practices. EAD is calculated as the product of alpha and EPE.
Internal ratings based approach (IRB) - a method of estimating the amount of credit risk taken by a bank. Under IRB a bank may use internal estimates to generate risk components for use in the calculation of its credit risk regulatory capital requirements. There are two approaches: foundation and advanced (including retail).
Latent loss provisions - loan impairment provisions held against impairments in the performing loan portfolio that have been incurred as a result of events occurring before the balance sheet date but which have not been identified as impaired at the balance sheet date. Loss given default (LGD) - an estimate of the amount that will not be recovered by RBS in the event of default, plus the cost of debt collection activities and the delay in cash recovery.
Margin period of risk - The time period from the last exchange of collateral covering a netting set of transactions with a defaulting counterparty until that counterparty is closed out and the resulting market risk is re-hedged.
Market risk - the risk of loss arising from fluctuations in interest rates, credit spreads, foreign currency rates, equity prices, commodity prices and other risk-related factors such as market volatilities that may lead to a reduction in earnings, economic value or both.
Mark-to-market (mtm) - the adjustment in the value of an asset or liability to reflect any change in market prices.
Mark-to-market method - in the context of counterparty credit risk, the mtm method is the simplest of three methods used to determine exposure values. The exposure value is calculated as the mtm value plus the potential future exposure (PFE) value, where the PFE is a percentage of the notional value of the contract. The percentage to be applied varies by product and maturity.
Minimum capital requirements - the minimum amount of regulatory capital that a financial institution must hold to meet the Pillar 1 requirements for credit, market and operational risk.
Monoline insurers (monolines) - entities that specialise in providing credit protection against the notional and interest cash flows due to the holders of debt instruments in the event of default. This protection is typically in the form of derivatives such as credit default swaps.
Netting - the process by which the value of assets taken from a given counterparty is offset by the value of assets given to the same counterparty, thereby reducing the exposure of one party to the other to the difference between the two.
Non-trading book - positions, exposures, assets and liabilities that are not in the trading book. It is also referred to as “banking book”.
Operational risk - the risk of loss resulting from inadequate or failed processes, people, systems or from external events.
Over-the-counter derivatives - derivatives with tailored terms and conditions negotiated bilaterally, in contrast to exchange traded derivatives which have standardised terms and conditions.
Pillar 1 - the part of CRD IV that sets out the process by which regulatory capital requirements should be calculated for credit, market and operational risk.
Pillar 2 - Pillar 2 is intended to ensure that firms have adequate capital to support all the relevant risks in their business and is divided into capital held against risks not captured or not fully captured by the Pillar 1 regulations (Pillar 2A) and risks to which a firm may become exposed over a forward-looking planning horizon (Pillar 2B). Capital held under Pillar 2A, in addition to the Pillar 1 requirements, is the minimum level of regulatory capital a bank should maintain at all times to cover adequately the risks to which it is or might be exposed, and to comply with the overall financial adequacy rules. Pillar 2B is a capital buffer which helps to ensure that a bank can continue to meet minimum requirements during a stressed period, and is determined by the PRA evaluating the risks to which the firm may become exposed (e.g. due to changes to the economic environment) during the supervisory review and evaluation process. All firms will be subject to a PRA buffer assessment and the PRA will set a PRA buffer only if it judges that the CRD IV buffers are inadequate for a particular firm given its vulnerability in a stress scenario, or where the PRA has identified risk management and governance failings, which the CRD IV buffers are not intended to address. Pillar 3 - the part of CRD IV that sets out the information banks must disclose about their risks, the amount of capital required to absorb them, and their approach to risk management. The aim is to strengthen market discipline.
Point-in-time - an assessment of PD or a rating system based on a view of a counterparty's current rather than future financial situation given economic conditions. This differs from a through-the-cycle approach, which considers performance over the duration of an economic cycle.
Key terms and glossary
127
Key terms Position risk requirement - a capital requirement applied to a position treated under Part Three, Title 1, Chapter 3 (Market risk) as part of the calculation of the market risk capital requirement.
Probability of default (PD) - the likelihood that a customer will fail to make full and timely repayment of credit obligations over a one year time horizon.
Prudential Regulation Authority (PRA) - the statutory body responsible, from 1 April 2013, for the prudential supervision of banks, building societies, insurers and a small number of significant investment firms in the UK. The PRA is a subsidiary of the Bank of England.
Repo - refer to sale and repurchase agreements.
Re-securitisations - securitisations in which the underlying pools of assets are themselves bonds issued by securitisation SSPEs.
Residential mortgage-backed securities - asset-backed securities for which the underlying asset portfolios are residential mortgages.
Residual maturity - the remaining time in years that a borrower is permitted to take to fully discharge their contractual obligation (principal, interest and fees) under the terms of a loan agreement. Exposures are classified using maturity bands in line with contractual maturity.
Reverse repurchase agreement (reverse repo) - refer to sale and repurchase agreements. Risk-weighted assets (RWAs) - assets adjusted for their associated risks using weightings established in accordance with the Basel Capital Accord as implemented by the PRA. Certain assets are not weighted but deducted from capital. Risks not in VaR (RNIVs) - the RNIV framework is used to identify and quantify market risks that are inadequately captured by the internal VaR and SVaR models. RWA density - RWAs as a percentage of EAD post CRM. Sale and repurchase agreements - in a sale and repurchase agreement one party, the seller, sells a financial asset to another party, the buyer, at the same time the seller agrees to reacquire and the buyer to resell the asset at a later date. From the seller's perspective such agreements are repurchase agreements (repos) and from the buyer's reverse repurchase agreements (reverse repos).
Securitisation - a process by which assets or cash flows are transformed into transferable securities. The underlying assets or cash flows are transferred by the originator or an intermediary, typically an investment bank, to a structured entity which issues securities to investors. Asset securitisations involve issuing debt securities (asset-backed securities) that are backed by the cash flows of income generating assets (ranging from credit card receivables to residential mortgage loans).
Securitisation position - refers to any exposures RBS may have to a securitisation. These include not only the securities issued by an SSPE, but also loans, liquidity facilities and derivatives transacted with an SSPE.
Securitisation special purpose entity (SSPE) - an entity that has been designed such that voting or similar rights are not the dominant factor in deciding who controls the entity, for example when any voting rights relate to administrative tasks only and the relevant activities are directed by means of contractual arrangements. SSPEs are usually established for a specific limited purpose, they do not carry out a business or trade and typically have no employees. They take a variety of legal forms - trusts, partnerships and companies - and fulfil many different functions.
Securitised exposure - an asset, or a pool of assets, that has been securitised, either via a traditional securitisation or a synthetic securitisation. See traditional securitisation and synthetic securitisation below.
Standard industrial classification - a classification of businesses by type or economic activity. It is applied by international government agencies to provide a framework for the collection, tabulation, presentation and analysis of data related to industry sectors, and its use promotes uniformity.
Standardised (STD) approach - a method used to calculate credit risk capital requirements under Pillar 1 of Basel III. In this approach the risk-weights used in the capital calculation are determined by regulators. For operational risk, capital requirements are determined by multiplying three years’ historical gross income by a percentage determined by the regulator. The percentage ranges from 12% to 18%, depending on the type of underlying business being considered.
Stress testing - a technique used to evaluate the potential effects on an institution’s financial condition of an exceptional but plausible event and/or movement in a set of financial variables. Stressed value-at-risk (SVaR) - a VaR measure using historical data from a one year period of stressed market conditions. For the purposes of calculating regulatory stressed VaR, a time horizon of ten trading days is assumed at a confidence level of 99% (Refer to VaR definition below).
Supervisory slotting approach - a method of calculating regulatory capital, specifically for lending exposures in project finance and income producing real estate, where the PD estimates do not meet the minimum internal ratings based standards. Under this approach, the bank classifies exposures from 1 to 5, where 1 is strong and 5 is default. Specific risk-weights are assigned to each classification.
Synthetic securitisation - a securitisation process in which the originator retains ownership of the underlying exposure(s), but transfers the associated credit risk to another entity through the use of guarantees or credit derivatives.
Through the cycle – PD models that reflect a long run average view of default levels. Also refer to point-in-time.

Key terms and glossary
128
Key terms Tier 1 capital - a component of regulatory capital, comprising Common Equity Tier 1 and Additional Tier 1.
Tier 1 capital ratio - Tier 1 capital as a percentage of risk-weighted assets.
Tier 2 capital - qualifying subordinated debt and other Tier 2 securities in issue, eligible collective impairment allowances less certain regulatory deductions.
Trading book - a trading book consists of positions in financial instruments and commodities held either with the intent to trade, or in order to hedge other elements of the trading book. To be eligible for trading book capital treatment, financial instruments must either be free of any restrictive covenants on their tradability, or able to be hedged.
Traditional securitisation - securitisation in which the originator transfers ownership of the underlying exposure(s) to an SSPE, putting the asset(s) beyond the reach of the originator and its creditors.
Undrawn commitments - assets/liabilities that have been committed but not yet transacted. In terms of credit risk, these are obligations to make loans or other payments in the future.
Undrawn weighted average credit conversion factor (for each AQ band) - Calculated by multiplying the undrawn commitment of each position by the associated CCF, giving a CCF-weighted undrawn for each position. CCF-weighted undrawns for each position are added together for the whole AQ band and the final sum is divided by the total CCFs for the AQ band to arrive at an exposure weighted average CCF for each AQ band.
Western Europe excluding the UK - Andorra, Austria, Belgium, Denmark, Finland, France, Germany, Greece, Iceland, Ireland, Italy, Liechtenstein, Luxembourg, Malta, Monaco, the Netherlands, Norway, Portugal, San Marino, Spain, Sweden, Switzerland and the Vatican City State (Holy See).
Wrong-way risk - the risk of loss when the risk factors driving the exposure to a counterparty or customer are positively correlated with the creditworthiness of that counterparty i.e. the size of the exposure increases at the same time as the risk of the counterparty or customer being unable to meet that obligation, increases.
Value-at-risk (VaR) - a technique that produces estimates of the potential loss in the market value of a portfolio over a specified time period at a given confidence level.