Embed Size (px)
Citation preview

V
PIKE-TEST OF [NSFWMENYS f0 GAMER
DEMOGRAP’HEC DATA
Thus-h {1” fits mum of M. A.
MICHEGAN STAKE UNIVERSITY
Meredith Johnson Mead
1.965

TH5515
LIBRARY
Michigan State
University

letter:
Of a la
naires
The pu]
COVer J
relatec
ness of
able re

ABSTRACT
PRE-TEST OF INSTRUMENTS TO GATHER
DEMOGRAPHIC DATA
by Meredith Johnson Mead
The pre-test of a four page questionnaire and cover
letters was conducted during July and August of 1964 as part
of a larger study designed to pre—test several question—
naires for a future study of undergraduate student marriage.
The purposes of the pre-test were to discover factors in the
cover letters, questionnaires and sample that appeared to be
related to reSponse rate and to investigate the effective-
ness of the questionnaire items in obtaining valid and reli-
able reSponses.
A purposive, non-random sample of 156, 1958—1959
Alumni of Michigan State University whose addreSses were
listed as being in the Lansing-East Lansing, Michigan area
was selected. These names were distributed into four cate—
gories according to sex and whether or not the person had
received a Bachelors degree from Michigan State University
during the 1958-1959 academic year. Sixty names were placed
in each of the degree received categories, but only 23 names
were available for the no degree received female category

-va
-\‘-a
.p_
.
Lme.,
and 13 J
non-code
rations
Iure we]
cover l<
to the 1
stamped
of resp(
aPpeal t
Upl. 1
tion abc
naire ar
Were sel
geUEIal
to the (J
naire-
intespo
weekend.
h a G1
in wa ’

Meredith Johnson Mead
and 13 for the no degree received male category.
Two formats of the questionnaire, a pre-coded and a
non-coded form, and three cover letters using different salu-
tations, types of appeal and methods of affixing the signa—
ture were developed. The resulting six combinations of
cover letters and questionnaire forms were randomly assigned
to the names in each degree—sex category.
The cover letters, questionnaires and self—addressed
stamped envelopes were mailed on July 6, 1964 and a record
of reSponses compiled. Two letters with the same type of
appeal but with different salutations were used for Follow—
up 1. The cover letter for Follow-up 2 gave more informa-
tion about the study and was enclosed with another question-
naire and envelope.
A sample of 21 respondents and 19 non—reSpondents
were selected for interviews. These were designed to elicit
reSponses concerning reasons for response or non-reSponse,
general evaluation of the questionnaire, and verbal reSponses
to the questions that had appeared on the mailed question-
naire.
A total response of 78% was recorded. An increase
in response rate occurred after each mailing and after each
weekend. The largest percent return occurred during Wave 1,
with a decrease in reSponse during Wave II and an increase
in Wave III.
The results of the response rate over three waves of

it:
reSpons
Sponse
of the
rate di
the deg
differe
of affi
categor
only th
letter
haVe 6X.
The lim
salutat
0f salu
The typ
related
infOrma.
SpondEn
Tive 6f;
of aHOtI
‘L _
the Inc
$1
1
' a
:ten

Meredith Johnson Mead
reSponse and of total reSponse seemed to indicate that re-
Sponse rate is not related to the degree status or the sex
of the sample members. However, differences in reSponse
rate did appear when response was analyzed in relation to
the degree—sex categories.
Rate of response did not appear to be related to the
different questionnaire formats nor to the different methods
of affixing the signature to the letter.
The different letter salutation and letter appeal
categories in Wave I received small reSponse differences but
only the letter receiving the highest percent return and the
letter receiving the lowest percent return are considered to
have exhibited differences in the solicitation of response.
The limited findings concerning the relation of the letter
salutation to reSponse rate seems to indicate that the type
of salutation used was not a factor in influencing reSponse.
The type of appeal in the cover letter did not appear to be
related to reSponse rate except when the appeal gave more
information about the study and about who the desired re-
Spondents were. However, other factors such as the cumula-
tive effect of repeated appeals to respond and the enclosure
of another questionnaire may have been factors influencing
the increase in reSponse that occurred with this follow-up.
The check of questionnaire reliability and validity
that was conducted seemed to indicate that the questionnaire
items were consistently eliciting the information desired.

PRE-TEST OF INSTRUMENTS TO GATHER
DEMOGRAPHIC DATA
BY
Meredith Johnson Mead
A THESIS
Submitted to
Michigan State University
in partial fulfillment of the requirements
for the degree of
MASTER OF ARTS
Department of Home Management and Child Development
1965

in 1
exp]
encc
for
conc
Thes
stud
tion
fact
to i
ity
the

ACKNOWLEDGMENTS
Appreciation is expressed to Dr. William Marshall
and to Dr. Frances Magrabi for their guidance and direction
in planning and conducting the study. Appreciation is also
expressed to Dr. Twyla Shear for her helpful suggestions and
encouragement. Gratitude is expressed to my husband, Jon,
for his patience, helpfulness, and constant encouragement.
*‘k'kv'c7k
This study was conducted as part of a larger study
concerned with the pre—testing of two mailed questionniares.
These questionnaires will eventually be used to conduct a
study of undergraduate student marriage. One of the ques—
tionnaires, Schedule A, was pre-tested to determine which
factors in the cover letter, questionnaire and sample appear
to influence reSponse rate and to check questionnaire valid-
ity and reliability. This study was partially supported by
the Michigan State University Agricultural Experiment Station.
‘kv‘r‘kvkir
ii

ACKVOIIL
LIST OF
LIST OF
LIST OF
Chapter
I .
II.
III,
IV.
BIBLI

TABLE OF CONTENTS
ACKNOWLEDGMENTS
LIST OF
LIST OF
LIST OF
Chapter
I.
II.
III.
IV.
TABLES
GRAPHS
APPENDICES
INTRODUCTION
Purpose of the Study
Definition of Terms
Assumptions
Hypotheses
REVIEW OF THE LITERATURE
METHODOLOGY
Instruments
Sample . . . . . .
Collection of Data
RESULTS
Mailed Questionnaire
Interview Results . . .
Limitations of the Study
CONCLUSIONS AND IMPLICATIONS
ReSponse Rate
Interview
Summary
BIBLIOGRAPHY
APPENDICES
iii
Page
ii
iv
vi
vii
HO\
Ulbww
17
17
20
22
27
27
44
48
51
51
56
57
59
62

Table
10.
LIST OF TABLES
Assignment of Letter and Questionnaire
Form Combinations to the Degree—Sex
Categories
ReSpondents to Questionnaire in Degree-
Sex Categories Over Three Waves of
ReSponse
Cumulative Number and Percent of
Respondents in Degree—Sex Categories
Over Three Waves of ReSponse . . .
Number and Percent of ReSpondents in
Degree—Sex Categories According to the
Number of Questionnaires Mailed Before
Each ReSponse Wave . . . . . .
Percent of Total Respondents for Each
Degree-Sex Category ReSponding in One
of Three Waves of ReSponse . . . .
ReSpondents to Questionnaire in Degree
Status Categories Over Three Waves of
ReSponse . . . . . . . . . . . .
Number and Percent of ReSpondents in
Degree Status Categories According to
Number of Questionnaires Mailed Before
Each Response Wave . . . . . . . .
ReSpondents to Questionnaire in Sex
Categories Over Three Waves of
Response
Percent of Total ReSpondents in Each Sex
Category Responding in Each of Three
Waves of ReSponse . . . . . . .
ReSpondents in Questionnaire Format
Categories Over Three Waves of
Response . . . . . . . . . . . . . .
iv
Page
23
3O
31
33
34
35
36
37
39
4O

Table
11.
12.
13.
1-4.

Table
11.
12.
13.
14.
Respondents to Questionnaire in Letter
Salutation and Letter Appeal Categories
for ReSponse Wave I . . . . . . . .
Respondents to Questionnaire in Letter
Salutation Categories in Wave II
Respondents to Questionnaire in
Signature Categories for ReSponse
Wave I
Success of Attempts to Contact People for
an Interview by Degree—Sex Categories of
ReSpondents and Non-ReSpondents
Page
41
42
43
44

LIST OF GRAPHS
Graph Page
1. Daily ReSponse Rate for Mailed
Questionnaire . . . . . . . . . . . . . . . 28
2. Daily Response Rate in Relation to Sex
of ReSpondent . . . . . . . . . . . . . . . 38
vi

Appendix
I. C
II. I
III,

LIST OF APPENDICES
Appendix Page
I. QUESTIONNAIRES . . . . . . . . . . . . . . . 63
Questionnaire 1 . . . . . . . . . . . . 64
Questionnaire 2 . . . . . . . . . . . . 68
II. LETTERS . . . . . . . . . . . . . . . . . . 72
Cover Letter 1 . . . . . . . . . . . . . 73
Cover Letter 2 . . . . . . . . . . . . . 74
Cover Letter 3 . . . . . . . . . . . . . 75
Follow-Up 1, Letter 1 . . . . . . . . . 76
Follow—Up 1, Letter 2 . . . . . . . . . 77
Follow-Up 2 Letter . . . . . . . . . . . 78
III. INTERVIEW SCHEDULE . . . . . . . . . . . . . 79
vii

were p:
cernin;
validi‘
The fi]
decisi.
ment a:
Which .
ity am
mailed
bias I

CHAPTER I
INTRODUCTION
A four page questionnaire and several cover letters
were pre-tested so that information could be gathered con—
cerning factors which appear to influence response and the
validity and reliability of the answers to the questions.
The findings of the pre-test will provide a basis upon which
decisions concerning questionnaire and cover letter develop-
ment and revision can be made in relation to those factors
which appear to influence reSponse and questionnaire valid-
ity and reliability.
One of the problems connected with the use of the
mailed questionnaire as a method of data collection is the
bias that can result due to the non—reSponding portion of
the sample. Since there is no assurance that those who do
reSpond are representative of the entire sample, it is impor—
tant that the non—responding portion be small enough so that
the generalizations drawn from a study will not be seriously
biased. Through the process of pre-testing, using the pro-
posed instruments and a sample similar to that to be used in
the final study, those factors which may influence reSponse
rate can be identified. Adjustments can then be made in the

i3.
data cc
rate.
respon;
pIOVIGI
Sponse
is tha‘
desire;
ity of
Spondex
in5trur
IESpon:
gathere
diVergg
from t1
t0 res]
COnduC.
d98r6e
Who 18]
whOSe E
Alumni
aIEa .

data collection device in an effort to increase reSponse
rate. An investigation of the characteristics of the non—
reSpondents and their stated reasons for non—reSponse can
provide information and suggestions for ways in which re-
Sponse rate may be increased.
Another problem in the use of mailed questionnaires
is that of accurately obtaining the kind of information
desired. Information can be gathered to evaluate the clar-
ity of the questions through personal interviews with re—
Spondents and non—reSpondents. The reliability of the
instrument can be checked by comparing the verbal and written
reSponses of the reSpondents and some information can be
gathered from the non—reSpondents to see if they are widely
divergent from or seem to have characteristics different
from the respondents, which might have influenced them not
to reSpond.
The pre—test of Schedule A and the cover letters was
conducted during July and August, 1964. It used a sample of
degree and non-degree alumni of Michigan State University
who left the school during the 1958—1959 academic year, and
whose addresses as listed in the Michigan State University
Alumni Office were in the Lansing—East Lansing, Michigan,
area .

tionna
StUd)’ Wt

Purpose of the Study
The two main purposes for the pre—test of the ques-
tionnaire and cover letters were:
1. to discover factors in the cover letters, ques—
tionnaire and sample that are related to non-
reSponse or to the reSponse rate.
2. to investigate the effectiveness of the question—
naire items in obtaining valid and reliable an—
SWEI‘S .
Definitions of Terms
The definitions of terms as operationalized in this
study were:
1. mailed questionnaire — a set of questions sent
to a person by way of first class mail.
2. format of questionnaire - the general physical
appearance of the questionnaire. In this study
the format was varied to include coding numbers
and answer blanks in the right hand margin of
half of the questionnaires and answer blanks in
front of some questions and no data-coding num-
bers on the remaining half of the questionnaires.
3. cover letter - a letter enclosed with the ques-
tionnaire which serves as an introduction to the
study and an appeal to reSpond.

Two
follow-up letter — a letter sent to those whotunme
not reSponded urging them to do so. A copy of
the questionnaire may or may not be enclosed
with this letter.
rate of reSponse or response rate - usually indi-
cated by the number or percent of completed ques—
tionnaires returned to the investigator in rela-
tion to a Specific factor such as degree or non-
degree alumni status.
wave of response or reSponse wave - a division
of the total responses into three categories
according to when they were received by the in—
vestigator and whether the reSponse appeared to
be due to the first mailing, the first follow—up
letter, or the second follow-up letter with
enclosed questionnaire.
reSpondent - one who returned, by mail, a com—
pleted or filled-in questionnaire.
non-respondent - one who did not return, by mail,
a completed questionnaire.
Assumptions
assumptions underlying this study were:
the rate of response may, to some extent, depend
upon factors within the control of the investiga—
tor.

tors r

the effectiveness of the questionnaire in elicit-
ing accurate answers may, to some extent, depend
upon factors within the control of the investiga-
tor.
Hypotheses
The hypotheses investigated in relation
tors related to reSponse rate were that:
l. the rate of reSponse is not
sex status.
the rate of reSponse is not
non—degree alumni status.
the rate of response is not
the rate of response is not
mat of the questionnaire.
the rate of reSponse is not
related
related
related
related
related
tation used in the cover letter.
the rate of reSponse is not related
of appeal made in the cover letter.
the rate of response is not related
of method used in signing the cover
to the fac—
to degree~
to degree or
to sex.
to the for-
to the salu—
to the type
to the type
letter.

CHAPTER II
REVIEW OF THE LITERATURE
Data collection through the use of mailed question-
naires usually must take into consideration that segment of
the population who do not return the questionnaire. Various
factors such as the sponsorship of the questionnaire; the
attractiveness of the questionnaire format; the length of
the questionnaire; the nature of the accompanying letter
requesting c00peration; the ease of filling out the question—
naire and mailing it back; the inducements offered to reply;
and the nature of the people to whom the questionnaire is
sent1 are thought to influence the percent of returns. Even
though returns are likely to be increased by employing those
factors which seem to influence reSponse, there is usually a
non—reSponding portion of the population. This non-respond—
ing portion of the population creates some sample bias which
if large enough and if influential upon the significant
areas of the study, may bias the results of the study. Dif—
ferent populations seem to vary as to what factors influence
response and in the type and degree of bias introduced by
the non-respondents. Therefore, it is important to make
1Claire Selltiz et a1., Research Methods in Social
Relations (New York: Holt, Rinehart and Winston, Inc., 1963),
p. 241.


every attempt to increase reSponses and if possible, to dis~
cover some characteristics of the non-reSponding portion of
the population so that some information as to the kind and
direction of the bias might be acquired.
The literature concerning factors which influence
reSponse and techniques for maximizing returns as well as
comparisons of characteristics which differentiate between
early and late reSpondents, and between reSpondents and non~
reSpondents shows varied and sometimes conflicting results.
. 2
From the results of their study Edgerton et a1.
concluded that
intensive and vigorous follow-up is a basic tenet
in mail questionnaire research. Otherwise, the
tendency will be to obtain replies from those who
have a Special interest in the subject under
study, or who exhibit some characteristic or char—
acteristics different from the non—reSpondents or
from the casual or indifferent reSpondents.
He found that in a mailed—questionnaire study of all male
contestants in the First Annual Science Talent Search, the
"winner” contestants made an almost perfect return of the
questionnaire for each of three successive years. The
"honorable mention“ contestants made the next highest per~
cent return while the ”others“ or ”also ran” contestants
had the lowest percent of return. Thus, he concluded that
"interest in the subject under investigation or ties to the
2Norman Edgerton, Harold A. Britt, Stewart Henderson,
and Ralph Norman, "Objective Differences Among Various Types
of ReSpondents to a Mailed Questionnaire,” American Sociolog—
ical Review, XII (October 1947), 435—444.
LEIUIHS
iigs 1n
IETC at
ariginal
usual re
IEPTESBU

questionnaire Sponsor are related to high percentage of
returns on the part of the reSpondents.”
Stanton3 came to the same conclusion when the find—
ings in his study indicated that the results of a follow~up
were at variance with the findings based on replies to the
original mailing. This, he concluded, ”suggests that the
usual reSponding portion of the mail Survey sample is not
representative of the non-returning group.”
In a study which was concerned with factors which
influenced questionnaire returns from former university Stu-
dents, Pace4 reported that the comparisons between total
returns and non—returns indicated that
graduation from the university and number of
quarters of university work completed were both
important factors influencing returns; but fac—
tors of sex, age, and year of entrance to the
university were relatively unimportant.
After making comparisons among the early returns, the late
returns and the non—reSponding portion of the sample, he
concluded that the following factors appeared to operate to
produce a higher selection among questionnaire respondents
than was true among the original sample Selected for Study;
for both men and women, employment at the professional levels,
jobs in the same field as university Specialization, and job
3Frank Stanton, ”Notes on the Validity of Mail Ques—
tionnaire Returns,” Journal of Applied Psychology, XXIII
(June 1939), 95-104.
4Robert C. Pace, ”Factors Influencing Questionnaire
Returns From Former University Students,” Journal of Applied
ESychology, XXIII (June 1939), 388-397.

:ural sta
showed n:
directior
:ertain n
It was re
returned
fliers an
were more
and that
If the tc
SOUS fOr
reaSOIIab:

satisfaction; for men, economic status; and for women, cul—
tural status. Factors of income and general adjustment
showed neither Significant differences nor a consistent
direction of differences.
In a study which investigated whether readers of a
certain magazine traveled by regular commercial air lines,
it was reported that when the second wave of reSponSes were
returned that the first wave had over-rated the number of
fliers among the readers. Rollins5 concluded that those who
were more interested in flying are likely to answer first
and that the second wave of reSponse provided a truer picture
of the total sample. In other reSpects, notably age and rea—
sons for choosing different airlines, the two waves showed
reasonably close similarities.
A study which involved 2,768 dues paying members of
the League of Women Voters reported a 77.3% return after two
Successive follow—up mailings and a personal telephone call.
The telephone call was designed to raise total reSponse
rate, to provide some information about the non—respondents,
and to ask questions concerning the extent of the person's
participation in the organization and reasons for non-
reSponse. Donald6 reported that an ”analysis of reSponse
5Malcolm Rollins, ”The Practical Use of Repeated
(Questionnaire Waves,” Journal of Applied Psyghology, XXIV
(1940), 770—772.
6Marjorie Donald, ”Implications of Non—ReSponse for
‘the Interpretation of Mail Questionnaire Data,” Public
()Ednion anrterly, XXIV (1960), 99-114.

accord
return
tionst
in the
report
The me
the nr
ROI {1
other
Other
IESpQ
tion
there
Spons
ulati
compa
Sales
did c
SaleE
thOué
SpOnc
grep}
\
Pfirf

10
according to the number of stimuli required to induce
returns of the questionnaire indicated a Significant rela-
tionship between reSponse elicitation and member involvement
in the organization.” Those who had not responded were
reported as having a tendency to criticize the questionnaire.
The main criticisms of the questionnaire which were given by
the non-reSpondents were that it was too long and complicated,
not really anonymous and too personal. Being too busy with
other reSponsibilities or Simply not wanting to answer were
other reasons given for non-response. The various waves of
response and the telephone reSponses were analyzed in rela-
tion to demographic characteristics. She reported that
there were “no clear demographic trends in the waves of re—
Sponse . . . and no Sharp changes in the nature of the pop-
ulation of telephone responses.”7
In a study reported by Kirchner and Mousley8 which
compared the job performance of respondent and non-reSpondent
salesmen to an attitude survey, it was found that respondents
did differ significantly from non—reSpondentS in terms of
sales points. They concluded that there are definite, al-
though not necessarily consistent differences between re-
Spondents and non-reSpondentS in terms of personality, demo-
graphic data and motivation.
7Marjorie Donald, op. cit.
8Wayne K. Kirchner and Nancy Mousley, ”A Note on Job
Performance: Differences Between ReSpondent and Non—ReSpon-
dent Salesmen to an Attitude Survey,” Journal of Applied
Psychology, XLVII (1963), 223—224.

Bar
in the sub_
without dei‘
represente:
late retur:
that demog
hat having
Su
were retur
With the t
resPondent
to a Child
used and t
nique dECr
Sc‘irflple3 an
Ithich the
rESPOHSe,
Ir

ll
Baur(9 attributed bias to the difference in interest
.in the subject of the questionnaire. He reported that those
Ivithout definite plans for education or training were under—
rwepresented in the early returns and over-represented in the
.late returns._ The results of his study seemed to indicate
tllat demographic characteristics, such as age and having or
IMDt having children did not Show a bias in time of reSponding.
Suchman and McCandless10 reported that questionnaires
vwere returned in a directly decreasing ratio to familiarity
vwith the topic under investigation and education of the
remapondent, in a study concerning listening or not listening
tc> a child training program broadcast. One follow-up was
'usexi and they reported that the use of the follow-up tech-
nixque decreased the bias in the answering portion of the
saanle, and permitted an inference as to the direction in
wtrich.the bias was operating plus increasing the total
re Sponse .
In a study which Showed an unusually high rate of
r€3t11rn,ll over 90%, the reasons for the high return were
reported as being that the subject of the questionnaire was
I
¥
9Jackson E. Baur, ”ReSponse Bias In a Mail Survey,"
FLblic Opinion Quarterly, IX (1947), 594-600.
10Edward A. Suchman and Boyd McCandless, ”Who Answers
(RENEStionnaires,” Journal of Applied Psychology, XXIV (1940)
758-769.
11Norman Tallent and William J. Reiss, ”A Note on an
'Urnasually High Rate of Returns for a Mail Questionnaire,”
Public Opinion Quarterly, XXIII (1959), 579-581.\

in an a
fessioh
with th
high re
was pri
dent an
return
Cluding
the
his
his
him
the
t0 '
res
pal'Ed p
resPond
of resp

12
in an area in which the sample members demonstrated much pro~
.fessional concern and that the sample members were identified
\Nith the Sponsoring agency. Other factors related to the
IIigh reSponse were reported as being the cover letter which
1Nas printed and addressed personally to the potential reSpon—
cient and the enclosure of a Self-addressed, postage-free
return envelope.
Ruess12 Summarizes the findings of a study by con-
cluding that
the intelligence of the questionnaire recipient,
his qualities of purposefulness and initiative,
his loyalty or the strength of his ties attaching
him to the institution or individual Sponsoring
the questionnaire, and a rural background seem
to be factors favorably influencing questionnaire
reSponse.
In a study of sophomore nursing students that com—
pwrred.personality characteristics of reSpondents and non-
l . .
rEHSpondentS 3 1t was demonstrated that personality factors
arwe a class of variables which operate to influence the act
Of? responding.
Slettol4 conducted a study in which questionnaire
téeclrniques were the subject of the investigation. His
¥
12Carl S. Ruess, ”Difference BetWeen Persons Respond-
ing and Not Responding to a Mailed Questionnaire, ” American
SOCiological Review, VIII (1943), 433- 438.
13Bernard Lubin, Eugene E. Levitt and Marvin Zucker—
Inari "Some Personality Differences Between Responders and Non-
Responders to a Survey Questionnaire, ” Journal of Consulting
WXXVI (1962), 192.
. l4Raymond Sletto, “Pretesting of Questionnaires,”
§EEE£gcan Sociological Review, V (April 1940), 193—200.

IBaS‘
to b1
therc
appea
Prepa:

l3
reason for this study was that "for most of the decisions
to be made in the construction and use of the questionnaire
there is no tested body of knowledge to guide the investiga—
tor in his choice.” One of the problems he explored was the
effect of the length of a questionnaire on the proportion of
returns. His results after testing a 10 and 25 page ques-
tionnaire with 300 former university students suggest that
the factor of questionnaire length is less important than it
has generally been assumed to be insofar as prOportion of
returns is concerned. A second problem investigated, using
the same sample, involved the influence of the nature of the
appeals employed upon returns. Three different letters were
prepared and each directed its appeal to different reasons
for reSponse. The letters received a 67%, 64% and 60% re-
Sponse and the letter receiving the highest percent return
was used in the final study. About this selection he reports,
the difference in the proportion of returns
yielded by the three letters are not large enough
to yield critical ratios that are statistically
significant according to conventional standards.
The superiority of the first letter in producing
returns was, nevertheless, consistently main-
tained throughout the time period of the returns.
Since pretesting of questionnaires will normally
involve small numbers of cases, we must expect
most ”true” differences to yield Small critical
ratios.
The third problem Sletto investigated using the same sample
group was whether postal cards would be as effective as
letters in producing returns in the first follow-up mailing.
He reported the number of returns to the postal card and the

It
it:
it
na
th
DE
C1
it
di
CO]
1‘6:
ta:
Sta
are
‘W-h O

14
letter as identical and thus concluded that postal cards
were as effective as letters in return of the questionnaire
in the first follow—up mailing.
In a study by Pace15 the practice of comparing the
early and late returns as a means of trying to discover the
nature and scope of bias was investigated. He notes that
this comparison assumes that the late returns are more
nearly like the non—returns than are the early returns.
Pace concludes that this method of comparison is not suffi—
ciently sensitive to indicate the extent of bias, but that
it does provide a Simple tool for determining the probable
direction of bias and could be used in judging the repre-
sentativeness of returns.
Baur16 pointed out the danger of the assumption
commonly made that the non-reSpondents are like the slowest
respondents. The results of his study Showed that the educa-
tional level of the non—respondents was most like that of the
tardiest reSpondent, but that other factors Such as marital
status was most like that of those who responded quickly.
Edgerton et al.17 reported that people who reply to
a questionnaire, at least without much subsequent urging,
are different from those who do not reply, and that those
who reply with urging differ from those who reply without
lsRobert 0. Pace, op. cit., XXIII, 391.
l()Jackson E. Baur, op. cit., IX, 600.
17Norman Edgerton et al., op. cit., XII, 436.

15
reminder, as well as from those who do not reply at all.
In a recent study18 in which 2,497 questionnaires
were mailed and which yielded a 48% return a 10% random sub-
sample of reSpondents and non-respondents were selected for
interviews. Of those selected for interview 137 had not
answered the questionnaire and 122 had responded. This
study investigated whether or not data collected by means
of the mailed questionnaire technique can be considered
representative of the universe of inquiry deSpite the lim-
itation of the partial returns. The principal finding con-
cerning methodology suggested that the data Showed no sta-
tistically Significant differences between the mailed ques-
tionnaire and the structured interview with respect to
identical questions. The results suggested that the mail
questionnaire may reveal representative responses in spite
of the partial return from the sample of the universe Select-
ed. There were no Significant differences between the re-
Sponses of the mailed questionnaire and those of the inter-
viewed reSpondents who had not answered the questionnaire.
Lundberg and Larsenlg in an attempt to find out the
amount of bias resulting from the hard—to-reach portion of
the population used an interview procedure. They reported
18Edward D. McDonagh and A. Leon Rosenblum, ”A Com-
parison of Mailed Questionnaire and Subsequent Structured In—
terviews,” Public Opinion Quarterly, XXIV (1964), 131-136.
19George A. Lundberg and Otto N. Larsen, ”Character-
istics of Hard—to—Reach Individuals in Field Surveys,” Public
Opinion Quarterly, XIII (1949), 487-494.

16
that the personal characteristics and responses of the hard-
to-reach were not markedly different from those of the main
group interviewed.
The findings of research concerning the mailed ques-
tionnaire as a methodological problem in itself or as a
method of data collection in survey research have indicated
that factors within the questionnaire, cover letters, mail-
ing methodology and characteristics of the sample members
seem to have an influence upon reSponse or non—response to
the questionnaire. The nature and extent of bias resulting
from non-reSponse has been studied by comparing characteris-
tics of reSpondentS, non-reSpondents, early respondents and
late reSpondentS. Some studies have reported that respon—
dents were found to have different characteristics than non-
reSpondents while other studies have reported that reSpon—
dents and non-reSpondents did not seem to differ in relation
to the characteristics studied. Some studies have reported
differences between early and late reSpondents, while others
have not. Further research is needed so that factors which
influence response can be delineated and so that the effects
of late responses or non-response upon the representativeness
of the sample and upon the findings of a study can be deter-
mined and perhaps minimized by invoking responses from the
hard-to-reach portion of the sample and increasing total
returns.
CHAPTER III
METHODOLOGY
Instruments
Questionnaires
Two forms of the four page questionnaire were devel-
oped. The questions on each form had the same wording and
occurred in the same sequence. The general physical appear—
ance of the questionnaire was varied by the inclusion of
data coding numbers and some of the answer blanks in the
right-hand column of Questionnaire l, the pre-coded form.
The data coding numbers were omitted on Questionnaire 2,
the non—coded form, and some of the answer blanks were on
the left hand side of the page in front of the question
(Appendix I, Questionnaire 1 and Questionnaire 2, p. 63).
The inclusion of data coding numbers would facilitate the
transfer of data from the questionnaire to punch cards;
Similarly the shifting of lines for the answers from the
left side preceding the question to the right hand side of
the page between the question and data coding numbers would
aid in the transfer of the data.
Letters
Three cover letters were written using different
salutations, types of appeal and methods of signing
17

18
(Appendix II, Cover Letter 1, Cover Letter 2 and Cover
Letter 3, p. 72).
Cover Letter 1 with the salutation Dear Fellow
Spartan, asked the person to provide information which would
help others in making an important decision. The signature
was mimeographed.
The salutation on Cover Letter 2 had the name of the
person typed in and the appeal was Slanted toward the help-
fulness of the Alumni to the University and a concern about
the influence of undergraduate marriage on the family. The
Signatures were hand written in ink.
Cover Letter 3 used the salutation Dear Alumnus, and
made an appeal to the alumni status of the person and his
ability to aid the university through participation in its
research. The signatures were hand written in ink.
The same method of affixing the Signatures was used
on Cover Letters 2 and 3 because of difficulties involved in
duplication processes.
Letter and Questionnaire Combinations
The two forms of the questionnaire and the three
cover letters were combined to form the following six
combinations.
1. Cover Letter 1 with Questionnaire l
2. Cover Letter 2 with Questionnaire l
3. Cover Letter 3 with Questionnaire l
4. Cover Letter 1 with Questionnaire 2

19
5. Cover Letter 2 with Questionnaire 2
6. Cover Letter 3 with Questionnaire 2.
Follow—Up Letters
The Follow—Up Letters 1 and 2 were designed to be a
brief reminder to the non-respondent about the questionnaire
and asked him to reSpond (Appendix II, Follow-Up 1, Letter 1
and Letter 2, p. 76). The salutation of Dear Fellow Spartan
was dropped from use, but Dear Alumnus and Dear (name typed
in) were retained. The type of salutation mailed to the non-
reSpondentS was the same as that mailed the first time except
for those non-reSpondents who had received Dear Fellow Spar-
tan letters. Half of the non-reSpondentS who had received
this salutation were mailed a letter with the Dear Alumnus
salutation and the other half were mailed a letter with the
Dear (name typed in) salutation. Although the bodies of the
two letters were slightly different, they were not considered
to have different types of appeal. Signatures were hand
written in ink on all letters mailed in Follow—Up l.
The Follow—Up 2 letters used the salutation Dear
(name typed in) and were mailed to all non-respondents (Ap—
pendix II, Follow—Up 2 Letter, p. 78). This letter made an
appeal to reSpond, gave further explanation of the study,
and gave information about the sample Selected and about who
the desired reSpondents were. Signatures were hand written
in ink and ”Thanks for Your Help“ was hand written with ink
at the bottom of each letter.

20
Interview Schedule
The interview schedule (Appendix III, p. 79) con-
tained the same questions as did the questionnaire, but the
questions were re—phrased, in some cases, for the oral in—
quiry. The same questions were included so that the verbal
reSponse could be compared with the written reSponse of those
who had reSponded and so that some information could be
gained from the non—reSpondents. Additional questions were
included with reSpect to why the person did or did not re-
Spond and whether or not certain factors such as format,
type of salutation, type of signature or type of appeal had
any Special significance in influencing them. Other appro-
priate questions were added by the interviewer to obtain
additional information or clarification if this Seemed
desirable.'
Sample
A list of 414 names and addresses of 1958-1959
Alumni of Michigan State University whose addresses were
listed as being in the Lansing or East Lansing area was
obtained from the Regional File in the Michigan State Univer-
sity Alumni Office. The names of Michigan State University
Faculty, as could be determined by use of the 1963—1964
Faculty Telephone Directory and those whose address was
listed as being in university operated housing were dropped
from the list. This selection was made in an effort to

21
reduce some sample bias which might result from the use of
an area close to the University and would thus make the sam-
ple somewhat more similar to that to be used in the future
study.
The names were then divided according to sex and
whether or not the person had received a Bachelors degree
from Michigan State University during the 1958-1959 academic
year. The names of those listed as withdrawn during the
1958-1959 academic year were considered as not having re-
ceived a Bachelors degree from Michigan State University dur—
ing that year. The split-plot design resulted in the follow-
ing four sample categories:
1. degree received; male
2. degree received; female
3. no degree received; male
4. no degree received; female.
A table of random numbers was used to select a sam-
ple of names from the degree received male and degree re—
ceived female lists. All of the names that were available
for the no degree received male and the no degree received
female categories were used. This resulted in a purposive,
non—random sample of 156, 1958—1959 Alumni of Michigan State
University whose addresses were listed as being in the
Lansing-East Lansing, Michigan area in the Regional File of
the Michigan State University Alumni Office and who were not
listed in the 1963-1964 Faculty Telephone Directory or as

22
living in University operated housing. The 156 names were
distributed among the degree—sex categories as follows:
Category Number
Degree received; male . . . . . 60
Degree received; female . . . . 60
No degree received; male . . . . 13
No degree received; female . . . _23
Total . . . . . . . . . . . 156
Collection of Data
Cover Letters and Questionnaires
The six combinations of cover letters and question-
naire forms were randomly assigned to the names in each of
the degree—Sex categories as listed in Table 1. After these
combinations were assigned, a three digit code number was
placed on two pages of the questionnaire for identification
purposes. The first digit indicated the degree—Sex category,
the second digit the combination of cover letter and ques-
tionnaire mailed, and the third digit the person's number
within the letter-questionnaire combination.
The cover letters, questionnaires and a self-
addressed stamped envelope were mailed to the 156 members of
the sample on July 6, 1964 and a record of the reSponse
received according to the date returned and number of the
questionnaire was compiled.

TABLE 1. Assignment of Letter and Questionnaire Form
Combinations to the Degree-Sex Categories
Degree Received Degree Received
Male No. Female No.
Letter 1; Question. 1 10 Letter 1; Question. 1 10
Letter 2; Question. 1 10 Letter 2; Question. 1 10
Letter 3; Question. 1 10 Letter 3; Question° l 10
Letter 1; Question. 2 10 Letter 1; Question. 2 10
Letter 2; Question. 2 10 Letter 2; Question. 2 10
Letter 3; Question. 2 10 Letter 3; Question. 2 10
Total 60 Total 60
No Degree Received No Degree Received
Male No. Female No.
Letter 1; Question. 1 2 Letter 1; Question. 1 4
Letter 2; Question. 1 2 Letter 2; Question. 1 4
Letter 3; Question. 1 3 Letter 3; Question. 1 3
Letter 1; Question. 2 2 Letter 1; Question. 2 4
Letter 2; Question. 2 2 Letter 2; Question. 2 4
Letter 3; Question. 2 _2 Letter 3; Question. 2 _4
Total 13 Total 23
Follow—up l was mailed on July 15, 1964 to all those
who had not reSponded by that date.
Follow—up 2 consisted of the Follow—up 2 letter,
another copy of the questionnaire of the same type as was

24
mailed in the first mailing and another stamped self-addressed
envelope. These were mailed on July 23, 1964 to all those
from whom reSponses had not been received.
The dates for the follow—up mailings were chosen as
the study was conducted so that when responses decreased
rapidly the follow-up could be sent and considered to be a
salient influencing agent of those reSponseS received after
a two day waiting period. The two day waiting period would
allow time for delivery to the investigator of any replies
mailed before the follow-up have been received by the sample
members, but yet, not enough time for the follow-up to have
been received and the questionnaire returned.
The reSponses received from July 8, 1964 to July 17,
1964 are considered to be due to the first mailing of the
cover letter and questionnaire and are classed in ReSponse
Wave 1. Follow-up 1 was mailed on July 15, 1964 but only
those replies received between July 17, 1964 and July 25,
1964 are considered to be due to this mailing or to the
cumulative effect of both mailings and are classed in
ReSponse Wave II. Follow-up 2 consisting of a cover letter,
questionnaire and stamped return envelope was mailed on
July 23, 1964 and those reSponses received from July 25,
1964 to August 13, 1964 are considered to be due to this
mailing or to the cumulative effect of the three mailings
and are classed in Response Wave III.

Interview
The sample of individuals to be contacted for an
interview was selected on August 13, 1964 and interviews
were conducted from August 13 to September 4, 1964. One
reSpondent and one non—reSpondent were selected at random
from each of the Six cover letter-questionnaire combination
groups for both the degree received male and female cate—
gories. In the no degree received male category all of the
non—respondents were selected for interviews, while a random
sample of half of the reSpondentS were Selected. A random
sample of five of the respondents in the no degree received
female category and all of the non-respondents were selected
for interviews.
Telephone numbers for about half of the sample were
found in the 1964 Lansing—East Lansing Telephone Directory.
Those individuals for whom a telephone number was available
were contacted by telephone and interviewed over the tele—
phone. For the other half of the interview sample, the
interviewer went to the address to which the letter had been
mailed and requested a personal interview. The same inter—
view schedule (Appendix III, p. 79) was used for the tele-
phone and personal contact interviews.
Repeated telephone calls were made until the person
could be contacted or until someone at the number answered
and reported that the person could not be contacted there

26
because he had moved and no longer lived there. The inter—
viewer went to the address a total of six times on different
days and at different times during the day before deciding
the person could not be contacted. If someone answered the
door and reported that the person requested did not live
there an attempt was made to discover where the person lived
and what had happened to the letters that had been sent to
the person at that address.
The reSponSes were recorded by the interviewer on
the interview schedule while the interview was being con-
ducted.

CHAPTER IV
RESULTS
Mailed Qpestionnaire
ReSponses to the mailed questionnaire were analyzed
according to the number of questionnaires returned each day
and according to the number and percent of questionnaires
returned during each of three designated response waves.
This analysis was designed to indicate the magnitude of
reSponse within designated time Spans and to Show fluctua—
tions in response rate over several time spans in relation
to selected characteristics of the sample and in relation to
Selected characteristics of the letters and questionnaires
mailed.
Daily ReSponse Rate
Graph 1 indicates the number of questionnaires
returned on weekdays from July 8, 1964, to August 13, 1964.
The largest number of questionnaires returned on any one day
occurred on July 9, three days after the initial mailing.
Mailing 11 occurred on July 15 and its influence was observed
by July 20. Mailing III occurred on July 23 and its influence
was noted in reSponses received from July 25 to August 13.
Each mailing was followed by an increase in the number of
reSponses.
27

July
1964
Aug.
1964
8 9
10
13
14
15
16
17
Number
of
Questionnaires
Returned
HF‘P‘HF‘FJHFJH‘HBUBJNDQRJNDQR)
bLAOSN
OHNWbMOflWOOI—‘NLAQMO‘NWOOI—‘Nw
N 00
[//
20
21
22
23
24
27
28
:>
/>
e If
Graph 1. Daily ReSponse Rate for Mailed Questionnaire
28

29
However, another influence seems to have been pres-
ent in relation to the number of questionnaires returned.
From July 13 to August 13 three days each week Show larger
numbers of reSponseS than other days. The highest number of
returns were received on Monday or Tuesday of each week.
Returns declined on Wednesday, and a second peak of responses
occurred on Thursday in all but one week, with a decline
again on Friday. How many reSponses on July 20 and July 27
and 28 were due to the urges to respond and how many were
due to people taking time over the weekend to answer, mail,
and fill in the questionnaire is not known. The general
pattern of response seems to indicate that the larger num-
ber of returns came during the beginning of the week on
Monday or Tuesday. Therefore, it would Seem advisable to
time the mailing of a questionnaire so that it would be
received before the weekend, and thus provide a stimulus to
reSpond as close as possible to the time when the response
will generally take place.
Response by Degree-Sex Categories
Questionnaires were mailed to a sample of 156 indi-
viduals. A total of 122 questionnaires were filled-in and
returned yielding a 78% reSponse. The largest number of
reSponses were received during Wave 1 and the smallest num-
ber of responses were received during Wave II. Wave 111
showed an increase in the number of reSponses over Wave II
but was less than Wave I (Table 2).

30
TABLE 2. ReSpondents to Questionnaire in Degree-Sex
Categories Over Three Waves of Response
Wave Wave Wave
I II 111 Total
No. No. No. No. No. %
Category Mailed. Ret. Ret. Ret. Ret. Return
Degree received;
male 60 24 6 19 49 82
Degree received;
female 60 25 5 14 44 73
No degree received;
male 13 l 2 5 8 62
No degree received;
female 23 10 4 7 21 91
Total 156 60 17 45 122 78
The reSponses in the degree-Sex categories followed
the same pattern of high response in Wave I, a decrease in
reSponse during Wave II and an increase in reSponse during
Wave 111, except for the no degree received male catEgory.
This group exhibited a small increase in responses from
Wave I to Wave II and a larger increase from Wave II to
Wave III.
The highest percent return occurred in the no degree
received female category with a final percent return of 91%.
The no degree received male category exhibited the lowest
percent return.

31
By the end of Wave II the total cumulative number of
respondents was 77 which is almost half of the sample (Table
3). In the degree—sex categories half (50%) of the individ_
uals in the degree received male and degree received female
categories had reSponded by the end of Wave 11 whereas in
the no degree received male category 23% had reSponded and
61% had reSponded in the no degree received female category.
TABLE 3. Cumulative Number and Percent* of ReSpondents in
Degree-Sex Categories Over Three Waves of ReSponse
Wave 1 Wave 11 Wave III
Cum. Cum.* Cum. Cum.*
No. No. No. % No. %
Category Mailed Ret. % Ret. Ret.
Degree received;
male 60 24 40 30 50 49 82
Degree received;
female 60 25 42 30 50 44 73
No degree received;
male 13 l 8 3 23 8 62
No degree received;
female 23 10 43 14 61 21 91
Total 156 60 38 77 49 122 78
* . . . . . .
Percent based on number of quest1onna1res 1n 1n1t1al
mailing.

32
Although the degree received male and female cate-
gories had an equal number and percent return at the end of
Wave II, at the end of Wave III the degree received male
category had returned five more questionnaires than had the
degree received female category giving the degree received
male category the higher reSponse.
The cumulative percent return in each response wave
for the no degree received female category is consistently
higher than for any of the other categories and thus Showed
an earlier response and a larger percent response (Table 3).
The increase in response in the no degree received
male category from Wave II to Wave III is 39%, the largest
increase among the degree-sex categories between these two
waves of reSponse (Table 3).
Table 4 is included so that each wave of response
can be examined separately in terms of number of question-
naires mailed at the beginning of each wave, the number of
questionnaires returned during each wave and the percent
return in each wave in each of the degree—sex categories.
In Wave I the percent return is about the same in all
degree-sex categories except for the no degree received male
category which shows the lowest percent return. In Wave II
the pattern changes and a fairly even percent return occurred
among all groups except the degree received female category
which shows the lowest percent return and in the no degree
received female category which shows the highest percent
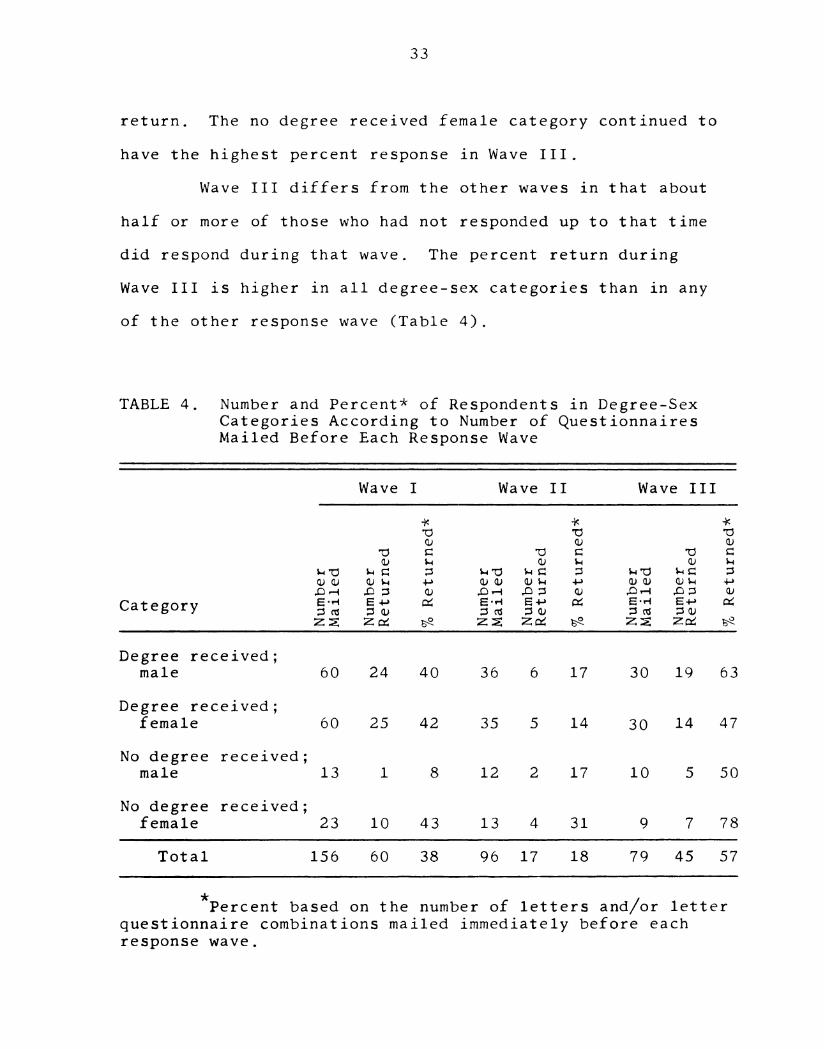
return.
33
have the highest percent reSponse in Wave III.
Wave III differs from the other waves in that about
half or more of those who had not reSponded up to that time
did reSpond during that wave.
Wave III is higher in all degree-sex categories than in any
The no degree received female category continued to
The percent return during
of the other response wave (Table 4).
TABLE 4. Number and Percent* of Respondents in Degree-Sex
Categories According to Number of Questionnaires
Mailed Before Each ReSponse Wave
Wave I Wave II Wave III
e a r
o p UQ) Q) (U
'o c o c p c
(1) H G.) H Q) H
no u: :3 we no 3 no u: :
QJO Q)H # QJ® WLI -p Q)® mu -p
DH .0: 8 DH 9: 6 .ma 9: m
Category s: 51: e as St e s; a; e22 zm x 2: 2m 82 2: 2m 52
Degree received;
male 60 24 40 36 6 17 30 LN? 63
Degree received;
female 60 25 42 35 5 14 30 14 47
No degree received;
male 13 l 8 12 2 17 10 .5 50
No degree received;
female 23 10 43 13 4 31 9 '7 78
Total 156 60 38 96 l7 18 'W) 45 57
*
Percent based on the number of letters and/or letter
questionnaire combinations mailed immediately before each
reSponse wave.

34
Of the 122 reSpondentS almost half of them had
responded by the end of Wave I. The reSponseS in Wave II
accounted for only 14% of the total responses and a total of
63% of the reSpondents had responded by this time. During
Wave III, 37% of the total responses were received. The
pattern of largest percent reSponse, lowest percent response
and then an increase in percent response is evident in all
categories except the no degree received male category.
This category exhibited a consistent increase in percent
reSponse and differs from the other groups in that in Wave
111 over half of total responses for this group were re-
ceived, while about one-third of the total responses for the
other groups were received in this wave (Table 5).
TABLE 5. Percent of Total ReSpondents for Each Degree-Sex
Category ReSponding in One of Three Waves of
Response
Total Wave
No. Wave I WaveII III Total
Ret. % Ret. ‘% Ret. % Ret. %
Degree received;
male 49 49 12 39 100
Degree received;
female 44 57 ll 32 100
No degree received;
male 8 13 25 62 100
No degree received;
female 21 48 19 33 100
Total ReSpond. 122 49 14 37 100

35
ReSponse in Degree Status
Categories
The final percent return at the end of Wave III for
the degree received category and no degree received cate—
gory was about equal. In Wave 1, the degree received cate-
gory had a higher percent return, but by Wave II the cumula-
tive percent return was almost the same (Table 6).
TABLE 6. Respondents to Questionnaire in Degree Status
Categories Over Three Waves of ReSponse
Wave I Wave 11 Wave III
p ~ '
“J U U P r U # k
H (U CD 0) ° (U Q) '
u-I c: '0 c: o: +4 c: as 44
(6 8-4 Q) 8-4 (I) H G)
E :3 a 3 - m 3 - m+4 H 44 O +a 0
H a) 3 m Z $3 o 2 83
Q) on 44 ad of.
D °’ e' e' e' e'S m o 3 3 o 5 a
Category 2 b\° z o o z o 0
Degree received 120 49 41 ll 60 50 33 93 78
No degree received 36 ll 31 6 17 47 12 29 81
Total 156 60 38 17 77 49 45 122 78
*
Percent based on number of questionnaires in initial
mailing.

36
Thus, degree status seemed to have little influence
upon the final percent return and the rate of reSponse over
the three waves varied Slightly between the two groups.
The pattern of response shown in Table 7 is based on
the number of letters or letter questionnaire combinations
mailed immediately before each reSponse wave.
TABLE 7. Number and Percent* of Respondents in Degree Status
Categories According to Number of Questionnaires
Mailed Before Each ReSponse Wave
Wave I Wave 11 Wave III
U U oo r o r m a
H'U HG ' H'U H: 0 H'U HG ‘
CUQ) (UH .P 00) (DH 44 (DO) (DH +3
.m4 6: o DH 13: m DH 13: 6
EH 5+: :2 ewt 5+4 m {id 5+» m
Sm so am so am so
2: 20d b\° 2: 2m be 22 204 be
Degree received 120 49 41 71 ll 15 60 33 55
No degree received 36 ll 31 25 6 24 19 12 63
Total 156 60 38 96 17 18 79 45 57
*Percent based on the number of letters or letter
questionnaire combinations mailed immediately before each
response wave.
During Wave I a higher percent return for the degree received
category was exhibited while in Wave II the no degree received
category had a higher percent return. This latter trend
carried over into Wave III with a 63% return in the no degree
received category and a 55% return in the degree received
category. The continued urgings seemed to have a somewhat

37
greater influence upon the individuals in the no degree
received category than in the degree received category
(Table 7).
ReSponse in Sex Categories
The daily response rate followed the same general
pattern for the male and female categories. Both groups
exhibited increases and declines in reSponse on or near the
same day (Graph 2).
The final percent return at the end of Wave III was
78% in both the male and female categories (Table 8). This
Seems to indicate that percent return is not related to the
Sex of the individuals asked to reSpond.
TABLE 8. ReSpondents to Questionnaire in Sex Categories
Over Three Waves of Responses
Wave I Wave 11 Wave III
- “O ”O 'U “'0
p a) on) o o o
H'U m u c 2:: . H a 2:: -
(12(1) 04 +4 (UH H +4 (DH H 44
.Dv-I <1) .03 '3 <1) .023 ~23 <1)
E-H - or E44 E44 o4 E44 E44 Cr.
Category 3 m o 3 m :30 3 m 3 m
22 Z b\° Zed 001$ zm om $
Male 73 25 34 8 33 45 24 57 78
Female 83 35 42 9 44 53 21 65 78
122 7848
U1
Total 156 60 39 17 77 49

38
Graph 2. Daily Response Rate in Relation to the Sex of the
ReSpondent*
16 Male .
Female ---------
15 .
I
14 :1
13 H
12
11
Number
of
Questionnaires
Returned
c»
July8.
*The number mailed in each category was different;
male = 73, female = 83.

39
Of the total reSpondents to the questionnaire 10%
more women than men reSponded in Wave 1. Fourteen percent
of the total responses for both groups were returned in
Wave II. Forty-two percent of the men who reSponded did so
during Wave III, while 32% of the women who responded did
so during that wave (Table 9).
TABLE 9. Percent of Total Respondents in Each Sex Category
ReSponding in Each of Three Waves of Response
Total Wave I Wave 11 Wave III
Number % of % of % of
Returned Return Return Return Total
Male 57 44 14 42 100
Female 65 54 14 32 100
Total Res. 122 49 14 37 100
Respondents in Questionnaire
Format Categories
Questionnaire 1 had the blanks for recording answers
at the end of the questions followed by data coding numbers.
Questionnaire 2 did not have any coding numbers and the
answer blanks were placed in front of the questions where
appropriate.
The cumulative percent return at the end of Wave III
was 77% for Questionnaire l and 79% for Questionnaire 2.
The cumulative percent return in each wave varied from two

40
to four percent between the two questionnaires. The small
differences exhibited in total percent return and response
rate over the three waves seemed to indicate that different
questionnaire formats did not have different effects upon
response (Table 10).
TABLE 10. ReSpondents in Questionnaire Format Categories Over
Three Waves of ReSponse
Wave I Wave II Wave III
0' o'Lug u - H z 58 H 2 82
o o o .p m 6
DH D ' Q) VD. o O o D o o o.
Ewiesw m 8+4 8+4 8+4 8+4 8+4 8#
den :0) so an) 3 o :30 :3o so
2228 b\° Zed Dad Oct 204 um Dad
Questionnaire l 78 31 40 6 37 47 23 60 77
Questionnaire 2 78 29 37 ll 40 51 22 62 79
Total 156 60 38 17 77 49 45 122 78
ReSpondentS in Relation to Letter
Salutation and Letter Appeal
Categories
Three different cover letters which varied in the
type of salutation used and the type of appeal used to urge
people to reSpond were mailed at the beginning of Wave 1.
Of the 52 individuals who had been mailed the Dear
Alumnus letter with the questionnaire enclosed, 23 reSponded,
while 17 of the 52 who had been mailed the Dear (name typed
in) letter reSponded in Wave 1. This resulted in a 11%
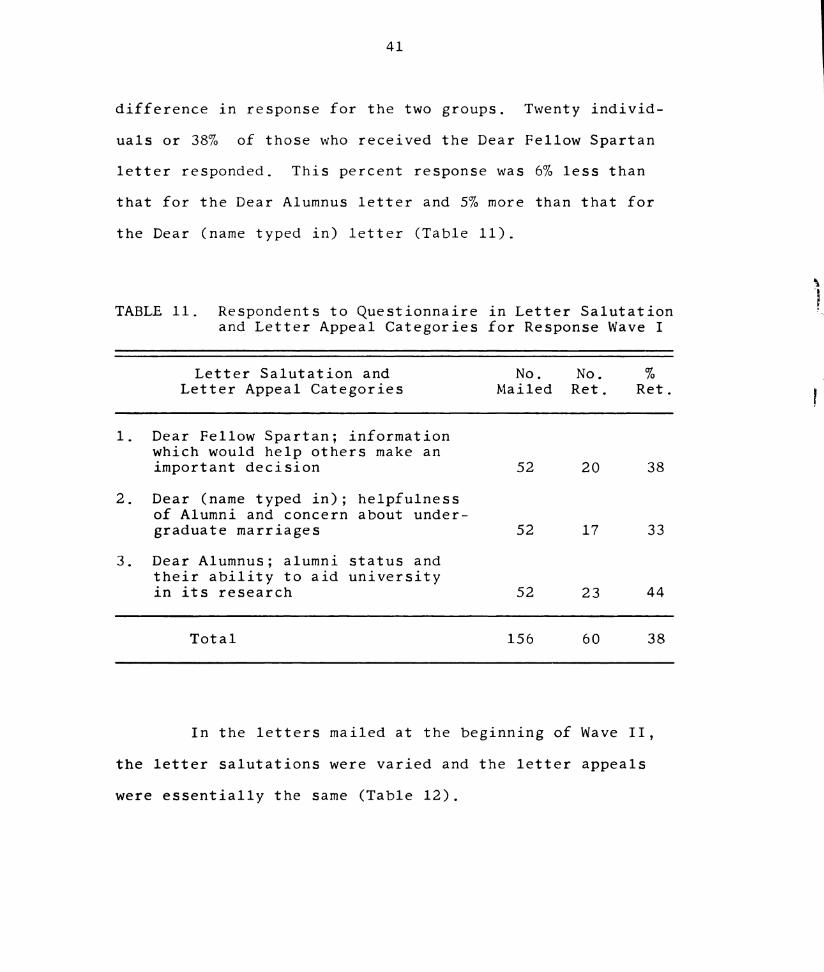
41
difference in response for the two groups. Twenty individ-
uals or 38% of those who received the Dear Fellow Spartan
letter reSponded. This percent response was 6% less than
that for the Dear Alumnus letter and 5% more than that for
the Dear (name typed in) letter (Table 11).
TABLE 11. Respondents to Questionnaire in Letter Salutation
and Letter Appeal Categories for Response Wave I
Letter Salutation and No. No. %
Letter Appeal Categories Mailed Ret. Ret.
1. Dear Fellow Spartan; information
which would help others make an
important decision 52 20 38
2. Dear (name typed in); helpfulness
of Alumni and concern about under—
graduate marriages 52 17 33
3. Dear Alumnus; alumni status and
their ability to aid university
in its research 52 23 44
Total 156 60 38
In the letters mailed at the beginning of Wave II,
the letter salutations were varied and the letter appeals
were essentially the same (Table 12).

42
TABLE 12. ReSpondents to Questionnaire in Letter Salutation
Categories in Wave II
Wave 11
Number Number %
Category Mailed Returned Return
1. Dear (name typed in) 52 9 l7
2. Dear Alumnus 44 8 18
Total 96 l7 l8
The percent return was almost the same for each
group, Dear (name typed in) received 17% return and the Dear
Alumnus category received an 18% return in relation to the
number of letters mailed at the beginning of Wave II (Table
12).
The Dear (name typed in) salutation was used on all
letters mailed at the beginning of Wave III and the appeal
was the same for all the letters but varied from the other
appeals in the previous mailings in that it gave more infor—
mation about the type of sample selected and who the desired
respondents were. Wave III exhibited an increase in returns
over Wave 11 (Tables 2 and 3) and accounted for 37% of the
total responses (Table 5). It is not known if this increase
in reSponse is due to the type of appeal used, the enclosure
of another copy of the questionnaire with this letter, the
hand written in ink ”thanks for your help” note at the
‘

43
bottom of each letter or to the cumulative influence of the
continued urgings to respond.
ReSponSes in Relation to Signatures
Used
Different methods of affixing the Signature on the
letters were used in Wave 1.
The percent return at the end of Wave I for the
mimeographed method and the hand written in ink method of
affixing signatures to the letters were the same (Table 13).
Difficulty with various duplication processes made
it necessary to have an unequal number of letters mailed
with each type of signature in Wave I and this portion of
the study was abandoned in Waves II and III. In these two
waves the signatures were hand written in ink.
TABLE 13. ReSpondents to Questionnaire in Signature
Categories for Response Wave I
Number Number %
Category Mailed Returned Return
Mimeographed signature 52 20 38
Hand written ink signature 104 40 38
Total 156 60 38

44
Interview Results
Twenty—one of the individuals selected for inter-
views had reSponded to the questionnaire and 19 had not. Of
the total group, 25, or 63% were contacted and asked for an
interview. Fifteen or 37% could not be contacted (Table 14).
TABLE 14. Success of Attempts to Contact PeOple for an
Interview by Degree-Sex Categories of Respondents
and Non-Respondents
Number Number Number
Category Attempted Contacted Not Contacted
ReSpondentS:
Degree received; male 6 4 2
Degree received; female 6 6 0
No degree received;
male 4 2 2
No degree received;
female 5 5 0
Total ReSpondents 21 17 4
Non—Respondents:
Degree received; male 6 3 3
Degree received; female 6 2 4
No degree received;
male 5 3 2
No degree received;
female 2 0 2
Total Non-ReSpondents l9 8 ll
Total ReSpondents and
Non—Respondents 40 25 15

45
Over half of the non-respondents could not be con-
tacted at the address to which the letters had been mailed.
Nine of the 11 were reported as having moved and not living
at that address when the interviewer called on the telephone
or went to the address. All the peOple reporting this infor-
mation also reported having received letters addressed to
the person from the Department of Home Management and Child
Development. Answers to the inquiry of what happened to the
letters fell into one of the following categories of:
1. had not forwarded the mail yet.
“YEW—-
.
2. did not know a forwarding address and ignored
the mail.
3. threw all the mail from the university and
advertisers away and forwarded the rest.
4. were saving the mail to take with them when they
went to visit the person or when the person came
to visit them.
Thus, 11 or 7% of the total number of 156 letters and ques-
tionnaires mailed in the first mailing had not reached the
individuals by August 13, 1964, nor had they been returned
to the Sender.
One of the non—respondents in the degree received
female category reported never having received the question-
naire or the follow-up letters. She reported having moved
recently and the mail must not have been forwarded.

46
Those who had reSponded to the questionnaire but
could not be contacted for an interview were reported as
being either at a military summer camp or as having moved
within the preceding two weeks to another area in Michigan
or to another state.
Of the twenty-five people contacted and asked for an
interview, 22 agreed and 3 refused. Of the 22 peOple who
were interviewed, 16 had reSponded and 6 had not responded
to the questionnaire.
All of those interviewed reported accurately as to
whether or not they had responded and when they had responded
in relation to materials that had been mailed to them. The
main reasons for responding to the questionnaire were re—
ported as being one of the following:
1. it was connected with the university and I
usually try to answer things sent from the
university.
the study sounded interesting and important.
wanted to help in the study.
kept getting letters so finally decided to
reSpond.
the third letter (Follow-up 2 Letter) explained
more about the study and had another question-
naire enclosed.
47
The questions reported as being misunderstood by
four or more of the people who had responded were those
related to Spouse‘s education (questions 6b and 9d and e).
Several people reported that it was hard for them to answer
accurately the question about the amount of support they had
received from various sources when they were undergraduates
(question 7). All of the people interviewed commented on
the number of questions about previous marriages and most of
them indicated that they thought one question about it would
be enough to take care of most cases.
When the answers given during the interviews were
checked against the answers on the written questionnaire some
differences were found. The largest number of differences
occurred in questions which asked for dates such as, the
years in college, year of marriage, and year of child‘s
birth. Some of these year differences would have changed
the answer the person would give to whether or not he was
married as an undergraduate, but in only one case was the
answer to this question different in the oral response than
in the written reSponse.
The misunderstandings on the questions about the
wife's education resulted in an incorrect reSponse on the
written questionnaire in three cases.
Although some people reported having difficulty
accurately stating the amount of support they had received
from various sources there was only one amount reported

48
differently orally than in the written response.
The answers reported by the non—respondents did not
differ from those received by the respondents except that
there were three Single people in the non—reSponding inter—
view and only one in the responding interview sample.
Those who had not reSponded to the questionnaire
reported the following reasons for non-response:
l. didn't think it was very important.
2. thought it was only for people who were married
or had been married as undergraduates.
3. the questions were too personal.
4. had just arrived home the day before and hadn't
had time to return the questionnaire.
The main difference between the responding and non-
reSponding portion of the sample was that more of the non—
‘ respondents had not received their letters and could not be
contacted for interview than the respondents.
Limitations of the Study
The unavailability of names of those people who had
left the University during the 1958—1959 academic year with-
out receiving a Bachelors degree limited the comparisons
which could be made between the various categories. The no
degree received male category was so Small that any conclu-
Sion drawn about this group must be highly tentative.

49
The use of a purposive non-random sample limits the
applicability of the generalizations drawn to only the group
studied and does not allow for the generalization of these
findings to other populations.
Testing of the relation of different methods of
affixing the Signature to the letter was dropped at the end
of Wave 1, due to duplication problems. Therefore, this
hypothesis was not thoroughly tested over the various waves
of reSponse.
During the process of contacting people for an inter-
view it was discovered that out of the 40 people selected,
11 had not received their questionnaires. How many other
members of the original sample did not receive their ques-
tionnaires is not known, but at least 7% had not received
their questionnaires, nor were their letters returned to the
Sender. Part of this was due to the mailing list which was
not up-to-date, and some was due to the fact that mail had
not been forwarded to the person. What degree of non—
response was due to not having received the questionnaire
is not known.
The necessity of forwarding mail would have taken
longer for reSponses to be returned. Therefore, even though
a reSponse came after a certain mailing, it does not mean
that the current mailing prompted the response. A very
limited check of when people reSponded with their verbal
report of when they responded seemed to indicate that when

50
the questionnaire was received was an indicator of which
mailing had influenced the respondent to respond. But, that
portion of the population which was interviewed were those
who were reasonably accessible and not necessarily repre—
sentative of the total population.
Conducting the study during the summer might have
had some influence upon the reSponse, but the extent of this
is not known.
The reasons for, or the factors influencing, the
daily reSponse rate and total reSponse cannot be determined
in a direct relationship because of the various number of
variables involved in any one case of response or non-
response. Because one factor and one result occurred at the
same time does not necessarily mean that one is the cause of
the other. It can only be stated that they did occur to-
gether and Suggest that there may be some relationship be-
tween the two.

CHAPTER V
CONCLUSIONS AND IMPLICATIONS
ReSponse Rate
One hundred and fifty-Six questionnaires were mailed
and 122 or 78% were returned. Two follow—up procedures were
used and these appeared to have some influence in increasing
the total reSponse.
The largest number of reSponses were received during
the first response wave. The mailing of the first follow—up
was the beginning of the second reSponse wave which received
the Smallest number of responses of any of the three waves
of reSponse. The mailing of another followeup marked the
beginning of the third reSponse wave. The number of returns
in this wave was larger than in the Second reSponse wave,
but less than in the first reSponse wave. The pattern of'a
high return followed by a low number returned and then an
increase in the number returned appeared.
Each mailing was followed by an increase in the num-
ber of reSponses. The beginning of each week also exhibited
an increase in the number of questionnaires returned. These
findings seem to indicate that the repeated mailings did ‘
have some influence upon reSponse, but that the weekend
51

52
intervals might also have been a factor in influencing the
daily reSponse rate.
About 50% of the total sample had reSponded by the
end of the second wave of reSponse. An increase of 28%
occurred after the mailing of the second and last follow-up.
This last reSponse wave accounted for 37%, or over one-third
of the total reSpondents. Continued follow-ups greatly in-
creased the total returns and thus would have had some in—
fluence upon decreasing response bias.
The percent return for the degree received and no
degree received categories was almost equal. Degree status
did not seem to be related to total percent returns or to
the rate of reSponse over the three waves. However, the con—
tinued urgings were followed by a larger percent increase in
returns for the no degree received than for the degree re-
ceived category. This suggests that there may be some dif-
ferences in the two groups in relation to rate of response
and the amount of urging required before responding, but
that this difference was not great enough to influence total
reSponse.
The male and female categories exhibited the same
daily reSponse pattern and the final percent return was
equal. Sex did not Seem to be a factor influencing total
response, although the men seemed to reSpond later than did
the women.

53
The differences observed between the male and female
and between the degree received and no degree received
categories were small, but further testing is needed before
any conclusions concerning them can be drawn. The results
of this study do indicate, however, that in terms of total
returns that degree received and no degree received status
and that male or female status does not seem to influence
total reSponse.
Some differences were exhibited among the degree-sex
categories that had not appeared in the responses when they
were classified in the single degree or sex category.
The pattern of reSponse was the same as that for the
total group for all degree-Sex categories except the no
degree received male category. This category showed an in-
creasing instead of fluctuating response pattern over the
three waves of reSponse.
The no degree received male category had the lowest
reSponse and reSponded later than the other groups with over
half of their reSponses being returned during the final
reSponse wave. The small number of names in the original
sample for this group may have been a factor in influencing
these differences. In this study the no degree received
male exhibited differences from the other groups in reSponse
rate over the three waves and in total returns. Another
study using equal numbers in the Split-plot experimental de—
sign would reduce the possibility of sample bias which could

54
have resulted because of the Small number of cases in this
category in the present study.
The no degree received female category had the high-
est response and tended to reSpond quicker than did the
other degree-sex categories. The number in the original
sample was Small for this group, as it was for the no degree
received male category, but, a very different and opposite
reSponse rate over the three waves and total reSponse was
exhibited.
Further study is needed using equal numbers and up—
to—date mailing lists before the differences among the
degree—Sex categories can be adequately tested.
Those who responded during the final reSponse wave
exhibited different characteristics from those who had re-
Sponded during the first two response waves in relation to
the factors of Sex and having or not having received a
Bachelors degree. Failure to have included the last follow-
up would have resulted in a biased sample. The low percent
return in the no degree received male category would seem to
indicate the possible direction of arbias, but problems
related to sampling and to the delivery of the mail to the
person may have been an influencing factor in this trend.
The total percent of response returned in each of
the questionnaire format categories seems to suggest that
the different questionnaire formats did not have different
effects upon the reSpondents in terms of soliciting their

55
reSponse.
Although the letter salutation and letter appeal
categories did receive different numbers of responses, the
differences among the three do not seem to be large enough
to warrant any conclusion concerning the superiority of any
one letter in soliciting reSponseS. However, the difference
in reSponse between the letter receiving the highest return
and the letter receiving the lowest return suggests that
there might have been some differences in the appeals to
reSpond between these two letters.
When the salutation of the letter was the main vari-
able in the instruments mailed, as it was during response
wave 11, the results seemed to indicate that different salu—
tations were not a factor in influencing reSponseS. However,
the small number of questionnaires returned during that wave
do not provide a large enough sample upon which to base a
conclusion.
The testing of any relation between the method of
affixing the signature and response was discontinued after
the first wave of reSponse. For the two methods used during
Wave I there was an unequal number in each signature cate-
gory because of problems encountered in duplication processes.
From the limited testing, the kind of method used in Signing
the letter did not appear to be related to response.

56
Interview
The results of the attempts to contact people for an
interview seem to indicate that there might be some differ—
ences between the reSpondents and non—respondents in ease of
contact. The non—responding portion of the population were
very hard to contact for an interview mainly because they
were no longer living at the address to which the letters
had been mailed. Thus, it is not possible to draw any con-
clusions concerning the non—respondents or even make any
Suggestions concerning the bias their non-response may have
introduced because it is not known how many of these were
true non—respondents or how many had not received the ques-
tionnaire. Neither, for the same reasons, is it possible to
compare the characteristics of the later respondents with
those of the early reSpondents in an attempt to discover
sample bias due to non—response.
In general, the answers given to the questions were
not different when the interview results for the reSpondentS
and the non-reSpondents were compared, except that the non-
respondent category contained a few more single people than
did the reSpondent category. The two groups did not seem to
differ in the kind of answers given to the questions, thus
no differences between the non—responding portion and the
reSponding portion of the population were discovered.

57
When the written answers were compared with the oral
answers obtained during the interviews, most of the informa—
tion was in agreement. The largest number of differences in
the information given from the same person occurred in the
statement of the year in which various things were to have
happened. Thus the greatest amount on unreliability seemed
to be in the statement of dates, eSpecially the year. How—
ever, as a whole the reliability of the instrument was upheld
by the large number of identical answers reported in the two
situations. The misinterpretation of a few questions may
influence the validity and reliability of the questionnaire,
but misinterpretation of the questions was rare and would
not have been enough to influence results a great deal.
Summary
Response to the questionnaire did not appear to be
related to the degree status of the sample members or to the
Sex of the sample members. However, when the factors of
degree status and sex were combined into degree-sex cate-
gories distinct differences in response rate and total re-
Sponse did appear among the categories.
The factors of different questionnaire formats and
methods of affixing the signature to the letter did not
appear to be related to response rate or to total reSponse.
The three letter salutation and letter appeal cate-
gories used in the first mailing exhibited small differences

58
in reSponse. However, only the Dear Alumnus letter which
received the largest percent return and the Dear (name typed
in) letter which received the smallest percent return are
considered to have exhibited differences in the solicita-
tion of reSponSes. The limited findings concerning the
relation of the letter salutation to response seem to indi-
cate that the type of salutation used was not a factor in
influencing reSponse. The increase in responses during the
final wave of response might have been due to the appeal in
the cover letter because this appeal was different from that
in any of the previous letters in that it gave further infor-
mation about the study and about who the desired respondents
were. However, other factors such as the cumulative influ-
ence of repeated mailings and the enclosure of another ques—
tionnaire also seemed to be operating to increase the re—
Sponse during this wave.
Generally, the questionnaire items elicited the type
of information desired and when oral reSponses obtained
through an interview were checked against those written on
the returned questionnaire very few differences in informa-
tion occurred. Therefore, the questionnaire seemed to be
effective in eliciting valid and reliable responses.

BIBLIOGRAPHY
Books
Goode, William J. and Paul K. Hatt. Methods in Social
Research. New York: McGraw—Hill Book Company, Inc.,
1952.
Lazarsfeld, Paul F. and Morris Rosenberg (ed.). The
Language of Social Research. Illinois: The Free Press,
1955.
Selltiz, Claire et al. Research Methods in Social Relations.
New York: Holt, Rinehart and Winston, Inc., 1963.
Periodicals
Baur, Jackson, E. ”ReSponse Bias In A Mail Survey,”
Public Opinion Quarterly, XI (1947), 594—600.
Bensen, L. E. ”Mail Surveys Can Be Valuable,” Public
Opinion Quarterly, X (1946), 234—241.
Burchinal, Lee G. "Personality Characteristics and Sample
Bias,” Journal of Applied Psychology, XLIV (1960),
172-174.
Donald, Marjorie. “Implications of Non-Response for the
Interpretation of Mail Questionnaire Data," Public
Opinion Quarterly, XXIV (1960), 99—114.
Edgerton, Norman, Harold A. Britt, Stewart Henderson and
Ralph Norman. ”Objective Differences Among Various
Types of ReSpondents to a Mailed Questionnaire,”
American Sociological Review, XII (August 1947), 435-444.
Ellis, Albert. ”Questionnaire Versus Interview Methods In
The Study of Human Love Relationships,” American
Sociological Review, XII (October 1947), 541-553.
Frazen, Raymond and Paul Lazarsfeld, ”Mail Questionnaire
As A Research Problem," Journal of Psychology, X (1945),
293-320.
59

6O
Ghisell, Edwin E. ”All or None Versus Graded Response
Questionnaires,” Journal of Applied Psychology, XXIII
(1939), 405-413.
Gullahorn, John T. and Jeanne E. Gullahorn. ”Increasing
Returns from Non-Respondents,” Public Opinion Quarterly,
XXIII (1959), 119-121.
Herbert, Hyman. ”Do They Tell The Truth?” Public Opinion
Quarterly, VIII (1944), 557-559.
Hammond, Cuyler. ”Inhalation in Relation to Type and Amount
of Smoking,” Journal of the American Statistical
Association, LIV (March 1959), 35-51.
Kirchner, Wayne K. and Nancy Mousley. ”A Note on Job
Performance: Differences Between Respondent and Non—
Respondent Salesmen To An Attitude Survey," Journal of
Applied Psychology, XLVII (1963), 223-224.
Levine, Sol and Gerald Gordon. ”Maximizing Returns on Mail
Questionnaires,” Public Opinion Quarterly, XXII (1958),
568-575.
Lubin, Bernard, Eugene E. Levitt and Marvin Zuckerman.
”Some Personality Differences Between Responders and
Non-ReSponders to a Survey Questionnaire,” Journal of
Consulting Psychology, XXVI (1962), 192.
Lundberg, George A. and Otto N. Larsen. ”Characteristics
of Hard-to—Reach Individuals in Field Surveys,” Public
Opinion Quarterly, XIII (1949), 487-494.
McDonagh, Edward C. and A. Leon Rosenblum. ”A Comparison
of Mailed Questionnaire and Subsequent Structured
Interviews,” Public Opinion Quarterly, XXIV (1964),
131-136.
Pace, Robert C. ”Factors Influencing Questionnaire Returns
From Former University Students,” Journal of Applied
Psychology, XXIII (June 1939), 388—397.
Reid, S. "Respondents and Non—Respondents to Mail Question-
naires,” Educational Research Bulletin, XXI (1942),
87-96.
Rollins, Malcolm. ”The Practical Use of Repeated Question—
naire Waves,” Journal of Applied Psychology, XXIV (1940),
770-772.

61
Ruess, Carl 8. ”Difference Between Persons ReSponding and
Not ReSponding to a Mailed Questionnaire,” American
Sociological Review, VIII (1943), 433—438.
Shuttleworth, F. D. ”Sampling Errors Involved in Incomplete
Returns to Mailed Questionnaires,” Psychological Bulletin,
XXXVII (1940), 437—439.
Sinha, Durgan. “Test-Retest Variations in Answers to
Personal Data Form," Educational Psychology, V
(September 1958), 159-163.
Sletto, Raymond. ”Pretesting of Questionnaires,” American
Sociological Review, V (April 1940), 193—200.
Stanton, Frank. ”Notes on the Validity of Mail Question-
naire Returns," Journal of Applied Psychology, XIX
(1945), 95-104.
Suchman, Edward A. and Boyd McCandless. "Who Answers
Questionnaires?” Journal of Applied Psychology, XXIV
(1940), 758—769.
Tallent, Norman and William J. Reiss. ”A Note on An
Unusually High Rate of Returns for a Mail Questionnaire,”
Public Opinion Quarterly, XXIII (1959), 579-581.
Wallace, David. ”A Case For and Against Mail Questionnaires,"
Public Opinion Qparterly, XVIII (1954), 40-52.
APPENDICES

APPENDIX I
Questionnaire l
Questionnaire 2

Michigan Stats University
Questionnaire 1
July, 1964
Schedule number
Study number
6“ no nor mm IN nus sues
Card number
Pleasa fill in the following information.
If your spouse has also raceivad ona of these questionnaires, please check hora
Then please fill in tho questionnaira and return.
each return the questionnaire.
1.
6.
r. r.Wthat you
Sex: Male 1.
Female 2.
Birthdata:
'Honth Year
Occupation (Describe the work you do):
Your education:
Name of Collage Dates attended Year
or University Major 140., Yr. Mo., Yr. Degrea(s) Obtained
Hi
H H
Hers you married during at least one acadanic term while enrolled
as an undergraduate student at Michigan Stats University Yes 1.
Nb 2.
If 15;, during tho pariod in your marriage when you were aurolled
in Michigan State University:
a) was your spousa living*vith you? (That is. did tho two of
you rasida in the same apartment or house?)
Yes, during the entire period 0.
Yes, for at least one academic term 1.
No 2.
b) was your spouse also a student during at least part of that
period? If yes, check all that apply; if no, check one:
Yes, spouse was an undergraduate at M30 0.
Yes, spouse was a graduate student at M50 1.
Yes. spousa was a student in some school other than M50 2.
No, spouse had already graduated from college 3.
Ho. spouse had started college but dropped out 4.
No, spouse never attended college 5.
1-5
6-8
10
11-14
15-16
17-29
30-42
43-55
56-68
69
70
71-72

.
. .
I , .
. .
.
fi
.' .
_ _ - ,, V
.
O .
'-
l n
' I
. ~
. - r .n... .-.
.‘ n . \
a-
. . ,
' -a
‘ ' “Jv
- . - , > _ -
- - a.rv _,.,
0'
D)
s,
-1 v
. .. - V
- I
(‘l
. .
.
(
o
.a
.
e
. .
a
.A -.
a..-

65
2
1° to your best recollection, vhat per cent of your support while in college
“Ia from each of the tollouing sources?
Parental support (including loans) 1 10-12
Selt-emplonent 2 13-15
Savings 1 16-18
Other loans 1 19-21
lorhing wife or husband 7. 22-26
Scholarship I 25-27
Other (Please specin below)
i 1 28-30
m
1001 Total
8. CURB!!! marital status: Single 1. 31
m1.‘ 2s
Divorced 3.
Widowed lo.
Separated 5.
Other (Please specin below)
9. if presently married:
a) Date of present marriage 32-35
Ibnth 7 Year
b) Spouse's age36-37
c) Spouse's occupation (Describe the kind of work) M 38-39
d) Spouse's education 40
Grade school only l. -
High school only 2.
Trade or Vocational school 3.
(beyond high school)
College or University lo.
e) If spouse attended college 1.1
“er of years completed ~______
32) Highest degree spouse obtained: 42
D.A., 3.8., or teaching Certificate 1.
MsAs or H.S. 2e
2.13.1)" Ph.D.. Cue 3e
D.D.S., NJ)" .tCs (ls
Other (Please specin below)
_‘_
7

.-
u .. ..
. .. . . .u . e a, ,, . . .e a a . o . . . _ a ..
c .. ,b . . w , . .
v I a
. a
.u , :. f r a
. ..... .
ii p . e. u e , r w..
. . .... , . . . .
o’er?! iv! . A... I .J . .
. ‘ .ID 4 l
v . . . - s e
... .. ..c.. . .. . I. I Ste: 1 ‘ve‘l
. a. ..y
u . . .. w .. u
l‘" 1 os.. u. ‘Z..- s
- s . tW r: A . - .. Is
,. . . ..
.1 n I u. C . I h
.b.I.e .e s .- . .I.
a . , a.
l.o a
. ...IO to .e.ea.n.ane«.s'ls
. .
. . .. < y
. . . s H ..
e ‘ - Ova .‘.
i. e. , .A .
e. r . 5 i . .. . l .e I
s
we. ‘J’I’ul ’1. I ‘II‘ . . .uo’ ,‘an'i .0“ ‘ ‘ .)
Ib,i a. s.f,i‘..‘-9
. v » -
a - . . e
. . p. .a. a
a J.
I
u . .. . a o u . n
o ‘ Z V.
na' ‘Je'li ‘tl
.
. .1 ’.o tl.‘
I e . p. . v
'b .O a.
e r .. .l 4, r... o
' . .
is V n J .€.a
v. a
s . .
i! e;- . 1 e.) .‘II'.
’ 1 u r
l‘( .1 &‘~Il’s. ll. . .u... .
I
. . . . . .
. .. . In ; .n A . .. u.
, QI- s «1)....(k. I 4. ,.. xi . ..rlv .. . .. slot 7 .‘f .s‘. 3.4.... c .I
r .
'
: \ as n
C 'Olki ’ . .l ‘4 ~
.0} - ls .. sl‘ . libs. . . I z .: out» 51;... . l - .\ . .. . . a a
4' a. § .
o e ‘
b s h A
4
. . g-0 _
. ‘
:lo,tu0.l“bslft....llr.
. . I
. .... . A. r . .U s . ma v .1 . A . 4 n \r. . t .1 . .. .. , a
. a ' . VI. 1A, .K‘I . nl
. .d .7. la).- . i is 1."? Vi! xv e~ . A .5. . e . '1‘ .p 4 .‘ p. a . 1‘ . . . 0 . I , r . s.
. .1“ ..._ J .. .... . o n
.. 1 v . on
a . . J . A ..
O . y .s r . .. . . .
‘23,“: 3| (“A I o...
— ..) . t .. . . a
O r . t ,. e . n . . ‘
eII- Iv.3e‘.‘0 .e. r
s u . .. i. n . v w .. J
O m : a .. y .. .. Hue . . u. .
0 "I I. O C ‘ b
a V i. .a . ..~ .. .o .p u
. . A . . .
4. v o , ; . r . we . .-
e o. .. . . C; .r. ,
a ,. s .u .
.n
n O . . a‘ .-Iv ' a . .y
_ . r .. . o
. . a I
.. .. a . . a .s . . a . .o c
I . l . . Al’s.
A .)
.\\ \.
. - ~ a
1 - ~ ‘. . e a M y . . . . wt». .. . 7..1 e . .. . r .
. _ .
s e a . .9..
aa .« s4. .‘ . .scra< 4. . t .
... A... {0.10 .. .r
b¢\; vs f.o.§s.. .4. ad .0..-
I ‘9 a a...
r o O D V U 0
al. u.s . u I Is I
. F.. .
D . . e C I . 9 . a .
a . . .l,
..
a , ... .y - A ‘ t: ‘ Q e ' .
. o ‘l s u I .
I pl a 9 _
Id . I'

66
3
10. it you have been married at any time, please fill in the folloving if
applicable:
a) Pirst marriage (if other than current marriage
described above):
Date:
Month
Terminated:
43-46
Wm...
47-50
Month
Terminated by:
Death 1.
Divorce 2.
Year
Legal separation 3.
Annulment 4.
Other (Please specify)
b) Second marriage (if other than current marriage):
Date: 52-55
Month
Terminated:
Year
56-59
Month
Terminated by:
Death 1.
Year
Divorce 2.
Legal separation 3.
Annulment 4.
Other (Please specify)
c) Third marriage (if other than current marriage):
Date: 61-64
Month
terminated:
Year
65-68
Month
terminated by:
Death 1.
Year
69
Divorce 2.
Legal separation 3.
Annulment 4.
Other (Please specify)
d) have you been married more than three times in
addition to your current marriage?
Yes 1.
Nb 2.
7O

. "I .
.. .m-m v
.-. I
. ,A
.4-
.
-e.-.¢ .1-
., ‘
c -- - .
._.
K _ .,
h
-vver‘
-. '
a. - e n...—
.- ‘00-" 1n~. a.-
' s s- e
.. r»
. -a- ._ .«c
i .
. . -p
, . . ..
I
'-m‘I‘- . -—e-\A..
m . . .
' ’ 'I v e
._ . _. .
- .,_.
- D
's' ,s .5
. . 1..
. ¢
, ,\
i h
A
I
I
.._ .
. d“
3
-—. on.
-- . ”.4
..
‘ f
" e
I
s ..
fl
‘ 4
a t
.- ~ ..
.
. ,
s
0 e
' a
1 a . I
I“
.I
C .‘
.
I
a
)
V
mo-
‘ .
e
I
-e
a
9
..
.
.IX -.‘ 1!“ - ' ’3 g
.g _ . At ‘ '
e
',., - , -.- . -_ ,
,-t,.' L ,. .
v3:, .
.
...,,.
. ‘ r
_ s
. .
..
I ‘ “
.. .-. .. ~ -
p ..
,‘I
Q
I I
.
f
_~ . .
.
- ... . .e ..
a. .. _.
. , b‘f.
\
I
.
‘ F
k,
I. . .7
. .
,'7
.
.
I V
'0.
‘ . . \
. 7' . «z
is

67
I:
11. Children by PRESENT marriage:
' Birth date
Name Sea: Month-Year
12. Children by your PREEOUS marriage(s):
‘ Birth date
Name Sex Munch-Year
13. If you have NO! graduated from college, please check all the following
' statements which are applicable.
Dropped outobecause I was uncertain about my goals. .0.
was'not interested in schoolwork . . . . . . . . . .1.
wanted to go to work right away . . . . . . . . . . .2.
ntdmth‘WIh‘3b111t’s e s e s s s s e a s s e e s3s
Cot married, or planned to marry shortly. . . . . . .4.
w..nC.deathmeeeassessesssseessSs
It seemed financially impossible to continue. . . . .6.
Parents did not encourage my continuing . . . . . . .7.
Pcrlonlllllneal...................8.
Decided to go to technical, business or
proprietary school. . . . . . . . . . . . .9.
Decided to join the armed services. . . . . . . . . 10.
Other (Please specify)
14' which reason was the most important? Please indicate by number.
1'"“HHI:'roo son rous.astrsunssss
C
10-14
15-19
20-24
25-29
30-34
35-39
40-44
45-49
50-54
55-59
60-63
64-65

»<: 1 . ‘ .
o. , .
.
. , I- -
_.-,k, .u---- -.--- . I __ -_~- .- '.AI._, ... ._, a . ._.,_.. I . a
.f'
S
..- r - —-.... ..- ..-. — . -I -. V _ A I - » I ‘. ..
. _.-. I .-,- _ - .--. .I - -...4 .~ . . .n . - w .
L
V ‘
r . s ‘
I- m . v I... . _ . .H , .4."- . p . - - ,. -... ~~ . -.-.. . .
I4
I ..I- In .~...4 - ..e , . ~ -. I..- e. - .. - v -
' 1. . "I . . r ._,. r: A
. .
.
. I
. , >
. o
.- s «A
,_ , _ ,- .- . . .. .4 A...--....‘ .... _
v a a _ .. a . a .. .. .-
. h
I- ,m . I . - . -. . .. ., .. .-. -.— ... v .,. - . . . . - -
II a I u'mu. - - -v a . -I so a - I I i a h . p 'e U '-
. --~ 0- ,~4 of I I» _ - m - g A - -.. s v - .. v . a. I I
.
II . . ' -
' ‘ . . “ c . . ‘ 1 ' ‘ ' 41‘ . '
.- . . I 1 . p ‘
‘ I , s
, -I , - .. .g. f ' a \‘ I
: u N ‘ .
. , V . I a " '. A . ‘-‘h a r'- ‘ | L ~ It! I ’_ .
. ‘ .-.. . . .. .
. m ,, ' , ' .v
s a I I I I e ‘ e e o . . ' . a' . -
's e v ‘I - U a g
. ‘ I ' - « x w’. . w a , v - . g j , ' I 4
~. '\ O O m
. . ' s x
‘ ‘ ‘ ;-
O I x e a s h . V - ~ . . . ." l‘.- . .- .- ..
. ' . p I. ,a ~ ‘~ vi ' o ' I I ~ _
I 3 O I I V . ' I a ’ ’0. la ‘ a .; h 4 ' 4
-...- . . .- . .-
, .
I . I , ~ A
. a O r ’ h ~ 1 s '- ‘ v Q s O a 0 Q .‘ ‘
. .-- .A . V
4 b I ', . .
s - . - e o ‘ . - . -.- Lv‘; I 1. . . -. .~
I- >-
. ‘ ‘ ,
h D s . 4 V3, ‘-. « ,
O I P O I a s I I ‘ L , ' v ' .'-.. I I I
. - - « II .
l ‘ '
p“ O a I a ‘ s . y g e m . - A. . ., .
. .
. ' . Y .r , - , '¢ . ‘, n V . .
’ , . e .
' l' re7' .3 I ‘.
s I m a a s o s I o O s v I .. ‘w .
- as ». .. 0>‘
' .'
i . . , . Q o
e e a . a . ..’ - - V '
a- I ~
I , ., . .
. 4.. _ I. ' ‘
- - a - . A r n ,. -.-.. , e .. “.4 ‘» e . . ‘ 9
' a . -. a- -- - v4 . . g A . _ .. 9.. al.... . , . u- I . I o
‘ L . V
.I ‘ ‘ i _ I ,‘ , , . ,(
o 4 _ \ . v ‘. ' ‘
-‘ 0" -
, , . . ., ~ I

Questionnaire 2
Nflehigsn State University
July, 1964 58
Please fill in the following information.
If your spouse has also received one of these questionnaires, please check here
Then please fill in the questionnaire and return.
each return the questionnaire.
1. Sex: Male
Female
2. Birthdate:
Mbnth Year
3. Occupation (Describe the work you do):
It is VERY IMPORTANT that you
4. Your education:
Name of College Dates attended
or University Major Mo., Yr.
M00, Yrs
Year
Degree(s) Obtained
5. Were you married during at least one academic term while enrolled as an
undergraduate student at Michigan State University? Yes
No
6. If YES, during the period in your marriage when you were enrolled in
Michigan State University:
a) was your spouse living with you? (That is, did the two of you
reside in the same apartment or house?)
Yes, during the entire period.
Yes, for at least one academic temm.
b) was your spouse also a student during at least part of that
period? If yes, check all that apply; if no, check one:
Yes, spouse was an undergraduate at M.S.U.
Yes, spouse was a graduate student at M.S.U.
No, spouse never attended college.
Yes, spouse was a student in.some school other than MQS.U.
No, spouse had already graduate from college.
No, spouse had started college but dropped out.


69
2
7. To your best recollection, what per cent of your support while in college came
from each of the following sources?
Z Parental support (including loans)
% Self-employment
% Savings
2 Other loans
2 werking wife or husband
. Scholarship
. Other (Please specify below)
100% Total
8. CURRENT marital status: Single
married
Divorced
Widowed
Separated
Other (Please specify below)
9. If PRESENTLY married:
a) Date of present marriage
Month Year
b) Spouse's age
c) Spouse's occupation (Describe the kind of work)
d) Spouse's education Grade school only
High school only
Trade or vocational school
(Beyond High school)
College or university
a) If spouse attended college
Number of years completed
0R
Highest degree spouse obtained:
B.A., 8.8., or Teaching Certificate
M.A. or 14.8.
Ph.D., E.D.D., etc.
0.0.3., 14.0., etc.
Other (Please specify below)

7O
3
10. If you have been married at any time, please fill in the following if
applicable:
a) First marriage (if other than current marriage described above):
Date:
Mbnth Year
Terminated:
Month Year
Terminated by: Death
Divorce
Legal separation
Annulment
Other (Please specify below)
b) Second marriage (if other than current marriage):
Date:
Month Year
Terminated:
Mbnth Year
Terminated by: Death
Divorce
Legal separation
Annulment
Other (Please specify below)
c) Third marriage (if other than current marriage):
Date:
Mbnth Year
Terminated:
Month Year
Terminated by: Death
Divorce
Legal separation
Annulment
Other (Please specify below)
d) Have you been married more than three times in addition to
your current marriage? Yes
No


71
4
11. Children by PRESENT marriage:
Birth date
Name Sex Month-Year
12. Children by your PREVIOUS marriage(s):
Birth date
Name Sex Month-Year
13. If you have £93 graduated from.college, please check all the following
statements which are applicable.
Dropped out because I was uncertain about my goals.
was not interested in school work.
wanted to go to work right away.
Did not have the ability.
Got married, or planned to marry shortly.
was needed at home.
It seemed financially impossible to continue.
Parents did not encourage my continuing.
Decided to go to technical, business or proprietary school.
Decided to join the armed services.
Other (Please specify)
14. Please circle the reason which was the most important.
THANK YOU FOR YOUR HELPFULNESS.

APPENDIX II
Cover Letter 1
Cover Letter 2
Cover Letter 3
Follow—up 1, Letter 1
Follow-up 1, Letter 2
Follow-up 2 Letter
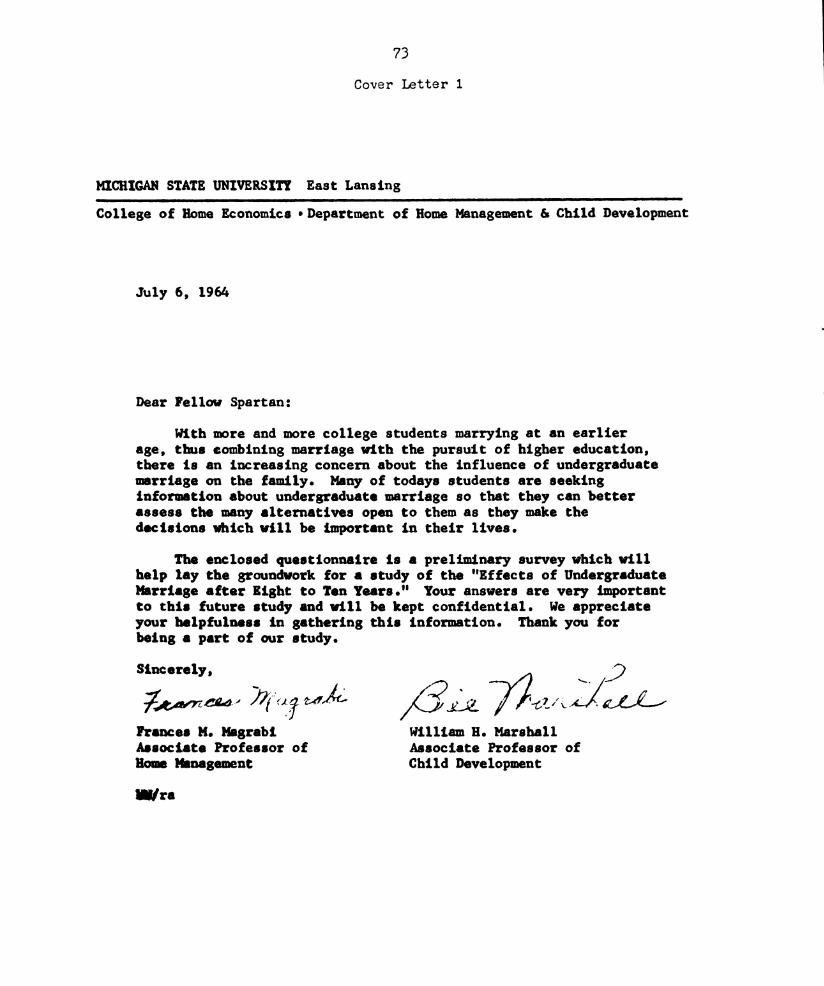
73
Cover Letter 1
MICHIGAN STATE UNIVERSITY East Lansing
College of Home Economics oDepartment of Home Management &.Child Development
July 6, 1964
Dear Fellow Spartan:
With more and more college students marrying at an earlier
age, thus combining marriage with the pursuit of higher education,
there is an increasing concern about the influence of undergraduate
marriage on the family. ‘Many of todays students are seeking
information about undergraduate marriage so that they can better
assess the many alternatives Open to them as they make the
decisions which will be important in their lives.
The enclosed questionnaire is a preliminary survey which‘will
help lay the groundwork for a study of the "Effects of Undergraduate
Marriage after Right to Ten Years." Your answers are very important
to this future study and will be kept confidential. we appreciate
your helpfulness in gathering this information. Thank you for
being a part of our study.
Sincerely, ,:>
7mm! Mu?MA 6i" :2 ; jtf/Z/LL/g Z L/
Frances M. Magrabi William B. Marshall
Associate Professor of Associate Professor of
Home Management Child Development
“Ira

I I I.
.
. I
' I 1
I _;
._ '
Q II.
‘I - L;
I
., e
I
t
L I
.
6.
‘ I
I
I
, II'
o
\u.
.'-I
" A
-
'I
s
I
S_“ s
.4....
I
‘1
.
I
-.
.
1.-
I
l
.
l
. I
0
IL}
I
l,'
I
. .
a
vs
I7..
o
II . a
I
0
' ‘-
.
c
J ..
-.
‘5,
o
. a>. .
. I. .
a
' I‘.
.
‘ r
.a‘.
.
. -_
.
. ‘ _
s
, ,
, . .
.. .‘
J .‘ I
\I' 1..
' l.
.-
.
- I
U
' I. l'
4
a
.
.
..
. I
1‘ 7.
I
n-
-.' r.
, \
er
~Q
‘.
.,_ .1
.
f 3
I “
AI. '.t I.' ‘
l' '

71+
Cover Letter 2
MICHIGAN STATE UNIVERSITY East Lansing
College of Home Economics -Department of Home Management & Child Development
July 6, 1964
Dear
Alumni of Michigan State University are known for their concern
about their school and their helpfulness in many ways to the University.
One of the ways alumni help is through giving a few moments of their
time to answer questionnaires connected with University research.
During the time when you were attending Michigan State University
many undergraduate students were married. we are interested in the
influence undergraduate marriage has on the family. You can help us
by answering the enclosed questionnaire' and returning it in the
enclosed enve10pe. Ybur answers will be confidential and will help
lay the groundwork for a much larger study of the "Effects of under-
graduate Marriage after Eight to Ten Years."
Thank you for your helpfulness in filling in the questionnaire
and being a part of our study.
Sincerely,
// , )2 '4. ., , A7 2
if. ’W 7
Frances M. mgrabi /William B. Marshall
Associate Professor of Associate Professor of
Home Management Child Development
MM/ra

I
.
. Ii
. J . .
O r ‘ I
, .
_ . . .
s ' ‘I k A
. , Iv
. . . . ,
.
I
w , v .
.
4‘ ‘ ,’. n k .
1 ‘ o
.
. .
l I l
a
I" \ I- I
, . I i r
~I
9J I
.I

75
Cover Letter 3
MICHIGAN STATE UNIVERSITY East Lansing
College of Home Economics ' Department of Home Management 6 Child Development
July 6, 1964
Dear Alumnus :
RESEARCH is an important word in present day America and at
Michigan State University. YOU can help Michigan State University
maintain its reputation as a leader by participating in its research.
A few moments of your time spent in filling out the enclosed form
and returning it will help a great deal. The information you supply
will be kept confidential; only summaries of returns will be pub-
lished. These will be used to help lay the groundwork for a much
larger study of the "Effects of Undergraduate Marriage after Eight
to Ten Years."
As an alumni of Michigan State University you have this oppor-
tunity to join the efforts for the advancement of knowledge through
research sponsored by Your University. Thank you for your helpfulness.
Sincerely,
A97 A7 ‘ // ‘ WW/fiiga‘éafleo 120110 wflfl/
Frances 'M. Magrabi , William H. Marshall
Associate Professor of ,7 Associate Professor of
Home Management Child Development
MM/ra


76
Follow-up 1, Letter 1
‘MICBIGAN STATE UNIVERSITY East Lansing
College of Home Economics ' Department of Home Management &.Child Development
July 16, 1964
Dear
We have not yet received your questionnaire response
to our study of the "Effects of Undergraduate Marriage after
Eight to Ten Years." Your reply to this questionnaire is very
important because it will help in the formulation of the
future study which will involve over 6,000 people. an't
you please return your completed questionnaire today? Your
answers will be confidential and will help make our study
complete.
Thank you very much.
Sincerely,
AMA/”12572AAt JustFrances M. Magrabi William ll. Marshall
Associate Professor of Associate Professor of
Home Management Child Development
MM/ra

r15._

77
Follow-up 1, Letter 2
MICHIGAN STATE UNIVERSITY East Lansing
College of Home Economics 0 Department of Home Management & Child Development
July 16, 1964
Dear Alumnus:
we have not received your response to the questionnaire
we mailed you last week. It will lay the groundwork for a
future study of the "Effects of Undergraduate Marriage after
Eight to Ten Years." If you have not returned the questionnaire,
we urge that you do so. we know that Michigan State University
Alumni can be counted on for a 100% response. Your answers
will be confidential and will give us direction and suggestions
as we formulate our future study.
Thank you for your helpfulness.
Sincerely,
,A.
I/ftffl z '5 ///l’g',‘1.? («‘4 {71 :2; I z :-’é/Q’)
Frances M. Magrabi William R. Marshall
Associate Professor of Associate Professor of
Home Management L Child Development
MM/ra
1‘,
.1

78
Follow—up 2 Letter
MICHIGAN STATE UNIVERSITY East Lansing
College of Home Economics ' Department of Home Management &
Child Development
July 23, 1965
Dear
We notice that your reSponse to our questionnaire has been
delayed. A further explanation of our study will perhaps
indicate the importance of your reply.
One question you might be asking is ”Why was this question—
naire sent to me?” Our sample for this preliminary study
includes the graduates and non-graduates of Michigan State
University during the years of 1958 and 1959 whose current
addresses, as listed in the Michigan State University Alumni
Records Office, are in the Greater Lansing area. In order
to formulate our future study of undergraduate marriages we
need to have some information about people who are now
married or unmarried, including those who were married before,
during or after they were undergraduates at Michigan State
University. This future study will concern about 6,000
people who were undergraduates at Michigan State University
eight to ten years ago. Your reply will give us direction
for the formulation of the future study and will give us
some insight into the questions that will be appropriate to
use with this larger sample.
We are enclosing another questionnaire and self—addressed
stamped envelope; we hope we can depend upon receiving your
reply soon.
Sincerely,
Frances M. Magrabi William H. Marshall
Associate Professor Associate Professor
Home Management Child Development
MM/ra

APPENDIX III
Interview Schedule

80
Michigan State University
July, 1964
INTERVIEW SCHEDULE
NAME DATE
ADDRESS INTERVIEWER
PHONE
Introduction with explanation of the study and a request for
an interview.
1. Did you reSpond to the questionnaire? Yes
No
2. Why did you (or didn't you) reSpond? (What was there
about the questionnaire or cover letter that prompted
you to respond (or not reSpond) to the questionnaire?)
3. When did you reSpond?
when first received the letter and questionnaire
after Follow-up 1 (letter)
after receiving Follow-up 2 (letter & questionnaire)
4. Cover letter:
SD Did the letter look attractive to you?
b. Do you remember the reason the letter gave for
requesting your response? What was it?
c. Do you remember anything about the letter that you
liked or did not like? What was it?
d. Did the letter explain what the study was about
clearly or was it confusing to you?
e. Did you mind receiving the letter and questionnaire?
5. Questionnaire:
a. Did the questionnaire look attractive to you?
b. Do you remember anything that you did or did not like
about the questionnaire? What was it?

81
c. Were there any questions you did not understand?
Or that you did not know how to answer? Which ones?
d. Were there any questions you did not like, or did
not care to answer?
e. Were there any numbers in the right-hand column of
the questionnaire?
Yes, (Did these bother you in any way? Did you
wonder why they were there?)
No.
f. What is your frank evaluation of the questionnaire?
6. Follow-up (if appropriate)
a. Did you receive any letters reminding you that you
had not responded and asking you to do so?
If yes, what was it you received?
b. Do you remember anything about the letters that you
liked or did not like? What was it?
c. Did these letters help clarify the study?
d. Did you mind receiving successive letters?
Make the transition to asking the same questions that appeared
on the questionnaire.
1. Sex: Male
Female
2. What is your birthdate?
Month Year
3. What is your occupation? What kind of work do you do?
4. Your education:
Name of College Dates Attended Year
or University Major Mo. Yr., Mo. Yr. Degree(s) Obtained
._‘-."J‘-.(an:
i137$
W...
‘fisfi‘k
'IJI-
\s
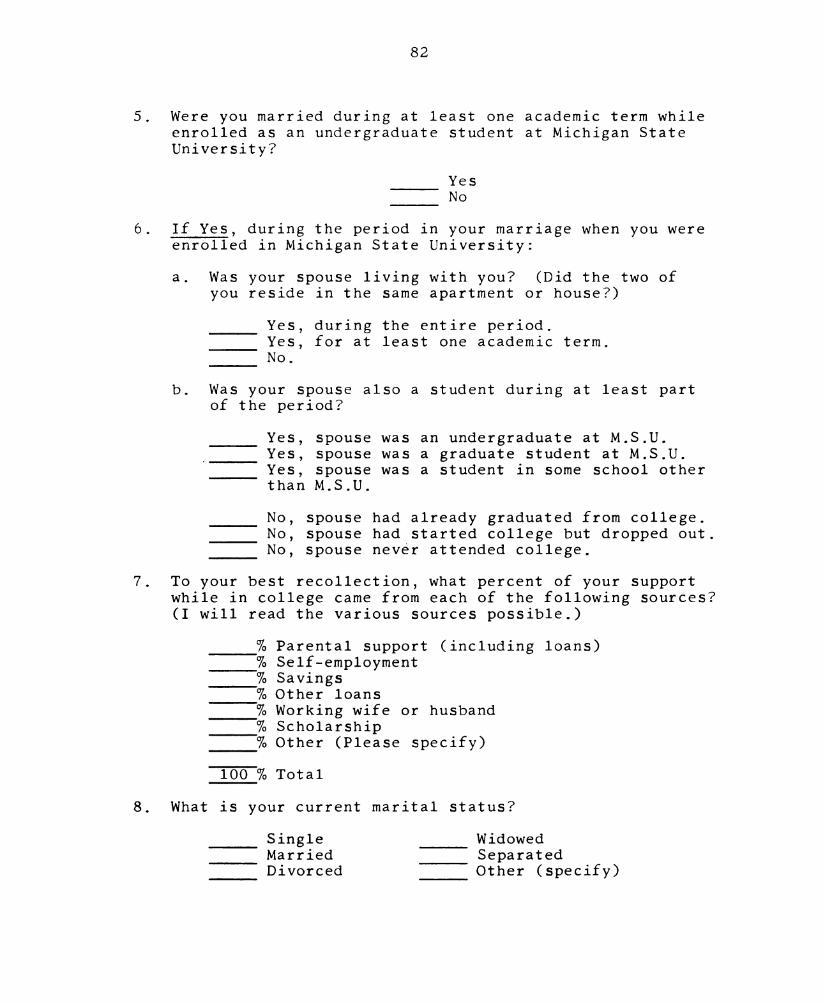
82
5. Were you married during at least one academic term while
enrolled as an undergraduate student at Michigan State
University?
Yes
No
6. If Yes, during the period in your marriage when you were
enrolled in Michigan State University:
a. Was your Spouse living with you? (Did the two of
you reside in the same apartment or house?)
Yes, during the entire period.
Yes, for at least one academic term.
No.
b. Was your Spouse also a student during at least part
of the period?
Yes, Spouse was an undergraduate at M.S.U.
Yes, spouse was a graduate student at M.S.U.
Yes, Spouse was a student in some school other
than M.S.U.
No, spouse had already graduated from college.
No, Spouse had started college but dropped out.
No, Spouse never attended college.
7. To your best recollection, what percent of your support
while in college came from each of the following sources?
(I will read the various sources possible.)
% Parental support (including loans)
0 Self—employment
0 Savings
0 Other loans
0 Working wife or husband
0 Scholarship
o Other (Please specify)
100 % Total
8. What is your current marital status?
Single Widowed
Married Separated
Divorced Other (Specify)

83
9. If presently married:
Did your Spouse receive a questionnaire? Yes
No
If yes, did he/she reSpond? Yes
No
a. What is the date of your present marriage?
Mo. Year
What is your wife/husband‘s age?
What kind of work does your wife/husband do? What
is their occupation?
Spouse's education Grade school only
High school only
Trade or vocational school
(beyond high school)
College or University
If Spouse attended college
Number of years completed
or
Highest degree Spouse obtained?
B.A., B.S., or Teaching Certificate
M.A. or M.S.
Ph.D., E.D.D., etc.
D.D.S., M.D., etc.
Other (Please Specify)
10. Have you ever been married?/ or have you had any previous
marriages? If Yes:
a. First marriage (if other than current marriage described
above):
Date:
Month Year
Terminated:
Month Year
Terminated by: Death
Divorce
Legal separation
Annulment
Other (Please Specify)
N"-
..

84
b. If more than one marriage obtain same information
as above.
11. Do you have any children? (By present or previous mar-
riage; please indicate.)
12. Name Sex Birthdate
Month-Year
13. FOR THOSE WHO DID NOT GRADUATE FROM COLLEGE (M.S.U.)
What are your main reasons for leaving M.S.U. before
graduation?
From this list which is the most important reason or
reasons? (Circle the one more important if indicated.)
List of possible reasons for leaving M.S.U. before
graduation: (Read to reSpondent)
Dropped out because I was uncertain about my goals.
Was not interested in school work.
Wanted to go to work right away.
Did not have the ability.
Got married, or planned to marry shortly.
Was needed at home.
It seemed financially impossible to continue.
Parents did not encourage my continuing.
Personal illness.
Decided to go to technical, business or proprietary
school
Other (Please Specify)
THANK YOU VERY MUCHI
h0iqeHm»....Jretamrwl
“Jul-14.1Jags}?I'1‘
«fiftibl
(d.(.a“(trig.
£133..9
(373

”'TITI'l‘Mflwiflflflfilflfijlitfyflflilflflflflfflfllfl