Embed Size (px)
Citation preview

From Commons, M. L, Herrnstein, R. J. & A. R. Wagner (Eds.). 1983. Quantitative Analyses of Behavior: Discrimination Processes. Cambridge, MA: Ballinger (Vol. IV, Chapter 3, pages 37-57). .
Pigeons and the Magical Number Seven
Sheila Chase Hunter College of the City University of New York
In 1956 George Miller called our attention to the still unexplained fact that humans can
identify only about seven (plus or minus two) tones, or sound intensities, without error. Beyond the “magical number seven” increasing the number of such stimuli to be identified produces little gain in information transmitted. Stimuli that are identified perfectly as part of a set of four or five are confused when they are part of a larger set. Since confusions do not occur if the number of stimuli is small, they cannot be completely due to sensory limitations. Further evidence that the limitations on accuracy are not solely due to lack of sensitivity is provided by the range effect. As the separation between adjacent stimuli in a set is increased there is, at first, a gain in accuracy. This, however, quickly levels off. In fact, Pollack (1952) found that the range of tones to be identified can be increased by a factor of about 20 without much improvement in accuracy.
Extensive work on the range effect, and other problems of intensity resolution, has lead Durlach and Braida (1969) and their collaborators to conclude that the main source of error in absolute identification of sound intensities is memory (see Berliner, Durlach and Braida, 1978; Braida and Durlach, 1972; Purks, Callahan, Braida, and Durlach, 1980). Confronted with the task of identifying stimuli presented in random order without benefit of a standard to which they can be compared, the subject operates in the context coding mode. That is, “the subject attempts to compare the sensation with the general context of sounds in the experiment.” (Durlach and Braida, 1969, p. 374). In most of the experiments to be described below pigeons were trained to make absolute identifications of lights that varied only in luminance. In many respects their performance is not unlike that of humans confronted with a similar task. Like humans, pigeons seem to be severely limited in their ability to identify such stimuli when they are members of a large set. The limitation appears to be the result of an imperfect memory coupled with a decision process that uses only a small sample of the information in this memory. Although Heinemann (1983a) developed this model to account for choice behavior of pigeons in a variety of two-choice situations, it applies, with very little modification, equally well to situations that involve more than two choices, for example: the categorization and the absolute identification experiments to be described here.
EXPERIMENTS
One general procedure was used in all experiments. To make food an effective incentive for
responding correctly, the subjects, White Carneaux pigeons, were maintained at about 85 percent of their free-feeding weights. The black response panel of a pigeon operant conditioning chamber contained a square opening for the feeder, located near the floor of the chamber. A rectangular (3.5 x 3 cm) display key was located above a row of circular choice keys. The choice keys were 2.5 cm in diameter and separated from each other by 1.5 cm in the categorization experiment. They were 1.75 cm in diameter and were separated by 2 cm in the remaining experiments.
1
In all experiments the display key was illuminated with white light at a predetermined level of luminance at the start of each trial. Five pecks (one peck in the categorization experiment) on the display key caused the choice keys to be illuminated with green light. A subsequent peck on a particular choice key was treated as being correct if it was made in the presence of a particular luminance (or range of luminances). Correct responses were followed by two seconds of access to food, and a period of approximately 10 seconds, during which the choice keys were darkened and were inoperative. The occurrence of the correct response ended the trial. The luminance present when an error was made was presented again 10 seconds later. Two methods were used to prompt the choice of the correct key on such reruns of the trial. In the categorization experiment the choice key that was pecked in error was not illuminated following the display key peck; this was repeated with additional keys darkened on each rerun of the trial until the correct key was chosen. In the remaining experiments only the correct choice key was illuminated following an error. Since the birds rarely pecked the darkened choice keys, this second procedure usually resulted in a correct key choice on the first rerun of the trial; key choices made on such correction reruns will not be considered in the analyses of performance to be described below.
Acquisition of a Five-Choice Categorization Task1
Most work concerned with stimulus control of behavior has dealt with situations requiring a
choice between two alternatives, namely, the choice of responding or not responding, or the choice of one of two pecking keys. In view of the evidence that even humans are severely limited in their ability to identify stimuli that differ only in intensity, an experiment was carried out to see what happens to a choice discrimination when the number of choices required of a pigeon is increased successively from two to five. Since data from human subjects have shown that the range of stimuli to which the subjects are exposed affects sensitivity, the same stimuli were used throughout the experiment.
Five choice keys were used in this experiment. The stimuli, presented in random order, were 13 luminance levels of white light, ranging from 0.5 to 2.9 log ft.L in 0.2 log unit steps. Each session was 78 trials in length. There were four stages of training during which the number of response alternatives was increased from two to five. During all these stages one of the key choices (R1) was treated as being correct for luminances L1 through L5. These were the five lowest luminances for four of the subjects and the five highest luminances for the remaining four subjects. The luminance values defining the other correct responses during successive stages of training are shown in Table 3-1. Training in each stage was continued until the performance of all eight birds in the experiment appeared to have attained asymptotic levels. After a total of 489 days of training the birds were returned to the two-choice condition and, finally, were retrained on the five-choice condition.
Table 3-1. Relation between luminance range and correct response at various stages of training.
Number of Choices Responses R1 R2 R3 R4 R5 Two L1-L5 L6-L13 Three L1-L5 L6-L7 L8-L13 Four L1-L5 L6-L7 L8-L9 L10-L13 Five L1-L5 L6-L7 L8-L9 L10-L11 L12-L13 Note: Entries represent the range of stimuli for which the response shown at the top of the column was considered correct.
2
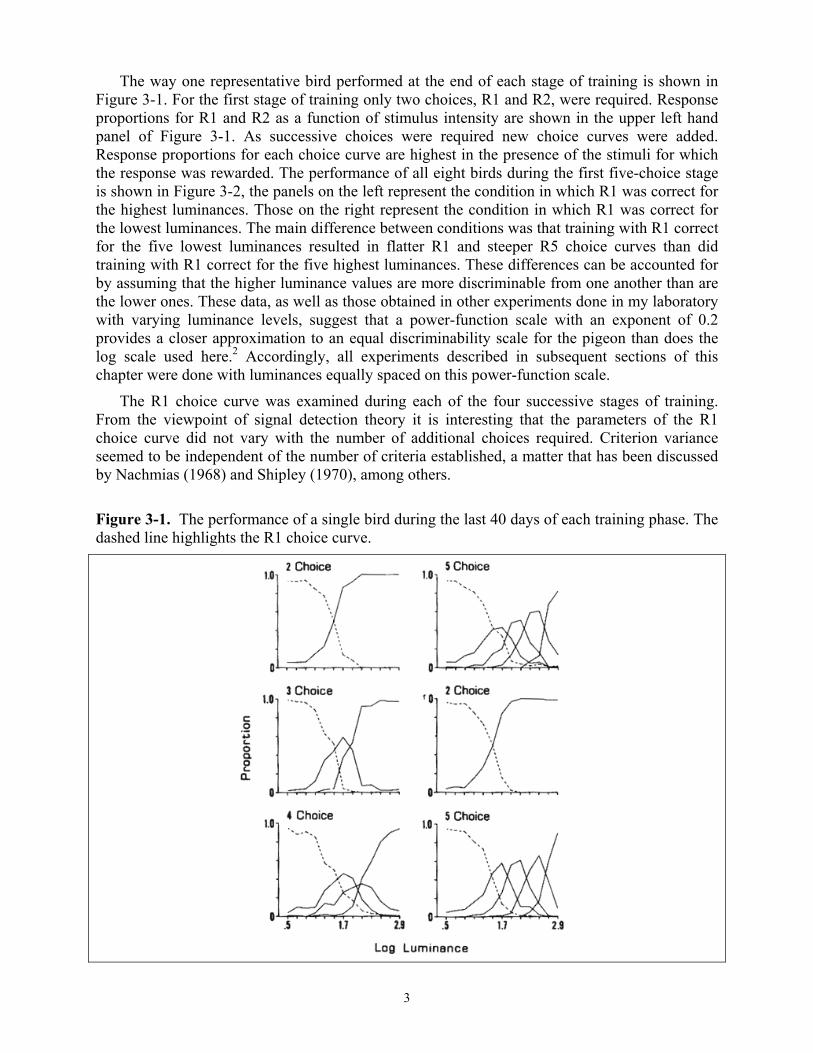
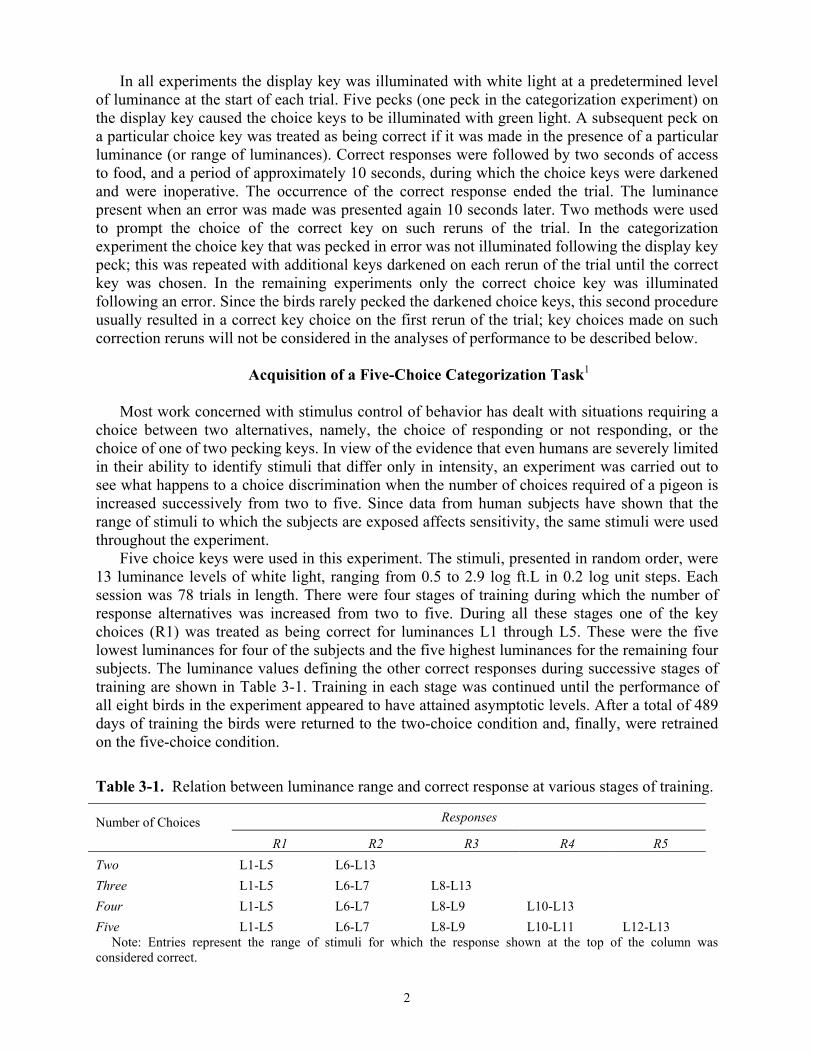
The way one representative bird performed at the end of each stage of training is shown in Figure 3-1. For the first stage of training only two choices, R1 and R2, were required. Response proportions for R1 and R2 as a function of stimulus intensity are shown in the upper left hand panel of Figure 3-1. As successive choices were required new choice curves were added. Response proportions for each choice curve are highest in the presence of the stimuli for which the response was rewarded. The performance of all eight birds during the first five-choice stage is shown in Figure 3-2, the panels on the left represent the condition in which R1 was correct for the highest luminances. Those on the right represent the condition in which R1 was correct for the lowest luminances. The main difference between conditions was that training with R1 correct for the five lowest luminances resulted in flatter R1 and steeper R5 choice curves than did training with R1 correct for the five highest luminances. These differences can be accounted for by assuming that the higher luminance values are more discriminable from one another than are the lower ones. These data, as well as those obtained in other experiments done in my laboratory with varying luminance levels, suggest that a power-function scale with an exponent of 0.2 provides a closer approximation to an equal discriminability scale for the pigeon than does the log scale used here.2 Accordingly, all experiments described in subsequent sections of this chapter were done with luminances equally spaced on this power-function scale.
The R1 choice curve was examined during each of the four successive stages of training. From the viewpoint of signal detection theory it is interesting that the parameters of the R1 choice curve did not vary with the number of additional choices required. Criterion variance seemed to be independent of the number of criteria established, a matter that has been discussed by Nachmias (1968) and Shipley (1970), among others.
Figure 3-1. The performance of a single bird during the last 40 days of each training phase. The dashed line highlights the R1 choice curve.
3
Figure 3-2. The performance of all eight birds during the last 40 days of five-choice training. The dashed line highlights the Rl choice curve.
The design of this experiment and the assumption that a five-choice categorization task is
very difficult for a pigeon to master dictated that the number of choices required of the pigeon be increased gradually, and that extensive training be given before each additional choice was added. A subsequent experiment showed that pigeons readily learn to classify luminances into as many as five categories if they are presented with this task from the outset. After only 15 to 20 sessions, the performance of three birds that were trained from the start on the five-choice task was roughly comparable to that of the birds whose performance is shown in the right-hand panel of Figure 3-2. The new group also had the five lowest luminances associated with R1. Though stimulus control over multiple responses emerges rapidly, performance may continue to improve slightly over as many as 150 days.
The Relation Between the Stimulus and Response Dimensions
In experiments in which human subjects are required to assign numbers to stimuli, the coding
is usually consistent with the natural ordering of the stimulus and response continua. Braida and Durlach (1972) used such an ordering for their experiments on absolute identification of sound intensities. They point out that “if the mapping prescribed by the experimenter between stimulus set and response set had ignored the natural ordering of these sets (so that, for example, the most intense stimulus was identified as 8, the second most intense as 1, the third most intense as 5, etc.), the sensitivity might have been reduced.” (p. 501). In our pigeon analogue of the absolute identification situation the pigeon identifies the stimuli by key position rather than by number. A natural ordering would be one in which there is a monotonic relationship between luminance and the position of the key defined as being correct.
4
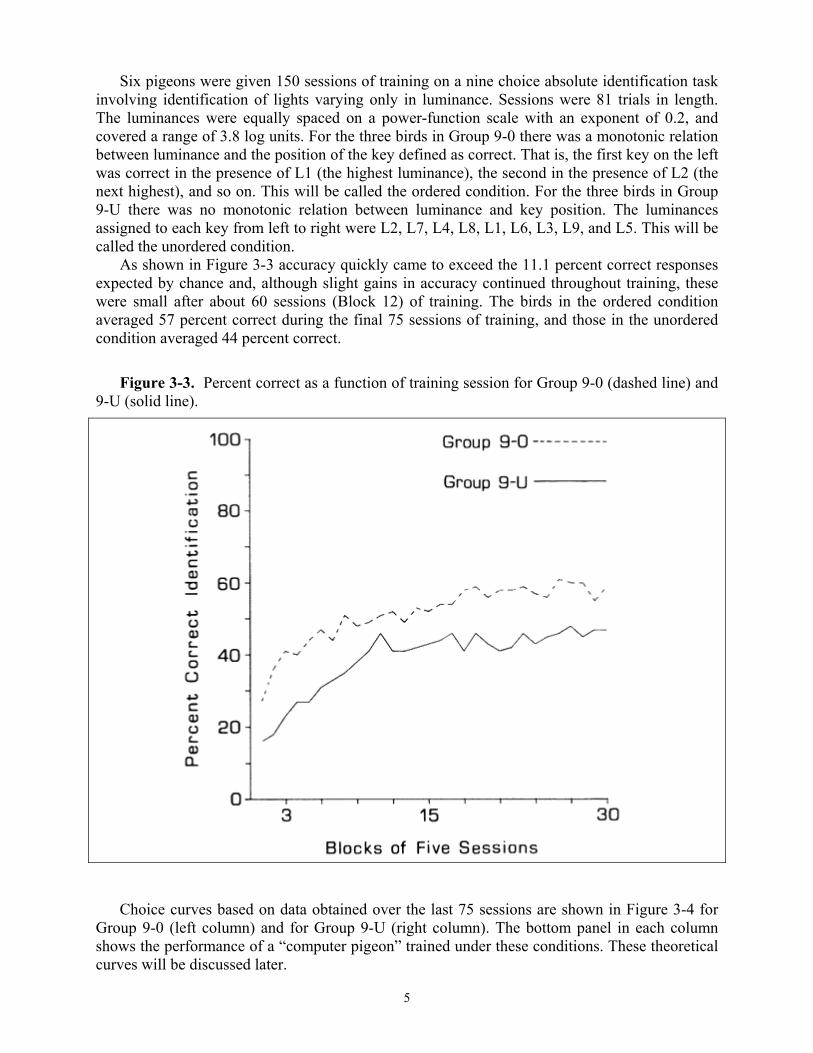
Six pigeons were given 150 sessions of training on a nine choice absolute identification task involving identification of lights varying only in luminance. Sessions were 81 trials in length. The luminances were equally spaced on a power-function scale with an exponent of 0.2, and covered a range of 3.8 log units. For the three birds in Group 9-0 there was a monotonic relation between luminance and the position of the key defined as correct. That is, the first key on the left was correct in the presence of L1 (the highest luminance), the second in the presence of L2 (the next highest), and so on. This will be called the ordered condition. For the three birds in Group 9-U there was no monotonic relation between luminance and key position. The luminances assigned to each key from left to right were L2, L7, L4, L8, L1, L6, L3, L9, and L5. This will be called the unordered condition.
As shown in Figure 3-3 accuracy quickly came to exceed the 11.1 percent correct responses expected by chance and, although slight gains in accuracy continued throughout training, these were small after about 60 sessions (Block 12) of training. The birds in the ordered condition averaged 57 percent correct during the final 75 sessions of training, and those in the unordered condition averaged 44 percent correct.
Figure 3-3. Percent correct as a function of training session for Group 9-0 (dashed line) and
9-U (solid line).
Choice curves based on data obtained over the last 75 sessions are shown in Figure 3-4 for
Group 9-0 (left column) and for Group 9-U (right column). The bottom panel in each column shows the performance of a “computer pigeon” trained under these conditions. These theoretical curves will be discussed later.
5
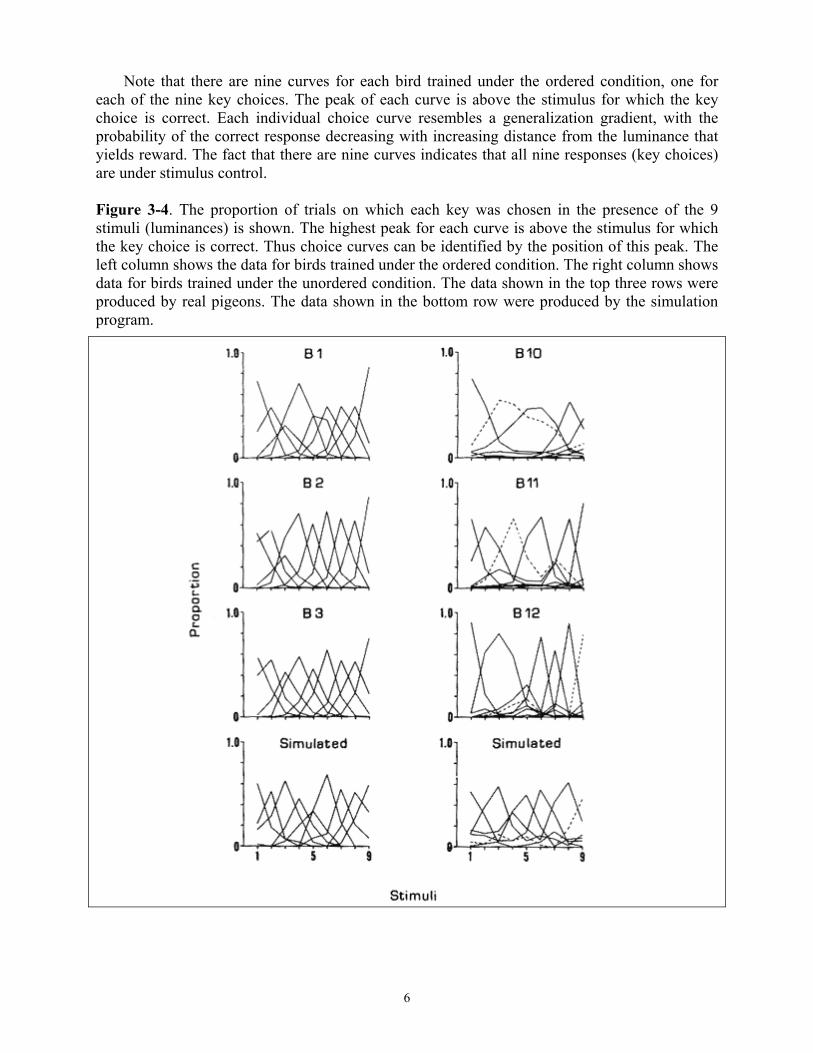
Note that there are nine curves for each bird trained under the ordered condition, one for each of the nine key choices. The peak of each curve is above the stimulus for which the key choice is correct. Each individual choice curve resembles a generalization gradient, with the probability of the correct response decreasing with increasing distance from the luminance that yields reward. The fact that there are nine curves indicates that all nine responses (key choices) are under stimulus control. Figure 3-4. The proportion of trials on which each key was chosen in the presence of the 9 stimuli (luminances) is shown. The highest peak for each curve is above the stimulus for which the key choice is correct. Thus choice curves can be identified by the position of this peak. The left column shows the data for birds trained under the ordered condition. The right column shows data for birds trained under the unordered condition. The data shown in the top three rows were produced by real pigeons. The data shown in the bottom row were produced by the simulation program.
6
The choice curves of the birds in the unordered group are less regular. These curves differ from those obtained under the ordered condition in two respects: (1) Some choice curves are missing entirely, for example, the curves R2, R4, R5, and R7 for Bird 10 (top right panel of Figure 3-4), and (2) some choice curves show a secondary peak (for each bird one such curve is highlighted in Figure 3-4 by use of a dashed line). The position of the secondary peak is not random — rather, it is at a luminance for which the correct choice is a key adjacent to the key for the choice curve being considered. Secondary peaks can be accounted for if it is assumed that discrimination among key positions is imperfect. Under the ordered condition, errors due to imperfect discrimination among the keys generally cannot be distinguished from those due to imperfect discrimination among the luminances. This is because both types of errors will lead to choices of adjacent, or near adjacent, keys.
Imperfect discrimination among the keys is responsible in part for the greater accuracy shown under the ordered condition. Most errors involve confusions among adjacent stimuli. Under the ordered condition, when an incorrect identification of the stimulus results in a decision to peck a key adjacent to the correct one, key confusion may accidentally lead to the choice of the correct key. This would not occur under the unordered condition.
The failure of birds trained under the unordered condition to make all nine choices probably also contributed to the poorer performance observed under this condition. Under the ordered condition the birds readily learned to choose all nine keys, and under the unordered condition certain keys were consistently ignored when all the choice keys were illuminated. Failure to choose certain keys could not be due to lack of training. This is because for 150 sessions the correction procedure required choice of each of the nine keys nine times each. What aspect of the ordered condition facilitates performance of the nine alternative absolute identification task?
In the situation studied here both the luminances and the key positions are points on continuous dimensions. The ordering of the values along each dimension is reflected in the fact that confusions are most frequent between adjacent luminances and adjacent key positions, and these drop off monotonically as distances on each of these continua increase. In this sense the situation studied here is not unlike many situations encountered beyond the laboratory, situations in which gradations in motor behavior are required in the presence of gradations in stimuli. Skinner (1953) suggested that the continuity in the stimulus control of motor behavior, such as that involved in the fine adjustments made in touching a spot in the visual field, may be acquired through experience with only limited examples of the relationship between such “continuous stimulus and response dimensions.” It is possible that under the ordered condition the pigeons learn the relationship between luminance and key position through training on only limited points of correspondence between these dimensions. If such a relationship were learned they should be capable of extrapolating to new instances. Learning a rule such as “peck further to the left as the brightness increases” may be responsible for the main difference between the ordered and unordered conditions.
In order to determine whether such rules were learned three additional pigeons were trained for 100 sessions under the ordered condition with only luminances L2, L3, L5, L7, and L8. In a test session, all nine stimuli were presented with reward available only in the presence of the five training stimuli. During this session the keys that were never associated with reward (the first. fourth. sixth and ninth keys) were chosen on about 10 percent of the trials. Training on five points of correspondence between the stimulus and response dimensions does not yield behavior identical to that following direct training on all nine points of correspondence (the novel keys were chosen less frequently than the other keys). But consideration of only those trials on which one of the novel keys was chosen provides clear evidence of extrapolation of the relationship present during training to these new instances. Averaged across birds and stimuli the appropriate
7
novel key was chosen on 77 percent of the trials on which the novel response was made.3 A theory that accounts for behavior such as that described here will be presented later.
Limits on the Pigeon’s Capacity to Process Information
Although pigeons are capable of making absolute identifications of at least nine luminances,
they do so with error. For nine stimuli identified without error information transmitted is 3.17 bits. Information transmitted by the birds trained under the ordered condition was only 1.73 bits. Under the unordered condition information transmitted was even less, 1.05 bits. In terms of number of stimuli identified without error this is equivalent to about 3.3 perfect identifications under the ordered condition and 2.1 under the unordered condition.
The number of identifications that can be made without error is limited by the discriminability of the stimuli as well as by the number of stimuli to be identified. Within a fixed range, the number of stimuli to be identified can be increased only by decreasing the separation between the stimuli. The purpose of the following experiments was to examine the effects of changes in number of stimuli to be identified and the accompanying changes in stimulus spacing on accuracy and information transmitted.
In these experiments the training conditions differed in only minor ways (the ordered condition used, the number of trials per session, and the number of sessions) from those in effect for the previous experiment. In all experiments the luminances were equally spaced according to the power-function scale. Luminances and required key choices were monotonically arranged. All birds were trained for 100 sessions of 100 trials each. The measures of percent correct and information transmitted for individual subjects shown in Table 3-2 are based on performance averaged across the final 25 training sessions. Groups are identified in this table by number of stimuli to be identified (3, 5, or 9) and by the luminance range (N= narrow (0.8 log units), M = moderate (1.8 log units), MW = moderately wide (3.0 log units), W = wide (3.8 log units)).
Comparison of Accuracy and Information Transmitted When Number of Stimuli Vary Within
a Fixed Range. Three groups of four pigeons each were trained with luminances covering the 3.8 log unit range used in the previous experiment. For all birds the left-most key was correct in the presence of the dimmest light, L9; the right-most key was correct for the brightest light. L1; and the center key was correct for L5. Group 3-W was trained with only these three luminances. Group 5-W was trained with these luminances as well as L3, for which the seventh key was correct, and L7, for which the third key was correct. Group 9-W was presented with all nine stimuli and was trained to choose among all nine keys.
8

Table 3-2. Percent correct (%) and information transmitted (IT) under various conditions.
THREE CHOICES FIVE CHOICES NINE CHOICES NARROW GROUP 3-N RANGE Bird % IT .8 19 67 .52 31 69 .58 40 80 .76 54 84 .97 MEAN 75 .71 MODERATE GROUP 3-M GROUP 5-M RANGE Bird % IT Bird % IT 1.8 4 86 1.31 7 85 1.63 8 91 1.35 18 60 1.03 15 95 1.40 24 64 1.14 30 96 1.50 35 46 .71 MEAN 92 1.39 MEAN 63.8 1.13 MODERATELY GROUP 5-MW GROUP 9-MW WIDE RANGE Bird % IT Bird % IT 3.0 41 85 1.76 42 48 1.55 46 81 1.86 45 57 1.74 50 79 1.78 49 47 1.50 MEAN 81.7 1.80 MEAN 50.7 1.60 WIDE GROUP 3-W GROUP 5-W GROUP 9-W RANGE Bird % IT Bird % IT Bird % IT 3.8 3 99 1.56 5 79 1.79 6 53 1.54 11 98 1.56 12 73 1.78 17 48 1.54 23 99 1.54 28 81 1.91 21 51 1.53 27 98 1.54 51 74 1.84 59 53 1.67 MEAN 98.5 1.55 MEAN 76.8 1.83 MEAN 51.2 1.57
Due to the virtually perfect performance of Group 3-W, information transmitted for this
group was close to the maximum possible for three equally likely alternatives. Increasing the potential for information transmission by increasing from three to five the number of luminances to be identified resulted in an increase in information transmitted from 1.55 to 1.83 bits, an increase that fell substantially below the 2.32 bits possible had the five luminances been identified with perfect accuracy. Further increases in the number of luminances to be identified to nine, the condition in effect for Group 9-W, resulted in a decrease in information transmitted to 1.57 bits. In fact, as measured by information transmitted, the performance of the birds trained with three luminances (Group 3-W) is equivalent to that of Group 9-W. An analysis of variance showed information transmitted for Group 5-W to be significantly higher than that for either Groups 3-W or 9-W (F = 35.9. df = 2, 9, p < .001). This increase in information transmitted, followed by a decrease as the number of stimuli to be identified within a fixed range is increased, is reminiscent of data obtained by Garner (1953) for absolute identification of sound intensities by human observers.
Comparison of Accuracy When Only Stimulus Spacing is Varied. In the above experiment
number of choices and stimulus spacing covaried: as the number of stimuli was increased, luminance and key spacing decreased. In order to examine the effects of luminance and key spacing so that they are unconfounded with number of choices, the performance of the birds in Group 3-W was compared to that of four pigeons trained with the luminances equally spaced
9

within a 1.8 log unit range (Group 3-M). It was also compared to that of four pigeons trained with the luminances equally spaced within a 0.8 log unit range (Group 3-N). Group 3-M was trained with L3, L5 and L7. Group 3-N was trained with L4, L5, and L6. The data shown in Table 3-2 indicate that, as stimulus spacing is increased, both percent correct and information transmitted increase. These differences in both percent correct (F = 19.71. df = 2 and 9, p = .001) and information transmitted (F = 50.16, df = 2 and 9, p < .001) are significant.
Comparison of Accuracy When the Stimulus Range is Varied. The significant increase in the
accuracy with which three equally spaced stimuli are identified as the distance between adjacent stimuli is increased suggests that more information might have been transmitted under the nine choice condition if the stimuli had been further apart. Since the 3.8 log unit range used in these experiments could not be extended, three pigeons (Group 9-MW) were trained with nine equally spaced luminances within a 3.0 log unit range. In all other respects the conditions in effect for Group 9-MW were identical to those of Group 9-W. the results showed that spacing of the stimuli over a 3.0 or a 3.8 log unit range made no difference. Both groups averaged 51 percent correct.
In order to examine further the manner in which stimulus range affects performance, a group of three pigeons (Group 5-MW) was trained to identify five stimuli equally spaced within the 3.0 log unit range. The training conditions for this group were identical to those of Group 5-W. Again the wider spacing did not improve performance, in fact, Group 5-MW averaged 82 percent correct while Group 5-W averaged 77 percent correct.
These data, coupled with the three-choice data described above, suggest that, while increasing stimulus spacing when the stimuli are close together increases accuracy, such gains in accuracy level off as spacing is further increased. The leveling off of gains in accuracy as the separation between a fixed number of equally spaced stimuli is increased is called the range effect. It is well documented in the human literature (e.g. Braida and Durlach. 1972). The data discussed above suggest that pigeons also are susceptible to the range effect.
These experiments were not designed to provide a comparison between absolute identification by pigeons and humans and are not extensive enough to provide information about the best possible performance obtainable from pigeons. They suggest, however, that the pigeon, like the human, is severely limited in its ability to identify stimuli varying along a single dimension. Summarizing the data available in 1956. Miller noted that channel capacity for humans varies from 1.6 bits for curvature of a line to 3.9 bits for positions in an interval. Pigeons identifying lights that vary only in luminance perform at the low end of this range. Although performance may be improved somewhat by using stimuli that vary along a different dimension, or by further training, or by eliminating confusions among the response manipulanda, it is still unlikely that pigeons will perform quite as well as humans on absolute identification tasks.
The next section describes a model that accounts for performance in the absolute identification situations described here and provides an explanation for the limitations in the accuracy of absolute identifications.
THEORETICAL CONSIDERATIONS
The theoretical account of absolute identification performance presented in this section is
based on the model presented by Heinemann (1983a). According to that model, information gathered on each trial is assumed to be placed in a limited capacity memory (LCM). According to estimates made by Heinemann, the pigeon’s LCM has approximately 1200 storage locations. Each storage location can hold a record that shows the response made, the discriminative stimulus that was present when the response was made, and whether or not reward was received.
10

One such three-part record is entered into LCM on every trial. Each newly entered record goes to a randomly selected location arid destroys the record that previously occupied that location. On each trial the subject retrieves from LCM an independent sample of records. Only those records indicating that reward was received are used in the decision process. The choice of response is based solely on the information contained in this sample. The size of the sample (number of records), denoted θ, varies somewhat from subject to subject. According to Heinemann, θ = 7 +5.
It is assumed that over repeated presentations, the various stimuli used in experiments on absolute identification induce sensory effects that are normally distributed with means, µl, µ2… µn, and with the common standard deviation σ.
The sensory effect experienced on each trial is stored in the LCM. The version of the model developed here differs from that presented by Heinemann (1983a) in the way the response selection process is treated. Instead of treating the representation of responses in memory as labels, such as R1, R2, and so on, responses are assumed to be represented in memory by the visual (and other) stimulation received when a particular key was pecked. These sensory effects will be referred to as effects of position. They undoubtedly vary along numerous dimensions. One of the dimensions might be thought of, for example, as the visual distance between the key pecked and a particular landmark such as the vertical sides of the response panel. In what follows, the sensory effects of position will be represented as unidimensional, and normally distributed with means corresponding to the center of each key.
The difference in the values of the means of the sensory effect distributions produced by different luminances, d′L, or positions of the response keys, d′P, depends on the physical distance between the stimuli (e.g., the difference in luminance, the distance between the keys) as well as on the sensitivity of the pigeon to these differences. In the treatment of the data, distances between the means of the sensory effect distributions are expressed in terms of normal deviates, z-score units.
The details of the postulated response selection process are represented in Figure 3-5. The illustration shows a sample of three records. The horizontal axis, ZL, represents the sensory effects of key positions. The vertical axis, ZP, represents the sensory effects of luminance. The normal distributions shown on the horizontal axis represent three remembered key positions. Those on the vertical axis represent the remembered luminance levels present when these positions were approached prior to reward. The concentric circles shown in the interior of the figure represent equal probability density contours for the joint remembered effects of position and luminances.
The sensory effect induced by the display key luminance on a particular trial will be referred to as the current input for luminance, IL. The current input induced by the position continuum is under the control of the pigeon. It is assumed that the pigeon looks at each of the keys and thus presents itself with as many current inputs for position IKi (i = 1, 2,… n) as there are keys.
The points A. B, and C in Figure 3-5 represent the joint current inputs for luminance, IL, and each of the keys checked by the pigeon, IKi. It is assumed that the pigeon chooses the response that is most likely to yield reward on the basis of the evidence provided by the records in the sample. To accomplish this, the bird compares the sums of the probability densities at each of the three joint inputs (A, B, and C) and then approaches that position for which the probability density is highest, in this case key 3. Appendix A provides a numerical illustration of the decision process.
11
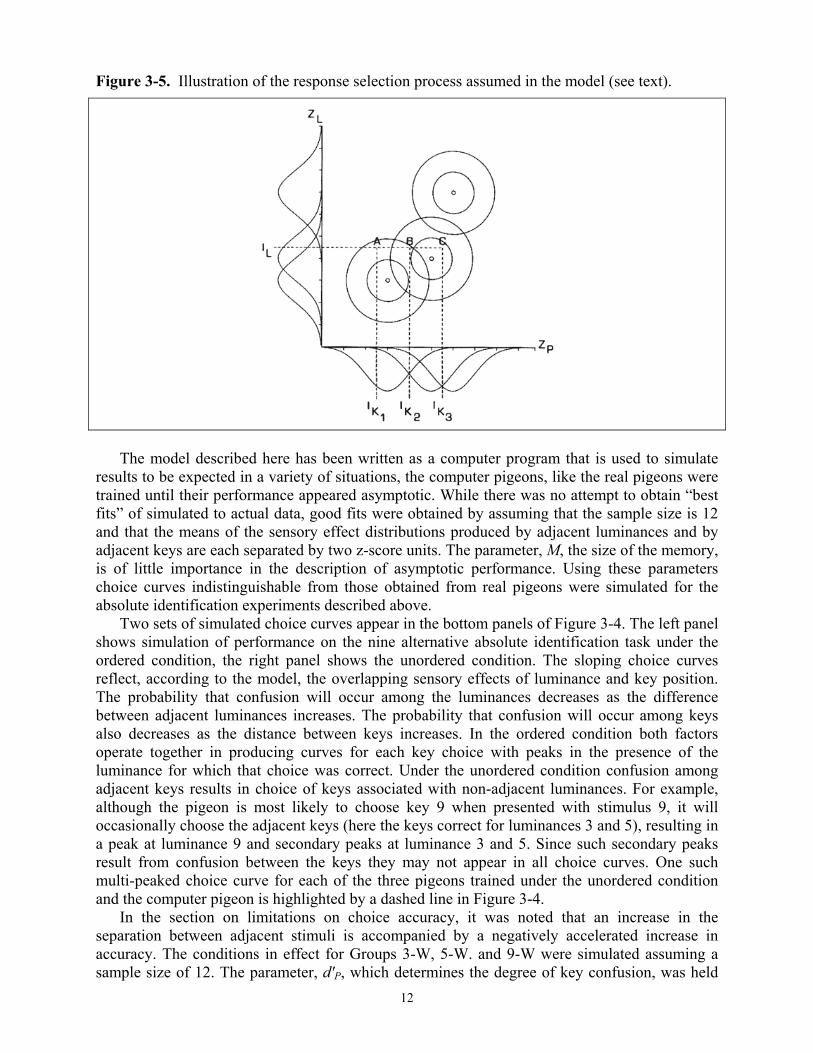
Figure 3-5. Illustration of the response selection process assumed in the model (see text).
The model described here has been written as a computer program that is used to simulate results to be expected in a variety of situations, the computer pigeons, like the real pigeons were trained until their performance appeared asymptotic. While there was no attempt to obtain “best fits” of simulated to actual data, good fits were obtained by assuming that the sample size is 12 and that the means of the sensory effect distributions produced by adjacent luminances and by adjacent keys are each separated by two z-score units. The parameter, M, the size of the memory, is of little importance in the description of asymptotic performance. Using these parameters choice curves indistinguishable from those obtained from real pigeons were simulated for the absolute identification experiments described above.
Two sets of simulated choice curves appear in the bottom panels of Figure 3-4. The left panel shows simulation of performance on the nine alternative absolute identification task under the ordered condition, the right panel shows the unordered condition. The sloping choice curves reflect, according to the model, the overlapping sensory effects of luminance and key position. The probability that confusion will occur among the luminances decreases as the difference between adjacent luminances increases. The probability that confusion will occur among keys also decreases as the distance between keys increases. In the ordered condition both factors operate together in producing curves for each key choice with peaks in the presence of the luminance for which that choice was correct. Under the unordered condition confusion among adjacent keys results in choice of keys associated with non-adjacent luminances. For example, although the pigeon is most likely to choose key 9 when presented with stimulus 9, it will occasionally choose the adjacent keys (here the keys correct for luminances 3 and 5), resulting in a peak at luminance 9 and secondary peaks at luminance 3 and 5. Since such secondary peaks result from confusion between the keys they may not appear in all choice curves. One such multi-peaked choice curve for each of the three pigeons trained under the unordered condition and the computer pigeon is highlighted by a dashed line in Figure 3-4.
In the section on limitations on choice accuracy, it was noted that an increase in the separation between adjacent stimuli is accompanied by a negatively accelerated increase in accuracy. The conditions in effect for Groups 3-W, 5-W. and 9-W were simulated assuming a sample size of 12. The parameter, d′P, which determines the degree of key confusion, was held
12

constant. In these simulations d′P for adjacent keys was set at two (a two z-score unit separation between the means of the sensory effect distributions produced by adjacent keys). The effect on information transmitted of increases in the distance between the means of sensory effect distributions produced by adjacent luminance is shown in Figure 3-6.
Figure 3-6. Information transmitted as a function of the distance between the means of adjacent luminance distributions. The curve labeled 3 refers to simulations of the conditions in effect for Group 3-W, 5 to Group 5-W, and 9 to Group 9-W. In these simulations θ = 12 and d′P = 2.
As the distance between the means of the adjacent luminance distributions, d’L, increases,
information transmitted levels off. Three factors determine the value of d’L at which this leveling off occurs: (1) the number of choices, (2) the degree of key confusion, (3) the size of the sample upon which judgments are based. Asymptotic levels of information transmitted shown by both the real and computer pigeons in Group 3-W approach the maximum possible for three equally likely alternatives. This reflects the nearly perfect performance obtained when three widely separated luminances are presented for identification. Perfect performance was never obtained with five or nine stimuli even at the widest possible separation among adjacent luminances. The simulations in Figure 3-6 show that asymptotic performance under the conditions in effect for Groups 5-W and 9-W is a function of two sources of error that remain even when the sensory effects produced by adjacent luminances no longer overlap. These are the effects of key confusion and limited sample size. In the present experiments the effects of key confusion were relatively small and had only a trivial effect on information transmitted. The effects of sample size will be considered next.
13

For a given degree of overlap in the sensory effects induced by the stimuli and key positions, accuracy decreases as sample size decreases. Moreover, for a fixed sample size, as the number of choices (stimuli to be identified) increases, each choice is represented in the sample by fewer records. This, too, increases the probability of an error. For a sample size of 12, five choices will be represented on the average by 2.4 records each, 9 choices by 1.3. Note that information transmitted was higher for Group 5-W than for Group 9-W in the actual experiments as well as in the simulations reported in Figure 3-6. According to the model this reflects the effects on accuracy of number of records representing each response. These simulations, as well as the range effect data, suggest that overlap in the sensory effects produced by adjacent luminances in the wide range conditions was not the main factor responsible for the errors observed. In the simulations (see Figure 3-6) near asymptotic levels of information transmitted were obtained with the means of the sensory effect distributions produced by adjacent luminances separated by two z-scores, a value that provided good fits for all the absolute identification data reported here.
The sample size of 12 used in these simulations is not arbitrary. Smaller sample sizes yielded choice curves that were clearly flatter than those shown by the pigeons: larger values yielded curves that were clearly steeper. In his theoretical account of decision processes in pigeons, Heinemann (1983a) has also shown that it is necessary to assume that the pigeon has access to only a limited number of records of past events. While sample size may vary somewhat under different experimental conditions, decisions appear to be based on only a small sample of records of past events.
Figure 3-7 shows information transmitted as a function of input information for the three groups trained on the wide range. The dashed diagonal line shows the relationship between information transmitted and number of choices given perfect performance. The solid curve shows the results predicted by the model. This theoretical curve was obtained from the simulations shown in Figure 3-6 for a two z-score unit separation between the means of the sensory effect distributions produced by adjacent luminances.
Figure 3-7. Information transmitted as a function of number of alternatives (input information) in the absolute identification task. The dashed line indicates perfect performance. The solid line represents the prediction of the model for the fixed-range condition. Circles show the results obtained from real pigeons.
14

The first point on the curve (3 choices) represents virtually perfect performance. As noted
above this is possible because the luminances were very widely separated, and the number of stimuli to be identified is small enough, relative to the sample size so that each response is reasonably well represented in the sample. As the number of choices is increased, each response is represented by fewer records. As mentioned above both theory and data show that information transmitted on the five choice absolute identification task is greater than for nine choices.
This fixed-range curve is very similar to the curves that led Miller (1956) to talk of “channel capacity.” If one considers the limiting effects of sample size it is little wonder that the theoretical curve levels off well below the dashed line that represents perfect performance. The “magical number” for the pigeon seems to be somewhat less than four, a number less magical if one considers that in making absolute identifications one may have access to only a limited sample of past sensory events.
ACKNOWLEDGEMENTS This article is reproduced from the book with some minor changes, e.g. in formatting and in references to other chapters in the book. The research reported here was supported by National Science Foundation Grant Number BNS-79241070, and Grants 10104,11510E, and 12230 from the Research Foundation of the City University of New York
APPENDIX A
Figure 3-5 represents a concrete illustration of the decision process. Here only three records of previously rewarded outcomes are available for determining which key should be pecked given that the display key has the luminance IL. If distances between the tick-marks on the ZL and ZP axes of Figure 3-5 each represent one z–score, the decision process may be numerically illustrated as follows:
Probability densities (P) at “inputs” IL, IK1, IK2, and IK3, are obtained for each of the three records. These densities along with the distance in z-scores between the inputs, and the means of each of the marginal distributions µLi and µKi) are given in Table 3-3.
The probability density for each record at points A, B, and C is the product of the marginal densities at the coordinates of these points. These are given in the last column of Table 3-3.
The sum of the probability densities at each of the three points is obtained and compared. The choice made is the one for which the sum is highest. In this illustration this is the density associated with point C. Key 3, is chosen.
15

Table 3-3. Illustration of the decision process.
Distance Distance IL – µLi
PIL IK1
– µKi PIK1
P at Point A
Record 1 1.5 .1295 0.5 .3521 .0456 Record 2 0.5 .3521 2.5 .0175 .0062 Record 3 2.5 .0175 3.5 .0009 .0000 Sum = .0518 IL – µLi
PIL IK2
– µKi PIK2
P at Point B
Record 1 1.5 .1295 1.0 .2420 .0313 Record 2 0.5 .3521 1.0 .2420 .0852 Record 3 2.5 .0175 2.0 .0540 .0009 Sum = .1174 IL – µLi
PIL IK3
– µKi PIK3
P at Point C
Record 1 1.5 .1295 2.5 .0175 .0023 Record 2 0.5 .3521 .5 .3521 .1240 Record 3 2.5 .0175 .5 .3521 .0062 Sum = .1325
Note: In this table Records 1, 2 and 3 refer to the three distributions shown in Figure 3-5. The number assigned to each record refers to its ordinal position with respect to the origin.
REFERENCES
Berliner, J.E., Durlach, N. E., & Braida, L.D. (1978). Intensity Perception IX. Effect of a
fixed standard on resolution in identification. Journal of the Acoustical Society of America 64: 687-89.
Boakes, R.A. (1969). The bisection of a brightness interval by pigeons. Journal of the Experimental Analysis of Behavior 12 : 201-209.
Braida, L.D., & Durlach, N. I. (1972). Intensity perception. II. Resolution in one interval paradigms. Journal of the Acoustical Society of America, 51: 783-802.
Chase, S., Geller, E. A. & Hendry, J. S. (1974). On the establishment of a continuous repertoire. Bulletin of the Psychonomic Society 4: 14-16.
Cumming, W.W., & Eckerman, D.A. (1965). Stimulus control of a differentiated operant. Psychonomic Science 3: 313-14.
Durlach, N.I., & Braida, L.D. (1969). Intensity perception. I. Preliminary theory of intensity resolution. Journal of the Acoustical Society of America 46: 372-83.
Eckerman, D.A. (1970). Generalization and response mediation of a conditional discrimination. Journal of the Experimental Analysis of Behavior 13: 301-16.
Garner, W. R. (1953). An informational analysis of absolute judgments of loudness. Journal of Experimenta1 Psychology 46: 373-80.
Heinemann, E. G. (1983a). A memory model for decision processes in pigeons. In M. L. Commons, R. J. Herrnstein and A. R. Wagner (Eds.). Quantitative Analyses of Behavior: Discrimination Processes. Cambridge: Ballinger.
Heinemann, E. G. (1983b). The presolution period and detection of statistical associations. In M. L. Commons, R. J. Herrnstein and A. R. Wagner (Eds.). Quantitative Analyses of Behavior: Discrimination Processes. Cambridge: Ballinger.
16
Miller, G.A. (1956). The magical number seven, plus or minus two: Some limits on our capacity for processing information. Psychological Review 63: 81-97.
Nachmias, J. (1968). Effects of presentation probability and number of response alternatives on simple visual detection. Perception and Psychophysics 3: 151-55.
Pollack, I. (1952). The information of elementary auditory displays. Journal of the Acoustical Society of America 24: 745-49.
Purks, S.R., Callahan, D.J., Braida, L. D. & Durlach, N.I. (1980). Intensity perception X. Effect of preceding stimulus on identification performance. Journal of the Acoustical Society of America 67: 634-37.
Shipley, E.F. (1970). A signal detection theory analysis of a category judgment experiment. Perception and Psychophysics 7: 38-42.
Skinner, B.F. (1953). Science and Human Behavior. New York: MacMillan. Wildemann, D.G., & Holland, J. G. (1972). Control of a continuous response dimension by a
continuous stimulus dimension. Journal of the Experimental Analysis of Behavior 18: 419-34.
NOTES TO CHAPTER 3
1 The results of this experiment were first presented at the 1977 meeting of the Psychonomic
Society. 2 Boakes (1969), found that pigeons tend to bisect brightness intervals on the brighter side of
the geometric mean. His work suggested that a power function scale with an exponent of 0.24 is appropriate for dealing with bisection data obtained from pigeons.
3. Previous attempts to demonstrate that training on limited points of correspondence between a continuous stimulus and a continuous response dimension will lead to continuous control over response position have not been successful with luminance (Cumming and Eckerman, 1965) or tonal frequency (Wildemann and Holland, 1972) as the stimulus dimensions. Eckerman (1970), however, obtained some evidence of control over response position by wavelength and Chase, Geller, and Hendry (1974) found that pigeons readily learn to extrapolate the relationship demonstrated in training to new instances when the position of a spot of light determines which key is correct.
17