Embed Size (px)
Citation preview
Pigeon CorporationPigeon Corporation
June 8, 2010
Akio OkoshiPresident and Chief Operating Officer
(Securities code: 7956)
2
The Pigeon GroupThe Pigeon Group
3
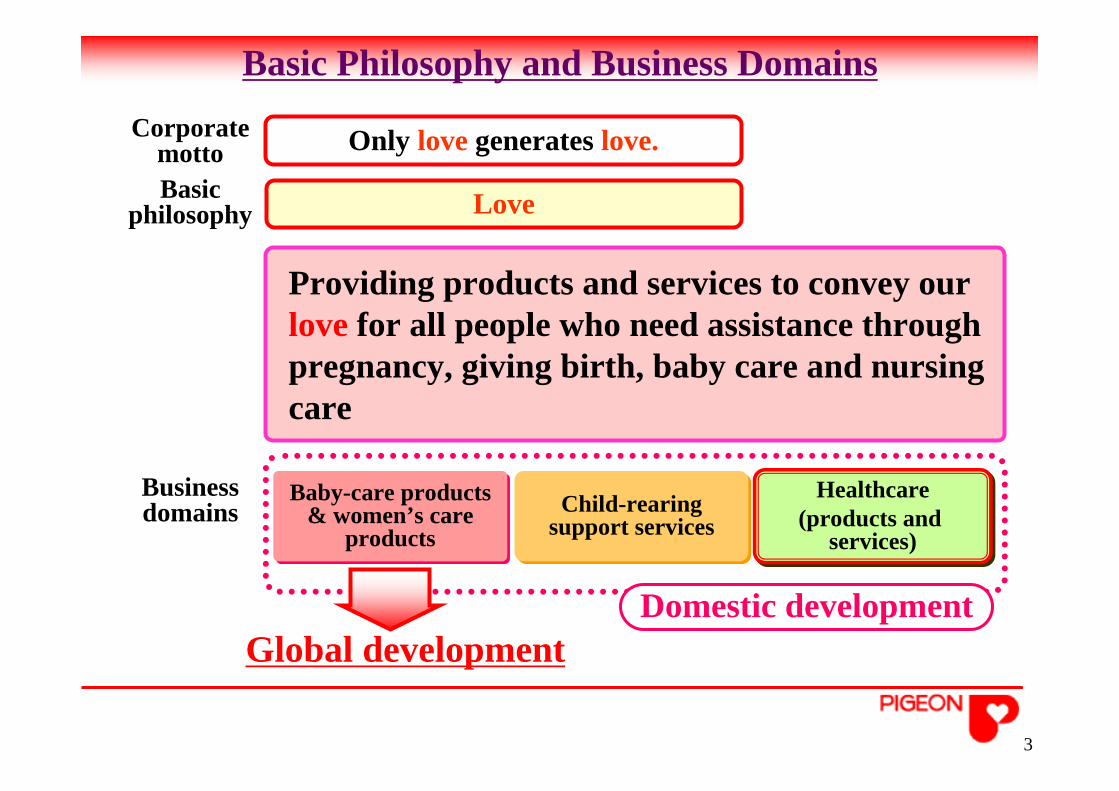
Basic Philosophy and Business Domains
Love
Only love generates love.Corporate motto
Providing products and services to convey our love for all people who need assistance through pregnancy, giving birth, baby care and nursing care
Basic philosophy
Child-rearing support servicesChild-rearing
support servicesBaby-care products
& women’s care products
Baby-care products & women’s care
products
Domestic developmentGlobal development
Healthcare(products and
services)
Healthcare(products and
services)
Business domains
4
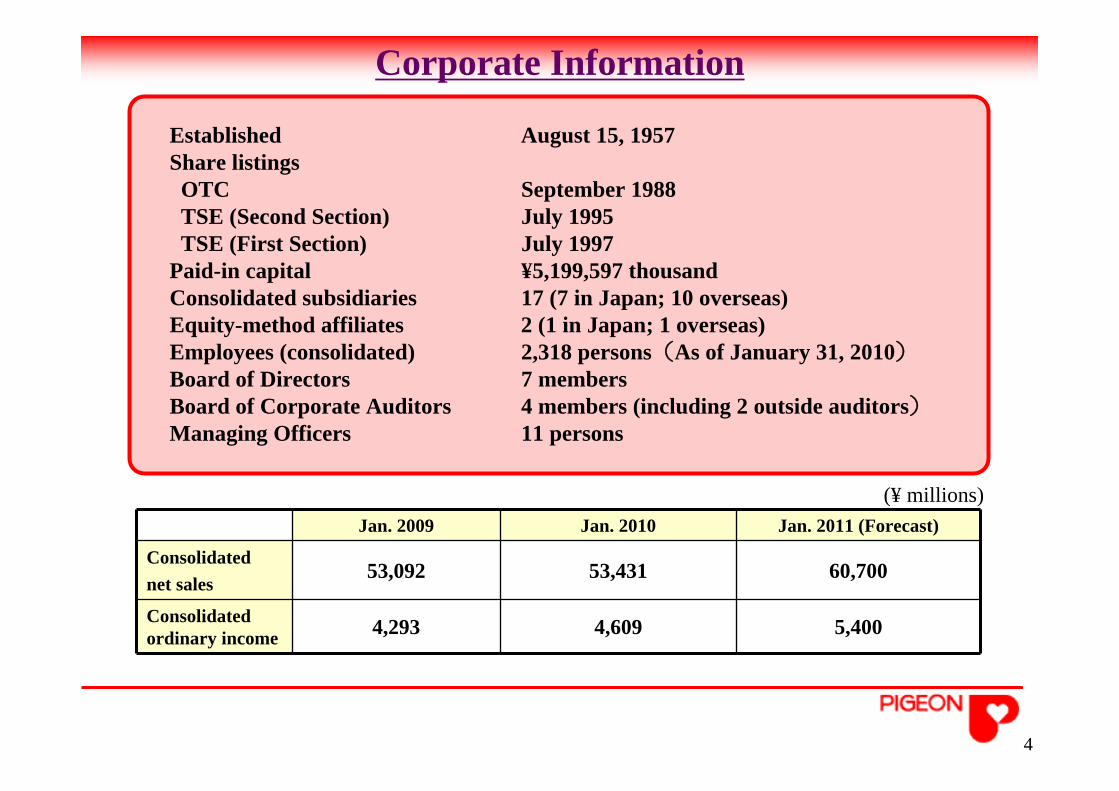
Corporate Information
Jan. 2009 Jan. 2010 Jan. 2011 (Forecast)
Consolidated net sales
53,092 53,431 60,700
Consolidated ordinary income 4,293 4,609 5,400
Established August 15, 1957Share listings OTC September 1988TSE (Second Section) July 1995 TSE (First Section) July 1997
Paid-in capital ¥5,199,597 thousandConsolidated subsidiaries 17 (7 in Japan; 10 overseas)Equity-method affiliates 2 (1 in Japan; 1 overseas)Employees (consolidated) 2,318 persons(As of January 31, 2010)Board of Directors 7 membersBoard of Corporate Auditors 4 members (including 2 outside auditors)Managing Officers 11 persons
(¥ millions)
PIGEON CORPORATION●札幌営業所
●仙台支店
●筑波事業所●中央研究所
●ピジョン本社ピジョンハーツピジョンウィル
●福岡支店
●広島支店●大阪支店
●名古屋支店
●金沢営業所
●PHP兵庫
●ピジョンホームプロダクツ
●PHP茨城
●ピジョン真中ピジョンタヒラ●
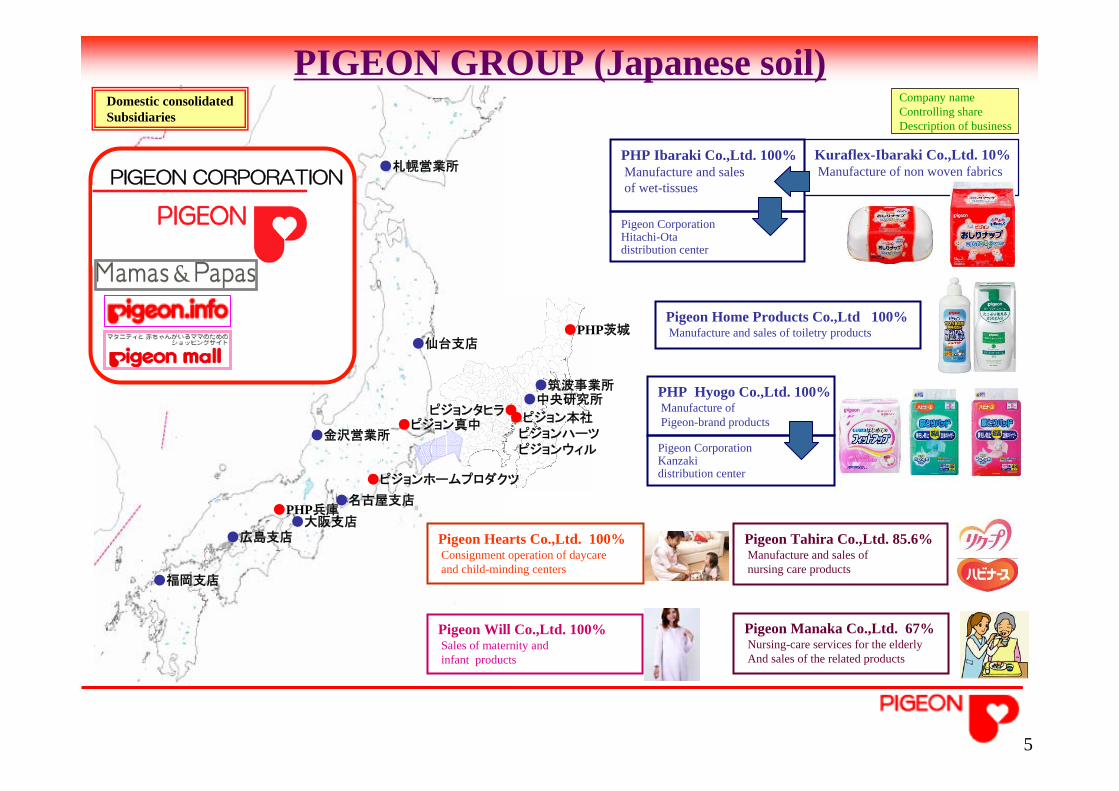
Domestic consolidatedSubsidiaries
Pigeon Hearts Co.,Ltd. 100%Consignment operation of daycare and child-minding centers
Pigeon Will Co.,Ltd. 100%Sales of maternity andinfant products
Pigeon Tahira Co.,Ltd. 85.6%Manufacture and sales of nursing care products
Pigeon Manaka Co.,Ltd. 67%Nursing-care services for the elderlyAnd sales of the related products
PHP Hyogo Co.,Ltd. 100%Manufacture of Pigeon-brand products
Pigeon CorporationKanzakidistribution center
Pigeon Home Products Co.,Ltd 100%Manufacture and sales of toiletry products
PHP Ibaraki Co.,Ltd. 100%Manufacture and salesof wet-tissues
Pigeon CorporationHitachi-Ota distribution center
Kuraflex-Ibaraki Co.,Ltd. 10%Manufacture of non woven fabrics
As of Jan.31, 2010PIGEON GROUP (Japanese soil)
5
Company nameControlling shareDescription of business
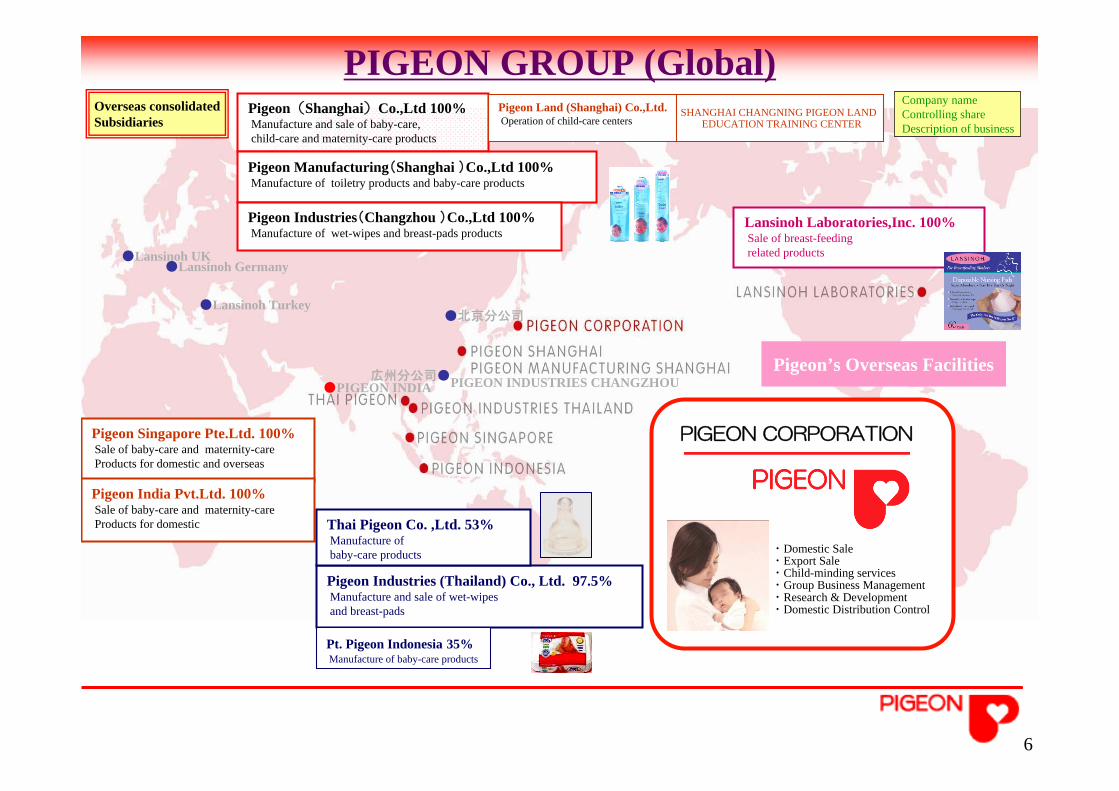
As of Jan.31, 2010
SHANGHAI CHANGNING PIGEON LAND EDUCATION TRAINING CENTER
●PIGEON INDIA PIGEON INDUSTRIES CHANGZHOU
●北京分公司
広州分公司●
●Lansinoh UK●Lansinoh Germany
●Lansinoh Turkey
Overseas consolidatedSubsidiaries
Pigeon’s Overseas Facilities
PIGEON CORPORATION
・Domestic Sale・Export Sale・Child-minding services・Group Business Management・Research & Development ・Domestic Distribution Control
Lansinoh Laboratories,Inc. 100%Sale of breast-feeding related products
Pigeon Singapore Pte.Ltd. 100%Sale of baby-care and maternity-care Products for domestic and overseas
Pigeon India Pvt.Ltd. 100%Sale of baby-care and maternity-care Products for domestic
Pigeon Industries (Thailand) Co., Ltd. 97.5%Manufacture and sale of wet-wipes and breast-pads
Thai Pigeon Co. ,Ltd. 53%Manufacture of baby-care products
Pt. Pigeon Indonesia 35%Manufacture of baby-care products
Pigeon(Shanghai)Co.,Ltd 100%Manufacture and sale of baby-care, child-care and maternity-care products
Pigeon Manufacturing(Shanghai )Co.,Ltd 100%Manufacture of toiletry products and baby-care products
Pigeon Industries(Changzhou )Co.,Ltd 100%Manufacture of wet-wipes and breast-pads products
Pigeon Land (Shanghai) Co.,Ltd.Operation of child-care centers
PIGEON GROUP (Global)Company nameControlling shareDescription of business
6
7
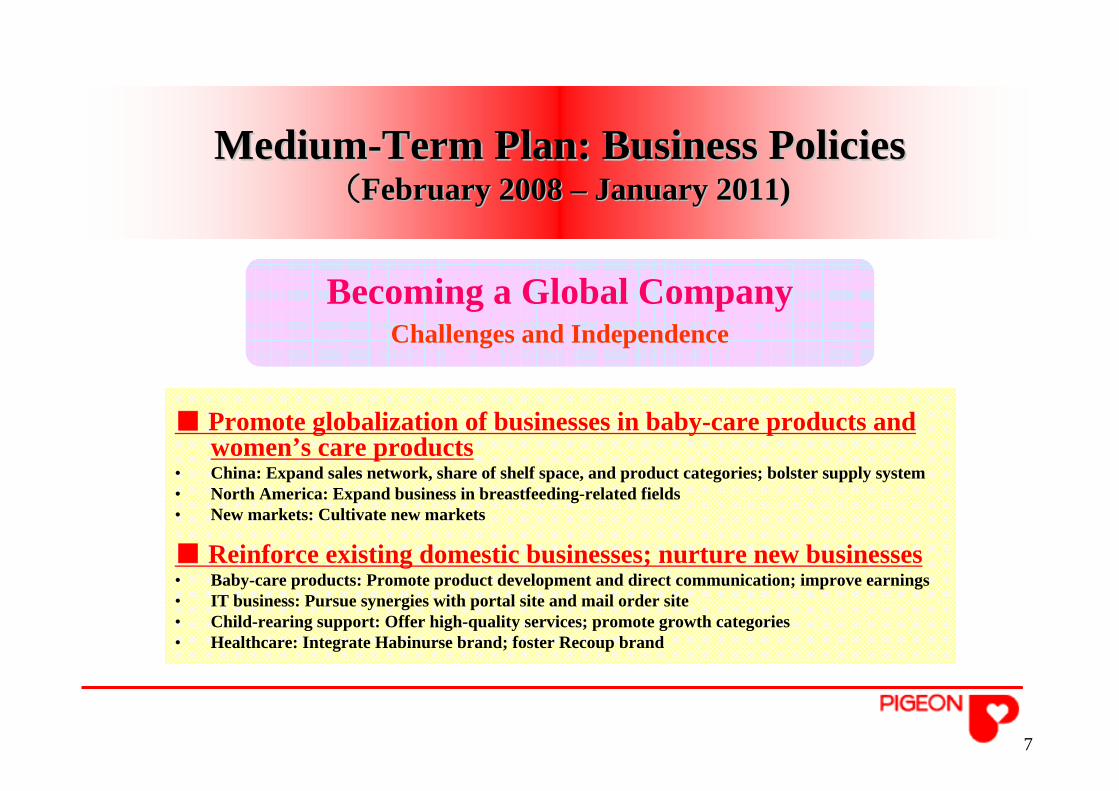
MediumMedium--Term Plan: Business PoliciesTerm Plan: Business Policies((February 2008 February 2008 –– January 2011)January 2011)
■ Promote globalization of businesses in baby-care products and women’s care products
• China: Expand sales network, share of shelf space, and product categories; bolster supply system• North America: Expand business in breastfeeding-related fields• New markets: Cultivate new markets
■ Reinforce existing domestic businesses; nurture new businesses• Baby-care products: Promote product development and direct communication; improve earnings• IT business: Pursue synergies with portal site and mail order site• Child-rearing support: Offer high-quality services; promote growth categories• Healthcare: Integrate Habinurse brand; foster Recoup brand
Becoming a Global CompanyChallenges and Independence
Becoming a Global CompanyChallenges and Independence
8
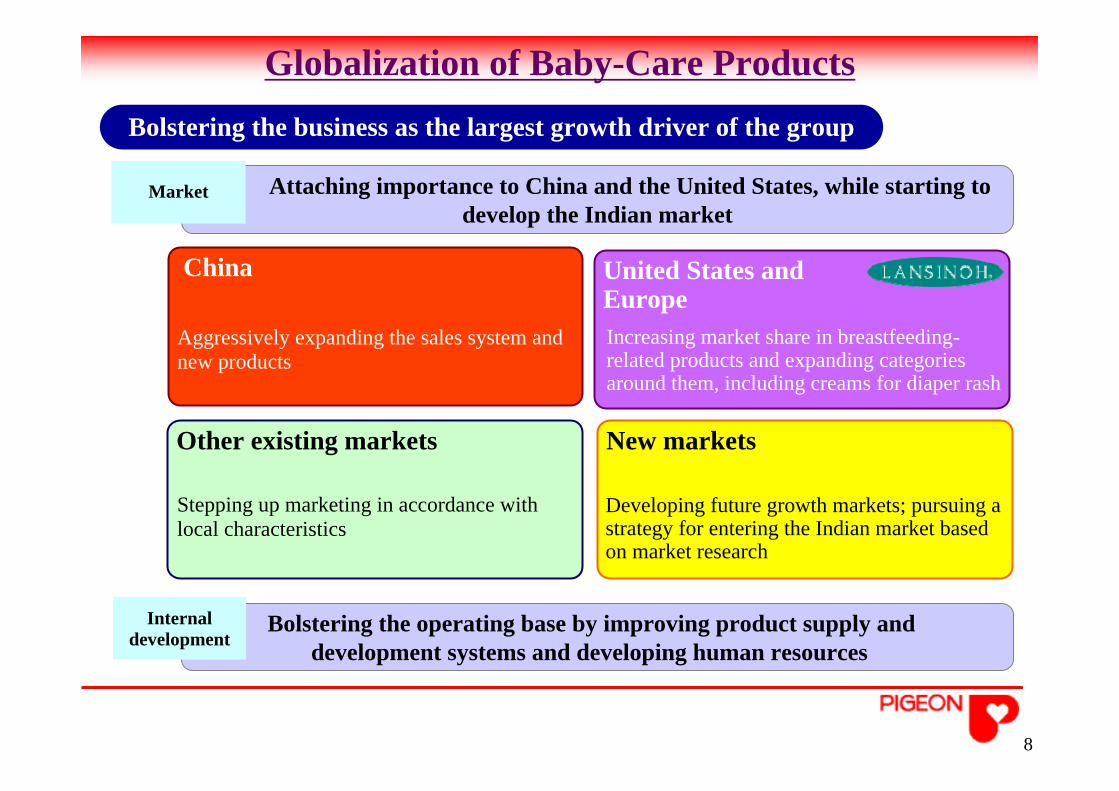
Globalization of Baby-Care Products
Attaching importance to China and the United States, while starting to develop the Indian market
Bolstering the operating base by improving product supply and development systems and developing human resources
China
New markets
Market
Internal development
Bolstering the business as the largest growth driver of the group
Aggressively expanding the sales system and new products
Other existing markets
Stepping up marketing in accordance with local characteristics
Developing future growth markets; pursuing a strategy for entering the Indian market based on market research
United States and EuropeIncreasing market share in breastfeeding-related products and expanding categories around them, including creams for diaper rash
9
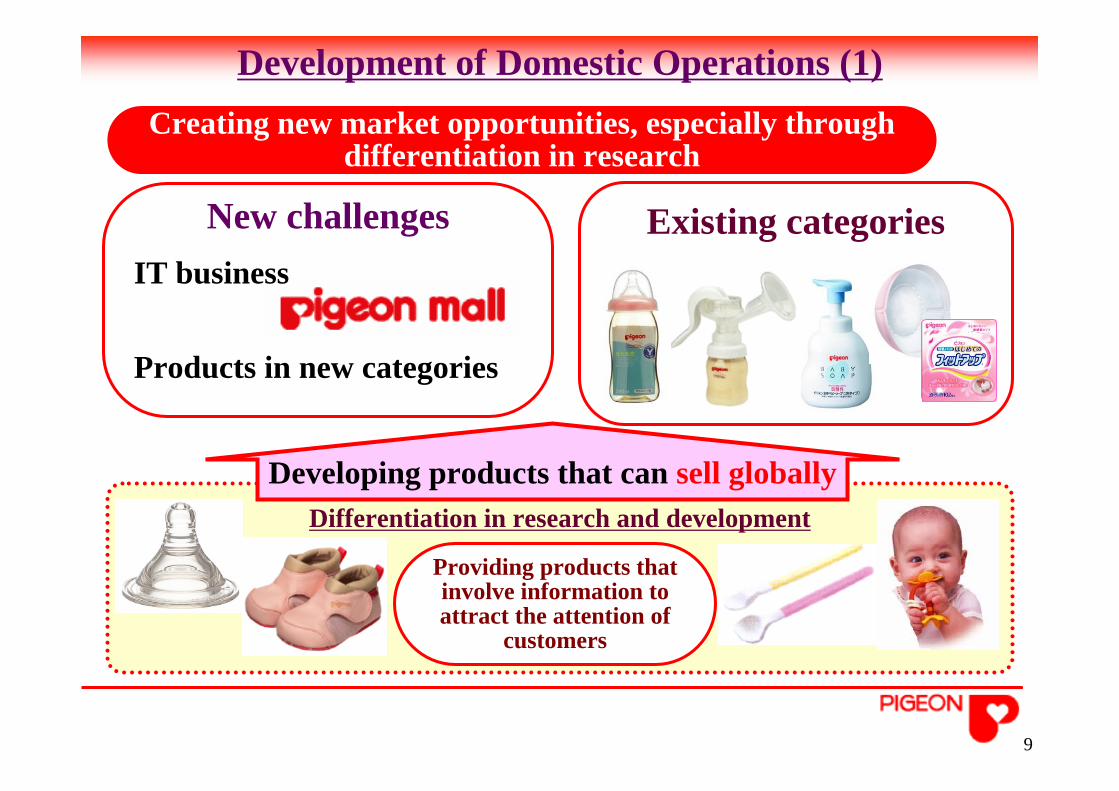
Development of Domestic Operations (1)
New challenges
Differentiation in research and development
Products in new categories
Developing products that can sell globally
Creating new market opportunities, especially through differentiation in research
Providing products that involve information to attract the attention of
customers
Existing categoriesIT business
10
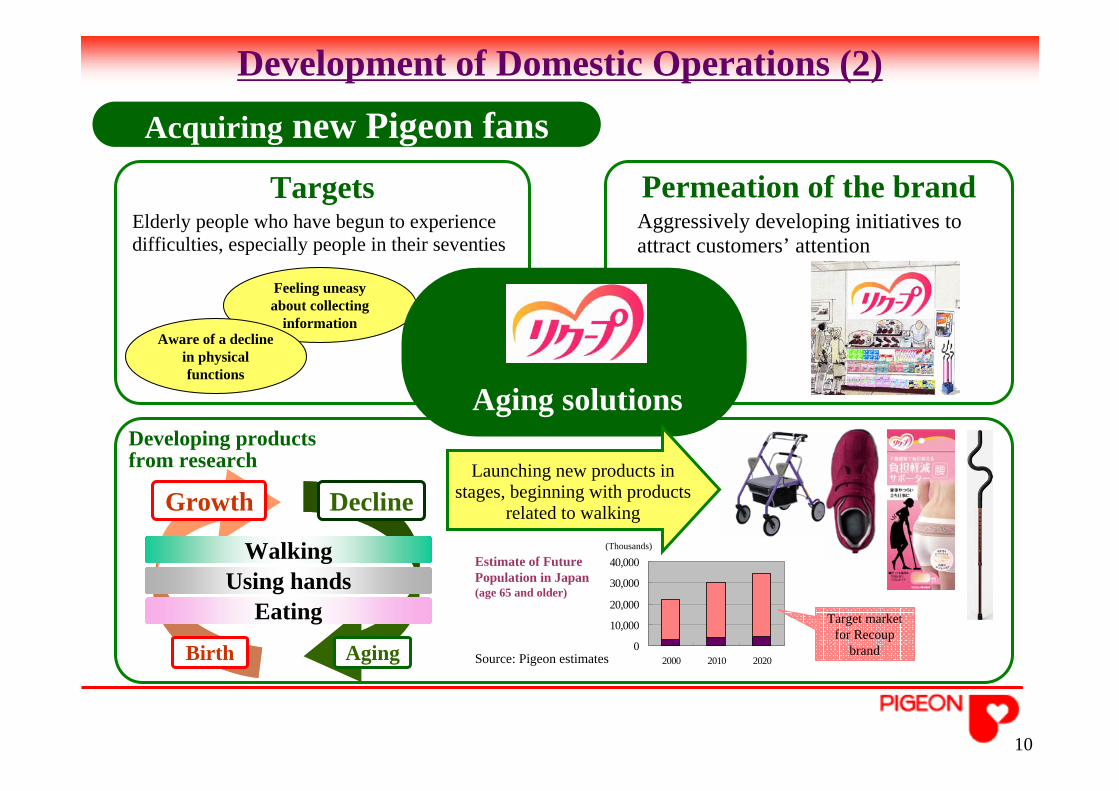
Development of Domestic Operations (2)
Feeling uneasy about collecting
information
Developing products from research
Permeation of the brandTargets
Acquiring new Pigeon fans
Elderly people who have begun to experience difficulties, especially people in their seventies
Growth Decline
WalkingUsing hands
Eating
AgingBirth
Aggressively developing initiatives to attract customers’ attention
Aware of a decline in physical functions
Aging solutions
0
10,000
20,000
30,000
40,000
2000 2010 2020
(Thousands)
Target market for Recoup
brand
Launching new products in stages, beginning with products
related to walking
Estimate of Future Population in Japan (age 65 and older)
Source: Pigeon estimates
¥ 100 millions Jan. 2008(Result)
Jan. 2009(Result )
Jan. 2010(Result)
Jan. 2011(Plan)
Growth rate(base year: Jan. 2008)
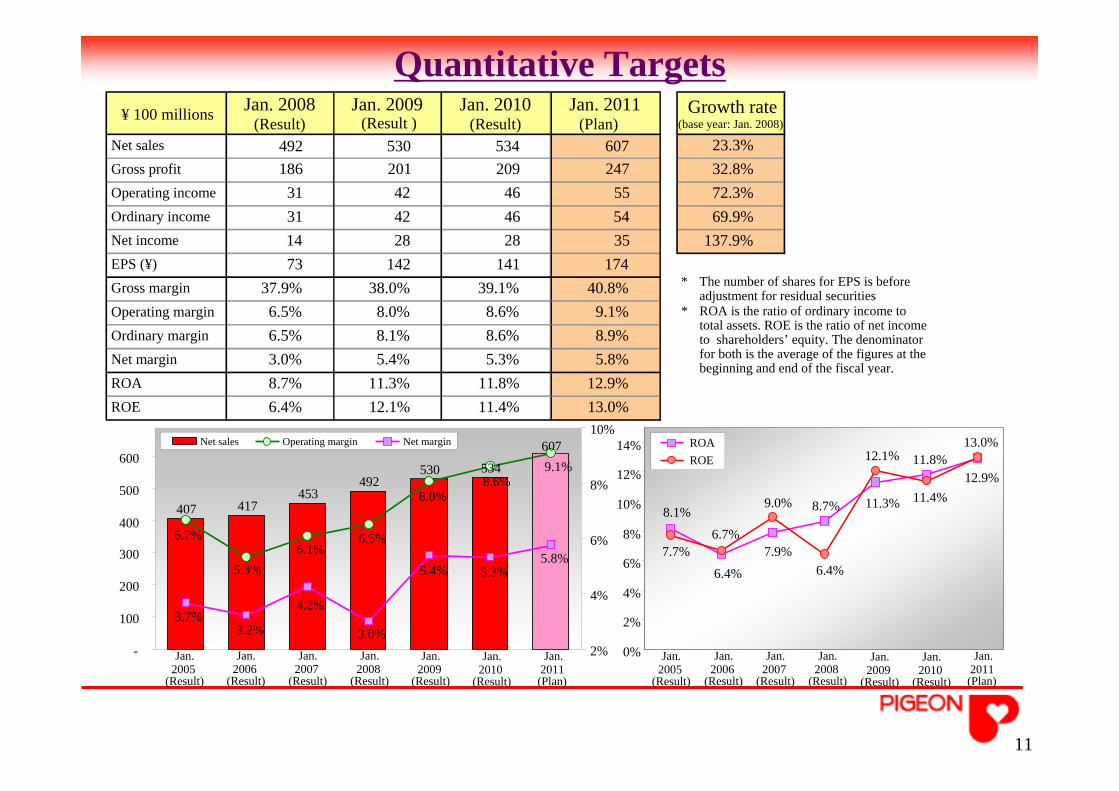
Net sales 492 530 534 607 23.3%Gross profit 186 201 209 247 32.8%Operating income 31 42 46 55 72.3%Ordinary income 31 42 46 54 69.9%Net income 14 28 28 35 137.9%EPS (¥) 73 142 141 174Gross margin 37.9% 38.0% 39.1% 40.8%Operating margin 6.5% 8.0% 8.6% 9.1%Ordinary margin 6.5% 8.1% 8.6% 8.9%Net margin 3.0% 5.4% 5.3% 5.8%ROA 8.7% 11.3% 11.8% 12.9%ROE 6.4% 12.1% 11.4% 13.0%
* The number of shares for EPS is before adjustment for residual securities
* ROA is the ratio of ordinary income to total assets. ROE is the ratio of net income to shareholders’ equity. The denominator for both is the average of the figures at the beginning and end of the fiscal year.
407 417453
492530 534
6079.1%
8.6%8.0%
6.7%6.1%
6.5%
5.3%5.8%
5.3%5.4%
3.0%
4.2%
3.2%3.7%
-
100
200
300
400
500
600
2%
4%
6%
8%
10%Net sales Operating margin Net margin
Jan. 2005
(Result)
Jan. 2006
(Result)
Jan. 2007
(Result)
Jan. 2008
(Result)
Jan. 2009
(Result)
Jan. 2010
(Result)
Jan. 2011(Plan)
0%
2%
4%
6%
8%
10%
12%
8.1%
6.4%
7.9%
8.7% 11.3%
11.8%12.9%
7.7%6.7%
9.0%
6.4%
12.1%
11.4%
13.0%
Jan. 2005
(Result)
Jan. 2006
(Result)
Jan. 2007
(Result)
Jan. 2008
(Result)
Jan. 2009
(Result)
Jan. 2010
(Result)
Jan. 2011(Plan)
14% ROAROE
Quantitative Targets
11
12
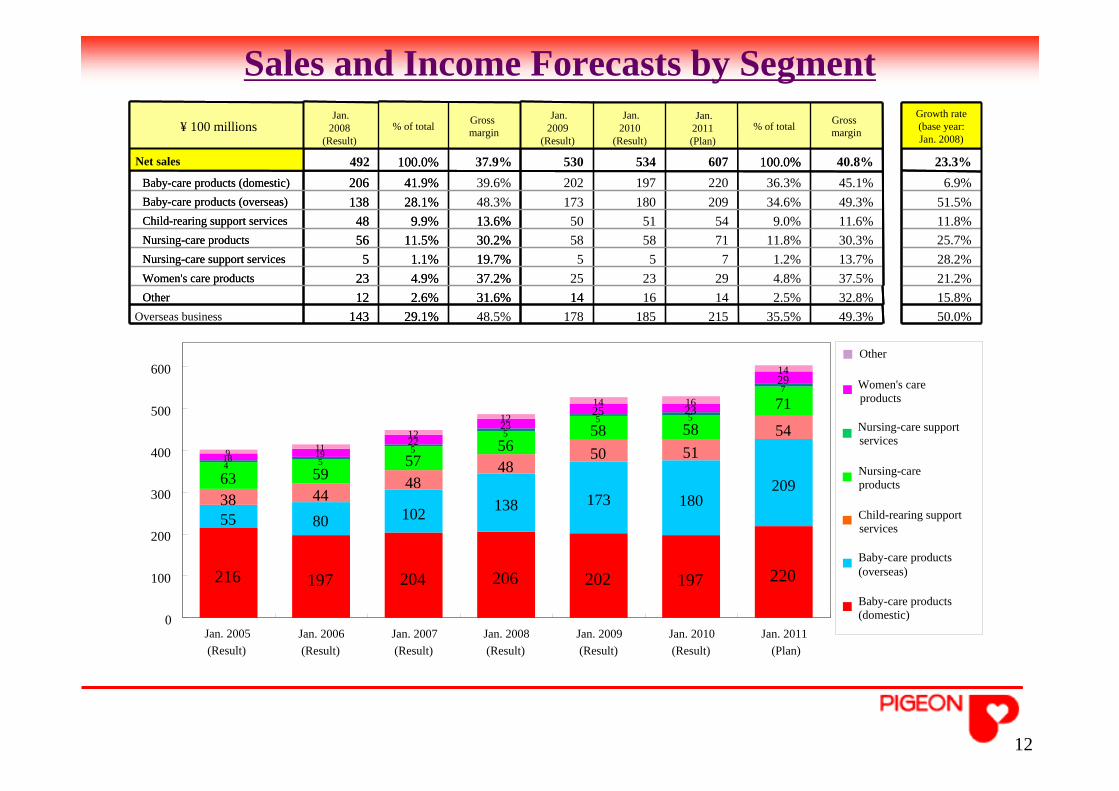
Sales and Income Forecasts by Segment
Other
Women's careproducts
Nursing-care supportservices
Nursing-careproducts
Child-rearing supportservices
Baby-care products(overseas)
Baby-care products(domestic)
216 197 204 206 202 197 220
55 80 102 138 173 180209
38 4448
4850 51
54
63 5957
5658 58
71
1212
14 16
14
7
555
554
18 1922
23
29
2325
119
0
100
200
300
400
500
600
Jan. 2005(Result)
Jan. 2006(Result)
Jan. 2007(Result)
Jan. 2008(Result)
Jan. 2009(Result)
Jan. 2010(Result)
Jan. 2011(Plan)
50.0%49.3%35.5%215185 17848.5%29.1%143 Overseas business15.8%32.8%2.5%14 1614 31.6%2.6%12 Other21.2%37.5%4.8%29 232537.2%4.9%23 Women's care products28.2%13.7%1.2%7 5519.7%1.1%5 Nursing-care support services
30.3%11.8%71 5858 30.2%11.5%56 Nursing-care products11.8%11.6%9.0%54 51 50 13.6%9.9%48 Child-rearing support services51.5%49.3%34.6%209 18017348.3%28.1%138 Baby-care products (overseas)6.9%45.1%36.3%220 20239.6%41.9%206 Baby-care products (domestic)
23.3%40.8%100.0%607534530 37.9%100.0%492 Net sales
Growth rate (base year: Jan. 2008)
Gross profit margin% of totalPlan in Jan.
2011 FYPlan in Jan.
2010 FYPlan in Jan.
2009 FYGross profit
margin% of totalResults in Jan. 2008
FY¥ 100 milions
29.1%143 14 31.6%2.6%12 Other
37.2%4.9%23 Women's care products19.7%1.1%5 Nursing-care support services30.2%11.5%56 Nursing-care products13.6%9.9%48 Child-rearing support services
28.1%138 Baby-care products (overseas)19741.9%206 Baby-care products (domestic)
100.0%100.0%Net sales
Growth rate (base year: Jan. 2008)
Grossmargin% of totalGross
margin% of totalJan.
2011(Plan)
¥ 100 millionsJan.
2009(Result)
Jan. 2010
(Result)
Jan. 2008
(Result)
25.7%
185
178
215
(¥100 millions)
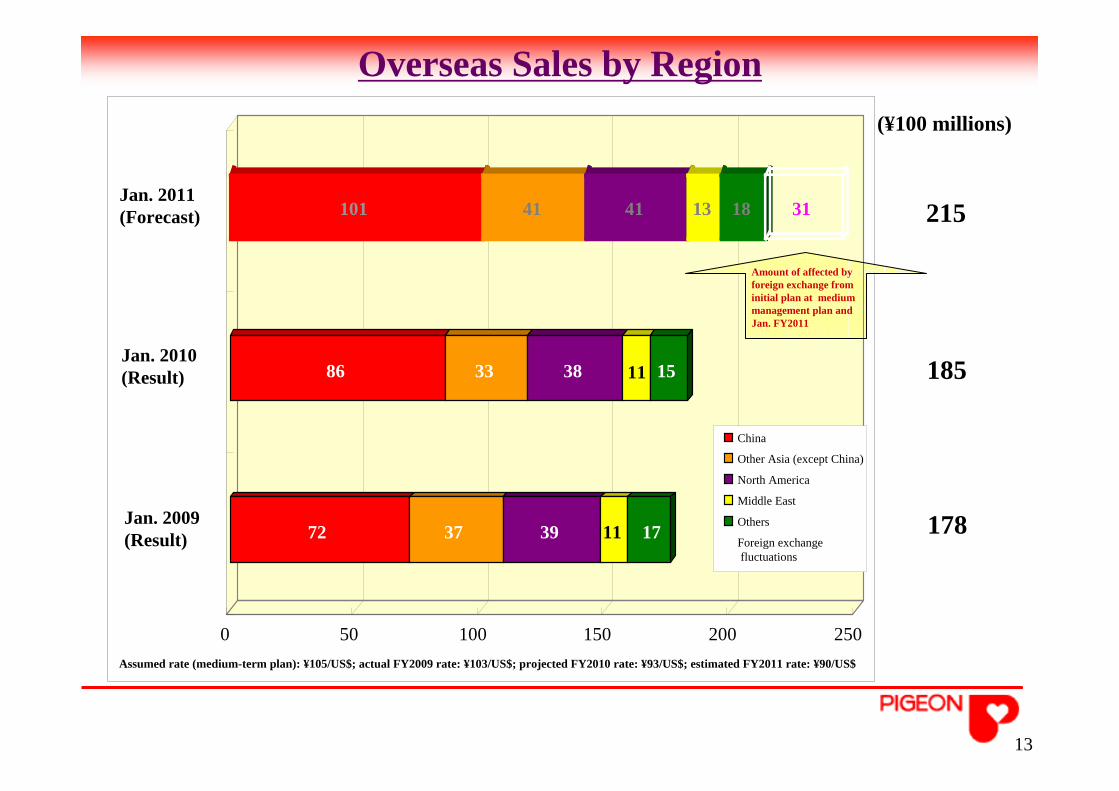
Assumed rate (medium-term plan): ¥105/US$; actual FY2009 rate: ¥103/US$; projected FY2010 rate: ¥93/US$; estimated FY2011 rate: ¥90/US$
72 37 39 11 17
86 33 38 11 15
101 41 41 13 18 31
0 50 100 150 200 250
Jan. 2011(Forecast)
China
Other Asia (except China)
North America
Middle East
Others
Foreign exchangefluctuations
Jan. 2010(Result)
Jan. 2009(Result)
Amount of affected by foreign exchange from initial plan at medium management plan and Jan. FY2011
Overseas Sales by Region
13
Assumed rate (medium-term plan): ¥105/US$; actual FY2009 rate: ¥103/US$; projected FY2010 rate: ¥93/US$; estimated FY2011 rate: ¥90/US$
14
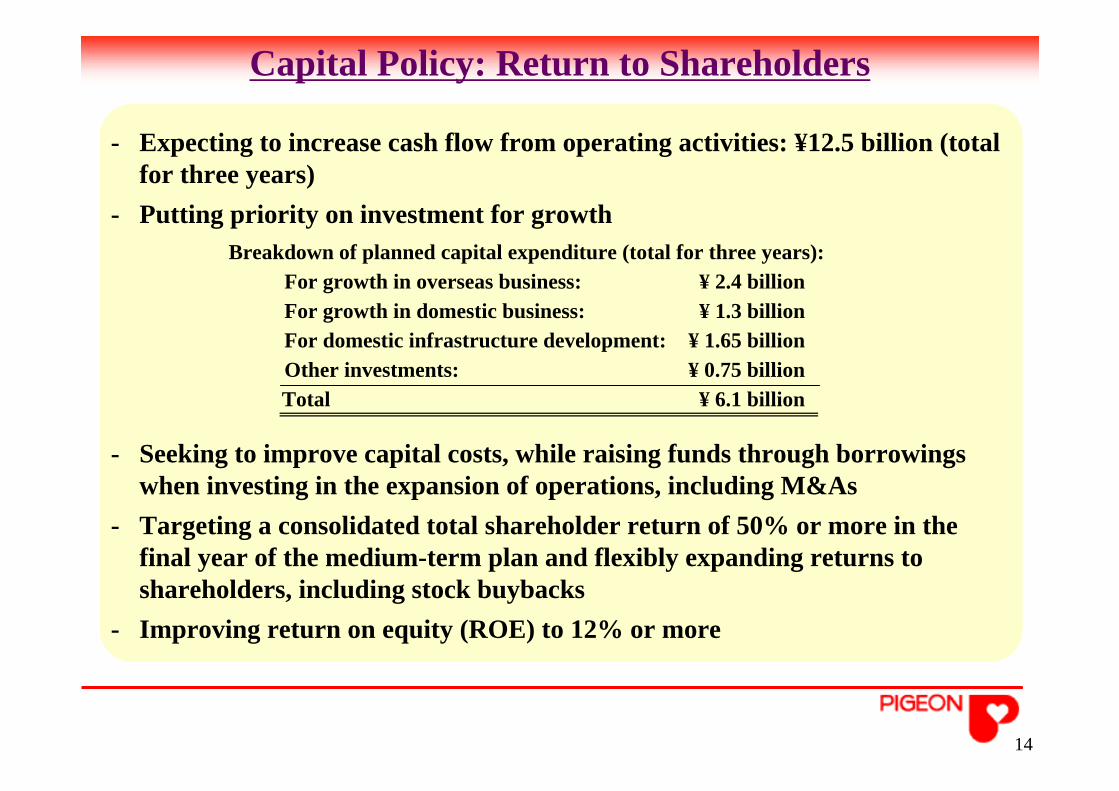
Capital Policy: Return to Shareholders
- Expecting to increase cash flow from operating activities: ¥12.5 billion (total for three years)
- Putting priority on investment for growth
- Seeking to improve capital costs, while raising funds through borrowings when investing in the expansion of operations, including M&As
- Targeting a consolidated total shareholder return of 50% or more in the final year of the medium-term plan and flexibly expanding returns to shareholders, including stock buybacks
- Improving return on equity (ROE) to 12% or more
Breakdown of planned capital expenditure (total for three years):For growth in overseas business: ¥ 2.4 billionFor growth in domestic business: ¥ 1.3 billionFor domestic infrastructure development: ¥ 1.65 billionOther investments: ¥ 0.75 billionTotal ¥ 6.1 billion

15
Jan. 20Jan. 201010 Results Results Jan. 201Jan. 20111 ForecastsForecasts
16
Jan. 2010 Jan. 2011 (Forecast)
(¥ millions) Amount % of Total YoY Change Amount % of Total YoY Change
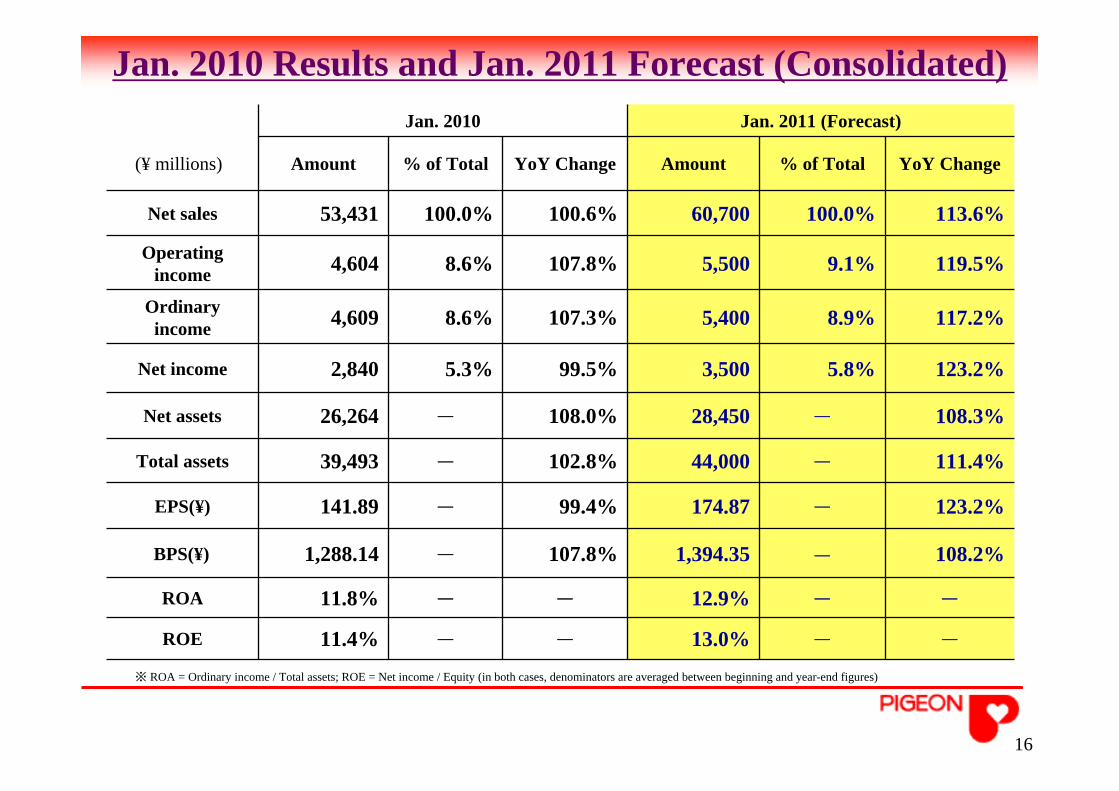
Net sales 53,431 100.0% 100.6% 60,700 100.0% 113.6%
Operating income 4,604 8.6% 107.8% 5,500 9.1% 119.5%
Ordinary income 4,609 8.6% 107.3% 5,400 8.9% 117.2%
Net income 2,840 5.3% 99.5% 3,500 5.8% 123.2%
Net assets 26,264 - 108.0% 28,450 - 108.3%
Total assets 39,493 - 102.8% 44,000 - 111.4%
EPS(¥) 141.89 - 99.4% 174.87 - 123.2%
BPS(¥) 1,288.14 - 107.8% 1,394.35 - 108.2%
ROA 11.8% - - 12.9% - -
ROE 11.4% - - 13.0% - -
※ ROA = Ordinary income / Total assets; ROE = Net income / Equity (in both cases, denominators are averaged between beginning and year-end figures)
Jan. 2010 Results and Jan. 2011 Forecast (Consolidated)
17
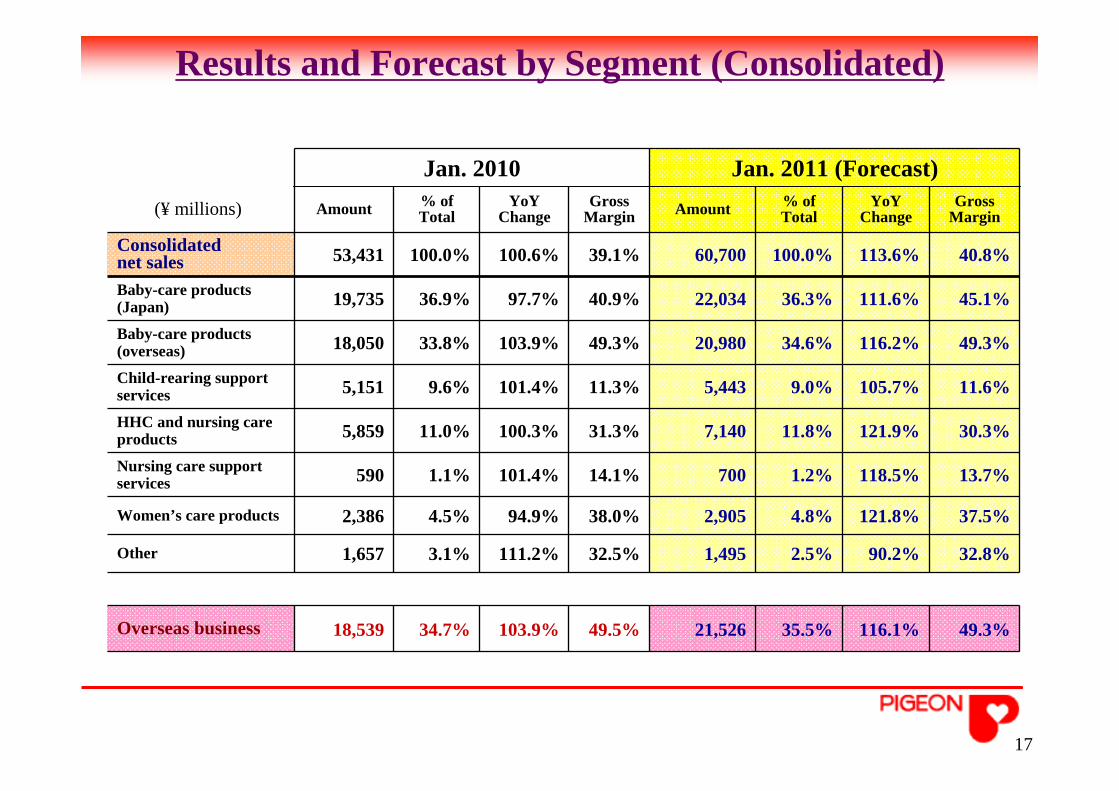
Jan. 2010 Jan. 2011 (Forecast)Amount % of
TotalYoY
ChangeGross
Margin Amount % of Total
YoYChange
Gross Margin
Consolidatednet sales 53,431 100.0% 100.6% 39.1% 60,700 100.0% 113.6% 40.8%
Baby-care products (Japan) 19,735 36.9% 97.7% 40.9% 22,034 36.3% 111.6% 45.1%
Baby-care products (overseas) 18,050 33.8% 103.9% 49.3% 20,980 34.6% 116.2% 49.3%
Child-rearing support services 5,151 9.6% 101.4% 11.3% 5,443 9.0% 105.7% 11.6%
HHC and nursing care products 5,859 11.0% 100.3% 31.3% 7,140 11.8% 121.9% 30.3%
Nursing care support services 590 1.1% 101.4% 14.1% 700 1.2% 118.5% 13.7%
Women’s care products 2,386 4.5% 94.9% 38.0% 2,905 4.8% 121.8% 37.5%
Other 1,657 3.1% 111.2% 32.5% 1,495 2.5% 90.2% 32.8%
Overseas business 18,539 34.7% 103.9% 49.5% 21,526 35.5% 116.1% 49.3%
(¥ millions)
Results and Forecast by Segment (Consolidated)
18
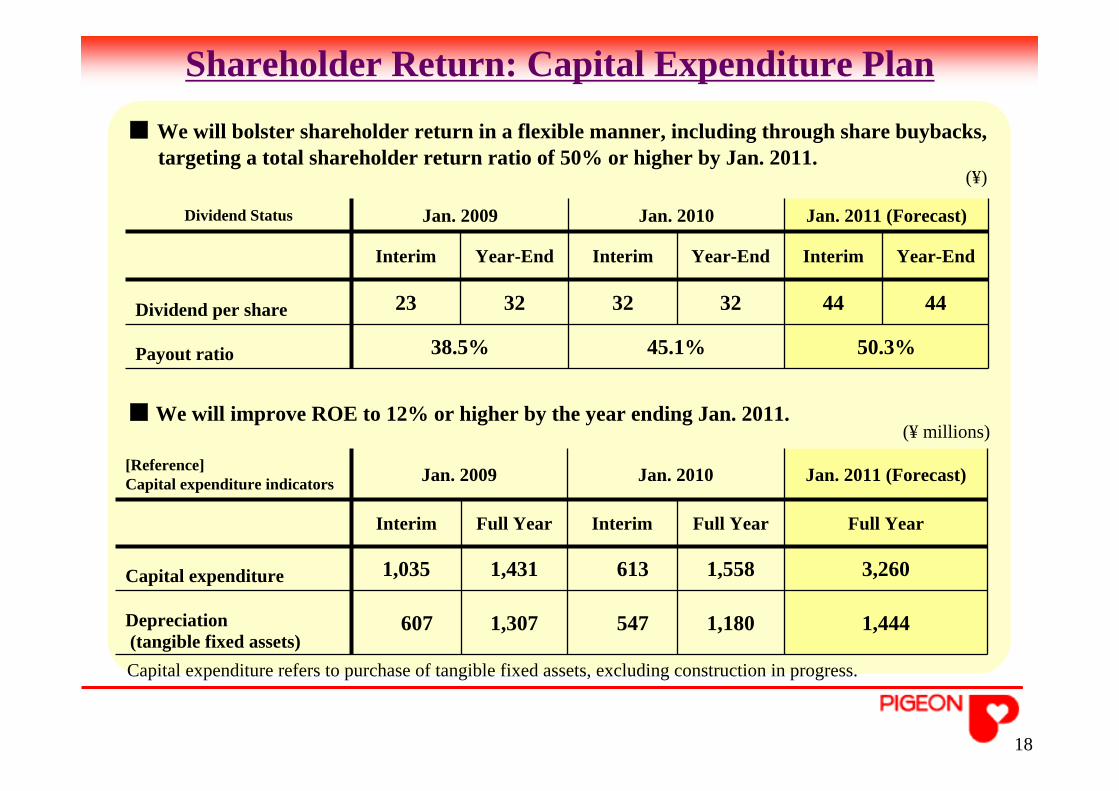
■ We will bolster shareholder return in a flexible manner, including through share buybacks, targeting a total shareholder return ratio of 50% or higher by Jan. 2011.
■ We will improve ROE to 12% or higher by the year ending Jan. 2011.
1,307
1,431
Full Year
607
1,035
Interim
Jan. 2009[Reference] Capital expenditure indicators Jan. 2010 Jan. 2011 (Forecast)
Interim Full Year Full Year
Capital expenditure 613 1,558 3,260
Depreciation(tangible fixed assets)
547 1,180 1,444
Dividend Status Jan. 2009 Jan. 2010 Jan. 2011 (Forecast)
Interim Year-End Interim Year-End Interim Year-End
Dividend per share 23 32 32 32 44 44
Payout ratio 38.5% 45.1% 50.3%
Capital expenditure refers to purchase of tangible fixed assets, excluding construction in progress.
(¥ millions)
(¥)
Shareholder Return: Capital Expenditure Plan
19
■ Results・ Higher revenue and earnings despite underperforming targets of initial plan
and revised plan ・ Achieved cost cuts through reduced raw materials costs and emphasis on in-
house manufacturing ⇒ Increase in dividends thanks to good profits・ Continued steady growth in overseas business, centering on China and North
America, despite negative impact of foreign exchange fluctuations・ Solid progress in approach to new markets (new sales subsidiary in India; new
sales agencies in Russia and South Korea)
■ Issues・ Domestic business underperforming plan’s targets due to weak consumption
and deflationary trend ⇒ Rebuild operations, including by fostering new businesses
・ Need to build and reinforce business structure to be more responsive to expanding overseas business
Second Year of Plan: Results and Issues
20
■ Globalization of baby and child care product and women’s care product businesses
• China: Further strengthen sales base; continue expanding production facilities
• North America: Maintain/expand high share of breastfeeding-related product• Europe: Expand sales in Europe and Turkey • New markets: Build brand and expand sales via local subsidiary in India;
advance into new core markets (South Korea, Russia, etc.)
■ Reinforce existing domestic businesses and nurture new businesses
• Baby and child care products: Reinforce existing businesses; nurture new businesses; continue direct communication campaign; improve profitability
• IT business: Expand sales through focus on mail-order and child-rearing sites• Child-rearing support: Improve quality of both human skills and services• Healthcare: Promote brand of Recoup; secure new sales channels
Year Ending Jan. 2011: Key Issues
Overseas OperationsOverseas Operations
21
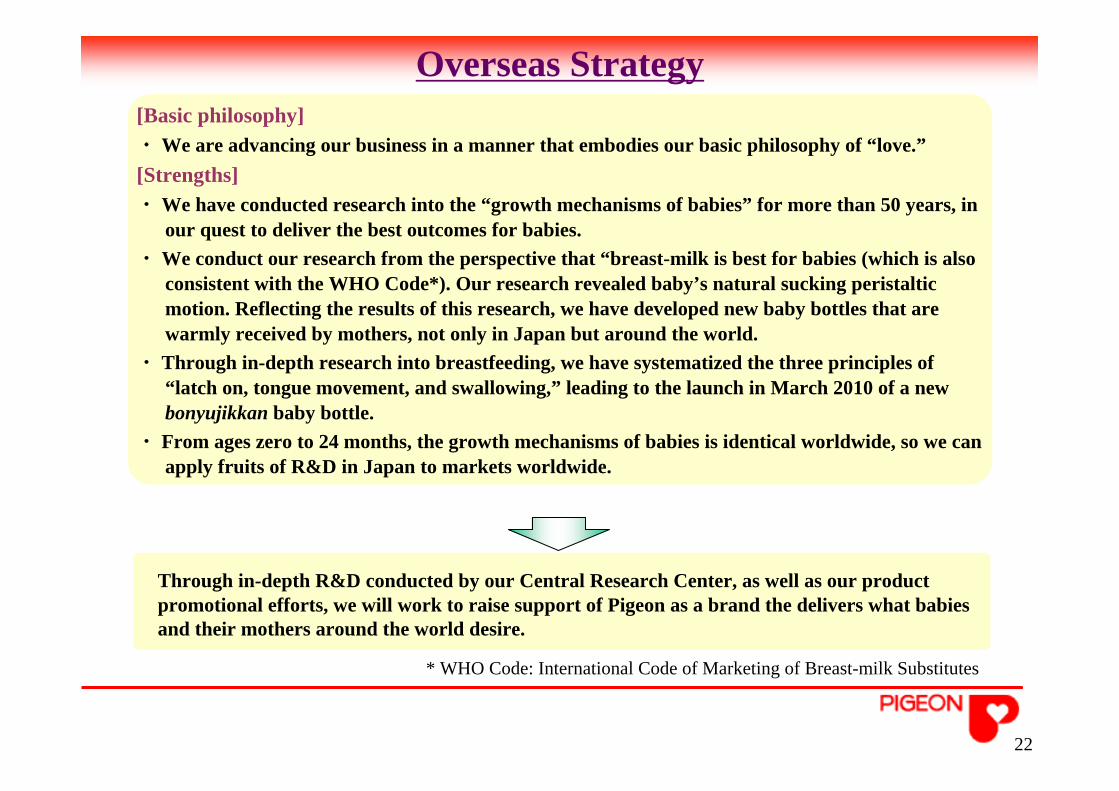
Through in-depth R&D conducted by our Central Research Center, as well as our product promotional efforts, we will work to raise support of Pigeon as a brand the delivers what babies and their mothers around the world desire.
Overseas Strategy
* WHO Code: International Code of Marketing of Breast-milk Substitutes
[Basic philosophy]・ We are advancing our business in a manner that embodies our basic philosophy of “love.”[Strengths]・ We have conducted research into the “growth mechanisms of babies” for more than 50 years, in
our quest to deliver the best outcomes for babies. ・ We conduct our research from the perspective that “breast-milk is best for babies (which is also
consistent with the WHO Code*). Our research revealed baby’s natural sucking peristaltic motion. Reflecting the results of this research, we have developed new baby bottles that are warmly received by mothers, not only in Japan but around the world.
・ Through in-depth research into breastfeeding, we have systematized the three principles of “latch on, tongue movement, and swallowing,” leading to the launch in March 2010 of a new bonyujikkan baby bottle.
・ From ages zero to 24 months, the growth mechanisms of babies is identical worldwide, so we can apply fruits of R&D in Japan to markets worldwide.
22
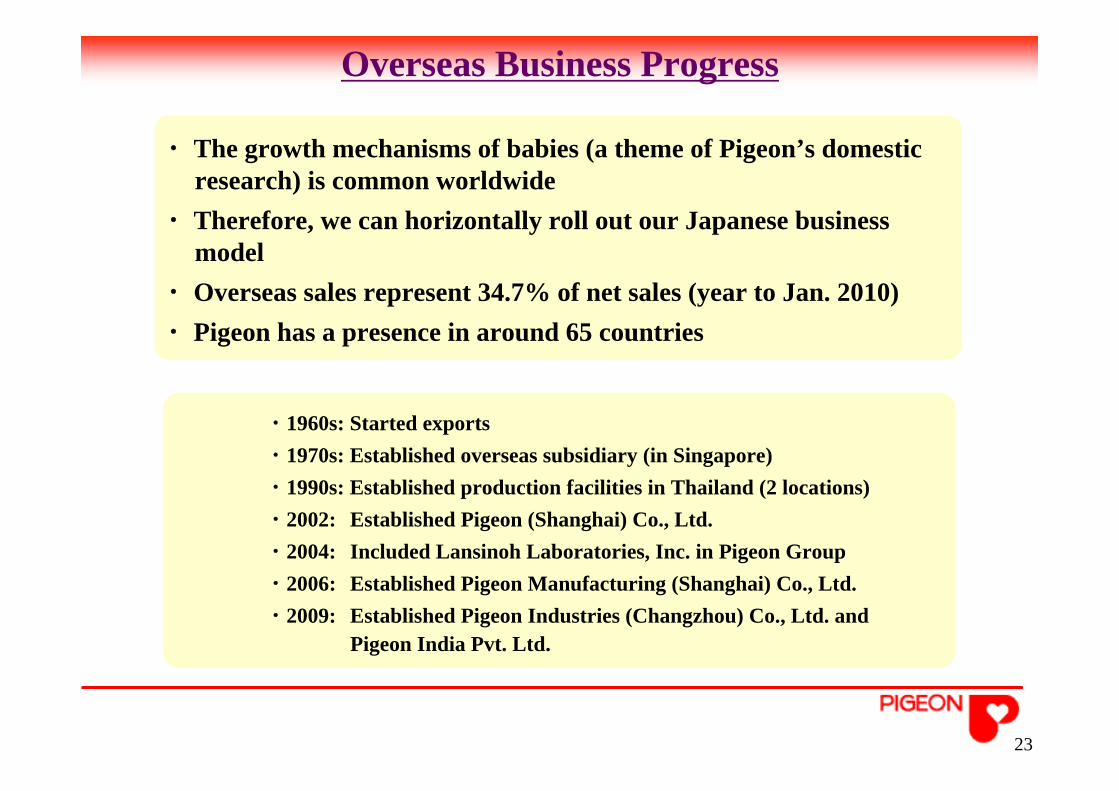
・1960s: Started exports・1970s: Established overseas subsidiary (in Singapore)・1990s: Established production facilities in Thailand (2 locations)・2002: Established Pigeon (Shanghai) Co., Ltd.・2004: Included Lansinoh Laboratories, Inc. in Pigeon Group・2006: Established Pigeon Manufacturing (Shanghai) Co., Ltd. ・2009: Established Pigeon Industries (Changzhou) Co., Ltd. and
Pigeon India Pvt. Ltd.
Overseas Business Progress
・ The growth mechanisms of babies (a theme of Pigeon’s domestic research) is common worldwide
・ Therefore, we can horizontally roll out our Japanese business model
・ Overseas sales represent 34.7% of net sales (year to Jan. 2010) ・ Pigeon has a presence in around 65 countries
23
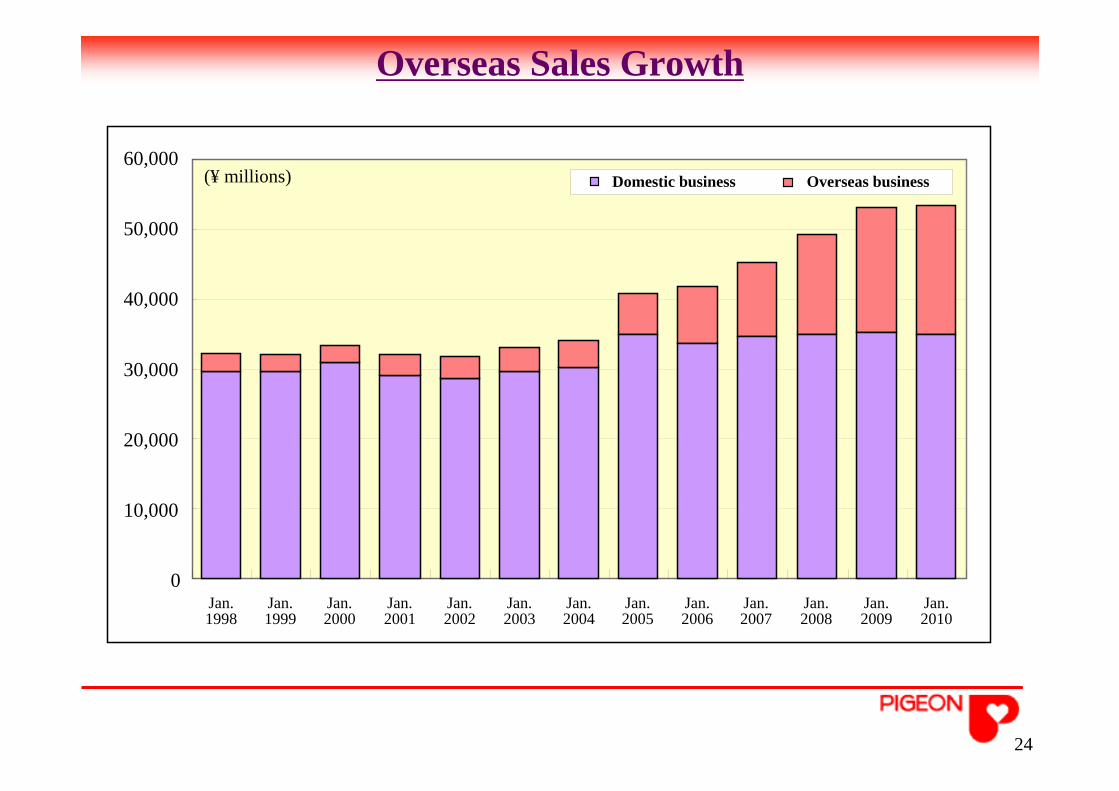
Overseas Sales Growth
24
0
10,000
20,000
30,000
40,000
50,000
60,000(¥ millions)
Jan.1998
Jan.1999
Jan.2000
Jan.2001
Jan.2002
Jan.2003
Jan.2004
Jan.2005
Jan.2006
Jan.2007
Jan.2008
Jan.2009
Domestic business Overseas business
Jan.2010
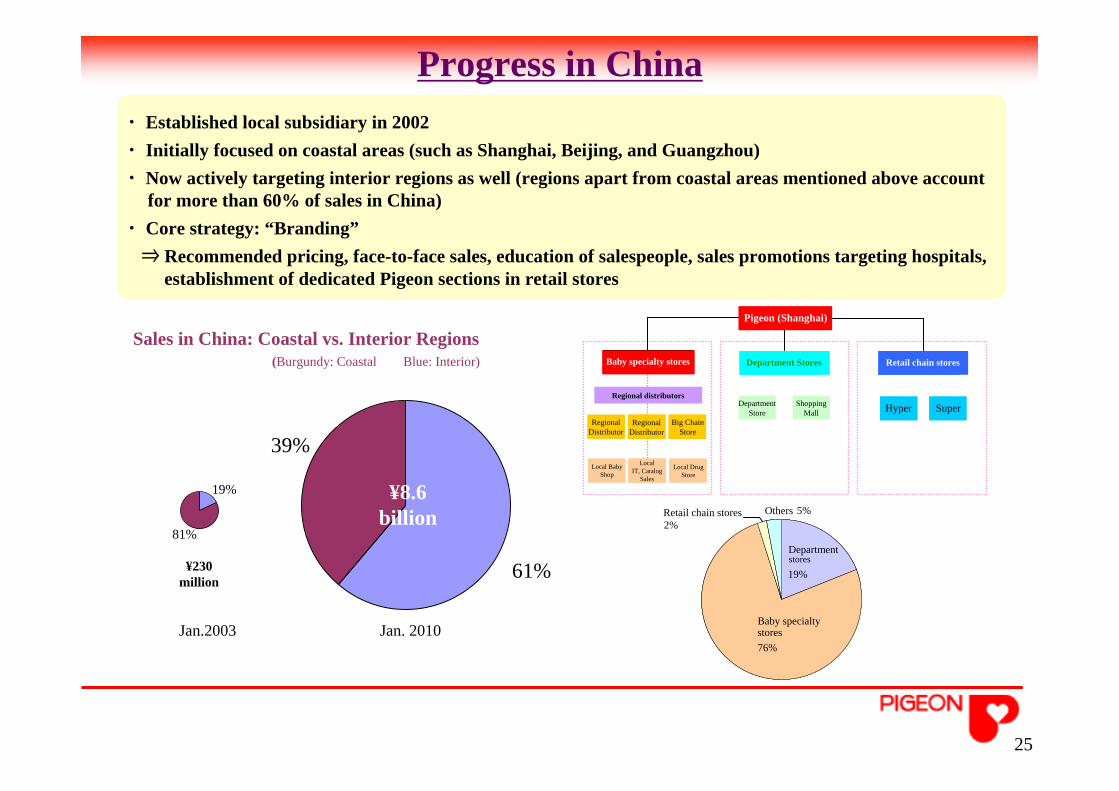
Progress in China・ Established local subsidiary in 2002・ Initially focused on coastal areas (such as Shanghai, Beijing, and Guangzhou)・ Now actively targeting interior regions as well (regions apart from coastal areas mentioned above account
for more than 60% of sales in China) ・ Core strategy: “Branding”
⇒ Recommended pricing, face-to-face sales, education of salespeople, sales promotions targeting hospitals, establishment of dedicated Pigeon sections in retail stores
Jan.2003 Jan. 2010
Sales in China: Coastal vs. Interior Regions (Burgundy: Coastal Blue: Interior)
19%
81%
¥8.6billion
¥230 million
25
Departmentstores
76%
Baby specialtystores
19%
Others
5%2%
Departmentstores
76%
Baby specialtystores
19%
5%Retail chain stores
LocalDrugStore
Local
Baby specialty storesBaby specialty stores Department StoresDepartment Stores Retail chain storesRetail chain stores
SuperHyper SuperHyperShopping Mall
Department Store
Local Drug Store
Local Baby Shop
Regional Big ChainRegional Distributor
Big Chain Store
Regional distributorsRegional distributors
LocalIT、Catalog
Sales
Local IT, Catalog
Sales
RegionalRegional Distributor
Pigeon (Shanghai)Pigeon (Shanghai)
61%
39%
0
2000
4000
6000
8000
10000
Jan.2005 Jan.2006 Jan.2007 Jan.2008 Jan.2009 Jan.2010
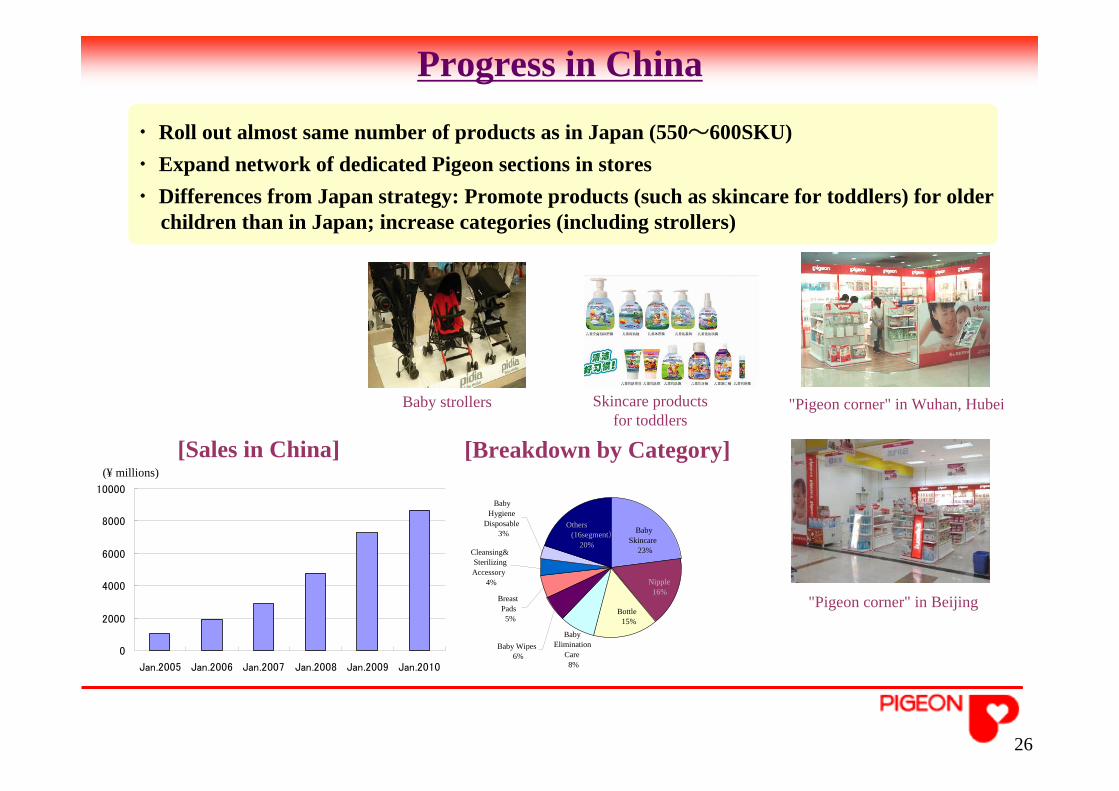
Progress in China
・ Roll out almost same number of products as in Japan (550~600SKU) ・ Expand network of dedicated Pigeon sections in stores・ Differences from Japan strategy: Promote products (such as skincare for toddlers) for older
children than in Japan; increase categories (including strollers)
[Breakdown by Category][Sales in China]
Baby strollers "Pigeon corner" in Wuhan, Hubei
"Pigeon corner" in Beijing
Skincare products for toddlers
(¥ millions)
26
BreastPads5%
Baby Wipes6%
Others(16segment)
20%
BabyHygiene
Disposable3%
Cleansing&SterilizingAccessory
4%
BabyElimination
Care8%
Bottle15%
Nipple16%
BabySkincare
23%
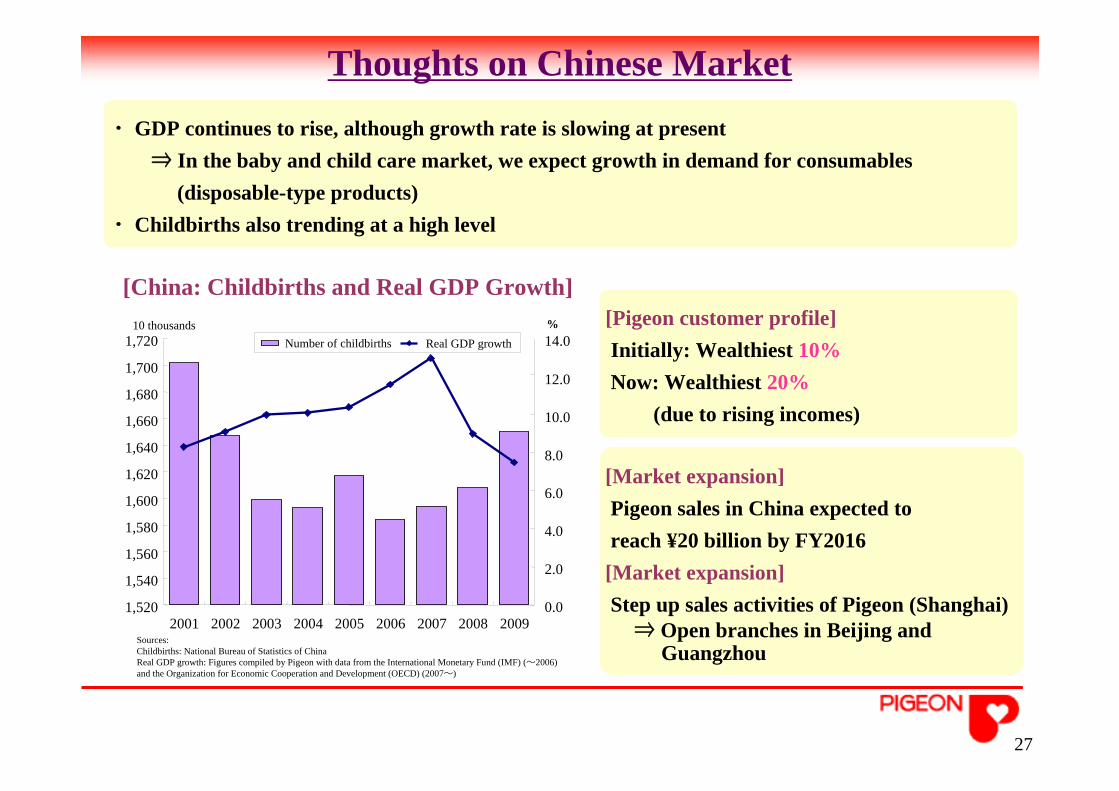
・ GDP continues to rise, although growth rate is slowing at present⇒ In the baby and child care market, we expect growth in demand for consumables
(disposable-type products)・ Childbirths also trending at a high level
Thoughts on Chinese Market
[Pigeon customer profile]Initially: Wealthiest 10%Now: Wealthiest 20%
(due to rising incomes)
[Market expansion]Pigeon sales in China expected to reach ¥20 billion by FY2016
[Market expansion]Step up sales activities of Pigeon (Shanghai)
⇒ Open branches in Beijing and Guangzhou
[China: Childbirths and Real GDP Growth]
⑩ ⑪
1,520
1,540
1,560
1,580
1,600
1,620
1,640
1,660
1,680
1,700
1,720
2001 2002 2003 2004 2005 2006 2007 2008 2009
10 thousands
0.0
2.0
4.0
6.0
8.0
10.0
12.0
14.0%
Number of childbirths Real GDP growth
Sources:Childbirths: National Bureau of Statistics of ChinaReal GDP growth: Figures compiled by Pigeon with data from the International Monetary Fund (IMF) (~2006) and the Organization for Economic Cooperation and Development (OECD) (2007~)
27
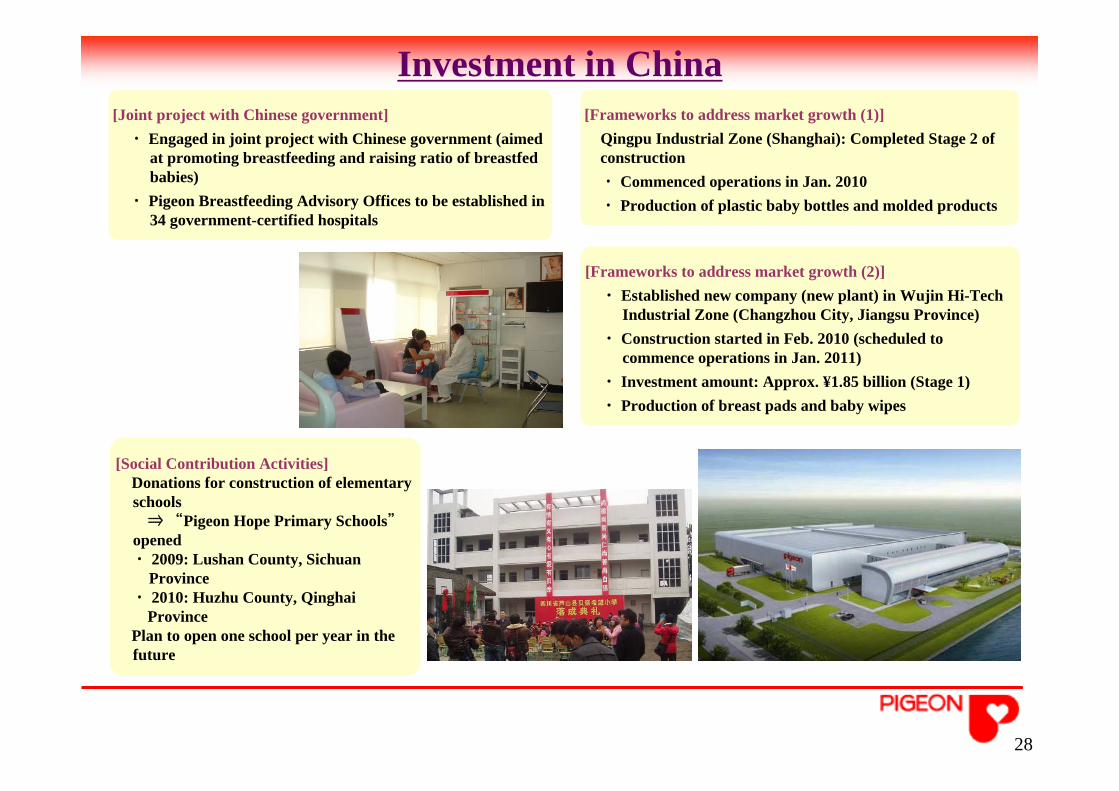
Investment in China
[Social Contribution Activities]Donations for construction of elementary schools
⇒ “Pigeon Hope Primary Schools”opened ・ 2009: Lushan County, Sichuan
Province ・ 2010: Huzhu County, Qinghai
Province Plan to open one school per year in the future
[Joint project with Chinese government] ・ Engaged in joint project with Chinese government (aimed
at promoting breastfeeding and raising ratio of breastfed babies)
・ Pigeon Breastfeeding Advisory Offices to be established in 34 government-certified hospitals
[Frameworks to address market growth (1)]Qingpu Industrial Zone (Shanghai): Completed Stage 2 of construction・ Commenced operations in Jan. 2010・ Production of plastic baby bottles and molded products
[Frameworks to address market growth (2)]・ Established new company (new plant) in Wujin Hi-Tech
Industrial Zone (Changzhou City, Jiangsu Province)・ Construction started in Feb. 2010 (scheduled to
commence operations in Jan. 2011)・ Investment amount: Approx. ¥1.85 billion (Stage 1)・ Production of breast pads and baby wipes
28
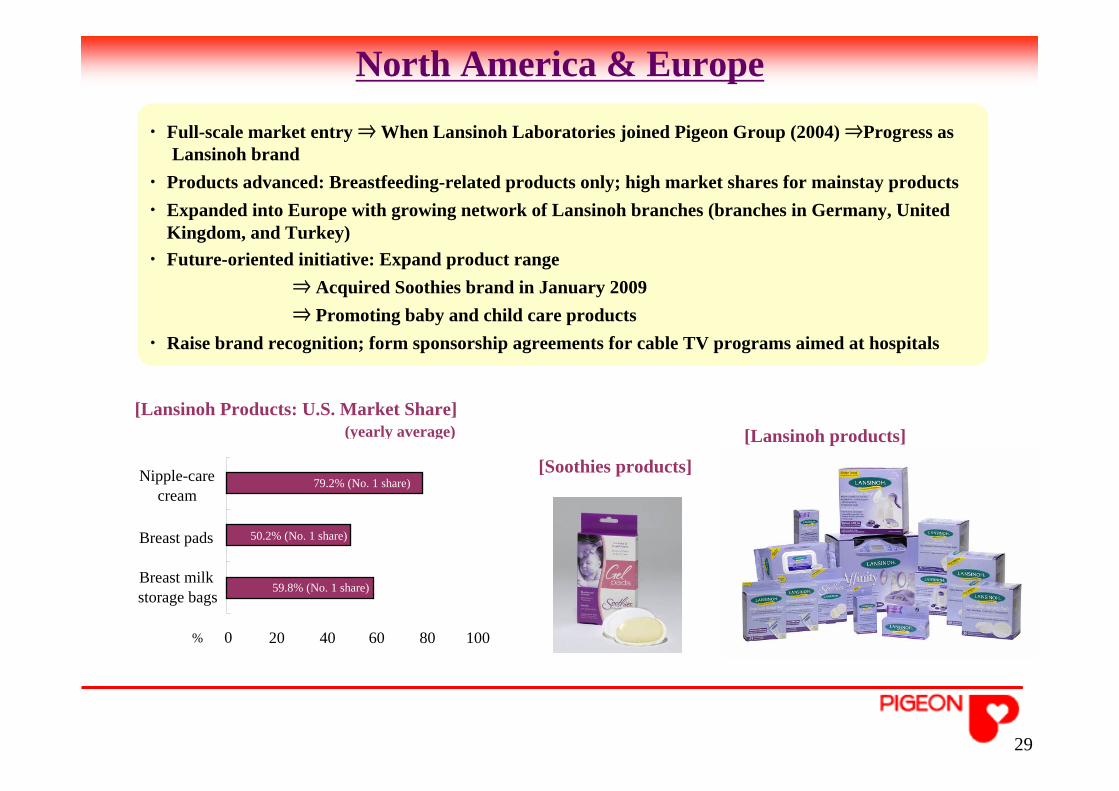
・ Full-scale market entry ⇒ When Lansinoh Laboratories joined Pigeon Group (2004) ⇒Progress as Lansinoh brand
・ Products advanced: Breastfeeding-related products only; high market shares for mainstay products ・ Expanded into Europe with growing network of Lansinoh branches (branches in Germany, United
Kingdom, and Turkey) ・ Future-oriented initiative: Expand product range
⇒ Acquired Soothies brand in January 2009⇒ Promoting baby and child care products
・ Raise brand recognition; form sponsorship agreements for cable TV programs aimed at hospitals
North America & Europe
[Lansinoh products][Soothies products]
[Lansinoh Products: U.S. Market Share] (yearly average)
0 20 40 60 80 100
Breast milkstorage bags
Breast pads
Nipple-carecream
%
79.2% (No. 1 share)
50.2% (No. 1 share)
59.8% (No. 1 share)
29
Russia - Population aged 0–4 expected to increase
through 2015 - 1.6–1.7 million babies born annually
South Korea - Formed new sales agency agreement - Start promoting Double Heart (new
brand) in 2010
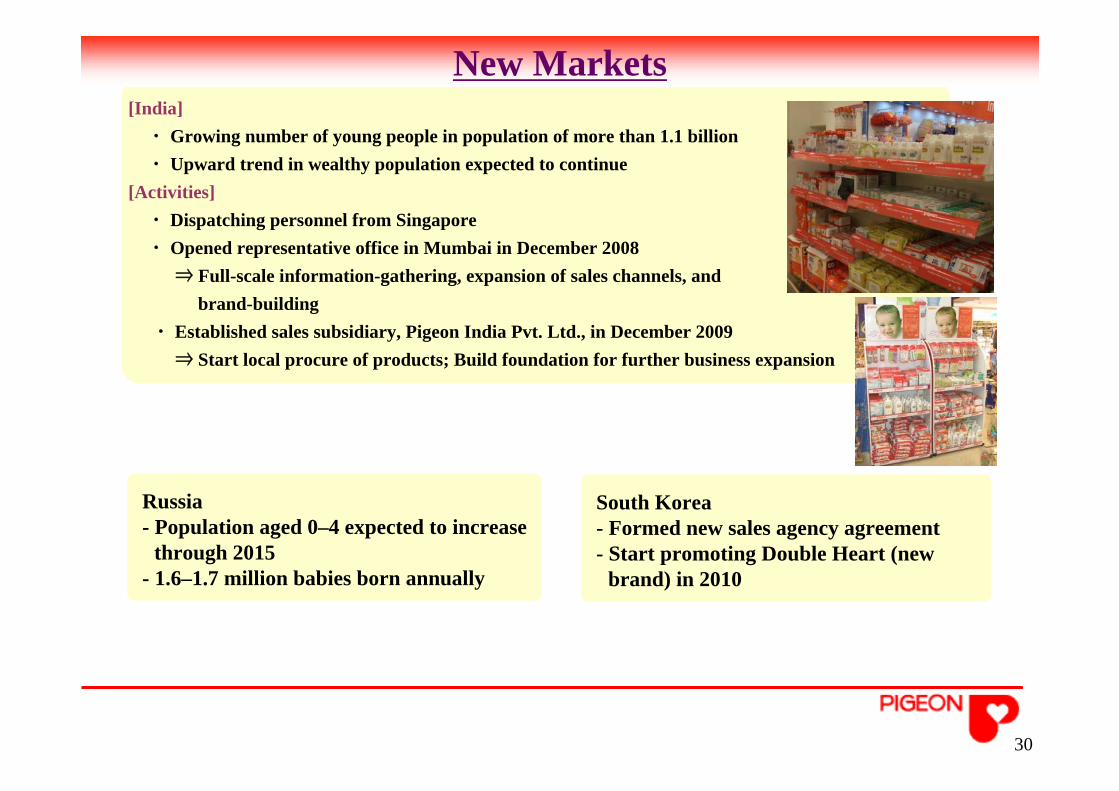
[India]・ Growing number of young people in population of more than 1.1 billion ・ Upward trend in wealthy population expected to continue
[Activities]・ Dispatching personnel from Singapore・ Opened representative office in Mumbai in December 2008
⇒ Full-scale information-gathering, expansion of sales channels, and brand-building
・ Established sales subsidiary, Pigeon India Pvt. Ltd., in December 2009⇒ Start local procure of products; Build foundation for further business expansion
New Markets
30
PIGEON CORPORATION
Head office4-4, Nihonbashi-Hisamatsucho, Chuo-ku, Tokyo 103-8480, JapanTel: +81-3-3661-4200
+81-3-3661-4188 (Investor Relations)Fax:+81-3-3661-4320
E-mail [email protected]
URL http://www.pigeon.co.jp /http://english.pigeon.co.jp/
Corporate Overview
In this document, statements other than historical facts related to plans, forecasts, and strategies are based on information available at the time of writing.The Corporation cannot provide guarantees or commitments for these forward-looking statements.Due to various factors, actual results may differ significantly from those anticipated in this document.
31