Embed Size (px)
Citation preview

Stat ist ics in focus Agriculture and fisheries Author: Pol MARQUER
8/2010
Pig farming in the EU, a changing sector
Pigmeat is produced throughout the EU on several types of farms with considerable variations from one Member State to another. Three quarters of the pigs are reared by just 1.5% of the largest fatteners. Small pig producers are mostly found in the new Member States and are one of the reasons for the decreasing size of the herd. The tasks of pig rearing are distributed across farms and, in the main production basins, even across regions.
Regional data on livestock are more informative than national figures as a means of displaying the zones of pig production (Figure 1). The major production basin extends from Denmark to Vlaams Gewest (BE) and accounts for 30% of EU sows. However, there are other important regions, such as Cataluña, Murcia (ES), Lombardia (IT), Bretagne (FR) and some areas of central Poland and Northern Croatia.
Figure 1: Number of sows by region (2008) 1 dot = 1,000 sows - NUTS 2 except DK, DE, UK (NUTS1)
0 500 1 000250 km
Source: Eurostat (agr_r_animal)
2 8/2010 — Statistics in focus
Structure of the pig farms
The distribution of national herds by size is taken from the Farm Structure Survey (FSS). The pigs are recorded in three categories, i.e. piglets, breeding sows and other pigs. The sows reflect the permanent pig herd and the other pigs are the pigs fattened before slaughtering (see methodological notes).
Herd size: other pigs
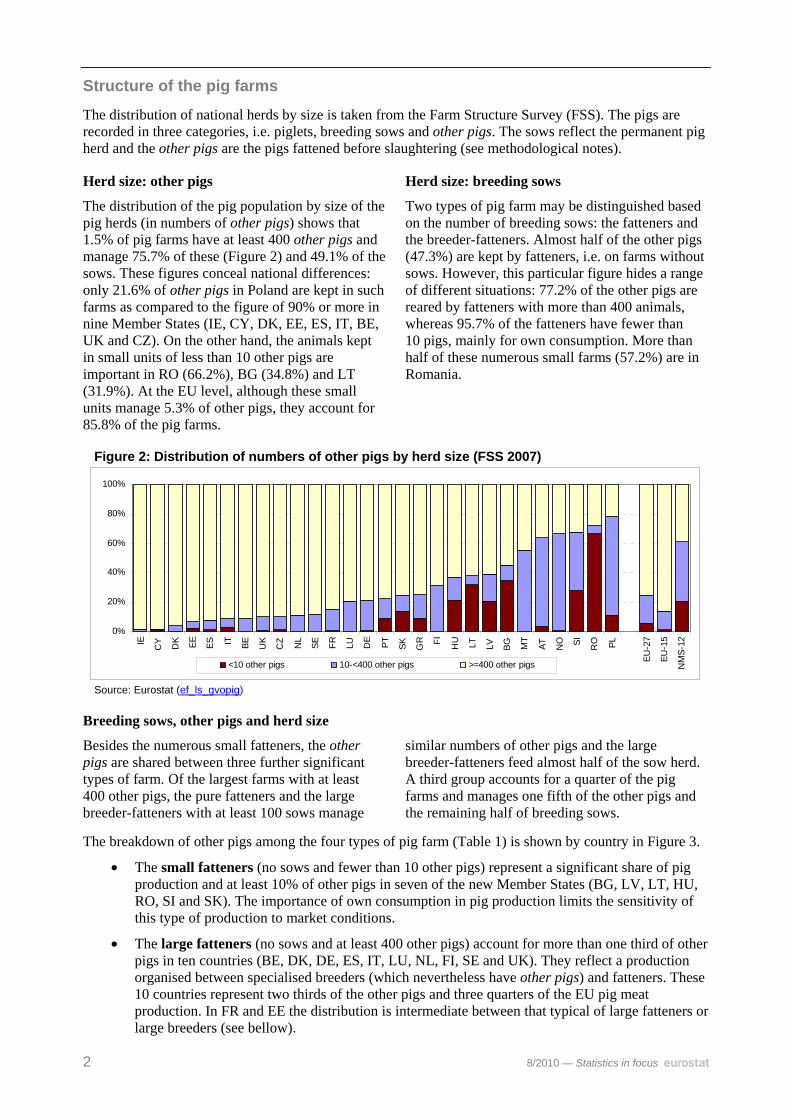
The distribution of the pig population by size of the pig herds (in numbers of other pigs) shows that 1.5% of pig farms have at least 400 other pigs and manage 75.7% of these (Figure 2) and 49.1% of the sows. These figures conceal national differences: only 21.6% of other pigs in Poland are kept in such farms as compared to the figure of 90% or more in nine Member States (IE, CY, DK, EE, ES, IT, BE, UK and CZ). On the other hand, the animals kept in small units of less than 10 other pigs are important in RO (66.2%), BG (34.8%) and LT (31.9%). At the EU level, although these small units manage 5.3% of other pigs, they account for 85.8% of the pig farms.
Herd size: breeding sows
Two types of pig farm may be distinguished based on the number of breeding sows: the fatteners and the breeder-fatteners. Almost half of the other pigs (47.3%) are kept by fatteners, i.e. on farms without sows. However, this particular figure hides a range of different situations: 77.2% of the other pigs are reared by fatteners with more than 400 animals, whereas 95.7% of the fatteners have fewer than 10 pigs, mainly for own consumption. More than half of these numerous small farms (57.2%) are in Romania.
Figure 2: Distribution of numbers of other pigs by herd size (FSS 2007)
0%
20%
40%
60%
80%
100%
IE CY DK EE ES IT BE UK
CZ NL
SE FR LU DE PT SK GR FI HU LT LV BG MT
AT NO SI RO PL
EU-2
7
EU-1
5
NM
S-12
<10 other pigs 10-<400 other pigs >=400 other pigs
Source: Eurostat (ef_ls_gvopig)
Breeding sows, other pigs and herd size
Besides the numerous small fatteners, the other pigs are shared between three further significant types of farm. Of the largest farms with at least 400 other pigs, the pure fatteners and the large breeder-fatteners with at least 100 sows manage
similar numbers of other pigs and the large breeder-fatteners feed almost half of the sow herd. A third group accounts for a quarter of the pig farms and manages one fifth of the other pigs and the remaining half of breeding sows.
The breakdown of other pigs among the four types of pig farm (Table 1) is shown by country in Figure 3.
• The small fatteners (no sows and fewer than 10 other pigs) represent a significant share of pig production and at least 10% of other pigs in seven of the new Member States (BG, LV, LT, HU, RO, SI and SK). The importance of own consumption in pig production limits the sensitivity of this type of production to market conditions.
• The large fatteners (no sows and at least 400 other pigs) account for more than one third of other pigs in ten countries (BE, DK, DE, ES, IT, LU, NL, FI, SE and UK). They reflect a production organised between specialised breeders (which nevertheless have other pigs) and fatteners. These 10 countries represent two thirds of the other pigs and three quarters of the EU pigmeat production. In FR and EE the distribution is intermediate between that typical of large fatteners or large breeders (see bellow).
Statistics in focus — 8/2010 3
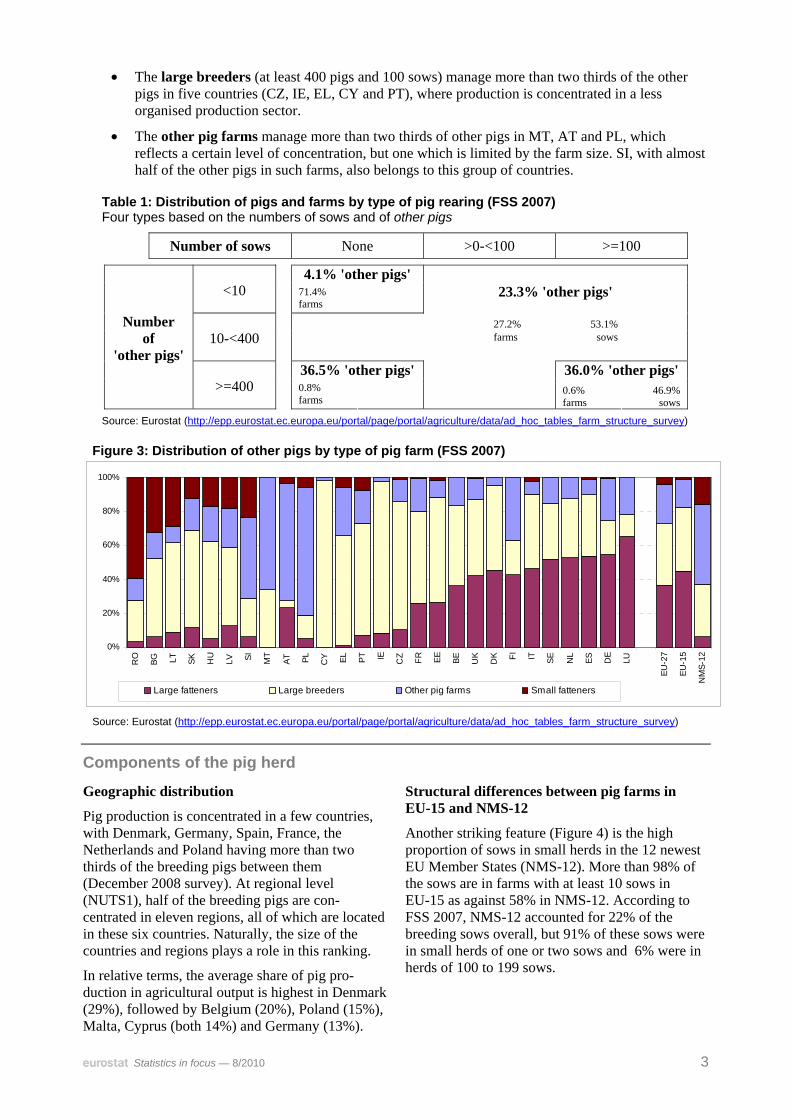
• The large breeders (at least 400 pigs and 100 sows) manage more than two thirds of the other pigs in five countries (CZ, IE, EL, CY and PT), where production is concentrated in a less organised production sector.
• The other pig farms manage more than two thirds of other pigs in MT, AT and PL, which reflects a certain level of concentration, but one which is limited by the farm size. SI, with almost half of the other pigs in such farms, also belongs to this group of countries.
Table 1: Distribution of pigs and farms by type of pig rearing (FSS 2007) Four types based on the numbers of sows and of other pigs
Number of sows None >0-<100 >=100
4.1% 'other pigs' <10 71.4%
farms 23.3% 'other pigs'
27.2% 53.1% 10-<400
farms sows
36.5% 'other pigs' 36.0% 'other pigs'
Number of
'other pigs'
>=400 0.8% farms
0.6% farms
46.9%sows
Source: Eurostat (http://epp.eurostat.ec.europa.eu/portal/page/portal/agriculture/data/ad_hoc_tables_farm_structure_survey)
Figure 3: Distribution of other pigs by type of pig farm (FSS 2007)
0%
20%
40%
60%
80%
100%
RO
BG LT SK HU
LV SI MT
AT PL CY EL PT IE CZ FR EE BE UK
DK FI IT SE NL
ES DE
LU
EU-2
7
EU-1
5
NM
S-12
Large fatteners Large breeders Other pig farms Small fatteners
Source: Eurostat (http://epp.eurostat.ec.europa.eu/portal/page/portal/agriculture/data/ad_hoc_tables_farm_structure_survey)
Components of the pig herd
Geographic distribution
Pig production is concentrated in a few countries, with Denmark, Germany, Spain, France, the Netherlands and Poland having more than two thirds of the breeding pigs between them (December 2008 survey). At regional level (NUTS1), half of the breeding pigs are con-centrated in eleven regions, all of which are located in these six countries. Naturally, the size of the countries and regions plays a role in this ranking.
In relative terms, the average share of pig pro-duction in agricultural output is highest in Denmark (29%), followed by Belgium (20%), Poland (15%), Malta, Cyprus (both 14%) and Germany (13%).
Structural differences between pig farms in EU-15 and NMS-12
Another striking feature (Figure 4) is the high proportion of sows in small herds in the 12 newest EU Member States (NMS-12). More than 98% of the sows are in farms with at least 10 sows in EU-15 as against 58% in NMS-12. According to FSS 2007, NMS-12 accounted for 22% of the breeding sows overall, but 91% of these sows were in small herds of one or two sows and 6% were in herds of 100 to 199 sows.

4 8/2010 — Statistics in focus
Figure 4: Distribution of the sows by herd size in EU-15 and NMS-12 (FSS 2007)
EU-15
NMS-12
0%
20%
40%
60%
80%
100%
1-2 3-4 5-9 10-19 20-49 50-99 100-199 >=200 All
% sows
Herd size (sows) Source: Eurostat (ef_ls_gvsows)
Components of the pig herd – types of animal
The livestock survey provides more detailed figures about the livestock population (see methodological notes). The number of sows or piglets determines the number of fattening pigs, which in turn determines the number of pigs to be slaughtered several months later.
The number of boars per sow (Table 2) reflects the frequency of artificial insemination, and also the importance of the herds in natural service. This shows how rapid genetic progress can be. One boar covers on average more than 50 sows in
Belgium, Ireland and the Netherlands, but fewer than 10 in Greece and Croatia.
The percentage of new sows (gilts) reflects the pressure to renew the breeding animals and is another determinant of genetic progress.
The pig population can be divided into two groups i.e. breeding pigs and meat pigs (Figure 5). The former provide the production factors for the latter. The breeding pigs are renewed by keeping young pigs from the previous year and slaughtering (culling) old pigs. The meat pigs can be sold at different stages as pigs to be fattened or as fattened pigs to be slaughtered.
Figure 5: Pig population (EU-27) Livestock population, December survey, 2008
50 kg Fattening and cull pigs
26.55 Mio
80 kg
110 kg
22.70 Mio
8.51 Mio
Piglets
40.33 Mio
Young pigs
34.96 Mio
20 kg
Live weight
for the first time
Sows covered
1.67 Mio
sows
Other covered
7.92 Mio
Not yet covered
Gilts
1.55 Mio
not covered
Other sows
1.55 Mio
Sows 13.96 Mio
Boars 0.29 Mio
Breeding animals
replacement
cull
birth
Source: Eurostat (apro_mt_lspig)
Components of the pig herd – trade of live animals
The intra-EU exchanges (Comext) of pigs less than 50 kg amounted to around 200 000 tonnes in 2008. Assuming an average weight of 25 kg, this is equivalent to 8 million young pigs (Figure 6). This annual production, which represents a flow over year, cannot be compared directly with the population of young pigs at any given moment. Germany is the main importer of young pigs, with
77% of EU imports, and Denmark is the main exporter with 74% of EU exports. In addition, Germany is the main importer of breeding animals (46%) and Denmark is the main exporter (23%). Germany is also the main importer of non-breeder pigs weighing at least 50 kg, i.e. mostly for slaughtering (Figure 7).

Statistics in focus — 8/2010 5
Figure 6: Net exchanges of young pigs Scheme of the intra-EU exchanges (2008)
Figure 7: Net exchanges of pigs for slaughtering Scheme of the intra-EU exchanges (2008)
NL
ES
AT
RO
PL
DE
DK
IT
AT RO
PL
DK
IT
HU
DENL
ES
Source: Eurostat (comext)
Arrow width is proportional to the volume of intra-EU foreign trade surplus (in tons). The 10 main surpluses on pigs weighing less than 50 kg account for 89% of the overall balances
Source: Eurostat (comext)
Arrow width is proportional to the volume of intra-EU foreign trade surplus (in tons). The 10 main surpluses on pigs with a live weighing at least 50 kg account for 88% of the overall balances
It can be seen from these maps that pig production is specialized even across borders, with breeders such as Denmark, fatteners such as Spain and mixed producers such as the Netherlands. Germany, Denmark and the Netherlands form a single pig production area (see page 1).
Changes and trends
Changes in the pig population
The total number of sows represents the production capacity. Between 2006 and 2008, the number of sows fell by 10%. In the 12 New Member States the reduction was stee-per (-27%) than in the 15 older Member States (-6%), with certain exceptions in each group. The decline was less marked in Estonia and Latvia in the first group and in Italy,
Figure 8: Change in the number of sows and piglets In EU-15 and EU27, December surveys
EU-15
EU-27
10
11
12
13
14
15
16
17
1994 1996 1998 2000 2002 2004 2006 200830
35
40
45
50Sows (million) Piglets (million)
Source: Eurostat (apro_mt_lspig)
Luxembourg, the Netherlands and Portugal in the second group. In Greece the number of sows actually increased. Such extreme changes are a combination of several phenomena, which have a varying impact depending on the structure of pig
production. The general decrease concerns all countries, but the underlying phenomenon is one of concentration, i.e. an increase in the size of the largest herds together with the disappearance of the smallest. The trend is towards a decrease in the
6 8/2010 — Statistics in focus
number of breeding sows and, in the medium term, this change in the structure of pig production in NMS-12 can be expected to continue.
Figure 8 shows that the decrease in the number of sows is balanced by a gain in productivity. The number of piglets in EU-15 is even showing a slight increase.
The most recent data come from the livestock survey carried out in May/June 2009. These figures
are provided by countries with at least 3 000 000 pigs, and the Member States concerned account for 85% of the EU pig population (according to the December survey). They show a yearly trend of -0.85% for sows, -0.56% for fattening pigs and -0.39% for piglets, i.e. -0.60% for all pigs. This rate of change is less marked than that observed in previous years (-3.79%) and indicates a lower rate of decrease. This would be comparable to the previous 5-year trend.
Changes in farm structure The structural data allow us to distinguish three types of national trend, depending on the changes in the number of sows from large farms with at least 200 sows and of those from small farms with fewer than 10 sows.
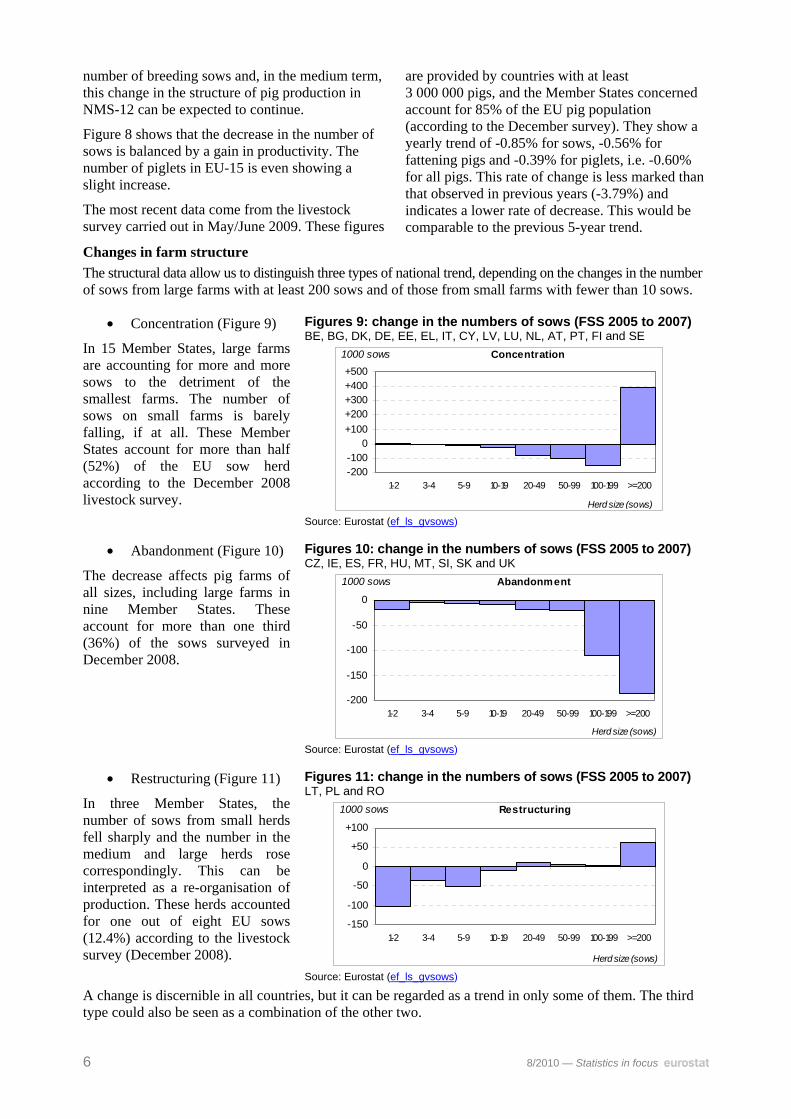
• Concentration (Figure 9)
In 15 Member States, large farms are accounting for more and more sows to the detriment of the smallest farms. The number of sows on small farms is barely falling, if at all. These Member States account for more than half (52%) of the EU sow herd according to the December 2008 livestock survey.
Figures 9: change in the numbers of sows (FSS 2005 to 2007) BE, BG, DK, DE, EE, EL, IT, CY, LV, LU, NL, AT, PT, FI and SE
-200-100
0+100+200+300+400+500
1-2 3-4 5-9 10-19 20-49 50-99 100-199 >=200
1000 sows
Herd size (sows)
Concentration
Source: Eurostat (ef_ls_gvsows)
• Abandonment (Figure 10)
The decrease affects pig farms of all sizes, including large farms in nine Member States. These account for more than one third (36%) of the sows surveyed in December 2008.
Figures 10: change in the numbers of sows (FSS 2005 to 2007) CZ, IE, ES, FR, HU, MT, SI, SK and UK
-200
-150
-100
-50
0
1-2 3-4 5-9 10-19 20-49 50-99 100-199 >=200
1000 sows
Herd size (sows)
Abandonment
Source: Eurostat (ef_ls_gvsows)
• Restructuring (Figure 11)
In three Member States, the number of sows from small herds fell sharply and the number in the medium and large herds rose correspondingly. This can be interpreted as a re-organisation of production. These herds accounted for one out of eight EU sows (12.4%) according to the livestock survey (December 2008).
Figures 11: change in the numbers of sows (FSS 2005 to 2007) LT, PL and RO
-150
-100
-50
0
+50
+100
1-2 3-4 5-9 10-19 20-49 50-99 100-199 >=200
1000 sows
Herd size (sows)
Restructuring
Source: Eurostat (ef_ls_gvsows)
A change is discernible in all countries, but it can be regarded as a trend in only some of them. The third type could also be seen as a combination of the other two.


8
8/2010 — S
tatistics in focus
Table 2: Statistics on the pig population, slaughtering and pigmeat production
Number of sows Sows New sows Slaughtering: 2008 2009 Gross indigenous production (GIP) 2
Change % 1000 heads per boar % 1000 tons 1000 heads Country
2008/2004 December 2008 1000 heads
1000 tons
, of which domestic
(%) 2009-S1 2008 2009-S1 2009-S2(f) 2010-S1 (f)
Change forecast
BE -6.0% 543.2 86.2 24.9% 11 157 1 056.2 - 533.3 10 684.3 5 493.7 4 851 4 855 -11.6% BG -20.3% 76.9 23.3 19.4% 993 72.9 44.8% 18.4 989.8 265.0 577 351 +32.5% CZ -33.0% 212.0 60.6 29.5% 3 804 336.5 5.8% 144.7 3 728.5 1 648.1 1 409 1 421 -13.8% DK -8.8% 1 289.0 107.4 34.1% 20 790 1 707.4 - 789.3 27 079.0 9 593.8 13 650 13 950 +45.4% DE -6.9% 2 296.4 69.2 22.6% 54 848 5 111.4 0.5% 2 599.6 47 376.8 27 708.2 22 555 22 156 -20.0% EE -8.1% 34.0 56.7 26.5% 496 39.6 11 %1 16.2 581.2 200.4 237 225 +12.3% IE -7.3% 154.7 103.1 23.7% 2 578 202.5 0.1%1 97.2 3 038.3 1 194.0 1 468 1 492 +25.0% EL +6.7% 142.0 8.9 26.1% 1 913 119.0 : 53.3 2 110.0 840.0 1 122 927 +10.4% ES -5.5% 2 541.6 44.5 17.3% 41 306 3 484.4 - 1 690.0 40 824.0 19 744.4 20 197 20 013 +1.4% FR -5.0% 1 201.0 70.6 22.6% 25 735 2 276.7 12.2% 998.4 26 041.9 12 347.5 12 925 12 780 +3.5% IT -2.0% 756.4 31.3 21.8% 13 616 1 606.0 12 % 794.0 13 204.2 6 281.2 6 521 6 341 +1.0% CY -8.9% 48.3 53.7 21.3% 725 59.2 : 28.4 659.4 347.6 371 340 -2.2% LV -8.3% 47.6 47.6 41.0% 524 40.7 13%1 13.2 538.9 175.8 238 235 +33.7% LT -19.9% 78.1 65.1 23.9% 937 75.9 27% 19.6 1 262.5 251.7 503 577 +129.2% LU -1.4% 7.3 73.0 30.1% 150 10.0 3.1% 4.7 105.9 66.0 54 45 -31.8% HU -20.7% 314.0 52.3 26.8% 4 994 460.4 15.1% 190.5 4 844.4 2 083.5 2 270 2 280 +9.4% MT -10.3% 7.0 17.5 24.3% 102 8.5 - 3.6 89.4 43.7 53 40 -8.5% NL -2.4% 1 025.0 68.3 23.9% 14 505 1 317.7 <1% 609.9 22 617.0 6 600.2 11 600 11 725 +77.6% AT -7.2% 290.9 42.2 19.0% 5 553 525.9 : 265.0 4 881.2 2 735.6 2 310 2 350 -14.1% PL -28.4% 1 278.8 36.4 14.4% 22 321 1 888.0 12% 772.0 21 878.4 9 029.8 9 200 10 100 +11.9% PT -2.2% 303.2 27.6 24.0% 5 976 381.3 0.2% 181.6 5 395.0 2 766.1 2 757 2 513 -9.2% RO -27.7% 376.4 29.2 37.6% 5 660 455.1 35% 98.7 5 714.0 1 288.9 3 468 1 560 +21.0% SI -19.7% 41.9 32.2 24.6% 381 31.4 0.8% 12.3 626.3 146.1 310 : : SK -39.8% 63.5 25.4 29.9% 1 084 102.4 19.8% 33.7 1 082.4 371.8 428 538 +44.7% FI -8.4% 167.1 42.8 28.8% 2 459 217.1 0.6%1 104.7 2 458.3 1 172.0 1 208 1 142 -2.6% SE -5.2% 168.0 52.5 37.0% 3 073 270.8 : 132.7 2 937.0 1 492.5 1 407 1 444 -3.2% UK -7.1% 487.0 28.6 23.6% 9 427 739.6 - 356.4 8 822.5 4 508.1 4 547 4 395 -2.5%
EU-27 -10.4% 13 951.2 47.6 23.1% 255 107 22 596.4 : 10 561.3 259 570.7 118 395.5 126 240 124 100 +4.8% EU-15 -5.6% 11 372.8 50.7 23.3% 213 085 19 025.7 : 9 210.0 217 575.5 102 543.2 107 170 106 130 +3.5% EU-25 -9.7% 13 497.9 48.7 22.7% 248 454 22 068.4 : 10 444.2 252 866.9 116 841.6 122 190 122 190 +4.6%
HR -18.3% 157.3 32.8 18.1% 2 492 : : 34.5 : 466.3 : : : Source: Eurostat (apro_mt_lspig, apro_mt_pann, apro_mt_pwgtm, apro_mt_ppighq)
1 Estimates for all species together 2 2008: yearly data; 2009 and 2010 by semester (S1 or S2) (f): forecast : not available - : real zero
Statistics in focus — 8/2010 9
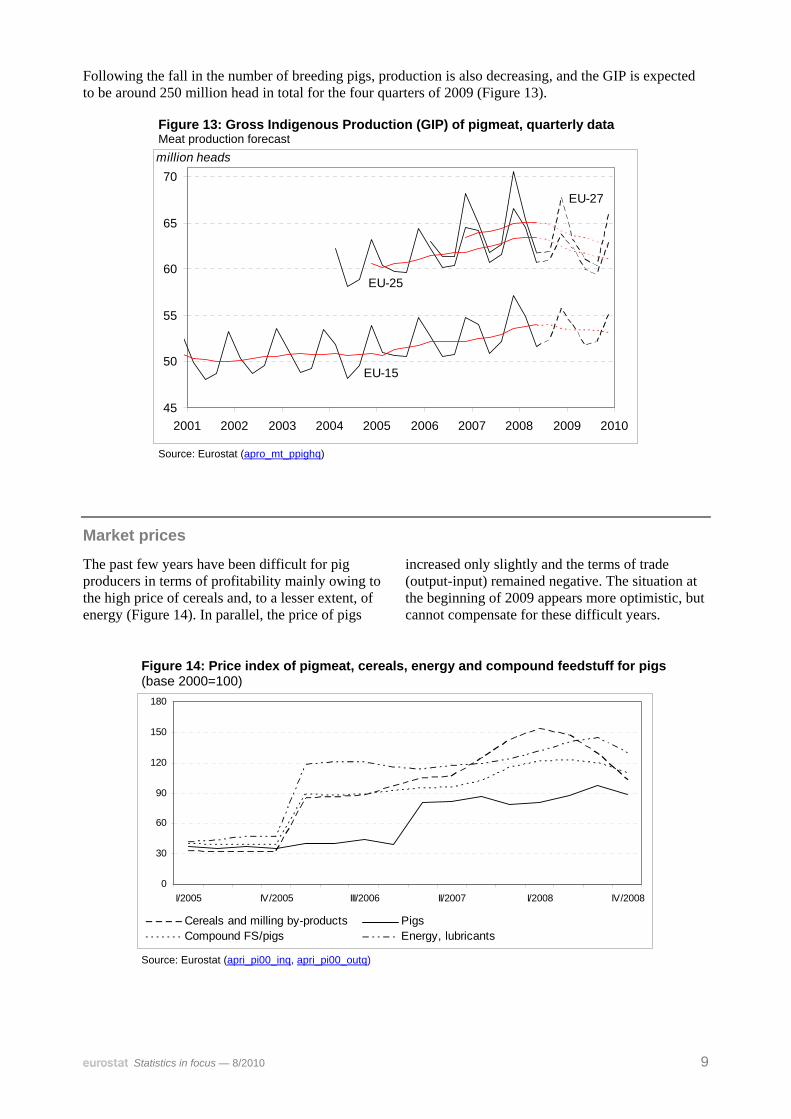
Following the fall in the number of breeding pigs, production is also decreasing, and the GIP is expected to be around 250 million head in total for the four quarters of 2009 (Figure 13).
Figure 13: Gross Indigenous Production (GIP) of pigmeat, quarterly data Meat production forecast
EU-27
EU-15
EU-25
45
50
55
60
65
70
2001 2002 2003 2004 2005 2006 2007 2008 2009 2010
million heads
Source: Eurostat (apro_mt_ppighq)
Market prices
The past few years have been difficult for pig producers in terms of profitability mainly owing to the high price of cereals and, to a lesser extent, of energy (Figure 14). In parallel, the price of pigs
increased only slightly and the terms of trade (output-input) remained negative. The situation at the beginning of 2009 appears more optimistic, but cannot compensate for these difficult years.
Figure 14: Price index of pigmeat, cereals, energy and compound feedstuff for pigs (base 2000=100)
0
30
60
90
120
150
180
I/2005 IV/2005 III/2006 II/2007 I/2008 IV/2008
Cereals and milling by-products PigsCompound FS/pigs Energy, lubricants
Source: Eurostat (apri_pi00_inq, apri_pi00_outq)
10 8/2010 — Statistics in focus
Methodological notes
Farm Structure Survey, a robust survey with a wide scope Eurostat database: Structure of agricultural holdings (ef)
From 2009 onwards the structure of livestock rearing no longer forms part of the survey as such. Thus, the data are drawn from the farm structure survey (FSS). Although this allows a wider scope (including land use, livestock, labour force, etc.) and a longer reference period, the results are less informative about the pig population than the data previously collected through the livestock surveys. Also the categories of pigs surveyed are limited to three: piglets with a live weight of less than 20 kg, breeding sows (weighing 50 kg and over) and other pigs. This latter category covers fattening pigs and also boars, cull sows, gilts, and various other pigs of at least 20 kg. Most of these other pigs are fattening pigs.
Four times per decade the farm structure survey records data about the farm structure which can be used for describing the structure of animal herds. Legal basis Since 21 December 2008, Regulation (EC) No 1166/2008 of the European Parliament and of the Council of 19 November 2008 on farm structure surveys and the survey on agricultural production methods and repealing Council Regulation (EEC) No 571/88 (OJ L 321, 1.12.2008, p. 14). Previously, Council Regulation (EEC) No 571/88 of 29 February 1988 on the organisation of Community surveys on the structure of agricultural holdings (OJ L 56, 2.3.1988, p. 1)..
Livestock survey, a frequent specialized survey Eurostat database: Agricultural products (apro) > Animal production (apro_mt) > Livestock (apro_mt_ls)
The livestock survey provides information about the livestock population at national and regional level. The relevant data are intended to be more precise than the FSS figures for the three categories above. Furthermore, the nomenclature of livestock contains more animal categories. All Surveys are conducted in all countries once a year (in December). Two other surveys used to be conducted in April and August up to 2008, but they have now been merged into a single intermediate survey, in order to track the changes in the animal categories. This is less burdensome for the smaller changes and makes it possible to concentrate on core topics or geographical areas. Thus the Member States with few animals are allowed to provide updates less frequently. The Member States are required to deliver regional data for the results of the December survey. Legal basis:
Since 21 December 2008, Regulation (EC) No 1165/2008 of the European Parliament and of the Council of 19 November 2008 concerning livestock and meat statistics and repealing Council Directives 93/23/EEC, 93/24/EEC and 93/25/EEC (OJ L 321, 1.12.2008, p. 1). Previously, Council Directive 93/23/EEC of 1 June 1993 on the statistical surveys to be carried out on pig production (OJ L 149, 21.6.1993, p. 1).
Slaughtering and meat production statistics, forecast and updated figures Eurostat database: Agricultural products (apro) > Animal production (apro_mt) > Meat production (apro_mt_p)
Slaughtering statistics are collected on a monthly basis. They refer to the activity of slaughterhouses, now defined as 'officially registered and approved establishments used for slaughtering and dressing animals whose meat is intended for human consumption'. The share of domestic slaughtering (i.e. outside such slaughterhouses) was explicitly left out of the figures by this new definition in order to improve the comparability of the results across Member States, but with a break in the time series.
From the slaughtering and the balance of external trade for live animals, the gross indigenous production (GIP) can be estimated, as can the national production of pigs for slaughtering. The GIP is forecast by the Member States, which provide Eurostat with these figures once or twice a year. Legal basis: see livestock survey
Statistics in focus — 8/2010 11
Agricultural price statistics Eurostat database: Agricultural prices and price indices (apri)> Price indices of agricultural products (apri_pi)
Data collection for agricultural price statistics (agricultural price indices and absolute agricultural prices) is based on a gentlemen's agreement following the methodological descriptions from the Handbook for EU agricultural price statistics.
The main use for absolute agricultural prices is to compare the price level between Member States and to study sales channels. On the other side, agricultural price indices are used above all in connection with the analysis of price developments and the effect on agricultural income.
External trade statistics, an exhaustive database Eurostat database: External Trade (external)
The statistics on external trade statistics record the monthly trade of the Member States in terms of imports and exports between Member States or with the third countries provided, as reported by the traders on the basis of Customs (extra-EU) and Intrastat (intra-EU) declarations. Legal basis: For the extra-EU trade, Council Regulation (EC) No 1172/95 of 22 May 1995 on the statistics relating to the trading of goods by the Community and its Member States with non-member countries (OJ L 118, 25.5.1995, p. 10–14). For the intra-EU trade, Regulation (EC) No 638/2004 of the European Parliament and of the Council of 31 March 2004 on Community statistics relating to the trading of goods between Member States and repealing Council Regulation (EEC) No 3330/91 (OJ L 102, 7.4.2004, p. 1-8).
Symbols and acronyms
Countries: BE: Belgium EL: Greece LU: Luxembourg RO: Romania BG: Bulgaria ES: Spain HU: Hungary SI: Slovenia CZ: Czech Republic FR: France MT: Malta SK: Slovakia DK: Denmark IT: Italy NL: Netherlands FI: Finland DE: Germany CY: Cyprus AT: Austria SE: Sweden EE: Estonia LV: Latvia PL: Poland UK: United Kingdom IE: Ireland LT: Lithuania PT: Portugal HR: Croatia
Country aggregates: EU-27: European Union (27 countries) – EU-15, NMS-12 EU-15: European Union (15 countries) - BE, DK, DE, IE, EL, ES, FR, IE, LU, NL, AT, PT, FI, SE, UK NMS-12: New Member States (12 countries) - BG, CZ, EE, CY, LV, LT, HU, MT, PL, RO, SI, SK
Pig husbandry
Pig farming is organised in a more or less sophisticated way, but it can always be analysed on the basis of the production cycle and is divided into two parts: farrowing sows for the production of weaned piglets and then their rearing, as future breeding animals or as pigs for slaughtering. In a non-organised sector the genetic selection is managed within each herd, with the breeding animals being kept from the grown pigs (gilts) or purchased outside (boars) and used for natural service. In a more sophisticated organisation the breeding animals are produced in specialised farms taking part in a thorough selection scheme (nucleus-multipliers-breeders). The sows are usually inseminated artificially and patch farrowed. Depending on the efficiency of the selection scheme, the pig fattening performance is improved. The functions of breeders, farrowers and fatteners can be combined and the fattening can be divided into growing and finishing. The housing of pigs may vary from confined buildings for rapid standardised production to outdoor extensive production, as well as all the forms of organisation in between. Most of the production is conducted according to optimised intensive methods, and extensive farming may either be in response to consumer demand (e.g. organic farming) or be used for own consumption. In such cases, the piglets grown and fattened in winter make use of cereals, food waste, by-products, buildings or labour force.

Further information Eurostat Website: http://ec.europa.eu/eurostat Data on ”Agriculture Statistics” http://epp.eurostat.ec.europa.eu/portal/page/portal/agriculture/data/database More information about “Agriculture statistics” http://epp.eurostat.ec.europa.eu/portal/page/portal/agriculture/introduction Journalists can contact the media support service: Bech Building Office A4/125 L - 2920 Luxembourg Tel. (352) 4301 33408 Fax (352) 4301 35349 E-mail: [email protected] European Statistical Data Support: With the members of the ‘European statistical system’, Eurostat has set up a network of support centres in nearly all Member States and in some EFTA countries. Their mission is to provide help and guidance to Internet users of European statistical data. Contact details for this support network can be found on our Internet site: http://ec.europa.eu/eurostat/ All Eurostat publications can be ordered via EU Bookshop http://bookshop.europa.eu/
Manuscript completed on: 02.02.2010 Data extracted on: 03.11.2009 ISSN 1977-0316 Catalogue number: KS-SF-10-008-EN-N © European Union, 2010