Embed Size (px)
Citation preview
Piezoelectric Insoles and Mobile Application for Osteoarthritis Pain and Exercise
Management
Abstract
Osteoarthritis (OA) is a painful disease characterized by cartilage degradation of
weightbearing joints that affects approximately 27 million American adults1. While moderate
exercise may slow cartilage degeneration, patients must manage it carefully. Underexercising
leads to joint weakness and decreased mobility2, and overexercising of already affected joints
causes pain and may further damage cartilage3. So far, we have not found an existing effective,
affordable solution to monitor knee OA patients’ exercise and pain.
To fill this gap, we propose a reliable method to monitor OA patients’ exercise using
piezoelectric pressuresensing insoles connected by Bluetooth to an exercisemonitoring
smartphone application. Used with conventional imaging (MRI or Xray) at checkups, this
device would help clinicians correlate patient activity (from plantar pressure data) to OA
progression and determine personalized exercise limits. Our prototype insole successfully
measured and transmitted realtime pressure data from six sensors under various areas of the foot
to a smartphone application via Bluetooth. More development and testing, including testing
sensor quality and incorporating machine learning features, are needed to fully characterize the
system. Once functional, the device may also allow clinicians to use pressure patterns as an
indirect measure of OA progression.
Introduction
Osteoarthritis (OA) is a degenerative joint disease that occurs when the cartilage at
weightbearing joints such as the knees and hips wears down from use or after injury, causing
extreme pain and bone damage2. It is the most common form of arthritis, especially amongst
middleaged adults, and currently affects around 27 million Americans1. The severity of OA in a
given patient is determined by the widely used KellgrenLawrence grading scale, based on the
degree of bone deformity and joint space4. There is currently no complete cure for knee OA
except whole knee replacement surgery2, 5. Patients must rely on regular exercise combined with
prescription painkillers to slow the cartilage degeneration and ease their pain, respectively2.
While exercise may strengthen joints, patients must carefully manage their exercise, as
underexercising will lead to joint stiffness and weakness, and overexercising may damage
cartilage and cause severe pain2, 3. Unfortunately, clinicians have little quantitative data on how
exercise affects joints, and they cannot determine exactly what constitutes overexercise and
underexercise for a given patient, making it difficult for them to prescribe exercise treatments.
After a literature search, we could not find any effective and affordable solutions
available to monitor OA patients’ exercise longterm and relate their physiological condition to
their exercise habits. While other devices that measure plantar pressure, ground reaction forces,
or knee loading have been produced, they are often not for personal use by patients6. Instruments
that measure knee pressure are often incorporated into knee prosthetics and require knee
replacement surgery to install, which is not feasible or necessary for many patients7. Force plates,
which are used to measure ground reaction forces, are not portable and are only able to capture
data for a small area, making them inconvenient for use outside of a laboratory6. Moticon, sells
1
pressure and motionsensitive insoles and analysis software that can be tailored to an
individual’s specific needs, but they are expensive (upwards of $1,000 for the software and
$2,000 for the insoles)8,9. Novel Electronics’ emed and pedar systems give highresolution data
and have many analysis capabilities such as center of pressure calculation and synchronization
with motioncapture technology, but they are also expensive and more for research purposes than
for use by patients themselves10.
Taking advantage of the lack of existing affordable OA exercise tracking systems, we
developed a device specifically for OA patients to measure pressure under the footbed so the
data collected can be correlated to OA progression. With this device, we hope to give both
clinicians and patients a tool to help them understand the relationship between exercise and OA
and make better informed decisions for optimal treatment.
Design Criteria
We needed an accessible and accurate way to constantly measure and record knee
pressure and pain of knee OA patients to help clinicians determine how patient activity affects
physical joint condition and personalize recommendations for patient exercise based on
quantitative data. In addition, patients must be able to selfreport their pain as they exercise,
which may help clinicians associate intensity of exercise to the level of pain patients feel. This
level may be subjective, but should be compared to some baseline objective measurement if
possible. The device would need to keep an accurate and complete record of the patient’s knee
pressure in an easily accessible format for patients and clinicians to understand and see patterns
in the data. The device should be comfortable, noninvasive, and easy for a patient with little to
no training to use outside of a lab setting, so as to encourage longterm regular use and maximize
2
data collection. It should be relatively inexpensive and simple for widespread personal use, since
many preexisting products that measure and analyze gait cost thousands of dollars, are not
intended for use outside a laboratory setting, and are not specifically tailored to OA patients’
needs (clinicianaccessible and with pain tracking features)6, 8, 9, 10. Durability and convenience
are also important requirements that should be considered for a knee pressure data collection
device. If possible, the device should be waterproof, since many recommended exercises for OA
patients are done in water2. An added benefit would be the ability to measure pressure on the hip
joint as well as the knee.
Concept
Keeping these needs in consideration, we propose pressuresensitive shoe insoles and
mobile application that can be easily incorporated into OA patients’ everyday lives. Insoles
should be flexible and thin enough to fit inside a patient’s shoe without discomfort or damage to
the insole from body heat, pressure, or humidity. The removable insole would be able to measure
plantar pressure, or pressure under the foot, with piezoelectric sensors embedded inside.
Although we have not found any studies that directly connect plantar pressure with knee
pressure, the type of activity a patient performs affects both plantar pressure11 and knee
loading7, 12, so we used plantar pressure as a proxy measurement for patient activity, which would
in turn be an indicator of knee pressure. The plantar pressure data would be wirelessly
transmitted from the sensors to the application on the patient’s smartphone via Bluetooth, as well
as to the cloud, so the clinician can then access the data. Patients would be able to view a graph
of their pressure data in real time on the app, as well as enter in their selfreported pain values,
which would range from 1 to 10 and be recorded and shown on the pressure graph at the time
3
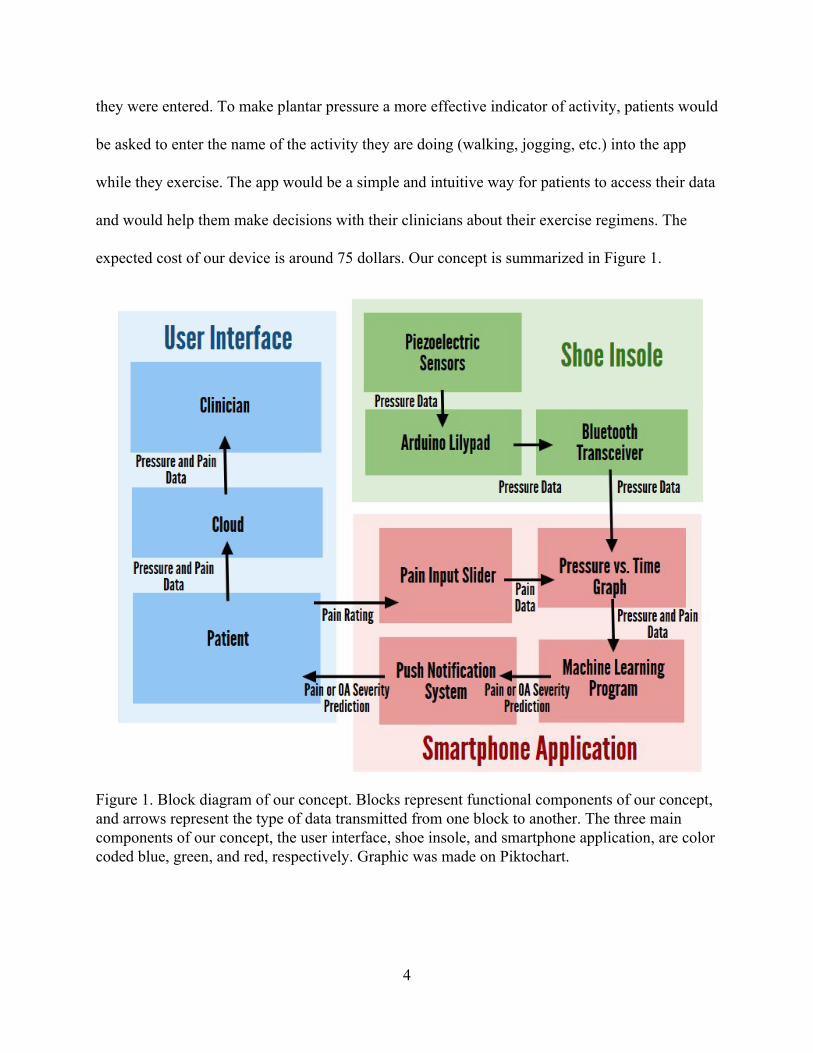
they were entered. To make plantar pressure a more effective indicator of activity, patients would
be asked to enter the name of the activity they are doing (walking, jogging, etc.) into the app
while they exercise. The app would be a simple and intuitive way for patients to access their data
and would help them make decisions with their clinicians about their exercise regimens. The
expected cost of our device is around 75 dollars. Our concept is summarized in Figure 1.
Figure 1. Block diagram of our concept. Blocks represent functional components of our concept, and arrows represent the type of data transmitted from one block to another. The three main components of our concept, the user interface, shoe insole, and smartphone application, are color coded blue, green, and red, respectively. Graphic was made on Piktochart.
4
When used by enough OA patients, this device should be able to collect sufficient
pressure and pain data to be used for a number of applications. We mainly focused on
characterizing the relationship between patient exercise habits and radiological OA progression.
This can be accomplished by regularly comparing the record of the patient’s exercise from
pressure data on the app to the physical condition of the patient’s joint as evaluated by clinicians
during checkups using Xray or other imaging technology.
Other applications we envisioned include comparing the pressure data of patients with
different OA severity ratings on the KellgrenLawrence scale and characterizing each rating
group’s pressure patterns. Plantar pressure data can be used to calculate ground reaction forces
(GRF) on a patient13, 14, and thus measure the knee adduction moment (KAM), which is linked to
OA progression15, 16. If pressure data of patients is found to differ based on OA severity, it may
be possible to measure the condition of a patient by his or her pressure patterns alone, which
would eventually allow clinicians and patients to track OA progression without using Xray or
other imaging unless absolutely necessary. This knowledge could be used to predict when an OA
patient requires full or partial knee replacement surgery, to determine the effect that low,
moderate, or highintensity exercise has on OA progression and the exact divisions between
intensity levels, and to measure efficacy of different OA treatments in comparative experiments
instead of using subjective disability selfreports.
Implementation
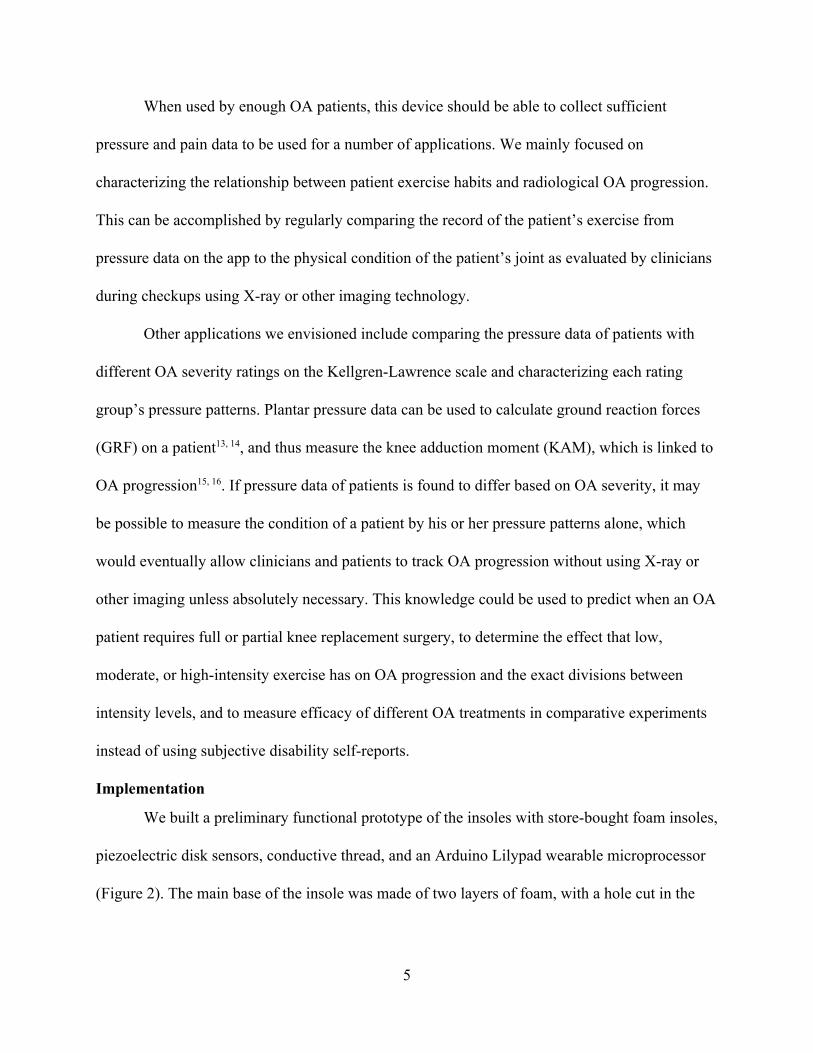
We built a preliminary functional prototype of the insoles with storebought foam insoles,
piezoelectric disk sensors, conductive thread, and an Arduino Lilypad wearable microprocessor
(Figure 2). The main base of the insole was made of two layers of foam, with a hole cut in the
5
bottom layer so the Arduino would fit comfortably and unobtrusively between the layers. Each
of the six piezoelectric sensors, which can convert pressure into voltage, is 20 mm in diameter.
The six sensors were positioned under the six general areas of the foot that bear the most
pressure: the medial heel, lateral heel, first metatarsal, second metatarsal, lateral metatarsal, and
hallux17. These sensor positions may be personalized for different patients’ feet, but should
remain under the foot structures listed. Holes were cut through the top layer of the insole so that
the leads of each sensor could connect to the Arduino and resistors fixed to the underside of the
top layer.
Figure 2. The inside of the insoles. The Arduino, Bluetooth module, and resistors are sewn to the top layer of foam and wired together with conductive thread as described in the text. In this figure, the sensors are shown under the top layer, but in the final prototype they are located on the other side of the layer, on top of the insole. The bottom layer has holes cut out to fit the Arduino and Bluetooth module inside without crushing them.
6
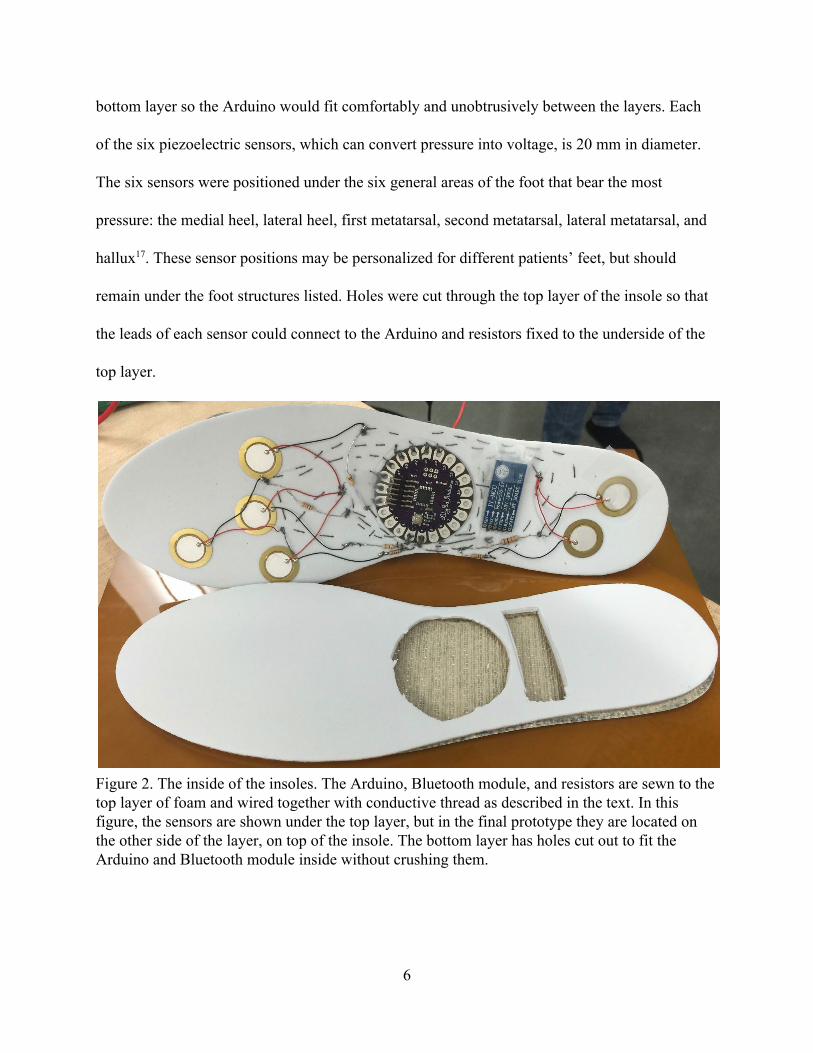
Based on the ThreeTone Keyboard tutorial and Knock tutorial on the Arduino website,
the positive leads of the sensors were connected to the Arduino’s 5V terminal, and the negative
leads were connected to each of the six analog input pins of the Arduino as well as to ground
through six 10 kiloohm resistors (Figure 3)18, 19. For software serial communication, the
Arduino’s digital input pins 10 and 11 were connected to the transmitting (TX) and receiving
(RX) pins, respectively, of an HC06 slave Bluetooth module, which was also wired to the 5V
and ground pins of the Arduino (Figure 3)20. These connections were all soldered first, then sewn
to the top layer of the insole with conductive thread to secure all components firmly in place.
Because the bottom layer of the insole is cut to expose the Arduino and Bluetooth, the prototype
can be reprogrammed without separating the insole layers, using an FTDI chip and cable to
connect the insole to a computer when the insole is not in use.
Figure 3. Schematic of the prototype insole. We used FSR to represent the pressure sensors, A for the analog input pins of the Arduino, D for the digital input pins of the Arduino, 5V for the power, GND for the ground, and RX and TX for the receiving and transmitting pins of the Arduino and Bluetooth module. This schematic was adapted from the schematic for the simple keyboard tutorial on the Arduino website21.
7
The prototype insole is capable of collecting pressure data from a person standing on it
and transmitting the data through Bluetooth to a phone paired with the Arduino. Pressure on the
insole, after being converted to voltage by the piezoelectric sensors in each area, is measured by
the Arduino in arbitrary units from 0 to 1023 and can be printed as different values for each
sensor or as a sum of all sensor readings in the serial port19. Other combinations of data from the
different sensors are possible with reprogramming of the Arduino. These values can be converted
to volts or kPa within the Arduino with a given calibration factor. Data can be viewed in real
time from a paired device on any Bluetooth app acting as a serial terminal in which data is
printed as numbers, such as Hazim Bitar’s ArduDroid app, which we used to test this feature22.
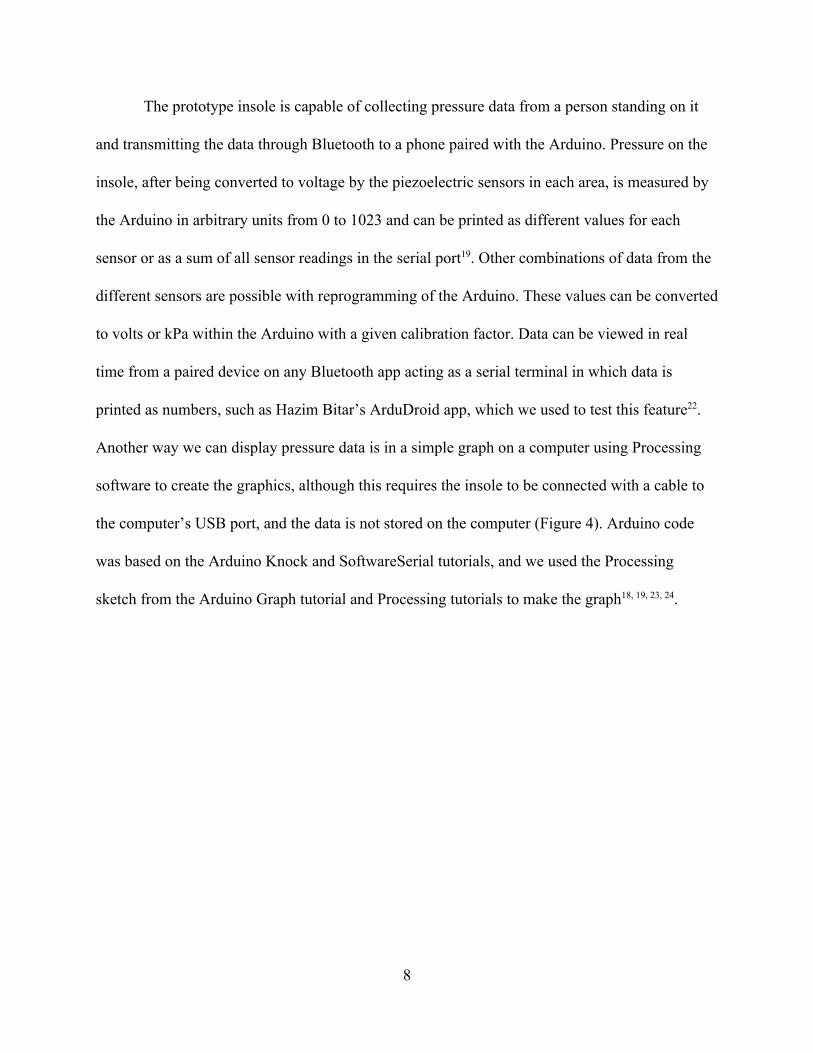
Another way we can display pressure data is in a simple graph on a computer using Processing
software to create the graphics, although this requires the insole to be connected with a cable to
the computer’s USB port, and the data is not stored on the computer (Figure 4). Arduino code
was based on the Arduino Knock and SoftwareSerial tutorials, and we used the Processing
sketch from the Arduino Graph tutorial and Processing tutorials to make the graph18, 19, 23, 24.
8
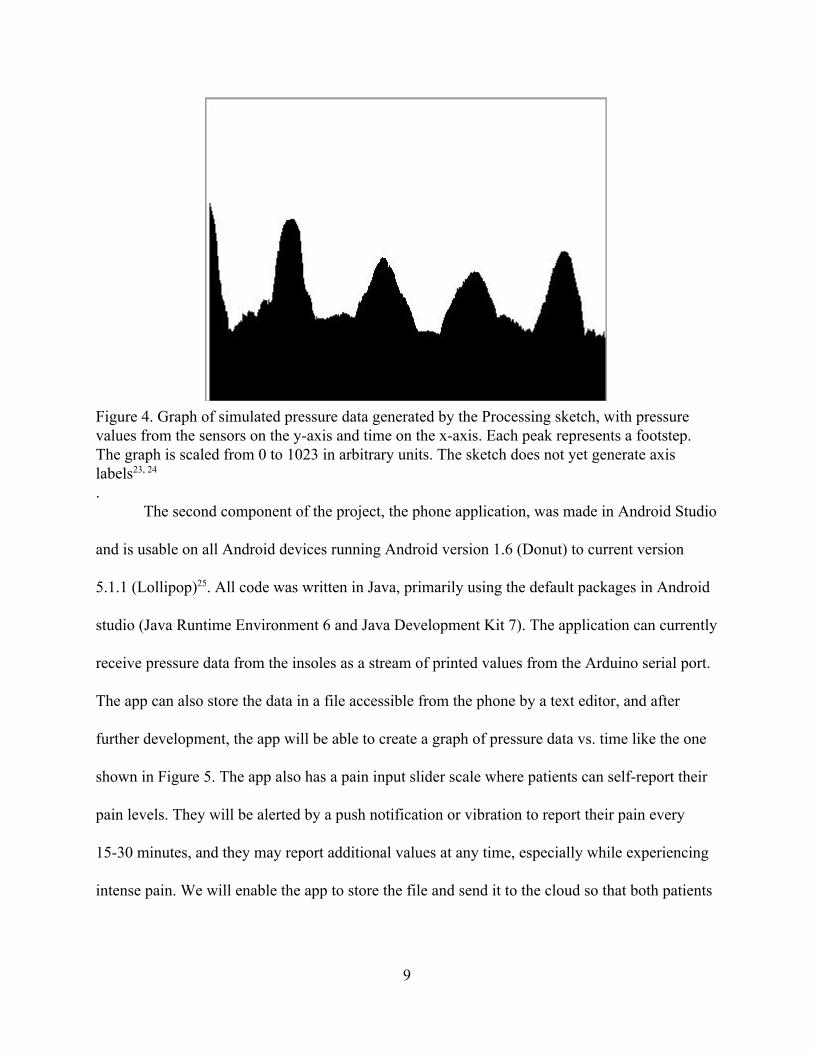
Figure 4. Graph of simulated pressure data generated by the Processing sketch, with pressure values from the sensors on the yaxis and time on the xaxis. Each peak represents a footstep. The graph is scaled from 0 to 1023 in arbitrary units. The sketch does not yet generate axis labels23, 24 .
The second component of the project, the phone application, was made in Android Studio
and is usable on all Android devices running Android version 1.6 (Donut) to current version
5.1.1 (Lollipop)25. All code was written in Java, primarily using the default packages in Android
studio (Java Runtime Environment 6 and Java Development Kit 7). The application can currently
receive pressure data from the insoles as a stream of printed values from the Arduino serial port.
The app can also store the data in a file accessible from the phone by a text editor, and after
further development, the app will be able to create a graph of pressure data vs. time like the one
shown in Figure 5. The app also has a pain input slider scale where patients can selfreport their
pain levels. They will be alerted by a push notification or vibration to report their pain every
1530 minutes, and they may report additional values at any time, especially while experiencing
intense pain. We will enable the app to store the file and send it to the cloud so that both patients
9
and clinicians can access the data and make more informed decisions about exercise and OA
progression.
Figure 5. Prospective graph of simulated pressure data that will be displayed on the app. This graph will include units and axis labels and show data in real time. Pain ratings will be displayed at the time they were reported connected to the pressure measurement at that time. A file with all of the recorded measurements will also be available on the app or a computer for tracking pressure data over long periods of time.
Future Testing and Improvements
Since the piezoelectric sensors measure data in arbitrary units (from 0 to 1023), we will
calibrate these units to kPa using pressure measurements taken with a known weight on each
sensor19. The piezoelectric sensors that we used would report abnormally high values when
touched lightly with certain modeling compounds and would occasionally display lower values
when pressed and high values without pressure. Further testing and research is needed to
determine why this is the case. After calibration of sensors and mapping of arbitrary units to kPa,
10

we will be able to test the range, consistency, and precision of measurements made by the insole,
as well as determine the most useful combination of sensor data to be shown in the app. We will
test to see how well the sensors handle overloads, temperature and pressure sensitivity, and how
long they function before they start to deteriorate. In addition, we will need to know how much
pressure under the foot is in an area not measured by the sensors and account for this, since we
were limited to only six sensors by the six Arduino pins.
We will also measure the amount of power that the microprocessor consumes and find an
optimal balance between power consumption and data resolution. We will determine the length
of time that the insoles can function on battery power, how the sampling rate of the insoles
affects their battery life, and the minimum sampling rate needed to convey useful information.
We will find a way to store the data, either on the patient’s phone or in the cloud, and minimize
required storage space so that many hours’ or even days’ worth of data may be accessed
conveniently.
Once the insoles are fully functional, we plan to evaluate their comfort by asking OA
patients or healthy individuals to try them on and answer survey questions about its fit,
cushioning, and intrusiveness of sensors. We will also ask OA patients and clinicians to help test
the app and survey them about its accessibility and ease of use. Patient feedback will be
incorporated into future revisions of the device, along with other planned features.
The first of these enhancements is a machine learning feature in the mobile app or on the
clinician’s computer that would analyze all of the pressure data recorded from one or multiple
patients for patterns that could be used to classify patients by disease severity, physical ability,
and other factors. An algorithm would look for patterns in the pressure data before patients
11
reported feeling extreme pain and predict these incidents in time to warn patients about
dangerous exercise levels with a notification on their phones. This feature would also be able to
classify different types of activities like running and walking by their pressure patterns, with the
help of an additional input section on the app where patients can report the name of the activity
they are doing. This, combined with the subjective pain data and data from patient Xrays, would
help clinicians learn more about the biomechanics of OA and what effects different kinds of
exercises have on OA progression.
Another specific addition that we plan to make to the insole is a piezoelectric generator to
power the insole. The Arduino and Bluetooth module in our current prototype must be powered
by an outside source, such as a battery, computer, or 5V direct current power supply. As these
means of powering the device are acceptable during testing but inconvenient for fulltime use,
we wish to build a piezoelectric generator into the insole. This component would harness the
pressure registered by the sensors to power the device, which would only need to be in use and
powered while the patient is walking.
Several more minor improvements could be made from the prototype to the final design.
While the conductive thread was needed to connect everything to the foam insole base, it made
the prototype insole both inconvenient to modify and vulnerable to short circuiting when two
threads touched, which required us to rework much of the wiring every time we changed the
design slightly to avoid crossed threads. In the future, we would suggest coating the conductive
thread with insulating material except where the connections to resistors and the Arduino are. In
addition, our Bluetooth module does not consistently turn on and connect to the phone,
especially if it is covered up in the insole. Putting the module in a different position inside the
12
insole or even moving it to the outside of the shoe might help, as well as trying alternative
methods to send data from Arduino to phone. We would also like to waterproof the device by
encasing it in a layer of protective material to prevent sweat, rain, or other moisture from
degrading the sensors or damaging the circuitrythis would have the added benefit of enabling
data collection while patients are exercising under water. Care must be taken so that this outer
layer does not end up affecting the sensor readings. The design should be made adaptable to
different shoe sizes, as our current prototype can only fit into shoes that are men’s size 10 and
11.
Broader future goals for this project are to improve the efficiency and design of the
circuit so it consumes less power and uses less data storage space, to consolidate the necessary
microprocessor and Bluetooth components into one chip for a thinner insole while increasing the
amount of sensors, to adapt the insoles for use as data collection devices for patients with other
diseases or healthy individuals, and to use the insoles to evaluate the effectiveness of different
OA treatments in controlled experiments.
Conclusions
The goal of this project was to enable clinicians to find a correlation between exercise
and OA progression, which would help them develop and prescribe better exercise programs for
OA patients. To do so, we designed a piezoelectric insole that sends pressure data via Bluetooth
to a mobile application and the clinician’s computer for analysis of exercise type, intensity, and
resulting patientreported pain. This device could be used not only to measure exercise levels for
comparison with Xray images, but also possibly to measure OA progression itself with the
pressure data collected from patients. Our device is noninvasive, comfortable for the patient,
13
and intuitive to use for someone with little training. Currently, we have successfully
demonstrated the data collection functionality of our prototype sensor insole and are capable of
transmitting data to a smartphone for viewing. Testing the prototype and refining our design as
necessary are our immediate next steps, which we hope to complete over the next year. We plan
to evaluate the sensor capabilities and measure the storage and power requirements of our current
design, as well as survey patients about comfort and useroriented features. The device could
also have applications for patients with other conditions, such as plantar fasciitis or diabetes, as
well as for athletes, where plantar pressure measurements are more directly useful. Ultimately,
we hope for our device to be used by actual OA patients in their daily lives and help clinicians
develop better treatments for OA. This device is a convenient, inexpensive, and reliable method
to monitor OA patients’ pain and exercise that would allow both clinicians and patients to make
more informed decisions about exercising with OA.
14

References 1. "ArthritisRelated Statistics." Centers for Disease Control and Prevention. Centers for
Disease Control and Prevention, 17 Mar. 2014. Web. 27 July 2015. 2. Lorig, Kate, and James F. Fries. The Arthritis Helpbook. 5th ed. Cambridge: Perseus,
2000. Print. 3. Andriacchi, Thomas P., et al. "A framework for the in vivo pathomechanics of
osteoarthritis at the knee." Annals of biomedical engineering 32.3 (2004): 447457. 4. Kellgren, J. H., and J. S. Lawrence. "Radiological assessment of osteoarthrosis." Annals
of the rheumatic diseases 16.4 (1957): 494. 5. "Osteoarthritis." Arthritis Foundation. Arthritis Foundation, n.d. Web. 6 Sept. 2015.
<http://www.arthritis.org/aboutarthritis/types/osteoarthritis/>. 6. Wertsch, Jacqueline J., John G. Webster, and Willis J. Tompkins. "A portable insole
plantar pressure measurement system." J Rehabil Res Dev 29.1 (1992): 1318.
7. Mündermann, Annegret, et al. "In vivo knee loading characteristics during activities of daily living as measured by an instrumented total knee replacement." Journal of Orthopaedic Research 26.9 (2008): 11671172.
8. "Product Documentation for Users." Moticon. Moticon, 2015. Web. 13 Sept. 2015. <http://www.moticon.de/support/documentation>.
9. Moticon GmbH. "OpenGo Science Price List." 27 Nov. 2014. PDF file. 10. "Systems/Software: pedar/pedoport." Novel. Novel Electronics, n.d. Web. 6 Sept. 2015.
<http://www.novelusa.com/index.php?fuseaction=systems.pedar>. 11. Rozema, Annet, et al. "Inshoe plantar pressures during activities of daily living:
implications for therapeutic footwear design." Foot & ankle international 17.6 (1996): 352359.
12. Mündermann, Annegret, et al. "In vivo knee loading characteristics during activities of
daily living as measured by an instrumented total knee replacement." Journal of Orthopaedic Research 26.9 (2008): 11671172.
15

13. FornerCordero, A., H. J. F. M. Koopman, and F. C. T. Van Der Helm. "Use of pressure
insoles to calculate the complete ground reaction forces." Journal of biomechanics 37.9 (2004): 14271432.
14. FornerCordero, A., H. J. F. M. Koopman, and F. C. T. Van der Helm. "Inverse dynamics
calculations during gait with restricted ground reaction force information from pressure insoles." Gait & posture 23.2 (2006): 189199.
15. Hunt, Michael A., et al. "Associations among knee adduction moment, frontal plane
ground reaction force, and lever arm during walking in patients with knee osteoarthritis." Journal of biomechanics 39.12 (2006): 22132220.
16. Foroughi, Nasim, Richard Smith, and Benedicte Vanwanseele. "The association of
external knee adduction moment with biomechanical variables in osteoarthritis: a systematic review." The Knee 16.5 (2009): 303309.
17. Rodgers, Mary M. "Dynamic foot biomechanics." Journal of Orthopaedic & Sports
Physical Therapy 21.6 (1995): 306316. 18. Simple keyboard using the tone() function. Arduino. Arduino, 2015. Web. 6 Sept. 2015.
<https://www.arduino.cc/en/Tutorial/Tone3>. 19. “Knock.” Arduino. Arduino, 2015. Web. 6 Sept. 2015.
<https://www.arduino.cc/en/Tutorial/Knock>. 20. “SoftwareSerial Library.” Arduino. Arduino, 2015. Web. 6 Sept. 2015.
<https://www.arduino.cc/en/Reference/SoftwareSerial>. 21. Schematic of Arduino three tone keyboard. Arduino. Arduino, 2015. Web. 6 Sept. 2015.
<https://www.arduino.cc/en/uploads/Tutorial/arduino_fsrs_speaker_schem.png>. 22. Bitar, Hazim. "ArduDroid: A Simple 2Way Bluetoothbased Android Controller for
Arduino." TechBitar. N.p., 30 Oct. 2013. Web. 28 July 2015. <http://www.techbitar.com/ardudroidsimplebluetoothcontrolforarduinoandandroid. html>.
23. “Graph.” Arduino. Arduino, 2015. Web. 6 Sept. 2015.
<https://www.arduino.cc/en/Reference/Graph>.
16

24. Reas, Casey, Ben Fry, and Daniel Shiffman. "Tutorials." Processing. Processing, June
2004. Web. 6 Sept. 2015. <https://www.processing.org/tutorials/>. 25. "Develop." Android Developers. Android, n.d. Web. 28 July 2015.
<http://developer.android.com/develop/index.html>.
17