Embed Size (px)
Citation preview
SMA SOLAR TECHNOLOGY AG Analyst / Investor Presentation Financial Results 2014 Pierre-Pascal Urbon, CEO/CFO March 26, 2015
SMA Solar Technology AG
Disclaimer
IMPORTANT LEGAL NOTICE
This presentation does not constitute or form part of, and should not be construed as, an offer or invitation to subscribe for, underwrite or otherwise acquire, any securities of SMA Solar Technology AG (the "Company") or any present or future subsidiary of the Company (together with the Company, the "SMA Group") nor should it or any part of it form the basis of, or be relied upon in connection with, any contract to purchase or subscribe for any securities in the Company or any member of the SMA Group or commitment whatsoever.
All information contained herein has been carefully prepared. Nevertheless, we do not guarantee its accuracy or completeness and nothing herein shall be construed to be a representation of such guarantee.
The information contained in this presentation is subject to amendment, revision and updating. Certain statements contained in this presentation may be statements of future expectations and other forward-looking statements that are based on the management's current views and assumptions and involve known and unknown risks and uncertainties. Actual results, performance or events may differ materially from those in such statements as a result of, among others, factors, changing business or other market conditions and the prospects for growth anticipated by the management of the Company. These and other factors could adversely affect the outcome and financial effects of the plans and events described herein. The Company does not undertake any obligation to update or revise any forward-looking statements, whether as a result of new information, future events or otherwise. You should not place undue reliance on forward-looking statements which speak only as of the date of this presentation.
This presentation is for information purposes only and may not be further distributed or passed on to any party which is not the addressee of this presentation. No part of this presentation must be copied, reproduced or cited by the addressees hereof other than for the purpose for which it has been provided to the addressee.
This document is not an offer of securities for sale in the United States of America. Securities may not be offered or sold in the United States of America absent registration or an exemption from registration under the U.S. Securities Act of 1933 as amended.
2
SMA ends 2014 with a high loss. The restructuring is well on track.
1. Net cash plus restricted cash 2.Sales between 730 MEUR and 770 MEUR ; EBIT between -30 MEUR and -60 MEUR; Depreciation/Amortization of c. 70 MEUR
3
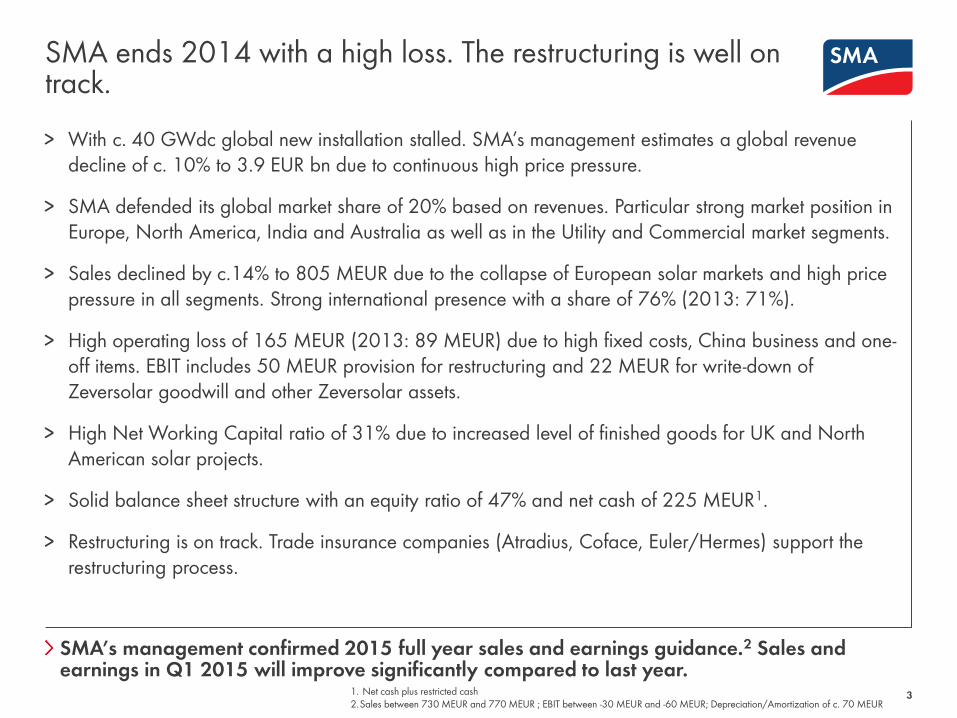
> With c. 40 GWdc global new installation stalled. SMA’s management estimates a global revenue decline of c. 10% to 3.9 EUR bn due to continuous high price pressure.
> SMA defended its global market share of 20% based on revenues. Particular strong market position in Europe, North America, India and Australia as well as in the Utility and Commercial market segments.
> Sales declined by c.14% to 805 MEUR due to the collapse of European solar markets and high price pressure in all segments. Strong international presence with a share of 76% (2013: 71%).
> High operating loss of 165 MEUR (2013: 89 MEUR) due to high fixed costs, China business and one-off items. EBIT includes 50 MEUR provision for restructuring and 22 MEUR for write-down of Zeversolar goodwill and other Zeversolar assets.
> High Net Working Capital ratio of 31% due to increased level of finished goods for UK and North American solar projects.
> Solid balance sheet structure with an equity ratio of 47% and net cash of 225 MEUR1.
> Restructuring is on track. Trade insurance companies (Atradius, Coface, Euler/Hermes) support the restructuring process.
SMA’s management confirmed 2015 full year sales and earnings guidance.2 Sales and earnings in Q1 2015 will improve significantly compared to last year.
1. Market environment and competitive landscape
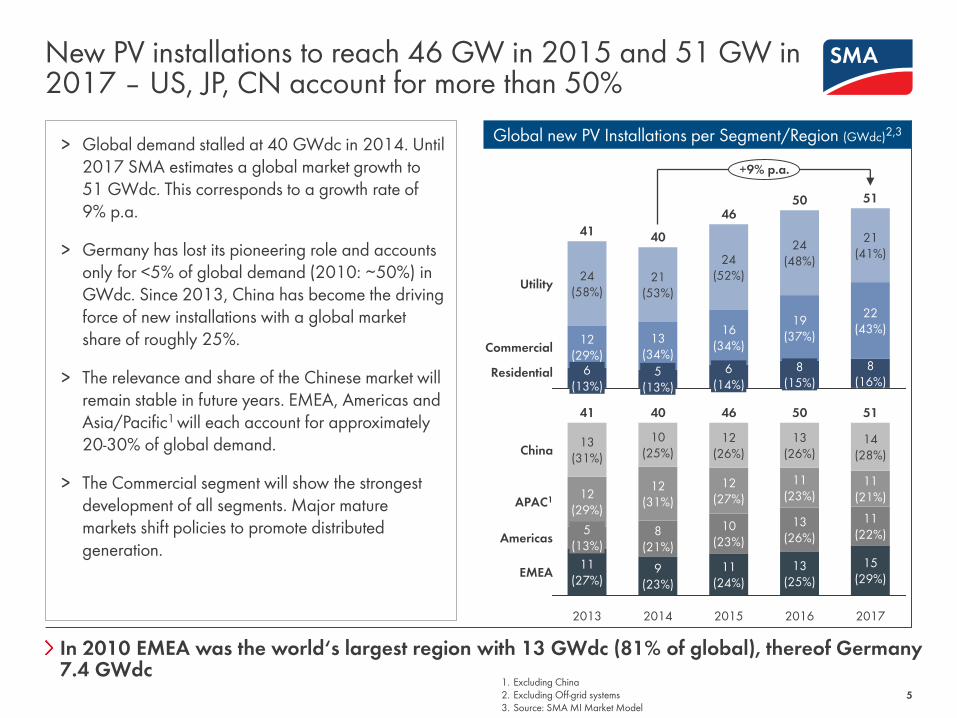
New PV installations to reach 46 GW in 2015 and 51 GW in 2017 – US, JP, CN account for more than 50%
5 1. Excluding China 2. Excluding Off-grid systems 3. Source: SMA MI Market Model
> Global demand stalled at 40 GWdc in 2014. Until 2017 SMA estimates a global market growth to 51 GWdc. This corresponds to a growth rate of 9% p.a.
> Germany has lost its pioneering role and accounts only for <5% of global demand (2010: ∼50%) in GWdc. Since 2013, China has become the driving force of new installations with a global market share of roughly 25%.
> The relevance and share of the Chinese market will remain stable in future years. EMEA, Americas and Asia/Pacific1 will each account for approximately 20-30% of global demand.
> The Commercial segment will show the strongest development of all segments. Major mature markets shift policies to promote distributed generation.
8 (15%)
19 (37%)
24 (48%)
46
6 (14%)
16 (34%)
24 (52%)
40
5 (13%)
13 (34%)
21 (53%)
41
6 (13%)
+9% p.a.
Residential
Commercial
Utility
51
8 (16%)
22 (43%)
21 (41%)
50
12 (29%)
24 (58%)
EMEA
Americas
China
APAC1
11 (27%)
5 (13%)
12 (29%)
13 (31%)
46
11 (24%)
10 (23%)
12 (27%)
12 (26%)
2014
40
9 (23%)
8 (21%)
12 (31%)
10 (25%)
2013
41
2017
51
15 (29%)
11 (22%)
11 (21%)
14 (28%)
2016
50
13 (25%)
13 (26%)
11 (23%)
13 (26%)
2015
Global new PV Installations per Segment/Region (GWdc)2,3
In 2010 EMEA was the world‘s largest region with 13 GWdc (81% of global), thereof Germany 7.4 GWdc
SMA expects a declining PV inverter market in Euro terms until 2017
6
-2% p.a.
Residential
Commercial
Utility
3.68
1.14 (31%)
1.41 (38%)
1.12 (30%)
4.06
1.21 (30%)
1.38 (34%)
1.47 (36%)
4.10
1.08 (26%)
1.38 (34%)
1.63 (40%)
3.90
0.95 (24%)
1.49 (38%)
1.46 (37%)
4.31
1.07 (25%)
1.46 (34%)
1.77 (41%)
EMEA
China
Americas
APAC2
2017
3.68
1.25 (34%)
1.02 (28%)
0.96 (26%)
0.45 (12%)
2016
4.06
1.17 (29%)
1.26 (31%)
1.21 (30%)
0.41 (10%)
2015
4.10
1.09 (27%)
1.12 (27%)
1.51 (37%)
0.37 (9%)
2014
3.90
0.96 (25%)
0.94 (24%)
1.69 (43%)
0.31 (8%)
2013
4.31
1.35 (31%)
0.66 (15%)
1.71 (40%)
0.60 (14%)
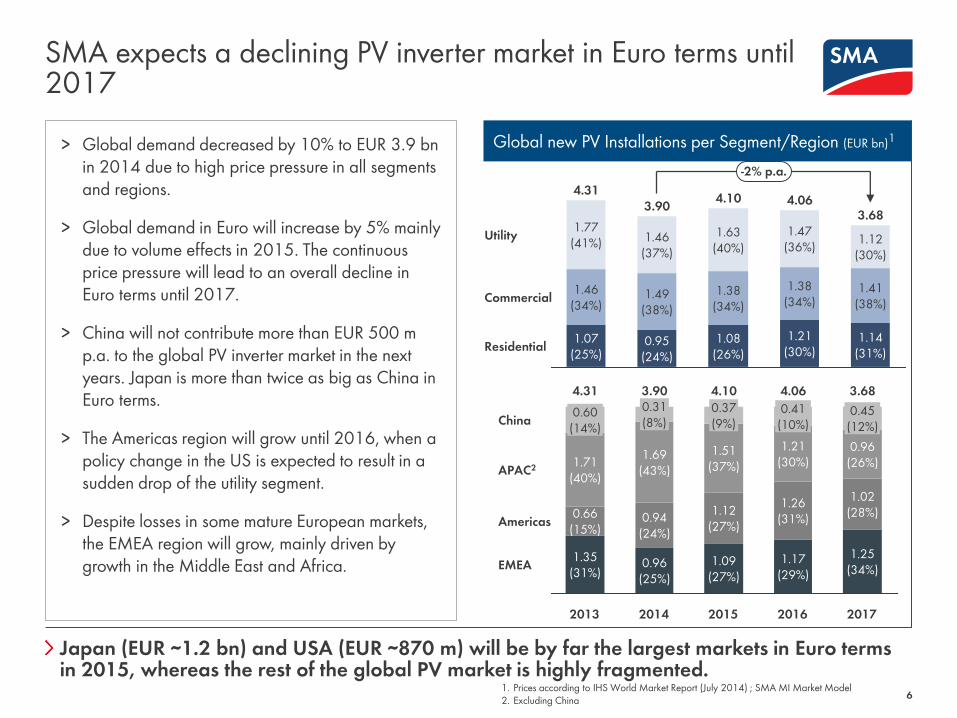
Japan (EUR ∼1.2 bn) and USA (EUR ∼870 m) will be by far the largest markets in Euro terms in 2015, whereas the rest of the global PV market is highly fragmented.
Global new PV Installations per Segment/Region (EUR bn)1 > Global demand decreased by 10% to EUR 3.9 bn
in 2014 due to high price pressure in all segments and regions.
> Global demand in Euro will increase by 5% mainly due to volume effects in 2015. The continuous price pressure will lead to an overall decline in Euro terms until 2017.
> China will not contribute more than EUR 500 m p.a. to the global PV inverter market in the next years. Japan is more than twice as big as China in Euro terms.
> The Americas region will grow until 2016, when a policy change in the US is expected to result in a sudden drop of the utility segment.
> Despite losses in some mature European markets, the EMEA region will grow, mainly driven by growth in the Middle East and Africa.
1. Prices according to IHS World Market Report (July 2014) ; SMA MI Market Model 2. Excluding China
Only a few players serve all PV applications and all solar markets
7
1.Source: SMA analysis based on intern. financial reports and IHS market shares as well as SMA estimates
2.Source: Public Information
4% 2%
1%
Comp. 4
2% 4%
Comp. 5
4% 3%
Comp. 2
10%
15%
Comp. 7
3%
Comp. 6 Comp. 3
6%
2%
Comp. 8
8%
3%
Comp. 1
8%
4%
SMA
15% 15%
4%
Comp. 6
4%
Comp. 4
3% 4%
Comp. 8 Comp. 5
3% 3%
7%
Comp. 2
5% 5%
Comp. 7
3% 2%
Comp. 1
12%
6%
SMA
20% 21%
Comp. 3
2%
9% 7%
20
13
20
14
20
13
20
14
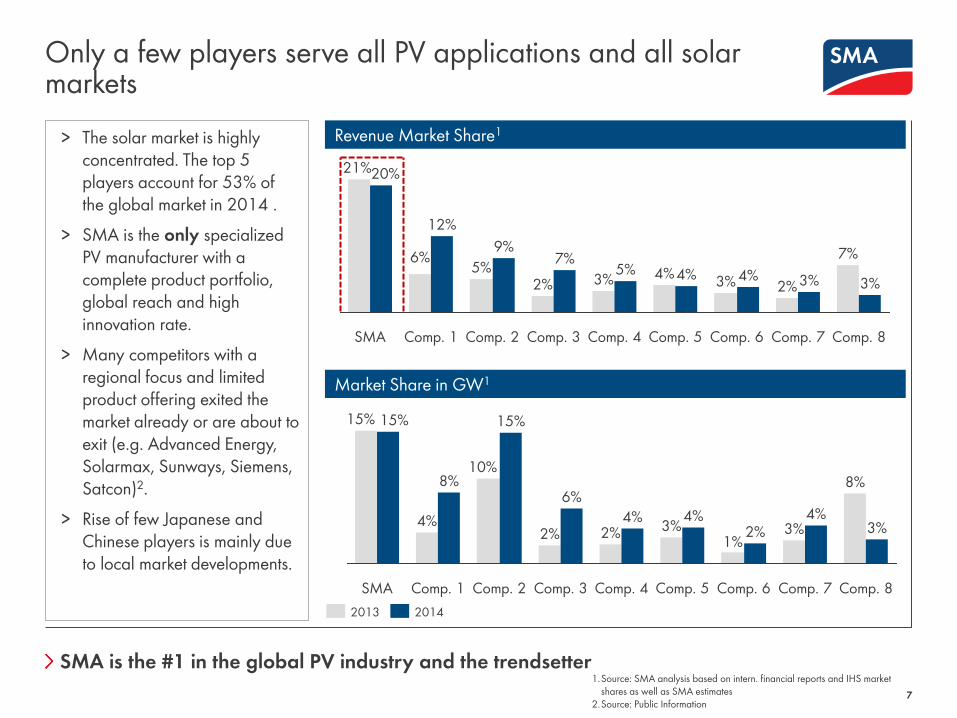
SMA is the #1 in the global PV industry and the trendsetter
> The solar market is highly concentrated. The top 5 players account for 53% of the global market in 2014 .
> SMA is the only specialized PV manufacturer with a complete product portfolio, global reach and high innovation rate.
> Many competitors with a regional focus and limited product offering exited the market already or are about to exit (e.g. Advanced Energy, Solarmax, Sunways, Siemens, Satcon)2.
> Rise of few Japanese and Chinese players is mainly due to local market developments.
Revenue Market Share1
Market Share in GW1
2013 2014
2. SMA‘s Unique Positioning
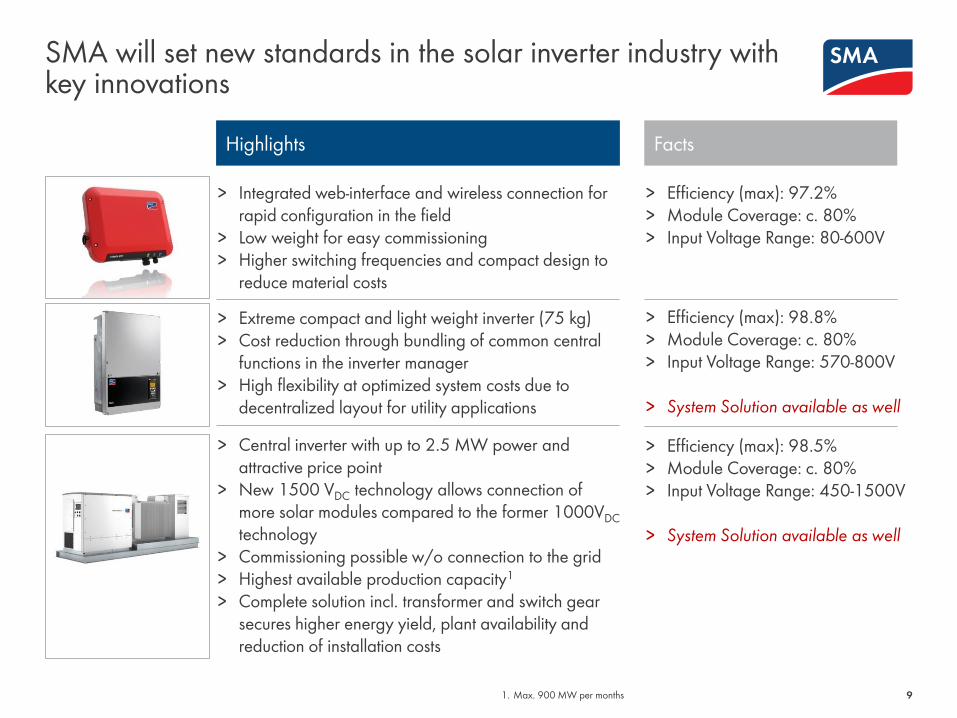
SMA will set new standards in the solar inverter industry with key innovations
> Integrated web-interface and wireless connection for rapid configuration in the field
> Low weight for easy commissioning > Higher switching frequencies and compact design to
reduce material costs
Highlights Facts
> Efficiency (max): 97.2% > Module Coverage: c. 80% > Input Voltage Range: 80-600V
> Extreme compact and light weight inverter (75 kg) > Cost reduction through bundling of common central
functions in the inverter manager > High flexibility at optimized system costs due to
decentralized layout for utility applications
> Efficiency (max): 98.8% > Module Coverage: c. 80% > Input Voltage Range: 570-800V
> System Solution available as well
> Central inverter with up to 2.5 MW power and attractive price point
> New 1500 VDC technology allows connection of more solar modules compared to the former 1000VDC technology
> Commissioning possible w/o connection to the grid > Highest available production capacity1
> Complete solution incl. transformer and switch gear secures higher energy yield, plant availability and reduction of installation costs
> Efficiency (max): 98.5% > Module Coverage: c. 80% > Input Voltage Range: 450-1500V
> System Solution available as well
9 1. Max. 900 MW per months
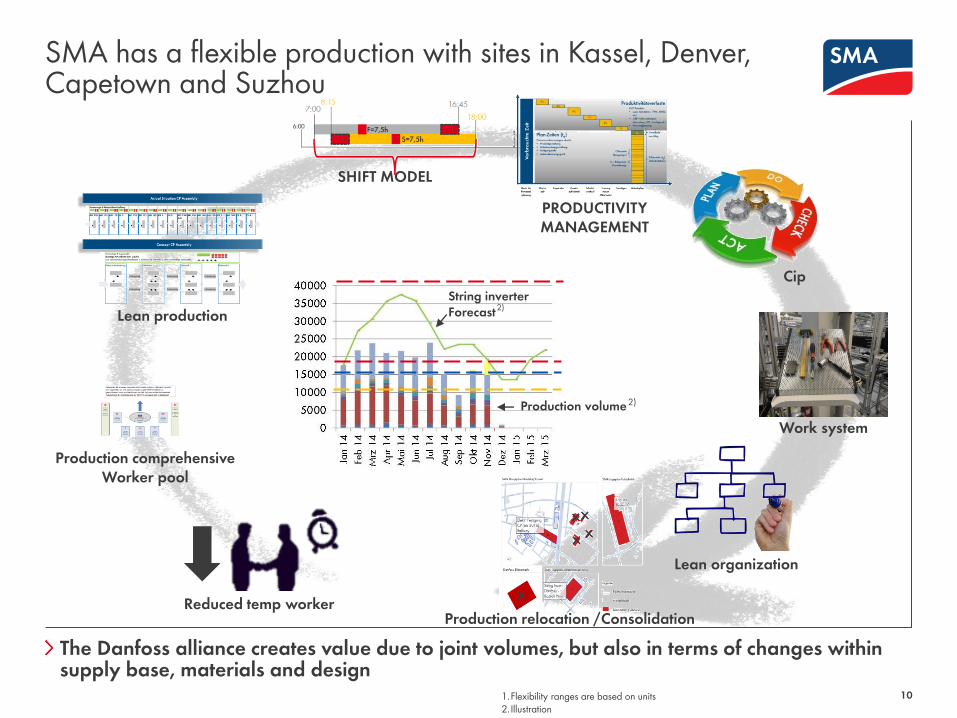
SMA has a flexible production with sites in Kassel, Denver, Capetown and Suzhou
Reduced temp worker
SHIFT MODEL
PRODUCTIVITY MANAGEMENT
Work system
Production relocation /Consolidation
Production comprehensive Worker pool
Lean production
Cip
Lean organization
String inverter Forecast
Production volume
10
The Danfoss alliance creates value due to joint volumes, but also in terms of changes within supply base, materials and design
1.Flexibility ranges are based on units 2.Illustration
2)
2)
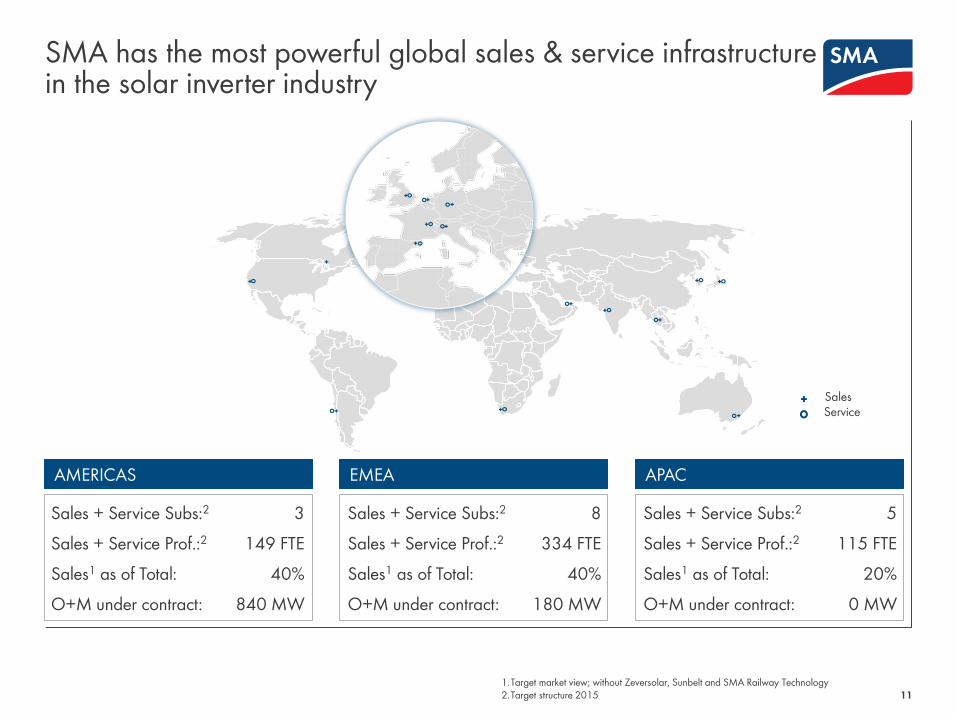
SMA has the most powerful global sales & service infrastructure in the solar inverter industry
11
AMERICAS
Sales + Service Subs:2 3
Sales + Service Prof.:2 149 FTE
Sales1 as of Total: 40%
O+M under contract: 840 MW
EMEA
Sales + Service Subs:2 8
Sales + Service Prof.:2 334 FTE
Sales1 as of Total: 40%
O+M under contract: 180 MW
APAC
Sales + Service Subs:2 5
Sales + Service Prof.:2 115 FTE
Sales1 as of Total: 20%
O+M under contract: 0 MW
Sales Service
1.Target market view; without Zeversolar, Sunbelt and SMA Railway Technology 2.Target structure 2015
3. Financials
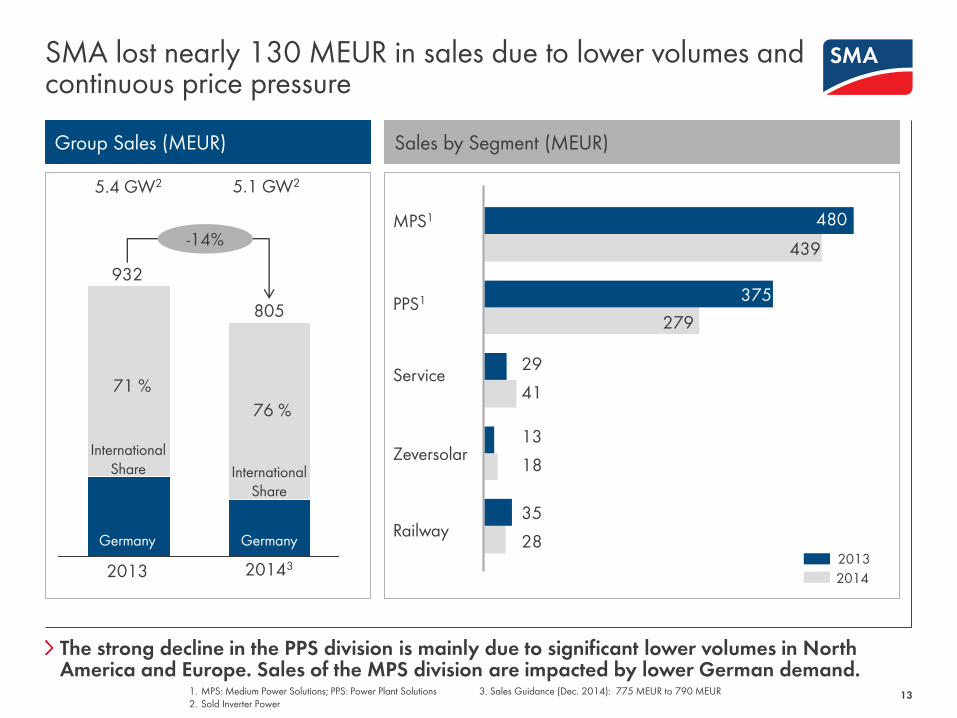
The strong decline in the PPS division is mainly due to significant lower volumes in North America and Europe. Sales of the MPS division are impacted by lower German demand.
SMA lost nearly 130 MEUR in sales due to lower volumes and continuous price pressure
13 1. MPS: Medium Power Solutions; PPS: Power Plant Solutions 3. Sales Guidance (Dec. 2014): 775 MEUR to 790 MEUR 2. Sold Inverter Power
2013 20143
Group Sales (MEUR) Sales by Segment (MEUR)
MPS1
PPS1
Service
Zeversolar
Railway
480
439
375
279
29
41
13
18
35
28
932
805
-14%
5.4 GW2 5.1 GW2
Germany Germany
International Share International
Share
2014
2013
71 %
76 %
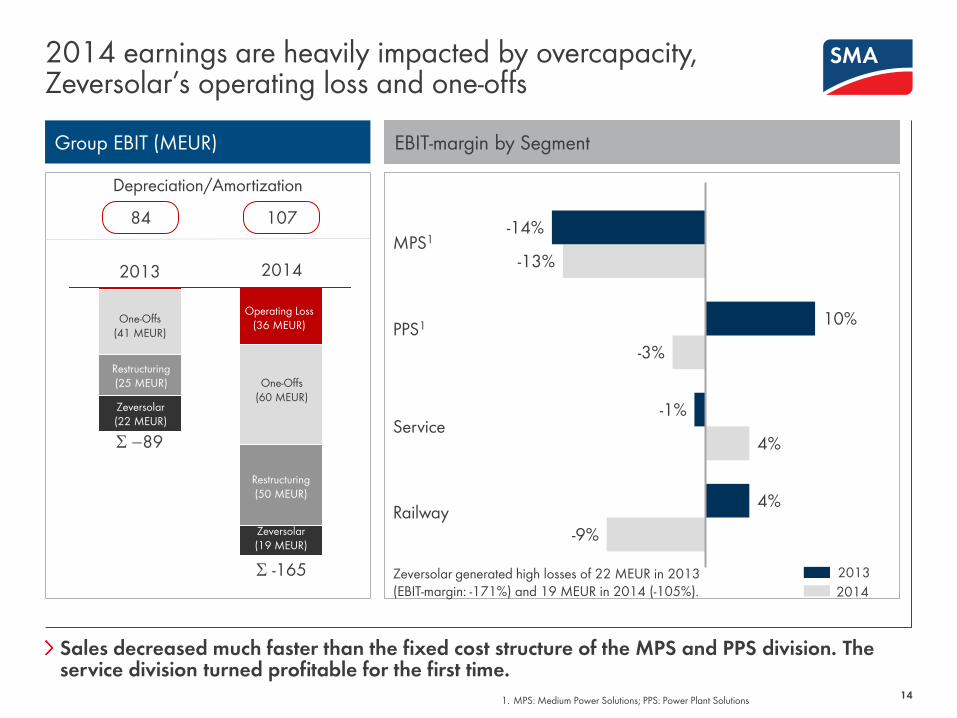
Sales decreased much faster than the fixed cost structure of the MPS and PPS division. The service division turned profitable for the first time.
2014 earnings are heavily impacted by overcapacity, Zeversolar’s operating loss and one-offs
14 1. MPS: Medium Power Solutions; PPS: Power Plant Solutions
Group EBIT (MEUR) EBIT-margin by Segment
Depreciation/Amortization
84 107
2013 2014
S -89
S -165
Zeversolar (22 MEUR)
Restructuring (25 MEUR)
One-Offs (41 MEUR)
Operating Loss (36 MEUR)
One-Offs (60 MEUR)
Restructuring (50 MEUR)
Zeversolar (19 MEUR)
MPS1
PPS1
Service
Railway -9%
4%
-3%
-13%
4%
-1%
10%
-14%
2014
2013 Zeversolar generated high losses of 22 MEUR in 2013 (EBIT-margin: -171%) and 19 MEUR in 2014 (-105%).
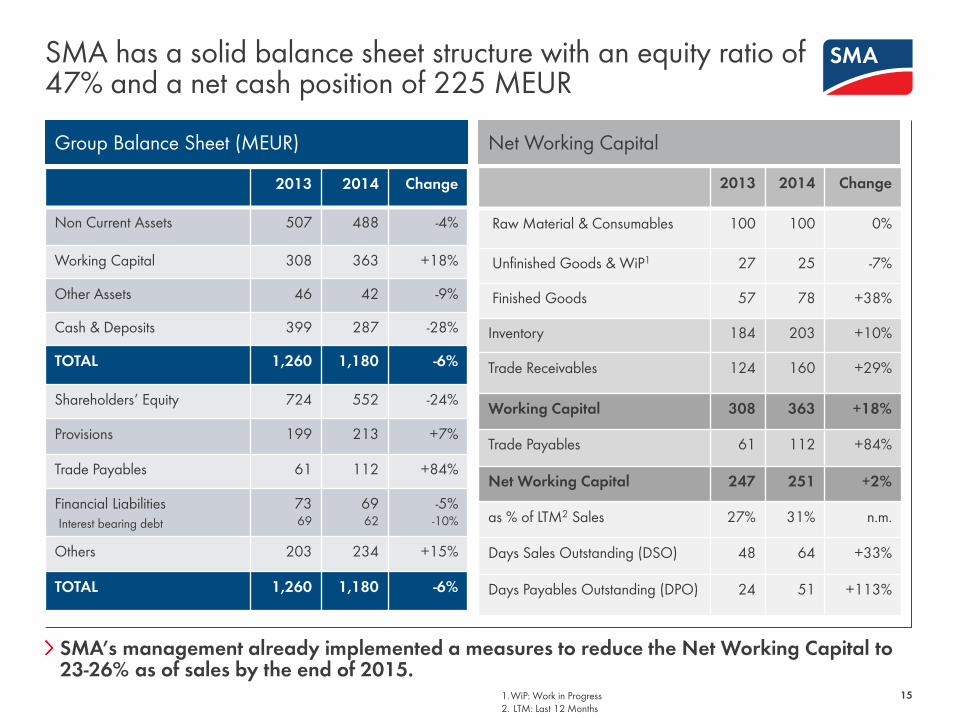
SMA’s management already implemented a measures to reduce the Net Working Capital to 23-26% as of sales by the end of 2015.
SMA has a solid balance sheet structure with an equity ratio of 47% and a net cash position of 225 MEUR
15
Group Balance Sheet (MEUR) Net Working Capital
1.WiP: Work in Progress 2. LTM: Last 12 Months
2013 2014 Change
Non Current Assets 507 488 -4%
Working Capital 308 363 +18%
Other Assets 46 42 -9%
Cash & Deposits 399 287 -28%
TOTAL 1,260 1,180 -6%
Shareholders‘ Equity 724 552 -24%
Provisions 199 213 +7%
Trade Payables 61 112 +84%
Financial Liabilities Interest bearing debt
73 69
69 62
-5% -10%
Others 203 234 +15%
TOTAL 1,260 1,180 -6%
2013 2014 Change
Raw Material & Consumables 100 100 0%
Unfinished Goods & WiP1 27 25 -7%
Finished Goods 57 78 +38%
Inventory 184 203 +10%
Trade Receivables 124 160 +29%
Working Capital 308 363 +18%
Trade Payables 61 112 +84%
Net Working Capital 247 251 +2%
as % of LTM2 Sales 27% 31% n.m.
Days Sales Outstanding (DSO) 48 64 +33%
Days Payables Outstanding (DPO) 24 51 +113%
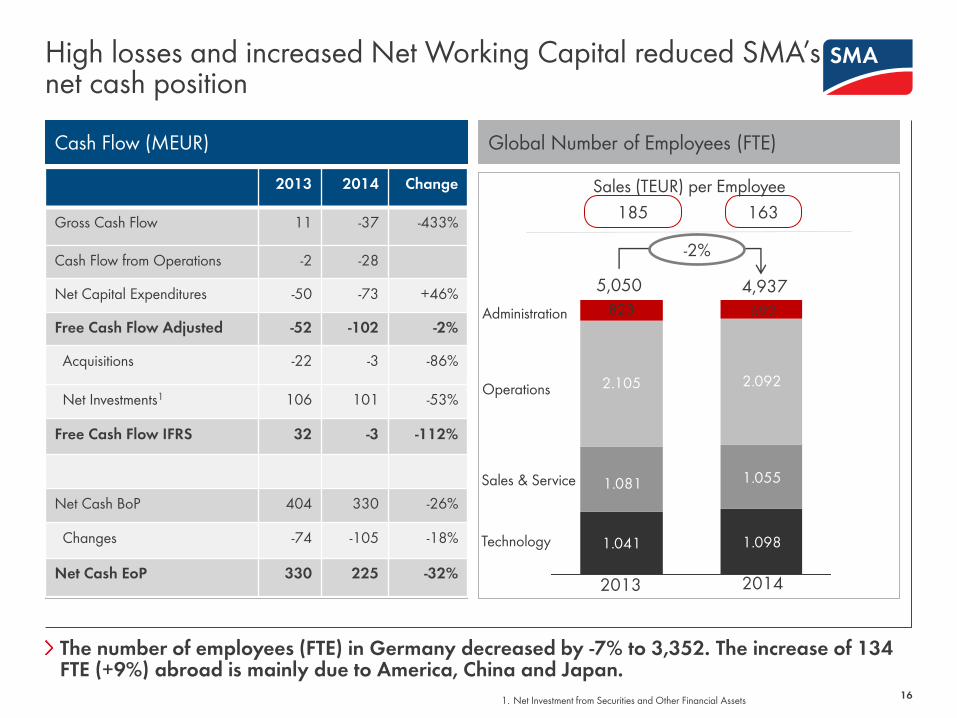
The number of employees (FTE) in Germany decreased by -7% to 3,352. The increase of 134 FTE (+9%) abroad is mainly due to America, China and Japan.
High losses and increased Net Working Capital reduced SMA’s net cash position
16 1. Net Investment from Securities and Other Financial Assets
Cash Flow (MEUR) Global Number of Employees (FTE)
2013 2014 Change
Gross Cash Flow 11 -37 -433%
Cash Flow from Operations -2 -28
Net Capital Expenditures -50 -73 +46%
Free Cash Flow Adjusted -52 -102 -2%
Acquisitions -22 -3 -86%
Net Investments1 106 101 -53%
Free Cash Flow IFRS 32 -3 -112%
Net Cash BoP 404 330 -26%
Changes -74 -105 -18%
Net Cash EoP 330 225 -32%
1.041 1.098
1.055
2.092
1.081
2.105
823
5,050 4,937
-2%
Technology
Sales & Service
Sales (TEUR) per Employee
185 163
2013 2014
Operations
Administration 692
4. Transformation & Outlook
Key transformation measures (FTE)1
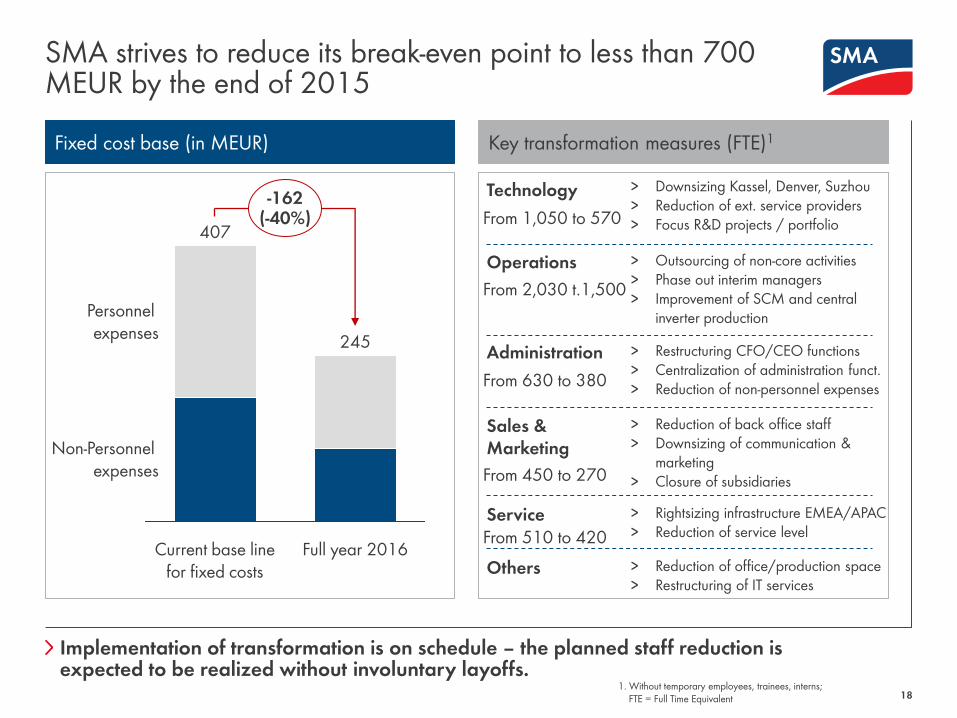
SMA strives to reduce its break-even point to less than 700 MEUR by the end of 2015
18
Fixed cost base (in MEUR)
Implementation of transformation is on schedule – the planned staff reduction is expected to be realized without involuntary layoffs.
Technology > Downsizing Kassel, Denver, Suzhou > Reduction of ext. service providers > Focus R&D projects / portfolio 407
245
-162 (-40%)
Current base line for fixed costs
Personnel expenses
Non-Personnel expenses
Full year 2016
Operations > Outsourcing of non-core activities > Phase out interim managers > Improvement of SCM and central
inverter production
Administration > Restructuring CFO/CEO functions > Centralization of administration funct. > Reduction of non-personnel expenses
Sales & Marketing
> Reduction of back office staff > Downsizing of communication &
marketing > Closure of subsidiaries
Service > Rightsizing infrastructure EMEA/APAC > Reduction of service level
Others > Reduction of office/production space > Restructuring of IT services
From 1,050 to 570
From 2,030 t.1,500
From 630 to 380
From 450 to 270
From 510 to 420
1. Without temporary employees, trainees, interns; FTE = Full Time Equivalent
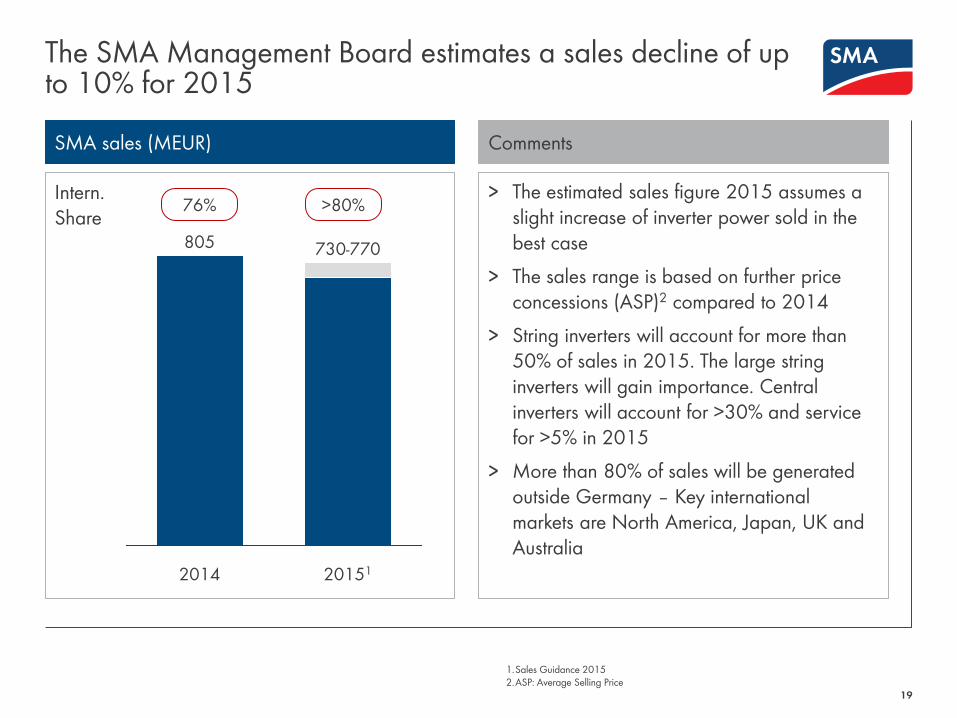
The SMA Management Board estimates a sales decline of up to 10% for 2015
19
SMA sales (MEUR)
20151
805
2014
730-770
Comments
> The estimated sales figure 2015 assumes a slight increase of inverter power sold in the best case
> The sales range is based on further price concessions (ASP)2 compared to 2014
> String inverters will account for more than 50% of sales in 2015. The large string inverters will gain importance. Central inverters will account for >30% and service for >5% in 2015
> More than 80% of sales will be generated outside Germany – Key international markets are North America, Japan, UK and Australia
Intern. Share 76% >80%
1.Sales Guidance 2015 2.ASP: Average Selling Price
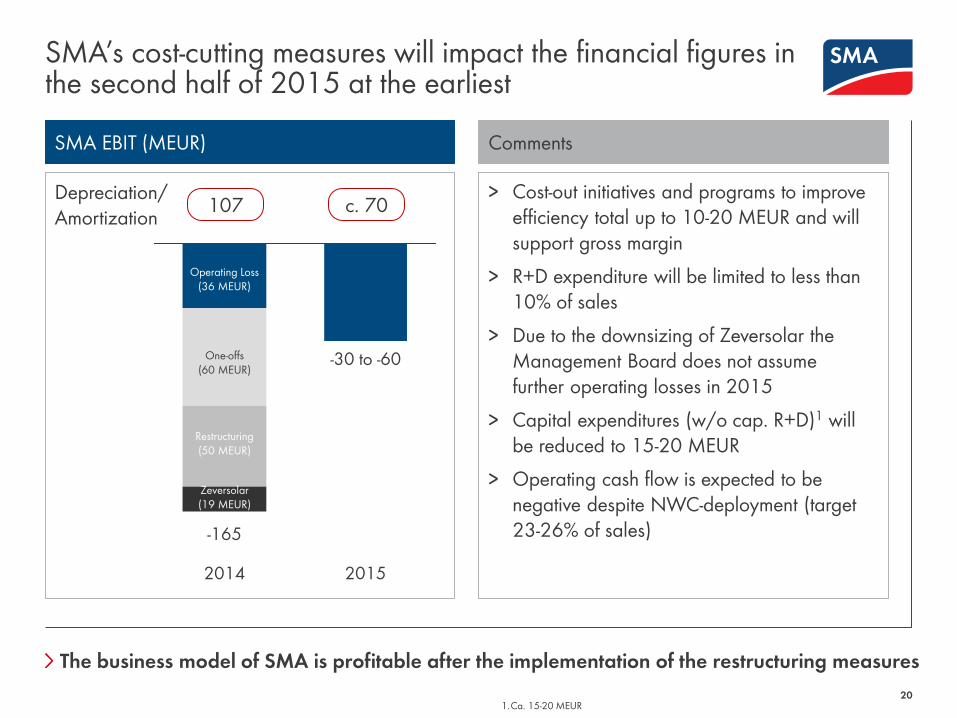
SMA’s cost-cutting measures will impact the financial figures in the second half of 2015 at the earliest
20 1.Ca. 15-20 MEUR
The business model of SMA is profitable after the implementation of the restructuring measures
SMA EBIT (MEUR)
2015
-30 to -60
2014
-165
One-offs (60 MEUR)
Comments
> Cost-out initiatives and programs to improve efficiency total up to 10-20 MEUR and will support gross margin
> R+D expenditure will be limited to less than 10% of sales
> Due to the downsizing of Zeversolar the Management Board does not assume further operating losses in 2015
> Capital expenditures (w/o cap. R+D)1 will be reduced to 15-20 MEUR
> Operating cash flow is expected to be negative despite NWC-deployment (target 23-26% of sales)
Depreciation/Amortization 107 c. 70
Zeversolar (19 MEUR)
Operating Loss (36 MEUR)
Restructuring (50 MEUR)
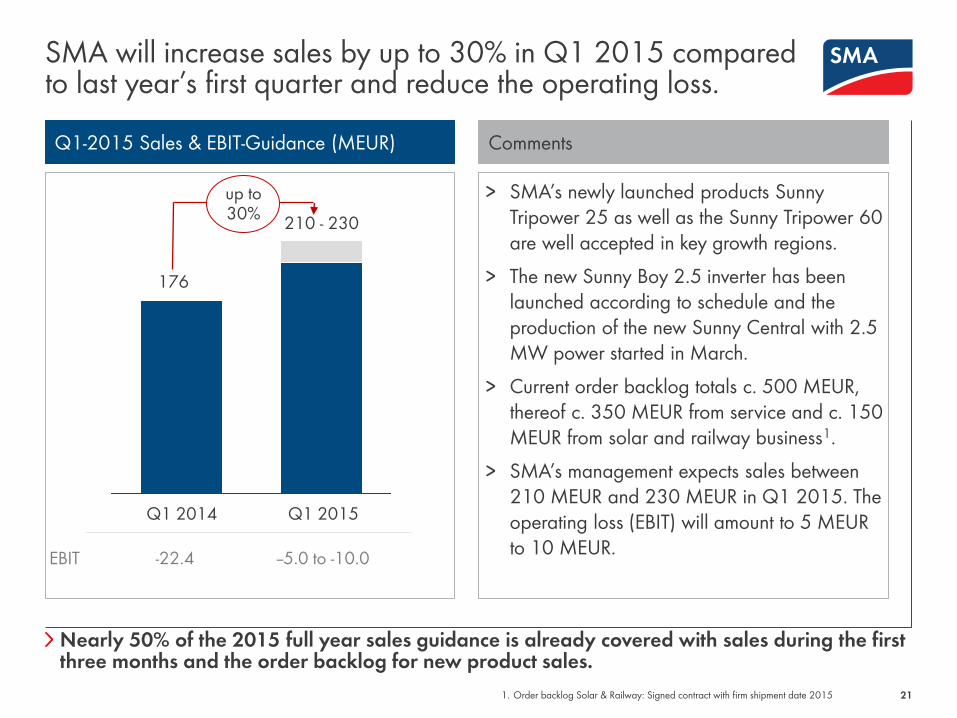
SMA will increase sales by up to 30% in Q1 2015 compared to last year’s first quarter and reduce the operating loss.
21
Nearly 50% of the 2015 full year sales guidance is already covered with sales during the first three months and the order backlog for new product sales.
Q1-2015 Sales & EBIT-Guidance (MEUR) Comments
> SMA’s newly launched products Sunny Tripower 25 as well as the Sunny Tripower 60 are well accepted in key growth regions.
> The new Sunny Boy 2.5 inverter has been launched according to schedule and the production of the new Sunny Central with 2.5 MW power started in March.
> Current order backlog totals c. 500 MEUR, thereof c. 350 MEUR from service and c. 150 MEUR from solar and railway business1.
> SMA’s management expects sales between 210 MEUR and 230 MEUR in Q1 2015. The operating loss (EBIT) will amount to 5 MEUR to 10 MEUR.
1. Order backlog Solar & Railway: Signed contract with firm shipment date 2015
Q1 2015 Q1 2014
176
210 - 230
up to 30%
EBIT -22.4 --5.0 to -10.0
Investment Highlights: SMA is a technology driven company with an attractive business model
Direct exposure to the global solar market
SMA is the #1 for solar inverters for more than 2 decades
Proven technology and game changing new products
Flexible business model and best-cost sourcing strategy
Powerful sales and service infrastructure
Transformation process will lead to significant cost reduction
Bankable partner due to high equity ratio and net cash position
Conservative planning assumptions, despite unique positioning
Stable shareholder structure with Danfoss as strategic anchor investor
22
SOCIAL MEDIA www.SMA.de/Newsroom
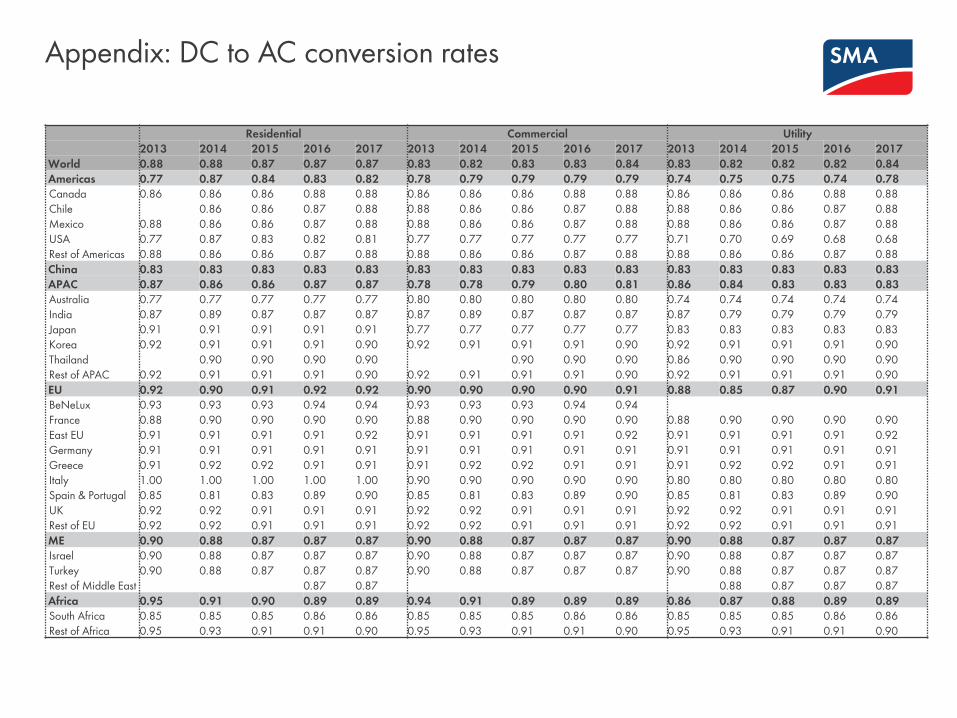
Appendix: DC to AC conversion rates
Residential Commercial Utility
2013 2014 2015 2016 2017 2013 2014 2015 2016 2017 2013 2014 2015 2016 2017
World 0.88 0.88 0.87 0.87 0.87 0.83 0.82 0.83 0.83 0.84 0.83 0.82 0.82 0.82 0.84
Americas 0.77 0.87 0.84 0.83 0.82 0.78 0.79 0.79 0.79 0.79 0.74 0.75 0.75 0.74 0.78 Canada 0.86 0.86 0.86 0.88 0.88 0.86 0.86 0.86 0.88 0.88 0.86 0.86 0.86 0.88 0.88
Chile 0.86 0.86 0.87 0.88 0.88 0.86 0.86 0.87 0.88 0.88 0.86 0.86 0.87 0.88
Mexico 0.88 0.86 0.86 0.87 0.88 0.88 0.86 0.86 0.87 0.88 0.88 0.86 0.86 0.87 0.88
USA 0.77 0.87 0.83 0.82 0.81 0.77 0.77 0.77 0.77 0.77 0.71 0.70 0.69 0.68 0.68
Rest of Americas 0.88 0.86 0.86 0.87 0.88 0.88 0.86 0.86 0.87 0.88 0.88 0.86 0.86 0.87 0.88
China 0.83 0.83 0.83 0.83 0.83 0.83 0.83 0.83 0.83 0.83 0.83 0.83 0.83 0.83 0.83
APAC 0.87 0.86 0.86 0.87 0.87 0.78 0.78 0.79 0.80 0.81 0.86 0.84 0.83 0.83 0.83 Australia 0.77 0.77 0.77 0.77 0.77 0.80 0.80 0.80 0.80 0.80 0.74 0.74 0.74 0.74 0.74
India 0.87 0.89 0.87 0.87 0.87 0.87 0.89 0.87 0.87 0.87 0.87 0.79 0.79 0.79 0.79
Japan 0.91 0.91 0.91 0.91 0.91 0.77 0.77 0.77 0.77 0.77 0.83 0.83 0.83 0.83 0.83
Korea 0.92 0.91 0.91 0.91 0.90 0.92 0.91 0.91 0.91 0.90 0.92 0.91 0.91 0.91 0.90
Thailand 0.90 0.90 0.90 0.90 0.90 0.90 0.90 0.86 0.90 0.90 0.90 0.90
Rest of APAC 0.92 0.91 0.91 0.91 0.90 0.92 0.91 0.91 0.91 0.90 0.92 0.91 0.91 0.91 0.90
EU 0.92 0.90 0.91 0.92 0.92 0.90 0.90 0.90 0.90 0.91 0.88 0.85 0.87 0.90 0.91 BeNeLux 0.93 0.93 0.93 0.94 0.94 0.93 0.93 0.93 0.94 0.94
France 0.88 0.90 0.90 0.90 0.90 0.88 0.90 0.90 0.90 0.90 0.88 0.90 0.90 0.90 0.90
East EU 0.91 0.91 0.91 0.91 0.92 0.91 0.91 0.91 0.91 0.92 0.91 0.91 0.91 0.91 0.92
Germany 0.91 0.91 0.91 0.91 0.91 0.91 0.91 0.91 0.91 0.91 0.91 0.91 0.91 0.91 0.91
Greece 0.91 0.92 0.92 0.91 0.91 0.91 0.92 0.92 0.91 0.91 0.91 0.92 0.92 0.91 0.91
Italy 1.00 1.00 1.00 1.00 1.00 0.90 0.90 0.90 0.90 0.90 0.80 0.80 0.80 0.80 0.80
Spain & Portugal 0.85 0.81 0.83 0.89 0.90 0.85 0.81 0.83 0.89 0.90 0.85 0.81 0.83 0.89 0.90
UK 0.92 0.92 0.91 0.91 0.91 0.92 0.92 0.91 0.91 0.91 0.92 0.92 0.91 0.91 0.91
Rest of EU 0.92 0.92 0.91 0.91 0.91 0.92 0.92 0.91 0.91 0.91 0.92 0.92 0.91 0.91 0.91
ME 0.90 0.88 0.87 0.87 0.87 0.90 0.88 0.87 0.87 0.87 0.90 0.88 0.87 0.87 0.87 Israel 0.90 0.88 0.87 0.87 0.87 0.90 0.88 0.87 0.87 0.87 0.90 0.88 0.87 0.87 0.87
Turkey 0.90 0.88 0.87 0.87 0.87 0.90 0.88 0.87 0.87 0.87 0.90 0.88 0.87 0.87 0.87
Rest of Middle East 0.87 0.87 0.88 0.87 0.87 0.87
Africa 0.95 0.91 0.90 0.89 0.89 0.94 0.91 0.89 0.89 0.89 0.86 0.87 0.88 0.89 0.89 South Africa 0.85 0.85 0.85 0.86 0.86 0.85 0.85 0.85 0.86 0.86 0.85 0.85 0.85 0.86 0.86
Rest of Africa 0.95 0.93 0.91 0.91 0.90 0.95 0.93 0.91 0.91 0.90 0.95 0.93 0.91 0.91 0.90