Embed Size (px)
Citation preview

Piece rate pay and working conditions in the export
garment sector
DECEMBER 2018
Floriana Borino
28DISCUSSION PAPER
Copyright © International Labour Organization (ILO) and Inter-national Finance Corporation (IFC)
First published DATE
Publications of the ILO enjoy copyright under Protocol 2 of the Universal Copyright Convention. Nevertheless, short excerpts from them may be reproduced without authorization, on condition that the source is indicated. For rights of reproduction or translation, application should be made to the ILO, acting on behalf of both organizations: ILO Publications (Rights and Permissions), International Labour Office, CH-1211 Geneva 22, Switzerland, or by email: [email protected]. The IFC and ILO welcome such applications.
Libraries, institutions and other users registered with reproduc-tion rights organizations may make copies in accordance with the licences issued to them for this purpose. Visit www.ifrro.org to find the reproduction rights organization in your country.
ILO CATALOGUING IN PUBLICATION DATA
Floriana Borino
Piece rate pay and working conditions in the export garment sector
International Labour Office
clothing industry / clothing worker / factory / working conditions / occupational safety / ILO Pro-gramme / programme evaluation / workers participation / employers participation / management / data collecting /
December 2018
The designations employed in this, which are in conformity with United Nations practice, and the presentation of material therein do not imply the expression of any opinion whatsoever on the part of the IFC or ILO concerning the legal status of any country, area or territory or of its authorities, or concerning the delimitation of its frontiers.
The responsibility for opinions expressed in signed articles, studies and other contributions rests solely with their authors, and publication does not constitute an endorsement by the IFC or ILO of the opinions expressed in them.
Reference to names of firms and commercial products and processes does not imply their endorsement by the IFC or ILO, and any failure to mention a particular firm, commercial prod-uct or process is not a sign of disapproval.
ILO publications can be obtained through major booksellers or ILO local offices in many countries, or direct from ILO Publica-tions, International Labour Office, CH-1211 Geneva 22, Switzer-land. Catalogues or lists of new publications are available free of charge from the above address, or by email: [email protected]
Visit our website: www.ilo.org/publns
Cover photo: ©ILO/IFC
Printed by ILO
1
Piece rate pay and working conditions in the export garment sector
Floriana Borino
December 2018
2
Contents 1 Executive Summary................................................................................................................................................. 3
2 Introduction ............................................................................................................................................................ 4
3 An introduction to piece rate pay ........................................................................................................................... 4
3.1 What is piece rate pay? ........................................................................................................................................ 4
3.2 Where is piece rate pay used? .............................................................................................................................. 5
4 Literature on piece rate pay and working conditions ............................................................................................. 7
4.1 Piece rate pay and wage ................................................................................................................................. 7
4.2 Piece rate pay and gender .............................................................................................................................. 8
4.3 Piece rate pay and working hours .................................................................................................................. 8
4.4 Piece rate pay and health of workers ............................................................................................................. 9
4.5 Piece rate pay and abusive treatment in workplace .................................................................................... 10
4.6 Piece rate pay and job satisfaction ............................................................................................................... 10
5 Piece rate pay and working conditions in Better Work garment factories .......................................................... 11
5.1 Data description ............................................................................................................................................ 11
5.2 Empirical results ............................................................................................................................................ 13
5.2.1 Wage ............................................................................................................................................................ 13
5.2.2 Working hours ............................................................................................................................................. 18
5.2.3 Health of workers ........................................................................................................................................ 20
5.2.4 Abusive treatment in workplace .................................................................................................................. 21
5.2.5 Life satisfaction ............................................................................................................................................ 23
6 Conclusions ........................................................................................................................................................... 24
7 Bibliography .......................................................................................................................................................... 26
8 Appendix ............................................................................................................................................................... 30
Acknowledgements
This discussion paper is the result of a collaborative effort between the Inclusive Labour Markets, Labour Relations and Working Conditions (INWORK) Branch of the Conditions of Work and Equality Department of the ILO, and the Better Work programme of the Governance Department of the ILO. Better Work is a joint programme of the ILO and IFC. The author wishes to express thanks for the valuable comments, contributions and ideas from Patrick Belser (INWORK), Jeffrey Eisenbraun (Better Work), Najati Ghosheh (INWORK), and Arianna Rossi (Better Work).
3
1 Executive Summary
Piece rate is defined as work paid according to the number of units produced (e.g. the number of T-shirts or bricks produced) instead of being paid on the basis of time spent on the job. The previous literature, which focuses mainly on advanced economies, predicts that piece rate workers would earn a higher hourly remuneration than fixed rate workers, because this type of contract induces higher level of effort. Pieceworkers should also avoid subjective assessment of their work performance and hence face a lower gender pay gap. However, incentive systems like piece rate wages have been reported to negatively affect the health of workers, due to workers speeding up their production and/or extending their working hours. Previous research has also linked sexual harassment to the piece rate, suggesting that supervisors responsible for output reporting may extract some portion of the piece rate incentive from workers in the form of sexual favour.
Given the high prevalence of piece rate pay in the garment sector, this paper explored the impact of piece rate pay on wages and working conditions in the sector, using data from ILO-IFC Better Work factories in Vietnam, Indonesia, Jordan, Haiti and Nicaragua. Piece rate workers in these exporting factories are found to earn a higher hourly wage than workers paid by the hour only in three out of the five countries analysed. Cross-country differences in outcome may reflect a discrepancy in piece rate pay design. This suggests that when employers set the amounts they pay workers for each operation in the production process (the “piece rates”) too low, workers are unable to earn a decent wage or the legal daily minimum wage in a regular workday, as the law requires.
When splitting piece rate pay between partial and full piece rate pay, we found a detrimental effect of partial piece rate on working conditions. In fact, workers paid partially by the piece, despite having often higher wages, are found to have higher probability of being concerned on low pay than time paid workers. This could be due to the higher variability of wages of partial piece workers, notably when the base salary is very low and the incentive pay, based on the output, is obtained only if a certain (high) output threshold is reached. Another reason for partial piece rate workers being concerned on low pay is the lack of transparency in piece rate setting, leading employees to mistrust the employer and believing that piece rates will be lowered. Generally, piece-rate employment is more strenuous because individuals work much harder when they are motivated. As a result, it has been shown that partial piece rate has a negative effect on workers’ self-reported physical and emotional health as well as on workers’ concern for accidents or injuries in the factory. Finally, partial piece rate pay workers are more likely of being subject to abusive treatments such as sexual harassment and verbal abuse and they report a lower life satisfaction.
Therefore, the extent to which piece rate can be of benefit for both employers and workers depends on how it is designed and regularly maintained afterwards. To be fair and effective, piece rate systems should be simple and transparent, rewards employees according to the difficulty and quality of their work, ensuring that motivated workers can earn substantially more than the minimum wage. Involving employees before implementing a piece-rate pay system will increase transparency and confidence, so a crucial role should be played by trade unions. To tackle the decent work deficits of piece rate workers and improve their work conditions, it is crucial for government to regulate piece rates and piece rate work and for enterprises to implement sound piece rate systems.
4
2 Introduction
Today’s global economy, and especially the garment sector, is characterized by geographically dispersed production (global production chains) and rapid market-driven changes (ILO, 2014 b). Millions of jobs have been created in the garment sector in developing countries, especially for women, and some countries have benefited greatly. However, competition is high at all levels, and players are constantly seeking ways to decrease costs and maintain or improve profit margins, often at the expense of working conditions. Piece rates are frequently used in the garment sector. When properly designed, they should motivate employees and hence increase productivity and wages. However, remuneration at the piece rate or by task work could, if inadequately designed, lead many workers to work long hours to earn the minimum wage, which is equivalent to performing unpaid overtime work. Under some conditions, piece rates may be beneficial to both employers and employees. For this to be the case, however, the manner in which remuneration is calculated for each piece produced or task completed needs to be fair to both parties: if the salary is set too low, discouragement will set in and the workers concerned will work long hours or very quickly and may ultimately feel burnt out by the system. If the rate is not fair to the employer, the enterprise might fail (Billikopf, 2014). Therefore, monitoring the effects of piece rate pay is a key element of an evidence-based system. Findings from rigorous studies should find their way back to policy makers, and adjustment or changes to the system. Policy makers should have access to studies on the effects of piece rate pay on variables such as wages (working poverty) and more generally working conditions. The purpose of this study was to carry out a broad survey and analysis of relevant research articles about piece rate wages and their effects on working conditions that were published internationally. Based on this review of the literature, an analysis of the prevalence and impact of piece rate pay on working conditions and wages in the garment sector was completed, using data from Better Work factories. Better Work (BW) is a joint program of the International Labour Organization and the International Finance Corporation which provides monitoring and assistance on compliance with international and national labour laws in participating countries.
3 An introduction to piece rate pay
3.1 What is piece rate pay?
Incentive pay differs from hourly or salaried pay in that it is based on performance rather than on time spent on the job. Piece rate pay is a specific type of incentive pay. Piece rate pay occurs when workers are paid by the unit performed (e.g. the number of T-shirts produced, kilometres driven or number of trees pruned). A “full pieceworker” receives a fixed rate for each unit (“piece”) produced or action performed (ILO, Minimum Wage Policy Guide). A mixture of piece rate pay and hourly pay is also often utilised. In such a system, called “partial piece rate pay”, management pays a base salary irrespective of production output and, if a certain output threshold is reached, an incentive system, based on the output, is added to the base salary. This incentive payment might be a low or a high addition to the base salary, depending on how the partial piece rate is designed. There could be some debate over the level and manner of determining the output threshold and how the incentive systems above it should be determined. Edwards (1979), for instance, argues that piece-rate compensation schemes were ineffective because management did not know how fast a job could be done and therefore could not set the correct piece rate. Thus, the pace of production is a key consideration when examining the impact of piece rate production on workers and for enterprises.
5
There are other types of incentive pay. The “production quota”, for instance, sets the number of units which are required to be completed by the worker in a certain time period, a day or a week, in order to be eligible for the basic payment. Many of the principles discussed for piece rate pay will also apply for production quota. In the empirical investigation of section 5, the working conditions of workers in the BW garment factories facing a production quota will be investigated and compared with piece rate workers.
3.2 Where is piece rate pay used?
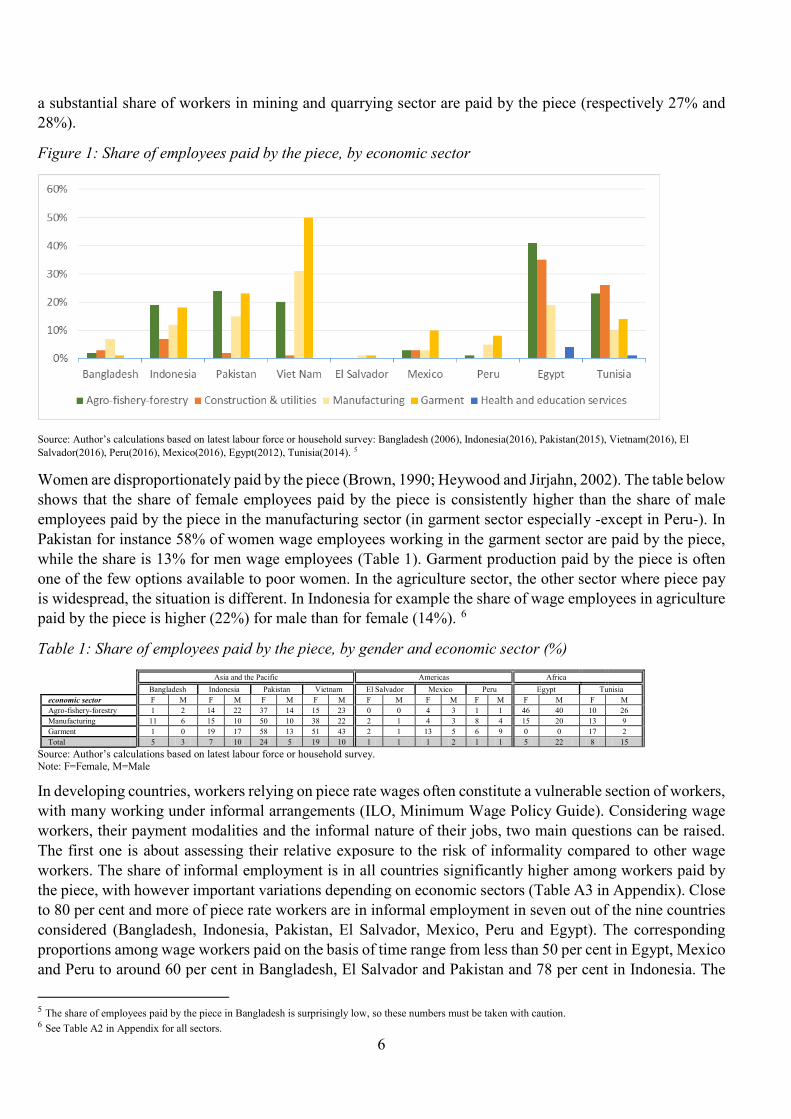
The piece rate is very common among low-wage industries in the developing world (Davis, 2016). The consequences of the piece rate pay are of particular concern for less developed countries, which face greater challenges in improving the conditions of low income workers and promoting wage employment. Therefore, this paper will focus its analysis on developing countries. It is important to highlight that although the incidence of piecework has significantly reduced in advanced industrialized economies in the manufacturing sector, it is still widespread in sectors such as agriculture (Hart, 2016). In addition, the rise of the gig-economy in recent years, where workers are paid for task that they complete so long as their work is accepted by the requester, might increase the importance of piece rate pay in advanced countries (Berg, 2016). Piece rated workers are found among factory based workers, home based workers and out-workers (ILO, Minimum Wage Policy Guide). Due to data constraints, this paper will focus only on wage employees. In this section the prevalence of piece rate pay will be assessed across different sectors using labour force and household surveys from countries in three regions: Asia and the Pacific (Bangladesh, Indonesia, Pakistan, and Viet Nam), Americas (El Salvador, Mexico, Peru) and Africa (Egypt, Tunisia).1 The figure below shows the share of wage workers paid by the piece for different economic sectors in a sample of countries. 2 Piece rate pay is common in industries where the output is readily measurable and the work is repetitive in nature whereas it is unusual in sectors where workers have multiple responsibilities or it does not make sense to reward the individual for moving quickly through their assignments. In all countries analysed, piece rate pay is pervasive in agriculture and manufacturing, especially in garment sector (Table A1 in Appendix). Farm employees for instance are often paid based on the number of buckets or bags they pick of the crop they harvest. The share of employees in the agricultural sector paid by the piece is 19% in Indonesia, 24% in Pakistan and 20% in Vietnam, 41% in Egypt and 23% in Tunisia, while the share is lower in Latin American countries (Figure 1). In the garment sector, the share of wage workers paid by the piece is higher in Asian countries (50% in Vietnam, 23% in Pakistan, 18% in Indonesia) than North Africa (14% in Tunisia) and Latin American ones (10% in Mexico and 8% in Peru). However, this is only a tip of an iceberg. 3 Not surprisingly, the share of employees paid by the piece in the health and education sector or public administration is close to zero. In these sectors, quality is particularly important, the jobs are less repetitive in nature and the tasks may require more or less time in a less predictable fashion thus making the usage of piece rate pay more difficult (Figure 1).
There are some differences across countries. In Tunisia and Egypt for instance a high share of workers in construction, transport and other private service provision are paid by the piece (26%, 30%, 24% in Tunisia and 32%, 33%, 23% in Egypt), while the share is generally low in other countries4. In Indonesia and Vietnam
1 See Appendix for details on the survey used in each country. Labour force and household surveys have the advantage of being nationally representative and hence the findings could serve policy makers. However it is important to note that the share of observations with missing data on method of payment is quite high: 75% for Bangladesh, 70% for Indonesia, 90% for Pakistan, 60% for Vietnam, 35% El Salvador, 38% Mexico, 20% Peru, 75% Tunisia and 67% in Egypt. 2 The analysis focuses on employees but it is important to keep in mind that also own-account workers are paid by the piece. 3 Home-based work (dominated by female workers) accounts for a substantial proportion of total garment output and workers cutting and stitching garments at home are typically paid by the piece. Estimates suggest that as much as 60 per cent of garment production, especially of children and women’s clothing, is done at home in both Asia and Latin America (WIEGO). Most home-based workers are classified as self-employed even if they may be in a position of dependence and subordination more commonly associated with employee status and thus are not included in the figures of Table A1.Tthe share of workers paid by the piece in the garment sector is much higher if home–based workers are included. 4 For instance, workers could be paid on the number of roofs completed, sinks installed, houses built because the work content can be predicted.
6
a substantial share of workers in mining and quarrying sector are paid by the piece (respectively 27% and 28%).
Figure 1: Share of employees paid by the piece, by economic sector
Source: Author’s calculations based on latest labour force or household survey: Bangladesh (2006), Indonesia(2016), Pakistan(2015), Vietnam(2016), El Salvador(2016), Peru(2016), Mexico(2016), Egypt(2012), Tunisia(2014). 5
Women are disproportionately paid by the piece (Brown, 1990; Heywood and Jirjahn, 2002). The table below shows that the share of female employees paid by the piece is consistently higher than the share of male employees paid by the piece in the manufacturing sector (in garment sector especially -except in Peru-). In Pakistan for instance 58% of women wage employees working in the garment sector are paid by the piece, while the share is 13% for men wage employees (Table 1). Garment production paid by the piece is often one of the few options available to poor women. In the agriculture sector, the other sector where piece pay is widespread, the situation is different. In Indonesia for example the share of wage employees in agriculture paid by the piece is higher (22%) for male than for female (14%). 6
Table 1: Share of employees paid by the piece, by gender and economic sector (%) Asia and the Pacific Americas Africa Bangladesh Indonesia Pakistan Vietnam El Salvador Mexico Peru Egypt Tunisia economic sector F M F M F M F M F M F M F M F M F M Agro-fishery-forestry 1 2 14 22 37 14 15 23 0 0 4 3 1 1 46 40 10 26 Manufacturing 11 6 15 10 50 10 38 22 2 1 4 3 8 4 15 20 13 9 Garment 1 0 19 17 58 13 51 43 2 1 13 5 6 9 0 0 17 2 Total 5 3 7 10 24 5 19 10 1 1 1 2 1 1 5 22 8 15
Source: Author’s calculations based on latest labour force or household survey. Note: F=Female, M=Male
In developing countries, workers relying on piece rate wages often constitute a vulnerable section of workers, with many working under informal arrangements (ILO, Minimum Wage Policy Guide). Considering wage workers, their payment modalities and the informal nature of their jobs, two main questions can be raised. The first one is about assessing their relative exposure to the risk of informality compared to other wage workers. The share of informal employment is in all countries significantly higher among workers paid by the piece, with however important variations depending on economic sectors (Table A3 in Appendix). Close to 80 per cent and more of piece rate workers are in informal employment in seven out of the nine countries considered (Bangladesh, Indonesia, Pakistan, El Salvador, Mexico, Peru and Egypt). The corresponding proportions among wage workers paid on the basis of time range from less than 50 per cent in Egypt, Mexico and Peru to around 60 per cent in Bangladesh, El Salvador and Pakistan and 78 per cent in Indonesia. The 5 The share of employees paid by the piece in Bangladesh is surprisingly low, so these numbers must be taken with caution. 6 See Table A2 in Appendix for all sectors.
7
differences in informality rates between wage workers paid by the piece and others range from 5.8 percentage points in Viet Nam to 41 percentage points in Peru and above 50 percentage points in Egypt. The gender analysis does not lead to clear conclusion with the exception of the two countries from North Africa (Egypt and Tunisia) where men are more exposed to informality than women in general (ILO, 2018) but also for employment paid on a piece rate basis.
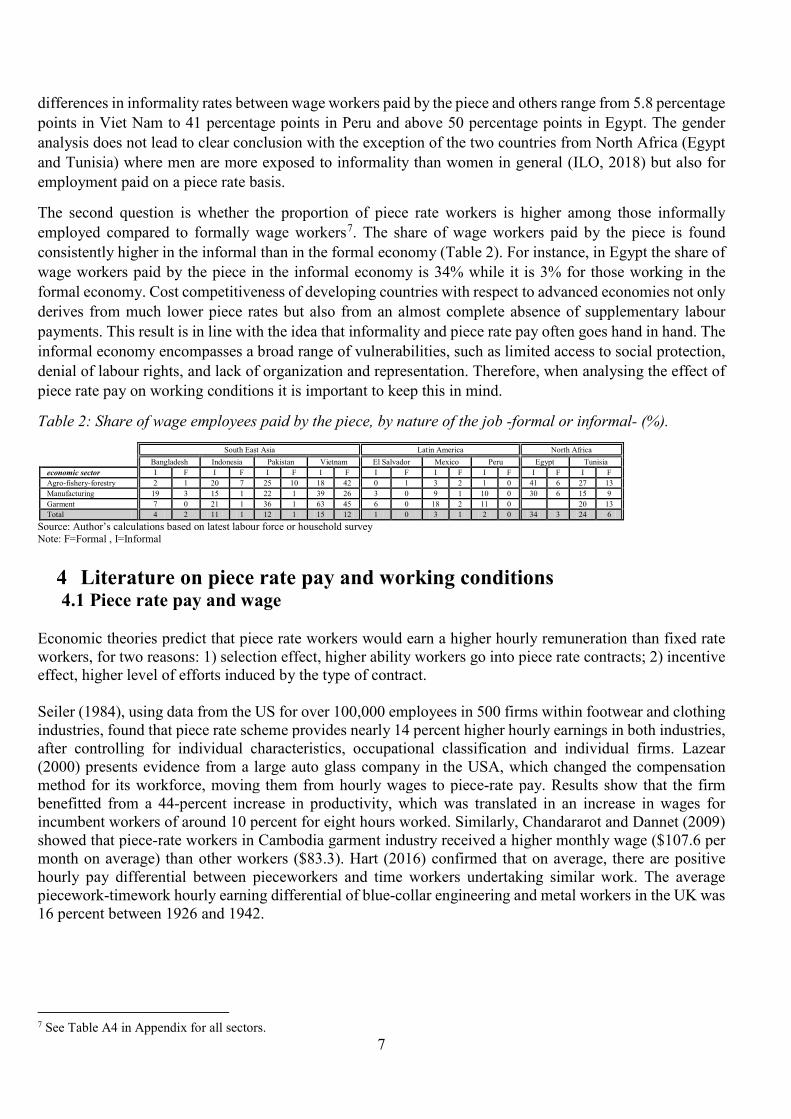
The second question is whether the proportion of piece rate workers is higher among those informally employed compared to formally wage workers7. The share of wage workers paid by the piece is found consistently higher in the informal than in the formal economy (Table 2). For instance, in Egypt the share of wage workers paid by the piece in the informal economy is 34% while it is 3% for those working in the formal economy. Cost competitiveness of developing countries with respect to advanced economies not only derives from much lower piece rates but also from an almost complete absence of supplementary labour payments. This result is in line with the idea that informality and piece rate pay often goes hand in hand. The informal economy encompasses a broad range of vulnerabilities, such as limited access to social protection, denial of labour rights, and lack of organization and representation. Therefore, when analysing the effect of piece rate pay on working conditions it is important to keep this in mind.
Table 2: Share of wage employees paid by the piece, by nature of the job -formal or informal- (%). South East Asia Latin America North Africa Bangladesh Indonesia Pakistan Vietnam El Salvador Mexico Peru Egypt Tunisia economic sector I F I F I F I F I F I F I F I F I F Agro-fishery-forestry 2 1 20 7 25 10 18 42 0 1 3 2 1 0 41 6 27 13 Manufacturing 19 3 15 1 22 1 39 26 3 0 9 1 10 0 30 6 15 9 Garment 7 0 21 1 36 1 63 45 6 0 18 2 11 0 20 13 Total 4 2 11 1 12 1 15 12 1 0 3 1 2 0 34 3 24 6
Source: Author’s calculations based on latest labour force or household survey Note: F=Formal , I=Informal
4 Literature on piece rate pay and working conditions 4.1 Piece rate pay and wage
Economic theories predict that piece rate workers would earn a higher hourly remuneration than fixed rate workers, for two reasons: 1) selection effect, higher ability workers go into piece rate contracts; 2) incentive effect, higher level of efforts induced by the type of contract. Seiler (1984), using data from the US for over 100,000 employees in 500 firms within footwear and clothing industries, found that piece rate scheme provides nearly 14 percent higher hourly earnings in both industries, after controlling for individual characteristics, occupational classification and individual firms. Lazear (2000) presents evidence from a large auto glass company in the USA, which changed the compensation method for its workforce, moving them from hourly wages to piece-rate pay. Results show that the firm benefitted from a 44-percent increase in productivity, which was translated in an increase in wages for incumbent workers of around 10 percent for eight hours worked. Similarly, Chandararot and Dannet (2009) showed that piece-rate workers in Cambodia garment industry received a higher monthly wage ($107.6 per month on average) than other workers ($83.3). Hart (2016) confirmed that on average, there are positive hourly pay differential between pieceworkers and time workers undertaking similar work. The average piecework-timework hourly earning differential of blue-collar engineering and metal workers in the UK was 16 percent between 1926 and 1942.
7 See Table A4 in Appendix for all sectors.
8
4.2 Piece rate pay and gender
Economists have consistently found that women are over-represented in jobs with piece-rate payments (e.g., Brown, 1990; Heywood and Jirjahn, 2002; Heywood and Wei, 1997; Geddes and Heywood, 2003; Hart, 2016). Therefore, several authors have explored the gender dimension of piece rate pay. Parent (1999) found that male piece rate workers earned a premium compared to other salaried or hourly paid workers, however for women there is no evidence of a premium. One explanation for this finding is that women who have dependents may not be able to respond quite as much to an explicit incentive scheme as can women who have no dependents or men. In fact, the author found that female piece rate workers earned more than other female workers once a control variable for the presence of dependents is interacted with the piece rate variable. In line with Parent (1999), Pekkarinen and Riddel (2008) investigated the earnings effects of performance pay using data from Finland’s metal industry for 1990-2000. They found that piece rate workers earned more than fixed rate workers by 9 to 10 percent, with women earning a performance pay premium one percentage point higher than men. On the contrary, Kangasniemi and Kauhanen (2013), using Finnish linked employer-employee panel data, found that piece rates increase gender wage differentials as they increase wages more for men than for women, while bonus pay decreases gender wage differentials. Jirjahn and Stephan (2004) investigating the disproportionate use of piece rate work among women, found support for the idea that women are more inclined to piece rates because they are subject to less wage discrimination since their remuneration is based on objective performance measures. Piece rate pay schemes provide more objective information on productivity and tying earning to productivity make the costs of discrimination greater as workers, managers, and enforcement officials can more easily identify when supervisory prejudice is translated into earnings discrimination. The authors, using cross-sectional data on German employees, found that the “controlled” gender wage gap is smaller in the piece-rate regime than in the time-wage regime (9% versus 17% respectively).8 This result is in line with the hypothesis that women are subject to less wage discrimination under piece rate pay. Stanfors et al. (2014) investigates the gender wage gap in cigar making around 1900. They find that when workers are paid by the piece, the gender difference in earnings can be explained entirely by the differences in characteristics such as experience, age or education of men and women employed. However when looking at workers paid by the hour only less than half of the difference in earnings between men and women can be explained by these characteristics.
4.3 Piece rate pay and working hours
Recent research estimates both the short- and long-term consequences of excessive working hours9 for workers and employers, as well as for society as a whole. Excessive hours of work impact on workers’ health, well-being and workplace safety, and can cause unforeseen indirect costs for companies in the form of accidents, injuries, absenteeism, lower productivity, and high worker turnover with the consequent recruitment of new employees and their training costs. However, the research on the impact of piece rate pay on working hours and overtime is very scarce. Piecework pay has been the norm for trucking drivers for decades. The tension between piecework pay and speed limits are found to encourage drivers to work unusually long hours in order to reach earnings targets (Belzer, 2000). Belzer et al. (2017) suggest that truck drivers in the US paid on a piecework basis (by the mile) will have an incentive to record unpaid non-driving labour (such as loads/unloads of the freight) as off duty, thus allowing the driver to work (and drive) long hours (more than the legal limit). Therefore, drivers 8 Using a Blinder-decomposition the authors showed that 13 percentage points of the gross gender wage gap of 31 percentage points can be explained by observed characteristics for workers receiving time wages, while 20 percentage points of a similar gender wage gap can be explained for piece pay workers. 9 There are three ways of examining long hours:1. hours exceeding the statutory normal hours, 2. hours exceeding the maximum hours of work beyond which negative consequences on workers are known to be visible, 3. hours exceeding those which workers prefer to work (Lee et al. 2007).
9
have been reported to work unusually long hours, up to one hundred or more hours per week, even though the legal limit in the US is around 60. This is because they have target earnings. Williamson et al. (2000) stated that the pressures exerted by the payment by results system can be seen in the influences on drivers to break the working hour’s regulations. The factors that distinguish drivers who frequently break the working hour’s regulations from those who do not are related to organisation of work such as the need to do enough trips to earn a living rather than personal reasons.
4.4 Piece rate pay and health of workers
The idea that piece rates increase the number of injuries is as old as modern economics. Adam Smith said: “Workmen . . . when they are liberally paid by the piece, are very apt to overwork themselves, and to ruin their health and constitution in a few years” (Smith, 1776). Incentive systems like piece rate wages, which pay a piece rate for each unit produced or action performed regardless of time, has been reported to affect the health of workers. Although this incentive system is a way of improving the productivity of workers, it is also known to adversely affect workers' health by speeding up on their production and/or extending their working hours. Financial incentives that speed the pace of work may result in less worker investment in safety precautions, particularly those that slow the pace of work. Research suggests that the piece rate leads workers to shirk on health-promoting activities such as machine safety maintenance, work breaks, wearing personal protection equipment (e.g., masks and steel-mesh gloves), and medical visits that would otherwise reduce job injury and accident risks.
Many studies have shown an increased accident and injury risk of piece rate pay in a number of industries. A five year medical study of workers in fertilizer production in India concluded that piece rate workers are more vulnerable to occupational accidents (increased probability and severity of an accident) than otherwise similar time rate workers (Saha et al. 2004). Bender et al. (2012) performed a cross-industry analyses in Europe. They showed that piece rate workers have 5 percentage point greater likelihood of injury that cannot be explained by their personal characteristic, the available characteristics of their job or the hazards to which they are exposed10. While this pattern exists for piece rates, it is not replicated for other measures of performance pay, such as profit sharing or subjectively evaluated bonuses, which are not uniquely tied to output and so generate different incentives. Similarly, Artz et al. (2015), using panel survey data, showed cross-sectional evidence of higher risk of workplace injury for those paid piece rates in the United States. The results hold even when controlling for a risk proxy, worker fixed effects and worker with employer match fixed effects.
Another branch of the literature highlights the possible negative effects of piece rate pay on worker physical and emotional well-being. Increased medical symptoms have been observed among piece rate workers, including lower levels of self-reported health, body mass index, absenteeism, higher levels of depression, and medication usage. For instance, Foster and Rosenzweig (1994) focus on the link between piece rates and overall health for agricultural workers. They use data from Pilipino farmers and proxy health with the body mass index (BMI) showing that farm workers paid piece rates have lower BMI values (worse health) after controlling for calories, illness, lagged BMI, and other variables. Vinet et al. (1989) highlighted a positive effect of piece work pay on medicine use in the clothing industry. Among currently employed women, the probability of using stomach medication was found higher for pieceworkers than among women who received an hourly wage. Wang et al. (2005) have investigated the correlations between work organization and the risk for musculoskeletal disorders among 314 female sewing machine operators in the garment industry in Los Angeles, USA. Results show that operators on piece rate wages more often report pains. The risk for pains was more than doubled compared with operators on time based wages. Analysing the pay structure of workers across 109 garment factories in Vietnam between 2010 and 2014, Davis (2016)
10 However, injury risk increases with hazards and with job characteristics such as repetition and monotony.
10
suggests that wage incentives, such as quota and piece rate pay, impact workers’ sense of their own physical and emotional health. In other words, workers paid by the piece or subject to a production quota report worse physical and emotional health than workers paid by the hour. Interestingly, the driving force behind the negative effect of piece rate is not a full piece rate system; rather, it is “partial piece rate”.
4.5 Piece rate pay and abusive treatment in workplace
Garment workers in global supply chains often face poor working conditions, including verbal abuse and sexual harassment from their supervisors. These forms of abusive treatment in the workplace have negative consequences for labour productivity beyond the physical and psychological effects on victims. Some research has been conducted on the impact of incentive pay system on sexual harassment and verbal abuse, using data gathered by the ILO-IFC Better Work programme.
Truskinovsky et al. (2014) found that opportunities arise for sexual harassment when the pay for supervisors and workers is determined using different incentives. Analysing a micro-data set of worker demographics and workplace characteristics in Haiti, Jordan and Indonesian apparel factories, the authors found that sexual harassment is more likely to be a concern in factories where garment workers are paid “by the piece”, and more so when their performance is assessed by supervisors who receive a fixed salary. The positive correlation of piece rate pay and complaints of sexual harassment results from the environment that emerges when supervisors are charged with monitoring individual worker productivity and determining bonuses without having similar pay incentives of their own. Within this kind of factory pay scheme, supervisors lack the incentive to improve the overall efficiency of their production line. Power relations are structured such that supervisors are enabled to demand bribes, in the form of sexual favours, in exchange for a positive report or assessment of individual worker performance. In line with these findings, Lin et al. (2014) found that in Haiti and Vietnam Better Work factories the presence of a production quota for workers is a significant predictor of sexual harassment.
Rourke (2014), using data drawn from surveys conducted between 2010 and 2013 in Indonesia, Jordan and Vietnam among managers and workers in over 300 garment factories enrolled in Better Work programme, shows the negative relationship between piece rate pay and verbal abuse. Evidence from Jordan shows that motivating effort from workers through piece rate wages decreases the likelihood they will experience verbal abuse. The decreasing incidence of verbal abuse for pieceworkers occurs as workers are motivated by monetary incentives, rather than through shouting, to increase their productivity. The analysis for Viet Nam and Indonesia however provides less conclusive results, probably due to country-specific data limitations.
4.6 Piece rate pay and job satisfaction
Despite finding that piece rate pay increase workers’ productivity and earnings, it remains unclear a priori what effect piece rate pay has on worker satisfaction with the job. While increased earnings will increase worker satisfaction, other aspects of piece rate pay may have less beneficial effects on job satisfaction. Heywood and Wei (2006) use the National Longitudinal Study of Youth to examine the influence of method of payment on job satisfaction in the United States. They showed that individual performance pay is associated with greater job satisfaction and greater satisfaction with pay. However, within the measure of individual performance pay there is a suggestion that piece rates may reduce overall satisfaction even if it increases satisfaction with pay.
The majority of previous work analysed the impact of performance-related pay on job satisfaction, without specifically focusing on piece rate pay. Green and Heywood (2008), for example, investigates the influence of performance-related pay on several dimensions of job satisfaction, including overall satisfaction,
11
satisfaction with pay, satisfaction with job security and satisfaction with hours. After accounting for worker fixed effects they found a positive association between performance-pay and job satisfaction. These results appear robust to a variety of alternative specifications and support the notion that performance-related pay allows increased opportunities for worker optimization and does not generally demotivate workers or crowds out intrinsic motivation. McCausland et al. (2005) use the British Household Panel Survey to investigate the impact of performance pay on several dimensions of job satisfaction. They use an econometric framework that endogenizes wages and accounts for self-selection into the method of pay. They show that for more highly paid workers satisfaction with the job and with pay are both higher under performance pay. On the other hand, for lower paid workers satisfaction is lower under performance pay. McCausland and his co-authors suggest that the difference between the two groups of workers may result from the fact that lower paid workers are more likely to see performance pay as a form of monitoring or control.
5 Piece rate pay and working conditions in Better Work garment factories
As shown in the previous section (section 3), garment factories in developing world often pay workers by the piece, assuming that this will generate an increase in productivity and hence profits. However, such productivity gains may, in fact, be gained at the expense of working conditions. The aim of this chapter is to test the impact of piece rate pay on different aspects of working conditions (wages, gender pay gap, overtime work, health, life satisfaction and abusive treatment) in the garment sector, using data from BW factories. The impact of another widely used incentive pay, the production quota, on working conditions of workers in BW factories will be analysed and used as a comparison. Taking insights from BW factories, we will try to inform policy makers on adjustment or changes to the system.
5.1 Data description
This section will use data from Better Work (BW) program, a joint initiative of the International Finance Corporation and the International Labour Organization, covering five countries (Vietnam, Indonesia, Jordan, Haiti, and Nicaragua). In Vietnam, Indonesia and Nicaragua the population surveyed is not a random sample of workers in apparel industry as firm enrolment in BW is voluntary.11 Therefore, the results of this section cannot be easily generalized. However they can provide intuitions on the advantages and disadvantages of piece rate pay.
When a factory enters the Better Work programme, information about factory compliance with international and national labour laws are collected (enterprise compliance assessment). In addition, after enrolment, a group of 30 workers and four managers in a subset of participating factories are randomly selected to complete a survey to measure the impact of the programme. The managers’ survey provides information, at factory level, on topics that range from total employment to compensation. The BW workers’ survey provides information, at worker level, not only on objective job characteristics, usually found in labour force survey (such as occupation, skills, hours of work, wage and method of payment), but also on other dimensions such as workers’ perception of their health and well-being, life satisfaction or concern on abusive treatment. This is an interesting feature as it allows to uncover the effect of piece rate pay on quantitative and qualitative dimensions of work. Workers’ survey are matched by year and factory to the manager and enterprise compliance assessment dataset. This is the source of the data for the following analysis.
Survey data range from 2010 to 2015 and the total number of surveyed factories and workers varies by country (see Table A5 in Appendix). For this analysis the sample was restricted to the first visit (baseline) of a participating BW factory in order to avoid double counting the same workers and ruling out the possible
11 However, BW is mandatory in Haiti and Jordan for exporting firms.
12
effects of being part of the BW programme.
For the purpose of the empirical analysis, the main variable of interest is the workers’ method of payment. Workers surveyed are asked whether they are paid by the hour, entirely by piece rate, or a combination of the two (‘partial piece rate’). The variable piece rate pay will be specified as a dummy variable equal to 1 if the worker is paid at least some percentage by the piece and 0 otherwise. In addition, the variable piece rate pay is further broken down into three separate categories (0= hourly, 1=Partial Piece Rate, 2= Fully Piece Rate) in order to determine whether variability in scope of the piece rate pay affects the results.
Another form of incentive pay frequently used in the garment sector in developing countries is the production quota. Therefore, a dummy variable quota is created, it is coded 1 if workers report facing a weekly or daily production quota and 0 otherwise. The variable quota is used in the regression as the main explanatory variable in lieu of piece rate pay to analyse the impact of production quota on working conditions.
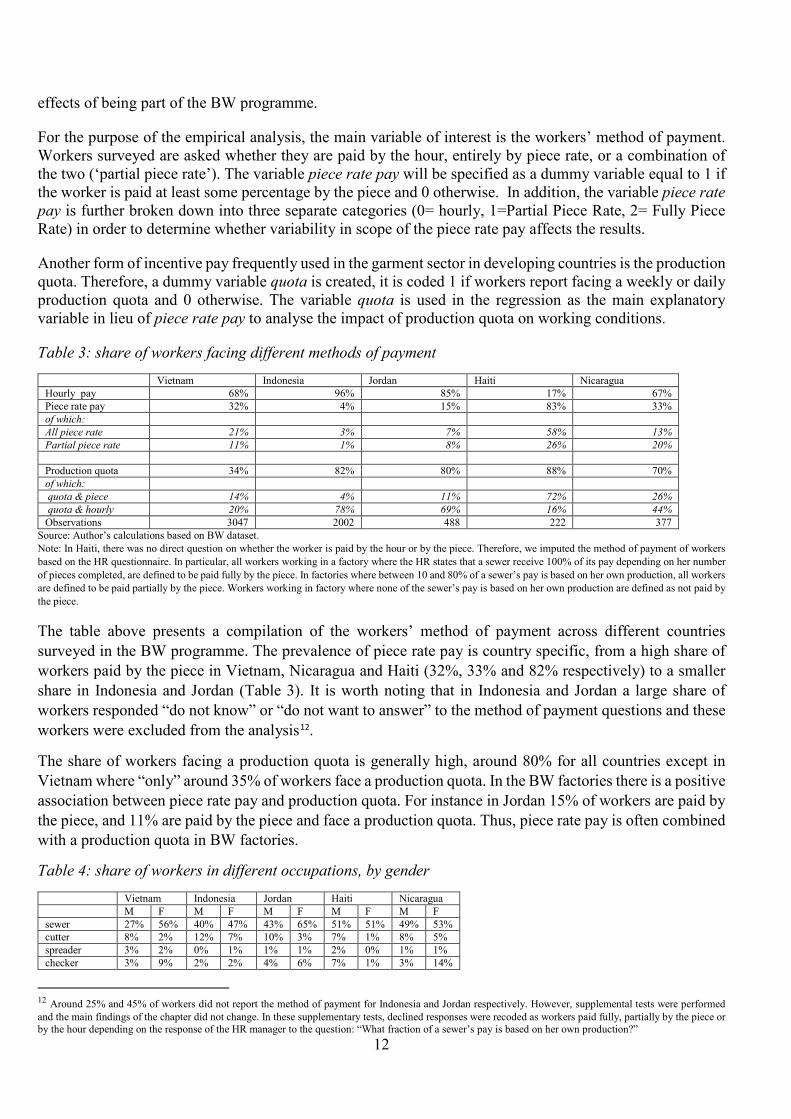
Table 3: share of workers facing different methods of payment Vietnam Indonesia Jordan Haiti Nicaragua Hourly pay 68% 96% 85% 17% 67% Piece rate pay 32% 4% 15% 83% 33% of which: All piece rate 21% 3% 7% 58% 13% Partial piece rate 11% 1% 8% 26% 20% Production quota 34% 82% 80% 88% 70% of which: quota & piece 14% 4% 11% 72% 26% quota & hourly 20% 78% 69% 16% 44% Observations 3047 2002 488 222 377
Source: Author’s calculations based on BW dataset. Note: In Haiti, there was no direct question on whether the worker is paid by the hour or by the piece. Therefore, we imputed the method of payment of workers based on the HR questionnaire. In particular, all workers working in a factory where the HR states that a sewer receive 100% of its pay depending on her number of pieces completed, are defined to be paid fully by the piece. In factories where between 10 and 80% of a sewer’s pay is based on her own production, all workers are defined to be paid partially by the piece. Workers working in factory where none of the sewer’s pay is based on her own production are defined as not paid by the piece.
The table above presents a compilation of the workers’ method of payment across different countries surveyed in the BW programme. The prevalence of piece rate pay is country specific, from a high share of workers paid by the piece in Vietnam, Nicaragua and Haiti (32%, 33% and 82% respectively) to a smaller share in Indonesia and Jordan (Table 3). It is worth noting that in Indonesia and Jordan a large share of workers responded “do not know” or “do not want to answer” to the method of payment questions and these workers were excluded from the analysis12.
The share of workers facing a production quota is generally high, around 80% for all countries except in Vietnam where “only” around 35% of workers face a production quota. In the BW factories there is a positive association between piece rate pay and production quota. For instance in Jordan 15% of workers are paid by the piece, and 11% are paid by the piece and face a production quota. Thus, piece rate pay is often combined with a production quota in BW factories.
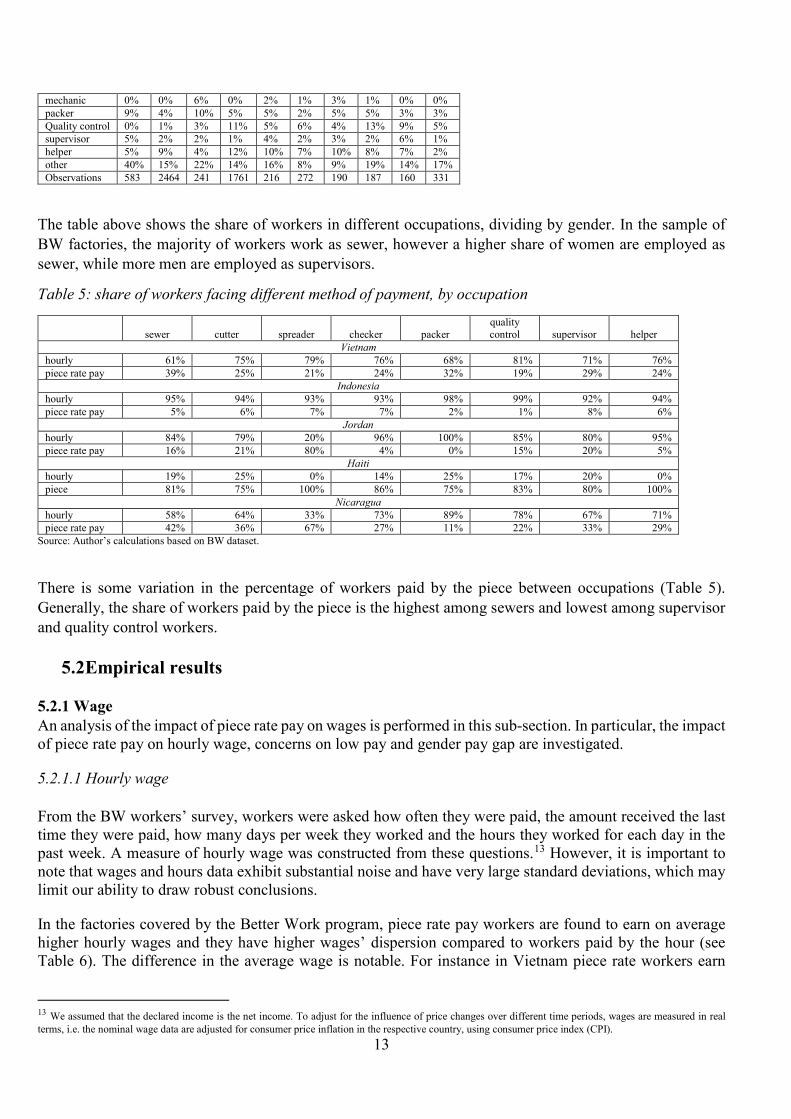
Table 4: share of workers in different occupations, by gender Vietnam Indonesia Jordan Haiti Nicaragua M F M F M F M F M F sewer 27% 56% 40% 47% 43% 65% 51% 51% 49% 53% cutter 8% 2% 12% 7% 10% 3% 7% 1% 8% 5% spreader 3% 2% 0% 1% 1% 1% 2% 0% 1% 1% checker 3% 9% 2% 2% 4% 6% 7% 1% 3% 14%
12 Around 25% and 45% of workers did not report the method of payment for Indonesia and Jordan respectively. However, supplemental tests were performed and the main findings of the chapter did not change. In these supplementary tests, declined responses were recoded as workers paid fully, partially by the piece or by the hour depending on the response of the HR manager to the question: “What fraction of a sewer’s pay is based on her own production?”
13
mechanic 0% 0% 6% 0% 2% 1% 3% 1% 0% 0% packer 9% 4% 10% 5% 5% 2% 5% 5% 3% 3% Quality control 0% 1% 3% 11% 5% 6% 4% 13% 9% 5% supervisor 5% 2% 2% 1% 4% 2% 3% 2% 6% 1% helper 5% 9% 4% 12% 10% 7% 10% 8% 7% 2% other 40% 15% 22% 14% 16% 8% 9% 19% 14% 17% Observations 583 2464 241 1761 216 272 190 187 160 331
The table above shows the share of workers in different occupations, dividing by gender. In the sample of BW factories, the majority of workers work as sewer, however a higher share of women are employed as sewer, while more men are employed as supervisors.
Table 5: share of workers facing different method of payment, by occupation
sewer cutter spreader checker packer quality control supervisor helper
Vietnam hourly 61% 75% 79% 76% 68% 81% 71% 76% piece rate pay 39% 25% 21% 24% 32% 19% 29% 24%
Indonesia hourly 95% 94% 93% 93% 98% 99% 92% 94% piece rate pay 5% 6% 7% 7% 2% 1% 8% 6%
Jordan hourly 84% 79% 20% 96% 100% 85% 80% 95% piece rate pay 16% 21% 80% 4% 0% 15% 20% 5%
Haiti hourly 19% 25% 0% 14% 25% 17% 20% 0% piece 81% 75% 100% 86% 75% 83% 80% 100%
Nicaragua hourly 58% 64% 33% 73% 89% 78% 67% 71% piece rate pay 42% 36% 67% 27% 11% 22% 33% 29%
Source: Author’s calculations based on BW dataset.
There is some variation in the percentage of workers paid by the piece between occupations (Table 5). Generally, the share of workers paid by the piece is the highest among sewers and lowest among supervisor and quality control workers.
5.2 Empirical results
5.2.1 Wage An analysis of the impact of piece rate pay on wages is performed in this sub-section. In particular, the impact of piece rate pay on hourly wage, concerns on low pay and gender pay gap are investigated.
5.2.1.1 Hourly wage
From the BW workers’ survey, workers were asked how often they were paid, the amount received the last time they were paid, how many days per week they worked and the hours they worked for each day in the past week. A measure of hourly wage was constructed from these questions.13 However, it is important to note that wages and hours data exhibit substantial noise and have very large standard deviations, which may limit our ability to draw robust conclusions.
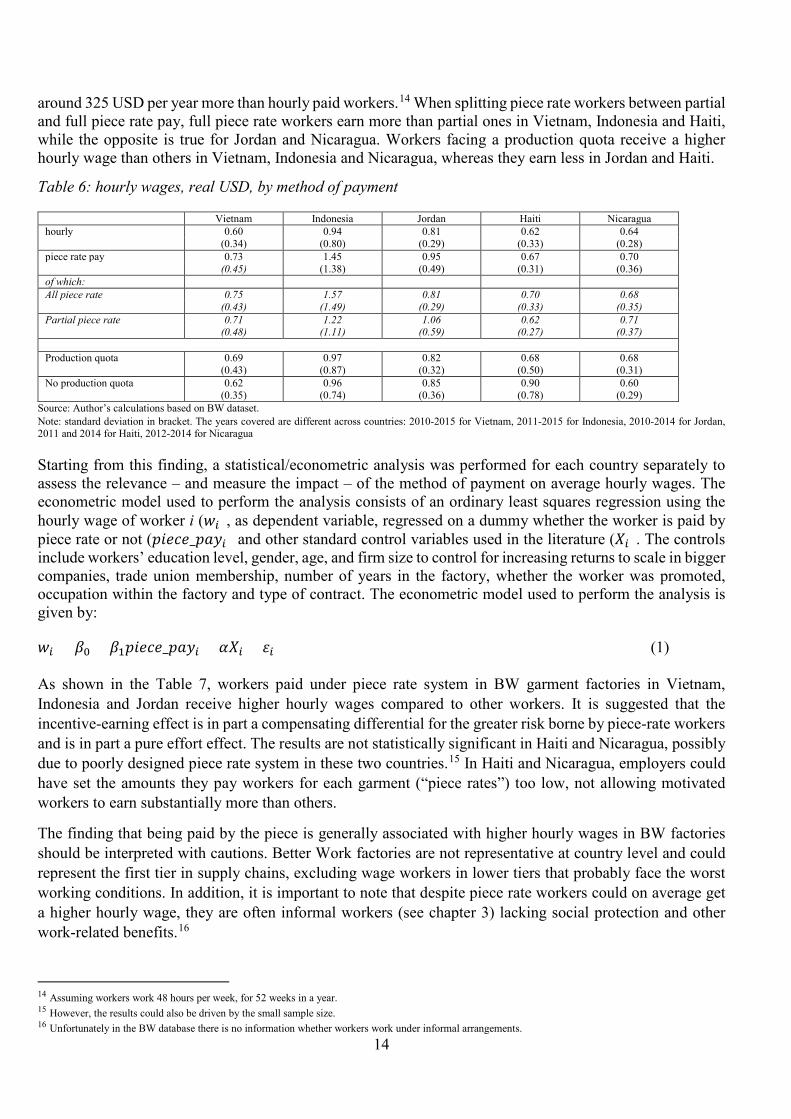
In the factories covered by the Better Work program, piece rate pay workers are found to earn on average higher hourly wages and they have higher wages’ dispersion compared to workers paid by the hour (see Table 6). The difference in the average wage is notable. For instance in Vietnam piece rate workers earn
13 We assumed that the declared income is the net income. To adjust for the influence of price changes over different time periods, wages are measured in real terms, i.e. the nominal wage data are adjusted for consumer price inflation in the respective country, using consumer price index (CPI).
14
around 325 USD per year more than hourly paid workers.14 When splitting piece rate workers between partial and full piece rate pay, full piece rate workers earn more than partial ones in Vietnam, Indonesia and Haiti, while the opposite is true for Jordan and Nicaragua. Workers facing a production quota receive a higher hourly wage than others in Vietnam, Indonesia and Nicaragua, whereas they earn less in Jordan and Haiti.
Table 6: hourly wages, real USD, by method of payment
Vietnam Indonesia Jordan Haiti Nicaragua hourly 0.60 0.94 0.81 0.62 0.64 (0.34) (0.80) (0.29) (0.33) (0.28) piece rate pay 0.73 1.45 0.95 0.67 0.70 (0.45) (1.38) (0.49) (0.31) (0.36) of which: All piece rate 0.75 1.57 0.81 0.70 0.68 (0.43) (1.49) (0.29) (0.33) (0.35) Partial piece rate 0.71 1.22 1.06 0.62 0.71 (0.48) (1.11) (0.59) (0.27) (0.37)
Production quota 0.69 0.97 0.82 0.68 0.68 (0.43) (0.87) (0.32) (0.50) (0.31) No production quota 0.62 0.96 0.85 0.90 0.60 (0.35) (0.74) (0.36) (0.78) (0.29)
Source: Author’s calculations based on BW dataset. Note: standard deviation in bracket. The years covered are different across countries: 2010-2015 for Vietnam, 2011-2015 for Indonesia, 2010-2014 for Jordan, 2011 and 2014 for Haiti, 2012-2014 for Nicaragua
Starting from this finding, a statistical/econometric analysis was performed for each country separately to assess the relevance – and measure the impact – of the method of payment on average hourly wages. The econometric model used to perform the analysis consists of an ordinary least squares regression using the hourly wage of worker i (𝑤𝑤𝑖𝑖), as dependent variable, regressed on a dummy whether the worker is paid by piece rate or not (𝑝𝑝𝑝𝑝𝑝𝑝𝑝𝑝𝑝𝑝_𝑝𝑝𝑝𝑝𝑝𝑝𝑖𝑖) and other standard control variables used in the literature (𝑋𝑋𝑖𝑖). The controls include workers’ education level, gender, age, and firm size to control for increasing returns to scale in bigger companies, trade union membership, number of years in the factory, whether the worker was promoted, occupation within the factory and type of contract. The econometric model used to perform the analysis is given by:
𝑤𝑤𝑖𝑖 = 𝛽𝛽0 + 𝛽𝛽1𝑝𝑝𝑝𝑝𝑝𝑝𝑝𝑝𝑝𝑝_𝑝𝑝𝑝𝑝𝑝𝑝𝑖𝑖 + 𝛼𝛼𝑋𝑋𝑖𝑖 + 𝜀𝜀𝑖𝑖 (1) As shown in the Table 7, workers paid under piece rate system in BW garment factories in Vietnam, Indonesia and Jordan receive higher hourly wages compared to other workers. It is suggested that the incentive-earning effect is in part a compensating differential for the greater risk borne by piece-rate workers and is in part a pure effort effect. The results are not statistically significant in Haiti and Nicaragua, possibly due to poorly designed piece rate system in these two countries.15 In Haiti and Nicaragua, employers could have set the amounts they pay workers for each garment (“piece rates”) too low, not allowing motivated workers to earn substantially more than others.
The finding that being paid by the piece is generally associated with higher hourly wages in BW factories should be interpreted with cautions. Better Work factories are not representative at country level and could represent the first tier in supply chains, excluding wage workers in lower tiers that probably face the worst working conditions. In addition, it is important to note that despite piece rate workers could on average get a higher hourly wage, they are often informal workers (see chapter 3) lacking social protection and other work-related benefits.16
14 Assuming workers work 48 hours per week, for 52 weeks in a year. 15 However, the results could also be driven by the small sample size. 16 Unfortunately in the BW database there is no information whether workers work under informal arrangements.
15
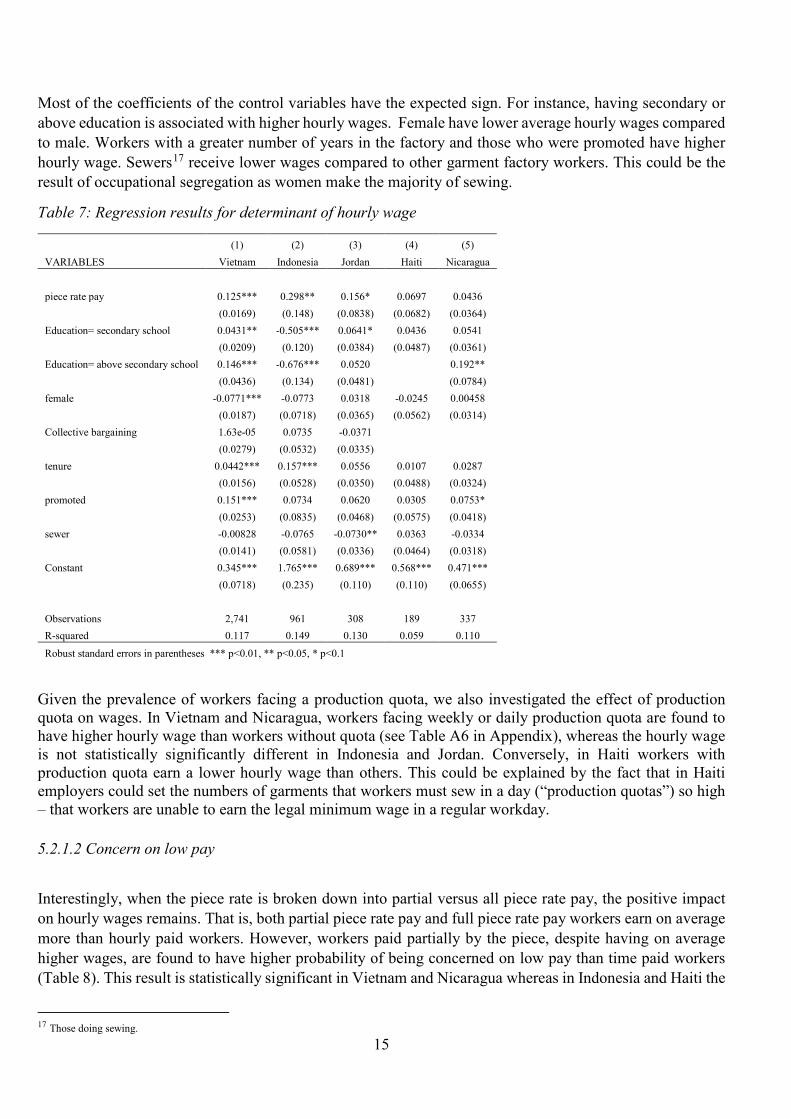
Most of the coefficients of the control variables have the expected sign. For instance, having secondary or above education is associated with higher hourly wages. Female have lower average hourly wages compared to male. Workers with a greater number of years in the factory and those who were promoted have higher hourly wage. Sewers17 receive lower wages compared to other garment factory workers. This could be the result of occupational segregation as women make the majority of sewing.
Table 7: Regression results for determinant of hourly wage
(1) (2) (3) (4) (5) VARIABLES Vietnam Indonesia Jordan Haiti Nicaragua piece rate pay 0.125*** 0.298** 0.156* 0.0697 0.0436
(0.0169) (0.148) (0.0838) (0.0682) (0.0364) Education= secondary school 0.0431** -0.505*** 0.0641* 0.0436 0.0541
(0.0209) (0.120) (0.0384) (0.0487) (0.0361) Education= above secondary school 0.146*** -0.676*** 0.0520 0.192**
(0.0436) (0.134) (0.0481) (0.0784) female -0.0771*** -0.0773 0.0318 -0.0245 0.00458
(0.0187) (0.0718) (0.0365) (0.0562) (0.0314) Collective bargaining 1.63e-05 0.0735 -0.0371
(0.0279) (0.0532) (0.0335) tenure 0.0442*** 0.157*** 0.0556 0.0107 0.0287
(0.0156) (0.0528) (0.0350) (0.0488) (0.0324) promoted 0.151*** 0.0734 0.0620 0.0305 0.0753*
(0.0253) (0.0835) (0.0468) (0.0575) (0.0418) sewer -0.00828 -0.0765 -0.0730** 0.0363 -0.0334
(0.0141) (0.0581) (0.0336) (0.0464) (0.0318) Constant 0.345*** 1.765*** 0.689*** 0.568*** 0.471***
(0.0718) (0.235) (0.110) (0.110) (0.0655)
Observations 2,741 961 308 189 337 R-squared 0.117 0.149 0.130 0.059 0.110
Robust standard errors in parentheses *** p<0.01, ** p<0.05, * p<0.1
Given the prevalence of workers facing a production quota, we also investigated the effect of production quota on wages. In Vietnam and Nicaragua, workers facing weekly or daily production quota are found to have higher hourly wage than workers without quota (see Table A6 in Appendix), whereas the hourly wage is not statistically significantly different in Indonesia and Jordan. Conversely, in Haiti workers with production quota earn a lower hourly wage than others. This could be explained by the fact that in Haiti employers could set the numbers of garments that workers must sew in a day (“production quotas”) so high – that workers are unable to earn the legal minimum wage in a regular workday. 5.2.1.2 Concern on low pay
Interestingly, when the piece rate is broken down into partial versus all piece rate pay, the positive impact on hourly wages remains. That is, both partial piece rate pay and full piece rate pay workers earn on average more than hourly paid workers. However, workers paid partially by the piece, despite having on average higher wages, are found to have higher probability of being concerned on low pay than time paid workers (Table 8). This result is statistically significant in Vietnam and Nicaragua whereas in Indonesia and Haiti the
17 Those doing sewing.

16
coefficient on partial piece rate pay is positive but not statistically significant. On the contrary, fully piece rate pay workers seem to have a lower probability of being concerned on low pay, although the result is statistically significant only for Vietnam, possibly due to the small sample size of other countries. Similarly, workers who face a production quota in Vietnam and Indonesia have a higher probability of being concerned on low wages (see Table A7 in Appendix).
Employees paid piece rates or facing production quota are paid by results instead of getting an hourly or weekly pay rate. This means the amount the employee earns each week will vary depending on how much work they do. The higher variability of wages could be a first explanation of the higher concern on low wages for piece rate pay workers. This is particularly a problem when workers face partial piece rate with a base salary very low and an incentive pay based on the output only if a certain output threshold is reached. This system could create a high level of uncertainty as the wage can be very low if the output threshold is not reached and thus generating high level of concern on low wages. A similar reasoning applies to a worker facing production quota, because if these workers do not reach the target, they will not receive their pay or they will receive a pay substantially lower.
In addition, a significant number of Better Work factories are not compliant with wage information. In many cases employers do not properly inform workers about wage payment and deductions. This higher concern on low pay of partial piece rate workers could be due to the uncertain and unclear setting of wage rates for these workers.18 In Vietnam, 12% of piece rate paid workers declared they were concerned about the explanation of piece rate pay and 60% of piece rate pay Indonesian workers declared to be worried or confused about piece rate pay. In general, a high share of workers declared to be concerned about piece rate pay (10% in Vietnam, and 25% in Jordan and in Nicaragua). This result is in line with the result in the next sections, where partial piece rate workers are found to be more concerned on physical and mental health compared to time rate workers.
Table 8: Regression results for the probability of workers being concerned with low pay
(1) (2) (3) (4) (5) VARIABLES Vietnam Indonesia Jordan Haiti Nicaragua All piece rate -0.301*** -0.160 -0.566 -0.379 0.245 (0.0920) (0.347) (0.442) (0.450) (0.222) Partial piece rate 0.487*** 0.492 -0.0579 0.0447 0.487** (0.0928) (0.561) (0.459) (0.510) (0.197) Constant -0.978*** 0.621* 0.177 0.874* -0.371** (0.357) (0.372) (0.293) (0.523) (0.182) Observations 2,699 407 159 106 295 Robust standard errors in parentheses *** p<0.01, ** p<0.05, * p<0.1 Probit model.
Often there is little or no workers involvement in terms and conditions of piecework contracts (Hart, 2016). As a result, employees have a negative feeling towards piece rate pay. Almost every employee either has been victim of piece-rate games, or know someone who has (Billikopf, 2014). When employees mistrust employer and believe that piece rates will be lowered if the employer really knows what they are capable of, the piece rate pay fails (Billikopf, 2014). Therefore, involving employees before implementing a piece-rate pay system is beneficial for increasing transparency, confidence and ownership of the piece rate pay design. In this respect, there is an important role for trade unions to play in order for piece-rate pay design to be built under fairness. 5.2.1.3 Gender pay gap 18 This is also probably due to shifting of piece rate pay due to changes in orders.
17
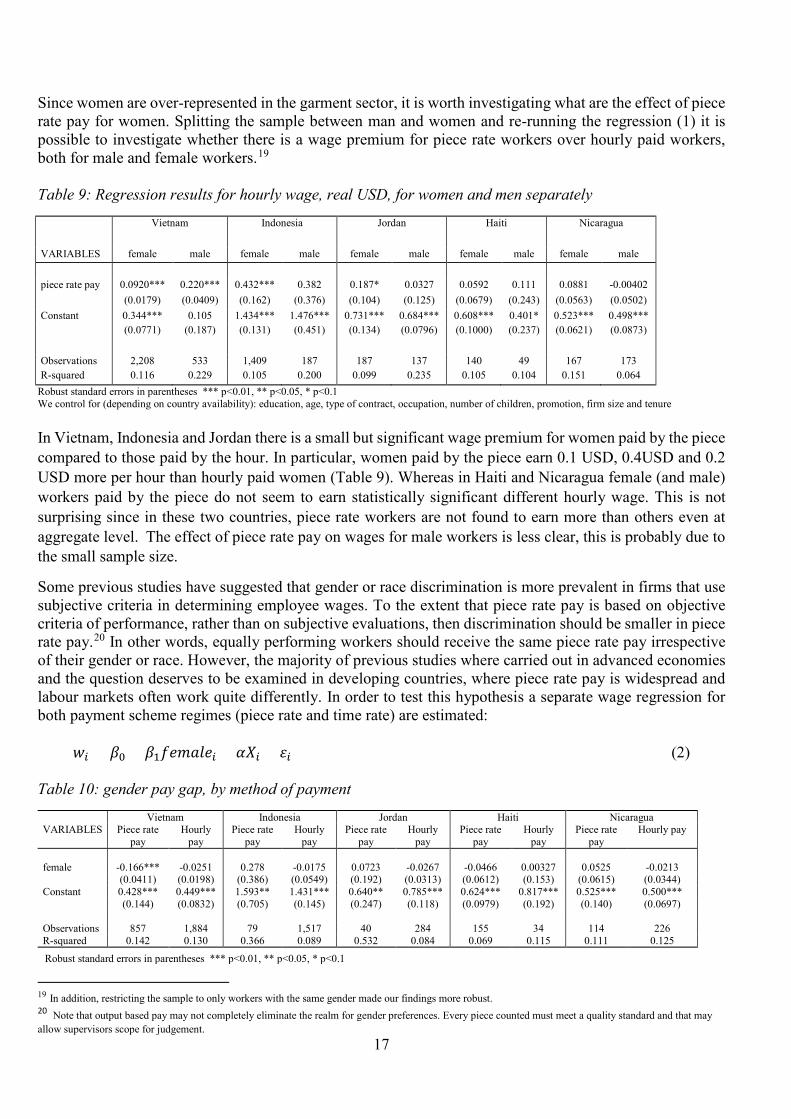
Since women are over-represented in the garment sector, it is worth investigating what are the effect of piece rate pay for women. Splitting the sample between man and women and re-running the regression (1) it is possible to investigate whether there is a wage premium for piece rate workers over hourly paid workers, both for male and female workers.19 Table 9: Regression results for hourly wage, real USD, for women and men separately
Vietnam Indonesia Jordan
Haiti Nicaragua
VARIABLES female male female male female male female male female male piece rate pay 0.0920*** 0.220*** 0.432*** 0.382 0.187* 0.0327 0.0592 0.111 0.0881 -0.00402 (0.0179) (0.0409) (0.162) (0.376) (0.104) (0.125) (0.0679) (0.243) (0.0563) (0.0502) Constant 0.344*** 0.105 1.434*** 1.476*** 0.731*** 0.684*** 0.608*** 0.401* 0.523*** 0.498*** (0.0771) (0.187) (0.131) (0.451) (0.134) (0.0796) (0.1000) (0.237) (0.0621) (0.0873) Observations 2,208 533 1,409 187 187 137 140 49 167 173 R-squared 0.116 0.229 0.105 0.200 0.099 0.235 0.105 0.104 0.151 0.064
Robust standard errors in parentheses *** p<0.01, ** p<0.05, * p<0.1 We control for (depending on country availability): education, age, type of contract, occupation, number of children, promotion, firm size and tenure
In Vietnam, Indonesia and Jordan there is a small but significant wage premium for women paid by the piece compared to those paid by the hour. In particular, women paid by the piece earn 0.1 USD, 0.4USD and 0.2 USD more per hour than hourly paid women (Table 9). Whereas in Haiti and Nicaragua female (and male) workers paid by the piece do not seem to earn statistically significant different hourly wage. This is not surprising since in these two countries, piece rate workers are not found to earn more than others even at aggregate level. The effect of piece rate pay on wages for male workers is less clear, this is probably due to the small sample size.
Some previous studies have suggested that gender or race discrimination is more prevalent in firms that use subjective criteria in determining employee wages. To the extent that piece rate pay is based on objective criteria of performance, rather than on subjective evaluations, then discrimination should be smaller in piece rate pay.20 In other words, equally performing workers should receive the same piece rate pay irrespective of their gender or race. However, the majority of previous studies where carried out in advanced economies and the question deserves to be examined in developing countries, where piece rate pay is widespread and labour markets often work quite differently. In order to test this hypothesis a separate wage regression for both payment scheme regimes (piece rate and time rate) are estimated:
𝑤𝑤𝑖𝑖 = 𝛽𝛽0 + 𝛽𝛽1𝑓𝑓𝑝𝑝𝑓𝑓𝑝𝑝𝑓𝑓𝑝𝑝𝑖𝑖 + 𝛼𝛼𝑋𝑋𝑖𝑖 + 𝜀𝜀𝑖𝑖 (2)
Table 10: gender pay gap, by method of payment
Vietnam Indonesia Jordan Haiti Nicaragua VARIABLES Piece rate
pay Hourly
pay Piece rate
pay Hourly
pay Piece rate
pay Hourly
pay Piece rate
pay Hourly
pay Piece rate
pay Hourly pay
female -0.166*** -0.0251 0.278 -0.0175 0.0723 -0.0267 -0.0466 0.00327 0.0525 -0.0213 (0.0411) (0.0198) (0.386) (0.0549) (0.192) (0.0313) (0.0612) (0.153) (0.0615) (0.0344) Constant 0.428*** 0.449*** 1.593** 1.431*** 0.640** 0.785*** 0.624*** 0.817*** 0.525*** 0.500*** (0.144) (0.0832) (0.705) (0.145) (0.247) (0.118) (0.0979) (0.192) (0.140) (0.0697) Observations 857 1,884 79 1,517 40 284 155 34 114 226 R-squared 0.142 0.130 0.366 0.089 0.532 0.084 0.069 0.115 0.111 0.125
Robust standard errors in parentheses *** p<0.01, ** p<0.05, * p<0.1
19 In addition, restricting the sample to only workers with the same gender made our findings more robust. 20 Note that output based pay may not completely eliminate the realm for gender preferences. Every piece counted must meet a quality standard and that may allow supervisors scope for judgement.
18
We control for (depending on country availability): education, age, type of contract, occupation, number of children, promotion, firm size and tenure
The regression results illustrate that in Vietnam, the gender coefficient (𝛽𝛽1) is negative and statistically significant only under piece rates and not for time wages. This implies that female earn statistically less than male when paid by the piece but not when paid by the hour, after controlling for basic control variables (Table 10). In BW factories in the remaining countries, female are not found to earn statistically significant less than men for both workers paid by the piece or by the hour. However the fact that the gender dummy coefficients are not statistically significant can be due to the small sample size, especially among piece rate workers. Therefore, from this empirical analysis, it is only possible to conclude that piece rate pay workers face stronger gender wage differentials than hourly paid workers in Vietnam BW factories. A similar result is found for workers in Vietnam BW factories that face a production quota. One possible explanation of the high gender pay gap in piece rate pay is that firms were exerting some monopsonistic exploitation of women due to their lower outside opportunities due to housework or family responsibilities (De la Rica et al. (2010) found a similar result in Spain). In fact, garment production paid by the piece is often one of the few options available to poor women (WIEGO). In addition, the gender pay gap could be high for piece rate workers in BW factories because piece rate pay is not based on objective criteria of performance. In fact, supervisors are frequently responsible for deciding whether the product meets the quality standard (and hence the workers could receive the payment) but they are often paid a salary independently of the workers’ output. This situation creates vulnerability, which can translate into gender discrimination (see Truskinovsky et al. 2014). In addition, piece rate workers in BW garment factories face a not transparent method of computation of wages (workers in BW factories declared to be concerned about the explanation of piece rate pay), which leaves space for more discrimination. 5.2.2 Working hours The Hours of Work (Industry) Convention, 1919 (No. 1), introduced a maximum standard working time of 48 hours per week and eight hours per day, with the exception of limited and well-circumscribed cases. However, some of the biggest garment production countries have not ratified Convention No. 1. Many of garment sector employees in developing countries work longer than a normal working day (ILO, 2014). In Vietnam, for instance, Better Work (2015) found that the majority of factories now comply with the national legal limits, established by the Labour Law in Vietnam, of four hours overtime per day, but 77 percent still fail to meet monthly limits (30 hours) and 72 percent exceed annual limits (300 hours). In addition, and due to the high prevalence of Sunday work, 44 percent of factories fail to provide at least four days of rest per month to all workers. Several problems are, indeed, associated to overtime work, including poor work/life balance and an increased risk of injury hazard (Dembe et al. 2005).
Therefore, it is crucial to identify whether piece rate pay has effects on the average number of working hours and overtime work. Because piece rate pay depends on the number of pieces produced, the number of hours worked could increases beyond legal or negotiated levels in order to reach a minimum wage level. On the contrary, piece rate workers may work less hours because they manage to get a reasonable wage in less time as a consequence of the higher effort they may put forward. The Better Work baseline survey asks workers to report the time they started and finished work on every day of the reference week. In order to assess workers' average weekly hours of work, a new variable can be computed as follows. First, the self-reported times at which workers started work on the last Monday were subtracted from the self-reported times at which workers finished work on the last Monday. The same was done for self-reported start and finishing times on Fridays and Saturdays. Only positive working hours were kept and non-positive work hours were recorded as “missing”. Based on the number of days the worker worked during the previous week, weekly average working hours were computed by adding up Monday
19
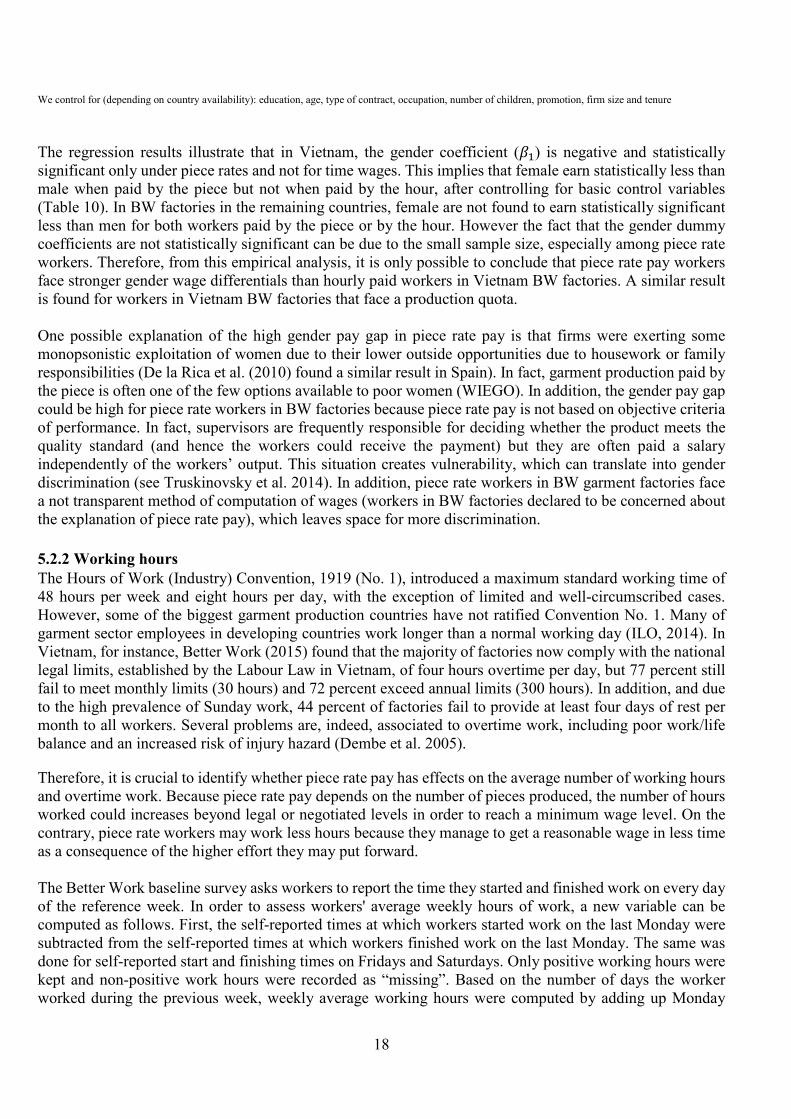
work hours times four as well as working hours on Friday, Saturday and Sunday21. It should also be noted that work hours were reported in half hour intervals rather than continuously and are likely to include a worker’s lunch break. In addition, starting from declared working hours, it is possible to compute a dummy variable (overtime work) that takes the value 1 when an employee works more than 48 hours a week on a normal week and 0 otherwise.
Table 11: hours worked per week, by method of payment
Vietnam Indonesia Jordan Haiti Nicaragua Hourly pay 58 47 69 52 53 Piece rate pay 57 39 69 52 52 Of which: All piece rate pay 57 39 68 53 52 Partial piece rate pay 56 39 69 52 52
Source: Author’s calculations based on BW dataset.
In the factories covered by the Better Work program, piece rate pay workers are found to work on average the same number of hours per week or slightly less than workers paid by the hour (see Table 11). When splitting piece rate workers between those paid partially and fully by the piece, the number of hours worked per week are almost the same. The lack of relationship between method of payment and hours worked can be due to the fact that all workers are working very long hours so there is less space for differences.
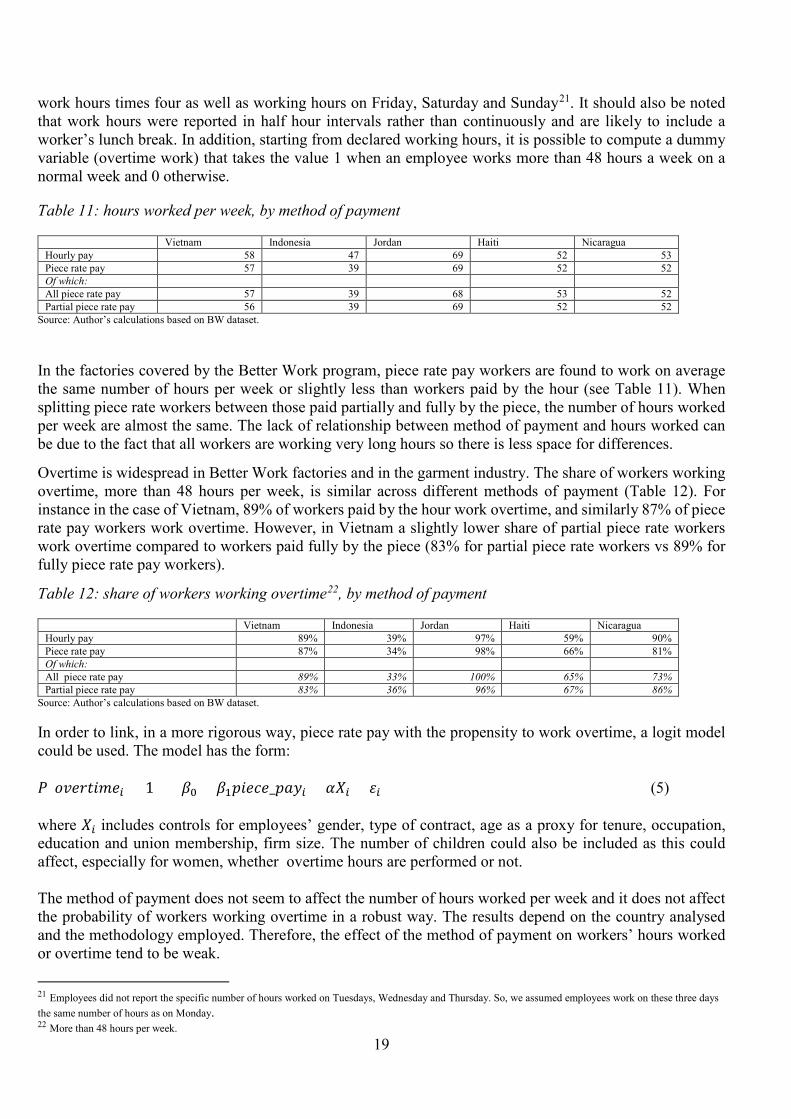
Overtime is widespread in Better Work factories and in the garment industry. The share of workers working overtime, more than 48 hours per week, is similar across different methods of payment (Table 12). For instance in the case of Vietnam, 89% of workers paid by the hour work overtime, and similarly 87% of piece rate pay workers work overtime. However, in Vietnam a slightly lower share of partial piece rate workers work overtime compared to workers paid fully by the piece (83% for partial piece rate workers vs 89% for fully piece rate pay workers).
Table 12: share of workers working overtime22, by method of payment
Vietnam Indonesia Jordan Haiti Nicaragua Hourly pay 89% 39% 97% 59% 90% Piece rate pay 87% 34% 98% 66% 81% Of which: All piece rate pay 89% 33% 100% 65% 73% Partial piece rate pay 83% 36% 96% 67% 86%
Source: Author’s calculations based on BW dataset.
In order to link, in a more rigorous way, piece rate pay with the propensity to work overtime, a logit model could be used. The model has the form: 𝑃𝑃(𝑜𝑜𝑜𝑜𝑝𝑝𝑜𝑜𝑜𝑜𝑝𝑝𝑓𝑓𝑝𝑝𝑖𝑖 = 1) = 𝛽𝛽0 + 𝛽𝛽1𝑝𝑝𝑝𝑝𝑝𝑝𝑝𝑝𝑝𝑝_𝑝𝑝𝑝𝑝𝑝𝑝𝑖𝑖 + 𝛼𝛼𝑋𝑋𝑖𝑖 + 𝜀𝜀𝑖𝑖 (5) where 𝑋𝑋𝑖𝑖 includes controls for employees’ gender, type of contract, age as a proxy for tenure, occupation, education and union membership, firm size. The number of children could also be included as this could affect, especially for women, whether overtime hours are performed or not. The method of payment does not seem to affect the number of hours worked per week and it does not affect the probability of workers working overtime in a robust way. The results depend on the country analysed and the methodology employed. Therefore, the effect of the method of payment on workers’ hours worked or overtime tend to be weak.
21 Employees did not report the specific number of hours worked on Tuesdays, Wednesday and Thursday. So, we assumed employees work on these three days the same number of hours as on Monday. 22 More than 48 hours per week.
20
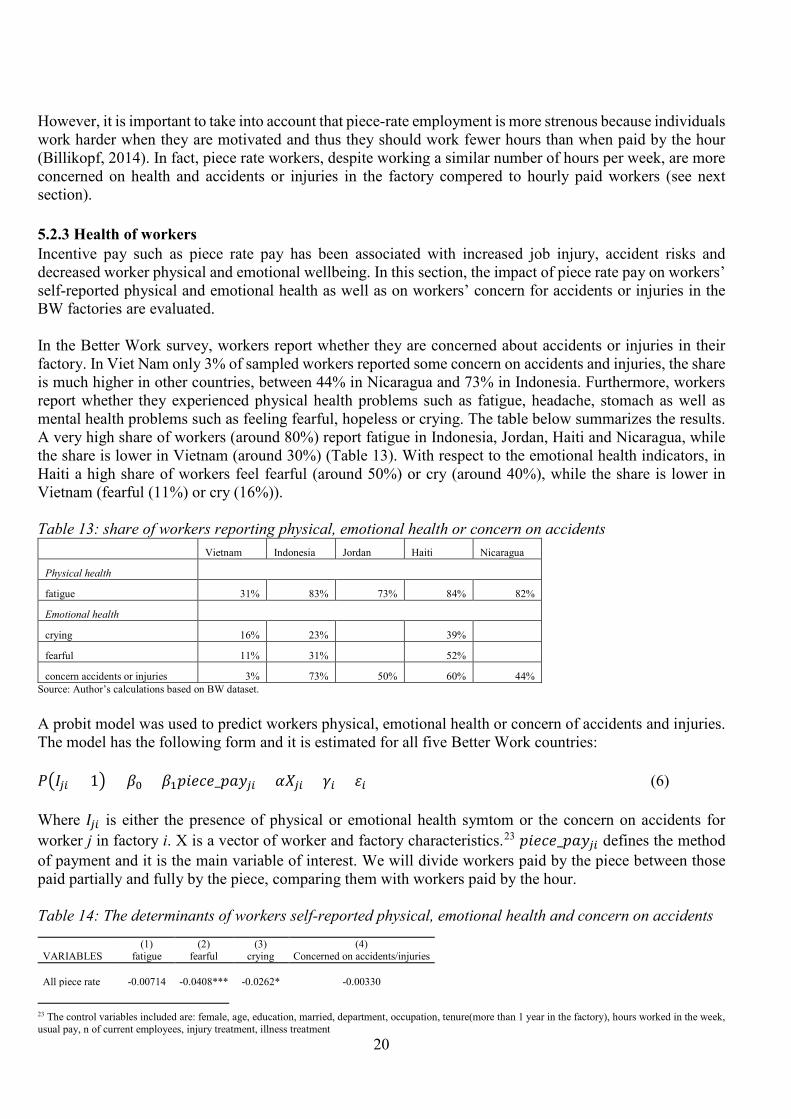
However, it is important to take into account that piece-rate employment is more strenous because individuals work harder when they are motivated and thus they should work fewer hours than when paid by the hour (Billikopf, 2014). In fact, piece rate workers, despite working a similar number of hours per week, are more concerned on health and accidents or injuries in the factory compered to hourly paid workers (see next section). 5.2.3 Health of workers Incentive pay such as piece rate pay has been associated with increased job injury, accident risks and decreased worker physical and emotional wellbeing. In this section, the impact of piece rate pay on workers’ self-reported physical and emotional health as well as on workers’ concern for accidents or injuries in the BW factories are evaluated. In the Better Work survey, workers report whether they are concerned about accidents or injuries in their factory. In Viet Nam only 3% of sampled workers reported some concern on accidents and injuries, the share is much higher in other countries, between 44% in Nicaragua and 73% in Indonesia. Furthermore, workers report whether they experienced physical health problems such as fatigue, headache, stomach as well as mental health problems such as feeling fearful, hopeless or crying. The table below summarizes the results. A very high share of workers (around 80%) report fatigue in Indonesia, Jordan, Haiti and Nicaragua, while the share is lower in Vietnam (around 30%) (Table 13). With respect to the emotional health indicators, in Haiti a high share of workers feel fearful (around 50%) or cry (around 40%), while the share is lower in Vietnam (fearful (11%) or cry (16%)). Table 13: share of workers reporting physical, emotional health or concern on accidents
Vietnam Indonesia Jordan Haiti Nicaragua
Physical health
fatigue 31% 83% 73% 84% 82%
Emotional health
crying 16% 23% 39%
fearful 11% 31% 52%
concern accidents or injuries 3% 73% 50% 60% 44% Source: Author’s calculations based on BW dataset.
A probit model was used to predict workers physical, emotional health or concern of accidents and injuries. The model has the following form and it is estimated for all five Better Work countries: 𝑃𝑃�𝐼𝐼𝑗𝑗𝑖𝑖 = 1� = 𝛽𝛽0 + 𝛽𝛽1𝑝𝑝𝑝𝑝𝑝𝑝𝑝𝑝𝑝𝑝_𝑝𝑝𝑝𝑝𝑝𝑝𝑗𝑗𝑖𝑖 + 𝛼𝛼𝑋𝑋𝑗𝑗𝑖𝑖 + 𝛾𝛾𝑖𝑖 + 𝜀𝜀𝑖𝑖 (6) Where 𝐼𝐼𝑗𝑗𝑖𝑖 is either the presence of physical or emotional health symtom or the concern on accidents for worker j in factory i. X is a vector of worker and factory characteristics.23 𝑝𝑝𝑝𝑝𝑝𝑝𝑝𝑝𝑝𝑝_𝑝𝑝𝑝𝑝𝑝𝑝𝑗𝑗𝑖𝑖 defines the method of payment and it is the main variable of interest. We will divide workers paid by the piece between those paid partially and fully by the piece, comparing them with workers paid by the hour. Table 14: The determinants of workers self-reported physical, emotional health and concern on accidents (1) (2) (3) (4) VARIABLES fatigue fearful crying Concerned on accidents/injuries All piece rate -0.00714 -0.0408*** -0.0262* -0.00330
23 The control variables included are: female, age, education, married, department, occupation, tenure(more than 1 year in the factory), hours worked in the week, usual pay, n of current employees, injury treatment, illness treatment
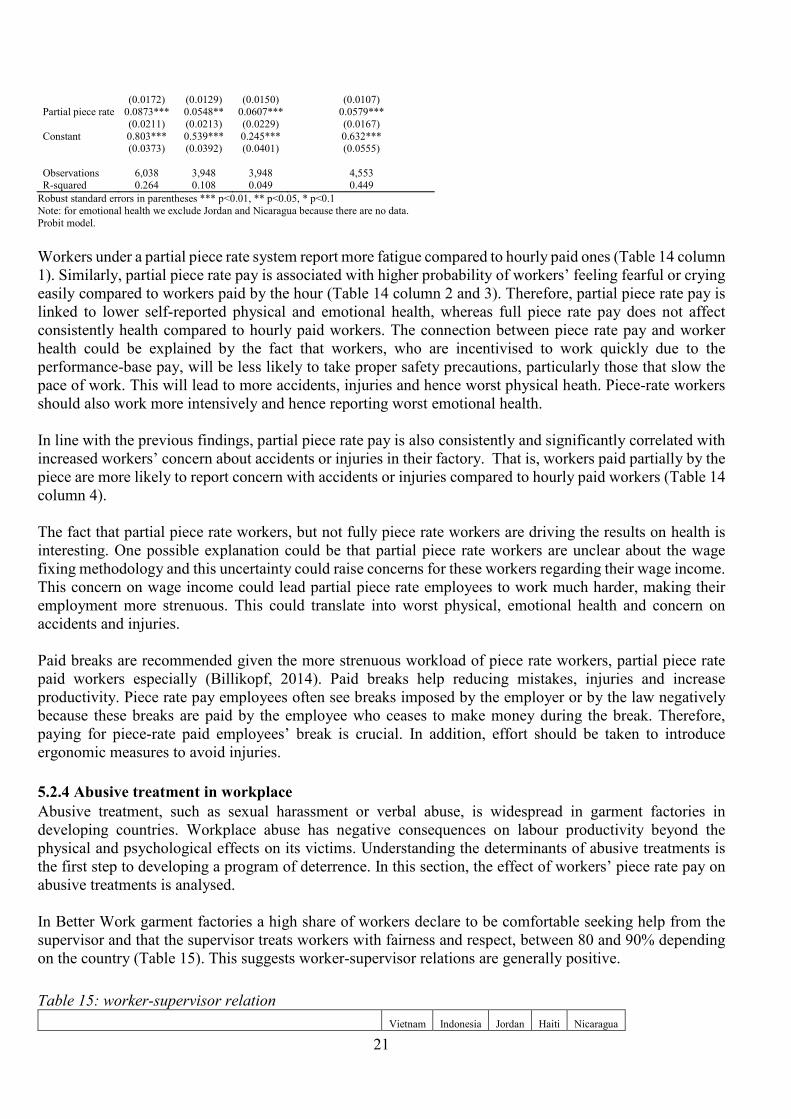
21
(0.0172) (0.0129) (0.0150) (0.0107) Partial piece rate 0.0873*** 0.0548** 0.0607*** 0.0579*** (0.0211) (0.0213) (0.0229) (0.0167) Constant 0.803*** 0.539*** 0.245*** 0.632*** (0.0373) (0.0392) (0.0401) (0.0555) Observations 6,038 3,948 3,948 4,553 R-squared 0.264 0.108 0.049 0.449
Robust standard errors in parentheses *** p<0.01, ** p<0.05, * p<0.1 Note: for emotional health we exclude Jordan and Nicaragua because there are no data. Probit model. Workers under a partial piece rate system report more fatigue compared to hourly paid ones (Table 14 column 1). Similarly, partial piece rate pay is associated with higher probability of workers’ feeling fearful or crying easily compared to workers paid by the hour (Table 14 column 2 and 3). Therefore, partial piece rate pay is linked to lower self-reported physical and emotional health, whereas full piece rate pay does not affect consistently health compared to hourly paid workers. The connection between piece rate pay and worker health could be explained by the fact that workers, who are incentivised to work quickly due to the performance-base pay, will be less likely to take proper safety precautions, particularly those that slow the pace of work. This will lead to more accidents, injuries and hence worst physical heath. Piece-rate workers should also work more intensively and hence reporting worst emotional health. In line with the previous findings, partial piece rate pay is also consistently and significantly correlated with increased workers’ concern about accidents or injuries in their factory. That is, workers paid partially by the piece are more likely to report concern with accidents or injuries compared to hourly paid workers (Table 14 column 4). The fact that partial piece rate workers, but not fully piece rate workers are driving the results on health is interesting. One possible explanation could be that partial piece rate workers are unclear about the wage fixing methodology and this uncertainty could raise concerns for these workers regarding their wage income. This concern on wage income could lead partial piece rate employees to work much harder, making their employment more strenuous. This could translate into worst physical, emotional health and concern on accidents and injuries. Paid breaks are recommended given the more strenuous workload of piece rate workers, partial piece rate paid workers especially (Billikopf, 2014). Paid breaks help reducing mistakes, injuries and increase productivity. Piece rate pay employees often see breaks imposed by the employer or by the law negatively because these breaks are paid by the employee who ceases to make money during the break. Therefore, paying for piece-rate paid employees’ break is crucial. In addition, effort should be taken to introduce ergonomic measures to avoid injuries. 5.2.4 Abusive treatment in workplace Abusive treatment, such as sexual harassment or verbal abuse, is widespread in garment factories in developing countries. Workplace abuse has negative consequences on labour productivity beyond the physical and psychological effects on its victims. Understanding the determinants of abusive treatments is the first step to developing a program of deterrence. In this section, the effect of workers’ piece rate pay on abusive treatments is analysed. In Better Work garment factories a high share of workers declare to be comfortable seeking help from the supervisor and that the supervisor treats workers with fairness and respect, between 80 and 90% depending on the country (Table 15). This suggests worker-supervisor relations are generally positive. Table 15: worker-supervisor relation
Vietnam Indonesia Jordan Haiti Nicaragua
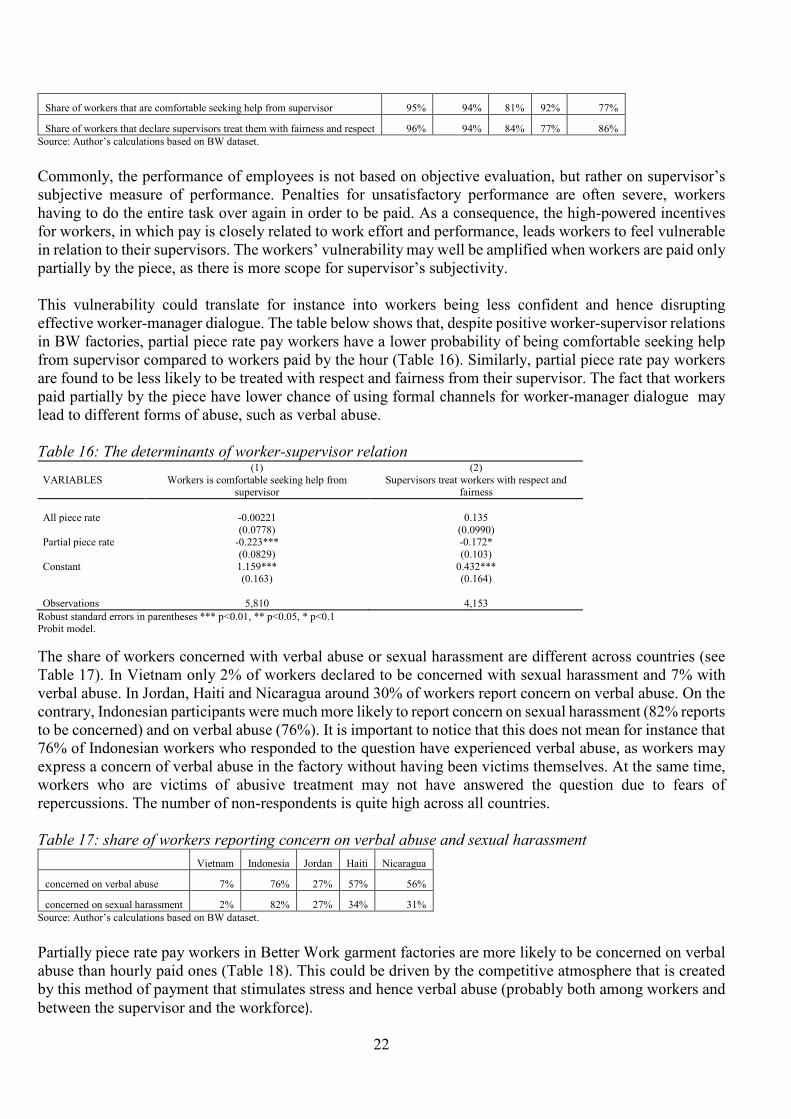
22
Share of workers that are comfortable seeking help from supervisor 95% 94% 81% 92% 77%
Share of workers that declare supervisors treat them with fairness and respect 96% 94% 84% 77% 86% Source: Author’s calculations based on BW dataset.
Commonly, the performance of employees is not based on objective evaluation, but rather on supervisor’s subjective measure of performance. Penalties for unsatisfactory performance are often severe, workers having to do the entire task over again in order to be paid. As a consequence, the high-powered incentives for workers, in which pay is closely related to work effort and performance, leads workers to feel vulnerable in relation to their supervisors. The workers’ vulnerability may well be amplified when workers are paid only partially by the piece, as there is more scope for supervisor’s subjectivity. This vulnerability could translate for instance into workers being less confident and hence disrupting effective worker-manager dialogue. The table below shows that, despite positive worker-supervisor relations in BW factories, partial piece rate pay workers have a lower probability of being comfortable seeking help from supervisor compared to workers paid by the hour (Table 16). Similarly, partial piece rate pay workers are found to be less likely to be treated with respect and fairness from their supervisor. The fact that workers paid partially by the piece have lower chance of using formal channels for worker-manager dialogue may lead to different forms of abuse, such as verbal abuse. Table 16: The determinants of worker-supervisor relation (1) (2) VARIABLES Workers is comfortable seeking help from
supervisor Supervisors treat workers with respect and
fairness All piece rate -0.00221 0.135 (0.0778) (0.0990) Partial piece rate -0.223*** -0.172* (0.0829) (0.103) Constant 1.159*** 0.432*** (0.163) (0.164) Observations 5,810 4,153
Robust standard errors in parentheses *** p<0.01, ** p<0.05, * p<0.1 Probit model. The share of workers concerned with verbal abuse or sexual harassment are different across countries (see Table 17). In Vietnam only 2% of workers declared to be concerned with sexual harassment and 7% with verbal abuse. In Jordan, Haiti and Nicaragua around 30% of workers report concern on verbal abuse. On the contrary, Indonesian participants were much more likely to report concern on sexual harassment (82% reports to be concerned) and on verbal abuse (76%). It is important to notice that this does not mean for instance that 76% of Indonesian workers who responded to the question have experienced verbal abuse, as workers may express a concern of verbal abuse in the factory without having been victims themselves. At the same time, workers who are victims of abusive treatment may not have answered the question due to fears of repercussions. The number of non-respondents is quite high across all countries. Table 17: share of workers reporting concern on verbal abuse and sexual harassment
Vietnam Indonesia Jordan Haiti Nicaragua
concerned on verbal abuse 7% 76% 27% 57% 56%
concerned on sexual harassment 2% 82% 27% 34% 31% Source: Author’s calculations based on BW dataset.
Partially piece rate pay workers in Better Work garment factories are more likely to be concerned on verbal abuse than hourly paid ones (Table 18). This could be driven by the competitive atmosphere that is created by this method of payment that stimulates stress and hence verbal abuse (probably both among workers and between the supervisor and the workforce).
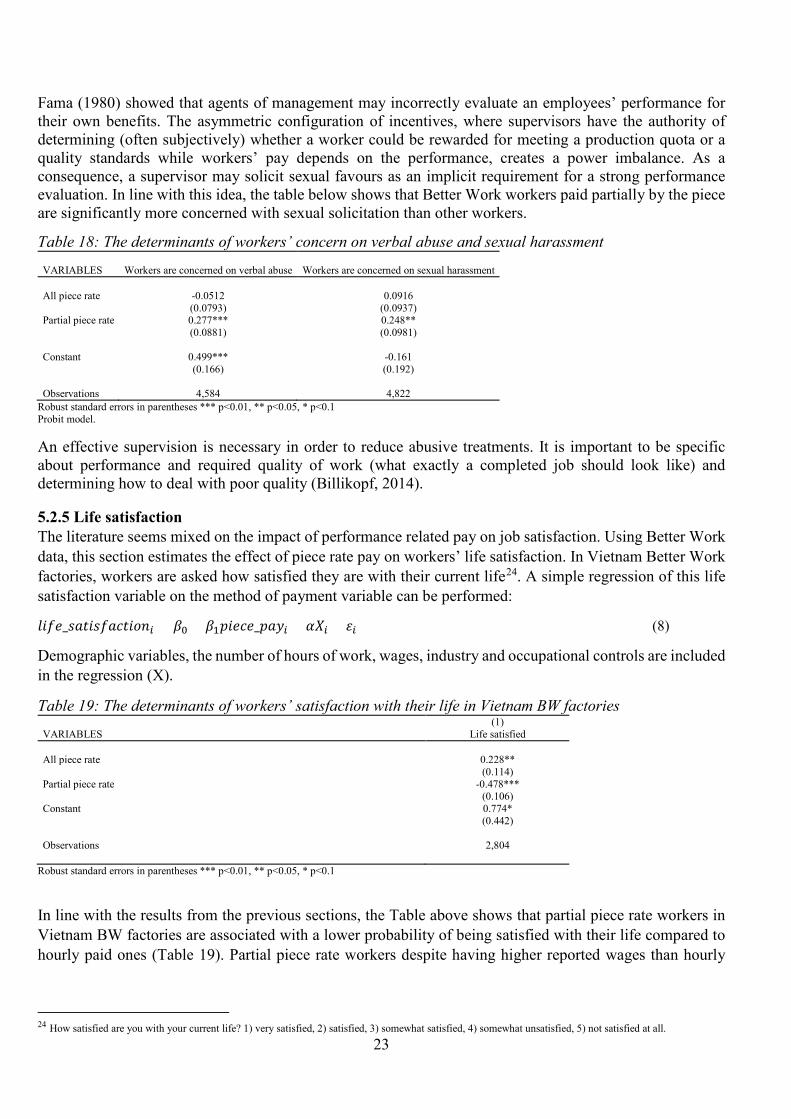
23
Fama (1980) showed that agents of management may incorrectly evaluate an employees’ performance for their own benefits. The asymmetric configuration of incentives, where supervisors have the authority of determining (often subjectively) whether a worker could be rewarded for meeting a production quota or a quality standards while workers’ pay depends on the performance, creates a power imbalance. As a consequence, a supervisor may solicit sexual favours as an implicit requirement for a strong performance evaluation. In line with this idea, the table below shows that Better Work workers paid partially by the piece are significantly more concerned with sexual solicitation than other workers.
Table 18: The determinants of workers’ concern on verbal abuse and sexual harassment VARIABLES Workers are concerned on verbal abuse Workers are concerned on sexual harassment All piece rate -0.0512 0.0916 (0.0793) (0.0937) Partial piece rate 0.277*** 0.248** (0.0881) (0.0981) Constant 0.499*** -0.161 (0.166) (0.192) Observations 4,584 4,822
Robust standard errors in parentheses *** p<0.01, ** p<0.05, * p<0.1 Probit model. An effective supervision is necessary in order to reduce abusive treatments. It is important to be specific about performance and required quality of work (what exactly a completed job should look like) and determining how to deal with poor quality (Billikopf, 2014).
5.2.5 Life satisfaction The literature seems mixed on the impact of performance related pay on job satisfaction. Using Better Work data, this section estimates the effect of piece rate pay on workers’ life satisfaction. In Vietnam Better Work factories, workers are asked how satisfied they are with their current life24. A simple regression of this life satisfaction variable on the method of payment variable can be performed:
𝑓𝑓𝑝𝑝𝑓𝑓𝑝𝑝_𝑠𝑠𝑝𝑝𝑜𝑜𝑝𝑝𝑠𝑠𝑓𝑓𝑝𝑝𝑝𝑝𝑜𝑜𝑝𝑝𝑜𝑜𝑠𝑠𝑖𝑖 = 𝛽𝛽0 + 𝛽𝛽1𝑝𝑝𝑝𝑝𝑝𝑝𝑝𝑝𝑝𝑝_𝑝𝑝𝑝𝑝𝑝𝑝𝑖𝑖 + 𝛼𝛼𝑋𝑋𝑖𝑖 + 𝜀𝜀𝑖𝑖 (8)
Demographic variables, the number of hours of work, wages, industry and occupational controls are included in the regression (X).
Table 19: The determinants of workers’ satisfaction with their life in Vietnam BW factories (1) VARIABLES Life satisfied All piece rate 0.228** (0.114) Partial piece rate -0.478*** (0.106) Constant 0.774* (0.442) Observations 2,804
Robust standard errors in parentheses *** p<0.01, ** p<0.05, * p<0.1
In line with the results from the previous sections, the Table above shows that partial piece rate workers in Vietnam BW factories are associated with a lower probability of being satisfied with their life compared to hourly paid ones (Table 19). Partial piece rate workers despite having higher reported wages than hourly
24 How satisfied are you with your current life? 1) very satisfied, 2) satisfied, 3) somewhat satisfied, 4) somewhat unsatisfied, 5) not satisfied at all.
24
paid workers, report greater concern regarding low wages, poor health, more concern on accidents and injuries in the factory, on abusive treatments and thus a lower life satisfaction.
6 Conclusions
In developing economies, piece rate work is still widespread. Workers relying on piece rate wages often constitute a vulnerable section of workers. A large number of piece rate workers are women and many work in the informal economy. Therefore, our study investigated the impact of piece rate payment on wages and working conditions in the context of garment sector in a set of developing countries. However, in order to provide more robust evidence on the impact of piece rate pay, better data sources are needed. In fact, the majority of the previous studies focused on advanced economies, due to data limitations in developing and emerging economies. Relatively high wages and productivity have been two features associated with pieceworkers in advanced economies however, these features are not necessarily associated with pieceworkers in developing countries as labour markets often work quite differently.
Our findings, based on BW garment factories in Vietnam, Indonesia, Jordan, Haiti and Nicaragua, suggest the effect of piece rate pay depends on the manner in which remuneration is calculated for each piece produced or task completed. Piece rate pay has the potential of being an effective pay method but often it represents a significant risks to employees. The analysis of Better Work garment factories in Vietnam, Indonesia, Jordan indicated that piece rate pay employees has the potential to earn more per hour than hourly paid employees. However, it is important not only to design an effective piece rate system, but also to regularly maintain it. For instance, when hourly paid employees receive a raise in wage, those paid on piece-rate should also receive an increase. One of the main result of this research is that the workers under partial piece rate system appear to be worse off than those working either 100% hourly wages or 100% by the piece. A straight piece rate pay, where there is a direct correspondence between units and pay is simpler, more transparent and more motivating for employees compared to partial piece rate system. Full piece rate pay is also easier to calculate for employers compared to partial piece rate pay. Partial piece rate paid workers are found more concerned about the possibility of low pay, probably due to the lack of clarity of the wage setting. This uncertainty also translates to worsening physical and mental health. To be fair and effective, piece rate systems should be transparent and clear. In this respect, there is an important role for trade unions to play in order to piece-rate pay design to be built under fairness. Involving employees before implementing a piece rate pay system would be beneficial, as their participation can increase transparency, confidence, and fairness. In BW factories, we found that piece rate paid employees work a similar number of hours than others. However, piece rate employment is often more strenuous because individuals work harder when they are motivated, leading possibly to injuries, accidents and health related problems. Thus, it would be useful to establish a maximum number of hours per day during which the piece rate paid work should be performed. Occupational health and safety issues often arise for partial piece rate pay workers. In order to help reduce injuries and accidents, paid breaks are recommended given the strenuous workload of pieceworkers. A possible solution might be for employers to pay these breaks at an hourly wage. Finally, partial piece rate pay workers are found more likely of being subject to abusive treatments such as sexual harassment and verbal abuse. This is due to the fact that supervisors responsible for output reporting may extract some portion of the piece rate incentive from workers. Therefore, an effective supervision is necessary to reduce these abusive treatments.
25
In summary, the extent to which piece rate pay can work as a fair and effective pay system depends on careful piece rate pay design. In order to avoid the decent work deficits related to piece rate pay, the government should intervene. Legislation in a number of countries takes account of the particular situation of workers paid at a piece rate or by the task. The manner in which remuneration is calculated for each piece produced or task completed is of the utmost importance: if the salary is set too low, the workers concerned will work long hours, which is in fact the equivalent of performing unpaid overtime work. In order to avoid such a situation, the legislation of some countries, such as at the provincial level Canada (New Brunswick), the Islamic Republic of Iran, Madagascar, and Morocco, stipulates that pieceworkers’ wages may not be lower than the applicable minimum wage. In other countries, such as India, Pakistan and Sri Lanka, the legislation provides for the possibility of fixing specific minimum wage rates for pieceworkers, while specific minimum wages for these workers in the agricultural sector have been set in at the provincial level Canada (British Columbia). In several French-speaking African countries, notably Côte d’Ivoire and Gabon, the remuneration for a job paid by the task or at a piece rate must be calculated in such a way that it gives a worker with average skills and normal output a salary at least equal to that of workers paid by time performing similar work. In Cambodia, pieceworkers’ wages must be fixed at a level that enables a wage earner with average skills and normal output to receive, for the same length of work, a salary at least equal to the guaranteed minimum wage. Legislation in the United Kingdom refers to the concept of “fair piece rates”, and piece rate pay is only permitted where an employer cannot control a worker’s hours of work, such as in the case of homeworkers (ILO, 2014). In addition, our empirical analysis support that the presence of unions is important for increasing the wage of both piece rate workers and other employees. Thus, a crucial role can be played by collective bargaining in order to set a more appropriate piece rate pay. Future research is needed to explore how to make the piece rate system more equitable in order to prevent some of the negative effects associated with this pay system. Further investigation is needed to determine how workers can play a more active role in setting rates for piece work, including through collective bargaining. An important challenge remains to identify whether there is a modern-day business case to support piece rate pay in developing-world industries such as the garment sector.
26
7 Bibliography
Artz, B., & Heywood, J. S. (2015). Performance pay and workplace injury: panel evidence. Economica, 82(s1), 1241-1260. Belzer MH. (2000) Sweatshops on Wheels: Winners and Losers in Trucking Deregulation, Oxford, UK and New York, NY: Oxford University Press.
Belzer, Michael H. and Sedo, Stanley A., 2017. Why Do Long Distance Truck Drivers Work Extremely Long Hours? Economic and Labour Relations Review. Available at SSRN: https://ssrn.com/abstract=3013200
Bender, Keith A., Green, Colin P., Heywood, John S. 2012. Piece rates and workplace injury: Does survey evidence support Adam Smith? Journal of Population Economics 25(2): 569–90
Bender, K. A., & Theodossiou, I. (2013). The unintended consequences of the rat race: the detrimental effects of performance pay on health. Oxford Economic Papers, 66(3), 824-847. Berg J., 2016. Income security in the on-demand economy: findings and policy lessons from a survey of crowdworkers. International Labour Office, Inclusive Labour Markets, Labour Relations and Working Conditions Branch. - Geneva: ILO, 2016 (Conditions of work and employment series ; No. 74) Better Work 2015 Vietnam: garment industry 8th compliance synthesis report / International Labour Office; International Finance Corporation. - Geneva: ILO, 2015
Billikopf, G.E., 2014. Labor management in agriculture: Cultivating personnel productivity. University of California, Division of Agriculture and Natural Resources, Agricultural Issues Center. Brown, C. (1990). Firms' choice of method of pay. ILR Review, 43(3), 165-S.
Chandararot, K. and Dannet, L. (2009). Study on minimum wage for Cambodia’s garment industry. Cambodia Institute of Development Study. Cambodia Institute of Development Study (CIDS), p. 6.
Davis, M. E. (2016). Pay Matters: The Piece Rate and Health in the Developing World. Annals of Global Health, 82(5), 858-865. De la Rica, S., Dolado, J.J. and Vegas, R., 2010. Performance pay and the gender wage gap: evidence from Spain. Dembe, A. E., Erickson, J. B., Delbos, R. G., & Banks, S. M. (2005). The impact of overtime and long work hours on occupational injuries and illnesses: new evidence from the United States. Occupational and environmental medicine, 62(9), 588-597. Edwards, R.C., 1979. Contested Terrain: The Transformation of the Workplace in America. New York: Basic. Ewing, B. T. (1996). Wages and performance-based pay: Evidence from the NLSY. Economics letters, 51(2), 241-246. Fama, E.F., 1980. Agency problems and the theory of the firm. Journal of political economy, 88(2), pp.288-307.
27
Foster, Andrew D. and Mark R. Rosenzweig. 1994. “A Test for Moral Hazard in the Labor Market: Contractual Arrangements, Effort, and Health,” Review of Economics and Statistics 74: 213-27.
Geddes, L.A. and Heywood, J.S., 2003. Gender and piece rates, commissions, and bonuses. Industrial Relations: A Journal of Economy and Society, 42(3), pp.419-444. Green, C., & Heywood, J. S. (2008). Does performance pay increase job satisfaction?. Economica, 75(300), 710-728. Hart, R.A., 2016. The rise and fall of piecework. IZA World of Labor. Harvard Case Study. 1983. “Lincoln Electric Company.” Boston, MA: Harvard Business School. Helper, S., Kleiner, M.M. and Wang, Y., 2010. Analyzing compensation methods in manufacturing: piece rates, time rates, or gain-sharing? (No. w16540). National Bureau of Economic Research. Heywood, J.S. and Wei, X., 1997. Piece-rate payment schemes and the employment of women: the case of Hong Kong. Journal of Comparative Economics, 25(2), pp.237-255. Heywood, J. S. and Wei, X. (2006). Performance pay and job satisfaction. Journal of Industrial Relations, 48, 523–40. Heywood, J.S. and O’Halloran, P.L., 2005. Racial earnings differentials and performance pay. Journal of Human Resources, 40(2), pp.435-452. Heywood, J. S., and D. Parent. "Performance Pay, the Gender Gap, and Specialization within Marriage." Journal of Labor Research 38.4 (2017): 387-427. Heywood, J.S. and Jirjahn, U., 2002. Payment schemes and gender in Germany. ILR Review, 56(1), pp.44-64. ILO (2014), Minimum wage systems, International Labour Conference Session, 103rd Session, 2014, International Labour Organization, available at: http://www.ilo.org/wcmsp5/groups/public/---ed_norm/---relconf/documents/meetingdocument/wcms_235287.pdf ILO (2014 b) Wages and Working Hours in the Textiles, Clothing, Leather and Footwear Industries: Issues Paper for Discussion at the Global Dialogue Forum on Wages and Working Hours in the Textiles, Clothing, Leather and Footwear Industries (Geneva, 23-25 September 2014) available at: http://www.ilo.org/wcmsp5/groups/public/@ed_dialogue/@sector/documents/publication/wcms_300463.pdf ILO Minimum wage policy guide, available at: http://www.ilo.org/minimumwage ILO (20148) Women and men in the informal economy: a statistical picture (third edition) / International Labour Office – Geneva Jirjahn, U. and G. Stephan: 2004, ‘Gender, Piece Rates and Wages: Evidence from Matched Employer–Employee Data’, Cambridge Journal of Economics 28(5), 683–704.
28
Jirjahn, U. and G. Stephan: 2006, ‘Gender and Wages in Germany: The Impact of Product Market Competition and Collective Bargaining’, in J. S. Heywood and J. H. Peoples (eds.), Product Market Structure and Labor Market Discrimination (State University of New York Press, Albany, NY), pp. 59–80 Kangasniemi, M., & Kauhanen, A. (2013). Performance-related pay and gender wage differences. Applied Economics, 45(36), 5131-5143. Lazear, E. P. (2000). Performance pay and productivity. American Economic Review, 90(5), 1346-1361. Lee, S., McCann, D. and Messenger, J.C., 2007. Working Time Around the World: Trends in working hours, laws, and policies in a global comparative perspective (London and Geneva, Routledge and ILO). Lin X, Babbitt L, and D Brown. 2014. Sexual Harassment in the Workplace: How Does It Affect Firm Performance and Profits. Better Work Discussion Paper Series: No. 16. International Labour Office, Geneva. McCausland, W., Pouliakas, K. and Theodossiou, I. (2005). Some are punished and some are rewarded: a study of the impact of performance pay on job satisfaction. International Journal of Manpower, 26, 636–59. Parent, D. (1999). Methods of pay and earnings: A longitudinal analysis. ILR Review, 53(1), 71-86. Pekkarinen, T., & Riddell, C. (2008). Performance pay and earnings: Evidence from personnel records. ILR Review, 61(3), 297-319.
Rourke E., 2014. Is there a business case against verbal abuse? Incentive structure, verbal abuse, productivity and profits in garment factories. Better Work Discussion Paper Series 2014; Discussion Paper 15. Available at: http://betterwork.org/global/wp- content/uploads/2014/09/DP-15-web. pdf.
Rubin, D. K., & Perloff, J. M. (1993). Who works for piece rates and why. American Journal of Agricultural Economics, 75(4), 1036-1043. Saha, Asim, Takir, Ramnath, Chaudhuri, Ramendra, Saiyed, Habibullah. 2004. An accident-risk assessment study of temporary piece rated workers. Industrial Health42(3): 240–45. Sankaran K., (2015) Piece Rated Minimum Wages, ILO Seiler, E. (1984). Piece rates vs. time rates: The effect of incentives on wages. Review of Economics and Statistics46(3): 363–76. Smith, Adam. 1776. An Inquiry into the Nature and Causes of the Wealth of Nations. As reprinted in 1909, Bullock, CJ (Ed.). New York: PF Collier & Son. Stanfors, M., Leunig, T., Eriksson, B., & Karlsson, T. (2014). Gender, productivity, and the nature of work and pay: evidence from the late nineteenth‐century tobacco industry. The Economic History Review, 67(1), 48-65. Truskinovsky Y., Rubin J., Brown D. (2014). Sexual Harassment in Garment Factories: Firm Structure, Organizational Culture and Incentive Systems. Better Work Discussion Paper Series 2014; Discussion Paper 14. Available at: https://betterwork.org/blog/portfolio/sexual-harassment-in-garment-factories-firm-structure-organizational-culture-and-incentive-systems/
29
Tunisia - Labor Market Panel Survey, TLMPS 2014. OAMDI, 2016. Labor Market Panel Surveys (LMPS), http://erf.org.eg/data-portal/. Version 2.0 of Licensed Data Files; TLMPS 2014. Egypt: Economic Research Forum (ERF).
Vaughan-Whitehead (2011). How “fair” are wage practices along the supply chain? Global Assessment in 2010–11, working paper for ILO/IFC Better Work Conference.
Vinet, A., Vézina, M., Brisson, C., & Bernard, P. M. (1989). Piecework, repetitive work and medicine use in the clothing industry. Social science & medicine, 28(12), 1283-1288. Wang, P. C., Ritz, B., Rempel, D., Harrison, R., Chan, J., & Janowitz, I. (2005). Work organization and work-related musculoskeletal disorders for sewing machine operators in garment industry. Annals of epidemiology, 15(8), 655. Williamson, A., Feyer, A., Friswell, R. and Saduri, S. (2000), Driver fatigue: A survey of professional heavy drivers in Australia, draft of report prepared for the National Road Transport Commission. Women in Informal Employment: Globalising and Organising (WIEGO), “Garment workers” available at: http://www.wiego.org/informal-economy/occupational-groups/garment-workers
Worker Rights Consortium, 2013. Stealing from the poor: Wage theft in the Haitian apparel industry.
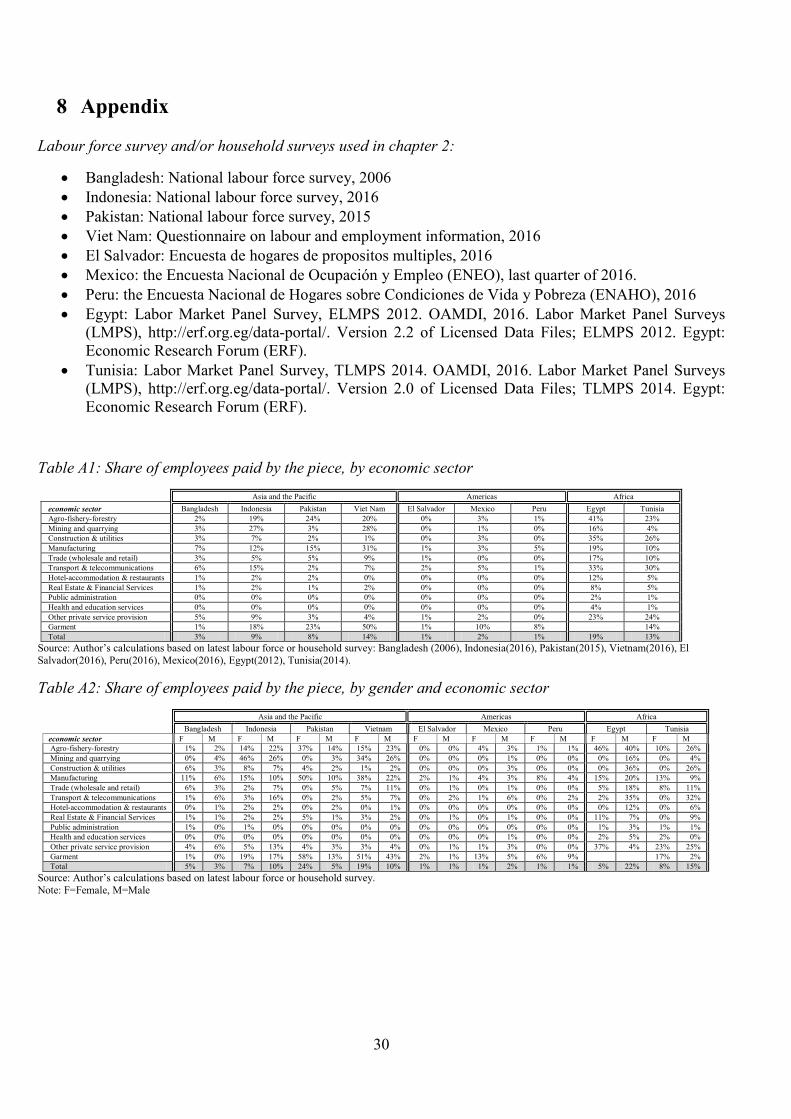
30
8 Appendix
Labour force survey and/or household surveys used in chapter 2:
• Bangladesh: National labour force survey, 2006 • Indonesia: National labour force survey, 2016 • Pakistan: National labour force survey, 2015 • Viet Nam: Questionnaire on labour and employment information, 2016 • El Salvador: Encuesta de hogares de propositos multiples, 2016 • Mexico: the Encuesta Nacional de Ocupación y Empleo (ENEO), last quarter of 2016. • Peru: the Encuesta Nacional de Hogares sobre Condiciones de Vida y Pobreza (ENAHO), 2016 • Egypt: Labor Market Panel Survey, ELMPS 2012. OAMDI, 2016. Labor Market Panel Surveys
(LMPS), http://erf.org.eg/data-portal/. Version 2.2 of Licensed Data Files; ELMPS 2012. Egypt: Economic Research Forum (ERF).
• Tunisia: Labor Market Panel Survey, TLMPS 2014. OAMDI, 2016. Labor Market Panel Surveys (LMPS), http://erf.org.eg/data-portal/. Version 2.0 of Licensed Data Files; TLMPS 2014. Egypt: Economic Research Forum (ERF).
Table A1: Share of employees paid by the piece, by economic sector Asia and the Pacific Americas Africa economic sector Bangladesh Indonesia Pakistan Viet Nam El Salvador Mexico Peru Egypt Tunisia Agro-fishery-forestry 2% 19% 24% 20% 0% 3% 1% 41% 23% Mining and quarrying 3% 27% 3% 28% 0% 1% 0% 16% 4% Construction & utilities 3% 7% 2% 1% 0% 3% 0% 35% 26% Manufacturing 7% 12% 15% 31% 1% 3% 5% 19% 10% Trade (wholesale and retail) 3% 5% 5% 9% 1% 0% 0% 17% 10% Transport & telecommunications 6% 15% 2% 7% 2% 5% 1% 33% 30% Hotel-accommodation & restaurants 1% 2% 2% 0% 0% 0% 0% 12% 5% Real Estate & Financial Services 1% 2% 1% 2% 0% 0% 0% 8% 5% Public administration 0% 0% 0% 0% 0% 0% 0% 2% 1% Health and education services 0% 0% 0% 0% 0% 0% 0% 4% 1% Other private service provision 5% 9% 3% 4% 1% 2% 0% 23% 24% Garment 1% 18% 23% 50% 1% 10% 8% 14% Total 3% 9% 8% 14% 1% 2% 1% 19% 13%
Source: Author’s calculations based on latest labour force or household survey: Bangladesh (2006), Indonesia(2016), Pakistan(2015), Vietnam(2016), El Salvador(2016), Peru(2016), Mexico(2016), Egypt(2012), Tunisia(2014). Table A2: Share of employees paid by the piece, by gender and economic sector
Asia and the Pacific Americas Africa Bangladesh Indonesia Pakistan Vietnam El Salvador Mexico Peru Egypt Tunisia economic sector F M F M F M F M F M F M F M F M F M Agro-fishery-forestry 1% 2% 14% 22% 37% 14% 15% 23% 0% 0% 4% 3% 1% 1% 46% 40% 10% 26% Mining and quarrying 0% 4% 46% 26% 0% 3% 34% 26% 0% 0% 0% 1% 0% 0% 0% 16% 0% 4% Construction & utilities 6% 3% 8% 7% 4% 2% 1% 2% 0% 0% 0% 3% 0% 0% 0% 36% 0% 26% Manufacturing 11% 6% 15% 10% 50% 10% 38% 22% 2% 1% 4% 3% 8% 4% 15% 20% 13% 9% Trade (wholesale and retail) 6% 3% 2% 7% 0% 5% 7% 11% 0% 1% 0% 1% 0% 0% 5% 18% 8% 11% Transport & telecommunications 1% 6% 3% 16% 0% 2% 5% 7% 0% 2% 1% 6% 0% 2% 2% 35% 0% 32% Hotel-accommodation & restaurants 0% 1% 2% 2% 0% 2% 0% 1% 0% 0% 0% 0% 0% 0% 0% 12% 0% 6% Real Estate & Financial Services 1% 1% 2% 2% 5% 1% 3% 2% 0% 1% 0% 1% 0% 0% 11% 7% 0% 9% Public administration 1% 0% 1% 0% 0% 0% 0% 0% 0% 0% 0% 0% 0% 0% 1% 3% 1% 1% Health and education services 0% 0% 0% 0% 0% 0% 0% 0% 0% 0% 0% 1% 0% 0% 2% 5% 2% 0% Other private service provision 4% 6% 5% 13% 4% 3% 3% 4% 0% 1% 1% 3% 0% 0% 37% 4% 23% 25% Garment 1% 0% 19% 17% 58% 13% 51% 43% 2% 1% 13% 5% 6% 9% 17% 2% Total 5% 3% 7% 10% 24% 5% 19% 10% 1% 1% 1% 2% 1% 1% 5% 22% 8% 15%
Source: Author’s calculations based on latest labour force or household survey. Note: F=Female, M=Male
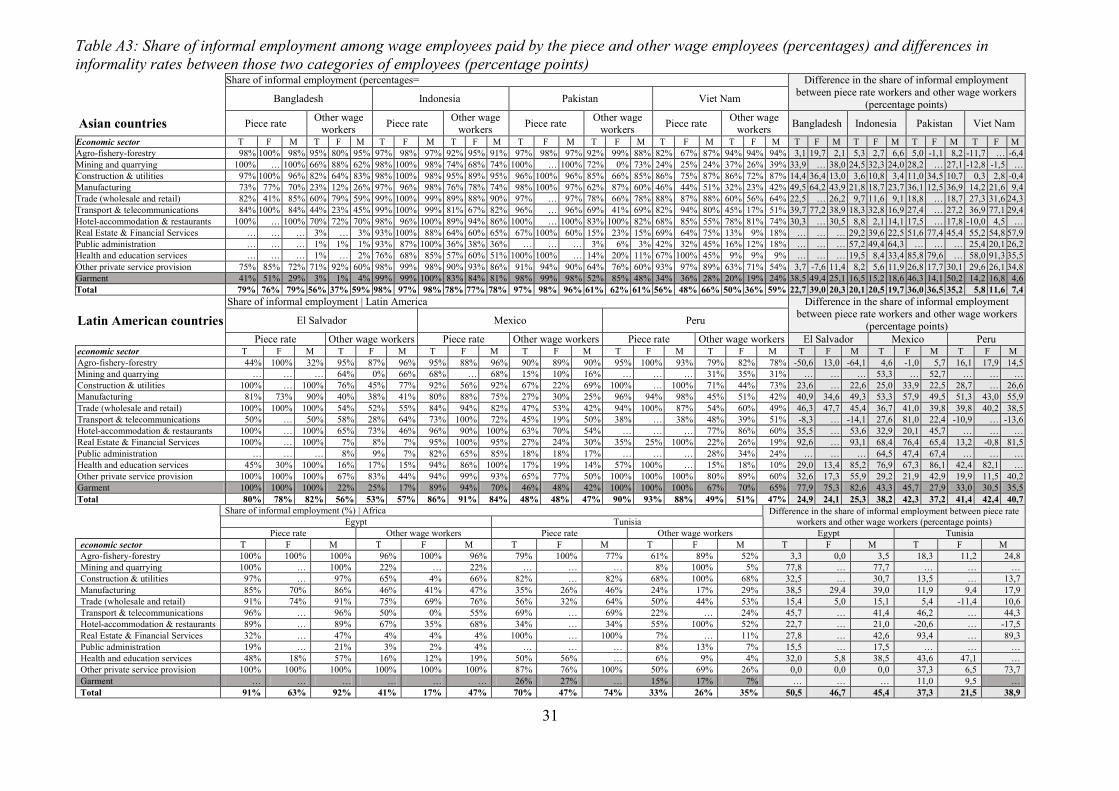
31
Table A3: Share of informal employment among wage employees paid by the piece and other wage employees (percentages) and differences in informality rates between those two categories of employees (percentage points) Share of informal employment (percentages= Difference in the share of informal employment
between piece rate workers and other wage workers (percentage points) Bangladesh Indonesia Pakistan Viet Nam
Asian countries Piece rate Other wage workers Piece rate Other wage
workers Piece rate Other wage workers Piece rate Other wage
workers Bangladesh Indonesia Pakistan Viet Nam
Economic sector T F M T F M T F M T F M T F M T F M T F M T F M T F M T F M T F M T F M Agro-fishery-forestry 98% 100% 98% 95% 80% 95% 97% 98% 97% 92% 95% 91% 97% 98% 97% 92% 99% 88% 82% 67% 87% 94% 94% 94% 3,1 19,7 2,1 5,3 2,7 6,6 5,0 -1,1 8,2 -11,7 … -6,4 Mining and quarrying 100% … 100% 66% 88% 62% 98% 100% 98% 74% 68% 74% 100% … 100% 72% 0% 73% 24% 25% 24% 37% 26% 39% 33,9 … 38,0 24,5 32,3 24,0 28,2 … 27,1 -12,8 -1,5 … Construction & utilities 97% 100% 96% 82% 64% 83% 98% 100% 98% 95% 89% 95% 96% 100% 96% 85% 66% 85% 86% 75% 87% 86% 72% 87% 14,4 36,4 13,0 3,6 10,8 3,4 11,0 34,5 10,7 0,3 2,8 -0,4 Manufacturing 73% 77% 70% 23% 12% 26% 97% 96% 98% 76% 78% 74% 98% 100% 97% 62% 87% 60% 46% 44% 51% 32% 23% 42% 49,5 64,2 43,9 21,8 18,7 23,7 36,1 12,5 36,9 14,2 21,6 9,4 Trade (wholesale and retail) 82% 41% 85% 60% 79% 59% 99% 100% 99% 89% 88% 90% 97% … 97% 78% 66% 78% 88% 87% 88% 60% 56% 64% 22,5 … 26,2 9,7 11,6 9,1 18,8 … 18,7 27,3 31,6 24,3 Transport & telecommunications 84% 100% 84% 44% 23% 45% 99% 100% 99% 81% 67% 82% 96% … 96% 69% 41% 69% 82% 94% 80% 45% 17% 51% 39,7 77,2 38,9 18,3 32,8 16,9 27,4 … 27,2 36,9 77,1 29,4 Hotel-accommodation & restaurants 100% … 100% 70% 72% 70% 98% 96% 100% 89% 94% 86% 100% … 100% 83% 100% 82% 68% 85% 55% 78% 81% 74% 30,3 … 30,5 8,8 2,1 14,1 17,5 … 17,8 -10,0 4,5 … Real Estate & Financial Services … … … 3% … 3% 93% 100% 88% 64% 60% 65% 67% 100% 60% 15% 23% 15% 69% 64% 75% 13% 9% 18% … … … 29,2 39,6 22,5 51,6 77,4 45,4 55,2 54,8 57,9 Public administration … … … 1% 1% 1% 93% 87% 100% 36% 38% 36% … … … 3% 6% 3% 42% 32% 45% 16% 12% 18% … … … 57,2 49,4 64,3 … … … 25,4 20,1 26,2 Health and education services … … … 1% … 2% 76% 68% 85% 57% 60% 51% 100% 100% … 14% 20% 11% 67% 100% 45% 9% 9% 9% … … … 19,5 8,4 33,4 85,8 79,6 … 58,0 91,3 35,5 Other private service provision 75% 85% 72% 71% 92% 60% 98% 99% 98% 90% 93% 86% 91% 94% 90% 64% 76% 60% 93% 97% 89% 63% 71% 54% 3,7 -7,6 11,4 8,2 5,6 11,9 26,8 17,7 30,1 29,6 26,1 34,8 Garment 41% 51% 29% 3% 1% 4% 99% 99% 100% 83% 84% 81% 98% 99% 98% 52% 85% 48% 34% 36% 28% 20% 19% 24% 38,5 49,4 25,1 16,5 15,2 18,6 46,3 14,1 50,2 14,2 16,8 4,6 Total 79% 76% 79% 56% 37% 59% 98% 97% 98% 78% 77% 78% 97% 98% 96% 61% 62% 61% 56% 48% 66% 50% 36% 59% 22,7 39,0 20,3 20,1 20,5 19,7 36,0 36,5 35,2 5,8 11,6 7,4 Share of informal employment | Latin America Difference in the share of informal employment
between piece rate workers and other wage workers (percentage points) Latin American countries El Salvador Mexico Peru
Piece rate Other wage workers Piece rate Other wage workers Piece rate Other wage workers El Salvador Mexico Peru economic sector T F M T F M T F M T F M T F M T F M T F M T F M T F M Agro-fishery-forestry 44% 100% 32% 95% 87% 96% 95% 88% 96% 90% 89% 90% 95% 100% 93% 79% 82% 78% -50,6 13,0 -64,1 4,6 -1,0 5,7 16,1 17,9 14,5 Mining and quarrying … … … 64% 0% 66% 68% … 68% 15% 10% 16% … … … 31% 35% 31% … … … 53,3 … 52,7 … … … Construction & utilities 100% … 100% 76% 45% 77% 92% 56% 92% 67% 22% 69% 100% … 100% 71% 44% 73% 23,6 … 22,6 25,0 33,9 22,5 28,7 … 26,6 Manufacturing 81% 73% 90% 40% 38% 41% 80% 88% 75% 27% 30% 25% 96% 94% 98% 45% 51% 42% 40,9 34,6 49,3 53,3 57,9 49,5 51,3 43,0 55,9 Trade (wholesale and retail) 100% 100% 100% 54% 52% 55% 84% 94% 82% 47% 53% 42% 94% 100% 87% 54% 60% 49% 46,3 47,7 45,4 36,7 41,0 39,8 39,8 40,2 38,5 Transport & telecommunications 50% … 50% 58% 28% 64% 73% 100% 72% 45% 19% 50% 38% … 38% 48% 39% 51% -8,3 … -14,1 27,6 81,0 22,4 -10,9 … -13,6 Hotel-accommodation & restaurants 100% … 100% 65% 73% 46% 96% 90% 100% 63% 70% 54% … … … 77% 86% 60% 35,5 … 53,6 32,9 20,1 45,7 … … … Real Estate & Financial Services 100% … 100% 7% 8% 7% 95% 100% 95% 27% 24% 30% 35% 25% 100% 22% 26% 19% 92,6 … 93,1 68,4 76,4 65,4 13,2 -0,8 81,5 Public administration … … … 8% 9% 7% 82% 65% 85% 18% 18% 17% … … … 28% 34% 24% … … … 64,5 47,4 67,4 … … … Health and education services 45% 30% 100% 16% 17% 15% 94% 86% 100% 17% 19% 14% 57% 100% … 15% 18% 10% 29,0 13,4 85,2 76,9 67,3 86,1 42,4 82,1 … Other private service provision 100% 100% 100% 67% 83% 44% 94% 99% 93% 65% 77% 50% 100% 100% 100% 80% 89% 60% 32,6 17,3 55,9 29,2 21,9 42,9 19,9 11,5 40,2 Garment 100% 100% 100% 22% 25% 17% 89% 94% 70% 46% 48% 42% 100% 100% 100% 67% 70% 65% 77,9 75,3 82,6 43,3 45,7 27,9 33,0 30,5 35,5 Total 80% 78% 82% 56% 53% 57% 86% 91% 84% 48% 48% 47% 90% 93% 88% 49% 51% 47% 24,9 24,1 25,3 38,2 42,3 37,2 41,4 42,4 40,7 Share of informal employment (%) | Africa Difference in the share of informal employment between piece rate
workers and other wage workers (percentage points) Egypt Tunisia Piece rate Other wage workers Piece rate Other wage workers Egypt Tunisia economic sector T F M T F M T F M T F M T F M T F M Agro-fishery-forestry 100% 100% 100% 96% 100% 96% 79% 100% 77% 61% 89% 52% 3,3 0,0 3,5 18,3 11,2 24,8 Mining and quarrying 100% … 100% 22% … 22% … … … 8% 100% 5% 77,8 … 77,7 … … … Construction & utilities 97% … 97% 65% 4% 66% 82% … 82% 68% 100% 68% 32,5 … 30,7 13,5 … 13,7 Manufacturing 85% 70% 86% 46% 41% 47% 35% 26% 46% 24% 17% 29% 38,5 29,4 39,0 11,9 9,4 17,9 Trade (wholesale and retail) 91% 74% 91% 75% 69% 76% 56% 32% 64% 50% 44% 53% 15,4 5,0 15,1 5,4 -11,4 10,6 Transport & telecommunications 96% … 96% 50% 0% 55% 69% … 69% 22% … 24% 45,7 … 41,4 46,2 … 44,3 Hotel-accommodation & restaurants 89% … 89% 67% 35% 68% 34% … 34% 55% 100% 52% 22,7 … 21,0 -20,6 … -17,5 Real Estate & Financial Services 32% … 47% 4% 4% 4% 100% … 100% 7% … 11% 27,8 … 42,6 93,4 … 89,3 Public administration 19% … 21% 3% 2% 4% … … … 8% 13% 7% 15,5 … 17,5 … … … Health and education services 48% 18% 57% 16% 12% 19% 50% 56% … 6% 9% 4% 32,0 5,8 38,5 43,6 47,1 … Other private service provision 100% 100% 100% 100% 100% 100% 87% 76% 100% 50% 69% 26% 0,0 0,0 0,0 37,3 6,5 73,7 Garment … … … … … … 26% 27% … 15% 17% 7% … … … 11,0 9,5 … Total 91% 63% 92% 41% 17% 47% 70% 47% 74% 33% 26% 35% 50,5 46,7 45,4 37,3 21,5 38,9
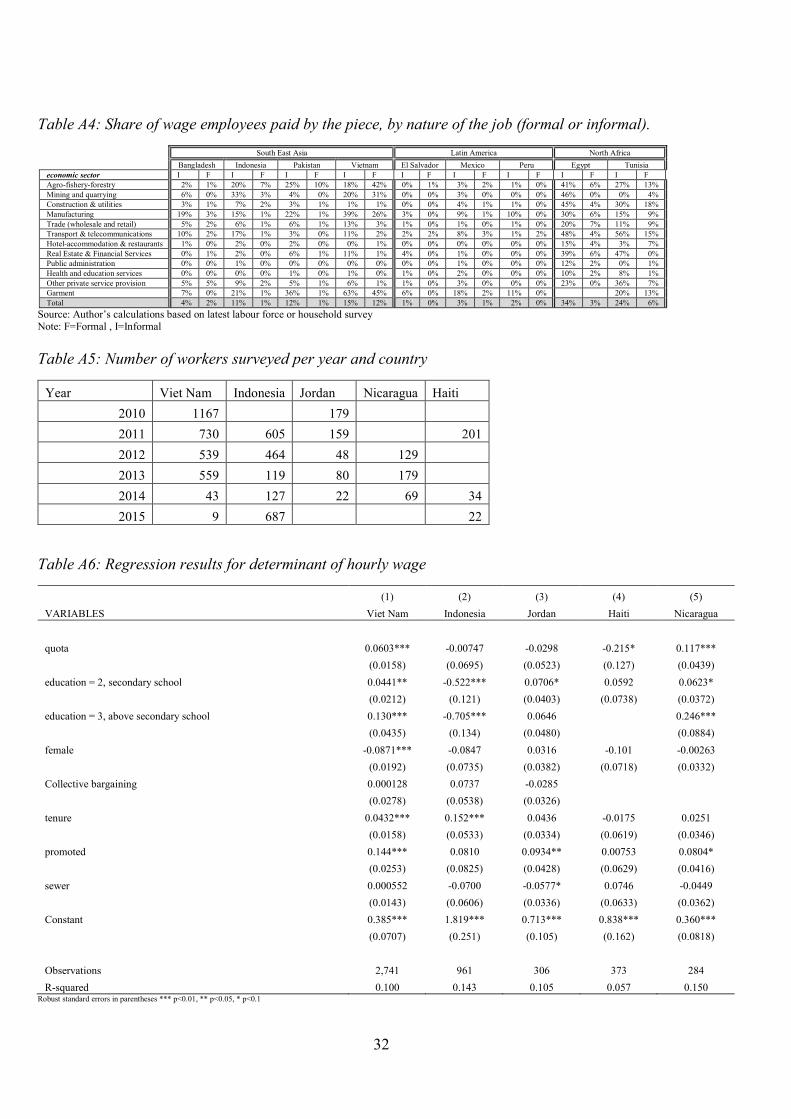
32
Table A4: Share of wage employees paid by the piece, by nature of the job (formal or informal). South East Asia Latin America North Africa Bangladesh Indonesia Pakistan Vietnam El Salvador Mexico Peru Egypt Tunisia economic sector I F I F I F I F I F I F I F I F I F Agro-fishery-forestry 2% 1% 20% 7% 25% 10% 18% 42% 0% 1% 3% 2% 1% 0% 41% 6% 27% 13% Mining and quarrying 6% 0% 33% 3% 4% 0% 20% 31% 0% 0% 3% 0% 0% 0% 46% 0% 0% 4% Construction & utilities 3% 1% 7% 2% 3% 1% 1% 1% 0% 0% 4% 1% 1% 0% 45% 4% 30% 18% Manufacturing 19% 3% 15% 1% 22% 1% 39% 26% 3% 0% 9% 1% 10% 0% 30% 6% 15% 9% Trade (wholesale and retail) 5% 2% 6% 1% 6% 1% 13% 3% 1% 0% 1% 0% 1% 0% 20% 7% 11% 9% Transport & telecommunications 10% 2% 17% 1% 3% 0% 11% 2% 2% 2% 8% 3% 1% 2% 48% 4% 56% 15% Hotel-accommodation & restaurants 1% 0% 2% 0% 2% 0% 0% 1% 0% 0% 0% 0% 0% 0% 15% 4% 3% 7% Real Estate & Financial Services 0% 1% 2% 0% 6% 1% 11% 1% 4% 0% 1% 0% 0% 0% 39% 6% 47% 0% Public administration 0% 0% 1% 0% 0% 0% 0% 0% 0% 0% 1% 0% 0% 0% 12% 2% 0% 1% Health and education services 0% 0% 0% 0% 1% 0% 1% 0% 1% 0% 2% 0% 0% 0% 10% 2% 8% 1% Other private service provision 5% 5% 9% 2% 5% 1% 6% 1% 1% 0% 3% 0% 0% 0% 23% 0% 36% 7% Garment 7% 0% 21% 1% 36% 1% 63% 45% 6% 0% 18% 2% 11% 0% 20% 13% Total 4% 2% 11% 1% 12% 1% 15% 12% 1% 0% 3% 1% 2% 0% 34% 3% 24% 6%
Source: Author’s calculations based on latest labour force or household survey Note: F=Formal , I=Informal
Table A5: Number of workers surveyed per year and country
Year Viet Nam Indonesia Jordan Nicaragua Haiti 2010 1167 179 2011 730 605 159 201 2012 539 464 48 129 2013 559 119 80 179 2014 43 127 22 69 34 2015 9 687 22
Table A6: Regression results for determinant of hourly wage
(1) (2) (3) (4) (5) VARIABLES Viet Nam Indonesia Jordan Haiti Nicaragua
quota 0.0603*** -0.00747 -0.0298 -0.215* 0.117***
(0.0158) (0.0695) (0.0523) (0.127) (0.0439) education = 2, secondary school 0.0441** -0.522*** 0.0706* 0.0592 0.0623*
(0.0212) (0.121) (0.0403) (0.0738) (0.0372) education = 3, above secondary school 0.130*** -0.705*** 0.0646 0.246***
(0.0435) (0.134) (0.0480) (0.0884) female -0.0871*** -0.0847 0.0316 -0.101 -0.00263
(0.0192) (0.0735) (0.0382) (0.0718) (0.0332) Collective bargaining 0.000128 0.0737 -0.0285
(0.0278) (0.0538) (0.0326) tenure 0.0432*** 0.152*** 0.0436 -0.0175 0.0251
(0.0158) (0.0533) (0.0334) (0.0619) (0.0346) promoted 0.144*** 0.0810 0.0934** 0.00753 0.0804*
(0.0253) (0.0825) (0.0428) (0.0629) (0.0416) sewer 0.000552 -0.0700 -0.0577* 0.0746 -0.0449
(0.0143) (0.0606) (0.0336) (0.0633) (0.0362) Constant 0.385*** 1.819*** 0.713*** 0.838*** 0.360***
(0.0707) (0.251) (0.105) (0.162) (0.0818)
Observations 2,741 961 306 373 284 R-squared 0.100 0.143 0.105 0.057 0.150
Robust standard errors in parentheses *** p<0.01, ** p<0.05, * p<0.1
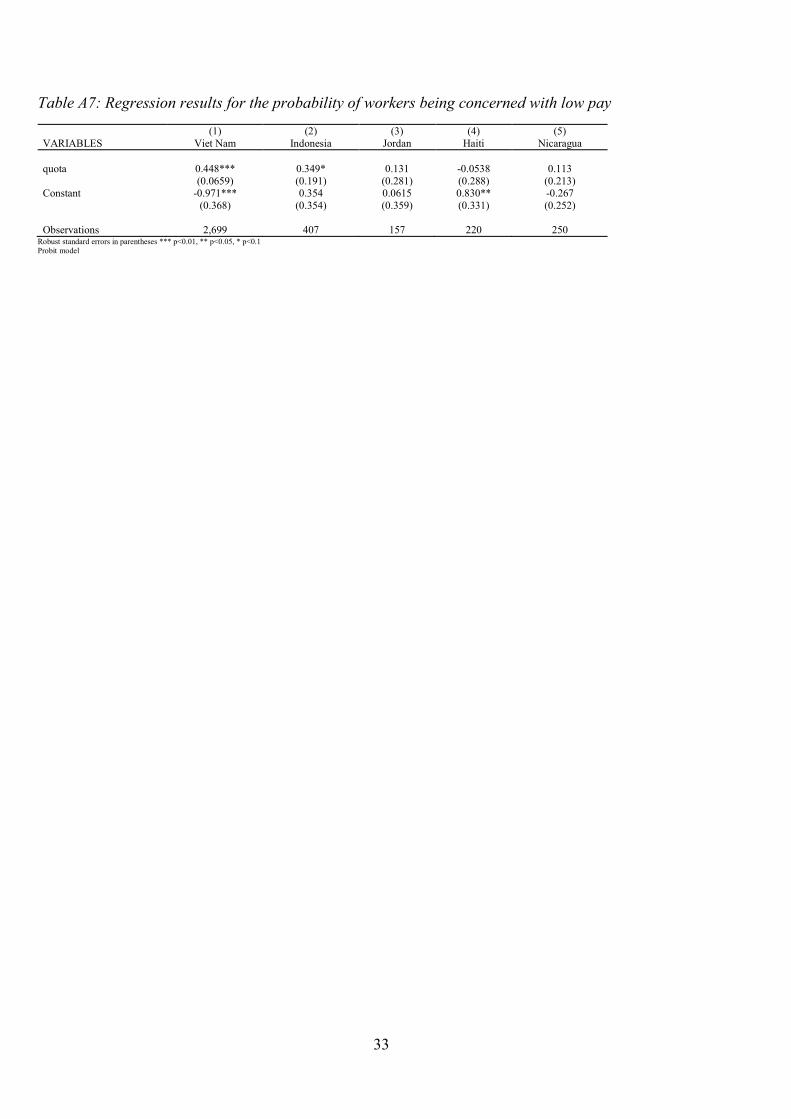
33
Table A7: Regression results for the probability of workers being concerned with low pay
(1) (2) (3) (4) (5) VARIABLES Viet Nam Indonesia Jordan Haiti Nicaragua quota 0.448*** 0.349* 0.131 -0.0538 0.113 (0.0659) (0.191) (0.281) (0.288) (0.213) Constant -0.971*** 0.354 0.0615 0.830** -0.267 (0.368) (0.354) (0.359) (0.331) (0.252) Observations 2,699 407 157 220 250
Robust standard errors in parentheses *** p<0.01, ** p<0.05, * p<0.1 Probit model

THE BETTER WORK GLOBAL PROGRAMME IS SUPPORTED BY PARTICIPATING BRANDS AND
FACTORIES, AND THE FOLLOWING KEY DONOR PARTNERS (IN ALPHABETICAL ORDER):
Australia (Department of Foreign Affairs and Trade, DFAT)
Denmark (Ministry of Foreign Affairs, Danida)
Germany (Federal Ministry for Economic Cooperation and Development, BMZ)
Netherlands (Ministry of Foreign Affairs, MFA)
Switzerland (State Secretariat for Economic Affairs, SECO)
United States (US Department of Labor, USDOL)
Support for this publication was also provided within the framework of the programme Labour Standards in Global Supply Chains financed by the Government of the Federal Republic of Germany. The programme was initiated as part of a renewed partnership between the German Ministry for Development Cooperation (BMZ) and the International Labour Organization (ILO). The responsibility for opinions expressed in this publication rests solely with its author(s), and its publication does not constitute an endorsement by the ILO or the Govern¬ment of the Federal Republic of Germany of the opinions expressed in it.
The Better Work Discussion Paper Series is an original, peer-reviewed series that presents rigorous, work-in-progress research material for comment and feedback. It is addressed to researchers, policymakers and development practitioners to generate comments and encourage discussion.