Upload chickendipper
View 75
Download 0
Embed Size (px) 344 x 292 429 x 357 514 x 422 599 x 487
Citation preview
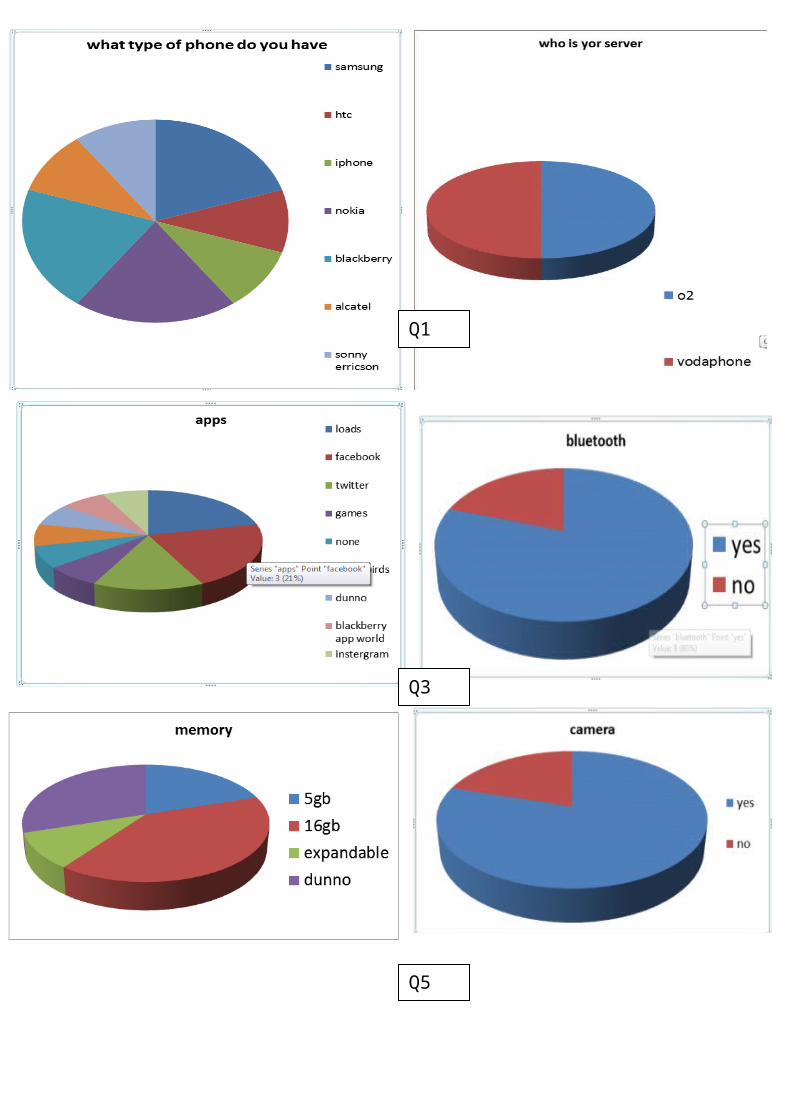
Q1 Q2
Q3 Q4
Q5 Q6
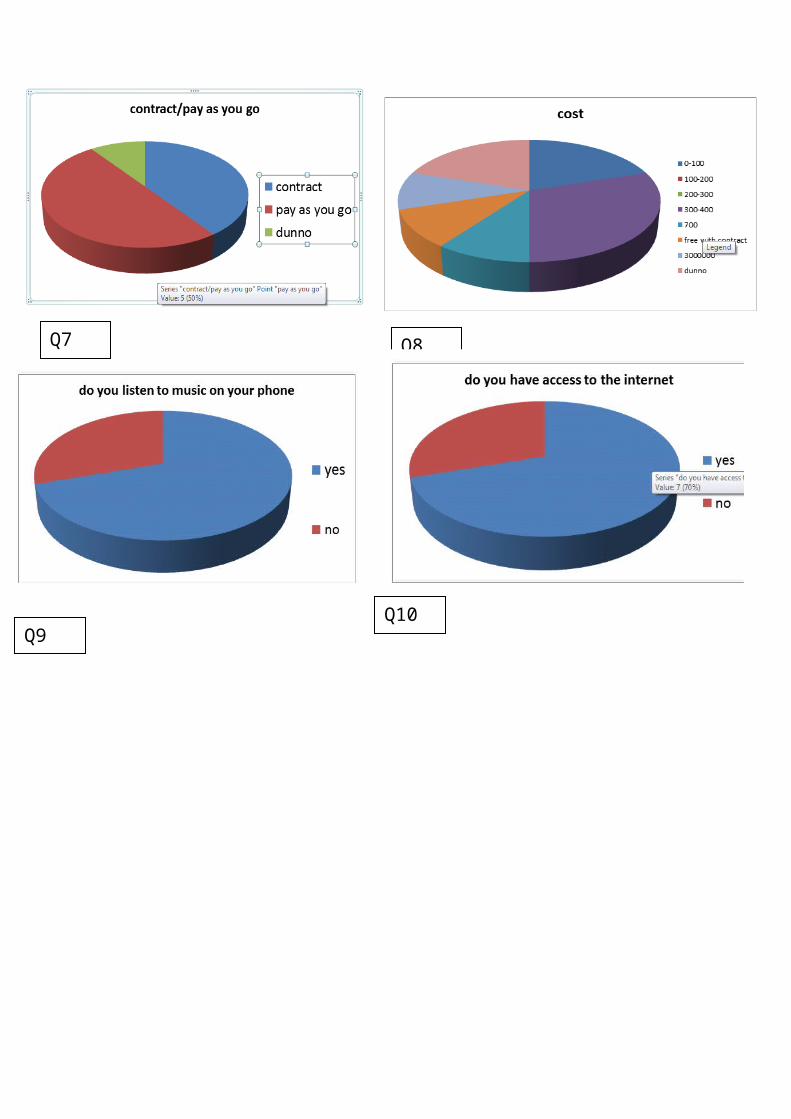
Q7 Q8
Q9Q10
Equivalent Fractions and Pie Charts
Choosing charts for data visualization€¦ · Pie charts and doughnut charts What they are. Pie charts are circles divided into wedges. Doughnut charts are wheels divided into sections
Reading Pie Charts - Corbettmaths · PDF fileReading Pie Charts Video 135 on Question 7: The pie chart below show the holiday destinations of 270 people. The pie chart is drawn
Questionare responce pie charts
MODULE 05 Graphs Pie Charts Component Band Charts…biostatcourse.fiu.edu/PDFSlides/Module5.pdf · 5 - 1 Module 4: Pie Charts and Component Band Charts This module discusses the circumstances
Level of challenge:DS5 S5 Interpreting bar charts, pie ... · what will happen to the pie chart? S5–2 Level of challenge: D S5 Interpreting bar charts, pie charts, box and whisker
Graphing. Types of Graphs Pie Charts XY Graphs Bar Charts
Pie charts are evil
Pie charts (interpreting and drawing)
Tables Charts & Graphs 3-Jun-14Created by Mr. Lafferty Maths Dept. Relative Frequency Reading Pie Charts Constructing Pie Charts
csXGraph - Version 2.0 ActiveX Control to Draw Bar Charts, Pie … · 2019-08-28 · 4 1. Pie Charts Pie charts are drawn by adding data items using the AddData method. Each data
2.1 Organizing Qualitative Data Creating Bar Charts and Pie Charts
Finished Pie Charts
Graphs Pie Charts Component Band Charts
(Pie) Charts
Foundation Pie Charts - Winwood Maths
Pie charts of results (pilot)
Music questionnaire pie charts
Level of challenge:DS5 S5 Interpreting bar charts, pie charts ......Level of challenge:DS5 S5 Interpreting bar charts, pie charts, box and whisker plots Mathematical goals To help
3B-1. Describing Data Visually (Part 2) Scatter Plots Scatter Plots Tables Pie Charts Pie Charts Effective Excel Charts Effective Excel Charts Maps and
Section 2.2: Bar Charts and Pie Charts - KSU | Faculty Webfacultyweb.kennesaw.edu/jdemaio/MATH 2332 2.2 Bar Charts and Pie Graphs.pdfSection 2.2: Bar Charts and Pie Charts 1 Raw Data
Describing Pie Charts
Level D 4-Jun-14Created by Mr.Lafferty Maths Dept Pie Charts Reading Pie Charts Constructing Pie Charts
Feeling hungry? Have a slice of pie ;). Pie charts
Pie Charts and Bar Graphs
MAL-001 – BAR GRAPHS AND PIE CHARTS. 1 Bar charts MAL-001 STATISTICS Representing and interpreting data 2 Pie charts
Review For Quiz on Pie Charts
Science Fair Pie Charts
15-Dec-15 Relative Frequency Reading Pie Charts Tables Charts & Graphs Constructing Pie Charts Cumulative Frequency Tables Dot Plots
Stop Making Pie Charts!